South African Insurance Outlook 2021 Navigating ... - Deloitte
37
South African Insurance Outlook 2021 Navigating the insurance landscape
-
Upload
khangminh22 -
Category
Documents
-
view
3 -
download
0
Transcript of South African Insurance Outlook 2021 Navigating ... - Deloitte

1
South African Insurance Outlook 2021Navigating the insurance landscape
2
Contents
SA INSUR ANCE OUTLOOK | PERSPECTIVES ON THE INSUR ANCE LANDSCAPE
Using technology to combat insurance fraud
Proactively managing conduct risk
Understanding a more complete IFRS 17 picture
IFRS 17: Controls and financial reporting under the new standard
VAT: Closing the compliance gap
Introduction
Overview of the 2020 financial and EV results
COVID-19 – Once bitten, twice shy.A pandemic’s impact on stress testing frameworks
Optimising the life insurance regulatory balance sheet
Artificial intelligence and machine learning
3
SA INSUR ANCE OUTLOOK | INTRODUCTION
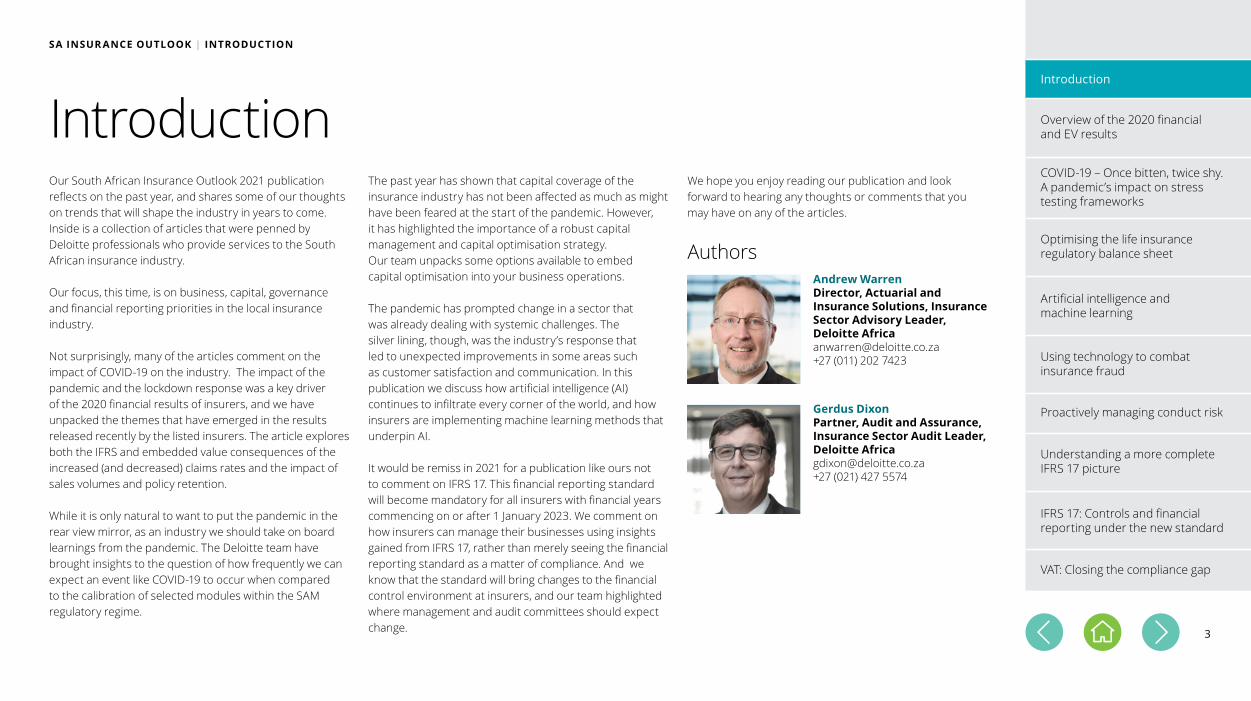
IntroductionOur South African Insurance Outlook 2021 publication reflects on the past year, and shares some of our thoughts on trends that will shape the industry in years to come. Inside is a collection of articles that were penned by Deloitte professionals who provide services to the South African insurance industry.
Our focus, this time, is on business, capital, governance and financial reporting priorities in the local insurance industry.
Not surprisingly, many of the articles comment on the impact of COVID-19 on the industry. The impact of the pandemic and the lockdown response was a key driver of the 2020 financial results of insurers, and we have unpacked the themes that have emerged in the results released recently by the listed insurers. The article explores both the IFRS and embedded value consequences of the increased (and decreased) claims rates and the impact of sales volumes and policy retention. While it is only natural to want to put the pandemic in the rear view mirror, as an industry we should take on board learnings from the pandemic. The Deloitte team have brought insights to the question of how frequently we can expect an event like COVID-19 to occur when compared to the calibration of selected modules within the SAM regulatory regime.
The past year has shown that capital coverage of the insurance industry has not been affected as much as might have been feared at the start of the pandemic. However, it has highlighted the importance of a robust capital management and capital optimisation strategy. Our team unpacks some options available to embed capital optimisation into your business operations.
The pandemic has prompted change in a sector that was already dealing with systemic challenges. The silver lining, though, was the industry’s response that led to unexpected improvements in some areas such as customer satisfaction and communication. In this publication we discuss how artificial intelligence (AI) continues to infiltrate every corner of the world, and how insurers are implementing machine learning methods that underpin AI.
It would be remiss in 2021 for a publication like ours not to comment on IFRS 17. This financial reporting standard will become mandatory for all insurers with financial years commencing on or after 1 January 2023. We comment on how insurers can manage their businesses using insights gained from IFRS 17, rather than merely seeing the financial reporting standard as a matter of compliance. And we know that the standard will bring changes to the financial control environment at insurers, and our team highlighted where management and audit committees should expect change.
We hope you enjoy reading our publication and look forward to hearing any thoughts or comments that you may have on any of the articles.
Authors
Gerdus DixonPartner, Audit and Assurance, Insurance Sector Audit Leader, Deloitte [email protected] +27 (021) 427 5574
Andrew WarrenDirector, Actuarial and Insurance Solutions, Insurance Sector Advisory Leader, Deloitte [email protected]+27 (011) 202 7423 Using technology to combat
insurance fraud
Proactively managing conduct risk
Understanding a more complete IFRS 17 picture
IFRS 17: Controls and financial reporting under the new standard
VAT: Closing the compliance gap
Introduction
Overview of the 2020 financial and EV results
COVID-19 – Once bitten, twice shy.A pandemic’s impact on stress testing frameworks
Optimising the life insurance regulatory balance sheet
Artificial intelligence and machine learning
4
Overview of the 2020 financial and embedded value results of the largest five listed insurancegroups in South Africa
SA INSUR ANCE OUTLOOK | OVERVIEW OF THE 2020 FINANCIAL AND EMBEDDED VALUE RESULTS OF THE LARGEST FIVE LISTED INSUR ANCE GROUPS IN SOUTH AFRICA
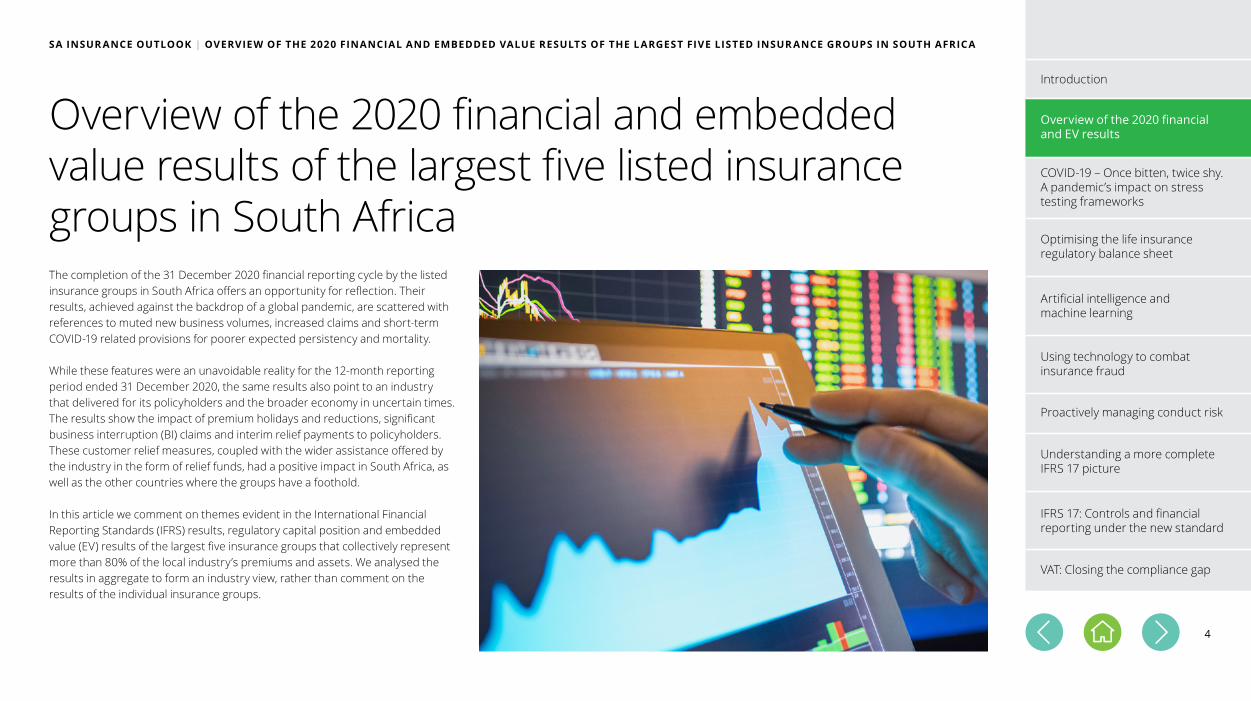
The completion of the 31 December 2020 financial reporting cycle by the listed insurance groups in South Africa offers an opportunity for reflection. Their results, achieved against the backdrop of a global pandemic, are scattered with references to muted new business volumes, increased claims and short-term COVID-19 related provisions for poorer expected persistency and mortality.
While these features were an unavoidable reality for the 12-month reporting period ended 31 December 2020, the same results also point to an industry that delivered for its policyholders and the broader economy in uncertain times. The results show the impact of premium holidays and reductions, significant business interruption (BI) claims and interim relief payments to policyholders. These customer relief measures, coupled with the wider assistance offered by the industry in the form of relief funds, had a positive impact in South Africa, as well as the other countries where the groups have a foothold.
In this article we comment on themes evident in the International Financial Reporting Standards (IFRS) results, regulatory capital position and embedded value (EV) results of the largest five insurance groups that collectively represent more than 80% of the local industry’s premiums and assets. We analysed the results in aggregate to form an industry view, rather than comment on the results of the individual insurance groups.
Using technology to combat insurance fraud
Proactively managing conduct risk
Understanding a more complete IFRS 17 picture
IFRS 17: Controls and financial reporting under the new standard
VAT: Closing the compliance gap
COVID-19 – Once bitten, twice shy.A pandemic’s impact on stress testing frameworks
Optimising the life insurance regulatory balance sheet
Artificial intelligence and machine learning
Introduction
Overview of the 2020 financial and EV results
5
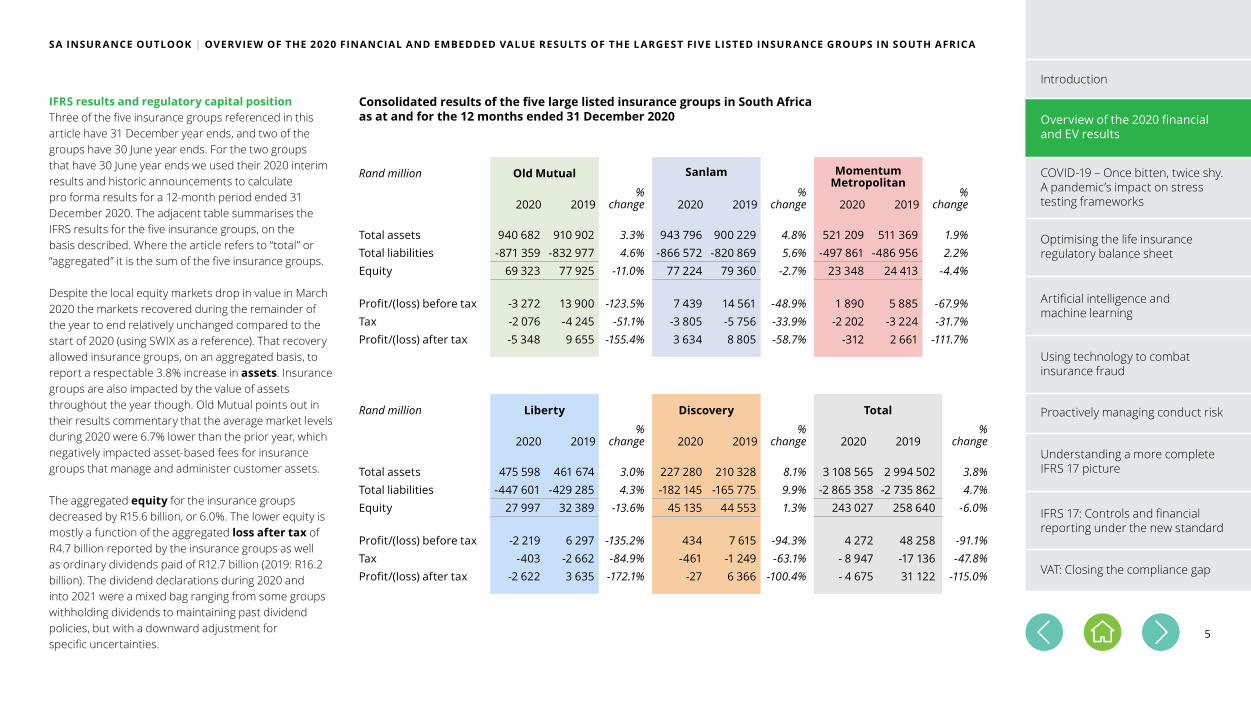
IFRS results and regulatory capital position Three of the five insurance groups referenced in this article have 31 December year ends, and two of the groups have 30 June year ends. For the two groups that have 30 June year ends we used their 2020 interim results and historic announcements to calculate pro forma results for a 12-month period ended 31 December 2020. The adjacent table summarises the IFRS results for the five insurance groups, on the basis described. Where the article refers to “total” or “aggregated” it is the sum of the five insurance groups.
Despite the local equity markets drop in value in March 2020 the markets recovered during the remainder of the year to end relatively unchanged compared to the start of 2020 (using SWIX as a reference). That recovery allowed insurance groups, on an aggregated basis, to report a respectable 3.8% increase in assets. Insurance groups are also impacted by the value of assets throughout the year though. Old Mutual points out in their results commentary that the average market levels during 2020 were 6.7% lower than the prior year, which negatively impacted asset-based fees for insurance groups that manage and administer customer assets.
The aggregated equity for the insurance groups decreased by R15.6 billion, or 6.0%. The lower equity is mostly a function of the aggregated loss after tax of R4.7 billion reported by the insurance groups as well as ordinary dividends paid of R12.7 billion (2019: R16.2 billion). The dividend declarations during 2020 and into 2021 were a mixed bag ranging from some groups withholding dividends to maintaining past dividend policies, but with a downward adjustment for specific uncertainties.
SA INSUR ANCE OUTLOOK | OVERVIEW OF THE 2020 FINANCIAL AND EMBEDDED VALUE RESULTS OF THE LARGEST FIVE LISTED INSUR ANCE GROUPS IN SOUTH AFRICA
Consolidated results of the five large listed insurance groups in South Africaas at and for the 12 months ended 31 December 2020
Momentum Metropolitan
Using technology to combat insurance fraud
Proactively managing conduct risk
Understanding a more complete IFRS 17 picture
IFRS 17: Controls and financial reporting under the new standard
VAT: Closing the compliance gap
COVID-19 – Once bitten, twice shy.A pandemic’s impact on stress testing frameworks
Optimising the life insurance regulatory balance sheet
Artificial intelligence and machine learning
Introduction
Overview of the 2020 financial and EV results
6
It is not always easy to make direct comparisons between the IFRS results of the individual insurance groups as their accounting policies for the recognition of negative reserves and revenue are often not consistent, and the level of prudence applied in setting policyholder liabilities varies. For example, in the current year Sanlam reported that it had previously created a pandemic reserve of R760 million that was now to be utilised. By contrast, most other insurers did not previously hold any such reserve. Suffice to say that even if pandemic reserves were commonplace these reserves would unlikely have been sufficient to absorb all that 2020 brought to bear.
The current year’s results were achieved against the backdrop of muted economic activity in Africa, even before the pandemic hit. South Africa’s Gross Domestic Product
contracted by 7% in 2020, and more severely in some other African countries.
On an aggregated basis the insurance groups’ profit before tax of R48.3 billion reported in 2019 reduced to R4.3 billion in 2020 (-91%). The financial results reflect the impact of:
• Lower new business volumes as adviser productivity, in the absence of face-to-face sales, was significantly impacted during the initial lock down period
• COVID-19 customer support mechanisms, such as premium holidays, and other direct financial support
• Increased death claims – the Association for Savings and Investment South Africa (ASISA) noted that the South African life assurance industry recorded 116 774 more death claims in 2020 than it did in 2019, an increase of 37%
• Poorer persistency for life insurance policies – while most insurers commented that the actual lapse experience in the current year tracked favourably against expectations as policyholders opted to hold onto their insurance policies in uncertain times, the assumptions for short-term future terminations have been bolstered
• Significantly lower investment returns on shareholder assets coupled with a reduction in asset-based fees on customer assets (following on from lower assets under management during the year)
• Improved non-life personal lines underwriting results – lower personal lines claims volumes, particularly for motor vehicles, in the first half of the year during the extended national lockdown enforced by government
• Relief payments to clients in the hospitality and leisure sector coupled with significant liabilities created to settle BI claims.
For example, Santam as the largest short-term insurer in the country established a claims provision of R3 billion, net of reinsurance for its BI exposure. The industry’s accounting for BI claims at 31 December 2020 followed the rulings in both South Africa and the United Kingdom courts that addressed the uncertainty around the application of BI clauses. These proceedings confirmed that cover should be provided for BI losses caused by the government enforced national lockdown, provided there was an instance of COVID-19 within the defined radius of the policyholder’s business. Insurers have accepted the decisions of the courts, although further legal processes afoot to confirm the length of the indemnity period that applies.
A key feature of many of the results announcements is the short-term provisions created for the anticipated impacts of worsening mortality, morbidity and persistency experience related to COVID-19. The provisions for those groups that disclosed them explicitly total more than R10 billion at 31 December 2020. Some groups noted that their provisions needed to be bolstered in the second part of 2020 as the actual experience was more severe than their initial modelling, or additional information had become available. For example, Momentum Metropolitan Holdings note in their interim results announcement: “Mortality data from the South African Medical Research Council, indicates that recorded Covid-19 deaths are understating the full mortality impact of the pandemic. In line with the SAMRC data, our mortality claims experience to date has been more severe than our initial modelling. We therefore increased our COVID-19 provision…”.
The short-term provisions generally allow for increased mortality claims, higher terminations, reduced return-to-work experience on disability income claims in payment, as well as BI claims.
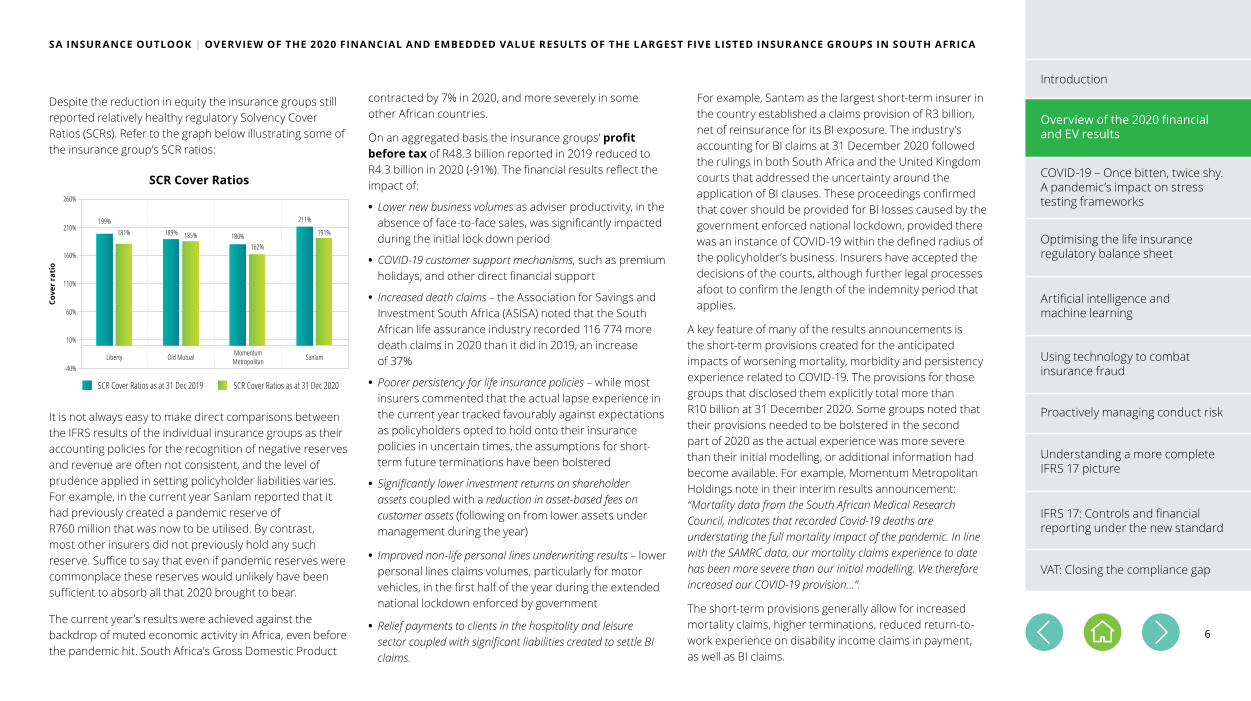
Despite the reduction in equity the insurance groups still reported relatively healthy regulatory Solvency Cover Ratios (SCRs). Refer to the graph below illustrating some of the insurance group’s SCR ratios:
SA INSUR ANCE OUTLOOK | OVERVIEW OF THE 2020 FINANCIAL AND EMBEDDED VALUE RESULTS OF THE LARGEST FIVE LISTED INSUR ANCE GROUPS IN SOUTH AFRICA
SCR Cover Ratios
Cove
r ra
tio
-40%
10%
60%
110%
160%
210%
260%
Liberty
199%181%
Old Mutual
189% 185%
Momentum Metropolitan
180%162%
Sanlam
211%
191%
SCR Cover Ratios as at 31 Dec 2019 SCR Cover Ratios as at 31 Dec 2020
Using technology to combat insurance fraud
Proactively managing conduct risk
Understanding a more complete IFRS 17 picture
IFRS 17: Controls and financial reporting under the new standard
VAT: Closing the compliance gap
COVID-19 – Once bitten, twice shy.A pandemic’s impact on stress testing frameworks
Optimising the life insurance regulatory balance sheet
Artificial intelligence and machine learning
Introduction
Overview of the 2020 financial and EV results
7
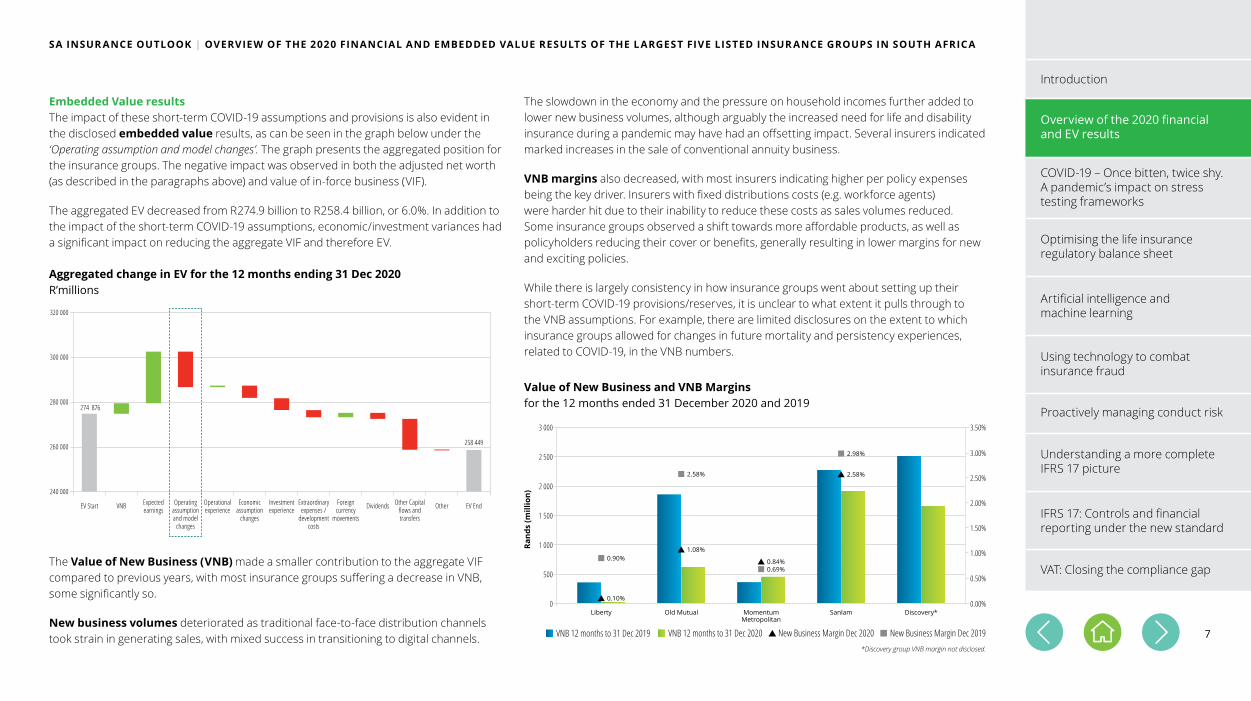
Embedded Value results The impact of these short-term COVID-19 assumptions and provisions is also evident in the disclosed embedded value results, as can be seen in the graph below under the ‘Operating assumption and model changes’. The graph presents the aggregated position for the insurance groups. The negative impact was observed in both the adjusted net worth (as described in the paragraphs above) and value of in-force business (VIF).
The aggregated EV decreased from R274.9 billion to R258.4 billion, or 6.0%. In addition to the impact of the short-term COVID-19 assumptions, economic/investment variances had a significant impact on reducing the aggregate VIF and therefore EV.
SA INSUR ANCE OUTLOOK | OVERVIEW OF THE 2020 FINANCIAL AND EMBEDDED VALUE RESULTS OF THE LARGEST FIVE LISTED INSUR ANCE GROUPS IN SOUTH AFRICA
The slowdown in the economy and the pressure on household incomes further added to lower new business volumes, although arguably the increased need for life and disability insurance during a pandemic may have had an offsetting impact. Several insurers indicated marked increases in the sale of conventional annuity business.
VNB margins also decreased, with most insurers indicating higher per policy expenses being the key driver. Insurers with fixed distributions costs (e.g. workforce agents) were harder hit due to their inability to reduce these costs as sales volumes reduced. Some insurance groups observed a shift towards more affordable products, as well as policyholders reducing their cover or benefits, generally resulting in lower margins for new and exciting policies.
While there is largely consistency in how insurance groups went about setting up their short-term COVID-19 provisions/reserves, it is unclear to what extent it pulls through to the VNB assumptions. For example, there are limited disclosures on the extent to which insurance groups allowed for changes in future mortality and persistency experiences, related to COVID-19, in the VNB numbers.
Aggregated change in EV for the 12 months ending 31 Dec 2020R’millions
240 000
260 000
280 000
300 000
320 000
274 876
258 449
EV Start Operationalexperience
Economic assumption
changes
Investmentexperience
Expectedearnings
Extraordinaryexpenses /
developmentcosts
Foreigncurrency
movements
Other Capitalflows andtransfers
Dividends EV EndVNB Operatingassumptionand model
changes
Other
The Value of New Business (VNB) made a smaller contribution to the aggregate VIF compared to previous years, with most insurance groups suffering a decrease in VNB, some significantly so.
New business volumes deteriorated as traditional face-to-face distribution channels took strain in generating sales, with mixed success in transitioning to digital channels.
*Discovery group VNB margin not disclosed.
VNB 12 months to 31 Dec 2019 VNB 12 months to 31 Dec 2020 New Business Margin Dec 2020 New Business Margin Dec 2019
Value of New Business and VNB Marginsfor the 12 months ended 31 December 2020 and 2019
0
500
1 000
1 500
2 000
2 500
3 000
0.00%
3.00%
3.50%
0.90%
0.10%
Liberty
2.58%
1.08%
Old Mutual
0.69%0.84%
Momentum Metropolitan
2.98%
2.58%
Sanlam Discovery*
Rand
s (m
illio
n)
2.50%
2.00%
1.50%
1.00%
0.50%
Using technology to combat insurance fraud
Proactively managing conduct risk
Understanding a more complete IFRS 17 picture
IFRS 17: Controls and financial reporting under the new standard
VAT: Closing the compliance gap
COVID-19 – Once bitten, twice shy.A pandemic’s impact on stress testing frameworks
Optimising the life insurance regulatory balance sheet
Artificial intelligence and machine learning
Introduction
Overview of the 2020 financial and EV results

8
SA INSUR ANCE OUTLOOK | OVERVIEW OF THE 2020 FINANCIAL AND EMBEDDED VALUE RESULTS OF THE LARGEST FIVE LISTED INSUR ANCE GROUPS IN SOUTH AFRICA
In summaryThe record books may show 2020 as a year in which reported financial results were well below expectations, it is by no means the full story. It was a year where the industry again showed its resilience, while at the same time positively impacting the lives of its customers at a time of great financial need. Perhaps less obvious, it was also a year where the industry made meaningful strides in changing its operating model through introducing digital capabilities that will transform the industry for many years to come. While it might be somewhat difficult for the authors of this article to say, being an accountant and an actuary, but perhaps 2020 is a year in which we need to look beyond just the numbers to see the full picture.
AuthorsGerdus DixonPartner, Audit and Assurance, Insurance Sector Audit Leader, Deloitte [email protected] +27 (021) 427 5574
Carike NelDirector, Actuarial and Insurance Solutions, Deloitte [email protected]+27 (021) 427 5358
Using technology to combat insurance fraud
Proactively managing conduct risk
Understanding a more complete IFRS 17 picture
IFRS 17: Controls and financial reporting under the new standard
VAT: Closing the compliance gap
COVID-19 – Once bitten, twice shy.A pandemic’s impact on stress testing frameworks
Optimising the life insurance regulatory balance sheet
Artificial intelligence and machine learning
Introduction
Overview of the 2020 financial and EV results
9
SA INSUR ANCE OUTLOOK | COVID-19 – ONCE BITTEN, T WICE SHY
Introduction As we reflect on 2020 that seems to have gone by in a flash, we have seen the remarkable ability of the human race to adapt and innovate, with the insurance market being no different. Remote working was set up with near perfect transition, that saw insurers adapting to change and the use of technology on a level never seen before in the insurance sector. However, the negative impact of the COVID-19 pandemic left its mark – from the tragic loss of life to the significant economic and societal impacts and, of course, the specific effects on the insurance sector. With the promulgation of the Solvency Assessment and Management (SAM) regulatory framework on 1 July 2018, insurers have increasingly asked the question of what a “1-in-200 year” event would actually look like. This paper aims to explore how frequently we can expect an event like COVID-19 to occur when compared to the calibration of selected modules within the SAM Standardised Formula. It further goes on to recognise potential areas where COVID-19 has highlighted shortfalls in the Solvency Capital Requirement (SCR) for consideration in insurers’ economic capital modelling and broader Own Risk and Solvency Assessment (ORSA).
The journey thus farIf we look back to March 2020 we can remember that equity markets were in freefall, worldwide lockdowns
were imposed, social distancing was the new norm and both fist bumps and elbow shakes were gaining traction. At the time many felt like Henny Penny and were thinking that the sky was falling. But was it really a 1-in-200 year event when compared to the underlying calibrations of the Standardised Formula? In answering this question, we look at the key risks that are captured by the Standardised Formula SCR, namely market risk, life underwriting risk, non-life underwriting risk and operational risk, and assess how the emergence of those risks under COVID-19 impacted on insurers’ solvency. Market RiskIn the market risk module we saw that equity risk, interest rate risk and currency risk were the risks within the Standardised Formula that were most significantly affected by COVID-19.
• Equity Risk According to the calibrations of the Standardised Formula, which consider annual movements of an insurer’s overall equity exposure, the MSCI World Index saw a 1-in-9 year event for the 12 months ending March 2020 (13% fall from March 2019 to March 2020) while the JSE All Share Index experienced a 1-in-10 year event over the same period (21% fall). However, we could also consider the intra-year drop in the JSE All Share Index
from its pre-crash high in December 2019 to its lowest point in March 2020, which was a significant fall of 34%. But even this movement translates to only a 1-in-100 year event according to the Standardised Formula calibrations.
With equities comprising only 14% of non-life insurers’ investment portfolios on average1, the impact of the falling equity market was not as significant as might have been expected. In contrast, life insurers were more exposed with equities representing on average 43% of their overall investment portfolio2. Despite this, however, most of these equity investments relate to investments made on behalf of policyholders through with-profits policies and linked business. With this risk passed on to the policyholders, most SCR ratios of life insurers were largely unaffected. Insurers who offer downside protection on their equity-backed policies saw a significant increase in their investment guarantee reserves, with the fall in the markets also resulting in an increase in the volatility of equity markets, with some of this offset by the hedging strategies that were employed.
COVID-19 – Once bitten, twice shyA pandemic’s impact on stress testing frameworks
Reference:1. Prudential Authority – Non-life industry experience 2018 2. Prudential Authority – An overview of the experience of life insurers in South Africa for 2018
Using technology to combat insurance fraud
Proactively managing conduct risk
Understanding a more complete IFRS 17 picture
IFRS 17: Controls and financial reporting under the new standard
VAT: Closing the compliance gap
Optimising the life insurance regulatory balance sheet
Artificial intelligence and machine learning
Introduction
Overview of the 2020 financial and EV results
COVID-19 – Once bitten, twice shy.A pandemic’s impact on stress testing frameworks

10
SA INSUR ANCE OUTLOOK | COVID-19 – ONCE BITTEN, T WICE SHY
• Currency Risk Similar to equity risk, the Standardised Formula calibrations (considering annual movements) suggest that the GBP/ZAR movement for the twelve months to April 2020 equates to a 1-in-10 year event (19% depreciation). For the USD/ZAR, we saw a 1-in-17 year event over this same period (12% depreciation). However, as with equity risk, we could also consider the intra-year movement from the most recent strongest position of the ZAR against the USD, in December 2019, to the weakest position in April 2020, over which a 27% depreciation was experienced. Even this only translates to a roughly 1-in-30 year event when compared against the Standardised Formula calibrations.
The average life and non-life insurer have limited foreign exposures and hence the impact of the ZAR deterioration had an insignificant effect on most insurers’ SCR ratios over the last year.
ObservationIt is imperative that insurers are well prepared for these extreme market movements, with a clearly defined approach for investment decisions under such conditions, allowing careful and objective consideration when markets are in free fall, reducing the risk of knee jerk-reactions. This should include a focus on the hedging of investment guarantees, and stress testing the effectiveness of those hedges under extreme market movement scenarios.
• Interest Rate Risk Interest rate risk was the most severely affected market risk module, with nominal yields reducing by up to 40% at short durations (equivalent to a 1-in-100 year event) and increasing by up to 80% at longer durations (which is much more severe than a 1-in-200 year event). Subsequent to this volatility, the PA had updated the constituent bonds used to derive the risk-free curve. This update had very little impact at short durations, but significantly reduced the impacts at longer durations. Had the new bond constituents been used throughout 2020 the impacts at long durations would be somewhere between a 1-in-20 and a 1-in-50 year event, depending on the duration. This less severe impact is also more in line with the observed movements in government bond yields.
ObservationInsurers need to understand the level of diversification assumed in the calibrations of the Standardised Formula to identify areas where economic capital requirements might need to deviate from the Standardised Formula. While the Standardised Formula does not allow for diversification between different currencies, the past year has made it clear that the volatility of the Rand is not the same for all foreign currencies, e.g. the USD/ZAR exchange rate tends to be more volatile than other exchange rates.
ObservationInsurers with long-dated liabilities need to assess their exposure to non-parallel movements in the yield curve, e.g. tilts and changes in shape, as these are not considered within the Standardised Formula. This is especially important where asset-liability matching is not based on matching cash flows, but rather based on matching duration or overall movements in liabilities. This shortfall in the Standardised Formula was noted during SAM’s development and insurers’ risk management functions could benefit from revisiting the relevant position papers and discussion documents to understand the shortcomings of the Standardised Formula, not only for interest rate risk, but also for other risk modules.
ObservationMany insurers have defaulted to using the PA’s risk free curve for other calculation bases, e.g. IFRS and Embedded Value reporting, but, after the volatility experienced during 2020, insurers were urgently considering alternative curves. With a variety of risk-free curves available, it’s important for insurers to have a sufficiently deep understanding of any yield curve that is used, for example an understanding of the curve construction methodology (interpolation and extrapolation), selection of bond constituents and whether historically the curve has displayed desirable behaviour, especially during times of market stress.
Using technology to combat insurance fraud
Proactively managing conduct risk
Understanding a more complete IFRS 17 picture
IFRS 17: Controls and financial reporting under the new standard
VAT: Closing the compliance gap
Optimising the life insurance regulatory balance sheet
Artificial intelligence and machine learning
Introduction
Overview of the 2020 financial and EV results
COVID-19 – Once bitten, twice shy.A pandemic’s impact on stress testing frameworks
11
SA INSUR ANCE OUTLOOK | COVID-19 – ONCE BITTEN, T WICE SHY
Further to this there are also longer-term mortality impacts from both lockdown and the associated economic recession, which have been estimated to be multiples of the direct excess deaths, with this impact being spread over the next 10 years5. These longer-term impacts are expected to be concentrated in lower income families where poverty induced deaths are likely to occur. However, higher income families are also expected to be subject to increased risk from at least a few factors, including delayed cancer diagnoses, emotional impacts from lockdown and potential long-term COVID-19 symptoms. To the extent that these deaths occur in the most impoverished of communities the impact on the insurance industry would be limited, but the loss of human life remains equally tragic. When including the impact of these longer-term deaths the severity of the COVID-19 pandemic becomes undoubtably more severe than the 1-in-200 year event envisioned by the Standardised Formula.
• Morbidity Risk Life insurers were also subject to other claim variances, including increases in temporary disability claims due to severe COVID-19 conditions, where waiting periods could be very short, as well as additional hospital cash claims due to COVID-19 submissions, although this is expected to be more than offset by a reduction in submissions arising from elective procedures. There could also be lockdown related impacts on morbidity claims, e.g. from temporary changes in lifestyle activities and alcohol availability.
• Retrenchment Risk The lockdown induced recession is the worst economic contraction our country has faced, at least since 1960 when economic growth data became available. This
Life Underwriting RiskWhile pandemics have always been a classical stress test for life insurers, COVID-19’s far reaching complexity could not have been captured in the simplicity of a theoretical stress test.
• Mortality Catastrophe Risk COVID-19’s mortality impact has taken much longer to materialise than the three months assumed in the Standardised Formula. With vaccines now available there is renewed hope that we can start estimating the pandemic’s ultimate impact. In this regard our analysis is based on the estimated impact of a third wave, without any fourth wave impact and after netting off other lockdown related impacts like limited deaths due to influenza and lower accidental deaths. The excess deaths within the South African population is then estimated to reach anywhere between 180 000 and 250 000 by the end of 20213. According to the Standardised Formula calibrations this could be expected to happen once every 250 to 370 years4.
recession caused between 2.2 and 3.0 million job losses6 and 7, well in excess of the 1 million jobs lost during the 2008 Global Financial Crisis8. Retrenchment risk might be negligible at an industry level9, but there are a number of insurers with significant exposure thereto, leading to such insurers recognising large retrenchment losses. This is the second round of such losses in less than 15 years, illustrating that retrenchment experience is highly volatile, but also that it behaves more like a short-lived catastrophe and less like the long-term upward stress included in the Standardised Formula. This is especially relevant for business with shorter contract boundaries, where the impact of such a short- lived catastrophe might not be captured sufficiently by the Standardised Formula.
ObservationInsurers can improve economic capital models by recalibrating many of the market risk modules, using more recent and larger data sets than those underlying the Standardised Formula. A typical example is interest rate risk, where there is significant experience available beyond the data set that was used to calibrate the Standardised Formula. Re-calibrating using more recent data could also better reflect changes in market behaviour, like the impact of technology and automated trading on equity markets.
ObservationInsurers with any material retrenchment risk need to take great care in ensuring their economic capital and ORSA stresses make an appropriate allowance for the true nature of retrenchment risk. In light of its volatility and potentially large and relatively frequent losses, risk appetite policies also need to be reassessed to ensure there are appropriate risk limits in place for retrenchment risk.
Reference:3. Extrapolated from SAMRC Excess Deaths data4. Swiss Re – Pandemic influenza: A 21st century model for mortality shocks5. Business Tech – ‘Real and dire possibilities’ facing South Africa after lockdown: Dawie Roodt6. Statistics South Africa – Quarterly Labour Force Survey, Quarter 2: 20207. NIDS-CRAM – Overview and Findings, NIDS-CRAM Synthesis Report Wave 18. Business Tech – South Africa lost 1 million jobs because of the 2008 recession – here’s why this one could be even worse9. Prudential Authority – An overview of the experience of life insurers in South Africa for 2018
Using technology to combat insurance fraud
Proactively managing conduct risk
Understanding a more complete IFRS 17 picture
IFRS 17: Controls and financial reporting under the new standard
VAT: Closing the compliance gap
Optimising the life insurance regulatory balance sheet
Artificial intelligence and machine learning
Introduction
Overview of the 2020 financial and EV results
COVID-19 – Once bitten, twice shy.A pandemic’s impact on stress testing frameworks
12
SA INSUR ANCE OUTLOOK | COVID-19 – ONCE BITTEN, T WICE SHY
• Lapse Risk and New Business Volumes The life insurance industry’s lapse experience is always fascinating to observe and 2020 was no different. Despite severe and unprecedented economic hardship there were no massive increases in industry level lapses10, definitely nothing that suggests we had a mass lapse event on our hands. In fact, some insurers experienced an improvement in lapse rates. This emphasises that any experience item, like lapses, that depends on policyholder behaviour is notoriously difficult to predict under extreme conditions, as it might behave counterintuitively.
New business volumes showed large reductions10, as disposable income came under pressure and advisor networks were restrained from travelling, placing at least some upward pressure on per policy expenses.
As such, the below are short-term observations that were observed across the non-life insurance market for the average insurer:
• Significant business interruption claims paid and reserved for
• Reduced loss ratios of the motor line of business owing to the lockdown
• Cash backs paid to policyholders to share in this improved motor experience
• Reduced cover from comprehensive to third party, fire and theft
• Increased claims on accident and health, travel and property contents lines of business
• Increased expenses following work-from-home protocols adopted
ObservationORSA scenarios representing extreme conditions need to consider the possibility of policyholders behaving in unexpected and counterintuitive ways, as this is not only plausible but could also notably change the outcomes of such scenarios.
ObservationWith the observation that there was very limited impact on non-life insurers’ Standardised Formula SCRs, non-life insurers that use the Standardised Formula as a proxy for economic capital as part of their ORSA process need to critically assess the appropriateness of the non-life underwriting risk modules in light of the current environment, both from a claims and expenses perspective.
Non-Life Underwriting RiskWith roughly 80% of non-life premiums being attributed to the motor, property and liability lines of business11, we have seen that, on the surface, there appears to be a limited impact of the pandemic on non-life underwriting risk for the average non-life insurer, as the risk modules do not specifically cater for the direct impacts of the COVID-19 pandemic.
Operational RiskAs the Standardised Formula allowance for operational risk is largely a premium and reserve exposure-based calculation, we have seen that, on average, the operationalrisk allowance for insurers decreased relative to expectations, in line with lower than expected business volumes.
ObservationOne would expect that with new work-from-home protocols, increased stress environments and stretched resource capacity following the pandemic, operational risk would increase. However, the Standardised Formula doesn’t accurately capture this effect. Insurers that use the Standardised Formula as a proxy for economic capital as part of their ORSA process need to critically assess the appropriateness of the operational risk modules in light of the current environment.
Reference:10. Prudential Authority – Summary of QRT data11. Prudential Authority – Non-life industry experience 2018
Using technology to combat insurance fraud
Proactively managing conduct risk
Understanding a more complete IFRS 17 picture
IFRS 17: Controls and financial reporting under the new standard
VAT: Closing the compliance gap
Optimising the life insurance regulatory balance sheet
Artificial intelligence and machine learning
Introduction
Overview of the 2020 financial and EV results
COVID-19 – Once bitten, twice shy.A pandemic’s impact on stress testing frameworks
13
SA INSUR ANCE OUTLOOK | COVID-19 – ONCE BITTEN, T WICE SHY
Last year may have felt like more than a 1-in-200 event across the risks the industry faced. But it is safe to say that, bar the remaining uncertainty surrounding business interruptions claims, the industry’s capital position was more than adequate to absorb the severe impact, showing the resilience of the balance sheets under the new capital regime. What our analysis has confirmed, however, is that not all of the risks and interrelationships of the risks can be catered for in a one-size-fits all standardised formula. It is important that insurers feed the insights and data gained during the pandemic into other elements of their risk management framework, in particular their ORSAs. In this way they will be better informed about the effectiveness of various elements of their risk management strategies as they adapt and thrive in the increasingly uncertain world. As Albert Einstein so eloquently put it: “In the middle of difficulty lies opportunity”.
• Increased lapses and lower new business volumes owing to suppressed economic growth and retrenchments
• Increased risk of defaults and widening of credit spreads as the economy remains fragile
• Impact on the property market and property investments of a permanent shift towards remote working and e-commerce
• Fiscal and monetary policy impacts on the economic environment and wider financial markets
• Longer-term mortality impacts which are still highly uncertain
• Impact on trade credit and credit life business over the next few years following the economic impact of the pandemic
• Potential delays in transformation and other large-scale programmes, including IFRS 17 implementation
• Potential long-term implications on staff skillsets following prolonged remote working, school and university disruption and the related implications for operational risk and scarce skills
• Changes in cyber and security risk related to prolonged remote working and e-commerce.
Looking ForwardWith the pandemic not yet over, we have listed below some items insurers should consider when assessing their top and emerging risks within the ORSA process. These items should also be considered as part of the post-stress profit assessment for their Loss Absorbing Capacity of Deferred Taxes calculation.
AuthorsLafras EksteenSenior Manager, Actuarial and Insurance Solutions, Deloitte [email protected]+27 (011) 209 8109
Ricardo GovenderSenior Manager, Actuarial and Insurance Solutions, Deloitte [email protected]+27 (011) 304 5953
Using technology to combat insurance fraud
Proactively managing conduct risk
Understanding a more complete IFRS 17 picture
IFRS 17: Controls and financial reporting under the new standard
VAT: Closing the compliance gap
Optimising the life insurance regulatory balance sheet
Artificial intelligence and machine learning
Introduction
Overview of the 2020 financial and EV results
COVID-19 – Once bitten, twice shy.A pandemic’s impact on stress testing frameworks
14
SA INSUR ANCE OUTLOOK | THE SAM DUST HAS SETTLED, TIME TO OPTIMISE THE LIFE INSUR ANCE BAL ANCE SHEET
The SAM dust has settled, time to optimise the life insurance balance sheetEasy wins to improve life insurers’ regulatory capital positions
Regulatory solvency
ratio
Liquidityand cash
generation
IFRS andEV earnings
Earningsvolatility
Taxefficiency
Economic solvency
ratio
Economicde-risking
Optimal solution
Priorities
Capital optimisation considerations
Stak
ehol
ders
Performance m
etrics
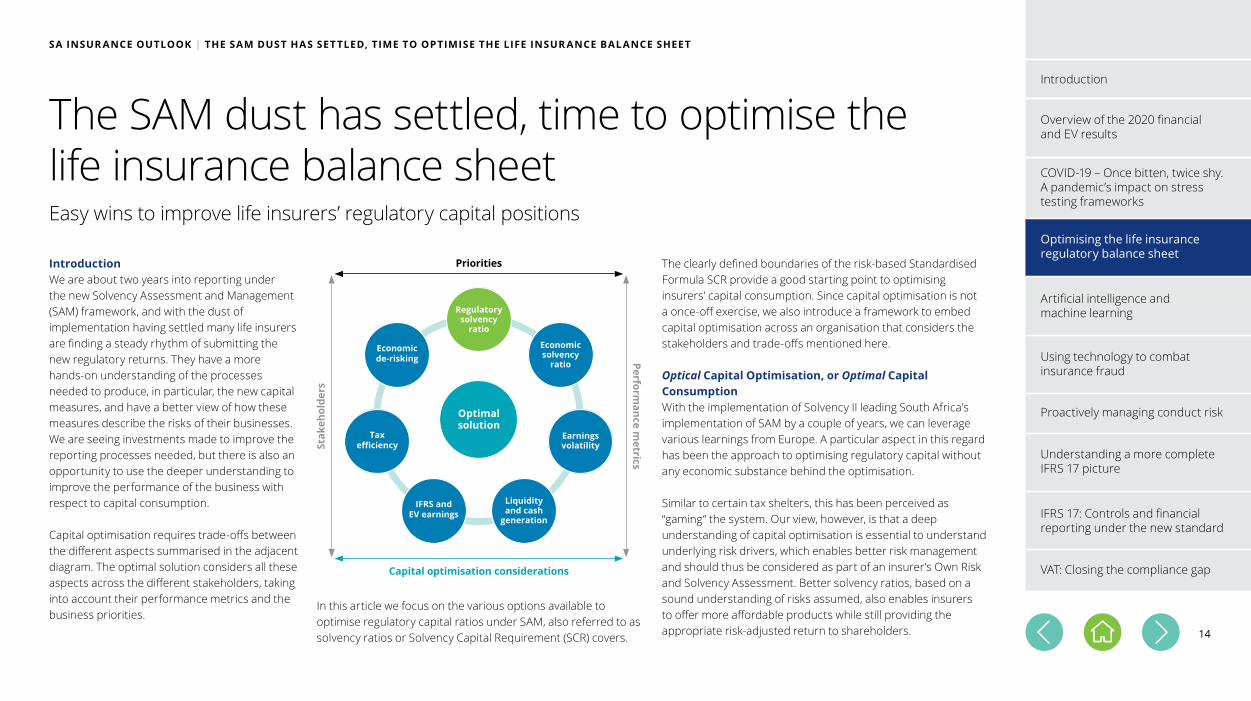
IntroductionWe are about two years into reporting under the new Solvency Assessment and Management (SAM) framework, and with the dust of implementation having settled many life insurers are finding a steady rhythm of submitting the new regulatory returns. They have a more hands-on understanding of the processes needed to produce, in particular, the new capital measures, and have a better view of how these measures describe the risks of their businesses. We are seeing investments made to improve the reporting processes needed, but there is also an opportunity to use the deeper understanding to improve the performance of the business with respect to capital consumption.
Capital optimisation requires trade-offs between the different aspects summarised in the adjacent diagram. The optimal solution considers all these aspects across the different stakeholders, taking into account their performance metrics and the business priorities.
In this article we focus on the various options available to optimise regulatory capital ratios under SAM, also referred to as solvency ratios or Solvency Capital Requirement (SCR) covers.
The clearly defined boundaries of the risk-based Standardised Formula SCR provide a good starting point to optimising insurers’ capital consumption. Since capital optimisation is not a once-off exercise, we also introduce a framework to embed capital optimisation across an organisation that considers the stakeholders and trade-offs mentioned here.
Optical Capital Optimisation, or Optimal Capital ConsumptionWith the implementation of Solvency II leading South Africa’s implementation of SAM by a couple of years, we can leverage various learnings from Europe. A particular aspect in this regard has been the approach to optimising regulatory capital without any economic substance behind the optimisation.
Similar to certain tax shelters, this has been perceived as “gaming” the system. Our view, however, is that a deep understanding of capital optimisation is essential to understand underlying risk drivers, which enables better risk management and should thus be considered as part of an insurer’s Own Risk and Solvency Assessment. Better solvency ratios, based on a sound understanding of risks assumed, also enables insurers to offer more affordable products while still providing the appropriate risk-adjusted return to shareholders.
Using technology to combat insurance fraud
Proactively managing conduct risk
Understanding a more complete IFRS 17 picture
IFRS 17: Controls and financial reporting under the new standard
VAT: Closing the compliance gap
Artificial intelligence and machine learning
Introduction
Overview of the 2020 financial and EV results
COVID-19 – Once bitten, twice shy.A pandemic’s impact on stress testing frameworks
Optimising the life insurance regulatory balance sheet
15
SA INSUR ANCE OUTLOOK | THE SAM DUST HAS SETTLED, TIME TO OPTIMISE THE LIFE INSUR ANCE BAL ANCE SHEET
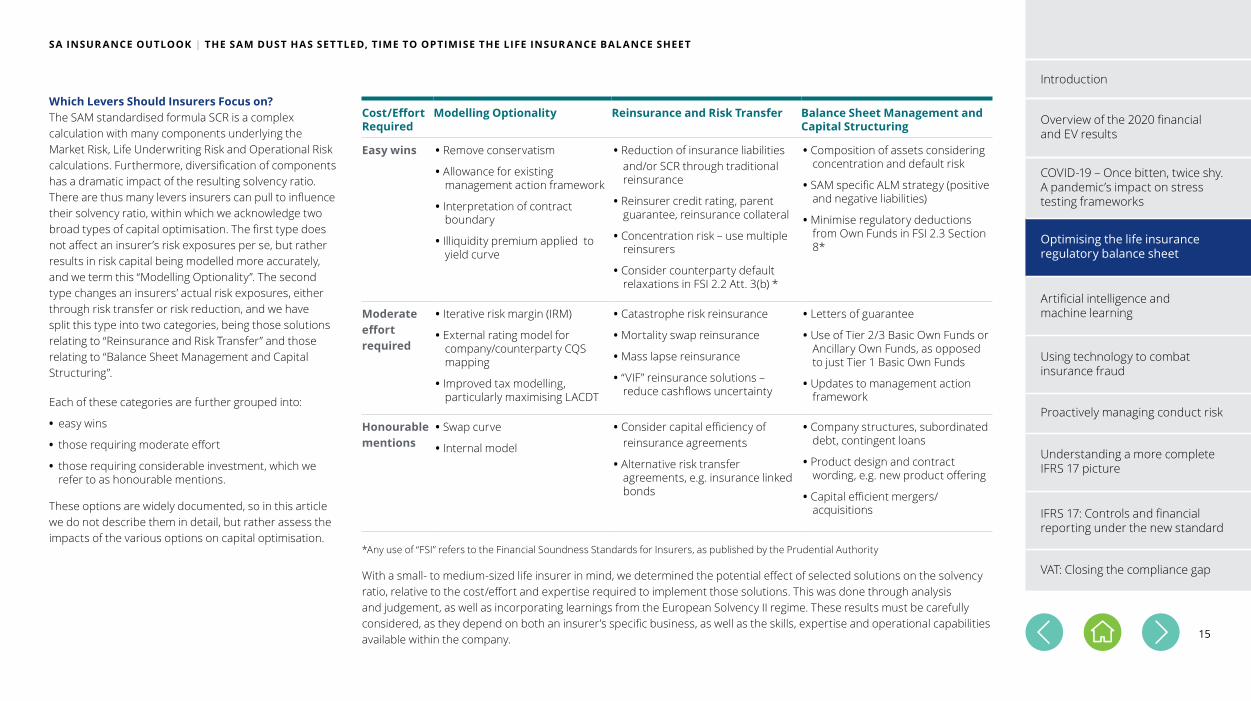
Which Levers Should Insurers Focus on?The SAM standardised formula SCR is a complex calculation with many components underlying the Market Risk, Life Underwriting Risk and Operational Risk calculations. Furthermore, diversification of components has a dramatic impact of the resulting solvency ratio. There are thus many levers insurers can pull to influence their solvency ratio, within which we acknowledge two broad types of capital optimisation. The first type does not affect an insurer’s risk exposures per se, but rather results in risk capital being modelled more accurately, and we term this “Modelling Optionality”. The second type changes an insurers’ actual risk exposures, either through risk transfer or risk reduction, and we have split this type into two categories, being those solutions relating to “Reinsurance and Risk Transfer” and those relating to “Balance Sheet Management and Capital Structuring”.
Each of these categories are further grouped into:
• easy wins
• those requiring moderate effort
• those requiring considerable investment, which we refer to as honourable mentions.
These options are widely documented, so in this article we do not describe them in detail, but rather assess the impacts of the various options on capital optimisation.
Cost/Effort Required
Modelling Optionality Reinsurance and Risk Transfer Balance Sheet Management and Capital Structuring
Easy wins • Remove conservatism
• Allowance for existing management action framework
• Interpretation of contract boundary
• Illiquidity premium applied to yield curve
• Reduction of insurance liabilities and/or SCR through traditional reinsurance
• Reinsurer credit rating, parent guarantee, reinsurance collateral
• Concentration risk – use multiple reinsurers
• Consider counterparty default relaxations in FSI 2.2 Att. 3(b) *
• Composition of assets considering concentration and default risk
• SAM specific ALM strategy (positive and negative liabilities)
• Minimise regulatory deductions from Own Funds in FSI 2.3 Section 8*
Moderate effort required
• Iterative risk margin (IRM)
• External rating model for company/counterparty CQS mapping
• Improved tax modelling, particularly maximising LACDT
• Catastrophe risk reinsurance
• Mortality swap reinsurance
• Mass lapse reinsurance
• “VIF” reinsurance solutions – reduce cashflows uncertainty
• Letters of guarantee
• Use of Tier 2/3 Basic Own Funds or Ancillary Own Funds, as opposed to just Tier 1 Basic Own Funds
• Updates to management action framework
Honourable mentions
• Swap curve
• Internal model
• Consider capital efficiency of reinsurance agreements
• Alternative risk transfer agreements, e.g. insurance linked bonds
• Company structures, subordinated debt, contingent loans
• Product design and contract wording, e.g. new product offering
• Capital efficient mergers/acquisitions
*Any use of “FSI” refers to the Financial Soundness Standards for Insurers, as published by the Prudential Authority
With a small- to medium-sized life insurer in mind, we determined the potential effect of selected solutions on the solvency ratio, relative to the cost/effort and expertise required to implement those solutions. This was done through analysis and judgement, as well as incorporating learnings from the European Solvency II regime. These results must be carefully considered, as they depend on both an insurer’s specific business, as well as the skills, expertise and operational capabilities available within the company.
Using technology to combat insurance fraud
Proactively managing conduct risk
Understanding a more complete IFRS 17 picture
IFRS 17: Controls and financial reporting under the new standard
VAT: Closing the compliance gap
Artificial intelligence and machine learning
Introduction
Overview of the 2020 financial and EV results
COVID-19 – Once bitten, twice shy.A pandemic’s impact on stress testing frameworks
Optimising the life insurance regulatory balance sheet
16
SA INSUR ANCE OUTLOOK | THE SAM DUST HAS SETTLED, TIME TO OPTIMISE THE LIFE INSUR ANCE BAL ANCE SHEET
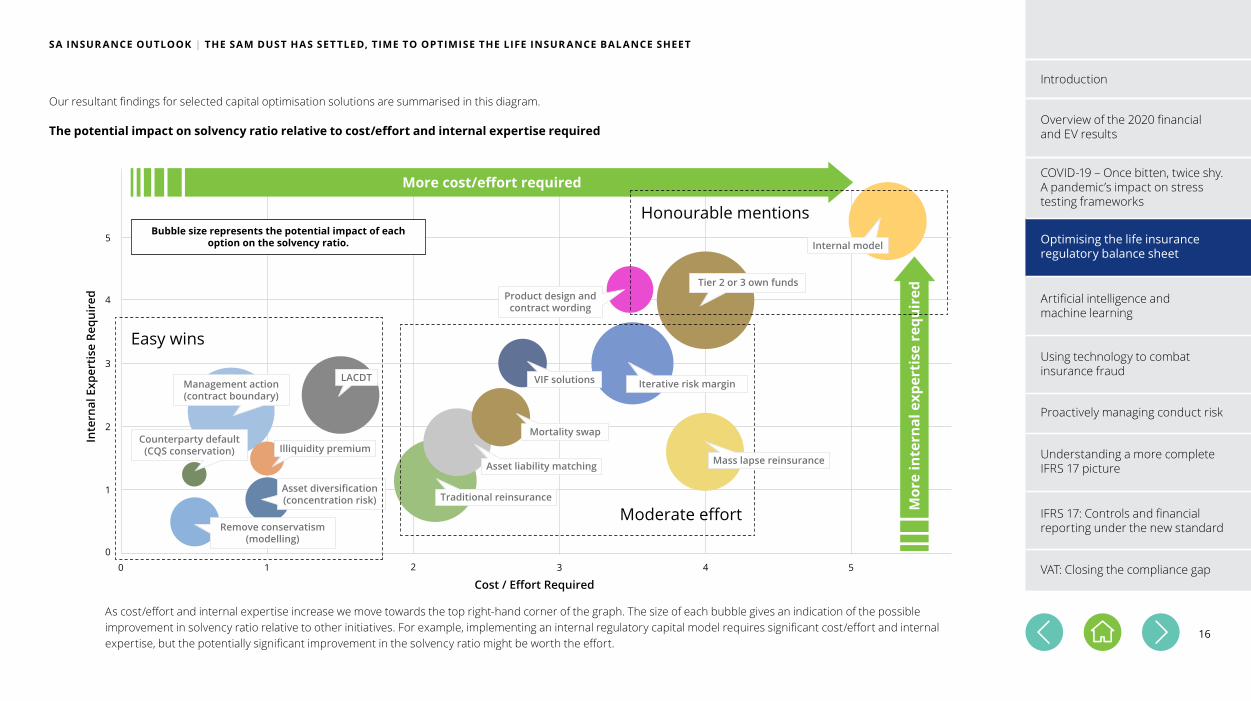
Our resultant findings for selected capital optimisation solutions are summarised in this diagram.
As cost/effort and internal expertise increase we move towards the top right-hand corner of the graph. The size of each bubble gives an indication of the possible improvement in solvency ratio relative to other initiatives. For example, implementing an internal regulatory capital model requires significant cost/effort and internal expertise, but the potentially significant improvement in the solvency ratio might be worth the effort.
The potential impact on solvency ratio relative to cost/effort and internal expertise required
5
4
3
2
1
0
0 1 2 3 4 5
More cost/effort required
Inte
rnal
Exp
erti
se R
equi
red
Cost / Effort Required
Bubble size represents the potential impact of each option on the solvency ratio.
Mor
e in
tern
al e
xper
tise
req
uire
d
Iterative risk marginVIF solutions
Traditional reinsurance
Asset liability matching
Mortality swap
Product design and contract wording
Internal model
Tier 2 or 3 own funds
Moderate effort
Management action(contract boundary)
LACDT
Counterparty default(CQS conservation) Illiquidity premium
Asset diversification(concentration risk)
Remove conservatism(modelling)
Honourable mentions
Easy wins
Mass lapse reinsurance
Using technology to combat insurance fraud
Proactively managing conduct risk
Understanding a more complete IFRS 17 picture
IFRS 17: Controls and financial reporting under the new standard
VAT: Closing the compliance gap
Artificial intelligence and machine learning
Introduction
Overview of the 2020 financial and EV results
COVID-19 – Once bitten, twice shy.A pandemic’s impact on stress testing frameworks
Optimising the life insurance regulatory balance sheet
17
SA INSUR ANCE OUTLOOK | THE SAM DUST HAS SETTLED, TIME TO OPTIMISE THE LIFE INSUR ANCE BAL ANCE SHEET
Easy WinsEasy wins are summarised in the bottom left-hand corner of the graph, as these are initiatives that can be implemented with relatively limited internal expertise and minimal cost/effort. Many of the easy wins relate to modelling initiatives. This can be understood with the context of where insurers’ capital thinking was grounded, the Financial Soundness Valuation (FSV) framework. In the FSV world conservatism in modelling was not only required but was also common practice. Under SAM the liabilities should be measured on a best estimate basis, however both implicit and sometimes explicit conservatism remains within some actuarial models and assumptions. Actuaries tend to include conservatism to allow for the uncertainty in assumptions, model risk and data. Actuaries should do more to ensure their numbers reflect a best estimate view. Conservatism is particularly included in the valuation of new contracts.
Furthermore, some insurers choose more conservative Credit Quality Steps than can be justified. Similarly, insurers might not be shortening contract boundaries for loss-making contracts, i.e. not allowing for the fact that such contracts can be assumed to be repriced at the expected repricing date, hence reducing capitalisation of long-term future losses.
A key modelling requirement under SAM is the loss absorbing capacity of deferred taxes which, with a moderate level of effort, could reduce the SCR by up to 28%. SAM also provides insurers with the option to increase the discount rate by an illiquidity premium, which can significantly reduce reserves for annuity business, albeit with a marginal increase in SCR.Another easy win, particularly at small/medium sized
insurers, is to fully understand the interplay between assets held and components of the Market Risk module. Small tweaks, for example spreading cash assets across multiple major banks, reduces concentration risk and can significantly decrease the Market Risk capital requirement.
Moderate EffortIn the middle of the graph there are several classic risk management tools, for example, asset liability matching that has long been used by insurers. This ranges from simple durational matching that can be done with less cost and expertise, all the way to complicated hedging strategies. These provide protection against a wide variety of movements in various financial variables.
Reinsurance is a similarly well-established risk transfer tool, starting with the transfer of mortality and morbidity risk through traditional reinsurance. Similarly, mortality swaps are an effective way to reduce longevity risk on annuity books and at the same time reduce cash flow volatility to better enable asset liability matching. Reinsurance can also provide financing, like VIF solutions which entail transferring large portions of premium to a reinsurer, thereby reducing Own Funds, but also significantly reducing most life underwriting risk components, including lapse risk. The net effect of such a solution could well be an improved solvency ratio.One of the youngest additions to the reinsurers’ toolkit is mass lapse reinsurance, which transfers a part of the loss arising from a mass lapse event. This is particularly beneficial for risk business with long contract boundaries where the mass lapse SCR is sizeable.
In South Africa insurers also have access to a fundamentally different tool, application of an iterative
risk margin (IRM). As the name suggests, the IRM calculates the risk margin and SCR iteratively. While this entails upfront effort, it has been proven to be cost-effective in the long term and can introduce significant solvency ratio improvements, particularly where there are large negative reserves. While the IRM modelling sophistication is not directly comparable to the actual risk transfer achieved through mass lapse reinsurance, both tools achieve similar outcomes in reducing the lapse risk component of the SCR. Insurers could thus consider these tools as alternatives to one another by comparing upfront cost/effort of the IRM approach, including regulatory application cost/effort, against the long-term cost of mass lapse reinsurance premiums.
Honourable MentionsOne of the biggest bubbles on the graph relates to the use of Tier 2 and tier 3 own funds, particularly the use of Ancillary Own Funds in the form of subordinated debt and parental letters of guarantee. A parental guarantee can significantly improve the solvency ratio without requiring a capital injection. When applying a parental guarantee in the SCR calculations an allowance for default risk is required, however this allowance is generally small relative to the maximum allowable increase in Own Funds, being say 50% of SCR for Tier 2 Own Funds.
Related to this are regulatory deductions from Own Funds, including investments in an insurer’s own shares, in its holding company, cash and deposits at a bank within the same financial conglomerate, participation in financial and credit institutions and net deferred tax assets. Minimising these deductions will improve the solvency ratio.
Using technology to combat insurance fraud
Proactively managing conduct risk
Understanding a more complete IFRS 17 picture
IFRS 17: Controls and financial reporting under the new standard
VAT: Closing the compliance gap
Artificial intelligence and machine learning
Introduction
Overview of the 2020 financial and EV results
COVID-19 – Once bitten, twice shy.A pandemic’s impact on stress testing frameworks
Optimising the life insurance regulatory balance sheet
18
SA INSUR ANCE OUTLOOK | THE SAM DUST HAS SETTLED, TIME TO OPTIMISE THE LIFE INSUR ANCE BAL ANCE SHEET
In the top right-hand corner of the graph is use of an internal model for regulatory capital. An internal SAM capital model requires significant cost/effort and internal expertise to implement, but could lead to significant improvement in the solvency ratio. These models are not very common in South Africa, especially the life insurance space. Historically it has been very difficult to get approval for use of an internal model from the Prudential Authority.
Finally, the impact of new products and features should be fully understood before launch, including the impact on diversification benefits of SCR components. In fact, by launching products that target certain SCR components an insurer can sell more policies without materially impacting its capital requirements, and thus improve Return on Equity.
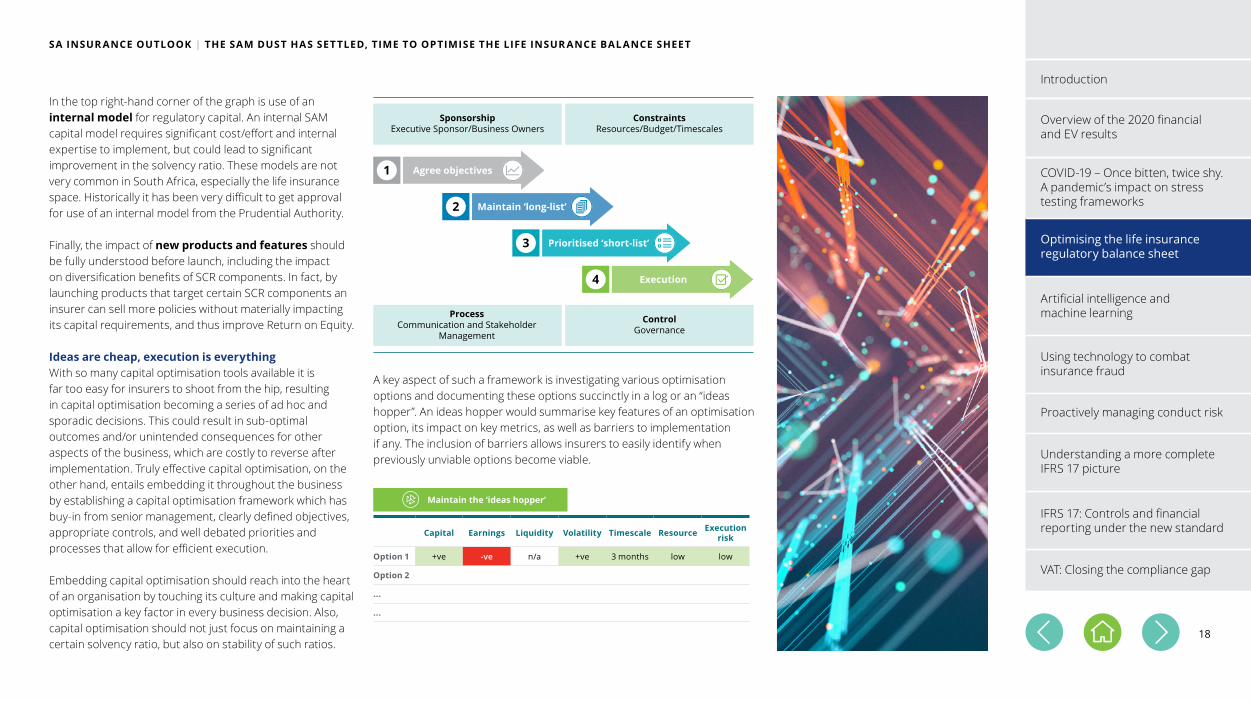
Ideas are cheap, execution is everything With so many capital optimisation tools available it is far too easy for insurers to shoot from the hip, resulting in capital optimisation becoming a series of ad hoc and sporadic decisions. This could result in sub-optimal outcomes and/or unintended consequences for other aspects of the business, which are costly to reverse after implementation. Truly effective capital optimisation, on the other hand, entails embedding it throughout the business by establishing a capital optimisation framework which has buy-in from senior management, clearly defined objectives, appropriate controls, and well debated priorities and processes that allow for efficient execution.
Embedding capital optimisation should reach into the heart of an organisation by touching its culture and making capital optimisation a key factor in every business decision. Also, capital optimisation should not just focus on maintaining a certain solvency ratio, but also on stability of such ratios.
Capital Earnings Liquidity Volatility Timescale Resource Execution risk
Option 1 +ve -ve n/a +ve 3 months low low
Option 2
...
...
Maintain the ‘ideas hopper’
A key aspect of such a framework is investigating various optimisation options and documenting these options succinctly in a log or an “ideas hopper”. An ideas hopper would summarise key features of an optimisation option, its impact on key metrics, as well as barriers to implementation if any. The inclusion of barriers allows insurers to easily identify when previously unviable options become viable.
4 Execution
1 Agree objectives
2 Maintain ‘long-list’
3 Prioritised ‘short-list’
ControlGovernance
ProcessCommunication and Stakeholder
Management
SponsorshipExecutive Sponsor/Business Owners
ConstraintsResources/Budget/Timescales
Using technology to combat insurance fraud
Proactively managing conduct risk
Understanding a more complete IFRS 17 picture
IFRS 17: Controls and financial reporting under the new standard
VAT: Closing the compliance gap
Artificial intelligence and machine learning
Introduction
Overview of the 2020 financial and EV results
COVID-19 – Once bitten, twice shy.A pandemic’s impact on stress testing frameworks
Optimising the life insurance regulatory balance sheet
19
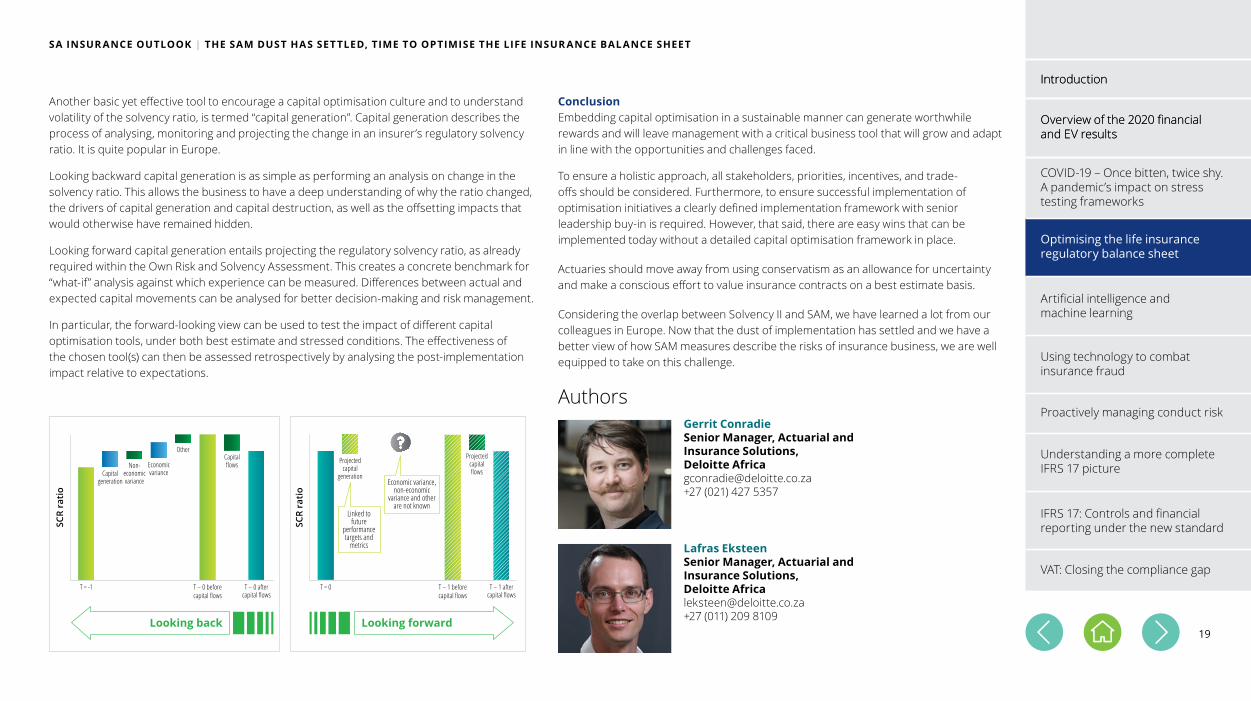
Another basic yet effective tool to encourage a capital optimisation culture and to understand volatility of the solvency ratio, is termed “capital generation”. Capital generation describes the process of analysing, monitoring and projecting the change in an insurer’s regulatory solvency ratio. It is quite popular in Europe.
Looking backward capital generation is as simple as performing an analysis on change in the solvency ratio. This allows the business to have a deep understanding of why the ratio changed, the drivers of capital generation and capital destruction, as well as the offsetting impacts that would otherwise have remained hidden.
Looking forward capital generation entails projecting the regulatory solvency ratio, as already required within the Own Risk and Solvency Assessment. This creates a concrete benchmark for “what-if” analysis against which experience can be measured. Differences between actual and expected capital movements can be analysed for better decision-making and risk management.
In particular, the forward-looking view can be used to test the impact of different capital optimisation tools, under both best estimate and stressed conditions. The effectiveness of the chosen tool(s) can then be assessed retrospectively by analysing the post-implementation impact relative to expectations.
SA INSUR ANCE OUTLOOK | THE SAM DUST HAS SETTLED, TIME TO OPTIMISE THE LIFE INSUR ANCE BAL ANCE SHEET
ConclusionEmbedding capital optimisation in a sustainable manner can generate worthwhile rewards and will leave management with a critical business tool that will grow and adapt in line with the opportunities and challenges faced.
To ensure a holistic approach, all stakeholders, priorities, incentives, and trade-offs should be considered. Furthermore, to ensure successful implementation of optimisation initiatives a clearly defined implementation framework with senior leadership buy-in is required. However, that said, there are easy wins that can be implemented today without a detailed capital optimisation framework in place.
Actuaries should move away from using conservatism as an allowance for uncertainty and make a conscious effort to value insurance contracts on a best estimate basis.
Considering the overlap between Solvency II and SAM, we have learned a lot from our colleagues in Europe. Now that the dust of implementation has settled and we have a better view of how SAM measures describe the risks of insurance business, we are well equipped to take on this challenge.
AuthorsGerrit ConradieSenior Manager, Actuarial and Insurance Solutions, Deloitte [email protected]+27 (021) 427 5357
Lafras EksteenSenior Manager, Actuarial and Insurance Solutions, Deloitte [email protected]+27 (011) 209 8109Looking forward
SCR
rati
o
T = 0
Projectedcapital
generation
Projectedcapitalflows
T – 1 beforecapital flows
T – 1 aftercapital flows
Economic variance, non-economic
variance and other are not known
Linked to future
performancetargets and
metrics
Looking back
Capitalgeneration
Non-economicvariance
Economicvariance
OtherCapitalflows
T = -1 T – 0 beforecapital flows
T – 0 aftercapital flows
SCR
rati
o
Using technology to combat insurance fraud
Proactively managing conduct risk
Understanding a more complete IFRS 17 picture
IFRS 17: Controls and financial reporting under the new standard
VAT: Closing the compliance gap
Artificial intelligence and machine learning
Introduction
Overview of the 2020 financial and EV results
Introduction
Overview of the 2020 financial and EV results
COVID-19 – Once bitten, twice shy.A pandemic’s impact on stress testing frameworks
Optimising the life insurance regulatory balance sheet
20
SA INSUR ANCE OUTLOOK | ARTIFICIAL INTELLIGENCE AND MACHINE LEARNING WITHIN THE INSUR ANCE MARKET
Artificial intelligence and machine learning within the insurance marketAs Artificial Intelligence (AI) continues to infiltrate every corner of the world, companies are being forced to adapt and ensure that implementation of machine learning (ML) methods that underpin AI occur throughout the business. If they don’t, they risk falling short of their competitors due to inferior performance, poor client interaction, flagging operational efficiencies and high costs. The use of Artificial Intelligence extends well beyond simply replacing mundane tasks with automated processes: machine learning algorithms are paving the way for solutions to be found and programs to be implemented to solve previously unimaginable problems. This is leading to higher profits, reduced risks and faster identification of systematic errors. Insurance, like any other industry, is on this journey to delivering value through Artificial Intelligence and as such, machine learning is fast becoming a business imperative.
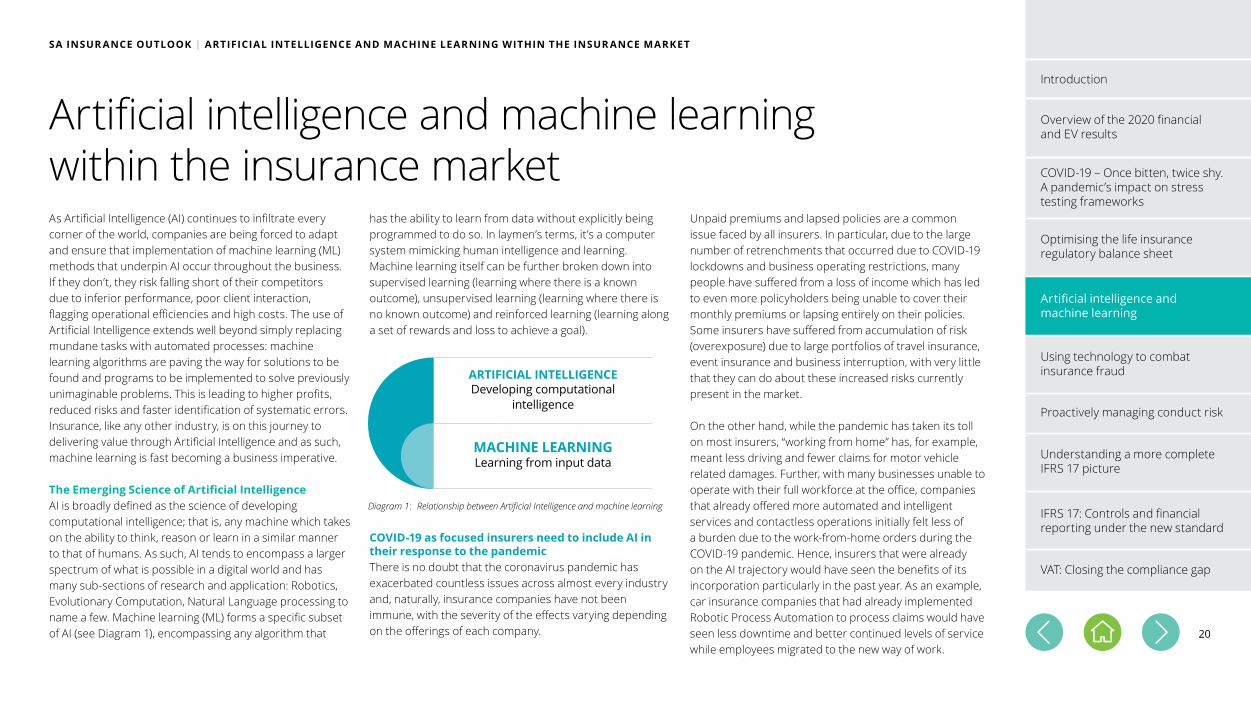
The Emerging Science of Artificial IntelligenceAI is broadly defined as the science of developing computational intelligence; that is, any machine which takes on the ability to think, reason or learn in a similar manner to that of humans. As such, AI tends to encompass a larger spectrum of what is possible in a digital world and has many sub-sections of research and application: Robotics, Evolutionary Computation, Natural Language processing to name a few. Machine learning (ML) forms a specific subset of AI (see Diagram 1), encompassing any algorithm that
has the ability to learn from data without explicitly being programmed to do so. In laymen’s terms, it’s a computer system mimicking human intelligence and learning. Machine learning itself can be further broken down into supervised learning (learning where there is a known outcome), unsupervised learning (learning where there is no known outcome) and reinforced learning (learning along a set of rewards and loss to achieve a goal).
COVID-19 as focused insurers need to include AI in their response to the pandemicThere is no doubt that the coronavirus pandemic has exacerbated countless issues across almost every industry and, naturally, insurance companies have not been immune, with the severity of the effects varying depending on the offerings of each company.
Unpaid premiums and lapsed policies are a common issue faced by all insurers. In particular, due to the large number of retrenchments that occurred due to COVID-19 lockdowns and business operating restrictions, many people have suffered from a loss of income which has led to even more policyholders being unable to cover their monthly premiums or lapsing entirely on their policies. Some insurers have suffered from accumulation of risk (overexposure) due to large portfolios of travel insurance, event insurance and business interruption, with very little that they can do about these increased risks currently present in the market.
On the other hand, while the pandemic has taken its toll on most insurers, “working from home” has, for example, meant less driving and fewer claims for motor vehicle related damages. Further, with many businesses unable to operate with their full workforce at the office, companies that already offered more automated and intelligent services and contactless operations initially felt less of a burden due to the work-from-home orders during the COVID-19 pandemic. Hence, insurers that were already on the AI trajectory would have seen the benefits of its incorporation particularly in the past year. As an example, car insurance companies that had already implemented Robotic Process Automation to process claims would have seen less downtime and better continued levels of service while employees migrated to the new way of work.
Diagram 1: Relationship between Artificial Intelligence and machine learning
ARTIFICIAL INTELLIGENCEDeveloping computational
intelligence
MACHINE LEARNINGLearning from input data
Using technology to combat insurance fraud
Proactively managing conduct risk
Understanding a more complete IFRS 17 picture
IFRS 17: Controls and financial reporting under the new standard
VAT: Closing the compliance gap
Introduction
Overview of the 2020 financial and EV results
COVID-19 – Once bitten, twice shy.A pandemic’s impact on stress testing frameworks
Optimising the life insurance regulatory balance sheet
Artificial intelligence and machine learning
21
Prioritising AI in the insurance value chainOur experience in the industry with various clients hasprovided us with some prime examples of the improvements possible when ML is incorporated into – or replaces – previous operational processes. As one of the biggest impacts of COVID-19 on insurers, unpaid premiums and lapsed policies have caused strain on the collections process. The ability to ensure efficient operations within the process and reclaim partial or full payments is essential for insurers surviving the pandemic.
The general collection process requires the insurer to chase missed premiums with policyholders and make the necessary payment arrangements before these individuals lapse on their policies entirely. The traditional approach requires daily dialling lists of policyholders who have missed payments and these lists then get sent to the collection centre to resolve. However, there often tends to be large numbers of policyholders with unpaid premiums making it very difficult to follow up with every single individual on the list each day. A machine learning model can predict which clients are more likely to make an arrangement on the outstanding amount and these clients can be targeted first by the dialling team. Hence, resources are not wasted on policyholders who have no intention of paying their missed premiums at a future date. Instead the collections process will yield a greater amount of money received by prioritising specific policyholders.
On the other end of the lifecycle, new business may be a struggle in the post-pandemic world with many individual’s either being retrenched or severely restrained by the consequent economic downturn. In many cases, AI and ML advances are out of reach for brokers and agents. With the insurer holding data across the business, they need to ensure that insights and decisions from AI are
passed through to the distribution model enabling the individual agent or broker to capitalise on opportunities. For instance, the inclusion of an early lapse probability through a prediction model can ensure that the broker/agent only takes on customers who have a greater chance of paying their premiums – especially in the first 12 months of the policy. Another example could be the implementation of Next Best Action models which can give brokers and agents insight into which offers clients would either be interested in or able to afford. This can be achieved though end-to-end AI solutions which ingest data across the business, run various models and deliver the insight on broker or agent platforms making the entire process seamless, intuitive with actionable and valuable insights that individuals can use in sales conversations. Other benefits of including AI tools in the sales process include leveraging process automation techniques for mundane manual tasks such as email follow ups and verification checks during the leads process. The benefits of this include operational efficiency and better client service.
Another pain point that AI can help with is underwriting. Underwriting is lengthy and often riddled with human judgement bias. Despite best attempts, unconscious bias can creep into decision-making which devalues the risk and pricing judgments in underwriting. However, AI and ML have no such bias! With a set of unbiased data, they are completely objective and add consistency to the process. In addition, AI can be leveraged to create greater accuracy in determining risk as it is able to consider a larger variety of data points, uncover subtle trends and locate outliers. And because machine learning can be combined with Big Data technologies, new data sources that may be large in volume, produced in real-time or be generated in a non-traditional way, can be leveraged to optimise the underwriting process. For instance, data sources such as social media data,
geo-location and data from wearable tech such as smart watches could all be incorporated into the underwriting process. Other areas in AI can be leveraged in the underwriting process. For instance, Robotic process automation (the automation of rules-based process) can optimise tasks such as ID and income verification, credit history checks and bank statement retrieval.
These examples of a simple machine learning application of Artificial Intelligence can lead to a major impact on day-to-day operations. By integrating predictive analytics via machine learning algorithms and process automation, an insurer can better streamline and consequently optimise their end-to-end lifecycle. Applying similar logic and appropriate machine learning models to fraud detection, claims and underwriting, will have significant benefits to any insurance business.
SA INSUR ANCE OUTLOOK | ARTIFICIAL INTELLIGENCE AND MACHINE LEARNING WITHIN THE INSUR ANCE MARKET
AuthorsWessel OosthuizenAssociate Director, Cognitive Advantage, AI Leader, Risk Advisory, Deloitte [email protected]+27 (011) 209 8036
Vanessa SakerManager, Analytics, Risk Advisory, Deloitte [email protected]+27 (011) 202 7349
Using technology to combat insurance fraud
Proactively managing conduct risk
Understanding a more complete IFRS 17 picture
IFRS 17: Controls and financial reporting under the new standard
VAT: Closing the compliance gap
Introduction
Overview of the 2020 financial and EV results
COVID-19 – Once bitten, twice shy.A pandemic’s impact on stress testing frameworks
Optimising the life insurance regulatory balance sheet
Artificial intelligence and machine learning
22
The perpetration of fraud within an insurance environment has many facets related to traditional claims (for example: death, disability, income protection and hospitalisation claims). However there are additional focus areas which exacerbate the propensity for fraud to be committed by various parties.
The impact on businesses globally as a result of COVID-19 cannot be denied. However with increased claims unfortunately comes an increased risk of fraud.
Leveraging technology-based solutions can assist in identifying fraud red flags and also reduce disruption to the claims process, ensuring that client turnaround times are top of mind and that legitimate claims are not unnecessarily delayed. COVID-19 has been the catalyst for remote working across industries and organisations, simultaneously increasing the use of technology. Identification
and response to risks needs to be driven by a consistent and effective process. This can be augmented through effective use of technology.
Coupling the technology with effective andexperienced resources is essential in maximising the levels of robustness in respectof deterring, preventing, detecting and responding to incidents of suspected fraud. The investment in technology and suitably qualified and experienced resources is imperative if one considers that the financial losses associated with fraud are but one of the consequences.
Brand damage and impaired investor confidence are some of the additional and critical considerations when assessing fraud risks and the organisation’s responseto fraud.
SA INSUR ANCE OUTLOOK | COMBATING INSUR ANCE FR AUD BY USING TECHNOLOGY AND DATA ANALY TICS
Combating insurance fraud by using technology and data analyticsThe risk of insurance fraud or fraud in general is not new, but have now been amplified in the current economic landscape.
Proactively managing conduct risk
Understanding a more complete IFRS 17 picture
IFRS 17: Controls and financial reporting under the new standard
VAT: Closing the compliance gap
Introduction
Overview of the 2020 financial and EV results
COVID-19 – Once bitten, twice shy.A pandemic’s impact on stress testing frameworks
Optimising the life insurance regulatory balance sheet
Artificial intelligence and machine learning
Using technology to combat insurance fraud

23
Effective fraud response plans and timelinesProactive use of technology in identifying fraud risk indicators allows early flagging and response to any potential incidents. Effective predictive analytics andassessment are key to responding swiftly, effectively and accurately. A key focus would be to reduce the number of false positives identified in order to allow dedicated focus of resourcing.
Secure data reviews and analysisUtilising proven eDiscovery technologies would provide a secure platform for secure review of documentation, data and evidence. eDiscovery solutions hold many benefits to an investigative or litigation team some of which include remote and secure review access by multiple reviewers,effective audit trails in respect of the review, broader
search criteria which becomes valuable in syndicate related investigations, machine learning and early case assessmentto name a few. Click here for more information on eDiscovery.
Sound evidentiary management principles and admissibilitySecuring digital evidence is a fundamental part of investigative procedures. This combined with the need to effectively secure hard copy documentary evidence posesrisks in terms of the evidence management principles. These risks need to be assessed and appropriately mitigated in order to ensure that sound evidence management is adopted and that should prosecution proceedings follow, that such evidence is in fact admissible.
Informed proactive fraud detection initiativesLeveraging data assists with detection, prevention and response to fraud. With the need to apply effective focus on resourcing and managing costs, data should beleveraged to also conduct proactive fraud detection initiatives. A purely reactive approach (response) to fraud would not be ideal in that the root causes of such fraudmay not be identified in their entirety.
This is particularly important if one considers that a specific product may be more susceptible to fraud purely by design and marketing. Utilising fraud analytics in the analysis oftrends from both a new business, claims and client perspective may yield additional insights into the fraud propensity associated with specific products.
A technology rich approach to combating fraud would, amongst others, assist in enhancing the following:
Effective fraud response plans and timelines
Secure data reviews and
analysis
Informed proactive fraud
detection initiativesSound evidentiary management principles
and admissibility
Valuable retrospective
analysis of business
transactionsEnhanced internal procedures as a result
of effective data analysis
SA INSUR ANCE OUTLOOK | COMBATING INSUR ANCE FR AUD BY USING TECHNOLOGY AND DATA ANALY TICS
Proactively managing conduct risk
Understanding a more complete IFRS 17 picture
IFRS 17: Controls and financial reporting under the new standard
VAT: Closing the compliance gap
Introduction
Overview of the 2020 financial and EV results
COVID-19 – Once bitten, twice shy.A pandemic’s impact on stress testing frameworks
Optimising the life insurance regulatory balance sheet
Artificial intelligence and machine learning
Using technology to combat insurance fraud

24
Enhanced internal procedures as a result of effective data analysisClient service and effective client interaction remains core to any business. Within an insurance environment the need to respond efficiently to client requests and claim submissions is paramount to ensuring clients are serviced in accordance with specified and/or agreed timelines.
Maximising the use of technology and data analysis could assist in not only preventing, detecting and responding to fraud but also reducing the number of manual (human)interventions required.
This could assist in reducing turnaround times in respect of specific transactions. eDiscovery review technologies could also augment any required manual interaction required while improving analysis of supporting documentation.
Valuable retrospective analysis of business transactionsRetrospective analysis of historical transactions can provide increased identification of potential fraud indicators.
The argument may be that such transactions are in fact completed and that any such fraud identified may notnecessarily result in effective recoveries of losses. However, it is important to note that applying the results and interpretations of the retrospective analysis to current environments may also assist in reducing the perpetuation of ongoing fraud or in fact reduce the likelihood of similar fraud not being detected. Information pertaining to how the fraud was perpetrated, who perpetrated such fraud, what controls were ineffective and who were the stakeholders or role players in specific transactions would be extremely valuable in conducting proactive detection initiatives.
This information would also allow any potential control weaknesses identified to be assessed and mitigated. Recovery proceedings in respect of losses should then beinitiated together with the relevant reporting to authorities.
Cohesive technology and experienceInvesting in proactive and reactive procedures are equally important in combating fraud in any environment.An organisation which is not effectively leveraging technology in their fraud strategy may be subject to increased risk of fraud. The need for qualified and experienced forensic professionals is a vital component of any forensic department. With this in mind the valueof technology would only be realised once the experienced forensic professionals are suitably trained and proficient in the use of such technologies. The use of technology for employee fraud awareness and training initiatives would further aid in achieving broader coverage and increased interaction, reducing the frequency of in person workshops.
All organisations need to ensure that their respective fraud strategy, relevant policies and response plan are regularly assessed and updated as required. Fraud risk assessments, which are an integral component of managing fraud risk would also benefit from cohesive interaction between technology and team members. In this regard comprehensive information/data and experienced professionals are essential in achieving this through the use of technology.
There should also be appropriate consideration to fraud risks when products are developed and related productprocedures are implemented.
Zero toleranceAny fraud incident should be addressed through a zero tolerance approach. In this regard consistency is key to deterring fraud in the future. It is incumbent upon all organisations and citizens to combat fraud, report fraud and deter fraud.
Technology and data has and continues to increasingly impact the way we engage with customers, do business and develop our strategies. Smart organisations with well orchestrated strategies in combating fraud, using data and technology, will realise the return on investment in the short term and continue to flourish and enhance stakeholder value.
SA INSUR ANCE OUTLOOK | COMBATING INSUR ANCE FR AUD BY USING TECHNOLOGY AND DATA ANALY TICS
AuthorsClayton ThomopoulosDirector, Forensic & Regulatory Solutions, e-Discovery Leader Risk Advisory, Deloitte Africa [email protected]+27 (011) 209 8275
Greg RammegoDirector, Forensic & Regulatory Solutions Leader, Risk Advisory, Deloitte AfricaE: [email protected]: +27 82 417 5889
Proactively managing conduct risk
Understanding a more complete IFRS 17 picture
IFRS 17: Controls and financial reporting under the new standard
VAT: Closing the compliance gap
Introduction
Overview of the 2020 financial and EV results
COVID-19 – Once bitten, twice shy.A pandemic’s impact on stress testing frameworks
Optimising the life insurance regulatory balance sheet
Artificial intelligence and machine learning
Using technology to combat insurance fraud
25
SA INSUR ANCE OUTLOOK | PROACTIVELY MANAGING CONDUCT RISK
The expectations of the Financial Sector Conduct Authority (FSCA) regarding treating customers fairly have grown significantly in the three years since the FSCA’s inception in 2018. While some institutions are responding to these expectations through well-planned conduct risk management programs, there remain institutions limiting their focus with regard to conduct risk and selecting a largely reactive response.
If we consider other regions where conduct risk regulation and monitoring is at a more mature stage, regulators have steadily increased the focus on conduct risk. This has resulted in exceptionally large remediation programs being undertaken. It is our view and expectation that, as has been the case globally, the market conduct regulator is likely to continue to tighten the screws on market conduct.
While the FSCA’s expectations has certainly driven much of the industry’s response to conduct risk, it is public opinion that also acts as a significant deterrent to delivering poor client outcomes. In today’s environment where information is readily available and shared via social media, the delivery of unfair treatment or unfair outcomes to customers can, and usually does, lead to reputational damage. We do not need to look far for a number of heavily publicised cases that have occurred over the past three years to understand the potential negative impact on an insurance company’s brand.
Regardless of the primary motivations that drive insurers, it is clear that conduct risk and the effective management thereof is no longer a conceptual requirement. The FSCA expects that insurers are actively measuring, monitoring and managing conduct risk, and customers are demanding the same. We would argue that any insurer without a pro-active conduct risk programme is at significant risk of governance failures, non-compliance consequences and reputational damage.
Our view on the approach to Conduct RiskEffective conduct risk programmes comprise a number of key elements, including a framework design, governance structures, employee incentives which have amended baselines, strict product governance protocols and redesigned marketing and sales procedures. We suggest viewing the requirements from the perspective of three key questions, namely: who should be managing conduct risk within an insurer; how should conduct risk be effectively managed, and what should be measured and monitored to ensure customers are receiving fair outcomes?
The whoIn all compliance and risk matters, there is always an important role for all three lines of defence, but who should have primary responsibility for implementing the conduct risk programme? Given that the central tenet of conduct risk is achieving fair outcomes for customers. In our
experience it is the first line that is best placed to identify, understand and manage the potential conduct risks.
The key challenge with managing conduct risk is identifying all the business processes that play a role in what a customer’s outcomes ultimately are. First line understands best which business processes impact customer outcomes. This identification and management is less obvious than it seems as a number of processes, beyond marketing and sales, directly impact customer outcomes – consider employee sales incentives and product design as two examples. Thus, we deem it crucial that the identification and management of conduct risk lies in the heart of the business, with the first line of defence.
When considering the complexity in identifying the conduct risk elements within a business, and understanding how to effectively map these to customer outcomes, second line can play a valuable role, especially as they operate across the organisation, and have a unique opportunity to understand and share first-line experiences and learnings. Similarly, third line should already be active in the conduct risk domain, and our view is that the value they best add at this point, is testing the process business is undertaking to identify and monitor the conduct risk drivers.
Proactively managing conduct riskTicking the box no longer ticks the box
Understanding a more complete IFRS 17 picture
IFRS 17: Controls and financial reporting under the new standard
VAT: Closing the compliance gap
Introduction
Overview of the 2020 financial and EV results
COVID-19 – Once bitten, twice shy.A pandemic’s impact on stress testing frameworks
Optimising the life insurance regulatory balance sheet
Artificial intelligence and machine learning
Using technology to combat insurance fraud
Proactively managing conduct risk
26
The person allocated the task of managing conduct risk should be given appropriate authority and be incentivised to drive and uphold a culture of fair customer treatment. Understanding the real threat to first line in having to balance business and financial targets, with conduct risk drivers will introduce a tension that will need to be carefully managed.
It is also worth noting that in our experience, there is often a disconnect in the definition of conduct risk and the identification of conduct risk drivers between business and traditional support functions such as human capital and marketing. This makes it imperative to define what conduct risk means in your organisation, as a critical initial step.
The howIn our experience, there is a danger that conduct risk becomes viewed largely as a soft issue (often mistakenly viewed as measured using a customer satisfaction score). This is, in our view, one of the biggest challenges within an institution. Conduct risk needs to be managed through ongoing training to ensure an accurate understanding of conduct risk, why it is relevant, and the role that each employee (and sometimes third party) plays in offering fair outcomes for the customer. Conduct risk drivers are tangible business processes, which can be clearly monitored through the correct management information – which is exactly what the global regulators are doing. To not capacitate your organisation to do the same will place your organisation at a distinct disadvantage.
These conduct risk drivers, and the data that underpins them, can and should be used to incentivise employee behaviour, which will in turn drive the right culture at all levels across an organisation. Consequently, an effective
conduct risk programme requires a structured framework, supported by clear definitions of the concepts involved, underpinned by policy establishment and effective governance structures. An insurer is then equipped to understand where conduct risk drivers potentially exist, and how to monitor and effectively manage them. This requires consideration of all products, distribution channels, target audience and any support structures that impact on this, for example remuneration and incentivisation processes.
The whatConduct drivers are best identified and managed through data indicators. The indicators that are leveraged to measure and monitor conduct risk require data from across business units, support functions and the data silos that reside in most insurers. The FSCA has identified and requested, from insurers, the key data required to evaluate market conduct in the form of the Conduct of Business Return (CBR). Due to the legacy systems within most insurers, accessing the required data at the right level of granularity, accuracy and quality in a consistent manner is challenging. In addition, the validation of data across consecutive CBR returns is an issue, as is alignment of data between various returns such as SAM reports. The challenge in this is that it is not data and analytics as usual. The way analytics is conducted will need to provide a conduct risk narrative, and not solely the business narrative.
While insurers have invested considerable time and effort in programmes to identify data and automate the population of the CBR, the FSCA appears understandably concerned that insurers see this as a tick-box exercise. It is expected that the data used to populate the CBR is
a starting point only and that the monitoring of data to tell the story of conduct across the business should be an imbedded process within insurers. While all insurers already monitor a multitude of indicators regularly, it is expected that the data is viewed through specifically a conduct lens. The FSCA expects that insurers will identify those areas where there is potential conduct risk, and following on from those institutions must identify those key performance indicators (with relevant thresholds), that, when monitored and interpreted, alert the institution to conduct risks that either are surfacing or have surfaced. This is ultimately what the regulator will be looking to do.
The objective of measuring and monitoring these conduct indicators is to identify the conduct risks within business and to drive proactive action to prevent the risk from occurring. Hence, a review of last quarter’s indicators, once a quarter, is not sufficient. A meaningful representation of the conduct story should be available, in near real time, for various stakeholders to monitor, investigate and act upon.
This was highlighted in a project that we recently executed with an insurer, where we analysed and visualised, through dashboards, their CBR data from the last four quarters. Through our analysis we were able to assess the quality of the submissions, as well as quickly see potential conduct risks across the various business units at a group level. Extending these dashboards to incorporate additional data from the insurer as well as public external data will enable deeper insights into public perception and the ability to complete root cause investigation – not three months after it has happened but in near real time.
SA INSUR ANCE OUTLOOK | PROACTIVELY MANAGING CONDUCT RISK
Understanding a more complete IFRS 17 picture
IFRS 17: Controls and financial reporting under the new standard
VAT: Closing the compliance gap
Introduction
Overview of the 2020 financial and EV results
COVID-19 – Once bitten, twice shy.A pandemic’s impact on stress testing frameworks
Optimising the life insurance regulatory balance sheet
Artificial intelligence and machine learning
Using technology to combat insurance fraud
Proactively managing conduct risk

27
Many insurers have also shared their concerns around the conduct risks posed by third parties that liaise with their customer base such as brokers and call centre agents. For this reason, it is important to gather an appropriate level of data to enable the monitoring of fair treatment of customers as the FSCA considers the insurer accountable.
In closing The nature of conduct risk means that its management requires more careful planning and action than many other compliance topics. That said, because it is customer focused, our view is that it is a topic that is well worth addressing comprehensively – not only for compliance reasons (which are clearly important), but because it creates an opportunity to understand customers from a different perspective. Every organisation knows that their customers are their lifeblood, and conduct risk is a topic that will allow organisations to find real business benefit in managing risk.
As a parting word, our experience is that organisations always find something new and valuable about their clients through this compliance programme, and that is the intent behind going beyond simply complying.
SA INSUR ANCE OUTLOOK | PROACTIVELY MANAGING CONDUCT RISK
Authors
Dr Tracy DunbarAssociate Director, Analytics, Risk Advisory, Deloitte [email protected] +27 (011) 209 6322
Nicky KingwillAssociate Director, Forensic & Regulatory Solutions, Risk Advisory, Deloitte [email protected]+27 (011) 304 5720
Dean ChiversDirector, Regulatory Solutions, Deloitte [email protected]+27 (011) 806 5828
Understanding a more complete IFRS 17 picture
IFRS 17: Controls and financial reporting under the new standard
VAT: Closing the compliance gap
Introduction
Overview of the 2020 financial and EV results
COVID-19 – Once bitten, twice shy.A pandemic’s impact on stress testing frameworks
Optimising the life insurance regulatory balance sheet
Artificial intelligence and machine learning
Using technology to combat insurance fraud
Proactively managing conduct risk
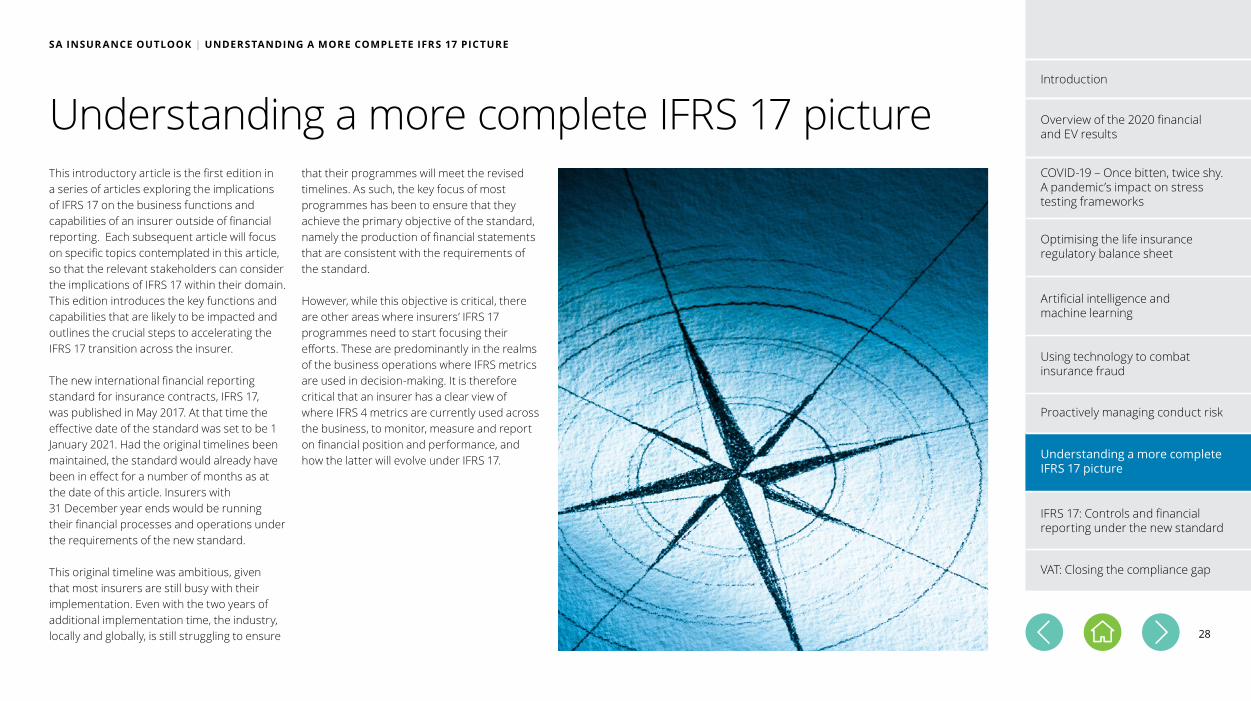
28
SA INSUR ANCE OUTLOOK | UNDERSTANDING A MORE COMPLETE IFRS 17 PICTURE
Understanding a more complete IFRS 17 pictureThis introductory article is the first edition in a series of articles exploring the implications of IFRS 17 on the business functions and capabilities of an insurer outside of financial reporting. Each subsequent article will focus on specific topics contemplated in this article, so that the relevant stakeholders can consider the implications of IFRS 17 within their domain. This edition introduces the key functions and capabilities that are likely to be impacted and outlines the crucial steps to accelerating the IFRS 17 transition across the insurer.
The new international financial reporting standard for insurance contracts, IFRS 17, was published in May 2017. At that time the effective date of the standard was set to be 1 January 2021. Had the original timelines been maintained, the standard would already have been in effect for a number of months as at the date of this article. Insurers with 31 December year ends would be running their financial processes and operations under the requirements of the new standard.
This original timeline was ambitious, given that most insurers are still busy with their implementation. Even with the two years of additional implementation time, the industry, locally and globally, is still struggling to ensure
that their programmes will meet the revised timelines. As such, the key focus of most programmes has been to ensure that they achieve the primary objective of the standard, namely the production of financial statements that are consistent with the requirements of the standard.
However, while this objective is critical, there are other areas where insurers’ IFRS 17programmes need to start focusing their efforts. These are predominantly in the realms of the business operations where IFRS metrics are used in decision-making. It is therefore critical that an insurer has a clear view of where IFRS 4 metrics are currently used across the business, to monitor, measure and report on financial position and performance, and how the latter will evolve under IFRS 17. Understanding a more complete
IFRS 17 picture
IFRS 17: Controls and financial reporting under the new standard
VAT: Closing the compliance gap
Introduction
Overview of the 2020 financial and EV results
COVID-19 – Once bitten, twice shy.A pandemic’s impact on stress testing frameworks
Optimising the life insurance regulatory balance sheet
Artificial intelligence and machine learning
Using technology to combat insurance fraud
Proactively managing conduct risk
Understanding a more complete IFRS 17 picture
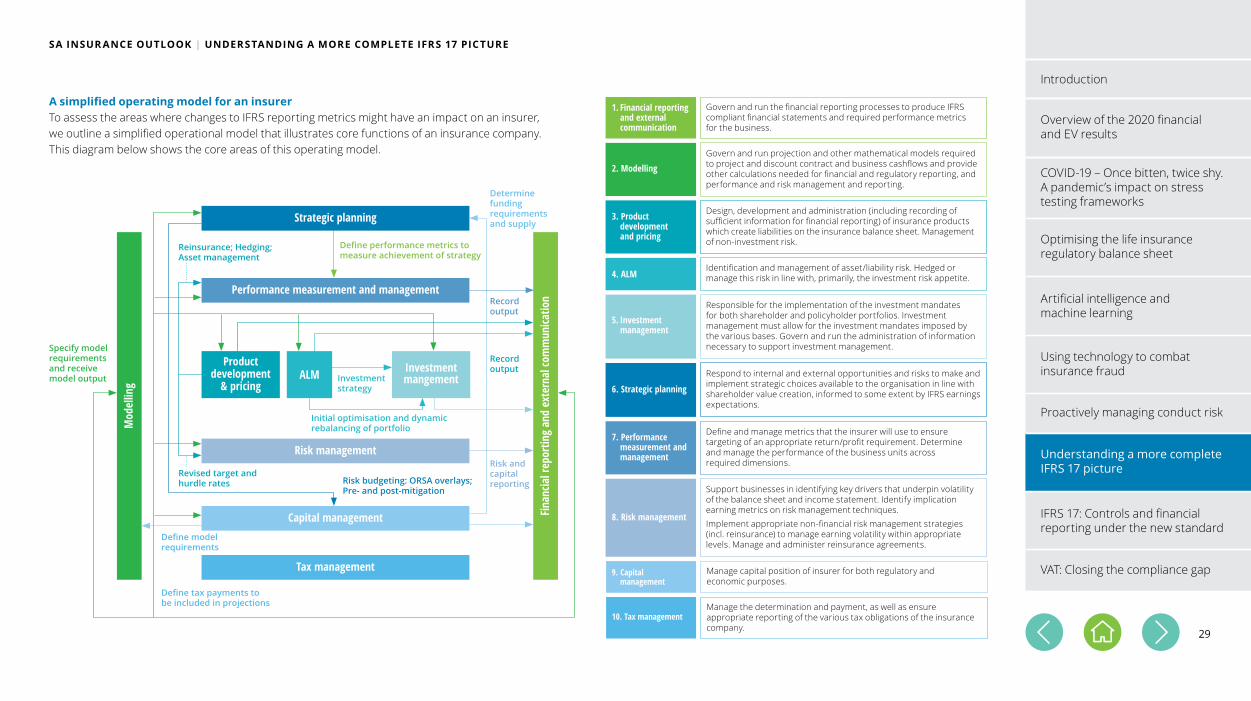
29
A simplified operating model for an insurerTo assess the areas where changes to IFRS reporting metrics might have an impact on an insurer, we outline a simplified operational model that illustrates core functions of an insurance company. This diagram below shows the core areas of this operating model.
SA INSUR ANCE OUTLOOK | UNDERSTANDING A MORE COMPLETE IFRS 17 PICTURE
4. ALM
1. Financial reporting and external communication
2. Modelling
3. Product development and pricing
5. Investment management
6. Strategic planning
7. Performance measurement and management
8. Risk management
9. Capital management
10. Tax management
Govern and run the financial reporting processes to produce IFRS compliant financial statements and required performance metrics for the business.
Govern and run projection and other mathematical models required to project and discount contract and business cashflows and provide other calculations needed for financial and regulatory reporting, and performance and risk management and reporting.
Design, development and administration (including recording of sufficient information for financial reporting) of insurance products which create liabilities on the insurance balance sheet. Management of non-investment risk.
Identification and management of asset/liability risk. Hedged or manage this risk in line with, primarily, the investment risk appetite.
Responsible for the implementation of the investment mandates for both shareholder and policyholder portfolios. Investment management must allow for the investment mandates imposed by the various bases. Govern and run the administration of information necessary to support investment management.
Respond to internal and external opportunities and risks to make and implement strategic choices available to the organisation in line with shareholder value creation, informed to some extent by IFRS earnings expectations.
Define and manage metrics that the insurer will use to ensure targeting of an appropriate return/profit requirement. Determine and manage the performance of the business units across required dimensions.
Support businesses in identifying key drivers that underpin volatility of the balance sheet and income statement. Identify implication earning metrics on risk management techniques. Implement appropriate non-financial risk management strategies (incl. reinsurance) to manage earning volatility within appropriate levels. Manage and administer reinsurance agreements.
Manage capital position of insurer for both regulatory and economic purposes.
Manage the determination and payment, as well as ensure appropriate reporting of the various tax obligations of the insurance company.
Determine fundingrequirementsand supply
Reinsurance; Hedging;Asset management
Revised target and hurdle rates
Define performance metrics tomeasure achievement of strategy
Risk budgeting: ORSA overlays;Pre- and post-mitigation
Risk and capital reporting
Define modelrequirements
Specify modelrequirementsand receivemodel output
Product development
& pricingALM Investment
mangementInvestment strategy
Initial optimisation and dynamicrebalancing of portfolio
Record output
Record output
Define tax payments to be included in projections
Performance measurement and management
Strategic planning
Tax management
Capital management
Risk management
Finan
cial r
epor
ting
and
exte
rnal
com
mun
icatio
n
Mod
ellin
g
Understanding a more complete IFRS 17 picture
IFRS 17: Controls and financial reporting under the new standard
VAT: Closing the compliance gap
Introduction
Overview of the 2020 financial and EV results
COVID-19 – Once bitten, twice shy.A pandemic’s impact on stress testing frameworks
Optimising the life insurance regulatory balance sheet
Artificial intelligence and machine learning
Using technology to combat insurance fraud
Proactively managing conduct risk
Understanding a more complete IFRS 17 picture
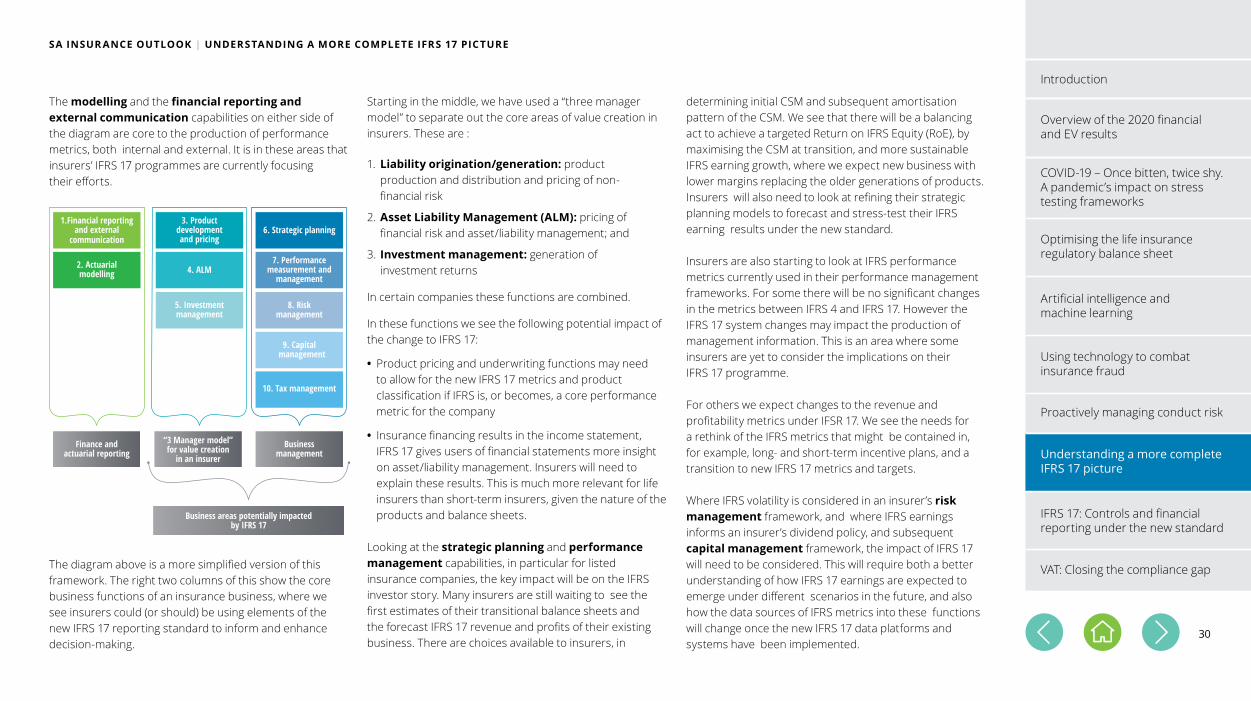
30
Starting in the middle, we have used a “three manager model” to separate out the core areas of value creation in insurers. These are :
1. Liability origination/generation: product production and distribution and pricing of non- financial risk
2. Asset Liability Management (ALM): pricing of financial risk and asset/liability management; and
3. Investment management: generation of investment returns
In certain companies these functions are combined.
In these functions we see the following potential impact of the change to IFRS 17:
• Product pricing and underwriting functions may need to allow for the new IFRS 17 metrics and product classification if IFRS is, or becomes, a core performance metric for the company
• Insurance financing results in the income statement, IFRS 17 gives users of financial statements more insight on asset/liability management. Insurers will need to explain these results. This is much more relevant for life insurers than short-term insurers, given the nature of the products and balance sheets.
Looking at the strategic planning and performance management capabilities, in particular for listed insurance companies, the key impact will be on the IFRS investor story. Many insurers are still waiting to see the first estimates of their transitional balance sheets and the forecast IFRS 17 revenue and profits of their existing business. There are choices available to insurers, in
SA INSUR ANCE OUTLOOK | UNDERSTANDING A MORE COMPLETE IFRS 17 PICTURE
determining initial CSM and subsequent amortisation pattern of the CSM. We see that there will be a balancing act to achieve a targeted Return on IFRS Equity (RoE), by maximising the CSM at transition, and more sustainable IFRS earning growth, where we expect new business with lower margins replacing the older generations of products. Insurers will also need to look at refining their strategic planning models to forecast and stress-test their IFRS earning results under the new standard.
Insurers are also starting to look at IFRS performance metrics currently used in their performance management frameworks. For some there will be no significant changes in the metrics between IFRS 4 and IFRS 17. However the IFRS 17 system changes may impact the production of management information. This is an area where some insurers are yet to consider the implications on their IFRS 17 programme.
For others we expect changes to the revenue and profitability metrics under IFSR 17. We see the needs for a rethink of the IFRS metrics that might be contained in, for example, long- and short-term incentive plans, and a transition to new IFRS 17 metrics and targets.
Where IFRS volatility is considered in an insurer’s risk management framework, and where IFRS earnings informs an insurer’s dividend policy, and subsequent capital management framework, the impact of IFRS 17 will need to be considered. This will require both a better understanding of how IFRS 17 earnings are expected to emerge under different scenarios in the future, and also how the data sources of IFRS metrics into these functions will change once the new IFRS 17 data platforms and systems have been implemented.
The modelling and the financial reporting and external communication capabilities on either side of the diagram are core to the production of performance metrics, both internal and external. It is in these areas that insurers’ IFRS 17 programmes are currently focusing their efforts.
The diagram above is a more simplified version of this framework. The right two columns of this show the core business functions of an insurance business, where we see insurers could (or should) be using elements of the new IFRS 17 reporting standard to inform and enhance decision-making.
Finance and actuarial reporting
“3 Manager model” for value creation
in an insurerBusiness
management
Business areas potentially impacted by IFRS 17
8. Risk management
4. ALM
3. Product development and pricing
5. Investment management
1.Financial reportingand external
communication
2. Actuarial modelling
6. Strategic planning
7. Performance measurement and
management
10. Tax management
9. Capital management
Understanding a more complete IFRS 17 picture
IFRS 17: Controls and financial reporting under the new standard
VAT: Closing the compliance gap
Introduction
Overview of the 2020 financial and EV results
COVID-19 – Once bitten, twice shy.A pandemic’s impact on stress testing frameworks
Optimising the life insurance regulatory balance sheet
Artificial intelligence and machine learning
Using technology to combat insurance fraud
Proactively managing conduct risk
Understanding a more complete IFRS 17 picture
31
And finally, while still uncertain, the implications of IFRS 17 on determining and reporting of tax need to be considered
Next steps for an insurerMoving the focus of an IFRS 17 programmes from “the production of IFRS 17 financial reports” to “IFRS 17 enhanced Management Information (MI) for decision-making”, means that insurers will need to be more deliberate when it comes to ensuring that the impact of IFRS 17 across their business is appreciated and addressed.
We see 5 key steps for an insurer to prioritise in their IFRS 17 programmes:
1. Build an IFRS 4 Inventory Insurers need to obtain an inventory of where IFRS, in particular IFRS 4, is currently used in any business decision-making processes. This will provide a starting point for insurers to gain an appreciation of current applications, data sources, processes and relevant impacted stakeholders are. The IFRS 4 inventory would likely include elements such as:
Strategic planning • Pricing environment relationship to IFRS 4 outcomes
Performance measurement and management • KPIs targeting current IFRS earnings, insurance result/change in actuarial liability, etc
Risk management • Areas which drive volatility in their IFRS income statement and balance sheet.
• The relationship and reconciliation between the IFRS and SAM metrics.
Capital management • IFRS-driven capital allocation decisions
2. Identify supporting data and systems Insurers should prepare a current state view of the data and systems environments that support the use of the IFRS 4 metrics. These may be ledgers and/or sub- ledgers from which information is extracted, but also proxy or forecast models where estimated IFRS 4 metrics are projected or used in calculating a subsequent measure (for example performance triggers). This step also involves an understanding of the sequencing of data feeds and surrounding data governance.
3. Identify and engage with impacted stakeholders In addition to the systems and data view, the IFRS 17 programme will need to identify and engage with stakeholders who currently use IFRS 4 in their functions. They will need to understand how the information contained in the IFRS 4 metrics is used by the relevant stakeholders. This is key in ensuring that all relevant stakeholders are identified for the IFRS 17 change management programme and an equivalent IFRS 17 metric is identified that addresses the needs of those stakeholders. Both internal and external stakeholders should be considered.
4. Create IFRS 17 awareness and or education of IFRS metrics Key users of IFRS 4 information will need to educate stakeholders on the implications of IFRS 17 for their function. These sessions also need to explore the following aspects:
• How the IFRS 17 metrics are expected to behave relative to existing IFRS 4 and other metrics
• Areas where there is no suitable replacement for the IFRS 4 metric, and a parallel reporting capability will need to be retained, and
• Whether IFRS 17 provides new/additional information that the stakeholders can use to address their needs.
These aspects will need to be addressed in the IFRS 17 change management plan.
5. Build appropriate actions into the IFRS 17 Programme Insurers should then use the outcome of the above steps to design the future business and operating model, in order to address the requirements of all the users of IFRS 17 metrics in the core business functions/ capabilities, to ensure that: a) Systems and data; and b) People and processes are aligned with the changes in the overall financial reporting/record to report and modelling capabilities of the insurer.
SA INSUR ANCE OUTLOOK | UNDERSTANDING A MORE COMPLETE IFRS 17 PICTURE
Understanding a more complete IFRS 17 picture
IFRS 17: Controls and financial reporting under the new standard
VAT: Closing the compliance gap
Introduction
Overview of the 2020 financial and EV results
COVID-19 – Once bitten, twice shy.A pandemic’s impact on stress testing frameworks
Optimising the life insurance regulatory balance sheet
Artificial intelligence and machine learning
Using technology to combat insurance fraud
Proactively managing conduct risk
Understanding a more complete IFRS 17 picture

32
SA INSUR ANCE OUTLOOK | UNDERSTANDING A MORE COMPLETE IFRS 17 PICTURE
ConclusionIFRS 17 was always going to have a significant impact on the actuarial modelling and financial reporting functions in an insurer. The data, systems, processes and people implications are now much better understood, and most insurers are well underway to be ready to produce their first sets of IFRS 17 financial statements in 2023.
However, we believe that now is the time for the IFRS 17 programmes to look beyond external reporting and to the business operations of the insurer that rely on IFRS 4 metrics to make appropriate business decisions, and bring these elements of change required into their programme.
Lindy SchmamanAssociate Director, Financial Services Advisory. Deloitte [email protected]+27 (011) 209 8034
AuthorsAndrew WarrenDirector, Actuarial and Insurance Solutions, Insurance Sector Advisory Leader, Deloitte [email protected]+27 (011) 202 7423
Lloyd BalshawSenior Manager, Actuarial and Insurance Solutions, Deloitte [email protected]+27 (011) 304 5920 Understanding a more complete
IFRS 17 picture
IFRS 17: Controls and financial reporting under the new standard
VAT: Closing the compliance gap
Introduction
Overview of the 2020 financial and EV results
COVID-19 – Once bitten, twice shy.A pandemic’s impact on stress testing frameworks
Optimising the life insurance regulatory balance sheet
Artificial intelligence and machine learning
Using technology to combat insurance fraud
Proactively managing conduct risk
Understanding a more complete IFRS 17 picture
33
SA INSUR ANCE OUTLOOK | CONTROLS AND FINANCIAL REPORTING
Controls and financial reporting What audit committees should know as insurers implement the requirements of IFRS 17.
Following the outbreak of COVID-19, insurers experienced a significant transformation of their operations overnight. Just over a year ago the pandemic shocked the world, adding to the complexities already faced by insurers. Decisions had to be accelerated and digital distribution roll-out plans implemented. Business models changed – significantly impacting governance structures. All this while dealing with the implementation of IFRS 17. A complete overhaul of insurance accounting and related processes are expected ... changing the fundamentals of a control environment!
IFRS 17 represents a new era for insurers across the globe. It is the storm before the calm, facilitating the need for a strategic shift in business as usual. Uncertainty is at its peak – with the standard introducing further complexity such as increased data requirements, systems enhancements and builds, process reconfiguration and people alignment. These changes are altering the fundamentals of the control environment, widening the responsibilities for all those involved in the financial reporting ecosystem and requiring governance structures to re-evaluate their responsibilities. The audit committee being an integral part of the governance structure is no exception, with oversight and monitoring remaining the cornerstone of an effective governance structure.
Although IFRS 17 offers many challenges, it also presents insurers with an opportunity to redefine their financial reporting landscape for the better. If implemented correctly, it will yield benefits that will long outlast the price tag that comes with the implementation process. For the audit committee, it requires a rethink of what its oversight of the financial reporting processes at an insurer should look like. For those charged with governance, understanding the key risks inherent and the controls thereof should be a key focus for the implementation of this standard. Continuous engagement with all stakeholders throughout the process, particularly management, is a necessity.
Questions that an audit committee could ask to help it understand the IFRS 17 implementation include: What does the implementation plan look like? What are the key priorities? Have the key processes been mapped and who are the owners? Do the owners demonstrate that they have the appropriate skills and capabilities? Capacity and prioritisation? Because there is a need for greater collaboration between functions – what are the handover points between them? What are the changes required in the internal control environment? Are data considerations of sufficient quality, and granular enough? Is it adequate to facilitate IFRS 17 reporting? Is the current infrastructure adequate for financial reporting or does it require enhancement?
And what do all these considerations mean for the control environment and the overall business impact?
Looking at controls specifically, management should share with the audit committee how it is transitioning the control environment while IFRS 17 is implemented. This includes how controls are designed, implemented, and tested. The majority of the controls relating to significant judgements, inputs in the form of data and the CSM calculation engine will be new and require careful planning. In some instances, insurers have chosen to defer the implementation of IFRS 9 to align to the implementation of IFRS 17. Audit committees should therefore ask that management provides feedback at meetings that also specifically incorporate IFRS 9 judgements and the interplay of the financial instruments’ standard with IFRS 17. Understanding a more complete
IFRS 17 picture
VAT: Closing the compliance gap
Introduction
Overview of the 2020 financial and EV results
COVID-19 – Once bitten, twice shy.A pandemic’s impact on stress testing frameworks
Optimising the life insurance regulatory balance sheet
Artificial intelligence and machine learning
Using technology to combat insurance fraud
Proactively managing conduct risk
Understanding a more complete IFRS 17 picture
IFRS 17: Controls and financial reporting under the new standard

34
SA INSUR ANCE OUTLOOK | CONTROLS AND FINANCIAL REPORTING
Participation in industry forums and consultations with both internal and external auditors should as a minimum underpin the oversight process. This will assist audit committees to benchmark key technical decisions and implementation progress at their insurers with the wider insurance industry. Communication channels outside of committee meetings must be established to facilitate updates with the relevant stakeholders as and when necessitated. More is less when it comes to the implementation of IFRS 17.
To conclude, even though IFRS 17 asks audit committees to delve into a standard that is not simple, it does offer an opportunity to refresh an insurer’s financial control environment. As part of the IFRS 17 journey audit committees should ask for control environments that are well designed and documented by management, which in turn should allow for more reliable financial reporting. The key factor being that audit committees need to be involved with the design of controls during the IFRS 17 implementation programme, and not only at the end.
AuthorNomfundo MarivhaPartner, Audit and Assurance, Deloitte [email protected]+27 (011) 209 8657
Understanding a more complete IFRS 17 picture
VAT: Closing the compliance gap
Introduction
Overview of the 2020 financial and EV results
COVID-19 – Once bitten, twice shy.A pandemic’s impact on stress testing frameworks
Optimising the life insurance regulatory balance sheet
Artificial intelligence and machine learning
Using technology to combat insurance fraud
Proactively managing conduct risk
Understanding a more complete IFRS 17 picture
IFRS 17: Controls and financial reporting under the new standard
35
SA INSUR ANCE OUTLOOK | VALUE-ADDED TA X - CLOSING THE COMPLIANCE GAP
Value-Added Tax Closing the compliance gap
There has recently been renewed focus by the South African Revenue Service (SARS) on value-added tax (VAT) in an effort to close the tax revenue gap. It is important to ensure that transactions are treated correctly from a VAT perspective to avoid unnecessary disputes and potential assessments for VAT, penalties and interest.
We highlight below some key SARS focus areas as well as other topical areas in the insurance industry. We have also included a recent development regarding the voluntary disclosure process and the requirement that the disclosure is indeed voluntary.
No-claim bonusesIFRS 17, the latest accounting standard for insurance contracts, will replace IFRS 4 for financial years beginning on or after 1 January 2023. In summary, IFRS 17 establishes principles for the recognition, measurement, presentation and disclosure of insurance contracts.
In readying themselves for IFRS 17 short-term insurers that have no-claim bonus features built into their insurance contracts need to give consideration to the accounting for these features. There has been much debate in the industry on how the no-claim bonus features impact the contract boundary, and whether the liability for future bonuses payable forms part of the liability for remaining coverage, or incurred claims. From a VAT perspective,
the treatment of no-claim bonuses depends on the characteristics of the underlying supply, or the event that gives rise to the payment. The VAT treatment of a no-claim bonus could take the form of a retrospective discount (credit note event) with the resultant input tax adjustment or a reduction in future premiums where VAT will be accounted for at a reduced amount.
The accounting for no-claim bonuses under IFRS 17 and their VAT treatment may therefore appear different. The evaluation of the accounting for no-claim bonuses for purposes of IFRS 17 also offers an opportunity for insurers to review their current insurance contract wordings to ensure that the VAT treatment is consistent with the requirements of Value-Added Tax Guide for Short-Term Insurance published by SARS.
Management of superannuation schemesLong-term insurers would generally not levy VAT on the insurance premium payable by the insured. Currently, long-term insurers must account for VAT on the management of a superannuation scheme either on the consideration embedded in the insurance premium or the cost of making such supply, whichever is greater (section 10 (22A)). However, Binding General Ruling 34 (Issue 2) (BGR 34) allows the insurer, who does not charge a specific consideration for the management service, to use the cost of making the supply to determine the value of the
consideration on which VAT must be accounted. BGR 34 also provides the method for calculating such cost.
In terms of a proposed amendment, section 10(22A) will be deleted which means that BGR 34 will no longer be applicable. This will have the effect that, where there is no fee embedded in the premium charged by the long-term insurer, a portion of the premium will be subject to 15% VAT to the extent that it is attributable to the management service. Should a long-term insurer wish to embed a fee in the premium charged, such fee should be specified in the insurance contract. Where the fee is not specified, section 10(22) requires a vendor to attribute that portion of the consideration received (being a consolidated charge for more than one supply) to the making of taxable supplies as is properly attributable to it.
The deletion of section 10(22A) means that if there is a fee/commission embedded in the premium, the long-term insurer needs to make a reasonable apportionment of what part is subject to VAT and what part is exempt from VAT, now with reference to section 10(22) of the VAT Act (with affect from 1 April 2021). In view of the proposed amendment, long-term insurers should review their contracts and consider the manner in which the reasonable apportionment can be made.
Understanding a more complete IFRS 17 picture
Introduction
Overview of the 2020 financial and EV results
Introduction
COVID-19 – Once bitten, twice shy.A pandemic’s impact on stress testing frameworks
Optimising the life insurance regulatory balance sheet
Artificial intelligence and machine learning
Using technology to combat insurance fraud
Proactively managing conduct risk
Understanding a more complete IFRS 17 picture
IFRS 17: Controls and financial reporting under the new standard
VAT: Closing the compliance gap

36
SA INSUR ANCE OUTLOOK | VALUE-ADDED TA X - CLOSING THE COMPLIANCE GAP
Apportionment methodThe stated policy of SARS is not to make VAT apportionment rulings effective retrospectively to prior financial years. As a result, a vendor must apply in the current financial year should it wish to apply an alternative apportionment method.
During 2019, the Tax Court considered an application for a retrospective apportionment ruling (VAT Case 2063). The taxpayer apportioned the VAT on its expenses but did not have prior written approval for the apportionment method it applied. The taxpayer applied in its 2017 financial year to SARS for approval to apply an appropriate apportionment method retrospectively to 1 February 2014. SARS issued a binding private ruling to the taxpayer in which it approved the application of a transaction count-based method. The ruling was made effective from 1 March 2016, being the commencement of the financial year in which the taxpayer applied for the ruling and not 1 February 2014 as per the vendor’s request.
The Tax Court found in favour of SARS on the basis that the standard turnover-based method as set out in Binding General Ruling 16 was the only ratio applicable to the taxpayer. Proviso (iii) to section 17(1) of the VAT Act expressly precluded SARS from issuing a ruling that had effect prior to 1 March 2016.
This judgement is, however, being taken on appeal on the basis that there is an alternative interpretation of proviso (iii), that is, if read with sub-paragraph (aa), a ruling may not be applied for retrospectively beyond the start of that particular financial year, only in instances where the vendor already had an approved method.
Even short-term insurers need to consider the impact of non-taxable income in the form of investment income (e.g. interest and dividends) and foreign reinsurance claim receipts.
As the standard turnover-based method is rarely representative of the extent to which a vendor utilises its expenses in order to make taxable supplies, the failure to apply for a ruling application may result in a vendor having to apply an inappropriate apportionment method which is contrary to the principles for claiming input tax.
Voluntary disclosuresIn order for a voluntary disclosure application to be valid, the disclosure must be “voluntary”. In the Purveyors South Africa Mine Services (Pty) Ltd v CSARS (Purveyors case), the High Court found that an application cannot be “voluntary” if SARS has prior knowledge of the default. In this specific instance, Purveyors queried its liability to pay customs VAT with SARS via email and telephonic discussions, during which SARS confirmed that Purveyors is required to pay customs VAT and that the default is subject to penalties and interest. Although it is unclear at this stage whether the High Court judgement will be appealed, prior interactions with SARS (e.g. ruling application) must be carefully considered as these could negatively impact a later request for relief under the Voluntary Disclosure Programme.
AuthorSeverus SmutsDirector, Tax & Legal, Deloitte [email protected]+27 (011) 806 5334
Understanding a more complete IFRS 17 picture
Introduction
Overview of the 2020 financial and EV results
Introduction
COVID-19 – Once bitten, twice shy.A pandemic’s impact on stress testing frameworks
Optimising the life insurance regulatory balance sheet
Artificial intelligence and machine learning
Using technology to combat insurance fraud
Proactively managing conduct risk
Understanding a more complete IFRS 17 picture
IFRS 17: Controls and financial reporting under the new standard
VAT: Closing the compliance gap

37
Deloitte refers to one or more of Deloitte Touche Tohmatsu Limited (“DTTL”), its global network of member firms, and their related entities (collectively, the “Deloitte organization”). DTTL (also referred to as “Deloitte Global”) and each of its member firms and related entities are legally separate and independent entities, which cannot obligate or bind each other in respect of third parties. DTTL and each DTTL member firm and related entity is liable only for its own acts and omissions, and not those of each other. DTTL does not provide services to clients. Please see www.deloitte.com/about to learn more.
Deloitte is a leading global provider of audit and assurance, consulting, financial advisory, risk advisory, tax and related services. Our global network of member firms and related entities in more than 150 countries and territories (collectively, the “Deloitte organization”) serves four out of five Fortune Global 500® companies. Learn how Deloitte’s approximately 330,000 people make an impact that matters at www.deloitte.com.
This communication contains general information only, and none of Deloitte Touche Tohmatsu Limited (“DTTL”), its global network of member firms or their related entities (collectively, the “Deloitte organization”) is, by means of this communication, rendering professional advice or services. Before making any decision or taking any action that may affect your finances or your business, you should consult a qualified professional adviser.
No representations, warranties or undertakings (express or implied) are given as to the accuracy or completeness of the information in this communication, and none of DTTL, its member firms, related entities, employees or agents shall be liable or responsible for any loss or damage whatsoever arising directly or indirectly in connection with any person relying on this communication. DTTL and each of its member firms, and their related entities, are legally separate and independent entities.
© 2021. For information, contact Deloitte Touche Tohmatsu Limited. Designed and produced by Creative Solutions at Deloitte, Johannesburg. (000000/ant)