Investigation of pressure-induced magnetic transitions in Co xFe3-xO4 spinels
9
PHYSICAL REVIEW B 87, 094408 (2013) Investigation of pressure-induced magnetic transitions in Co x Fe 3−x O 4 spinels G. Sub´ ıas, 1,* V. Cuartero, 2 J. Garc´ ıa, 1 J. Blasco, 1 S. Lafuerza, 1 S. Pascarelli, 3 O. Mathon, 3 C. Strohm, 3 K. Nagai, 4 M. Mito, 4 and G. Garbarino 3 1 ICMA-Instituto de Ciencia de Materiales de Arag´ on, Departamento de F´ ısica de la Materia Condensada, Universidad de Zaragoza-CSIC, 50009-Zaragoza, Spain 2 ALBA Synchrotron/CELLS, Cerdanyola del Vall` es, 08290, Spain 3 European Synchrotron Radiation Facility, BP 220, 38043 Grenoble Cedex, France 4 Faculty of Engineering, Kyushu Institute of Technology, Kitakyushu, Fukuoka 804-8550, Japan (Received 4 November 2012; published 7 March 2013) Room temperature Fe and Co K-edge x-ray magnetic circular dichroism, synchrotron x-ray powder diffraction, and magnetization measurements were carried out to investigate the stability of the ferrimagnetic ground state in Co x Fe 3−x O 4 (x = 0, 1, 1.5, and 2) ferrites under pressure up to about 30 GPa using diamond anvil cells. The x-ray magnetic circular dichroism at the Fe K-edge is observed to decrease continuously up to the highest reached pressure by ∼50% in Fe 3 O 4 (at 25 GPa) and by ∼70% in Co 1.5 Fe 1.5 O 4 (at 16 GPa) and Co 2 FeO 4 (at 21 GPa). In CoFe 2 O 4 , the suppression by ∼80% of the x-ray magnetic circular dichroic signal occurs simultaneously at both Fe and Co K-edges between 24 and 27 GPa. However, a continuous decrease of the dichroic signal with pressure is only observed at the Co K-edge, whereas the Fe K-edge dichroic intensity drops drastically. The synchrotron x-ray powder diffraction measurements indicate the occurrence of structural phase transitions at critical pressures in coincidence with the suppression of ferrimagnetism. In CoFe 2 O 4, bulk magnetization measurements up to 26 GPa confirm the disappearance of ferrimagnetism and indicate an almost linear dependence of the magnetization with the magnetic field in the high pressure phase. We thus conclude that high-pressure CoFe 2 O 4 is either paramagnetic or antiferromagnetic. DOI: 10.1103/PhysRevB.87.094408 PACS number(s): 62.50.−p, 75.47.Lx I. INTRODUCTION In magnetic materials with strong electron correlations such as transition-metal oxides, lattice compression strongly affects transport, structural, and magnetic properties, often leading to a high-pressure-induced insulator-to-metal transition ac- companied by the loss of its ferromagnetic long-range order and by a structural phase transition. Such transformations have been experimentally observed in various transition metal compounds, 1 but the mechanisms of these transitions are still ambiguous in many respects especially in the relation to the local, atomic scale electronic and magnetic modifications at the high-pressure phase. Spinel ferrites with AB 2 O 4 formula are transition-metal ternary oxides that have a wide range of applications because of their ferrimagnetic and electrical properties 2 that are governed by the choice of the cations along with Fe 3+ -Fe 2+ ions and their distribution between the tetrahedral A and octahedral B sites. Particularly, magnetite is, at ambient conditions, a ferrimagnetic cubic inverse spinel where the tetrahedral A and octahedral B sites are occupied by nominally Fe 3+ and mixed- valent Fe 2.5+ configurations, respectively. 3 Its high-pressure behavior has been extensively studied by x-ray diffraction (XRD), 4–7 M¨ ossbauer spectroscopy, 8,9 and electrical resistiv- ity measurements. 9,10 Above 25 GPa, magnetite undergoes a sluggish structural transformation to a high-pressure phase 4–7 as reflections of the low-pressure spinel phase could be traced up to at least 60 GPa. Powder XRD experiments of this high-pressure structure were indexed in the orthorhombic unit cell (CaMn 2 O 4 -type structure, space group Pbcm) by Fei et al. (Ref. 5) but also in a more symmetric CaTi 2 O 4 -type structure (space group Bbmm), as proposed by Haavick et al. (Ref. 6) and recently confirmed by Dubrovinsky et al. (Ref. 7). This high-pressure structure does not order magnetically at 300 K 7 and shows a semiconductorlike behavior. 9,10 Fe K-edge x-ray magnetic circular dichroism (XMCD) measurements 11–13 have been reported to give a comprehensive view of the magnetic behavior of magnetite with pressure. A pressure-induced magnetic transition shown by a sharp decrease (∼50%) in the amplitude of the XMCD signal was reported between 12 and 16 GPa by Ding et al. (Ref. 11). This abrupt change was interpreted as a high-spin to intermediate-spin transition of Fe 2+ ions in octahedral sites. However, two more recent XMCD experiments 12,13 challenge this abrupt high-spin to intermediate-spin transition. They observed a monotonous decrease of the magnetic moment with pressure of about 50% from ambient to 25 GPa in Ref. 12 and of about 60% from ambient to 41 GPa in Ref. 13, respectively. These works agree with the sluggish nature of the phase transformation because Pasternak et al. 8 estimated that only about 60% of magnetite transforms into the high-pressure polymorph on compression to 66 GPa at ambient temperature, and thus, the ferrimagnetic order is still not lost. Moreover, it reverts to the original magnetite phase by decompression following a hysteresis. 8 Furthermore, Baudelet et al. 13 plaid for a band-structure description, where the total loss of the ferrimagnetism is associated with the onset of full metallic behavior. The purpose of the present study is to give tracks on the mechanism for the pressure-induced magnetic transition reported in magnetite. The loss of ferromagnetism with pressure can be accounted for either by the formation of a zero net moment magnetic phase (paramagnetic or antiferromagnetic) or by the so-called magnetic collapse into a nonmagnetic metallic state. The former case is related 094408-1 1098-0121/2013/87(9)/094408(9) ©2013 American Physical Society
Transcript of Investigation of pressure-induced magnetic transitions in Co xFe3-xO4 spinels

PHYSICAL REVIEW B 87, 094408 (2013)
Investigation of pressure-induced magnetic transitions in CoxFe3−xO4 spinels
G. Subıas,1,* V. Cuartero,2 J. Garcıa,1 J. Blasco,1 S. Lafuerza,1 S. Pascarelli,3 O. Mathon,3 C. Strohm,3
K. Nagai,4 M. Mito,4 and G. Garbarino3
1ICMA-Instituto de Ciencia de Materiales de Aragon, Departamento de Fısica de la Materia Condensada,Universidad de Zaragoza-CSIC, 50009-Zaragoza, Spain
2ALBA Synchrotron/CELLS, Cerdanyola del Valles, 08290, Spain3European Synchrotron Radiation Facility, BP 220, 38043 Grenoble Cedex, France
4Faculty of Engineering, Kyushu Institute of Technology, Kitakyushu, Fukuoka 804-8550, Japan(Received 4 November 2012; published 7 March 2013)
Room temperature Fe and Co K-edge x-ray magnetic circular dichroism, synchrotron x-ray powder diffraction,and magnetization measurements were carried out to investigate the stability of the ferrimagnetic ground statein CoxFe3−xO4 (x = 0, 1, 1.5, and 2) ferrites under pressure up to about 30 GPa using diamond anvil cells. Thex-ray magnetic circular dichroism at the Fe K-edge is observed to decrease continuously up to the highest reachedpressure by ∼50% in Fe3O4 (at 25 GPa) and by ∼70% in Co1.5Fe1.5O4 (at 16 GPa) and Co2FeO4 (at 21 GPa). InCoFe2O4, the suppression by ∼80% of the x-ray magnetic circular dichroic signal occurs simultaneously at bothFe and Co K-edges between 24 and 27 GPa. However, a continuous decrease of the dichroic signal with pressureis only observed at the Co K-edge, whereas the Fe K-edge dichroic intensity drops drastically. The synchrotronx-ray powder diffraction measurements indicate the occurrence of structural phase transitions at critical pressuresin coincidence with the suppression of ferrimagnetism. In CoFe2O4, bulk magnetization measurements up to 26GPa confirm the disappearance of ferrimagnetism and indicate an almost linear dependence of the magnetizationwith the magnetic field in the high pressure phase. We thus conclude that high-pressure CoFe2O4 is eitherparamagnetic or antiferromagnetic.
DOI: 10.1103/PhysRevB.87.094408 PACS number(s): 62.50.−p, 75.47.Lx
I. INTRODUCTION
In magnetic materials with strong electron correlations suchas transition-metal oxides, lattice compression strongly affectstransport, structural, and magnetic properties, often leadingto a high-pressure-induced insulator-to-metal transition ac-companied by the loss of its ferromagnetic long-range orderand by a structural phase transition. Such transformationshave been experimentally observed in various transition metalcompounds,1 but the mechanisms of these transitions are stillambiguous in many respects especially in the relation to thelocal, atomic scale electronic and magnetic modifications atthe high-pressure phase.
Spinel ferrites with AB2O4 formula are transition-metalternary oxides that have a wide range of applications because oftheir ferrimagnetic and electrical properties2 that are governedby the choice of the cations along with Fe3+-Fe2+ ions andtheir distribution between the tetrahedral A and octahedralB sites. Particularly, magnetite is, at ambient conditions, aferrimagnetic cubic inverse spinel where the tetrahedral A andoctahedral B sites are occupied by nominally Fe3+ and mixed-valent Fe2.5+ configurations, respectively.3 Its high-pressurebehavior has been extensively studied by x-ray diffraction(XRD),4–7 Mossbauer spectroscopy,8,9 and electrical resistiv-ity measurements.9,10 Above 25 GPa, magnetite undergoes asluggish structural transformation to a high-pressure phase4–7
as reflections of the low-pressure spinel phase could be tracedup to at least 60 GPa. Powder XRD experiments of thishigh-pressure structure were indexed in the orthorhombic unitcell (CaMn2O4-type structure, space group Pbcm) by Fei et al.(Ref. 5) but also in a more symmetric CaTi2O4-type structure(space group Bbmm), as proposed by Haavick et al. (Ref. 6)
and recently confirmed by Dubrovinsky et al. (Ref. 7). Thishigh-pressure structure does not order magnetically at 300 K7
and shows a semiconductorlike behavior.9,10 Fe K-edge x-raymagnetic circular dichroism (XMCD) measurements11–13 havebeen reported to give a comprehensive view of the magneticbehavior of magnetite with pressure. A pressure-inducedmagnetic transition shown by a sharp decrease (∼50%) inthe amplitude of the XMCD signal was reported between 12and 16 GPa by Ding et al. (Ref. 11). This abrupt changewas interpreted as a high-spin to intermediate-spin transitionof Fe2+ ions in octahedral sites. However, two more recentXMCD experiments12,13 challenge this abrupt high-spin tointermediate-spin transition. They observed a monotonousdecrease of the magnetic moment with pressure of about 50%from ambient to 25 GPa in Ref. 12 and of about 60% fromambient to 41 GPa in Ref. 13, respectively. These works agreewith the sluggish nature of the phase transformation becausePasternak et al.8 estimated that only about 60% of magnetitetransforms into the high-pressure polymorph on compressionto 66 GPa at ambient temperature, and thus, the ferrimagneticorder is still not lost. Moreover, it reverts to the originalmagnetite phase by decompression following a hysteresis.8
Furthermore, Baudelet et al.13 plaid for a band-structuredescription, where the total loss of the ferrimagnetism isassociated with the onset of full metallic behavior.
The purpose of the present study is to give tracks onthe mechanism for the pressure-induced magnetic transitionreported in magnetite. The loss of ferromagnetism withpressure can be accounted for either by the formationof a zero net moment magnetic phase (paramagnetic orantiferromagnetic) or by the so-called magnetic collapseinto a nonmagnetic metallic state. The former case is related
094408-11098-0121/2013/87(9)/094408(9) ©2013 American Physical Society

G. SUBIAS et al. PHYSICAL REVIEW B 87, 094408 (2013)
to shifts of the magnetic-order temperature with pressure,whereas the latter transition is due to the 3d band wideningwith increasing pressure, which decreases the density of statesat the Fermi level below the stability limit for ferromagnetismgiven by the Stoner criterion.14 The delocalization of the 3delectrons results in metallization concurrently with the loss ofthe local magnetic moments. Low-temperature high-pressureXMCD measurements might resolve between these twopoints. However, the experiment may not be trivial.
Therefore, we have studied the stability of ferrimagnetismin the related cobalt-iron oxides CoxFe3−xO4 (x = 1, 1.5, and2) in comparison with magnetite. In particular, CoFe2O4 hasthe same inverse-spinel structure as magnetite, with divalentCo ions occupying predominantly the octahedral sites,15 andTN ∼ 790 K, only a bit lower than that of magnetite (∼850 K).The degree of cation disordering over the tetrahedral andoctahedral sites can be described using an inversion parameter(i) and the formula (M3+
iM2+1−i)A(M2+
iM3+2−i)BO4, where
i = 0 for a normal (ordered) spinel and i = 1 for an inverse(antiordered) spinel. Figure 1 shows the site occupancy ofFe and Co atoms for the cobalt-iron ferrites derived fromtheir Fe K-edge XMCD spectra16 and takes into account thatthe addition of Co to CoFe2O4 (i = 1 antiordered) makesthe cation distribution more normal so that Co3+ enters intooctahedral B sites and Co2+ moves from B sites to A sites.17
This results in two intermediate cases of partially inverse
FIG. 1. (Color online) Spinel structure of CoxFe3−xO4 (x = 1,1.5, and 2) ferrites showing the location of constituents, namely Fe3+
and Con+/Fe3+ at the tetrahedral A (green balls) and octahedral B(blue balls) sites. Oxygen atoms are represented by yellow balls.
spinels: the almost fully disordered Co1.5Fe1.5O4 with i = 0.7and the partially ordered CoFe2O4 with i = 0.4.
In this paper, we report combined room temperature XMCDmeasurements at the Fe and Co K-edges, magnetization,and synchrotron XRD studies up to ∼30 GPa. We findthat all the samples show diminished ferrimagnetism withpressure, the pressure-induced magnetic suppression takingplace in the same range of pressures as the structural phasetransitions. Based on our experiments measuring for the firsttime the magnetic field (H ) dependence of bulk magnetizationunder high pressure, in the particular case of CoFe2O4, wediscard unambiguously the magnetic collapse as the principalmechanism for ferrimagnetism suppression in this inversespinel ferrite. In fact, it is found that high-pressure CoFe2O4
is either a paramagnet or an antiferromagnet.
II. EXPERIMENTAL
Polycrystalline samples of CoFe2O4, Co1.5Fe1.5O4, andCo2FeO4 were synthesized from solid state methods. Stoichio-metric amounts of Co3O4 and Fe2O3 were first mixed and firedat 900 ◦C overnight. The obtained powders were ground againand pressed into pellets. The sintering process was adaptedto the chemical composition of the sample. CoFe2O4 wasthen sintered at 1100 ◦C for 48 h in air and cooled down toroom temperature. Co1.5Fe1.5O4 and Co2FeO4 were sinteredat 1100 ◦C in the same conditions, but they were slowlycooled (1 ◦C/min) down to 925 ◦C and quenched into air toprevent a decomposition into two spinel phases.18 The sampleswere characterized by x-ray powder diffraction and magneticmeasurements ensuring the correct oxygen stoichiometry. Allsamples were single phase (cubic spinel) at room temperature.Powdered crystals of magnetite were obtained from crushinga piece of a high-quality single-crystal grown by the floatingzone method.19
High-pressure room temperature XANES and XMCDmeasurements were carried out on the energy dispersive ID24beam line20 at the European Synchrotron Radiation Facility(ESRF) in Grenoble, France. The powder samples, mixed withsilicone oil as a pressure-transmitting medium, were loadedinto a nonmagnetic CuBe diamond anvil cell (DAC) equippedwith a pair of 1.2-mm-thick diamond anvils. Ruby chips wereused as pressure markers, and the magnetic field was ∼7 kOe.Circular polarization was attained using a diamond quarterwave plate. Two sets of measurements at each pressure withboth polarization helicities and both magnetic field directionswere taken in order to eliminate systematic errors arising fromthe positioning of the quarter wave plate for the two helicitiesand changing the direction of the magnetic field.
Synchrotron XRD experiments under pressure using a DACwere separately carried out at room temperature in angle-dispersive mode with wavelength of 0.3738 A at the ID27beam line21 at ESRF. Helium was used as the pressure medium.Diffraction images were recorded on a fast, large-area scanningMAR 165 CCD detector. The image data were integrated usingthe FIT2D software package,22 and the resulting diffractionpatterns were analyzed with the Fullprof package program.23
The magnetic field dependence of magnetization in thepressure range up to 26 GPa at room temperature was measuredby using both a superconducting quantum interference device
094408-2
INVESTIGATION OF PRESSURE-INDUCED MAGNETIC . . . PHYSICAL REVIEW B 87, 094408 (2013)
(SQUID) magnetometer and a miniature diamond anvil cell(mDAC) made of nonmagnetic hardened CuBe. This mDACis shown in detail in Ref. 24. We have used diamond anvilswith the culet size of 0.5 mm and a nonmagnetic CuBe orRe gasket with the thickness of 0.2 mm. Furthermore, cobaltfoils as a dummy material were located near the gasket (noton the gasket). As for the pressure-transmitting medium, weused Apiezon-J oil, and the ruby fluorescence technique hasbeen used for pressure calibration.
III. RESULTS AND DISCUSSION
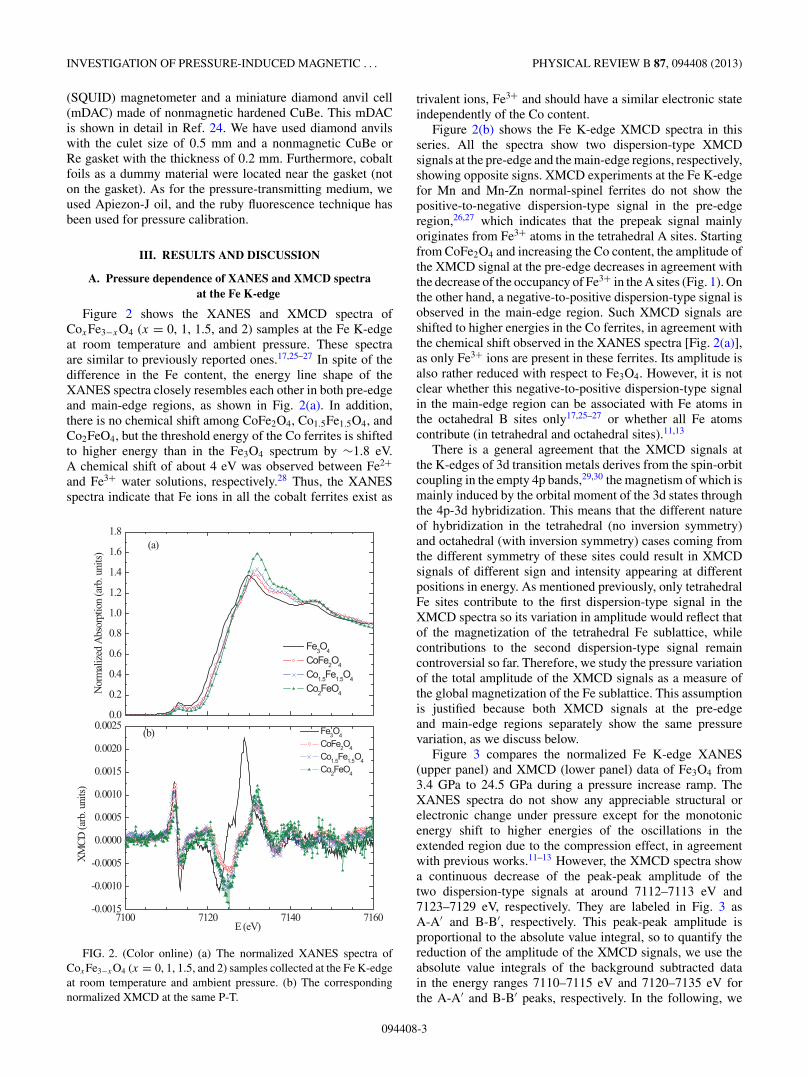
A. Pressure dependence of XANES and XMCD spectraat the Fe K-edge
Figure 2 shows the XANES and XMCD spectra ofCoxFe3−xO4 (x = 0, 1, 1.5, and 2) samples at the Fe K-edgeat room temperature and ambient pressure. These spectraare similar to previously reported ones.17,25–27 In spite of thedifference in the Fe content, the energy line shape of theXANES spectra closely resembles each other in both pre-edgeand main-edge regions, as shown in Fig. 2(a). In addition,there is no chemical shift among CoFe2O4, Co1.5Fe1.5O4, andCo2FeO4, but the threshold energy of the Co ferrites is shiftedto higher energy than in the Fe3O4 spectrum by ∼1.8 eV.A chemical shift of about 4 eV was observed between Fe2+and Fe3+ water solutions, respectively.28 Thus, the XANESspectra indicate that Fe ions in all the cobalt ferrites exist as
7100 7120 7140 7160-0.0015
-0.0010
-0.0005
0.0000
0.0005
0.0010
0.0015
0.0020
0.0025(b)
XM
CD (a
rb. u
nits)
E (eV)
Fe3O4
CoFe2O4
Co1.5Fe1.5O4
Co2FeO4
0.0
0.2
0.4
0.6
0.8
1.0
1.2
1.4
1.6
1.8
Fe3O4
CoFe2O4
Co1.5Fe1.5O4
Co2FeO4Norm
alize
d Ab
sorp
tion
(arb
. uni
ts)
(a)
FIG. 2. (Color online) (a) The normalized XANES spectra ofCoxFe3−xO4 (x = 0, 1, 1.5, and 2) samples collected at the Fe K-edgeat room temperature and ambient pressure. (b) The correspondingnormalized XMCD at the same P-T.
trivalent ions, Fe3+ and should have a similar electronic stateindependently of the Co content.
Figure 2(b) shows the Fe K-edge XMCD spectra in thisseries. All the spectra show two dispersion-type XMCDsignals at the pre-edge and the main-edge regions, respectively,showing opposite signs. XMCD experiments at the Fe K-edgefor Mn and Mn-Zn normal-spinel ferrites do not show thepositive-to-negative dispersion-type signal in the pre-edgeregion,26,27 which indicates that the prepeak signal mainlyoriginates from Fe3+ atoms in the tetrahedral A sites. Startingfrom CoFe2O4 and increasing the Co content, the amplitude ofthe XMCD signal at the pre-edge decreases in agreement withthe decrease of the occupancy of Fe3+ in the A sites (Fig. 1). Onthe other hand, a negative-to-positive dispersion-type signal isobserved in the main-edge region. Such XMCD signals areshifted to higher energies in the Co ferrites, in agreement withthe chemical shift observed in the XANES spectra [Fig. 2(a)],as only Fe3+ ions are present in these ferrites. Its amplitude isalso rather reduced with respect to Fe3O4. However, it is notclear whether this negative-to-positive dispersion-type signalin the main-edge region can be associated with Fe atoms inthe octahedral B sites only17,25–27 or whether all Fe atomscontribute (in tetrahedral and octahedral sites).11,13
There is a general agreement that the XMCD signals atthe K-edges of 3d transition metals derives from the spin-orbitcoupling in the empty 4p bands,29,30 the magnetism of which ismainly induced by the orbital moment of the 3d states throughthe 4p-3d hybridization. This means that the different natureof hybridization in the tetrahedral (no inversion symmetry)and octahedral (with inversion symmetry) cases coming fromthe different symmetry of these sites could result in XMCDsignals of different sign and intensity appearing at differentpositions in energy. As mentioned previously, only tetrahedralFe sites contribute to the first dispersion-type signal in theXMCD spectra so its variation in amplitude would reflect thatof the magnetization of the tetrahedral Fe sublattice, whilecontributions to the second dispersion-type signal remaincontroversial so far. Therefore, we study the pressure variationof the total amplitude of the XMCD signals as a measure ofthe global magnetization of the Fe sublattice. This assumptionis justified because both XMCD signals at the pre-edgeand main-edge regions separately show the same pressurevariation, as we discuss below.
Figure 3 compares the normalized Fe K-edge XANES(upper panel) and XMCD (lower panel) data of Fe3O4 from3.4 GPa to 24.5 GPa during a pressure increase ramp. TheXANES spectra do not show any appreciable structural orelectronic change under pressure except for the monotonicenergy shift to higher energies of the oscillations in theextended region due to the compression effect, in agreementwith previous works.11–13 However, the XMCD spectra showa continuous decrease of the peak-peak amplitude of thetwo dispersion-type signals at around 7112–7113 eV and7123–7129 eV, respectively. They are labeled in Fig. 3 asA-A′ and B-B′, respectively. This peak-peak amplitude isproportional to the absolute value integral, so to quantify thereduction of the amplitude of the XMCD signals, we use theabsolute value integrals of the background subtracted datain the energy ranges 7110–7115 eV and 7120–7135 eV forthe A-A′ and B-B′ peaks, respectively. In the following, we
094408-3

G. SUBIAS et al. PHYSICAL REVIEW B 87, 094408 (2013)
7105 7110 7115 7120 7125 7130 7135 7140 7145-0.0015
-0.0010
-0.0005
0.0000
0.0005
0.0010
0.0015
0.0020
0.0025
0.0030
B'
A
B
Norm
alize
d XM
CD (a
rb. u
nits)
Energy (eV)
3.4 GPa 6.4 GPa 9.8 GPa 13.6 GPa 18.5 GPa 22.6 GPa 24.5 GPa
A'
7110 7120 7130 7140 7150 7160 7170 7180 7190 72000.0
0.2
0.4
0.6
0.8
1.0
1.2
1.4
1.6B'
3.4 GPa 6.4 GPa 9.8 GPa 13.6 GPa 18.5 GPa 22.6 GPa 24.5 GPa
Norm
alize
d A
bsor
ptio
n (a
rb. u
nits)
Energy (eV)
A-A'
B
FIG. 3. (Color online) XANES (upper panel) and XMCD (lowerpanel) spectra at the Fe K-edge of Fe3O4 as a function of pressurefrom 3.4 GPa to 24.5 GPa.
call “amplitude” the absolute value integral for simplicity. InFig. 4, we plot the evolution of the amplitudes of the twoXMCD double peaks as a function of pressure. Below P ∼15 GPa, the amplitudes are almost constant, and then theystart decreasing continuously, showing roughly equal 50%reduction at 25 GPa. This evolution is compatible with the datashown in Ref. 13 and agrees with the high-pressure structuraland magnetic modification of magnetite.7,9 Upon pressurerelease, the XMCD signal recovers to its corresponding valueat ambient pressure (Fig. 4). This indicates a continuousdecrease of the global magnetization of Fe3O4 with increasingpressure even before the structural transformation occursat 25 GPa.
The pressure dependence of the normalized Fe K-edgeXMCD (left panel) and XANES (right panel) data of CoFe2O4,Co1.5Fe1.5O4, and Co2FeO4 are shown in Figures 5, 6, and 7,respectively. For CoFe2O4, as seen in Fig. 5, the Fe K-edgeXMCD spectrum shows no remarkable variation in the rangeof pressure from ambient pressure to 23 GPa. When the appliedpressure is increased above this pressure, the XMCD amplitudestrongly diminishes, and it is almost disappeared at 27 GPa.The XANES data show clearly that the local structure aroundFe is also modified above 23 GPa: the prepeak at 7113 eVbecomes less intense and the features at the main-edge regionof energies become less resolved. Therefore, the magnetictransition is accompanied by a structural transition. On the
0 5 10 15 20 25 300.00
0.02
0.04
0.06
0.08
0.10
0.12Peak B-B'Peak A-A'
Abs
olut
e valu
e int
egra
l of X
MCD
(arb
. uni
ts)
Pressure (GPa)
FIG. 4. (Color online) The evolution of the absolute value integralof the XMCD peaks A-A′ (red circles) and B-B′ (black squares) at theFe K-edge of Fe3O4 during a cycle of compression (closed symbols)and decompression (open symbols). Error bars indicate the standarddeviation, and the line is a guide for the eyes.
other hand, during the decompression process, both the FeK-edge XMCD and the XANES spectra do not recover downto 3 GPa. In contrast, as seen in Figs. 6 and 7, the Fe K-edgeXMCD spectrum of Co1.5Fe1.5O4 and Co2FeO4, respectively,shows a continuous decrease of its overall amplitude withincreasing pressure, and the simultaneous-obtained XANESspectra show poor variation. When the pressure is released,the XMCD spectra recover intensity.
The pressure dependence of the total absolute integral ofthe background subtracted XMCD signals correspondent tothe energy ranges 7110–7115 eV plus 7121–7135 eV forCoFe2O4, Co1.5Fe1.5O4, and Co2FeO4 are compared in Fig. 8.For CoFe2O4, this amplitude shows a constant value withinthe error up to 24 GPa followed by a drastic drop at 27 GPaof about 80% of its value at ambient pressure. A broadpressure hysteresis in this magnetic transition is demonstrated
7110 7120 7130 7140-0.0015
-0.0010
-0.0005
0.0000
0.0005
0.0010
0.0015
7110 7120 7130 7140 7150
0.0
0.2
0.4
0.6
0.8
1.0
1.2
1.4
1.6
1.8
Norm
alize
d XM
CD (a
rb. u
nits
)
Energy (eV)
3.6 GPa 13.8 GPa 23.5 GPa 27 GPa 3 GPa (P. released)
Norm
alize
d Ab
sorp
tion
(arb
. uni
ts)
Energy (eV)
3.6 GPa 13.8 GPa 19.4 GPa 27 GPa 3 GPa (P. released)
FIG. 5. (Color online) Pressure variation of Fe K-edge XMCDspectra (left panel) and some examples of XANES spectra (rightpanel) of CoFe2O4. Solid lines indicate data for increasing pressure,and the spectrum after the decompressing process is marked by line+ dots.
094408-4

INVESTIGATION OF PRESSURE-INDUCED MAGNETIC . . . PHYSICAL REVIEW B 87, 094408 (2013)
7110 7120 7130 7140-0.0015
-0.0010
-0.0005
0.0000
0.0005
0.0010
0.0015
7110 7120 7130 7140 7150
0.0
0.2
0.4
0.6
0.8
1.0
1.2
1.4
1.6
1.8
Nor
mali
zed
XM
CD (a
rb. u
nits)
Energy (eV)
3.2 GPa 9 GPa 12 GPa 16 GPa 1 GPa (P. released)
Norm
alize
d Ab
sorp
tion
(arb
. uni
ts)
Energy (eV)
3.2 GPa 9 GPa 12 GPa 16 GPa 1 GPa (P. released)
FIG. 6. (Color online) Pressure variation of Fe K-edge XMCD(left panel) and some examples of XANES (right panel) spectra ofCo1.5Fe1.5O4. Solid lines indicate data for increasing pressure, andthe spectrum after the decompressing process is marked by line +dots.
by compression and decompression processes. In this case,the amplitude of XMCD is stabilized with a low intensityalmost to the final state at ambient pressure, so the completesuppression of the Fe-sublattice global magnetization is notreached. Moreover, the onset of the XMCD signal decayis observed in correspondence to changes in the XANESspectra, suggesting that a structural transition plays a drivingrole in the magnetic one. In contrast, a continuous lineardecrease of the XMCD amplitude up to the maximum pressuremeasured is observed for Co1.5Fe1.5O4 and Co2FeO4 withoutany remarkable hysteresis in the increasing and decreasingpressure data. It is reduced by 70% of the value at ambientpressure for Co1.5Fe1.5O4 at 16 GPa and for Co2FeO4 at21 GPa. Consequently, it is expected that it will vanishfor these two samples at sufficiently high pressure. The
7110 7120 7130 7140-0.0015
-0.0010
-0.0005
0.0000
0.0005
0.0010
0.0015
7110 7120 7130 7140 7150
0.0
0.2
0.4
0.6
0.8
1.0
1.2
1.4
1.6
1.8
Norm
alize
d XM
CD (a
rb. u
nits)
Energy (eV)
2 GPa 10 GPa 12 GPa 17 GPa 21 GPa 7 GPa (P. released)
Norm
alize
d Ab
sorp
tion
(arb
. uni
ts)
Energy (eV)
2 GPa 12 GPa 17 GPa 21 GPa 7 GPa (P. released)
FIG. 7. (Color online) Pressure variation of Fe K-edge XMCD(left panel) and some examples of XANES (right panel) spectra ofCo2FeO4. Solid lines indicate data for increasing pressure, and thespectrum after the decompressing process is marked by line + dots.
0 5 10 15 20 25 300.00
0.02
0.04
0.06
0.08 CoFe2O4
Co1.5Fe1.5O4
Co2FeO4
Tota
l abs
olut
e va
lue
inte
gral
of X
MCD
(arb
. uni
ts)
Pressure (GPa)
FIG. 8. (Color online) Pressure dependence of the total absolutevalue integral of the XMCD signal for CoxFe3−xO4 (x = 1, 1.5, and2) samples at the Fe K-edge during a cycle of compression (closedsymbols) and decompression (open symbols). Error bars indicate thestandard deviation. The red and blue solid lines represent a linear fit ofthe XMCD data increasing pressure for Co1.5Fe1.5O4 and Co2FeO4,respectively.
extrapolation of a linear fit of the XMCD data to higherpressures predicts that Fe-sublattice global magnetizationwill be lost at about 22 GPa and 29 GPa for Co1.5Fe1.5O4
and Co2FeO4, respectively, as shown in Fig. 8. When thepressure is released, the value of the XMCD amplitude forCo1.5Fe1.5O4 at ambient pressure is lower than the initialstate one, whereas the transition is regarded as completelyreversible in Co2FeO4. These results reveal major differencesin the pressure evolution of Fe-sublattice global magnetizationof CoFe2O4 with respect to Co1.5Fe1.5O4 and Co2FeO4. Inthe former, this global magnetization is almost not affectedby compression until its drastic decrease at the structuraltransformation, similarly to pure Fe (Ref. 31) and FeCoalloys.32 In the latter ones, compression has an immediateeffect on this global magnetization, causing a continuousstrong linear decay and resembling more the behavior of pureCo (Ref. 33).
We now discuss the different behavior of the loss of theFe-sublattice global magnetization with pressure based on thestructural differences at ambient pressure. In the CoFe2O4
inverse spinel, the magnetization of the A-site and B-siteFe-sublattices align collinear antiparallel because the ABantiferromagnetic exchange interaction (JAB) is the predom-inant magnetic interaction. Creating an imbalance betweensublattice magnetizations, as for example, substituting Co2+for A-site Fe3+ cations in the Co-rich (x > 1) ferrites (Fig. 1),the strength of JAB is reduced and then a canting of the A-siteand/or B-site magnetizations can occur, resulting in a moreunstable ferrimagnetism when applying pressure. This factcould explain the different pressure evolution shown by the FeXMCD signal between CoFe2O4 and Co1+xFe2−xO4 (x = 0.5and 1) ferrites, which are partially inverse spinels. Moreover,the fully disordered Co1.5Fe1.5O4 spinel (i = 0.7) shows theloss of the Fe-sublattice magnetization at the lowest pressure.
094408-5

G. SUBIAS et al. PHYSICAL REVIEW B 87, 094408 (2013)
7710 7720 7730 7740-0.002
0.000
0.002
0.004
0.006
0.008
0.010
7700 7710 7720 7730 7740 77500.0
0.5
1.0
1.5
2.0
Nor
mal
ized
XM
CD
(arb
. uni
ts)
Energy (eV)
1.5GPa 9.8GPa16GPa 20GPa 22GPa 26GPa 20GPa (P. released) 4GPa (P. released)
Nor
mal
ized
Inte
nsity
(arb
. uni
ts)
Energy (eV)
1.5 GPa 16 GPa 22 GPa 30 GPa 15 GPa (P. released) 4 GPa (P. released)
FIG. 9. (Color online) Pressure variation of Co K-edge XMCDspectra (upper panel) and some examples of XANES (lower panel)spectra of CoFe2O4. The inset shows the pressure dependence of theintegral of the XMCD peak. Error bars indicate the standard deviation,and the line is a guide for the eyes.
B. Pressure dependence of XANES and XMCD spectraat the Co K-edge of CoFe2O4
To fully characterize the high-pressure magnetic state in thissample, we have separately carried out pressure-dependentXMCD experiments at the Co K-edge. Figure 9 shows thecombined XMCD and XANES data at the Co K-edge ofCoFe2O4 as a function of pressure. In XANES, the spectraexhibit an enhanced white-line-like absorption and no prepeakintensity. In XMCD, a positive signal with a double peakappears at about 7726 eV that corresponds to the white lineof XANES spectra but no dichroic signal at the prepeak isobserved. These experimental facts demonstrate that Co2+is preferably substituted for the Fe2+ in octahedral sites.The XMCD spectral profile coincides with those previouslyreported by Kita et al.17 and Kawamura et al.34 and can beexplained as arising from the Co2+ ions in the B sites ofCoFe2O4 that should be in the high-spin state. As the pressureincreases, the double-peaked XMCD signal continuouslydecreases down to 20% of its value at room pressure at thepressure Pc ∼ 26 GPa, in contrast to the drastic decay observedat the Fe K-edge. However, the XMCD signal suppressionoccurs at the same pressure for both Fe and Co K-edge. Underdecompression, the Co K-edge XMCD signal is not restoredeither (see inset of Fig. 9 upper panel), which confirms that themagnetic transition in CoFe2O4 is therefore irreversible. In thecritical region of pressures, simultaneously with the magnetictransition, a change is also observed in the XANES spectra at
0 1 2 3 4 50.0000
0.0005
0.0010
0.0015
0.0020
0.0025
0.0030
0.0035
0.0040
P=25.8 GPa
P=19.5 GPaP=17.5 GPa
P=8 GPa
P=12.7 GPa
Mag
netic
mom
ent (
emu)
H (104 Oe)
P=0 GPa
FIG. 10. (Color online) Magnetization curves of CoFe2O4 vsthe external magnetic field for selected pressures between ambientpressure and 26 GPa.
the Co K-edge, as shown in Fig. 9 lower panel. This is a signof a change in the electronic structure of the Co atoms in thehigh-pressure phase.
C. Pressure dependence of bulk magnetization in CoFe2O4
The straightforward conclusion from the previous XMCDmeasurements is the pressure-induced disappearance of Fe-and Co-sublattice magnetizations in CoFe2O4. However,XMCD alone cannot disentangle a transition to a paramagneticstate (loss of the magnetic order) from the disappearance ofthe local magnetic moments (magnetic collapse). In orderto determine the exact nature of the high-pressure magneticstate, we should compare with the pressure dependence ofthe bulk magnetization. We recall here that in CoFe2O4,Co has the largest contribution in the formation of the totalmagnetic moment because of antiparallel alignment of Fe3+ attetrahedral and octahedral sites. However, a small contributionof Fe is still deduced from magnetic Compton scattering.35
This fact is reflected in the amplitude of the XMCD signals atthe Fe (Fig. 5) and Co (Fig. 9) K-edges, which is about fivetimes larger for the Co K-edge. Magnetometric measurementsunder high pressure are difficult because of the weakness ofthe magnetic signal coming from the sample, and four runsof measurements were carried out at room temperature toobtain comprehensive results. In Fig. 10, the magnetic fielddependence of the bulk magnetic moment (M) is given forseveral pressures from P = 0 GPa up to P = 26 GPa at 293 K.It is clear that the magnetization up to P = 8 GPa showsthe typical feature of a ferromagnet, as expected from themajor contribution of the Co-sublattice ferromagnetism to thebulk magnetization, and appears to saturate at around 2 kOe.For higher pressures up to 19 GPa, the magnetization stillresembles the ferromagnetic behavior, but it does not reachsaturation even at the highest field of 5 kOe. At P = 26 GPa,the magnetization is nearly proportional to the magneticfield without saturation and approaches zero at H = 0 Oe,suggesting that high-pressure CoFe2O4 is either paramagneticor antiferromagnetic. The pressure dependence of the magneticmoment obtained from the SQUID measurements at twovalues of the magnetic field, H = 10 kOe and 50 kOe, issummarized in Fig. 11, where all the data points are plotted
094408-6

INVESTIGATION OF PRESSURE-INDUCED MAGNETIC . . . PHYSICAL REVIEW B 87, 094408 (2013)
0 5 10 15 20 25 300
20
40
60
80
100
120
Integral XMCD(P) / Integral XM
CD(P=0) (%)
H= 10 kOe H= 50 kOe
M(P
) / M
(P=0
) (%
)
P (GPa)
0
20
40
60
80
100
120 H= 10 kOe
FIG. 11. (Color online) Pressure dependence of the magnetiza-tion of CoFe2O4 observed at the external magnetic fields H = 10 kOe(open squares) and H = 50 kOe (full circles), which is compared tothe pressure variation of the Co K-edge XMCD integrated intensity.
with normalization against the saturation value at ambientpressure. The pressure dependence of the integral of theXMCD signal at the Co K-edge at H = 10 kOe is alsoshown in Fig. 11 for comparison. The bulk magnetic momentobtained from the SQUID measurements yield similar pressuredependence to the integral of the Co K-edge XMCD intensity,which confirms the major contribution of Co ferromagnetismto the bulk magnetization. As pressure increases, the bulkmagnetization continuously decreases, and the intensity ofM(H = 10 kOe) at P = 26 GPa was suppressed down toabout 10% of the initial one. However, M(H = 50 kOe) atP = 26 GPa was only suppressed down to about 40% of itsinitial value. This marked change in the slope of M(P ) vs H
indicates that measurable magnetization is easily induced byan external magnetic field and saturation should be reached athigh pressure applying a sufficiently high magnetic field. Thepresent results of the bulk magnetization point to a transitioninto a paramagnetic state or a collinear antiferromagnetic stateas the most likely mechanism to explain the pressure-induceddisappearance of the ferrimagnetic ordering in CoFe2O4 asderived from the XMCD study. We recall that the magneticcollapse will induce a Pauli paramagnetic high-pressure state.Thus, we have estimated the DC magnetic susceptibility ofCoFe2O4 at 300 K and 26 GPa to be about 6.5 × 10⁻⁵ emu/g.This value is one or two orders of magnitude larger thantypical Pauli magnetic susceptibilities,36 which suggests thatCoFe2O4 at high-pressure corresponds well with a paramagnetof localized moments.
D. High-pressure phase transformations of CoxFe3−xO4 (x = 1,1.5, and 2): Correlation between the crystal
and magnetic state
The x-ray absorption spectra of CoFe2O4 at both Fe andCo K-edges indicate a structural transition in the pressurerange between 24 and 27 GPa, simultaneous with the magneticone. In order to determine the high-pressure polymorphs ofthe CoxFe3−xO4 (x = 1, 1.5, and 2), spinel compounds, andthe relationship with their high-pressure magnetic state, wehave carried out x-ray powder diffraction measurements up to
5 10 15 200
200400600800
100012001400160018002000
LP-phase
39.333
30
2624.41712
0.54.3
Inte
nsity
(arb
. uni
ts)
2 (deg)
(c)CoFe2O4
8.5
P (GPa)
HP-phase
0200400600800
100012001400160018002000
LP-phase
39.33329.824.4221814.6
24
Inte
nsity
(arb
. uni
ts)
(b)Co1.5Fe1.5O4
8.5
P (GPa)
HP-phase
0200400600800
100012001400160018002000
LP-phase
39.536.4
31.229.824.41712
24
Inte
nsity
(arb
. uni
ts)
(a)Co2FeO4
8.5
P (GPa)
HP-phase
FIG. 12. (Color online) X-ray diffraction of Co2FeO4 (a),Co1.5Fe1.5O4 (b), and CoFe2O4 (c) obtained during the compressionrun. The downward (↓) and upward (↑) arrows indicate the disap-pearance of the cubic spinel phase (black lines) and the appearanceof the new high pressure phase (red lines), respectively.
40 GPa. Figures 12(a)–12(c) show representative diffractionpatterns measured for the three samples. The patterns canbe indexed with the cubic spinel structure up to the criticalpressures (Pc) of 24 GPa, 22 GPa, and 29 GPa for CoFe2O4,Co1.5Fe1.5O4, and Co2FeO4, respectively. Changes in thediffraction patterns are found at Pc, where the three samplesshow new diffraction lines that are not explained by thespinel-type structure. This indicates the onset of a phasetransformation to another high-pressure phase. It is importantto mark that the obtained critical pressures for the struc-tural transformation in Co1.5Fe1.5O4 and Co2FeO4 samplescoincide with the extrapolated values (Fig. 8) for which the
094408-7

G. SUBIAS et al. PHYSICAL REVIEW B 87, 094408 (2013)
0 5 10 15 20 25 30 35 4055
60
65
70
0 5 10 15 20 25 30 35 40
0
20
40
60
80
100
P (GPa)
0
20
40
60
80
100
two
phas
es
mar
okite
Uni
t cel
l vol
ume/
Z (Å
3 /f.u.
)
P (GPa)
Co2FeO4
spin
el
FIG. 13. (Color online) Variation of the unit cell volume ofCo2FeO4 as a function of pressure. The vertical axis indicates (V /Z)for consistency in the volume change because of changes in Z
between low- and high-pressure phases. The inset compares thespinel/marokite phase fraction (black squares) from XRD and theintegral of the Fe K-edge XMCD signal (blue circles) with pressure.In the dashed area, the spinel-marokite coexistence region is indicatedby XRD.
pressure-induced extinction of the XMCD signals occur, i.e.,the loss of the ferrimagnetic order.
Only the image for the Co2FeO4 sample shows smoothDebye-Scherrer rings, allowing for straightforward quanti-tative Rietveld refinement of the observed peak intensities.The best agreement between the observed and calculatedpatterns has been achieved when considering the orthorhombicCaMn2O4-type (marokite) structure. The results obtained forthe evolution of the unit cell as a function of pressure are shownin Fig. 13. The transition from the cubic to the orthorhombicphases involves an estimated volume collapse of around 5% atthe transition and a coexistence region from 29 to 36 GPa,i.e., it is a first-order transition. In the inset, we comparethe pressure evolution of the integral of the main XMCDpeak at the Fe K-edge with the pressure evolution of thespinel/marokite phase fraction as estimated from the Rietveldanalysis. Compression immediately decrease the Fe K-edgeXMCD signal, long before the onset of the structural transition,and this onset into a mixed spinel-marokite phase is expectedto occur simultaneously with the total extinction of the XMCDsignal. For the other two cobalt ferrites, the high-pressure XRDpatterns are affected by preferred orientation and show thepresence of more than one postspinel polymorph, probablythose of the orthorhombic postspinel CaMn2O4-type (spacegroup: Pbcm) and CaFe2O4-type (space group: Pnma) struc-tures. Further high-pressure studies are needed to clarify thestructural properties of the high-pressure phases of CoFe2O4
and Co1.5Fe1.5O4. However, all these high-pressure postspinelstructures are denser than the spinel one, which results in moredistorted polyhedron around Fe and Co crystallographic sites.
This could modify the superexchange magnetic interaction andfavor the disappearance of the ferromagnetic order.
From our XRD data we have deduced that the criticalpressures for the structural transformation in Co1.5Fe1.5O4 andCo2FeO4 are higher than the maximum pressure achieved inthe XMCD experiments. This means that these two sampleswere still in the cubic spinel phase, which can explain why theirXMCD signals are found to be reversible upon decompression.On the other hand, the high-pressure phase of CoFe2O4 isquenchable upon release of pressure.
IV. CONCLUSIONS
We have carried out XMCD and magnetization studiesto pressures of 30 GPa combined with XRD studies up to40 GPa to explore the pressure-induced phase transformationsof CoxFe3−xO4 ferrites. All samples are ferrimagnetic andcrystallize with a cubic spinel structure at ambient pressure.Upon increase of pressure, XRD and Fe K-edge XMCDmeasurements indicate that CoFe2O4 is almost unaffected bycompression until ∼27 GPa, where it transforms to an or-thorhombic structure, and Fe-sublattice magnetization (mainlyarising from the antiferromagnetism between tetrahedral andoctahedral sites) is strongly suppressed. Co K-edge XMCDmeasurements show that Co-sublattice magnetization (mainlyferromagnetic) is more sensitive to the effect of pressure,causing a linear decay from the initial applied pressure, butthe magnetic transition occurs simultaneously at the twoedges. This new high-pressure phase is metastable duringdecompression to ambient conditions. Bulk magnetizationmeasurements, which reflects the major contribution of the Coferromagnetism, show that the high-pressure magnetic phasein CoFe2O4 is actually either paramagnetic or collinear antifer-romagnetic. Co1.5Fe1.5O4 and Co2FeO4 ferrites also transforminto orthorhombic high-pressure structures at ∼24 GPa and∼30 GPa, respectively. The high-pressure phase of Co2FeO4
is consistent with the orthorhombic marokite structure. Dif-ferently from CoFe2O4, Fe K-edge XMCD measurementsin the Co-rich samples indicate that compression causes animmediate decrease of Fe-sublattice magnetization withoutany structural modification. Indeed the collapse of the Fe-sublattice magnetization is expected to coincide with theonset of the respective structural phase transitions. Althoughwe would expect a transition to either a paramagnetic orantiferromagnetic phase similar to CoFe2O4, we cannot com-pletely rule out the total disappearance of the local magneticmoment in the mixed spinel/orthorhombic high-pressure phaseof Co1.5Fe1.5O4 and Co2FeO4 ferrites.
ACKNOWLEDGMENTS
We thank ESRF for proving us with beam time. J. Jacobsis acknowledged for the preparation of the high pressureXRD DAC. This research was financed by the SpanishMICINN (Project No. MAT2012-38213-C02-01) and DGA(CAMRADS).
*Corresponding author: [email protected]. S. Lyubutin and A. G. Gavriliuk, Phys. Usp. 52, 989 (2009).
2V. A. M. Brabers, in Hand Book of Magnetic Materials, edited byK. H. Buschow (North-Holland, Amsterdam, 1995), Vol. 8, p. 189.
094408-8

INVESTIGATION OF PRESSURE-INDUCED MAGNETIC . . . PHYSICAL REVIEW B 87, 094408 (2013)
3J. Garcıa and G. Subıas, J. Phys.: Condens. Matter 16, R145 (2004).4H. K. Mao, T. Takahashi, W. Bassett, G. Kinsland, and L. Merrill,J. Geophys. Res. 79, 1165 (1974).
5Y. Fei, D. J. Frost, H.-K. Mao, C. T. Prewitt, and D. Hausermann,Am. Mineral. 84, 203 (1999).
6C. Haavik, S. Stolen, H. Fjellvag, M. Hanfland, and D. Hausermann,Am. Mineral. 85, 514 (2000).
7L. S. Dubrovinsky, N. A. Dubrovinskaia, C. McCammon, G. KhRozenberg, R. Ahuja, J. M. Osorio-Guillen, V. Dmitriev, H.-P.Weber, T. Le Bihan, and B. Johansson, J. Phys.: Condens. Matter15, 7697 (2003).
8M. P. Pasternak, S. Nasu, K. Wada, and S. Endo, Phys. Rev. B 50,6446 (1994)
9W. M. Xu, G. Yu. Machavariani, G. Kh. Rozenberg, and M. P.Pasternak, Phys. Rev. B 70, 174106 (2004).
10E. R. Morris and Q. Williams, J. Geophys. Res. 102, 18139 (1997).11Y. Ding, D. Haskel, S. G. Ovchinnikov, Y.-C. Tseng, Y. S. Orlov,
J. C. Lang, and H. K. Mao, Phys. Rev. Lett. 100, 045508 (2008).12G. Subıas, V. Cuartero, J. Garcıa, J. Blasco, O. Mathon, and
S. Pascarelli, J. Phys.: Conf. Ser. 190, 012089 (2009).13F. Baudelet, S. Pascarelli, O. Mathon, J.-P. Itie, A. Polian and J.-C.
Chervin, Phys. Rev. B 82, 140412(R) (2010).14R. E. Cohen, I. I. Mazin, and D. G. Isaak, Science 275, 654 (1997).15G. Subıas, J. Garcıa, M. G. Proietti, J. Blasco, H. Renevier, J. L.
Hodeau, and M. C. Sanchez, Phys. Rev. B 70, 155105 (2004).16The cations distributions were obtained based on the decrease
of the peak-height A-A′ (Fig. 2) of the dispersion-type signalobserved in the vicinity of the pre-edge peak of XANES spectraof CoxFe3−xO4 (x = 1.5 and 2) samples with respect to CoFe2O4,where the tetrahedral A sites are fully occupied by Fe3+. Theremaining fraction of A sites is occupied by Co2+ that moves fromthe octahedral B sites when the substitution of Co3+ occurs to assurethe charge balance.
17N. Kita, N. Shibuichi, and S. Sasaki, J. Synchrotron Radiat. 8, 446(2001).
18P. J. Murray and J. W. Linnet, J. Phys. Chem. Solids 37, 619(1975).
19J. Blasco, J. Garcıa, and G. Subıas, Phys. Rev. B 83, 104105 (2011).20S. Pascarelli, O. Mathon, M. Munoz, T. Mairs, and J. Susini,
J. Synchrotron Radiat. 13, 351 (2006).21M. Mezouar, W. A. Crichton, S. Bauchau, H. Witsch, F. Torrecillas,
G. Blattmann, P. Marion, Y. Dabin, J. Chavanne, O. Hignette,C. Morawe, and C. Borel, J. Synchrotron Radiat. 12, 659 (2005).
22A. P. Hammersley, S. O. Svensson, M. Hanfland, A. N. Fitch, andD. Hausermann, High Press. Res. 14, 235 (1996).
23J. Rodrıguez-Carvajal, Physica B 192, 55 (1993). See alsohttp://www.ill.eu/sites/fullprof/.
24M. Mito, M. Hitaka, T. Kawae, K. Takeda, T. Kitai, andN. Toyoshima, Jpn. J. Appl. Phys. 40, 6641 (2001).
25H. Maruyama, I. Harada, K. Kobayashi, and H. Yamazaki, PhysicaB 208-209, 760 (1995).
26N. Kawamura, H. Maruyama, K. Kobayashi, I. Inoue, andH. Yamazaki, J. Phys. IV (France) 7, C1 (1997).
27K. Matsumoto, F. Saito, T. Toyoda, K. Ohkubo, K. Yamawaki,T. Mori, K. Hirano, M. Tanaka, and S. Sasaki, Jpn. J. Appl. Phys.39, 6089 (2000).
28J. Garcıa, G. Subıas, V. Cuartero, and J. Herrero-Martın,J. Synchrotron Radiat. 17, 386 (2010).
29J. I. Igarashi and K. Hirai, Phys. Rev. B 50, 17820 (1994).30G. Y. Guo, J. Phys.: Condens. Matter 8, L747 (1996).31O. Mathon, F. Baudelet, J. P. Itie, A. Polian, M. d’Astuto, J. C.
Chervin, and S. Pascarelli, Phys. Rev. Lett. 93, 255503 (2004).32R. Torchio, S. Pascarelli, O. Mathon, C. Marini, S. Anzellini,
P. Centomo, C. Meneghini, S. Mobilio, N. A. Morley, and M. R. J.Gibbs, High Press. Res. 31, 148 (2011).
33R. Torchio, A. Monza, F. Baudelet, S. Pascarelli, O. Mathon,E. Pugh, D. Antonangeli, and J. P. Itie, Phys. Rev. B 84, 060403(R)(2011).
34N. Kawamura, H. Maruyama, K. Kobayashi, S. Uemura, A. Urata,and H. Yamazaki, J. Phys. Soc. Jpn. 68, 923 (1999).
35H. S. Mund, S. Tiwari, J. Sahariya, M. Itou, Y. Sakurai, and B. L.Ahuja, J. Appl. Phys. 110, 073914 (2011).
36N. W. Ashcroft and N. D. Mermin, Solid State Physics (CengageLearning Inc., Philadelphia, CA, 1976).
094408-9