Investigating the motion of a Gravity Car
53
Sreenidhi International School Physics Extended Essay Candidate Name: Janakirama Venkat Vital Saiteja Raju Indukuri Candidate number: 004976-0027 1 INVESTIGATING THE MOTION OF A GRAVITY CAR Subject : Physics. Topic: Mechanics. Candidate name: Janakirama Venkat Vital Saiteja Raju Indukuri Candidate number: 004976-0027 Supervisor name: Gyaneshwaran Gomathinayagam. School: Sreenidhi International School. Word count: 3734
-
Upload
independent -
Category
Documents
-
view
0 -
download
0
Transcript of Investigating the motion of a Gravity Car

Sreenidhi International School Physics Extended Essay
Candidate Name: Janakirama Venkat Vital Saiteja Raju Indukuri Candidate number: 004976-0027
1
INVESTIGATING THE MOTION OF A
GRAVITY CAR
Subject : Physics.
Topic: Mechanics.
Candidate name: Janakirama Venkat Vital Saiteja Raju Indukuri
Candidate number: 004976-0027
Supervisor name: Gyaneshwaran Gomathinayagam.
School: Sreenidhi International School.
Word count: 3734

Sreenidhi International School Physics Extended Essay
Candidate Name: Janakirama Venkat Vital Saiteja Raju Indukuri Candidate number: 004976-0027
2
Abstract
A small gravity car was constructed using waste cds for wheels, sketch pens for axles, and a thermocol box for
body of the car. Different weights were hung from the fixed pulley attached to the body of the car. The other end
of the string holding the weights was attached to the front axle of the car by means of a needle fixed to the axle.
When the weight fell down, the stored gravitational potential energy got converted into translational and
rotational kinetic energy and some energy also got dissipated as heat due to friction in the axles.
Videos of the motion of the gravity car for 3 trials each for 5 different loads were taken and analysed using
TRACKER software. Using TRACKER, the position and velocity of the gravity car and load were tracked as a
function of time. This raw data was processed to analyse the motion of the gravity car in different ways. The
acceleration and deceleration of the car were calculated. The acceleration of the car was found to increase with
increasing load, and the deceleration was found to be almost independent of load. The energy transformation
from gravitational to rotational and translational kinetic energy was found to vary linearly with distance fallen by
the load. The distance travelled by the gravity car was found to be proportional to the distance fallen by the load
during the same time. The downward acceleration of the load was calculated and found to increase with increase
in load. The ratio of rotational kinetic energy to translational kinetic energy was predicted to decrease with
increasing load, and the slope of the rotational kinetic energy vs translational kinetic energy matched the
predicted value perfectly for each of the five loads tested.
(Word Count 290)

Sreenidhi International School Physics Extended Essay
Candidate Name: Janakirama Venkat Vital Saiteja Raju Indukuri Candidate number: 004976-0027
3
Table of Contents Abstract .....................................................................................................................................................................................2
List of Figures .............................................................................................................................................................................4
List of Tables ..............................................................................................................................................................................6
Acknowledgement ....................................................................................................................................................................7
Introduction...............................................................................................................................................................................8
Hypothesis .............................................................................................................................................................................. 11
Energy Transformation ....................................................................................................................................................... 11
Relation between Rotational Kinetic Energy and Translational Kinetic Energy ................................................................. 11
Relation between distance travelled by gravity car and distance travelled by load .......................................................... 12
Relation between acceleration of gravity car and vertical acceleration of load ................................................................ 13
Acceleration and deceleration of gravity car ...................................................................................................................... 13
Investigation ........................................................................................................................................................................... 14
Discussion of Results .............................................................................................................................................................. 18
Energy vs time ..................................................................................................................................................................... 18
Energy vs distance fallen by load ........................................................................................................................................ 19
Distance travelled by gravity car vs time ............................................................................................................................ 20
Velocity of gravity car vs time ............................................................................................................................................. 23
Velocity of gravity car vs distance travelled by gravity car ................................................................................................. 29
Distance travelled by gravity car vs distance fallen by load ............................................................................................... 32
Distance fallen by load vs time ........................................................................................................................................... 35
Load vertical velocity vs time ............................................................................................................................................. 39
Rotational Kinetic Energy vs Translational Kinetic Energy .................................................................................................. 41
Conclusion .............................................................................................................................................................................. 45
Evaluation ............................................................................................................................................................................... 45
Bibliography ........................................................................................................................................................................... 45
Appendix ................................................................................................................................................................................ 46
Raw Data ............................................................................................................................................................................. 46
Sreenidhi International School Physics Extended Essay
Candidate Name: Janakirama Venkat Vital Saiteja Raju Indukuri Candidate number: 004976-0027
4
List of Figures Figure 1: Diagram to illustrate the different forces acting on the gravity car .......................................................................... 9
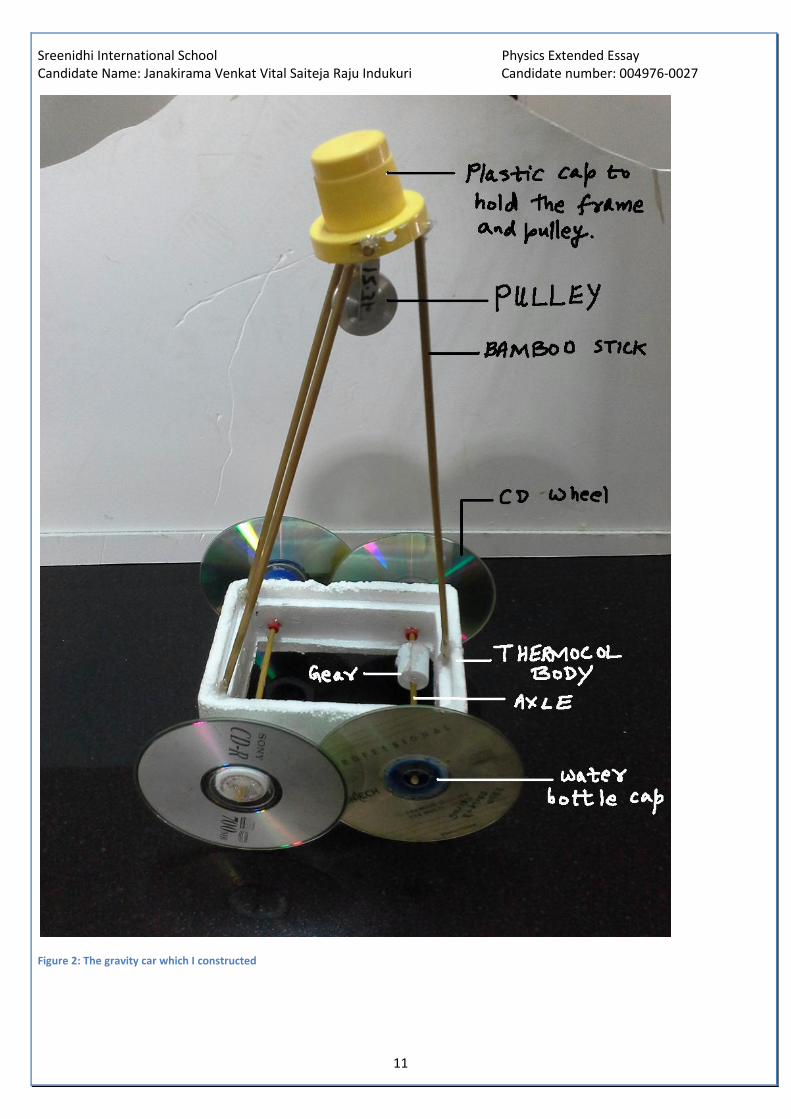
Figure 2: The gravity car which I constructed ......................................................................................................................... 11
Figure 3: diagram illustrating the derivation of the relation between the distance moved by the gravity car and the
distance fallen by the load ...................................................................................................................................................... 13
Figure 4: the video is calibrated by entering the diameter of wheel as 0.12 m ..................................................................... 16
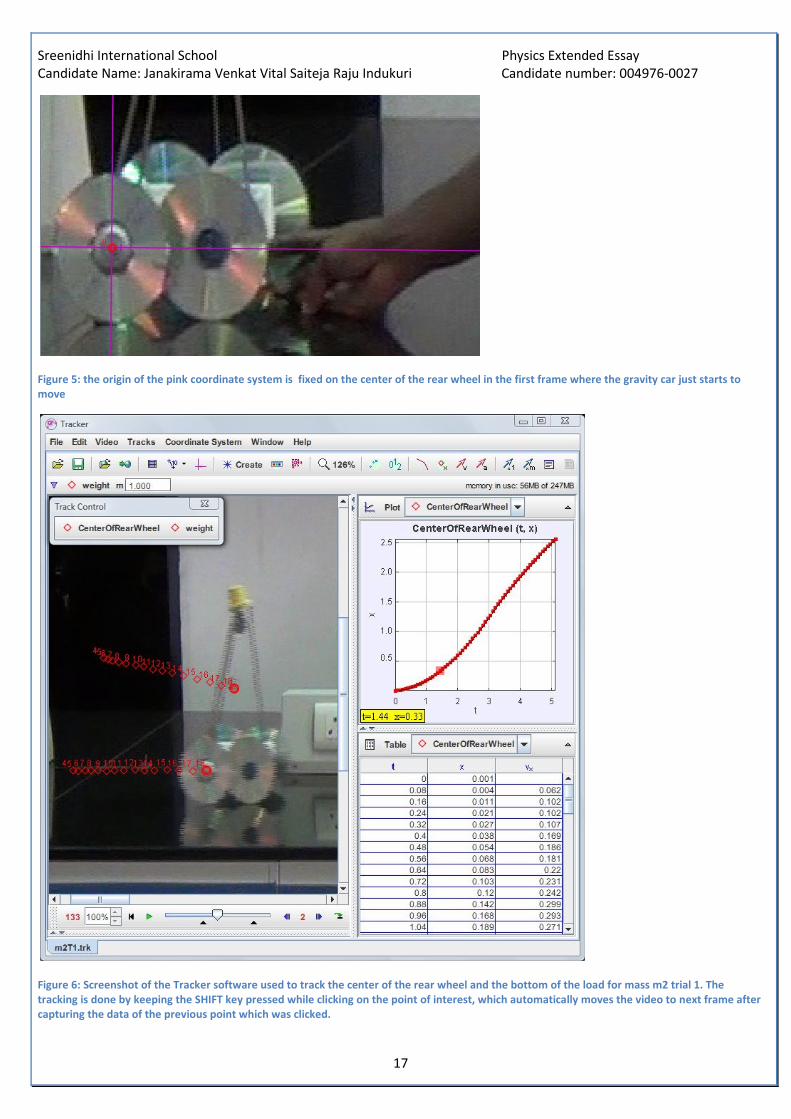
Figure 5: the origin of the pink coordinate system is fixed on the center of the rear wheel in the first frame where the
gravity car just starts to move ................................................................................................................................................ 17
Figure 6: Screenshot of the Tracker software used to track the center of the rear wheel and the bottom of the load for
mass m2 trial 1. The tracking is done by keeping the SHIFT key pressed while clicking on the point of interest, which
automatically moves the video to next frame after capturing the data of the previous point which was clicked. ............... 17
Figure 7: Energy transformation vs time for trial 1 of mass 1 ................................................................................................ 19
Figure 8: Distribution of different energies vs distance fallen by load for trial 1 of mass 1................................................... 20
Figure 9: distance travelled by gravity car vs time for mass m1 - all three trials ................................................................... 21
Figure 10: distance travelled by gravity car vs time for mass m2 - all three trials ................................................................. 21
Figure 11: distance travelled by gravity car vs time for m3 - all 3 trials ................................................................................. 22
Figure 12:Distance travelled by gravity car vs time for m4 - all 3 trials ................................................................................. 22
Figure 13: Distance travelled by gravity car vs time for m5- all 3 trials.................................................................................. 23
Figure 14:Velocity of gravity car vs time for m1 - all three trials ........................................................................................... 24
Figure 15:Velocity of the gravity car vs time for m2 - all three trials ..................................................................................... 25
Figure 16:velocity of the gravity car vs time for m3 - all three trials ...................................................................................... 26
Figure 17:velocity of gravity car vs time for m4- all three trials ............................................................................................. 27
Figure 18:velocity of the gravity car vs time for m5 - all three trials ...................................................................................... 28
Figure 19: Calculating acceleration and deceleration of gravity car from slopes of velocity vs time graphs ........................ 29
Figure 20: mean acceleration and mean deceleration vs load ............................................................................................... 29
Figure 21:velocity of gravity car vs distance travelled for m1- all three trials ....................................................................... 30
Figure 22:velocity of gravity car vs distance travelled for m2 - all three trials....................................................................... 31
Figure 23:velocity of gravity car vs distance travelled for m3 - all three trials....................................................................... 31
Figure 24:velocity of gravity car vs distance travelled for m4 - all three trials....................................................................... 32
Figure 25:velocity of gravity car vs distance travelled for m5 - all three trials....................................................................... 32
Figure 26:Distance travelled by gravity car vs distance fallen by load for m1 - all three trials .............................................. 33
Figure 27:Distance travelled by gravity car vs distance fallen by load for m2- all three trials ............................................... 33
Figure 28:Distance travelled by gravity car vs distance fallen by load for m3- all three trials ............................................... 34
Figure 29:Distance travelled by gravity car vs distance fallen by load for m4 - all three trials .............................................. 34
Figure 30:Distance travelled by gravity car vs distance fallen by load for m5 - all three trials .............................................. 35
Figure 31:Distance fallen by load vs time for m1 - all three trials .......................................................................................... 36
Figure 32:Distance fallen by load vs time for m2 - all three trials .......................................................................................... 36
Figure 33:Distance fallen by load vs time for m3 - all three trials .......................................................................................... 37
Figure 34:Distance fallen by load vs time for m4 - all three trials .......................................................................................... 37
Figure 35:Distance fallen by load vs time for m5 - all three trials .......................................................................................... 38
Figure 36: mean downward acceleration of load vs load ....................................................................................................... 39
Figure 37: Load vertical velocity vs time for m1 – all three trials ........................................................................................... 40
Figure 38: Load vertical velocity vs time for m2 – all three trials ........................................................................................... 40
Figure 39:Load vertical velocity vs time for m3– all three trials ............................................................................................. 41
Figure 40:Load vertical velocity vs time for m4 – all three trials ............................................................................................ 41

Sreenidhi International School Physics Extended Essay
Candidate Name: Janakirama Venkat Vital Saiteja Raju Indukuri Candidate number: 004976-0027
5
Figure 41:Load vertical velocity vs time for m5 – all three trials ............................................................................................ 42
Figure 42:Rotational kinetic energy vs translational kinetic energy for m1 – all three trials ................................................. 42
Figure 43: Rotational kinetic energy vs translational kinetic energy for m2 – all three trials ................................................ 43
Figure 44: Rotational kinetic energy vs translational kinetic energy for m3 – all three trials ................................................ 43
Figure 45: Rotational kinetic energy vs translational kinetic energy for m4 – all three trials ................................................ 44
Figure 46: Rotational kinetic energy vs translational kinetic energy for m5 – all three trials ................................................ 44
Figure 47: Comparing measured and predicted values of ratio of rotational and translational kinetic energies of gravity car
for different loads ................................................................................................................................................................... 45
Sreenidhi International School Physics Extended Essay
Candidate Name: Janakirama Venkat Vital Saiteja Raju Indukuri Candidate number: 004976-0027
6
List of Tables Table 1: Calculating acceleration and deceleration of gravity car from slopes of velocity vs time graphs ............................ 28
Table 2: Calculating the mean ratio of distance travelled by gravity car and distance fallen by load (from graph) .............. 35
Table 3: finding the downward acceleration of load from distance fallen by load vs time graphs ....................................... 38
Table 4: Calculating measured and predicted ratios of rotational and translational kinetic energies of gravity car for
different loads ......................................................................................................................................................................... 45
Table 5 The different loads used in the investigation ............................................................................................................ 47
Table 6: Raw data for trial 1 of load m1 ................................................................................................................................. 47

Sreenidhi International School Physics Extended Essay
Candidate Name: Janakirama Venkat Vital Saiteja Raju Indukuri Candidate number: 004976-0027
7
Acknowledgement
I am very grateful to my supervisor Mr. Gyaneshwaran G for his guidance in completing the extended essay.
I would like to thank my physics teacher Mr. Thavamani T for his guidance.
I would like to thank our Lab Technicians Mr. Anil and Mr. Mahendar for assisting me while shooting the
videos.

Sreenidhi International School Physics Extended Essay
Candidate Name: Janakirama Venkat Vital Saiteja Raju Indukuri Candidate number: 004976-0027
8
Introduction
I got introduced to gravity cars while watching the youtube videos of GrandadIsAnOldMan1. I was fascinated by the
simplicity of the construction and the scope for physics exploration it offered. So I decided to construct one and study its
motion. Since the gravity car uses the gravitational potential energy stored in a weight suspended from a pulley attached
to the body of the car, I decided to study the effect of varying this load, on the motion of the gravity car. So, my
research question is “How does the load hanging from the pulley of the gravity car affect the different parameters of its
motion like position, velocity, acceleration, ratio of rotational kinetic energy and translational kinetic energy, and ratio
of distance travelled by gravity car vs distance fallen by load?”
I couldn’t find any reference that described the detailed working of the gravity car or predicted its motion. So I had to find
out on my own by my own exploration.
I realized that the gravity car’s motion was not as simple as I first thought2.
1 "Gravity Powered Cars." YouTube. YouTube. Web. 11 Mar. 2014.
<http://www.youtube.com/playlist?list=PLA5a2xPRSrB1zzCqDckAnlOzz8iViuM94>. 2 DC, Pandey. "Mechanics of Rotational Motion - Combined Translational and Rotational Motion of a Rigid
Body." Understanding Physics Mechanics - Part 2. 2008 ed. Meerut: Arihant Prakashan, 2008. 34,35. Print.

Sreenidhi International School Physics Extended Es
Candidate Name: Janakirama Venkat Vital Saiteja
Figure 1: Diagram to illustrate the different forces acting on the gravity car
The load L applies a torque on the axle via
with the horizontal and this complicates the situation
hence the ‘active’ wheels which are attached to the axle)
wheel and the floor results in rolling motion
forward motion of the gravity car causes the ‘passive’ wheels to rotate due to the static friction f
the passive wheels, as shown in the above figure.
gravity car, while translational kinetic energy is possessed by the body of the gravity car and the load descending from the
pulley at the top. The floor exerts Normal reaction N upwards o
value of static friction that can be exerted on the wheels by the floor.
3 P.K, Sharma. "Rotational Kinematics - Concept of Rolling."
Publications, 2010. 158-160,263-268. Print.
International School Physics Extended Es
Janakirama Venkat Vital Saiteja Raju Indukuri Candidate number:
9
: Diagram to illustrate the different forces acting on the gravity car
ies a torque on the axle via the string passing through the pulley. The tension force acts at an acute angle
licates the situation3. The torque acting on the gear of radius r
hence the ‘active’ wheels which are attached to the axle), and the presence of static friction
wheel and the floor results in rolling motion of the wheel, which results in the forward motion of the gravity car.
forward motion of the gravity car causes the ‘passive’ wheels to rotate due to the static friction f
the passive wheels, as shown in the above figure. Thus, rotational kinetic energy is present in the rotating wheels of the
gravity car, while translational kinetic energy is possessed by the body of the gravity car and the load descending from the
The floor exerts Normal reaction N upwards on all the four wheels, which contributes to the limiting
value of static friction that can be exerted on the wheels by the floor.
Concept of Rolling." Understanding Physics Mechanics
. Print.
International School Physics Extended Essay
Candidate number: 004976-0027
ing through the pulley. The tension force acts at an acute angle θ
of radius rg, rotates the axle (and
, and the presence of static friction fsa between the ‘active’
of the wheel, which results in the forward motion of the gravity car. The
forward motion of the gravity car causes the ‘passive’ wheels to rotate due to the static friction fp exerted by the floor on
rotational kinetic energy is present in the rotating wheels of the
gravity car, while translational kinetic energy is possessed by the body of the gravity car and the load descending from the
which contributes to the limiting
Understanding Physics Mechanics - Part B. 2009 ed. Prakash

Sreenidhi International School Physics Extended Essay
Candidate Name: Janakirama Venkat Vital Saiteja Raju Indukuri Candidate number: 004976-0027
10
The load accelerates vertically downwards with acceleration a2. The gravity car has a forward acceleration a1 till the load
hits the ground. After the load hits the ground and is disconnected from the gravity car, only friction between the axle
and wheels faxle will act on the gravity car to decelerate it till it comes to rest. The gravity car has an instantaneous velocity
vc in the forward direction.
The distance travelled by the gravity car in time t is dc and the distance fallen by the load in time t is dL.
Sreenidhi International School Physics Extended Essay
Candidate Name: Janakirama Venkat Vital Saiteja Raju Indukuri Candidate number: 004976-0027
11
Figure 2: The gravity car which I constructed

Sreenidhi International School Physics Extended Essay
Candidate Name: Janakirama Venkat Vital Saiteja Raju Indukuri Candidate number: 004976-0027
12
Hypothesis
Energy Transformation
Since gravitational potential energy of an object of mass m at a height h , Ug = mgh, we find that the gravitational
potential energy of the load is proportional to its height. Hence, with the decrease in height of the load, there must be a
proportionate decrease in gravitational potential energy and a proportionate increase in translational and rotational
rotational kinetic energy of the gravity car. I expect friction in the axle to increase with an increase in load. Hence, I expect
the energy dissipation due to friction, to increase with increase in load. Note that load is the weight hung from the pulley
to provide the torque necessary to rotate the wheels of the gravity car.
Relation between Rotational Kinetic Energy and Translational Kinetic Energy
Total rotational kinetic energy of the gravity car is present as the sum of the rotational kinetic energy of the four wheels.
The rotational kinetic energy of the axle is neglected, since its moment of inertia is very small on account of its small mass
and radius.
Thus, total rotational kinetic energy of the gravity car,
�� = 4 × 12 × � ×
where I = moment of inertia of each wheel and ω = angular velocity of wheel
the factor 4 is required to account for the kinetic energy of rotation of 4 wheels.
On simplifying, we get
�� = 4 × � × ��
× � × ��� × �����
�
where mw = mass of each wheel
rw = radius of each wheel
vc = forward velocity of gravity car
which finally gives �� = � × ����
Translational Kinetic Energy of the gravity car with load, �� = � × �� + �� × ����

Sreenidhi International School Physics Extended Essay
Candidate Name: Janakirama Venkat Vital Saiteja Raju Indukuri Candidate number: 004976-0027
13
where L = mass of load hanging from pulley of gravity car
M = mass of empty gravity car
Thus, the ratio of Rotational Kinetic Energy to Translational Kinetic Energy,
����
= � × ����
12 × �� + �� × ����
= 2 × ��� + ��
Relation between distance travelled by gravity car and distance fallen by load
Figure 3: diagram illustrating the derivation of the relation between the distance moved by the gravity car and the distance fallen by the load
If the load falls a vertical distance dL, then the gear, and the ‘active’ wheels attached to the gear and axle, will have the
same angular displacement θ. The outer surface of the gear of radius rg will rotate by an arc length dL. So � = ���
.
For the ‘active’ wheels, we have � = ����
where dc = distance travelled by gravity car
rw = radius of wheel
Comparing the above two equations, we get !� = ���
× !"

Sreenidhi International School Physics Extended Essay
Candidate Name: Janakirama Venkat Vital Saiteja Raju Indukuri Candidate number: 004976-0027
14
Relation between acceleration of gravity car and vertical acceleration of load
Differentiating the expression for dc with respect to time, twice, we get #� = ���
× #"
where ac = forward acceleration of gravity car while the load is falling
aL = vertical acceleration of load while it is falling
Acceleration and deceleration of gravity car
While the load is falling, I expect the gravity car to have a constant positive acceleration due to the net torque exerted by
the load. I expect this acceleration to increase with an increase in load.
After the load hits the ground and gets disconnected from the gravity car, I expect the gravity car to decelerate at a
constant rate due to friction between the axle and wheels. I expect this deceleration to increase slightly with increase in
load, because I expect the friction between the axle and wheels to increase with increase in load.

Sreenidhi International School Physics Extended Essay
Candidate Name: Janakirama Venkat Vital Saiteja Raju Indukuri Candidate number: 004976-0027
15
Investigation
The gravity car was constructed by following the instructions given in the youtube video mentioned in the introduction.
Waste cds were used as wheels, bamboo sticks were used to make the framework to support the pulley to hold the load,
and a hollow thermocol box was used to make the body of the car. The hollow body of sketch pens were used to make
the axles, and water bottle caps were used to close the gaps in the cds while fixing them to the axles. Hot glue gun was
used to join all the parts. A needle was used to make a hook and hot glued on to the bottle cap which was used as a gear.
The wheels attached to the axle containing the gear are called ‘active’ wheels because they provide the torque to move
the vehicle. The wheels attached to the axle that do not contain the gear are called ‘passive’ because they don’t rotate on
their own, and rotate only because the car is made to move forward by the ‘active’ wheels.
mass of empty gravity car (without the load), M = 0.12670 kg ± 0.00001 kg (measured using electronic balance).
radius of each wheel, rw = 0.060 m ± 0.001 m (measured using meter scale)
radius of gear, rg = 0.0203 m ± 0.0001 m (measured using vernier calliper)
$%$&
= '. ')''. '*'+ = *. ,--). = +. ' �$012343 055 60 * 78&28589:26 58&1$47�
Thus, the predicted slope of distance travelled by gravity car vs distance fallen by load graphs is 3.0.
The predicted slope of acceleration of gravity car vs downward acceleration of load graphs is also 3.0.
This slope should be independent of the load.
mass of each wheel, mw = 0.01634 kg ± 0.00001 kg (using electronic balance)
moment of inertia of each wheel, I = 0.5 x 0.01634 x 0.0602 = 0.000029 kg.m2 (rounded off to 2 sf).
The motion of the gravity car was captured on video by taking all the precautions such as:
1. ensuring that the car travelled in a plane parallel to the face of the camera
2. keeping the camera fixed on a stand

Sreenidhi International School Physics Extended Essay
Candidate Name: Janakirama Venkat Vital Saiteja Raju Indukuri Candidate number: 004976-0027
16
3. shooting under bright natural light
4. choosing a smooth level surface which is long enough to cover the required motion of the gravity car
5. having a contrasting background to enable easy tracking of the points of interest in the gravity car.
The videos were then analysed using TRACKER software. First, the video was calibrated by using the blue calibration stick,
as shown in the figure below.
Figure 4: the video is calibrated by entering the diameter of wheel as 0.12 m
Then, the pink coordinate system was fixed as shown in the figure below, by setting the origin of the coordinate system at
the center of the rear wheel in the frame where the gravity car just starts to move. The video was forwarded to the last
frame and the coordinate system was adjusted so that the x axis passed through the center of the rear wheel even in the
last frame of the video. Thus it was ensured that the gravity car moved only along the positive x axis.
Sreenidhi International School Physics Extended Essay
Candidate Name: Janakirama Venkat Vital Saiteja Raju Indukuri Candidate number: 004976-0027
17
Figure 5: the origin of the pink coordinate system is fixed on the center of the rear wheel in the first frame where the gravity car just starts to
move
Figure 6: Screenshot of the Tracker software used to track the center of the rear wheel and the bottom of the load for mass m2 trial 1. The
tracking is done by keeping the SHIFT key pressed while clicking on the point of interest, which automatically moves the video to next frame after
capturing the data of the previous point which was clicked.

Sreenidhi International School Physics Extended Essay
Candidate Name: Janakirama Venkat Vital Saiteja Raju Indukuri Candidate number: 004976-0027
18
The center of the rear wheel was tracked in each frame to give the data about the position and velocity of the gravity car
as a function of time. The bottom of the load was tracked in each frame to give the data about the x and y coordinates of
the position, x and y components of velocity, and magnitude of velocity as a function of time. Thus, the raw data was
compiled for 3 trials each for five different values of load. The raw data table for trial 1 of mass 1 is in the Appendix. The
rest of the raw data and processed data can be accessed from the following link: http://tinyurl.com/otw6q6r

Sreenidhi International School Physics Extended Essay
Candidate Name: Janakirama Venkat Vital Saiteja Raju Indukuri Candidate number: 004976-0027
19
Discussion of Results
The Raw Data Tables and Processed Data Tables can be accessed from the following link:
http://tinyurl.com/otw6q6r
The tables are too numerous to print here.
Energy vs time
Figure 7: Energy transformation vs time for trial 1 of mass 1
This graph shows the distribution of energy in the gravity car in different forms as a function of time. We can see
that the relationship is not linear. As expected, the gravitational potential energy decreases with time, while the
translational and rotational kinetic energies increase with time, till they reach the maximum near 5 s. This is
when the load hits the ground and stops contributing to the accelerating torque. Thereafter, gravitational potential
energy remains at zero, and the translational and rotational kinetic energies start decreasing till they also become
zero. The work done by friction is calculated as the initial gravitational potential energy – sum of all the energies
present in the gravity car. The gravitational potential energy is only tracked till the load is in view while falling
down. Around 3.52 s, the load gets hidden behind the wheels and could not be tracked, and hence the data of
gravitational potential energy is not available from this moment onwards.
-0.01000
0.00000
0.01000
0.02000
0.03000
0.04000
0.05000
0.06000
0.07000
0.00000 2.00000 4.00000 6.00000 8.00000 10.00000 12.00000
En
erg
y /
J
time / s
m1 Trial 1: Energy vs time
Gravitational Potential Energy of Load
m1 - trial 1
Translational Kinetic Energy of (car +
load) - m1 Trial 1
Translational Kinetic Energy of load due
to vertical motion
Rotational Kinetic Energy of Wheels
Sum of all energies
Energy lost due to friction

Sreenidhi International School Physics Extended Essay
Candidate Name: Janakirama Venkat Vital Saiteja Raju Indukuri Candidate number: 004976-0027
20
Energy vs distance fallen by load
Figure 8: Distribution of different energies vs distance fallen by load for trial 1 of mass 1
This graph clearly shows the linear relationship between the different energies and the distance fallen by the load. This
verifies my hypothesis. The y intercept is nearly zero in all the linear fit equations, indicating a proportionality between
the different forms of energy and the distance fallen by the load. Thus, as the load falls down, the gravitational potential
energy is converted into translational and rotational kinetic energy, and part of the energy is also dissipated as heat due
to friction between the axle and wheels. The translational kinetic energy of load due to its vertical falling motion is
gravitational potential energy: y = -0.1968x + 0.0633
R² = 1
Translational kinetic energy (car + load) : y = 0.055x +
0.0002
R² = 0.9224
Translational kinetic energy of load due to vertical
motion: y = 0.0005x + 1E-06
R² = 0.5735
rotational kinetic energy of wheels: y = 0.0122x + 4E-05
R² = 0.9224
sum of all energies: y = -0.1291x + 0.0635
R² = 0.9779
energy lost due to friction: y = 0.1291x - 0.0002
R² = 0.9779
-0.01000
0.00000
0.01000
0.02000
0.03000
0.04000
0.05000
0.06000
0.07000
0.00000 0.05000 0.10000 0.15000 0.20000
En
erg
y /
J
distance fallen by load / m
Gravitational Potential Energy - m1
Trial 1
Translational Kinetic Energy of (Car +
Load) - m1 Trial 1
Translational Kinetic Energy of Load
due to vertical motion
Rotational Kinetic Energy of Wheels
Sum of all energies
Energy lost due to friction
Linear (Gravitational Potential Energy
- m1 Trial 1)
Linear (Translational Kinetic Energy
of (Car + Load) - m1 Trial 1)
Linear (Translational Kinetic Energy
of Load due to vertical motion)
Linear (Rotational Kinetic Energy of
Wheels)
Linear (Sum of all energies)
Linear (Energy lost due to friction)

Sreenidhi International School Physics Extended Essay
Candidate Name: Janakirama Venkat Vital Saiteja Raju Indukuri Candidate number: 004976-0027
21
practically negligible because its vertical component of velocity is very small compared to its horizontal component of
velocity throughout its motion.
Distance travelled by gravity car vs time
Figure 9: distance travelled by gravity car vs time for mass m1 - all three trials
Figure 10: distance travelled by gravity car vs time for mass m2 - all three trials
-0.50000
0.00000
0.50000
1.00000
1.50000
2.00000
2.50000
0.00000 2.00000 4.00000 6.00000 8.00000 10.00000 12.00000
dis
tan
ce t
rav
ell
ed
by
gra
vit
y c
ar
/ m
time / s
m1 Trial 1
m1 Trial 2
m1 Trial 3
-0.50000
0.00000
0.50000
1.00000
1.50000
2.00000
2.50000
3.00000
0.00000 1.00000 2.00000 3.00000 4.00000 5.00000 6.00000 7.00000
dis
tan
ce t
rav
ell
ed
by
gra
vit
y c
ar
/ m
time / s
m2 trial 1
m2 Trial 2
m2 Trial 3
Sreenidhi International School Physics Extended Essay
Candidate Name: Janakirama Venkat Vital Saiteja Raju Indukuri Candidate number: 004976-0027
22
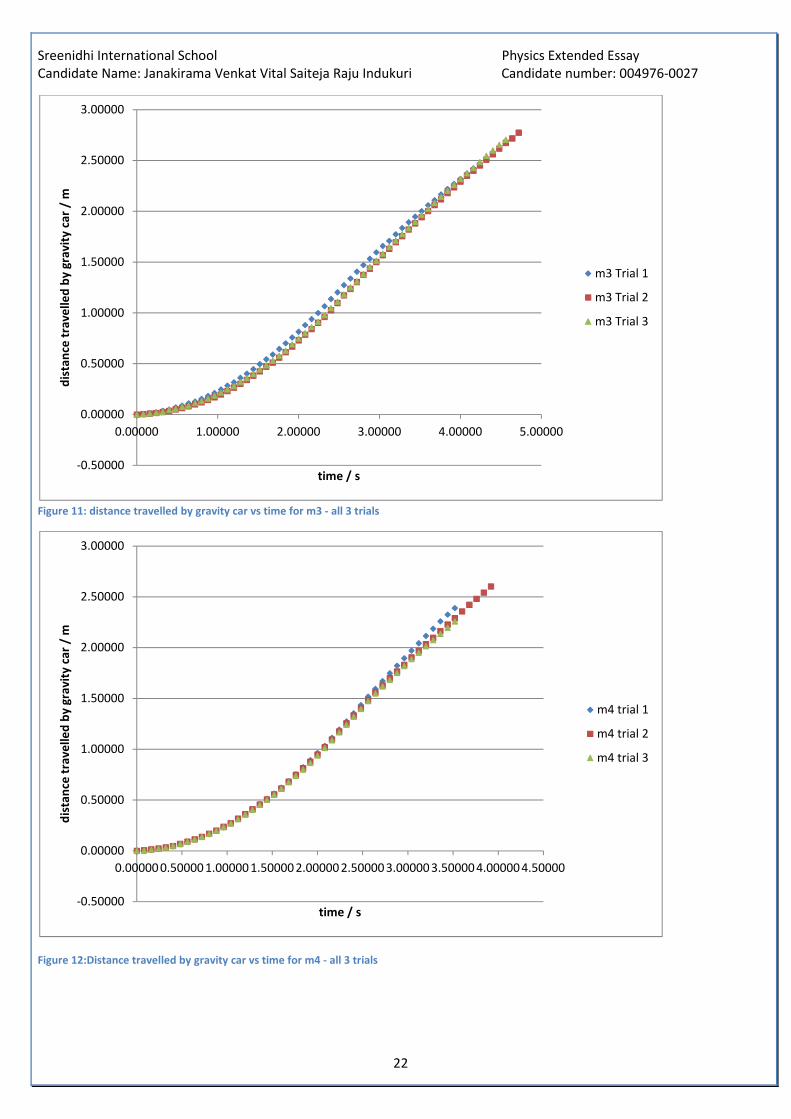
Figure 11: distance travelled by gravity car vs time for m3 - all 3 trials
Figure 12:Distance travelled by gravity car vs time for m4 - all 3 trials
-0.50000
0.00000
0.50000
1.00000
1.50000
2.00000
2.50000
3.00000
0.00000 1.00000 2.00000 3.00000 4.00000 5.00000
dis
tan
ce t
rav
ell
ed
by
gra
vit
y c
ar
/ m
time / s
m3 Trial 1
m3 Trial 2
m3 Trial 3
-0.50000
0.00000
0.50000
1.00000
1.50000
2.00000
2.50000
3.00000
0.00000 0.50000 1.00000 1.50000 2.00000 2.50000 3.00000 3.50000 4.00000 4.50000
dis
tan
ce t
rav
ell
ed
by
gra
vit
y c
ar
/ m
time / s
m4 trial 1
m4 trial 2
m4 trial 3
Sreenidhi International School Physics Extended Essay
Candidate Name: Janakirama Venkat Vital Saiteja Raju Indukuri Candidate number: 004976-0027
23
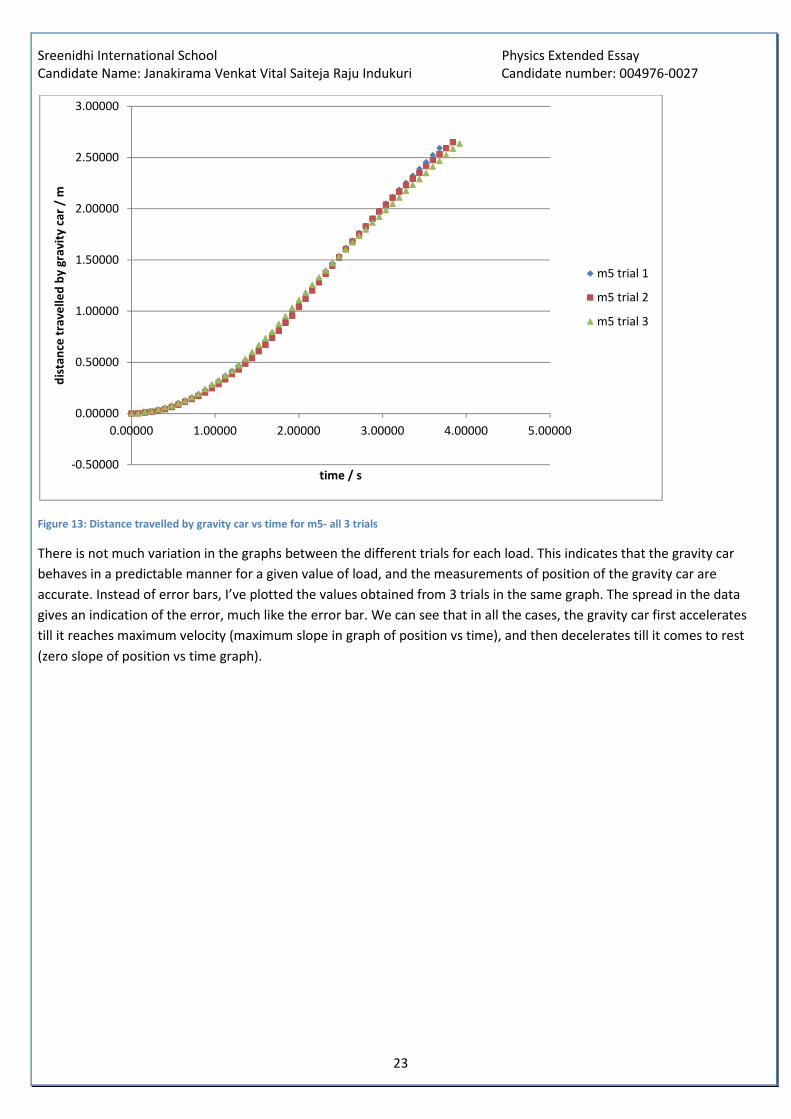
Figure 13: Distance travelled by gravity car vs time for m5- all 3 trials
There is not much variation in the graphs between the different trials for each load. This indicates that the gravity car
behaves in a predictable manner for a given value of load, and the measurements of position of the gravity car are
accurate. Instead of error bars, I’ve plotted the values obtained from 3 trials in the same graph. The spread in the data
gives an indication of the error, much like the error bar. We can see that in all the cases, the gravity car first accelerates
till it reaches maximum velocity (maximum slope in graph of position vs time), and then decelerates till it comes to rest
(zero slope of position vs time graph).
-0.50000
0.00000
0.50000
1.00000
1.50000
2.00000
2.50000
3.00000
0.00000 1.00000 2.00000 3.00000 4.00000 5.00000
dis
tan
ce t
rav
ell
ed
by
gra
vit
y c
ar
/ m
time / s
m5 trial 1
m5 trial 2
m5 trial 3
Sreenidhi International School Physics Extended Essay
Candidate Name: Janakirama Venkat Vital Saiteja Raju Indukuri Candidate number: 004976-0027
24
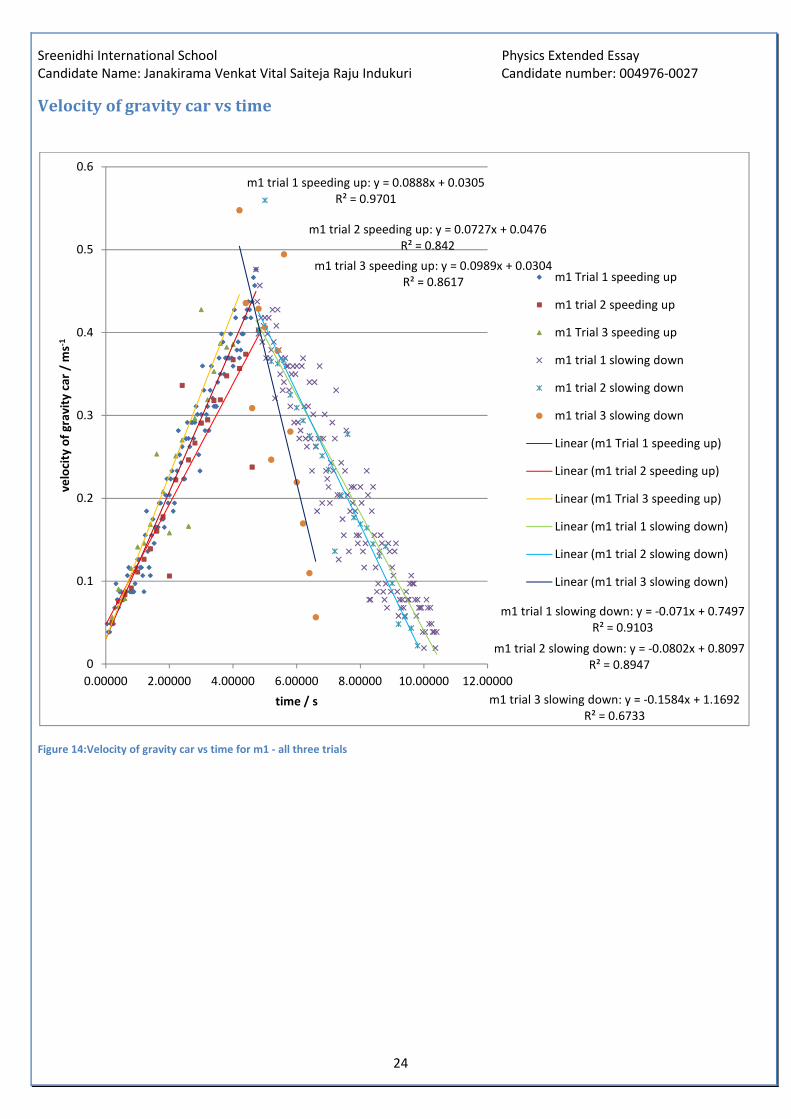
Velocity of gravity car vs time
Figure 14:Velocity of gravity car vs time for m1 - all three trials
m1 trial 1 speeding up: y = 0.0888x + 0.0305
R² = 0.9701
m1 trial 2 speeding up: y = 0.0727x + 0.0476
R² = 0.842
m1 trial 3 speeding up: y = 0.0989x + 0.0304
R² = 0.8617
m1 trial 1 slowing down: y = -0.071x + 0.7497
R² = 0.9103
m1 trial 2 slowing down: y = -0.0802x + 0.8097
R² = 0.8947
m1 trial 3 slowing down: y = -0.1584x + 1.1692
R² = 0.6733
0
0.1
0.2
0.3
0.4
0.5
0.6
0.00000 2.00000 4.00000 6.00000 8.00000 10.00000 12.00000
ve
loci
ty o
f g
rav
ity
ca
r /
ms-1
time / s
m1 Trial 1 speeding up
m1 trial 2 speeding up
m1 Trial 3 speeding up
m1 trial 1 slowing down
m1 trial 2 slowing down
m1 trial 3 slowing down
Linear (m1 Trial 1 speeding up)
Linear (m1 trial 2 speeding up)
Linear (m1 Trial 3 speeding up)
Linear (m1 trial 1 slowing down)
Linear (m1 trial 2 slowing down)
Linear (m1 trial 3 slowing down)

Sreenidhi International School Physics Extended Essay
Candidate Name: Janakirama Venkat Vital Saiteja Raju Indukuri Candidate number: 004976-0027
25
Figure 15:Velocity of the gravity car vs time for m2 - all three trials
m2 trial 1 speeding up: y = 0.2372x + 0.0597
R² = 0.9905
m2 trial 2 speeding up: y = 0.2118x + 0.0557
R² = 0.8531
m2 trial 3 speeding up: y = 0.2408x + 0.0485
R² = 0.8837
m2 trial 1 slowing down: y = -0.1142x + 1.0846
R² = 0.9101
m2 trial 2 slowing down: y = -0.183x + 1.4059
R² = 0.5979
m2 trial 3 slowing down: y = -0.1243x + 1.0867
R² = 0.72540
0.2
0.4
0.6
0.8
1
1.2
0.00000 1.00000 2.00000 3.00000 4.00000 5.00000 6.00000
ve
loci
ty o
f g
rav
ity
ca
r m
s-1
time / s
m2 trial 1 speeding up
m2 Trial 2 speeding up
m2 trial 3 speeding up
m2 trial 1 slowing down
m2 trial 2 slowing down
m2 trial 3 slowing down
Linear (m2 trial 1 speeding up)
Linear (m2 Trial 2 speeding up)
Linear (m2 trial 3 speeding up)
Linear (m2 trial 1 slowing down)
Linear (m2 trial 2 slowing down)
Linear (m2 trial 3 slowing down)

Sreenidhi International School Physics Extended Essay
Candidate Name: Janakirama Venkat Vital Saiteja Raju Indukuri Candidate number: 004976-0027
26
Figure 16:velocity of the gravity car vs time for m3 - all three trials
m3 trial 1 speeding up: y = 0.3384x + 0.0667
R² = 0.9919
m3 trial 2 speeding up: y = 0.3444x + 0.0161
R² = 0.9907
m3 trial 3 speeding up: y = 0.3121x + 0.0558
R² = 0.9807
m3 trial 1 slowing down: y = -0.1359x + 1.1774
R² = 0.916
m3 trial 2 slowing down: y = -0.1042x + 1.1208
R² = 0.908
m3 trial 3 slowing down: y = -0.0965x + 1.107
R² = 0.7961
0
0.1
0.2
0.3
0.4
0.5
0.6
0.7
0.8
0.9
1
0.00000 1.00000 2.00000 3.00000 4.00000 5.00000
ve
loci
ty o
f g
rav
ity
ca
r m
s-1
time / s
m3 Trial 1 speeding up
m3 trial 2 speeding up
m3 trial 3 speeding up
m3 trial 1 slowing down
m3 trial 2 slowing down
m3 trial 3 slowing down
Linear (m3 Trial 1 speeding up)
Linear (m3 trial 2 speeding up)
Linear (m3 trial 3 speeding up)
Linear (m3 trial 1 slowing down)
Linear (m3 trial 2 slowing down)
Linear (m3 trial 3 slowing down)

Sreenidhi International School Physics Extended Essay
Candidate Name: Janakirama Venkat Vital Saiteja Raju Indukuri Candidate number: 004976-0027
27
Figure 17:velocity of gravity car vs time for m4- all three trials
m4 trial 1 speeding up: y = 0.4254x + 0.0494
R² = 0.989
m4 trial 2 speeding up: y = 0.4061x + 0.0617
R² = 0.9831
m4 trial 3 speeding up: y = 0.4307x + 0.038
R² = 0.9963
m4 trial 1 slowing down: y = -0.1576x + 1.391
R² = 0.8996
m4 trial 2 slowing down: y = -0.1341x + 1.261
R² = 0.8641
m4 trial 3 slowing down: y = -0.1997x + 1.4268
R² = 0.8974
0
0.2
0.4
0.6
0.8
1
1.2
0.00000 1.00000 2.00000 3.00000 4.00000 5.00000
ve
loci
ty o
f g
rav
ity
ca
r m
s-1
time / s
m4 trial 1 speeding up
m4 trial 2 speeding up
m4 trial 3 speeding up
m4 trial 1 slowing down
m4 trial 2 slowing down
m4 trial 3 slowing down
Linear (m4 trial 1 speeding up)
Linear (m4 trial 2 speeding up)
Linear (m4 trial 3 speeding up)
Linear (m4 trial 1 slowing down)
Linear (m4 trial 2 slowing down)
Linear (m4 trial 3 slowing down)

Sreenidhi International School Physics Extended Essay
Candidate Name: Janakirama Venkat Vital Saiteja Raju Indukuri Candidate number: 004976-0027
28
Figure 18:velocity of the gravity car vs time for m5 - all three trials
Table 1: Calculating acceleration and deceleration of gravity car from slopes of velocity vs time graphs
Load /
kg
±
0.0000
1 kg
acceleration = slope of velocity-
time graph while speeding up / ms-
2
uncert
ainty
in
mean
accele
ration
= (max
slope -
min
slope)/
2
ms-2
deceleration = slope of velocity-time
graph while slowing down / ms-2
uncertai
nty in
mean
deceler
ation =
(max
slope -
min
slope)/2
ms-2 trial 1 trial 2 trial 3 mean trial 1 trial 2 trial 3 mean
m1 0.02008 0.0888 0.0727 0.0989 0.09 0.01 -0.0710 -0.0802 -0.1584 -0.10 0.04
m2 0.05080 0.2372 0.2118 0.2408 0.23 0.01 -0.1142 -0.1830 -0.1243 -0.14 0.03
m3 0.07030 0.3384 0.3444 0.3121 0.33 0.02 -0.1359 -0.1042 -0.0965 -0.11 0.02
m4 0.10000 0.4254 0.4061 0.4307 0.42 0.01 -0.1576 -0.1341 -0.1997 -0.16 0.03
m5 trial 1 speeding up: y = 0.4902x + 0.0499
R² = 0.9894
m5 trial 2 speeding up: y = 0.4973x + 0.0204
R² = 0.9968
m5 trial 3 speeding up: y = 0.5108x + 0.0453
R² = 0.9838m5 trial 1 slowing down: y = -0.0886x + 1.1497
R² = 0.8326
m5 trial 2 slowing downy = -0.2174x + 1.5137
R² = 0.9437
m5 trial 3 slowing down: y = -0.117x + 1.1442
R² = 0.9002
0
0.2
0.4
0.6
0.8
1
1.2
0.00000 1.00000 2.00000 3.00000 4.00000 5.00000
ve
loci
ty o
f g
rav
ity
ca
r m
s-1
time / s
m5 trial 1 speeding up
m5 trial 2 speeding up
m5 trial 3 speeding up
m5 trial 1 slowing down
m5 trial 2 slowing down
m5 trial 3 slowing down
Linear (m5 trial 1 speeding up)
Linear (m5 trial 2 speeding up)
Linear (m5 trial 3 speeding up)
Linear (m5 trial 1 slowing down)
Linear (m5 trial 2 slowing down)
Linear (m5 trial 3 slowing down)
Sreenidhi International School Physics Extended Essay
Candidate Name: Janakirama Venkat Vital Saiteja Raju Indukuri Candidate number: 004976-0027
29
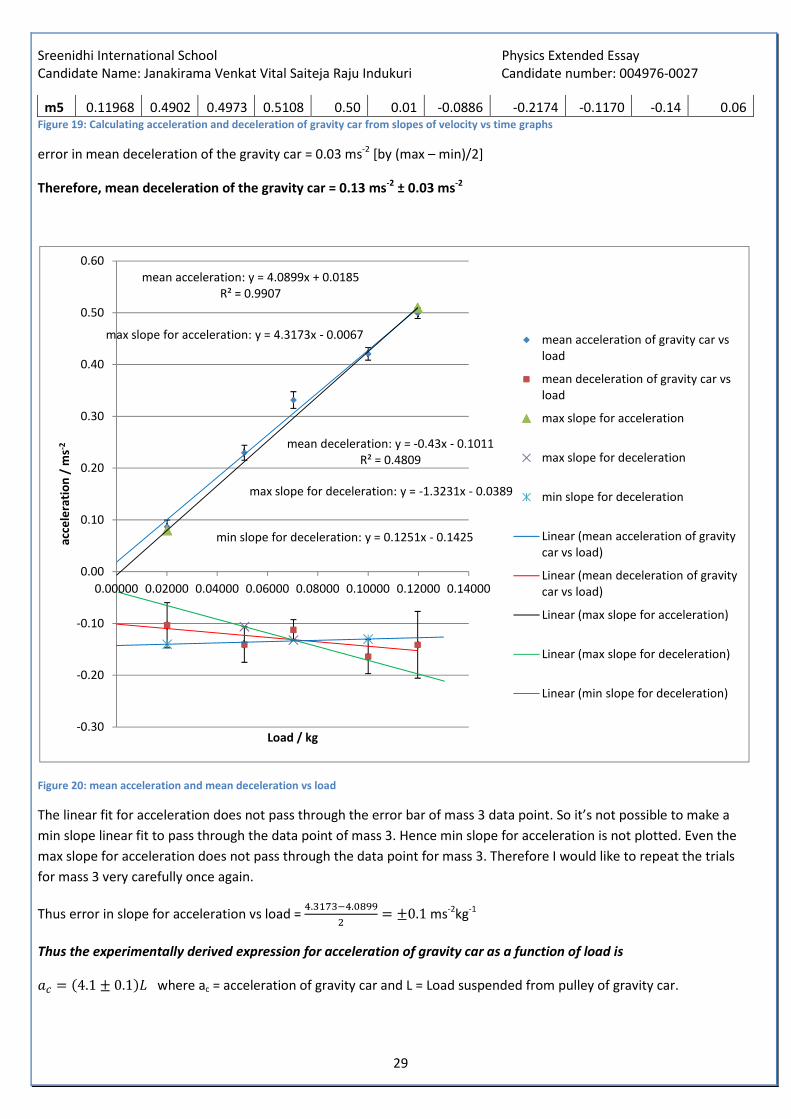
m5 0.11968 0.4902 0.4973 0.5108 0.50 0.01 -0.0886 -0.2174 -0.1170 -0.14 0.06 Figure 19: Calculating acceleration and deceleration of gravity car from slopes of velocity vs time graphs
error in mean deceleration of the gravity car = 0.03 ms-2 [by (max – min)/2]
Therefore, mean deceleration of the gravity car = 0.13 ms-2
± 0.03 ms-2
Figure 20: mean acceleration and mean deceleration vs load
The linear fit for acceleration does not pass through the error bar of mass 3 data point. So it’s not possible to make a
min slope linear fit to pass through the data point of mass 3. Hence min slope for acceleration is not plotted. Even the
max slope for acceleration does not pass through the data point for mass 3. Therefore I would like to repeat the trials
for mass 3 very carefully once again.
Thus error in slope for acceleration vs load = ;.<�=<>;.?@AA
= ±0.1 ms-2kg-1
Thus the experimentally derived expression for acceleration of gravity car as a function of load is
#� = �4.1 ± 0.1�� where ac = acceleration of gravity car and L = Load suspended from pulley of gravity car.
mean acceleration: y = 4.0899x + 0.0185
R² = 0.9907
mean deceleration: y = -0.43x - 0.1011
R² = 0.4809
max slope for acceleration: y = 4.3173x - 0.0067
max slope for deceleration: y = -1.3231x - 0.0389
min slope for deceleration: y = 0.1251x - 0.1425
-0.30
-0.20
-0.10
0.00
0.10
0.20
0.30
0.40
0.50
0.60
0.00000 0.02000 0.04000 0.06000 0.08000 0.10000 0.12000 0.14000
acc
ele
rati
on
/ m
s-2
Load / kg
mean acceleration of gravity car vs
load
mean deceleration of gravity car vs
load
max slope for acceleration
max slope for deceleration
min slope for deceleration
Linear (mean acceleration of gravity
car vs load)
Linear (mean deceleration of gravity
car vs load)
Linear (max slope for acceleration)
Linear (max slope for deceleration)
Linear (min slope for deceleration)

Sreenidhi International School Physics Extended Essay
Candidate Name: Janakirama Venkat Vital Saiteja Raju Indukuri Candidate number: 004976-0027
30
Though the linear fit for deceleration has a small negative slope as expected, which indicates a slight increase in
deceleration magnitude with an increase in Load mass as predicted, the error in slope is too high to make this
conclusion convincing.
The error in slope for deceleration vs load = >�.<<�>?.�D�
= ±0.7 ms-2kg-1
Thus, there is no real correlation between deceleration of gravity car and load, since the slope is 0.4±'. . ms-2
kg-1
.
Velocity of gravity car vs distance travelled
Figure 21:velocity of gravity car vs distance travelled for m1- all three trials
0
0.1
0.2
0.3
0.4
0.5
0.6
-0.50000 0.00000 0.50000 1.00000 1.50000 2.00000 2.50000
ve
loci
ty o
f g
rav
ity
ca
r m
s-1
distance travelled by gravity car / m
m1 Trial 1
m1 Trial 2
m1 Trial 3

Sreenidhi International School Physics Extended Essay
Candidate Name: Janakirama Venkat Vital Saiteja Raju Indukuri Candidate number: 004976-0027
31
Figure 22:velocity of gravity car vs distance travelled for m2 - all three trials
Figure 23:velocity of gravity car vs distance travelled for m3 - all three trials
0
0.2
0.4
0.6
0.8
1
1.2
-0.50000 0.00000 0.50000 1.00000 1.50000 2.00000 2.50000 3.00000
ve
loci
ty o
f g
rav
ity
ca
r m
s-1
distance travelled by Gravity Car / m
m2 trial 1
m2 trial 2
m2 trial 3
0
0.1
0.2
0.3
0.4
0.5
0.6
0.7
0.8
0.9
1
-0.50000 0.00000 0.50000 1.00000 1.50000 2.00000 2.50000 3.00000
ve
loci
ty o
f g
rav
ity
ca
r m
s-1
distance travelled by Gravity Car / m
m3 trial 1
m3 trial 2
m3 trial 3

Sreenidhi International School Physics Extended Essay
Candidate Name: Janakirama Venkat Vital Saiteja Raju Indukuri Candidate number: 004976-0027
32
Figure 24:velocity of gravity car vs distance travelled for m4 - all three trials
Figure 25:velocity of gravity car vs distance travelled for m5 - all three trials
Based on the nature of the graphs, it is clear that a plot of velocity squared vs distance travelled by gravity car would
yield a linear plot, since the acceleration and deceleration are constant.
0
0.2
0.4
0.6
0.8
1
1.2
-0.50000 0.00000 0.50000 1.00000 1.50000 2.00000 2.50000 3.00000
ve
loci
ty o
f g
rav
ity
ca
r m
s-1
distance travelled by Gravity Car / m
m4 trial 1
m4 trial 2
m4 trial 3
0
0.2
0.4
0.6
0.8
1
1.2
-0.50000 0.00000 0.50000 1.00000 1.50000 2.00000 2.50000 3.00000
ve
loci
ty o
f g
rav
ity
ca
r m
s-1
distance travelled by Gravity Car / m
m5 trial 1
m5 trial 2
m5 trial 3

Sreenidhi International School Physics Extended Essay
Candidate Name: Janakirama Venkat Vital Saiteja Raju Indukuri Candidate number: 004976-0027
33
Distance travelled by gravity car vs distance fallen by load
Figure 26:Distance travelled by gravity car vs distance fallen by load for m1 - all three trials
Figure 27:Distance travelled by gravity car vs distance fallen by load for m2- all three trials
m1 Trial 1: y = 4.2218x + 0.0088
R² = 0.9972
m1 Trial 2: y = 4.2944x + 0.0081
R² = 0.999
m1 Trial 3: y = 4.3665x + 0.0106
R² = 0.9986
-0.10000
0.00000
0.10000
0.20000
0.30000
0.40000
0.50000
0.60000
0.70000
0.80000
0.90000
-0.05000 0.00000 0.05000 0.10000 0.15000 0.20000
dis
tan
ce t
rav
ell
ed
by
gra
vit
y c
ar
/ m
distance fallen by load / m
m1 Trial 1
m1 Trial 2
m1 Trial 3
Linear (m1 Trial 1)
Linear (m1 Trial 2)
Linear (m1 Trial 3)
m2 Trial 1: y = 4.4543x + 0.003
R² = 0.999
m2 Trial 2: y = 4.4972x + 0.004
R² = 0.9991
m2 Trial 3: y = 4.303x + 0.0034
R² = 0.9988
-0.10000
0.00000
0.10000
0.20000
0.30000
0.40000
0.50000
0.60000
0.70000
0.80000
0.00000 0.05000 0.10000 0.15000 0.20000
dis
tan
ce t
rav
ell
ed
by
gra
vit
y c
ar
/ m
distance fallen by load / m
m2 Trial 1
m2 Trial 2
m2 Trial 3
Linear (m2 Trial 1)
Linear (m2 Trial 2)
Linear (m2 Trial 3)

Sreenidhi International School Physics Extended Essay
Candidate Name: Janakirama Venkat Vital Saiteja Raju Indukuri Candidate number: 004976-0027
34
Figure 28:Distance travelled by gravity car vs distance fallen by load for m3- all three trials
Figure 29:Distance travelled by gravity car vs distance fallen by load for m4 - all three trials
m3 Trial 1: y = 4.5156x + 0.0141
R² = 0.9976
m3 Trial 2: y = 4.5709x + 0.006
R² = 0.9973
m3 Trial 3: y = 4.5017x + 0.0109
R² = 0.9971
-0.10000
0.00000
0.10000
0.20000
0.30000
0.40000
0.50000
0.60000
0.70000
0.80000
0.90000
-0.05000 0.00000 0.05000 0.10000 0.15000 0.20000
dis
tan
ce t
rav
ell
ed
by
gra
vit
y c
ar
/ m
distance fallen by load / m
m3 Trial 1
m3 Trial 2
m3 Trial 3
Linear (m3 Trial 1)
Linear (m3 Trial 2)
Linear (m3 Trial 3)
m4 trial 1: y = 4.6038x + 0.0165
R² = 0.9958m4 trial 2: y = 4.6024x + 0.0141
R² = 0.997
m4 Trial 3: y = 4.5782x + 0.0107
R² = 0.9974
-0.10000
0.00000
0.10000
0.20000
0.30000
0.40000
0.50000
0.60000
0.70000
0.80000
-0.05000 0.00000 0.05000 0.10000 0.15000 0.20000
dis
tan
ce t
rav
ell
ed
by
gra
vit
y c
ar
/ m
distance fallen by load / m
m4 Trial 1
m4 Trial 2
m4 Trial 3
Linear (m4 Trial 1)
Linear (m4 Trial 2)
Linear (m4 Trial 3)

Sreenidhi International School Physics Extended Essay
Candidate Name: Janakirama Venkat Vital Saiteja Raju Indukuri Candidate number: 004976-0027
35
Figure 30:Distance travelled by gravity car vs distance fallen by load for m5 - all three trials
Table 2: Calculating the mean ratio of distance travelled by gravity car and distance fallen by load (from graph)
Load /
kg
±
0.00001
kg
slope of distance travelled by gravity car vs
distance travelled by load
trial 1 trial 2 trial 3 mean
m1 0.02008 4.2218 4.2944 4.3665 4.29
m2 0.05080 4.4543 4.4972 4.3030 4.42
m3 0.07030 4.5156 4.5709 4.5017 4.53
m4 0.10000 4.6038 4.6024 4.5782 4.59
m5 0.11968 4.5910 4.4163 3.6727 4.23
mean slope = 4.4
error in slope = 0.2
Thus, the measured value of slope (= 4.4) is greater than the predicted value of 3.0 by 46.7% . This means the gravity car
is travelling more distance per fall of load, than predicted. This could mean that the measured distance travelled by the
car is greater than the actual distance, which is quite possible, since there could be error in calibration of the videos.
Improper alignment of the camera with respect to the movement of the gravity car could also lead to this error. The
gravity car doesn’t always go in perfectly straight line, and sometimes veers towards or away from the camera leading to
this error.
m5 trial 1: y = 4.591x - 0.0022
R² = 0.9978
m5 trial 2: y = 4.4163x + 0.0124
R² = 0.9974
m5 trial 3: y = 3.6727x - 0.0185
R² = 0.991
-0.10000
0.00000
0.10000
0.20000
0.30000
0.40000
0.50000
0.60000
0.70000
0.80000
0.00000 0.05000 0.10000 0.15000 0.20000
dis
tan
ce t
rav
ell
ed
by
gra
vit
y c
ar
/ m
distance fallen by load / m
m5 Trial 1
m5 Trial 2
m5 Trial 3
Linear (m5 Trial 1)
Linear (m5 Trial 2)
Linear (m5 Trial 3)

Sreenidhi International School Physics Extended Essay
Candidate Name: Janakirama Venkat Vital Saiteja Raju Indukuri Candidate number: 004976-0027
36
Distance fallen by load vs time
Figure 31:Distance fallen by load vs time for m1 - all three trials
Figure 32:Distance fallen by load vs time for m2 - all three trials
m1 Trial 1: y = 0.0116x2 + 0.0026x + 0.0014
R² = 0.9975
m1 Trial 2: y = 0.0105x2 + 0.0045x - 0.0008
R² = 0.9976
m1 Trial 3: y = 0.0112x2 + 0.0065x - 0.0009
R² = 0.9986
-0.05000
0.00000
0.05000
0.10000
0.15000
0.20000
0.00000 0.50000 1.00000 1.50000 2.00000 2.50000 3.00000 3.50000 4.00000
dis
tan
ce f
all
en
by
lo
ad
/ m
time / s
m1 Trial 1
m1 Trial 2
m1 Trial 3
Poly. (m1 Trial 1)
Poly. (m1 Trial 2)
Poly. (m1 Trial 3)
m2 Trial 1: y = 0.0289x2 + 0.0088x + 0.0005
R² = 0.9991
m2 Trial 2: y = 0.0291x2 + 0.0014x - 0.001
R² = 0.9986
m2 Trial 3: y = 0.0292x2 + 0.0097x - 0.0009
R² = 0.9983
-0.02000
0.00000
0.02000
0.04000
0.06000
0.08000
0.10000
0.12000
0.14000
0.16000
0.18000
0.20000
0.00000 0.50000 1.00000 1.50000 2.00000 2.50000
dis
tan
ce f
all
en
by
lo
ad
/ m
time / s
m2 Trial 1
m2 Trial 2
m2 Trial 3
Poly. (m2 Trial 1)
Poly. (m2 Trial 2)
Poly. (m2 Trial 3)

Sreenidhi International School Physics Extended Essay
Candidate Name: Janakirama Venkat Vital Saiteja Raju Indukuri Candidate number: 004976-0027
37
Figure 33:Distance fallen by load vs time for m3 - all three trials
Figure 34:Distance fallen by load vs time for m4 - all three trials
m3 Trial 1: y = 0.0417x2 + 0.0069x - 0.0011
R² = 0.9979
m3 Trial 2: y = 0.0406x2 - 0.0023x + 0.0008
R² = 0.9969
m3 Trial 3: y = 0.041x2 + 0.0002x + 0.0003
R² = 0.9975
-0.02000
0.00000
0.02000
0.04000
0.06000
0.08000
0.10000
0.12000
0.14000
0.16000
0.18000
0.00000 0.50000 1.00000 1.50000 2.00000 2.50000
dis
tan
ce f
all
en
by
lo
ad
/ m
time / s
m3 Trial 1
m3 Trial 2
m3 Trial 3
Poly. (m3 Trial 1)
Poly. (m3 Trial 2)
Poly. (m3 Trial 3)
m4 Trial 1: y = 0.0577x2 - 0.0088x + 0.0009
R² = 0.997
m4 Trial 2: y = 0.0537x2 - 0.0035x + 0.0007
R² = 0.9973
m4 Trial 3: y = 0.0531x2 - 0.0031x + 0.0015
R² = 0.998
-0.02000
0.00000
0.02000
0.04000
0.06000
0.08000
0.10000
0.12000
0.14000
0.16000
0.18000
0.00000 0.50000 1.00000 1.50000 2.00000
dis
tan
ce f
all
en
by
lo
ad
/ m
time / s
m4 Trial 1
m4 Trial 2
m4 Trial 3
Poly. (m4 Trial 1)
Poly. (m4 Trial 2)
Poly. (m4 Trial 3)

Sreenidhi International School Physics Extended Essay
Candidate Name: Janakirama Venkat Vital Saiteja Raju Indukuri Candidate number: 004976-0027
38
Figure 35:Distance fallen by load vs time for m5 - all three trials
Table 3: finding the downward acceleration of load from distance fallen by load vs time graphs
Load /
kg
±
0.00001
kg
coefficient of t2 in quadratic fit of distance
travelled by gravity car vs time, c / ms-2
error in c
[= (max-
min)/2]
∆c / ms-2
downward
acceleration
of load, aL(=
2*c)
/ ms-2
error in
downward
acceleration
of load, aL
(= 2*∆c)
/ ms-2 trial 1 trial 2 trial 3 mean
m1 0.02008 0.0116 0.0105 0.0112 0.011 0.001 0.022 0.001
m2 0.05080 0.0289 0.0291 0.0292 0.029 0.000 0.058 0.000
m3 0.07030 0.0417 0.0406 0.0410 0.041 0.001 0.082 0.001
m4 0.10000 0.0577 0.0537 0.0531 0.055 0.002 0.110 0.005
m5 0.11968 0.0517 0.0651 0.0479 0.055 0.009 0.110 0.017
m5 Trial 1: y = 0.0517x2 + 0.0139x - 0.0006
R² = 0.9966
m5 Trial 2: y = 0.0651x2 - 0.0104x + 0.0014
R² = 0.9985
m5 Trial 3: y = 0.0479x2 + 0.0406x - 0.0011
R² = 0.9969
-0.02000
0.00000
0.02000
0.04000
0.06000
0.08000
0.10000
0.12000
0.14000
0.16000
0.18000
0.00000 0.50000 1.00000 1.50000 2.00000
dis
tan
ce f
all
en
by
lo
ad
/ m
time / s
m5 Trial 1
m5 Trial 2
m5 Trial 3
Poly. (m5 Trial 1)
Poly. (m5 Trial 2)
Poly. (m5 Trial 3)
Sreenidhi International School Physics Extended Essay
Candidate Name: Janakirama Venkat Vital Saiteja Raju Indukuri Candidate number: 004976-0027
39
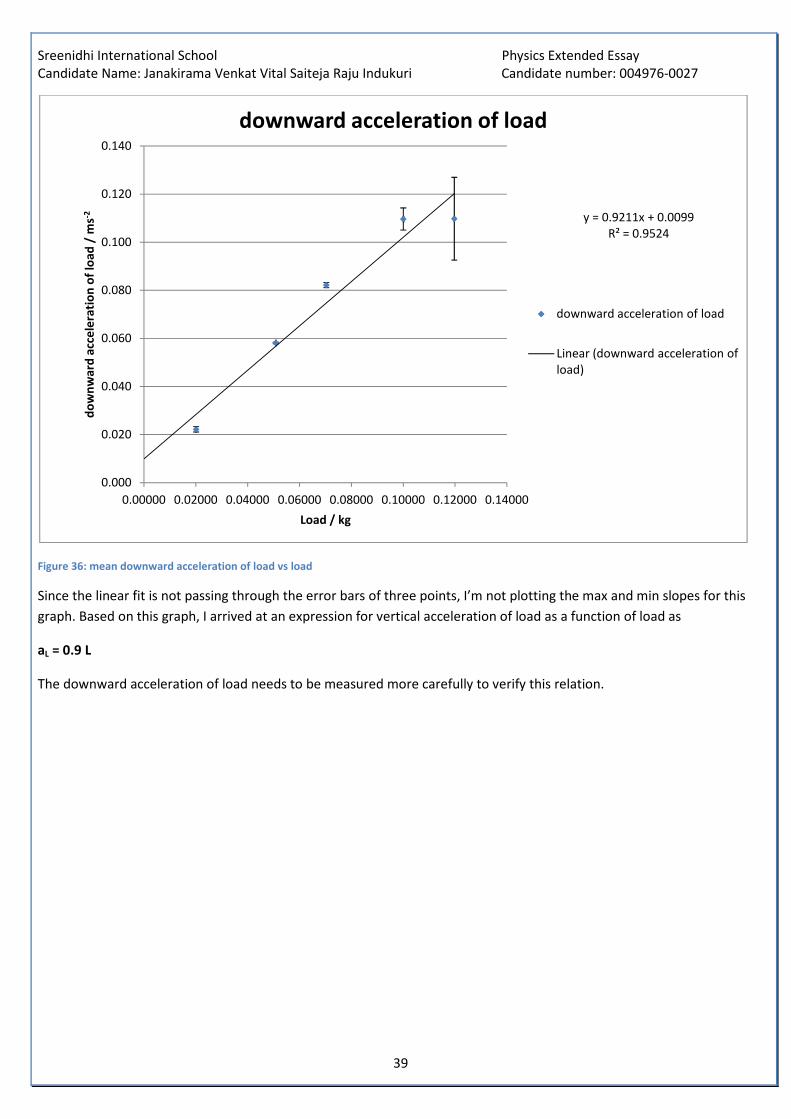
Figure 36: mean downward acceleration of load vs load
Since the linear fit is not passing through the error bars of three points, I’m not plotting the max and min slopes for this
graph. Based on this graph, I arrived at an expression for vertical acceleration of load as a function of load as
aL = 0.9 L
The downward acceleration of load needs to be measured more carefully to verify this relation.
y = 0.9211x + 0.0099
R² = 0.9524
0.000
0.020
0.040
0.060
0.080
0.100
0.120
0.140
0.00000 0.02000 0.04000 0.06000 0.08000 0.10000 0.12000 0.14000
do
wn
wa
rd a
cce
lera
tio
n o
f lo
ad
/ m
s-2
Load / kg
downward acceleration of load
downward acceleration of load
Linear (downward acceleration of
load)

Sreenidhi International School Physics Extended Essay
Candidate Name: Janakirama Venkat Vital Saiteja Raju Indukuri Candidate number: 004976-0027
40
Load vertical velocity vs time
Figure 37: Load vertical velocity vs time for m1 – all three trials
The data points for velocity are very scattered because the velocity is calculated from the difference in position and time.
since the time interval are very small, the changes in position are also very small, and hence the relative error of
difference in position and time are high, leading to high error in velocities.
Figure 38: Load vertical velocity vs time for m2 – all three trials
-0.14
-0.12
-0.1
-0.08
-0.06
-0.04
-0.02
0
0.02
0.00000 0.50000 1.00000 1.50000 2.00000 2.50000 3.00000 3.50000 4.00000
loa
d v
ert
ica
l v
elo
city
m.s
-1
time / s
m1 Trial 1
m1 Trial 2
m1 Trial 3
-0.16
-0.14
-0.12
-0.1
-0.08
-0.06
-0.04
-0.02
0
0.00000 0.50000 1.00000 1.50000 2.00000 2.50000
Loa
d v
ert
ica
l v
elo
city
ms-1
time / s
m2 Trial 1
m2 Trial 2
m2 Trial 3

Sreenidhi International School Physics Extended Essay
Candidate Name: Janakirama Venkat Vital Saiteja Raju Indukuri Candidate number: 004976-0027
41
Henceforth, I have increased the time interval between data points to reduce the relative error in position and time, and
thereby reduce the error in velocity.
Figure 39:Load vertical velocity vs time for m3– all three trials
Since the load tends to swing when the gravity car accelerates forward, the graph of vertical velocity vs time shows
bumps of bigger size for greater accelerations (greater loads).
Figure 40:Load vertical velocity vs time for m4 – all three trials
-0.25
-0.2
-0.15
-0.1
-0.05
0
0.00000 0.50000 1.00000 1.50000 2.00000
Loa
d v
ert
ica
l v
elo
city
ms-1
time / s
m3 Trial 1
m3 Trial 2
m3 Trial 3
-0.2
-0.18
-0.16
-0.14
-0.12
-0.1
-0.08
-0.06
-0.04
-0.02
0
0.00000 0.20000 0.40000 0.60000 0.80000 1.00000 1.20000 1.40000 1.60000 1.80000
Loa
d v
ert
ica
l v
elo
city
ms-1
time / s
m4 Trial 1
m4 Trial 2
m4 Trial 3

Sreenidhi International School Physics Extended Essay
Candidate Name: Janakirama Venkat Vital Saiteja Raju Indukuri Candidate number: 004976-0027
42
Figure 41:Load vertical velocity vs time for m5 – all three trials
Since the curve is not linear due to the bumps, I’m not making linear fits for these graphs.
Rotational Kinetic Energy vs Translational Kinetic Energy
Figure 42:Rotational kinetic energy vs translational kinetic energy for m1 – all three trials
-0.25
-0.2
-0.15
-0.1
-0.05
0
0.00000 0.20000 0.40000 0.60000 0.80000 1.00000 1.20000 1.40000 1.60000
Loa
d v
ert
ica
l v
elo
city
ms-1
time / s
m5 Trial 1
m5 Trial 2
m5 Trial 3
m1 Trial 1: y = 0.2226x + 5E-18
R² = 1
m1 Trial 2: y = 0.2226x + 6E-19
R² = 1
m1 Trial 3: y = 0.2226x - 4E-19
R² = 1
-0.00100
0.00000
0.00100
0.00200
0.00300
0.00400
0.00500
0.00600
0.00000 0.00500 0.01000 0.01500 0.02000 0.02500
rota
tio
na
l k
ine
tic
en
erg
y o
f w
he
els
of
gra
vit
y c
ar
/ J
Translational Kinetic Energy of Gravity car with load / J
m1 Trial 1
m1 trial 2
m1 Trial 3
Linear (m1 Trial 1)
Linear (m1 trial 2)
Linear (m1 Trial 3)

Sreenidhi International School Physics Extended Essay
Candidate Name: Janakirama Venkat Vital Saiteja Raju Indukuri Candidate number: 004976-0027
43
Figure 43: Rotational kinetic energy vs translational kinetic energy for m2 – all three trials
Figure 44: Rotational kinetic energy vs translational kinetic energy for m3 – all three trials
m2 Trial 1: y = 0.1841x
R² = 1
m2 Trial 2: y = 0.1841x - 3E-18
R² = 1
m2 Trial 3: y = 0.1841x - 5E-18
R² = 1
0.00000
0.00200
0.00400
0.00600
0.00800
0.01000
0.01200
0.01400
0.01600
0.01800
0.00000 0.02000 0.04000 0.06000 0.08000 0.10000
Ro
tati
on
al
kin
eti
c e
ne
rgy
of
wh
ee
ls o
f g
rav
ity
ca
r /
J
Translational kinetic energy of Gravity car with load / J
m2 Trial 1
m2 Trial 2
m2 Trial 3
Linear (m2 Trial 1)
Linear (m2 Trial 2)
Linear (m2 Trial 3)
m3 Trial 1: y = 0.1659x - 1E-17
R² = 1
m3 Trial 2: y = 0.1659x + 4E-18
R² = 1
m3 Trial 3: y = 0.1659x
R² = 1
-0.00200
0.00000
0.00200
0.00400
0.00600
0.00800
0.01000
0.01200
0.01400
0.01600
0.00000 0.02000 0.04000 0.06000 0.08000 0.10000Ro
tati
on
al
Kin
eti
c E
ne
rgy
of
wh
ee
ls o
f g
rav
ity
ca
r
/ J
Translational Kinetic Energy of Gravity car with load / J
m3 Trial 1
m3 Trial 2
m3 Trial 3
Linear (m3 Trial 1)
Linear (m3 Trial 2)
Linear (m3 Trial 3)

Sreenidhi International School Physics Extended Essay
Candidate Name: Janakirama Venkat Vital Saiteja Raju Indukuri Candidate number: 004976-0027
44
Figure 45: Rotational kinetic energy vs translational kinetic energy for m4 – all three trials
Figure 46: Rotational kinetic energy vs translational kinetic energy for m5 – all three trials
m4 trial 1: y = 0.1442x
R² = 1
m4 trial 2: y = 0.1442x
R² = 1
m4 Trial 3: y = 0.1442x
R² = 1
-0.00200
0.00000
0.00200
0.00400
0.00600
0.00800
0.01000
0.01200
0.01400
0.01600
0.01800
0.02000
0.00000 0.02000 0.04000 0.06000 0.08000 0.10000 0.12000 0.14000
Ro
tati
on
al
Kin
eti
c E
ne
rgy
of
wh
ee
ls o
f g
rav
ity
ca
r /
J
Translational Kinetic Energy of Gravity Car with Load / J
m4 Trial 1
m4 Trial 2
m4 Trial 3
Linear (m4 Trial
1)
m5 Trial 1: y = 0.1326x - 4E-17
R² = 1
m5 Trial 2: y = 0.1326x
R² = 1
m5 Trial 3: y = 0.1326x - 2E-17
R² = 1
-0.00200
0.00000
0.00200
0.00400
0.00600
0.00800
0.01000
0.01200
0.01400
0.01600
0.01800
0.00000 0.02000 0.04000 0.06000 0.08000 0.10000 0.12000 0.14000
Ro
tati
on
al
kin
eti
c e
ne
rgy
of
wh
ee
ls o
f g
rav
ity
ca
r /
J
Translational Kinetic Energy of Gravity Car with load / J
m5 Trial 1
m5 Trial 2
m5 Trial 3
Linear (m5 Trial 1)
Linear (m5 Trial 2)
Linear (m5 Trial 3)

Sreenidhi International School Physics Extended Essay
Candidate Name: Janakirama Venkat Vital Saiteja Raju Indukuri Candidate number: 004976-0027
45
Table 4: Calculating measured and predicted ratios of rotational and translational kinetic energies of gravity car for different loads
mass of wheel,
mw / kg = 0.01634± 0.00001
mass of empty
gravity car, M /
kg = 0.1267± 0.00001
Load L /
kg
±
0.00001
kg
measured KR/KT = slope of KR vs KT
graph
uncertainty in
measured
KR/KT = (max
slope - min
slope)/2
Predicted
KR/KT =
(2mw)/(L+M) trial 1 trial 2 trial 3 mean
m1 0.02008 0.2226 0.2226 0.2226 0.2226 0.00 0.22265
m2 0.05080 0.1841 0.1841 0.1841 0.1841 0.00 0.18411
m3 0.07030 0.1659 0.1659 0.1659 0.1659 0.00 0.16589
m4 0.10000 0.1442 0.1442 0.1442 0.1442 0.00 0.14416
m5 0.11968 0.1326 0.1326 0.1326 0.1326 0.00 0.13264
Figure 47: Comparing measured and predicted values of ratio of rotational and translational kinetic energies of gravity car for different loads
The graph shows that the predicted and measured values of the ratio of rotational and translational kinetic energy for
different loads match perfectly! The error in measured values is zero, when calculated using the (max-min)/2 method,
since there is no variation in slope in the different trials for each mass.
0.0000
0.0500
0.1000
0.1500
0.2000
0.2500
0.02008 0.05080 0.07030 0.10000 0.11968
rati
o o
f ro
tati
on
al
kin
eti
c e
ne
rgy
an
d
tra
nsl
ati
on
al
kin
eti
c e
ne
rgy
of
gra
vit
y c
ar,
KR/K
T
load L / kg
measured KR/KT
predicted KR/KT

Sreenidhi International School Physics Extended Essay
Candidate Name: Janakirama Venkat Vital Saiteja Raju Indukuri Candidate number: 004976-0027
46
Conclusion 1. The ratio of rotational and kinetic energies of the gravity car vary with load exactly as predicted. This ratio decreases
with increasing loads.
2. The load swings more for increasing load values due to increasing acceleration of the gravity car.
3. The downward acceleration of the load was found to be proportional to the load, and was found to obey aL = 0.9 L
where aL = downward acceleration of load, and L = load.
4. The gravity car travelled more distance per vertical distance fallen by the load than predicted. The predicted ratio for
distance travelled by gravity and distance fallen by load was 3.0, whereas the measured value was 4.4 ± 0.2 . Thus, the
discrepancy is 46.7%, and could be due to error in measuring the position of the gravity car using the TRACKER software.
The error could be due to the gravity car not travelling in a straight line.
5. The gravity has a constant acceleration and deceleration phase. The acceleration happens till the load hits the ground.
Thereafter only deceleration happens due to friction between the axle and wheels.
The experimentally derived expression for acceleration of gravity car as a function of load is
#� = �4.1 ± 0.1�� where ac = acceleration of gravity car and L = Load suspended from pulley of gravity car.
The average deceleration was found to be 0.13 ms-2 ± 0.03 ms-2.
6. The different forms of energies possessed by the gravity car varied linearly with distance fallen by the load as
predicted. As the gravitational potential energy decreased linearly with the distance fallen by the load, its translational
and rotational kinetic energy increased linearly. The energy dissipated due to friction also increased linearly with distance
fallen by load. The total energy possessed by the gravity car also decreased linearly with distance fallen by load during the
fall of the load.
Evaluation
1. Video capture and analysis using TRACKER gives very accurate data about the motion of objects.
2. Accuracy could be further improved by taking the videos in brighter conditions, and making the alignment of camera
more perfect, and by ensuring that the gravity car moved in a straight line.
3. The energy variation graphs could be plotted for all the trials and loads.
4. Multiple pulley systems could be used to power the gravity car to achieve greater range and acceleration, and their
motion could be investigated.
Bibliography
"Gravity Powered Cars." YouTube. YouTube. Web. 11 Mar. 2014.
<http://www.youtube.com/playlist?list=PLA5a2xPRSrB1zzCqDckAnlOzz8iViuM94>.
P.K, Sharma. "Rotational Kinematics - Concept of Rolling." Understanding Physics Mechanics - Part B. 2009 ed. Prakash
Publications, 2010. 158-160. Print.

Sreenidhi International School Physics Extended Essay
Candidate Name: Janakirama Venkat Vital Saiteja Raju Indukuri Candidate number: 004976-0027
47
DC, Pandey. "Mechanics of Rotational Motion - Combined Translational and Rotational Motion of a Rigid
Body." Understanding Physics Mechanics - Part 2. 2008 ed. Meerut: Arihant Prakashan, 2008. 34,35. Print.
Appendix
Raw Data
The five different values of Load that were used in the investigation are:
Table 5 The different loads used in the investigation
Load mass / kg
± 0.00001 kg
m1 0.02008
m2 0.05080
m3 0.07030
m4 0.10000
m5 0.11968
Table 6: Raw data for trial 1 of load m1
time t / s
Distance
travelled
by
Gravity
Car dc /
m
Velocity
of
Gravity
Car, vc /
ms-1
x
coordinate
of Load x /
m
y
coordinate
of Load y /
m
x
component
of load
velocity
ms-1
y
component
of load
velocity
ms-1
magnitude
of load
velocity
ms-1
0.00000 0.00026 0.06676 0.26160
0.04000 0.00181 0.04865 0.06823 0.26160 0.04898 -0.00013 0.04898
0.08000 0.00415 0.03883 0.07067 0.26159 0.07957 -0.00633 0.07982
0.12000 0.00492 0.03883 0.07459 0.26109 0.06112 -0.03689 0.07139
0.16000 0.00726 0.04867 0.07556 0.25864 0.03051 -0.03681 0.04781
0.20000 0.00881 0.04862 0.07703 0.25815 0.05508 -0.00627 0.05544
0.24000 0.01115 0.04855 0.07997 0.25814 0.05507 -0.01239 0.05644
0.28000 0.01270 0.06796 0.08144 0.25716 0.06119 -0.01240 0.06243
0.32000 0.01658 0.09715 0.08487 0.25715 0.07959 -0.00021 0.07959
0.36000 0.02047 0.07786 0.08780 0.25714 0.07340 -0.02468 0.07744
0.40000 0.02281 0.06814 0.09074 0.25517 0.06726 -0.03078 0.07397
0.44000 0.02592 0.08740 0.09319 0.25468 0.06734 -0.00017 0.06734
0.48000 0.02980 0.08743 0.09613 0.25516 0.07960 0.00592 0.07982
0.52000 0.03291 0.07778 0.09955 0.25515 0.08566 -0.01859 0.08765
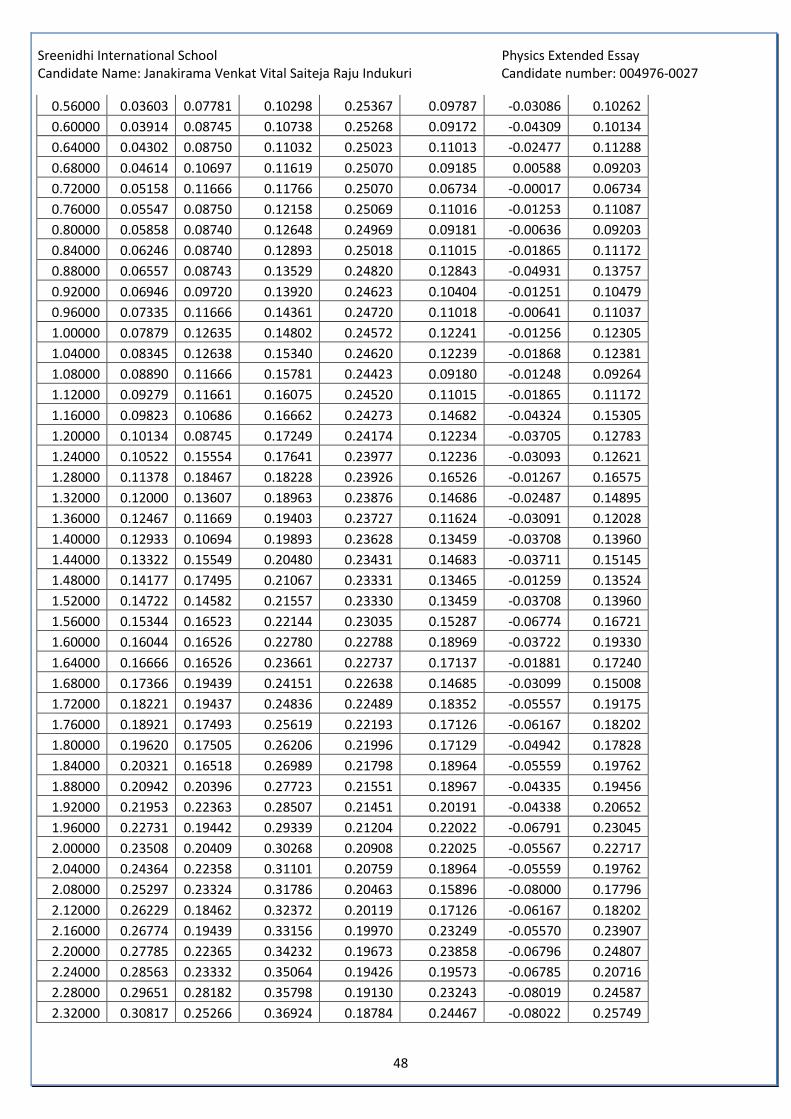
Sreenidhi International School Physics Extended Essay
Candidate Name: Janakirama Venkat Vital Saiteja Raju Indukuri Candidate number: 004976-0027
48
0.56000 0.03603 0.07781 0.10298 0.25367 0.09787 -0.03086 0.10262
0.60000 0.03914 0.08745 0.10738 0.25268 0.09172 -0.04309 0.10134
0.64000 0.04302 0.08750 0.11032 0.25023 0.11013 -0.02477 0.11288
0.68000 0.04614 0.10697 0.11619 0.25070 0.09185 0.00588 0.09203
0.72000 0.05158 0.11666 0.11766 0.25070 0.06734 -0.00017 0.06734
0.76000 0.05547 0.08750 0.12158 0.25069 0.11016 -0.01253 0.11087
0.80000 0.05858 0.08740 0.12648 0.24969 0.09181 -0.00636 0.09203
0.84000 0.06246 0.08740 0.12893 0.25018 0.11015 -0.01865 0.11172
0.88000 0.06557 0.08743 0.13529 0.24820 0.12843 -0.04931 0.13757
0.92000 0.06946 0.09720 0.13920 0.24623 0.10404 -0.01251 0.10479
0.96000 0.07335 0.11666 0.14361 0.24720 0.11018 -0.00641 0.11037
1.00000 0.07879 0.12635 0.14802 0.24572 0.12241 -0.01256 0.12305
1.04000 0.08345 0.12638 0.15340 0.24620 0.12239 -0.01868 0.12381
1.08000 0.08890 0.11666 0.15781 0.24423 0.09180 -0.01248 0.09264
1.12000 0.09279 0.11661 0.16075 0.24520 0.11015 -0.01865 0.11172
1.16000 0.09823 0.10686 0.16662 0.24273 0.14682 -0.04324 0.15305
1.20000 0.10134 0.08745 0.17249 0.24174 0.12234 -0.03705 0.12783
1.24000 0.10522 0.15554 0.17641 0.23977 0.12236 -0.03093 0.12621
1.28000 0.11378 0.18467 0.18228 0.23926 0.16526 -0.01267 0.16575
1.32000 0.12000 0.13607 0.18963 0.23876 0.14686 -0.02487 0.14895
1.36000 0.12467 0.11669 0.19403 0.23727 0.11624 -0.03091 0.12028
1.40000 0.12933 0.10694 0.19893 0.23628 0.13459 -0.03708 0.13960
1.44000 0.13322 0.15549 0.20480 0.23431 0.14683 -0.03711 0.15145
1.48000 0.14177 0.17495 0.21067 0.23331 0.13465 -0.01259 0.13524
1.52000 0.14722 0.14582 0.21557 0.23330 0.13459 -0.03708 0.13960
1.56000 0.15344 0.16523 0.22144 0.23035 0.15287 -0.06774 0.16721
1.60000 0.16044 0.16526 0.22780 0.22788 0.18969 -0.03722 0.19330
1.64000 0.16666 0.16526 0.23661 0.22737 0.17137 -0.01881 0.17240
1.68000 0.17366 0.19439 0.24151 0.22638 0.14685 -0.03099 0.15008
1.72000 0.18221 0.19437 0.24836 0.22489 0.18352 -0.05557 0.19175
1.76000 0.18921 0.17493 0.25619 0.22193 0.17126 -0.06167 0.18202
1.80000 0.19620 0.17505 0.26206 0.21996 0.17129 -0.04942 0.17828
1.84000 0.20321 0.16518 0.26989 0.21798 0.18964 -0.05559 0.19762
1.88000 0.20942 0.20396 0.27723 0.21551 0.18967 -0.04335 0.19456
1.92000 0.21953 0.22363 0.28507 0.21451 0.20191 -0.04338 0.20652
1.96000 0.22731 0.19442 0.29339 0.21204 0.22022 -0.06791 0.23045
2.00000 0.23508 0.20409 0.30268 0.20908 0.22025 -0.05567 0.22717
2.04000 0.24364 0.22358 0.31101 0.20759 0.18964 -0.05559 0.19762
2.08000 0.25297 0.23324 0.31786 0.20463 0.15896 -0.08000 0.17796
2.12000 0.26229 0.18462 0.32372 0.20119 0.17126 -0.06167 0.18202
2.16000 0.26774 0.19439 0.33156 0.19970 0.23249 -0.05570 0.23907
2.20000 0.27785 0.22365 0.34232 0.19673 0.23858 -0.06796 0.24807
2.24000 0.28563 0.23332 0.35064 0.19426 0.19573 -0.06785 0.20716
2.28000 0.29651 0.28182 0.35798 0.19130 0.23243 -0.08019 0.24587
2.32000 0.30817 0.25266 0.36924 0.18784 0.24467 -0.08022 0.25749
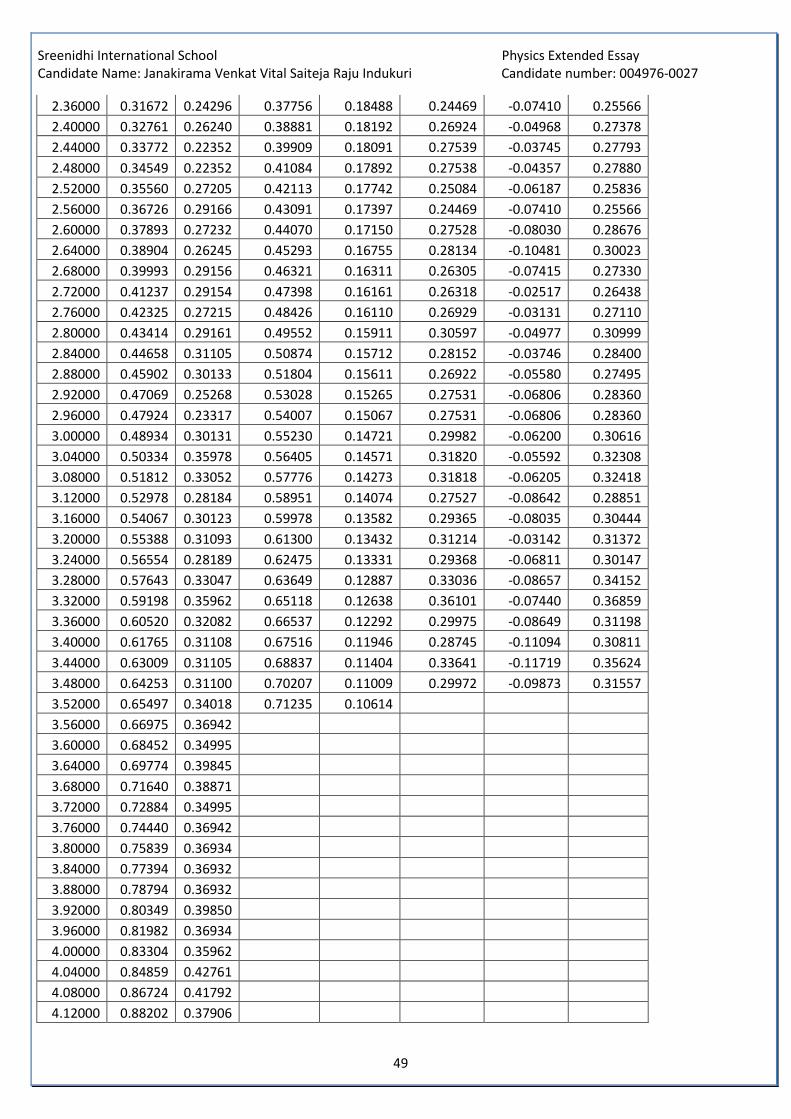
Sreenidhi International School Physics Extended Essay
Candidate Name: Janakirama Venkat Vital Saiteja Raju Indukuri Candidate number: 004976-0027
49
2.36000 0.31672 0.24296 0.37756 0.18488 0.24469 -0.07410 0.25566
2.40000 0.32761 0.26240 0.38881 0.18192 0.26924 -0.04968 0.27378
2.44000 0.33772 0.22352 0.39909 0.18091 0.27539 -0.03745 0.27793
2.48000 0.34549 0.22352 0.41084 0.17892 0.27538 -0.04357 0.27880
2.52000 0.35560 0.27205 0.42113 0.17742 0.25084 -0.06187 0.25836
2.56000 0.36726 0.29166 0.43091 0.17397 0.24469 -0.07410 0.25566
2.60000 0.37893 0.27232 0.44070 0.17150 0.27528 -0.08030 0.28676
2.64000 0.38904 0.26245 0.45293 0.16755 0.28134 -0.10481 0.30023
2.68000 0.39993 0.29156 0.46321 0.16311 0.26305 -0.07415 0.27330
2.72000 0.41237 0.29154 0.47398 0.16161 0.26318 -0.02517 0.26438
2.76000 0.42325 0.27215 0.48426 0.16110 0.26929 -0.03131 0.27110
2.80000 0.43414 0.29161 0.49552 0.15911 0.30597 -0.04977 0.30999
2.84000 0.44658 0.31105 0.50874 0.15712 0.28152 -0.03746 0.28400
2.88000 0.45902 0.30133 0.51804 0.15611 0.26922 -0.05580 0.27495
2.92000 0.47069 0.25268 0.53028 0.15265 0.27531 -0.06806 0.28360
2.96000 0.47924 0.23317 0.54007 0.15067 0.27531 -0.06806 0.28360
3.00000 0.48934 0.30131 0.55230 0.14721 0.29982 -0.06200 0.30616
3.04000 0.50334 0.35978 0.56405 0.14571 0.31820 -0.05592 0.32308
3.08000 0.51812 0.33052 0.57776 0.14273 0.31818 -0.06205 0.32418
3.12000 0.52978 0.28184 0.58951 0.14074 0.27527 -0.08642 0.28851
3.16000 0.54067 0.30123 0.59978 0.13582 0.29365 -0.08035 0.30444
3.20000 0.55388 0.31093 0.61300 0.13432 0.31214 -0.03142 0.31372
3.24000 0.56554 0.28189 0.62475 0.13331 0.29368 -0.06811 0.30147
3.28000 0.57643 0.33047 0.63649 0.12887 0.33036 -0.08657 0.34152
3.32000 0.59198 0.35962 0.65118 0.12638 0.36101 -0.07440 0.36859
3.36000 0.60520 0.32082 0.66537 0.12292 0.29975 -0.08649 0.31198
3.40000 0.61765 0.31108 0.67516 0.11946 0.28745 -0.11094 0.30811
3.44000 0.63009 0.31105 0.68837 0.11404 0.33641 -0.11719 0.35624
3.48000 0.64253 0.31100 0.70207 0.11009 0.29972 -0.09873 0.31557
3.52000 0.65497 0.34018 0.71235 0.10614
3.56000 0.66975 0.36942
3.60000 0.68452 0.34995
3.64000 0.69774 0.39845
3.68000 0.71640 0.38871
3.72000 0.72884 0.34995
3.76000 0.74440 0.36942
3.80000 0.75839 0.36934
3.84000 0.77394 0.36932
3.88000 0.78794 0.36932
3.92000 0.80349 0.39850
3.96000 0.81982 0.36934
4.00000 0.83304 0.35962
4.04000 0.84859 0.42761
4.08000 0.86724 0.41792
4.12000 0.88202 0.37906

Sreenidhi International School Physics Extended Essay
Candidate Name: Janakirama Venkat Vital Saiteja Raju Indukuri Candidate number: 004976-0027
50
4.16000 0.89757 0.38886
4.20000 0.91313 0.36944
4.24000 0.92713 0.37899
4.28000 0.94345 0.39845
4.32000 0.95900 0.39848
4.36000 0.97533 0.41789
4.40000 0.99243 0.41794
4.44000 1.00876 0.42771
4.48000 1.02665 0.43743
4.52000 1.04376 0.42764
4.56000 1.06086 0.41789
4.60000 1.07719 0.43738
4.64000 1.09585 0.46654
4.68000 1.11451 0.45682
4.72000 1.13240 0.47626
4.76000 1.15261 0.43741
4.80000 1.16739 0.39858
4.84000 1.18450 0.45687
4.88000 1.20394 0.41792
4.92000 1.21793 0.38873
4.96000 1.23504 0.40822
5.00000 1.25059 0.41797
5.04000 1.26847 0.36934
5.08000 1.28014 0.39848
5.12000 1.30035 0.41792
5.16000 1.31357 0.36934
5.20000 1.32990 0.37906
5.24000 1.34389 0.42764
5.28000 1.36411 0.38878
5.32000 1.37500 0.32072
5.36000 1.38977 0.40827
5.40000 1.40766 0.42774
5.44000 1.42399 0.37906
5.48000 1.43798 0.34990
5.52000 1.45198 0.36932
5.56000 1.46753 0.33052
5.60000 1.47842 0.34026
5.64000 1.49475 0.36932
5.68000 1.50797 0.35960
5.72000 1.52352 0.35965
5.76000 1.53674 0.33052
5.80000 1.54996 0.31108
5.84000 1.56162 0.34985
5.88000 1.57795 0.35952
5.92000 1.59039 0.29159

Sreenidhi International School Physics Extended Essay
Candidate Name: Janakirama Venkat Vital Saiteja Raju Indukuri Candidate number: 004976-0027
51
5.96000 1.60127 0.34990
6.00000 1.61838 0.35967
6.04000 1.63005 0.29171
6.08000 1.64172 0.27220
6.12000 1.65182 0.28192
6.16000 1.66427 0.35962
6.20000 1.68059 0.36919
6.24000 1.69380 0.31098
6.28000 1.70547 0.27220
6.32000 1.71558 0.26245
6.36000 1.72647 0.31108
6.40000 1.74047 0.34018
6.44000 1.75368 0.27210
6.48000 1.76223 0.23327
6.52000 1.77234 0.30138
6.56000 1.78635 0.34018
6.60000 1.79956 0.26235
6.64000 1.80733 0.18465
6.68000 1.81433 0.27212
6.72000 1.82910 0.35962
6.76000 1.84310 0.27217
6.80000 1.85088 0.19442
6.84000 1.85865 0.27217
6.88000 1.87265 0.30133
6.92000 1.88276 0.23329
6.96000 1.89131 0.22352
7.00000 1.90064 0.21381
7.04000 1.90842 0.19439
7.08000 1.91619 0.24296
7.12000 1.92786 0.29159
7.16000 1.93952 0.23329
7.20000 1.94652 0.27215
7.24000 1.96129 0.33052
7.28000 1.97296 0.20416
7.32000 1.97763 0.12635
7.36000 1.98307 0.20411
7.40000 1.99395 0.24301
7.44000 2.00251 0.17500
7.48000 2.00796 0.15551
7.52000 2.01495 0.23324
7.56000 2.02661 0.28197
7.60000 2.03751 0.20421
7.64000 2.04295 0.13602
7.68000 2.04839 0.18457
7.72000 2.05772 0.21381

Sreenidhi International School Physics Extended Essay
Candidate Name: Janakirama Venkat Vital Saiteja Raju Indukuri Candidate number: 004976-0027
52
7.76000 2.06550 0.19439
7.80000 2.07327 0.21378
7.84000 2.08260 0.18470
7.88000 2.08804 0.15556
7.92000 2.09504 0.14577
7.96000 2.09971 0.15544
8.00000 2.10748 0.21388
8.04000 2.11682 0.19449
8.08000 2.12304 0.13607
8.12000 2.12770 0.11663
8.16000 2.13237 0.14579
8.20000 2.13937 0.23324
8.24000 2.15103 0.20406
8.28000 2.15569 0.07773
8.32000 2.15725 0.07776
8.36000 2.16191 0.18470
8.40000 2.17202 0.21391
8.44000 2.17902 0.15556
8.48000 2.18447 0.11666
8.52000 2.18836 0.08750
8.56000 2.19147 0.09717
8.60000 2.19613 0.13612
8.64000 2.20236 0.15556
8.68000 2.20858 0.14577
8.72000 2.21402 0.08745
8.76000 2.21557 0.07773
8.80000 2.22024 0.09720
8.84000 2.22335 0.06804
8.88000 2.22568 0.14572
8.92000 2.23500 0.13602
8.96000 2.23656 0.08750
9.00000 2.24200 0.11663
9.04000 2.24589 0.10692
9.08000 2.25056 0.13607
9.12000 2.25678 0.14582
9.16000 2.26222 0.08748
9.20000 2.26378 0.05829
9.24000 2.26689 0.07776
9.28000 2.27000 0.06804
9.32000 2.27233 0.07776
9.36000 2.27622 0.06804
9.40000 2.27777 0.05832
9.44000 2.28088 0.08748
9.48000 2.28477 0.07773
9.52000 2.28710 0.07776

Sreenidhi International School Physics Extended Essay
Candidate Name: Janakirama Venkat Vital Saiteja Raju Indukuri Candidate number: 004976-0027
53
9.56000 2.29099 0.09725
9.60000 2.29488 0.10692
9.64000 2.29954 0.09717
9.68000 2.30265 0.09720
9.72000 2.30732 0.07773
9.76000 2.30887 0.05829
9.80000 2.31198 0.07776
9.84000 2.31509 0.06809
9.88000 2.31743 0.06809
9.92000 2.32054 0.06804
9.96000 2.32287 0.03888
10.00000 2.32365 0.01941
10.04000 2.32443 0.03883
10.08000 2.32676 0.07773
10.12000 2.33064 0.06804
10.16000 2.33220 0.04860
10.20000 2.33453 0.06809
10.24000 2.33765 0.04865
10.28000 2.33842 0.03888
10.32000 2.34076 0.03888
10.36000 2.34153 0.01941
10.40000 2.34231 0.03885
10.44000 2.34464
The above data is just for trial 1 of mass 1. Since there are 14 more tables like this, instead of wasting paper
printing them, I’ve provided the link to the spreadsheet for easy access: http://tinyurl.com/otw6q6r