Investigating the evolution of N 2 transport mechanism during the cyclic CVD post-treatment of...
14
Investigating the evolution of N 2 transport mechanism during the cyclic CVD post-treatment of silica membranes A.I. Labropoulos, G.E. Romanos * , N. Kakizis, G.I. Pilatos, E.P. Favvas, N.K. Kanellopoulos Institute of Physical Chemistry, NCSR ‘‘Demokritos’’, Agia Paraskevi Attikis, 15310 Athens, Greece Received 11 May 2007; received in revised form 15 July 2007; accepted 27 July 2007 Available online 3 August 2007 Abstract Silica membranes of 1 nm nominal pore size were post-treated by application of a cyclic chemical vapor deposition method at 573 K with the system TEOS/O 3 . Equal number of cycles and identical conditions were applied for two of the membranes to examine depo- sition reproducibility. A third membrane was modified under similar CVD conditions but for intermediate sorption/reaction periods and different number of cycles with the intention to thoroughly study performance evolution during treatment. Diffusion characteristics were attained after each cycle, by examining alterations of He and N 2 ‘‘apparent’’ activation energy. For the similarly modified mem- branes, He/N 2 permselectivity at 573 K reached its maximum value, from 10 to 107, after a total of 3.5 h exposure to organic precursor and oxidant. At this stage of the procedure the ‘‘apparent’’ activation energy of helium increased from 12 to 30 kJ/mol, while its per- meance dropped to 70% of the initial value. Contrary, N 2 permeance gave a negative slope in the Arrhenius plot, revealing that sorption contribution is still significant. Further post-treatment, had no remarkable effect either on the activation energy or on the permeance of helium, whereas He/N 2 permselectivity decreased continuously with successive CVD cycles, reaching a limit value of 32. This unexpected tendency was attributed to the observed transition of nitrogen transport from sorption to micropore diffusion dependent and was thor- oughly explained considering the analysis of adsorption potentials in microporous materials. The calculated ‘‘apparent’’ activation ener- gies of nitrogen rose from 1.0 to 2.5 kJ/mol for 4.5–8 h of total treatment. Ó 2007 Elsevier Inc. All rights reserved. Keywords: Silica membranes; Activated diffusion; Adsorption contribution; Cyclic CVD; Selectivity 1. Introduction Sol–gel modification of mesoporous alumina mem- branes with polymeric silica sols has been proved a very successful technique to develop microporous silica mem- branes that combine both molecular sieve performance with relatively high gas permeation rates (10 7 –10 6 mol/ m 2 /s/Pa for He and H 2 ). However, few studies are reported for the development of such materials with pore size below 1 nm [1]. For this reason the post-treatment of sol–gel derived membranes with several CVD techniques has been investigated and actually consists a very effective route to improve performance characteristics by efficiently control- ling the size and surface chemistry of the pores as well as the effective membrane thickness [2]. The plugging of exist- ing pinholes and defects on silica and zeolitic membranes is another widely examined potential benefit of CVD applica- tions [3]. The literature dealing with CVD modifications is often referred to the control of pore sizes <1 nm for the preparation of highly selective membranes with many potential applications in gas separations [4], as in the pro- duction of hydrogen at elevated temperatures using mem- brane steam reforming technology [5,6]. Although activated diffusion of He, H 2 ,N 2 , CO 2 and CH 4 constitutes a broadly adopted indicator for the extent of pore size reduction [7], there is not until now a clear correlation 1387-1811/$ - see front matter Ó 2007 Elsevier Inc. All rights reserved. doi:10.1016/j.micromeso.2007.07.035 * Corresponding author. Tel.: +30 2106503973; fax: +30 2106511766. E-mail address: [email protected] (G.E. Romanos). www.elsevier.com/locate/micromeso Available online at www.sciencedirect.com Microporous and Mesoporous Materials 110 (2008) 11–24
-
Upload
demokritos -
Category
Documents
-
view
0 -
download
0
Transcript of Investigating the evolution of N 2 transport mechanism during the cyclic CVD post-treatment of...

Available online at www.sciencedirect.com
www.elsevier.com/locate/micromeso
Microporous and Mesoporous Materials 110 (2008) 11–24
Investigating the evolution of N2 transport mechanism during the cyclicCVD post-treatment of silica membranes
A.I. Labropoulos, G.E. Romanos *, N. Kakizis, G.I. Pilatos,E.P. Favvas, N.K. Kanellopoulos
Institute of Physical Chemistry, NCSR ‘‘Demokritos’’, Agia Paraskevi Attikis, 15310 Athens, Greece
Received 11 May 2007; received in revised form 15 July 2007; accepted 27 July 2007Available online 3 August 2007
Abstract
Silica membranes of 1 nm nominal pore size were post-treated by application of a cyclic chemical vapor deposition method at 573 Kwith the system TEOS/O3. Equal number of cycles and identical conditions were applied for two of the membranes to examine depo-sition reproducibility. A third membrane was modified under similar CVD conditions but for intermediate sorption/reaction periodsand different number of cycles with the intention to thoroughly study performance evolution during treatment. Diffusion characteristicswere attained after each cycle, by examining alterations of He and N2 ‘‘apparent’’ activation energy. For the similarly modified mem-branes, He/N2 permselectivity at 573 K reached its maximum value, from 10 to 107, after a total of 3.5 h exposure to organic precursorand oxidant. At this stage of the procedure the ‘‘apparent’’ activation energy of helium increased from 12 to 30 kJ/mol, while its per-meance dropped to 70% of the initial value. Contrary, N2 permeance gave a negative slope in the Arrhenius plot, revealing that sorptioncontribution is still significant. Further post-treatment, had no remarkable effect either on the activation energy or on the permeance ofhelium, whereas He/N2 permselectivity decreased continuously with successive CVD cycles, reaching a limit value of 32. This unexpectedtendency was attributed to the observed transition of nitrogen transport from sorption to micropore diffusion dependent and was thor-oughly explained considering the analysis of adsorption potentials in microporous materials. The calculated ‘‘apparent’’ activation ener-gies of nitrogen rose from 1.0 to 2.5 kJ/mol for 4.5–8 h of total treatment.� 2007 Elsevier Inc. All rights reserved.
Keywords: Silica membranes; Activated diffusion; Adsorption contribution; Cyclic CVD; Selectivity
1. Introduction
Sol–gel modification of mesoporous alumina mem-branes with polymeric silica sols has been proved a verysuccessful technique to develop microporous silica mem-branes that combine both molecular sieve performancewith relatively high gas permeation rates (10�7–10�6 mol/m2/s/Pa for He and H2). However, few studies are reportedfor the development of such materials with pore size below1 nm [1]. For this reason the post-treatment of sol–gelderived membranes with several CVD techniques has been
1387-1811/$ - see front matter � 2007 Elsevier Inc. All rights reserved.
doi:10.1016/j.micromeso.2007.07.035
* Corresponding author. Tel.: +30 2106503973; fax: +30 2106511766.E-mail address: [email protected] (G.E. Romanos).
investigated and actually consists a very effective route toimprove performance characteristics by efficiently control-ling the size and surface chemistry of the pores as well asthe effective membrane thickness [2]. The plugging of exist-ing pinholes and defects on silica and zeolitic membranes isanother widely examined potential benefit of CVD applica-tions [3]. The literature dealing with CVD modifications isoften referred to the control of pore sizes <1 nm for thepreparation of highly selective membranes with manypotential applications in gas separations [4], as in the pro-duction of hydrogen at elevated temperatures using mem-brane steam reforming technology [5,6]. Althoughactivated diffusion of He, H2, N2, CO2 and CH4 constitutesa broadly adopted indicator for the extent of pore sizereduction [7], there is not until now a clear correlation
12 A.I. Labropoulos et al. / Microporous and Mesoporous Materials 110 (2008) 11–24
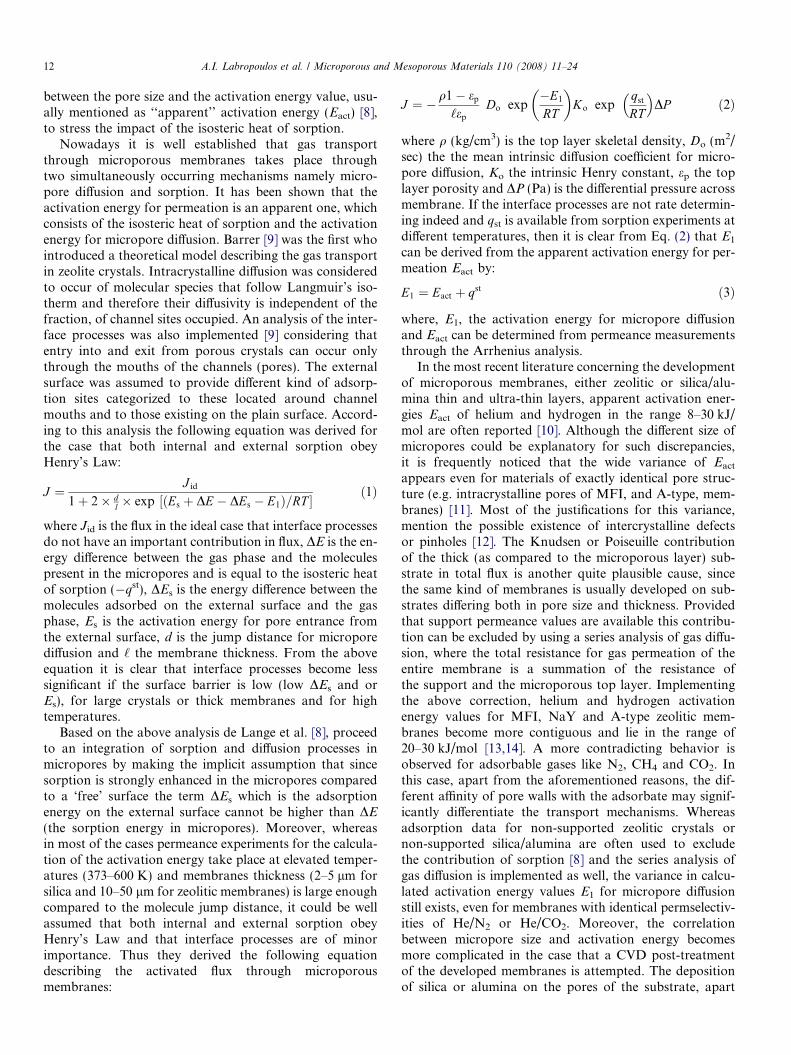
between the pore size and the activation energy value, usu-ally mentioned as ‘‘apparent’’ activation energy (Eact) [8],to stress the impact of the isosteric heat of sorption.
Nowadays it is well established that gas transportthrough microporous membranes takes place throughtwo simultaneously occurring mechanisms namely micro-pore diffusion and sorption. It has been shown that theactivation energy for permeation is an apparent one, whichconsists of the isosteric heat of sorption and the activationenergy for micropore diffusion. Barrer [9] was the first whointroduced a theoretical model describing the gas transportin zeolite crystals. Intracrystalline diffusion was consideredto occur of molecular species that follow Langmuir’s iso-therm and therefore their diffusivity is independent of thefraction, of channel sites occupied. An analysis of the inter-face processes was also implemented [9] considering thatentry into and exit from porous crystals can occur onlythrough the mouths of the channels (pores). The externalsurface was assumed to provide different kind of adsorp-tion sites categorized to these located around channelmouths and to those existing on the plain surface. Accord-ing to this analysis the following equation was derived forthe case that both internal and external sorption obeyHenry’s Law:
J ¼ J id
1þ 2� dl � exp ½ðEs þ DE � DEs � E1Þ=RT � ð1Þ
where Jid is the flux in the ideal case that interface processesdo not have an important contribution in flux, DE is the en-ergy difference between the gas phase and the moleculespresent in the micropores and is equal to the isosteric heatof sorption (�qst), DEs is the energy difference between themolecules adsorbed on the external surface and the gasphase, Es is the activation energy for pore entrance fromthe external surface, d is the jump distance for microporediffusion and ‘ the membrane thickness. From the aboveequation it is clear that interface processes become lesssignificant if the surface barrier is low (low DEs and orEs), for large crystals or thick membranes and for hightemperatures.
Based on the above analysis de Lange et al. [8], proceedto an integration of sorption and diffusion processes inmicropores by making the implicit assumption that sincesorption is strongly enhanced in the micropores comparedto a ‘free’ surface the term DEs which is the adsorptionenergy on the external surface cannot be higher than DE
(the sorption energy in micropores). Moreover, whereasin most of the cases permeance experiments for the calcula-tion of the activation energy take place at elevated temper-atures (373–600 K) and membranes thickness (2–5 lm forsilica and 10–50 lm for zeolitic membranes) is large enoughcompared to the molecule jump distance, it could be wellassumed that both internal and external sorption obeyHenry’s Law and that interface processes are of minorimportance. Thus they derived the following equationdescribing the activated flux through microporousmembranes:
J ¼ � q1� ep
‘ep
Do exp�E1
RT
� �Ko exp
qst
RT
� �DP ð2Þ
where q (kg/cm3) is the top layer skeletal density, Do (m2/sec) the the mean intrinsic diffusion coefficient for micro-pore diffusion, Ko the intrinsic Henry constant, ep the toplayer porosity and DP (Pa) is the differential pressure acrossmembrane. If the interface processes are not rate determin-ing indeed and qst is available from sorption experiments atdifferent temperatures, then it is clear from Eq. (2) that E1
can be derived from the apparent activation energy for per-meation Eact by:
E1 ¼ Eact þ qst ð3Þ
where, E1, the activation energy for micropore diffusionand Eact can be determined from permeance measurementsthrough the Arrhenius analysis.
In the most recent literature concerning the developmentof microporous membranes, either zeolitic or silica/alu-mina thin and ultra-thin layers, apparent activation ener-gies Eact of helium and hydrogen in the range 8–30 kJ/mol are often reported [10]. Although the different size ofmicropores could be explanatory for such discrepancies,it is frequently noticed that the wide variance of Eact
appears even for materials of exactly identical pore struc-ture (e.g. intracrystalline pores of MFI, and A-type, mem-branes) [11]. Most of the justifications for this variance,mention the possible existence of intercrystalline defectsor pinholes [12]. The Knudsen or Poiseuille contributionof the thick (as compared to the microporous layer) sub-strate in total flux is another quite plausible cause, sincethe same kind of membranes is usually developed on sub-strates differing both in pore size and thickness. Providedthat support permeance values are available this contribu-tion can be excluded by using a series analysis of gas diffu-sion, where the total resistance for gas permeation of theentire membrane is a summation of the resistance ofthe support and the microporous top layer. Implementingthe above correction, helium and hydrogen activationenergy values for MFI, NaY and A-type zeolitic mem-branes become more contiguous and lie in the range of20–30 kJ/mol [13,14]. A more contradicting behavior isobserved for adsorbable gases like N2, CH4 and CO2. Inthis case, apart from the aforementioned reasons, the dif-ferent affinity of pore walls with the adsorbate may signif-icantly differentiate the transport mechanisms. Whereasadsorption data for non-supported zeolitic crystals ornon-supported silica/alumina are often used to excludethe contribution of sorption [8] and the series analysis ofgas diffusion is implemented as well, the variance in calcu-lated activation energy values E1 for micropore diffusionstill exists, even for membranes with identical permselectiv-ities of He/N2 or He/CO2. Moreover, the correlationbetween micropore size and activation energy becomesmore complicated in the case that a CVD post-treatmentof the developed membranes is attempted. The depositionof silica or alumina on the pores of the substrate, apart

A.I. Labropoulos et al. / Microporous and Mesoporous Materials 110 (2008) 11–24 13
from those of the separation layer, changes its diffusioncharacteristics and accordingly its contribution to the totalflux. Thus substrate permeance values at different stages ofthe CVD process are needed to exclude this effect, which israther difficult.
In this work three similar commercially available silicamembranes (A, B and C) of 1 nm nominal pore size werepost-treated by application of a cyclic chemical vapordeposition (C-CVD) method at 573 K with the reactionsystem TEOS/O3 in the counter diffusion configuration.The challenge was to improve gas separation performancewithout considerably reducing the permeance of thesmaller size molecules. Each CVD cycle consisted of thefollowing successive steps: reaction of TEOS vapors(chemisorption) with surface hydroxyls, purging withnitrogen, reaction of adsorbate (TEOS) with O3 and purg-ing with air. Helium and nitrogen single-phase permeancemeasurements at three different temperatures (373, 473and 573 K) were performed after a specific number ofCVD cycles that for Membrane A corresponded to 4.5and 6.5 h of total exposure to organic vapor, for Mem-brane B to 0.9, 2.6 and 3.9 h and for Membrane C to4.5, 5.5, 6.5 and 8 h, respectively. Additionally, He/N2,He/CO2, He/SF6, and N2/CO2 selectivity measurementswith the Wicke–Kallenbach method were carried out forMembranes A and B after completion of the total numberof CVD cycles. Permeance measurements of the abovegases and at the same temperatures were also conductedfor the commercial (Inocermic GmbH) support used forthe development of these membranes. The exclusion ofpossible changes in the support transport mechanism wasaccomplished by analyzing the results of mercury porosi-metry that revealed a small reduction of the support poros-ity after the CVD process. This reduction was used tocorrect support’s permeance values by taking into accountthat diffusion through the support is mainly controlled bythe intermediate c-alumina layer, the pore size of whichwas estimated to be <10 nm. Accordingly diffusion throughthe support was considered to be of Knudsen type.
He/N2 permselectivity at 573 K, starting from 10, exhib-ited a maximum value after 3.5–4 h of CVD exposure andthen dropped gradually with treatment time to a limit valueof 32. The maximum values acquired were 107, 60, and 50for the three Membranes A, B and C, respectively. Furthertreatment up to 8 h in total had no effect on helium perme-ance with Eact values in the range 20–22 kJ/mol, while theobserved He/N2 selectivity reduction was accompanied bya transition of nitrogen transport mechanism from sorp-tion contributed to micropore diffusion with Eact valuesin the range 1–2.5 kJ/mol. Quantitative calculations ofEverett and Powl [15] for the enhancement of adsorptionpotentials of a gas molecule as a function of the distanceof neighboring pore surfaces, indirectly predict such abehavior, as the maximum enhancement of the (10:4) Len-nard-Jones adsorption potential is expected to occur at R/
r = 1.086, where r is the kinetic diameter of the gas mole-cule and R is the pore radius. Further decrease of the pore
size causes a strong decrease of the adsorption potential,and finally results in a non-permeable pore. By consideringthe above theory, this observed elimination of sorptioncontribution to nitrogen flux allowed us to predict thatthe pore size of the thin layer had dropped from 1 toapproximately 0.51 nm after 3.5 h of CVD treatment. Fur-ther modification did not induce any effect as the layerstarted to be impermeable to the bulky TEOS molecules.A similar dependence of the adsorption potential to themicropore size is also referred in the recent literature deal-ing with the application of modern molecular models suchas the non-local density functional theory (NLDFT) [16,17]and Monte Carlo (MC) [18,19] simulations of LJ fluids.These models have been proved very effective in providingdetailed information about carbon slit-shaped and silicacylindrical pores. In the former case the gas molecule–car-bon interactions are described by the 10-4-3 potential ofSteele [20] while in the later case the solid–fluid potentialinto pores is modeled as LJ interactions of the adsorbatemolecule with a single structure less cylindrical layer ofoxygen atoms in the pore wall [21].
2. Experimental
2.1. Materials
Tubular nanofiltration membranes (OD: 10 mm, ID:7 mm, length: 16 cm) were purchased from InocermicGmbH. The tubes consisted of an a-alumina macroporoussupport (d = 3lm), one a-alumina intermediate layer(d = 0.9 lm), a second intermediate layer of c-aluminaand a silica ultra-thin top layer of 1 nm pore diameterand thickness of about 1 lm located on the inner side ofthe tubes. The pore size of the two a-alumina layers wasdefined by mercury porosimetry while the pore size of theintermediate c-alumina layer was determined by applica-tion of a novel mercury intrusion technique described else-where [22]. By applying this technique, it was possible todefine that the pore size of the otherwise ‘undetectable’(with classical porosimetry) thin c-alumina layer was equalto 7 nm. Three of these identical tubes, hereinafter referredas Membrane A, B, and C, were post-treated with a cyclicChemical Vapor Deposition (CVD) method. The reactantsinvolved in the CVD process were TEOS (tetraethylorthos-ilicate, Si(OC2H5)4, 98% GC, Aldrich) and O3 produced bya lab-scale ozonizer (‘‘Labo L0’’, TRAILIGAZ) with airfeed (Chromatography Grade). Permeability measure-ments were conducted with the following gases: He (5.0),N2 (5.0), CO2 (4.9), SF6(3.0), iso-Butane (N2.5).
2.2. Instrumentation
CVD post-treatment and single gas permeability exper-iments at different temperatures where performed in a spe-cially designed and constructed reactor that additionallypermitted the continuous monitoring of oxygen permeanceduring the progress of the deposition. The reactor and the

Table 1CVD conditions and an overview of the performed permeance experiments
Sample T (K) TEOS (mol/m3) O3 (mol/m3) Elapsed number of CVD cycles when the following measurements were performed
He/N2 permselectivity at 573 K Activation energy of He and N2 Wicke–Kallenbach(He, N2, CO2, SF6)
Membrane A 573 1.65 0.29 0a, 2, 3, 5, 7, 9, 12, 14 0a, 9, 14 14Membrane B 573 1.65 0.29 0, 2, 6, 9 0, 2, 6, 9 9Membrane C 573 1.65 0.29 0a, 2, 3, 5, 7, 9, 12, 14, 16, 18 0, 9,12,14,18 18
a Zero cycle, denotes the membrane before the post-treatment.
14 A.I. Labropoulos et al. / Microporous and Mesoporous Materials 110 (2008) 11–24
way of its operation are thoroughly described elsewhere[23]. Gas permeance values were acquired with the pressuredrop (PD) method, by accurately measuring the differentialpressure DP (mbar) between the upstream and downstreamside of the membrane tubes while a preset constant gas flowJ (mol/min) was flowing through the membrane. The flowwas controlled by means of an electronic mass flow con-troller (Bronkhorst F-200CV, 0.2–10 ml(STP)/min, accu-racy 0.2% of full scale) equipped with Kalrez� o-rings toavoid condensable gases sorption, while differential pres-sure was continuously monitored via a differential pressuretransducer (ABB 2600T series, 0–1250 mbar, accuracy0.5% of full scale). After steady state was attained, perme-ance (F/L) was calculated by (F/L) = J/S/DP, where S
(cm2) is the surface of the membrane at the feed side (silicalayer), L (cm) the membrane thickness and DP (Pa) is thedifferential pressure across membrane sides.
Selectivity measurements were performed by the Wicke–Kallenbach (concentration gradient, WK) method in anin-house developed continuous flow stainless steel appara-tus [24], equipped with a 4-port switching valve (Valco,VICIAG). The 4-port valve was suitably automated toalternately transfer the two streams sweeping the two sidesof the membrane to the two loops of a 10-port gas-sam-pling valve (Valco, VICIAG) installed on a Gas Chromato-graph (HP 5890 SeriesII). The GC was configured with twochannels to analyze each loop separately. One of the chan-nels was equipped with a Heysep D column (10ft) and aFlame Ionization Detector for hydrocarbons analysis andthe second with a Heysep D column (30 ft) and a ThermalConductivity Detector for permanent gases analysis. Mer-cury porosimetry was conducted with the Autoscan 60(Quantachrome) mercury porosimeter.
2.3. Chemical vapor deposition conditions
During a CVD cycle, TEOS vapors were initially fedfrom the nanofiltration layer side for short selectable peri-ods of time, while the support side was swept with 850 ml/min of dry air. N2 at a flow rate of 50 ml/min was enrichedwith TEOS vapors by means of a glass bubbler equippedwith a bubbling frit and by-pass valves. The thermal stabil-ization of TEOS was achieved by means of a heating man-tle, while heating cords covered all tubing from the bubblerto the reactor to prohibit condensation. The purging stepcommenced after by passing the bubbler. During this step
dry N2 swept the nanofiltration side for a time adequateto remove any trace of TEOS from the annular space ofthe reactor, in order to prohibit deposition of particlesformed in the gas phase. The extent of this step was prede-fined according to the reactor geometry. Thereinafter O3
was produced in the air stream for selectable periods of timewhile dry nitrogen swept the layer side of the membrane.After ceasing O3 production, a purging period with dryair completed the CVD cycle and permeability measure-ments started. The conditions of the CVD reaction andthe coding of the samples are summarized in the followingTable 1. A short description of the permeance experimentsperformed for each membrane is also included.
3. Results and discussion
3.1. Permeance characteristics-untreated membranes
Single-phase permeance characteristics of the untreatedmembranes are summarized in the following Table 2.Although a significant variance of He and N2 permeancevalues is observed for the three membranes, the defect freecharacter of the silica nanofiltration layer is well estab-lished by the fairly high and almost equal Eact values forhelium. Moreover, the predominance of micropore diffu-sion mechanism for gas transport at elevated temperatures(573 K) is evident from the fact that gas permeance valuesdecrease with increasing molecular kinetic diameter. Thecontribution of sorption starts to be significant from arather high temperature (473 K) where the strongly adsorb-able iso-butane exhibiting surface diffusion permeatesfaster than N2 (Table 2). Surface diffusion contributioncontinues to be evident for N2, iso-Butane and SF6 evenafter implementing the correction for the contribution ofKnudsen diffusion that characterizes the support. Theresulting permeance values for all membranes (values withasterisks in Table 2) still decreased with increasing temper-ature. As explained above, the significant variation of Heand N2 permeances before CVD post-treatment, especiallybetween Membrane B and the other two, should not beattributed neither to the occurrence of defects on the nano-filtration layer nor to experimental error. Especially inwhat concerns the experimental error limits in the determi-nation of permeance values, a relative standard deviation(RSD) of 1.2% was calculated according to the accuracyspecifications of each instrument involved in permeance

Table 2Permeance results for several gases and activation energy of He obtained with the pressure drop (PD) and Wicke–Kallenbach (WK) method
T(K) Kinetic diameter r (nm) He N2
0.26 0.364 0.5 0.55
He N2 iso-Butane SF6
Permeance (mol/m2/s/Pa)
Membrane A 608 2.41E�07 1.52E�08 – 7.61E�09 Membrane B – –
573 1.59E�07 1.67E�08 1.57E�08 9.62E�09 5.64E�08 4.22E�09*1.67E�07 *1.69E�08 *1.6E�08 *9.78E�09 *5.73E�08 *4.23E�09
523 1.06E�07 – 1.71E�08 – – –
473 7.5E�08 2.05E�08 2.3E�08 1.07E�08 1.78E�08 5.05E�09*7.65E�08 *2.08E�08 *2.35E�08 *1.09E�08 *1.79E�08 *5.07E�09
373 4.73E�08 2.28E�08 – 1.4E�08 9.53E�09 5.52E�09*4.78E�08 *2.31E�08 *1.43E�08 *9.55E�09 *5.54E�09
Support 573 3.5E�06 1.44E�06 9.2E�07 5.8E�07 Membrane C 1.29E�07 1.03E�08*1.34E�07 *1.04E�08
473 3.82E�06 1.52E�06 1E�06 6.33E�07 6.08E�08 1.27E�08*6.18E�08 *1.28E�08
373 4.31E�06 1.68E�06 1.132E�06 7.13E�07 3.85E�08 1.41E�08*3.88E�08 *1.42E�08
Activation energy of helium (kJ/mol)
Membrane A 10.42 Membrane B 15.2 Membrane C 10.4*10.86 *15.4 *10.7
T (K) Ar sweep Ar sweep Ar sweep He sweep
He N2 He CO2 He SF6 N2 CO2
Membrane A, Permeance (mol/m2/s/Pa)
573 1.01E�07 4.81E�09 7.91E�08 4.27E�09 4.71E�08 2.47E�09 8.57E�09 1.22E�08
* Results pointed out by asterisks denote single gas permeance values and activation energies corrected for the support contribution to the total gastransport.
20
30
40
50
60
70
80
90
100
400140024003400
Wavenumber (cm-1)
Tra
nsm
itanc
e%
Membrane A
Membrane A, 14 cycles
Fig. 1a. FTIR spectra of the silica layer before and after CVD treatment.Membrane A.
A.I. Labropoulos et al. / Microporous and Mesoporous Materials 110 (2008) 11–24 15
experiments (mass flow controllers and differential pressuretransducer). This RSD factor produces a variation in thepermeance value, which is of minor importance comparedto the big discrepancies observed for the three membranes.This discrepancy rather reflects dissimilarities in the surfacechemistry characterizing the starting materials.
Residual carbon content was detected by FTIR analysisof the ultra-thin silica layer of one of the samples (Mem-brane A). This existed probably due to incomplete calcina-tion of the organic additive used during the fabrication ofthese commercial samples (sol–gel). In the following Fig. 1athe characteristic peaks of symmetrical stretching vibra-tions of CH2 and CH2–CH3 at 2920 cm�1 and 2850 cm�1
are clearly distinguishable for Membrane A, and disappearafter the 14th cycle of CVD treatment. The peaks do notexist for the untreated Membranes B and C (Fig. 1b).
Moreover, as depicted in the following Fig. 2a, He per-meance at 573 K for Membrane A rises by a factor of 1.6after the first three cycles of the CVD procedure, somethingthat was not observable for the other two membranes withzero carbon content (Figs. 1b, 2b and 2c). This abnormalbehavior is quite justifiable if we consider that the removalof the residual organic content under the highly oxidizingconditions (0.29 mol/m3 O3 at 573 K) had a greater impact
on He permeance than the contradicting effect of the simul-taneously occurring silica deposition.
Furthermore, the different hydroxyl content of the silicasurface could be a plausible reason for permeance valuesdiscrepancies. Membrane B, after purging in helium atmo-sphere at 573 K for a period of 24 h, exhibited permeancevalues of 9.9 · 10�8 and 7.6 · 10�9 for He and N2 respec-tively. A pre-treatment period of 3 h under O3 atmosphere

20
30
40
50
60
70
80
90
100
400140024003400
Wavenumber (cm-1)
Tra
nsm
itanc
e% Membrane B
Membrane C
Fig. 1b. FTIR spectra of the silica layer before CVD treatment.Membranes B and C.
0.0
0.5
1.0
1.5
2.0
2.5
3.0
0 2 4 6 8 10 12 14
No of CVD cycles
107 x
mol
/m2 /s
ec/P
a
0
0.05
0.1
0.15
0.2He N2
Fig. 2a. He, N2 permeance evolution. Membrane A. N2 plotted in thesecondary axis.
0 2 4 6 8 10 12 14 16 18No of CVD cycles
107 x
mol
/m2 /s
ec/P
a
0.0
0.2
0.4
0.6
0.8
1.0
1.2
1.4
0
0.02
0.04
0.06
0.08
0.1
0.12He N2
Fig. 2b. He, N2 permeance evolution. Membrane C. N2 plotted in thesecondary axis.
0 2 4 6 8 100.0
1.0
2.0
3.0
4.0
5.0
6.0
No of CVD cycles
108 x
mol
/m2 /s
ec/P
a
0
0.1
0.2
0.3
0.4
0.5He N2
Fig. 2c. He, N2 permeance evolution. Membrane B. N2 plotted in thesecondary axis.
16 A.I. Labropoulos et al. / Microporous and Mesoporous Materials 110 (2008) 11–24
(0.29 mol/m3 in air), just before starting the C-CVD proce-dure, had as effect the drop of He and N2 permeance valuesto 5.7 · 10�8 and 4.22 · 10�9, which is almost half theinitial values. Condensation reactions [25] of thetype SiOH(s) + SiOH(s)! Si–O–Si(s) + H2O(g) betweenhydroxyl groups in the presence of O3 at 573 K, formingSi–O–Si deposits on the pore walls is a possible explanationfor this intense drop of permeance.
A further issue under discussion is the impact of thecounter diffusing molecule to the permeating gases whenperforming measurements with the Wicke–Kallenbachmethod. In all WK experiments Ar (100 ml/min) was usedas the carrier gas sweeping the support side and the calcu-lated permeance values for He, N2 and SF6 (Table 2) wereremarkably lower by a factor of 1.6, 3.5, and 3.9, respec-tively, as compared to those acquired by single-phase PDexperiments.
The major difference of the WK method compared toPD, is the use of a sweep gas at the permeate side. It hasalready been investigated for silicalite-1 membranes [13]that the permeating sweep gas molecules can hinder perme-ation of molecules in the opposite direction. The observedhindrance was not only related to the magnitude of counterflux but also to the nature of the counter diffusing mole-cules and their concentration in the pores. This statementaroused by comparing the effect of two different sweepgases on permeance. Although Ar as a sweep gas, exhibiteda sufficiently lower counter flux than He, it had a muchstronger effect on hydrocarbons permeance for silicalite-1membranes. This was also the situation in our experiments(Table 2) where CO2 and N2 permeances drop by a factorof 2.9 and 1.8, respectively, when using Argon instead ofhelium as sweep gas.
3.2. Gas permeance evolution during CVD
In the following Fig. 2, He, N2and O2 permeability evo-lution at 573 K is illustrated versus CVD cycles. Apartfrom the above justified abnormal behavior of helium per-meance for Membrane A, a sudden rise of N2 permeanceat 573 K is observed for both Membranes A and C afterthe 9th cycle of their treatment (Figs. 2a and 2b). Thesame tendency was also noticed for oxygen permeance(Fig. 2d) measured in real time during CVD with theWK method. The rise of N2 permeance value at 573 Kwhich was accompanied by a sudden drop of He/N2 per-rmselectivity to almost the same value (32) for both Mem-branes A and B, does not imply any creation of defects onthe silica top layer. It will be adequately explained in the

0
0.2
0.4
0.6
0.8
1
1.2
0 5 10 15
No of CVD cycles
Nor
mal
ized
per
mea
nce
valu
es O2
N2
Fig. 2d. O2, N2 permeance evolution. Membrane A.
A.I. Labropoulos et al. / Microporous and Mesoporous Materials 110 (2008) 11–24 17
following paragraphs by taking into account the evolutionof adsorption potentials with pore walls distance inmicropores according to the quantitative calculations ofEverett and Powl.
As previously mentioned, the reactor was equipped withan oxygen sensor of electrolytic cell type (0–10% v/v O2)mounted in line with an N2 stream feeding the inner sideof the tubes. A stream of air that was continuously sweep-ing the outer side of the tubes was applied for O3 produc-tion. Through this configuration it was possible to monitorO2 permeance evolution during all steps of the CVD post-treatment.
In the following Fig. 3, oxygen permeance evolution ofthe three membranes is illustrated for some of the CVDcycles. The drop of oxygen permeance during the first1.3 h of treatment for Membranes A and C and 0.5 h forMembrane B (Fig. 3a) comes as result of the reaction(chemisorption) of tetraethoxysilane with silica surfacehydroxyls producing Si–O–Si(OEt)3 entities that partiallyblock the pores.
It is quite clear that this step led to a more intense dropof oxygen permeance for Membrane A. Since the CVD
0.46
0.52
0.58
0.64
0.7
0.76
0.82
0.88
0.94
1
0 1 2 3
Time (hours)
Nor
mal
ized
Oxy
gen
perm
eanc
e
Membrane A
Membrane C
Membrane B
Fig. 3a. Oxygen permeance evolution (573 K). 1st CVD cycle.
conditions and step period applied for Membranes A andC were exactly identical, a higher content of surfacehydroxyl groups which in turn led to a higher concentra-tion of Si–O–Si(OEt)3 entities had been concluded forMembrane A. The aforementioned 3 h of O3 pre-treatmentapplied to Membrane B had as result the elimination ofmost of surface hydroxyls, a fact that is adequatelyillustrated by the moderate drop of O2 permeance for theperiod 0–0.5 h, as compared to the other two membranes(Fig. 3a).
Moreover, during the step of O3 reaction with theadsorbed TEOS (1.8–2.6 h), the higher concentration ofSi–O–Si(OEt)3 on the silica surface of Membrane A,should certainly lead to a higher production of depositedsilica and thus to a more intense drop of oxygen perme-ance. However oxygen permeance for both membranes(A and C) was reduced by exactly the same factor (1.6) dur-ing this step because as previously referred, the greaterextent of Si–O–Si(s) deposition on Membrane A was coun-teracted by the removal of residual carbon content whichwas initially blocking some of the pores.
Conclusively, although the CVD conditions applied toall membranes were almost identical, the reproducibilitywas proved very poor especially during the initial stagesof treatment. This was due to inherent differences in thesurface chemistry of the starting materials. As soon asthe initial steps of the C-CVD method were completed(three cycles Fig. 3b), assigning in parallel the eliminationof inherent surface activity, the permeance characteristicsof all membranes seemed to come in convergence. Themost noteworthy issue was the sudden rise of N2 perme-ance after the closure of the 9th cycle for both MembranesA and C, a tendency that was not ascertained for Mem-brane B. This is quite justifiable if we consider that the totaltime of exposure to TEOS and O3 for Membranes A and Cafter the 9th cycle was 4.5 and 4.2 h, respectively, com-pared to the 3.9 and 4.2 h for Membrane B, meaning that
0 1 2 30.3
0.35
0.4
0.45
0.5
0.55
0.6
0.65
0.7
0.75
Time (hours)
Nor
mal
ized
Oxy
gen
perm
eanc
e
Membrane A
Membrane C
Membrane B
Fig. 3b. Oxygen permeance evolution during CVD (573 K). 3rd CVDcycle for Membranes A and C. 2nd and 3rd for Membrane B.
18 A.I. Labropoulos et al. / Microporous and Mesoporous Materials 110 (2008) 11–24
Membrane B falls short in time of treatment with TEOS(0.6 h) at this cycle of the procedure.
3.3. Mercury porosimetry results
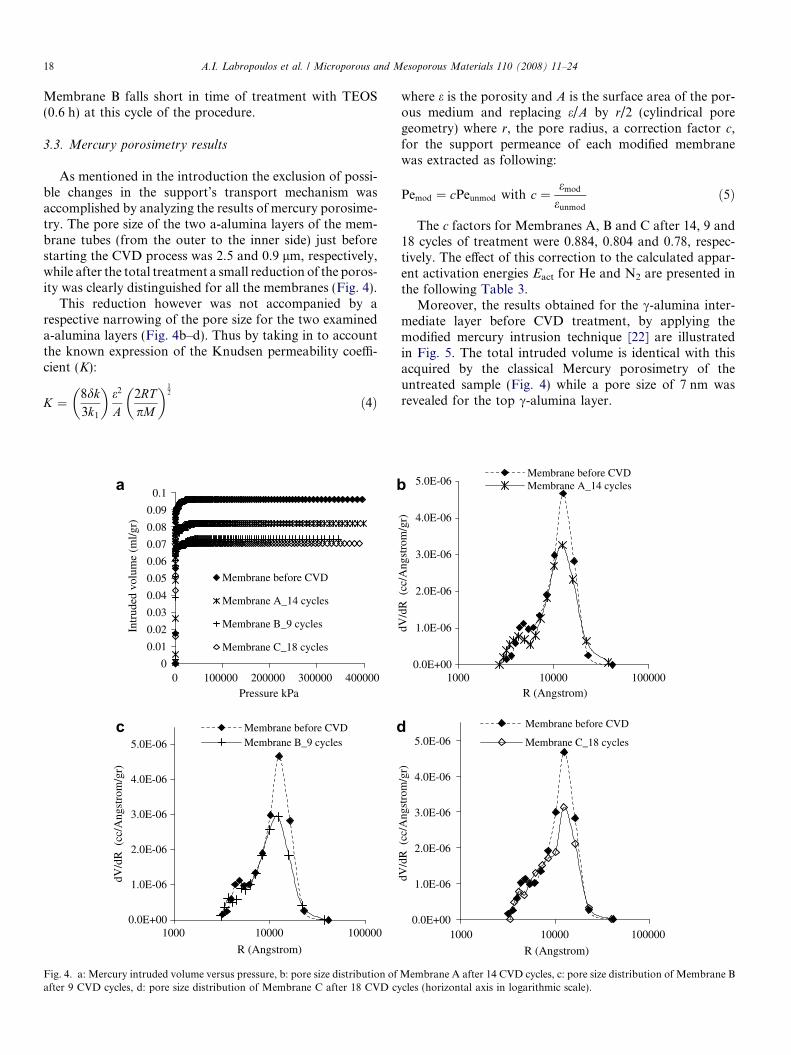
As mentioned in the introduction the exclusion of possi-ble changes in the support’s transport mechanism wasaccomplished by analyzing the results of mercury porosime-try. The pore size of the two a-alumina layers of the mem-brane tubes (from the outer to the inner side) just beforestarting the CVD process was 2.5 and 0.9 lm, respectively,while after the total treatment a small reduction of the poros-ity was clearly distinguished for all the membranes (Fig. 4).
This reduction however was not accompanied by arespective narrowing of the pore size for the two examineda-alumina layers (Fig. 4b–d). Thus by taking in to accountthe known expression of the Knudsen permeability coeffi-cient (K):
K ¼ 8dk3k1
� �e2
A2RTpM
� �12
ð4Þ
0
0.01
0.02
0.03
0.04
0.05
0.06
0.07
0.08
0.09
0.1
0 100000 200000 300000 400000Pressure kPa
Intr
uded
vol
ume
(ml/g
r)
Membrane before CVD
Membrane A_14 cycles
Membrane B_9 cycles
Membrane C_18 cycles
0.0E+00
1.0E-06
2.0E-06
3.0E-06
4.0E-06
5.0E-06
1000 10000 100000
R (Angstrom)
dV/d
R (
cc/A
ngst
rom
/gr)
Membrane before CVDMembrane B_9 cycles
Fig. 4. a: Mercury intruded volume versus pressure, b: pore size distribution ofafter 9 CVD cycles, d: pore size distribution of Membrane C after 18 CVD cy
where e is the porosity and A is the surface area of the por-ous medium and replacing e/A by r/2 (cylindrical poregeometry) where r, the pore radius, a correction factor c,for the support permeance of each modified membranewas extracted as following:
Pemod ¼ cPeunmod with c ¼ emod
eunmod
ð5Þ
The c factors for Membranes A, B and C after 14, 9 and18 cycles of treatment were 0.884, 0.804 and 0.78, respec-tively. The effect of this correction to the calculated appar-ent activation energies Eact for He and N2 are presented inthe following Table 3.
Moreover, the results obtained for the c-alumina inter-mediate layer before CVD treatment, by applying themodified mercury intrusion technique [22] are illustratedin Fig. 5. The total intruded volume is identical with thisacquired by the classical Mercury porosimetry of theuntreated sample (Fig. 4) while a pore size of 7 nm wasrevealed for the top c-alumina layer.
0.0E+00
1.0E-06
2.0E-06
3.0E-06
4.0E-06
5.0E-06
1000 10000 100000R (Angstrom)
dV/d
R (
cc/A
ngst
rom
/gr)
Membrane before CVDMembrane A_14 cycles
0.0E+00
1.0E-06
2.0E-06
3.0E-06
4.0E-06
5.0E-06
1000 10000 100000
R (Angstrom)
dV/d
R (
cc/A
ngst
rom
/gr)
Membrane before CVD
Membrane C_18 cycles
Membrane A after 14 CVD cycles, c: pore size distribution of Membrane Bcles (horizontal axis in logarithmic scale).
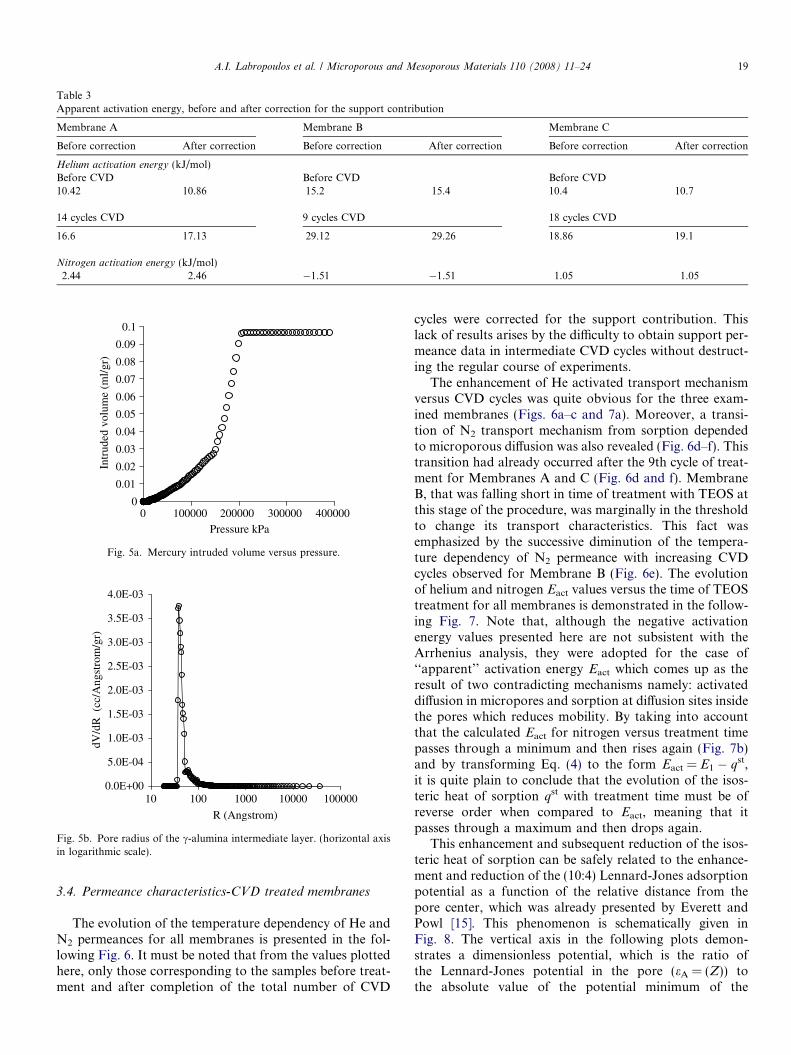
Table 3Apparent activation energy, before and after correction for the support contribution
Membrane A Membrane B Membrane C
Before correction After correction Before correction After correction Before correction After correction
Helium activation energy (kJ/mol)Before CVD Before CVD Before CVD10.42 10.86 15.2 15.4 10.4 10.7
14 cycles CVD 9 cycles CVD 18 cycles CVD
16.6 17.13 29.12 29.26 18.86 19.1
Nitrogen activation energy (kJ/mol)2.44 2.46 �1.51 �1.51 1.05 1.05
0
0.01
0.02
0.03
0.04
0.05
0.06
0.07
0.08
0.09
0.1
0 100000 200000 300000 400000
Pressure kPa
Intr
uded
vol
ume
(ml/g
r)
Fig. 5a. Mercury intruded volume versus pressure.
0.0E+00
5.0E-04
1.0E-03
1.5E-03
2.0E-03
2.5E-03
3.0E-03
3.5E-03
4.0E-03
10 100 1000 10000 100000
R (Angstrom)
dV/d
R (
cc/A
ngst
rom
/gr)
Fig. 5b. Pore radius of the c-alumina intermediate layer. (horizontal axisin logarithmic scale).
A.I. Labropoulos et al. / Microporous and Mesoporous Materials 110 (2008) 11–24 19
3.4. Permeance characteristics-CVD treated membranes
The evolution of the temperature dependency of He andN2 permeances for all membranes is presented in the fol-lowing Fig. 6. It must be noted that from the values plottedhere, only those corresponding to the samples before treat-ment and after completion of the total number of CVD
cycles were corrected for the support contribution. Thislack of results arises by the difficulty to obtain support per-meance data in intermediate CVD cycles without destruct-ing the regular course of experiments.
The enhancement of He activated transport mechanismversus CVD cycles was quite obvious for the three exam-ined membranes (Figs. 6a–c and 7a). Moreover, a transi-tion of N2 transport mechanism from sorption dependedto microporous diffusion was also revealed (Fig. 6d–f). Thistransition had already occurred after the 9th cycle of treat-ment for Membranes A and C (Fig. 6d and f). MembraneB, that was falling short in time of treatment with TEOS atthis stage of the procedure, was marginally in the thresholdto change its transport characteristics. This fact wasemphasized by the successive diminution of the tempera-ture dependency of N2 permeance with increasing CVDcycles observed for Membrane B (Fig. 6e). The evolutionof helium and nitrogen Eact values versus the time of TEOStreatment for all membranes is demonstrated in the follow-ing Fig. 7. Note that, although the negative activationenergy values presented here are not subsistent with theArrhenius analysis, they were adopted for the case of‘‘apparent’’ activation energy Eact which comes up as theresult of two contradicting mechanisms namely: activateddiffusion in micropores and sorption at diffusion sites insidethe pores which reduces mobility. By taking into accountthat the calculated Eact for nitrogen versus treatment timepasses through a minimum and then rises again (Fig. 7b)and by transforming Eq. (4) to the form Eact = E1 � qst,it is quite plain to conclude that the evolution of the isos-teric heat of sorption qst with treatment time must be ofreverse order when compared to Eact, meaning that itpasses through a maximum and then drops again.
This enhancement and subsequent reduction of the isos-teric heat of sorption can be safely related to the enhance-ment and reduction of the (10:4) Lennard-Jones adsorptionpotential as a function of the relative distance from thepore center, which was already presented by Everett andPowl [15]. This phenomenon is schematically given inFig. 8. The vertical axis in the following plots demon-strates a dimensionless potential, which is the ratio ofthe Lennard-Jones potential in the pore (eA = (Z)) tothe absolute value of the potential minimum of the

0.00
0.50
1.00
1.50
2.00
2.50
3.00
370 410 450 490 530 570 610T (K)
107 x
(m
ol/m
2 /sec
/Pa)
initial9_cycles14_cycles
0
1
2
3
4
5
6
370 440 510 580T (K)
108 x
(m
ol/m
2 /sec
/Pa)
initial2_cycles6_cycles9_cycles
0.0
0.2
0.4
0.6
0.8
1.0
1.2
1.4
370 440 510 580
107 x
(m
ol/m
2 /sec
/Pa)
initial9_cycles12_cycles14_cycles18_cycles
0.0
0.5
1.0
1.5
2.0
2.5
370 410 450 490 530 570 610T (K)T (K)
108 x
(m
ol/m
2 /sec
/Pa)
0.0
0.3
0.6
0.9
1.2
1.5
initial9_cycles14_cycles
0.00
0.10
0.20
0.30
0.40
0.50
0.60
300 350 400 450 500 550 600T (K)
108 x
(m
ol/m
2 /sec
/Pa)
0.00
0.10
0.20
0.30
0.40
0.50
0.60
0.70
initial2_cycles6_cycles9_cycles
0.0
0.2
0.4
0.6
0.8
1.0
1.2
1.4
1.6
300 350 400 450 500 550 600T (K)
108 x
(m
ol/m
2 /sec
/Pa)
0.00
0.05
0.10
0.15
0.20
0.25
0.30
0.35
0.40
0.45
0.50
Initial9_cycles12_cycles14_cycles18_cycles
Fig. 6. Temperature dependence of He, N2 permeance versus CVD cycles. a, b, c: Helium for Membranes A, B and C respectively. d, e, f: Nitrogen forMembranes A, B and C, respectively. The secondary axis corresponds to treated samples.
20 A.I. Labropoulos et al. / Microporous and Mesoporous Materials 110 (2008) 11–24
Lennard-Jones potential on a ‘free’ surface ðe�A1Þ. The porewalls distance Deff is calculated from Deff = 2R-rsurface oxygen
with rsurface oxygen = 2.76 A and R = pore radius.The values of R for the five relative pore sizes illustrated
in the above Fig. 8a, have been resulted by R/rA = 0.9,1.086, 1.239, 2 and 3, where rA the kinetic diameter ofnitrogen which is equal to 3.64 A. As indicative atFig. 8b [8] the maximum enhancement of the adsorptionpotential for the case of nitrogen occurs at R/rA = 1.086that corresponds to a pore size of 5.1 A (Fig. 8a). Further
reduction of the pore size leads to a strong decrease of theadsorption potential and finally results to a non-permeablepore for the specific molecule under examination. Accord-ing to our results this transition happened at the stage ofCVD treatment that corresponded to about 2.6–3 h of totalexposure to TEOS (Fig. 7b). However, the maximumpermselectivity value (573 K) was obtained after 3.6 h ofTEOS treatment (Fig. 9a). This small discrepancy can beexplained by the lack of permeance results in the periodbetween 2.6 and 3 h of treatment if we also consider that

0
5
10
15
20
25
30
35
0 2 4 6 8 10TEOS exposure (hours)
Eac
t (kJ
/mol
)
Membrane_A
Membrane_C
Membrane_B
Fig. 7a. Helium Eact evolution versus treatment time.
0 2 4 6 8 10
TEOS exposure (hours)
-4
-3
-2
-1
0
1
2
3
Eac
t (kJ
/mol
)
Membrane_A
Membrane_C
Membrane_B
Fig. 7b. Nitrogen Eact evolution versus treatment time.
-4
-3.5
-3
-2.5
-2
-1.5
-1
-0.5
0
0 10 15 20 25Pore walls distance (Angstrom)
5
Fig. 8. a: Reproduced from (b) for the case of N2, b: different pore sizeregimes related with molecular size, (10:4) potentials (cylindricalgeometry).
A.I. Labropoulos et al. / Microporous and Mesoporous Materials 110 (2008) 11–24 21
the drop of adsorption potential with pore wall distance isvery sharp and happens for pore widths between 5.1 and3.8 A for the case of nitrogen. Conclusively the maximumpermselectivity may have exhibited a higher value thatwas not observed during the course of experiments. How-ever, it can be asserted that at this stage of the procedurethe pore size of the thin silica top layer has been reducedfrom 10 to just below 5.1 A. The as previously describedjustification for the enhancement and subsequent decreaseof the qst with pore size, is also supported in recent litera-ture from GCMC simulations of CO2 and N2 for graphiticand one-dimensional cylindrical micropores (zeolites)[26,27]. By considering a LJ fluid with interaction parame-ters chosen to model CO2 adsorption at 273.2 K in cylindri-cal pores, it was showed that the fluid–solid potentialpresents to shallow minima in the widest pore (8.3 A)and a single minimum in narrower pores. As the pore sizedecreases the potential well first increases, and then therepulsive contributions from opposite walls start to inter-fere, leading to a decrease in the attractive wall–fluid inter-actions [28]. The deepest energy minimum was calculatedto occur at 6.99 A.
Moreover, it can be claimed that the maximum observedin He/N2 permselectivity value versus the time of treatment(Fig. 9) is mainly provoked due to the enhanced immobilityof nitrogen molecules inside the pores rather than from
molecular sieving effects (exclusion of N2 molecule). Fur-ther CVD treatment after 3 h (up to 8.5 h) had not anyremarkable effect neither on the calculated Eact values(Fig. 7) nor on the He/N2 permselectivity at 573 K, whichreaches a limit value of 32 (Fig. 9a). This tendency isexplained by the fact that a reduction of the pore sizesbelow 5.1 A, renders the pores impermeable for the bulkyTEOS molecules and any deposition reaction mainlyoccurs on the outer layer and not near the pore mouths.This deposition leads to a slight drop of He and N2 perme-ance for the further treatment period between 4 and 8.5 h(Figs. 3a and 3b).
3.5. Performance characteristics-WK measurements
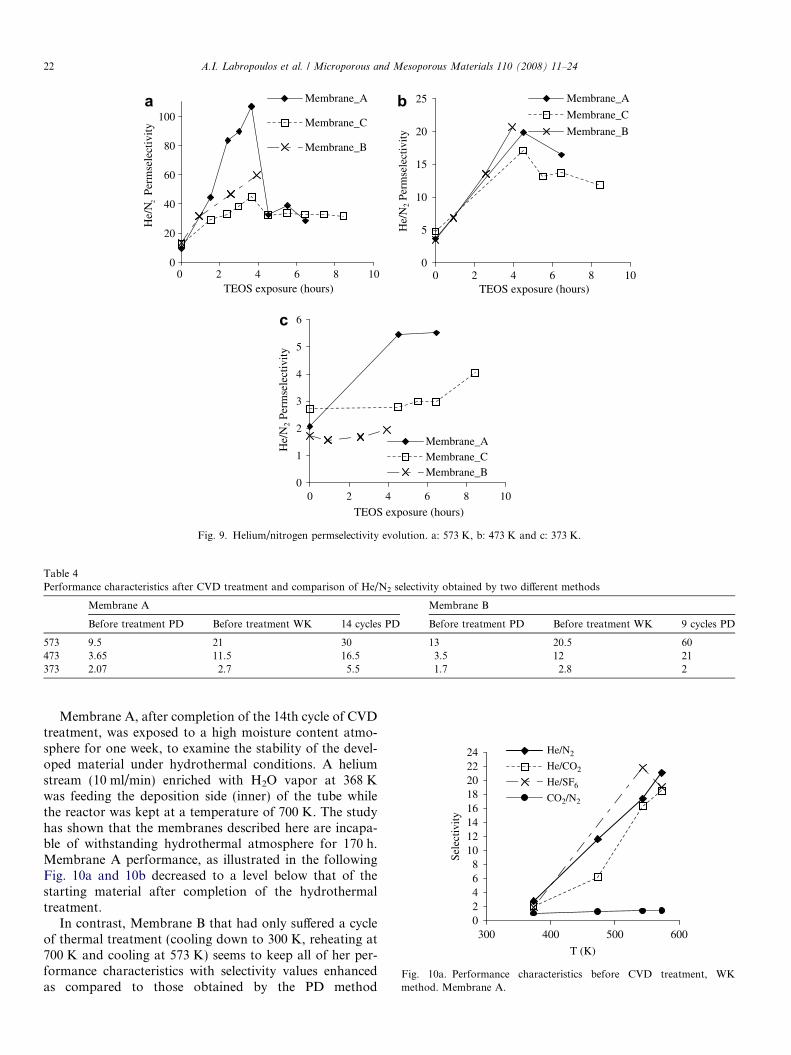
The He/N2 permselectivity value for Membrane A at573 K as measured by the pressure drop (PD) method was9.5, and rose to 30 after 14 cycles of CVD treatment. Thecorresponding values for Membrane B were 13.4 (initially)and 60 after 9 cycles of CVD treatment. The He/N2 permse-lectivity characteristics at three different temperatures aresummarized in the following Table 4, together with theselectivity values obtained before treatment with the WKmethod, by use of Argon (100 ml/min) as a sweep gas.
0
20
40
60
80
100
He/
N2 P
erm
sele
ctiv
ity
Membrane_A
Membrane_C
Membrane_B
0
5
10
15
20
25
0 2 4 6 8 10TEOS exposure (hours)
He/
N2
Perm
sele
ctiv
ity
Membrane_A
Membrane_C
Membrane_B
0
1
2
3
4
5
6
0 2 4 6 8 10
TEOS exposure (hours)
0 2 4 6 8 10TEOS exposure (hours)
He/
N2
Perm
sele
ctiv
ity
Membrane_AMembrane_CMembrane_B
Fig. 9. Helium/nitrogen permselectivity evolution. a: 573 K, b: 473 K and c: 373 K.
Table 4Performance characteristics after CVD treatment and comparison of He/N2 selectivity obtained by two different methods
Membrane A Membrane B
Before treatment PD Before treatment WK 14 cycles PD Before treatment PD Before treatment WK 9 cycles PD
573 9.5 21 30 13 20.5 60473 3.65 11.5 16.5 3.5 12 21373 2.07 2.7 5.5 1.7 2.8 2
02468
1012141618202224
300 400 500 600
T (K)
Sele
ctiv
ity
He/N2
He/CO2
He/SF6
CO2/N2
Fig. 10a. Performance characteristics before CVD treatment, WKmethod. Membrane A.
22 A.I. Labropoulos et al. / Microporous and Mesoporous Materials 110 (2008) 11–24
Membrane A, after completion of the 14th cycle of CVDtreatment, was exposed to a high moisture content atmo-sphere for one week, to examine the stability of the devel-oped material under hydrothermal conditions. A heliumstream (10 ml/min) enriched with H2O vapor at 368 Kwas feeding the deposition side (inner) of the tube whilethe reactor was kept at a temperature of 700 K. The studyhas shown that the membranes described here are incapa-ble of withstanding hydrothermal atmosphere for 170 h.Membrane A performance, as illustrated in the followingFig. 10a and 10b decreased to a level below that of thestarting material after completion of the hydrothermaltreatment.
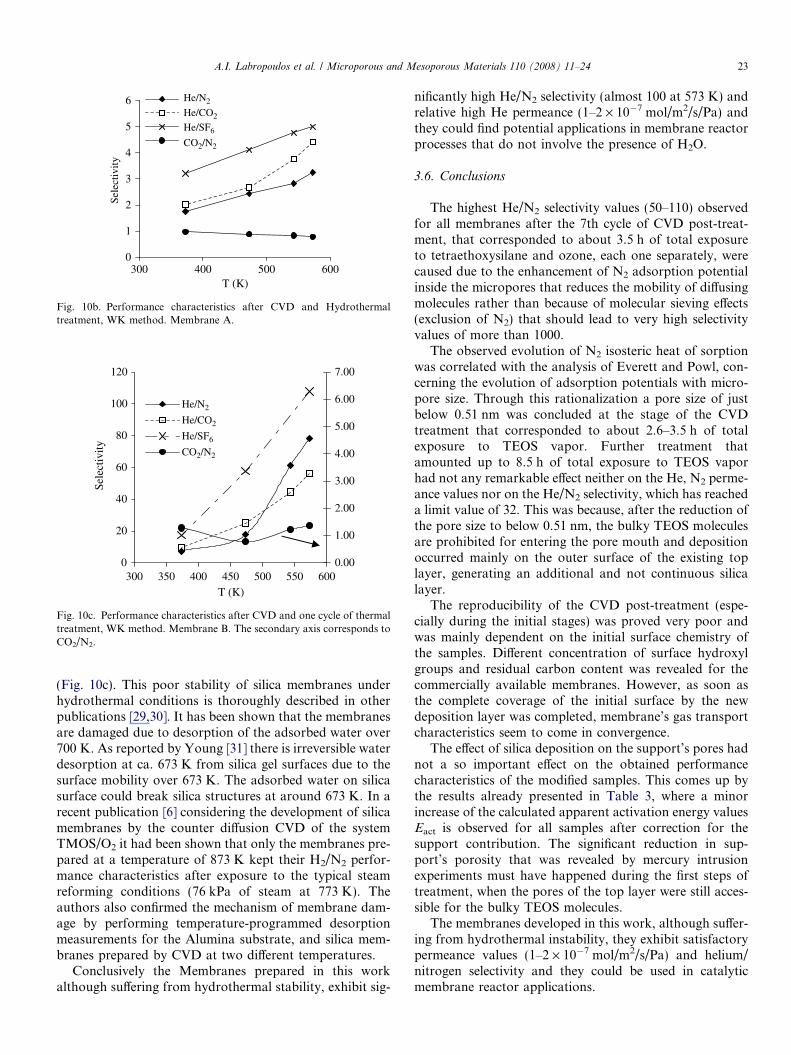
In contrast, Membrane B that had only suffered a cycleof thermal treatment (cooling down to 300 K, reheating at700 K and cooling at 573 K) seems to keep all of her per-formance characteristics with selectivity values enhancedas compared to those obtained by the PD method
0
1
2
3
4
5
6
300 400 500 600T (K)
Sele
ctiv
ity
He/N2
He/CO2
He/SF6
CO2/N2
Fig. 10b. Performance characteristics after CVD and Hydrothermaltreatment, WK method. Membrane A.
0
20
40
60
80
100
120
300 350 400 450 500 550 600T (K)
Sele
ctiv
ity
0.00
1.00
2.00
3.00
4.00
5.00
6.00
7.00
He/N2
He/CO2
He/SF6
CO2/N2
Fig. 10c. Performance characteristics after CVD and one cycle of thermaltreatment, WK method. Membrane B. The secondary axis corresponds toCO2/N2.
A.I. Labropoulos et al. / Microporous and Mesoporous Materials 110 (2008) 11–24 23
(Fig. 10c). This poor stability of silica membranes underhydrothermal conditions is thoroughly described in otherpublications [29,30]. It has been shown that the membranesare damaged due to desorption of the adsorbed water over700 K. As reported by Young [31] there is irreversible waterdesorption at ca. 673 K from silica gel surfaces due to thesurface mobility over 673 K. The adsorbed water on silicasurface could break silica structures at around 673 K. In arecent publication [6] considering the development of silicamembranes by the counter diffusion CVD of the systemTMOS/O2 it had been shown that only the membranes pre-pared at a temperature of 873 K kept their H2/N2 perfor-mance characteristics after exposure to the typical steamreforming conditions (76 kPa of steam at 773 K). Theauthors also confirmed the mechanism of membrane dam-age by performing temperature-programmed desorptionmeasurements for the Alumina substrate, and silica mem-branes prepared by CVD at two different temperatures.
Conclusively the Membranes prepared in this workalthough suffering from hydrothermal stability, exhibit sig-
nificantly high He/N2 selectivity (almost 100 at 573 K) andrelative high He permeance (1–2 · 10�7 mol/m2/s/Pa) andthey could find potential applications in membrane reactorprocesses that do not involve the presence of H2O.
3.6. Conclusions
The highest He/N2 selectivity values (50–110) observedfor all membranes after the 7th cycle of CVD post-treat-ment, that corresponded to about 3.5 h of total exposureto tetraethoxysilane and ozone, each one separately, werecaused due to the enhancement of N2 adsorption potentialinside the micropores that reduces the mobility of diffusingmolecules rather than because of molecular sieving effects(exclusion of N2) that should lead to very high selectivityvalues of more than 1000.
The observed evolution of N2 isosteric heat of sorptionwas correlated with the analysis of Everett and Powl, con-cerning the evolution of adsorption potentials with micro-pore size. Through this rationalization a pore size of justbelow 0.51 nm was concluded at the stage of the CVDtreatment that corresponded to about 2.6–3.5 h of totalexposure to TEOS vapor. Further treatment thatamounted up to 8.5 h of total exposure to TEOS vaporhad not any remarkable effect neither on the He, N2 perme-ance values nor on the He/N2 selectivity, which has reacheda limit value of 32. This was because, after the reduction ofthe pore size to below 0.51 nm, the bulky TEOS moleculesare prohibited for entering the pore mouth and depositionoccurred mainly on the outer surface of the existing toplayer, generating an additional and not continuous silicalayer.
The reproducibility of the CVD post-treatment (espe-cially during the initial stages) was proved very poor andwas mainly dependent on the initial surface chemistry ofthe samples. Different concentration of surface hydroxylgroups and residual carbon content was revealed for thecommercially available membranes. However, as soon asthe complete coverage of the initial surface by the newdeposition layer was completed, membrane’s gas transportcharacteristics seem to come in convergence.
The effect of silica deposition on the support’s pores hadnot a so important effect on the obtained performancecharacteristics of the modified samples. This comes up bythe results already presented in Table 3, where a minorincrease of the calculated apparent activation energy valuesEact is observed for all samples after correction for thesupport contribution. The significant reduction in sup-port’s porosity that was revealed by mercury intrusionexperiments must have happened during the first steps oftreatment, when the pores of the top layer were still acces-sible for the bulky TEOS molecules.
The membranes developed in this work, although suffer-ing from hydrothermal instability, they exhibit satisfactorypermeance values (1–2 · 10�7 mol/m2/s/Pa) and helium/nitrogen selectivity and they could be used in catalyticmembrane reactor applications.
24 A.I. Labropoulos et al. / Microporous and Mesoporous Materials 110 (2008) 11–24
Acknowledgements
This work is co-funded by European Social Fund andNational Resources. The authors would like to thank theMinistry of Development (General Secretariat-GSRT) ofthe Greek government for financial support of this research(PENED 03ED 181) and also the Greek Ministry ofNational Education and Religious Affairs (04-3-001/6‘‘Archimedes’’ Research Project). Finacial support by theEuropean network of excellence INSIDE-PORES is grate-fully acknowledged.
References
[1] B.N. Nair, T. Yamaguchi, T. Okubo, H. Suematsu, K. Keizer, S.-I.Nakao, J. Membr. Sci. 135 (1997) 237.
[2] G. Xomeritakis, J. Han, Y.S. Lin, J. Membr. Sci. 124 (1997) 27.[3] M. Nomura, T. Yamaguchi, S.-I. Nakao, J. Membr. Sci. 187 (2001)
203.[4] T. Yamaguchi, X. Ying, Y. Tokimasa, B.N. Nair, T. Sugawara, S.-I.
Nakao, Phys. Chem. Chem. Phys. 2 (2000) 4465.[5] B.-K. Sea, M. Watanabe, K. Kusakabe, S. Morooka, S.S. Kim, Gas
Sep. Purif. 10 (1996) 187.[6] M. Nomura, K. Ono, S. Gopalakrishnan, T. Sugawara, S.-I. Nakao,
J. Membr. Sci. 251 (2005) 151.[7] D. Lee, S.T. Oyama, J. Membr. Sci. 210 (2002) 291.[8] R.S.A. de Lange, K. Keizer, A.J. Burggraaf, J. Membr. Sci. 104
(1995) 81.[9] R.M. Barrer, J. Chem. Soc., Faraday Trans. 86 (7) (1990) 1123.
[10] Y. Takata, T. Tsuru, T. Yoshioka, M. Asaeda, Micropor. Mesopor.Mater. 54 (2002) 257.
[11] E.E. McLeary, J.C. Jansen, F. Kapteijn, Micropor. Mesopor. Mater.90 (2006) 198.
[12] P. Ciavarella, H. Moueddeb, S. Miachon, K. Fiaty, J.-A. Dalmon,Catal. Today 56 (2000) 253.
[13] J.M. van de Graaf, F. Kapteijn, J.A. Moulijn, J. Membr. Sci. 144(1998) 87.
[14] Y. Hasegawa, K. Kusakabe, S. Morooka, Chem. Eng. Sci. 56 (2001)4273.
[15] D.H. Everett, J. C Powl, J. Chem. Soc., Faraday Trans. I 72 (1976)619.
[16] M.M.L. Ribeiro Carrott, A.J.E. Candeias, P.J.M. Carrott, P.I.Ravikovitch, A.V. Neimark, A.D. Sequeira, Micropor. Mesopor.Mater. 47 (2001) 323.
[17] E.A. Ustinov, D.D. Do, V.B. Fenelonov, Appl. Surf. Sci. 253 (2007)5610.
[18] A. Wongkoblap, D.D. Do, J. Colloid Interf. Sci. 297 (2006) 1.[19] C.M. Lastoskie, N. Quirke, K.E. Gubbins, Stud. Surf. Sci. Catal. 104
(1997) 745.[20] W.A. Steele, The Interactions of Gases with Solid Surfaces, Perg-
amon, New York, 1974.[21] G.J. Tjatjopoulos, D.L. Feke, J.A. Mann, J. Phys. Chem. 92 (1988)
4006.[22] A. Lambropoulos, G.E. Romanos, T.A. Steriotis, J. Nolan, F.K.
Katsaros, E. Kouvelos, N.K. Kanellopoulos, J. Porous. Mater. DOIdoi:10.1007/s10934-006-9055-5.
[23] A. Lambropoulos, G. Romanos, Th. Steriotis, J. Nolan, F. Katsaros,E. Kouvelos, G. Charalambopoulou, N. Kanellopoulos, Micropor.Mesopor. Mater. 99 (2007) 206.
[24] G.E. Romanos, Th.A. Steriotis, E.S. Kikkinides, N.K. Kanellopou-los, V. Kasselouri, J.D.F. Ramsay, P. Langlois, S. Kallus, J. Eur.Ceram. Soc. 21 (2001) 119.
[25] R.J.R. Uhlhorn, K. Keizer, A.J. Burggraaf, J. Membr. Sci. 66 (1992)271.
[26] A. Vishnyakov, P.I. Ravikovitch, A.V. Neimark, Langmuir 15 (1999)8736.
[27] P.I. Ravikovitch, A. Vishnyakov, R. Russo, A.V. Neimark, Langmuir16 (2000) 311.
[28] P.I. Ravikovitch, A. Vishnyakov, A.V. Neimark, Phys. Rev. E 64(2001) 011602.
[29] A. Nijmeijer, Hydrogen-selective silica membranes for use in mem-brane steam reforming, Ph.D. Thesis, University of Twente, TheNetherlands, 1999.
[30] Y. Yoshino, T. Suzuki, B.N. Nair, H. Taguchi, N. Itoh, J. Membr.Sci. 267 (2005) 8–17.
[31] G.J. Young, J. Colloid Sci. 13 (1958) 67.