
Investigating human audio-visual object perception with a combination of hypothesis-generating and...
12
RESEARCH ARTICLE Investigating human audio-visual object perception with a combination of hypothesis-generating and hypothesis-testing fMRI analysis tools Marcus J. Naumer • Jasper J. F. van den Bosch • Michael Wibral • Axel Kohler • Wolf Singer • Jochen Kaiser • Vincent van de Ven • Lars Muckli Received: 1 November 2010 / Accepted: 28 March 2011 / Published online: 19 April 2011 Ó The Author(s) 2011. This article is published with open access at Springerlink.com Abstract Primate multisensory object perception involves distributed brain regions. To investigate the net- work character of these regions of the human brain, we applied data-driven group spatial independent component analysis (ICA) to a functional magnetic resonance imaging (fMRI) data set acquired during a passive audio-visual (AV) experiment with common object stimuli. We labeled three group-level independent component (IC) maps as auditory (A), visual (V), and AV, based on their spatial layouts and activation time courses. The overlap between these IC maps served as definition of a distributed network of multisensory candidate regions including superior temporal, ventral occipito-temporal, posterior parietal and prefrontal regions. During an independent second fMRI experiment, we explicitly tested their involvement in AV integration. Activations in nine out of these twelve regions met the max-criterion (A \ AV [ V) for multisensory integration. Comparison of this approach with a general linear model-based region-of-interest definition revealed its complementary value for multisensory neuroimaging. In conclusion, we estimated functional networks of uni- and multisensory functional connectivity from one dataset and validated their functional roles in an independent dataset. These findings demonstrate the particular value of ICA for multisensory neuroimaging research and using independent datasets to test hypotheses generated from a data-driven analysis. Keywords Crossmodal Á Functional connectivity Á Functional magnetic resonance imaging Á Independent component analysis Á Multisensory Á Object perception The authors Marcus J. Naumer, Jasper van den Bosch and Michael Wibral contributed equally. Electronic supplementary material The online version of this article (doi:10.1007/s00221-011-2669-0) contains supplementary material, which is available to authorized users. M. J. Naumer (&) Á J. J. F. van den Bosch Á J. Kaiser Crossmodal Neuroimaging Lab, Institute of Medical Psychology, Goethe-University of Frankfurt, Heinrich-Hoffmann-Strasse 10, 60528 Frankfurt am Main, Germany e-mail: [email protected] M. J. Naumer Á V. van de Ven Faculty of Psychology and Neuroscience, Maastricht University, Maastricht, The Netherlands M. Wibral Brain Imaging Center, Goethe-University, Frankfurt am Main, Germany A. Kohler Department of Psychiatric Neurophysiology, University Hospital of Psychiatry, Bern, Switzerland W. Singer Max Planck Institute for Brain Research, Frankfurt am Main, Germany L. Muckli Centre for Cognitive Neuroimaging (CCNi), Institute of Neuroscience and Psychology, University of Glasgow, Glasgow, UK L. Muckli School of Psychology, University of Glasgow, Glasgow, UK 123 Exp Brain Res (2011) 213:309–320 DOI 10.1007/s00221-011-2669-0
-
Upload
independent -
Category
Documents
-
view
1 -
download
0
Transcript of Investigating human audio-visual object perception with a combination of hypothesis-generating and...

RESEARCH ARTICLE
Investigating human audio-visual object perceptionwith a combination of hypothesis-generatingand hypothesis-testing fMRI analysis tools
Marcus J. Naumer • Jasper J. F. van den Bosch • Michael Wibral •
Axel Kohler • Wolf Singer • Jochen Kaiser • Vincent van de Ven •
Lars Muckli
Received: 1 November 2010 / Accepted: 28 March 2011 / Published online: 19 April 2011
� The Author(s) 2011. This article is published with open access at Springerlink.com
Abstract Primate multisensory object perception
involves distributed brain regions. To investigate the net-
work character of these regions of the human brain, we
applied data-driven group spatial independent component
analysis (ICA) to a functional magnetic resonance imaging
(fMRI) data set acquired during a passive audio-visual
(AV) experiment with common object stimuli. We labeled
three group-level independent component (IC) maps as
auditory (A), visual (V), and AV, based on their spatial
layouts and activation time courses. The overlap between
these IC maps served as definition of a distributed network
of multisensory candidate regions including superior
temporal, ventral occipito-temporal, posterior parietal and
prefrontal regions. During an independent second fMRI
experiment, we explicitly tested their involvement in AV
integration. Activations in nine out of these twelve regions
met the max-criterion (A \ AV [ V) for multisensory
integration. Comparison of this approach with a general
linear model-based region-of-interest definition revealed its
complementary value for multisensory neuroimaging. In
conclusion, we estimated functional networks of uni- and
multisensory functional connectivity from one dataset and
validated their functional roles in an independent dataset.
These findings demonstrate the particular value of ICA for
multisensory neuroimaging research and using independent
datasets to test hypotheses generated from a data-driven
analysis.
Keywords Crossmodal � Functional connectivity �Functional magnetic resonance imaging � Independent
component analysis � Multisensory � Object perception
The authors Marcus J. Naumer, Jasper van den Bosch and Michael
Wibral contributed equally.
Electronic supplementary material The online version of thisarticle (doi:10.1007/s00221-011-2669-0) contains supplementarymaterial, which is available to authorized users.
M. J. Naumer (&) � J. J. F. van den Bosch � J. Kaiser
Crossmodal Neuroimaging Lab, Institute of Medical
Psychology, Goethe-University of Frankfurt,
Heinrich-Hoffmann-Strasse 10,
60528 Frankfurt am Main, Germany
e-mail: [email protected]
M. J. Naumer � V. van de Ven
Faculty of Psychology and Neuroscience, Maastricht University,
Maastricht, The Netherlands
M. Wibral
Brain Imaging Center, Goethe-University,
Frankfurt am Main, Germany
A. Kohler
Department of Psychiatric Neurophysiology, University Hospital
of Psychiatry, Bern, Switzerland
W. Singer
Max Planck Institute for Brain Research, Frankfurt am Main,
Germany
L. Muckli
Centre for Cognitive Neuroimaging (CCNi),
Institute of Neuroscience and Psychology,
University of Glasgow, Glasgow, UK
L. Muckli
School of Psychology, University of Glasgow, Glasgow, UK
123
Exp Brain Res (2011) 213:309–320
DOI 10.1007/s00221-011-2669-0
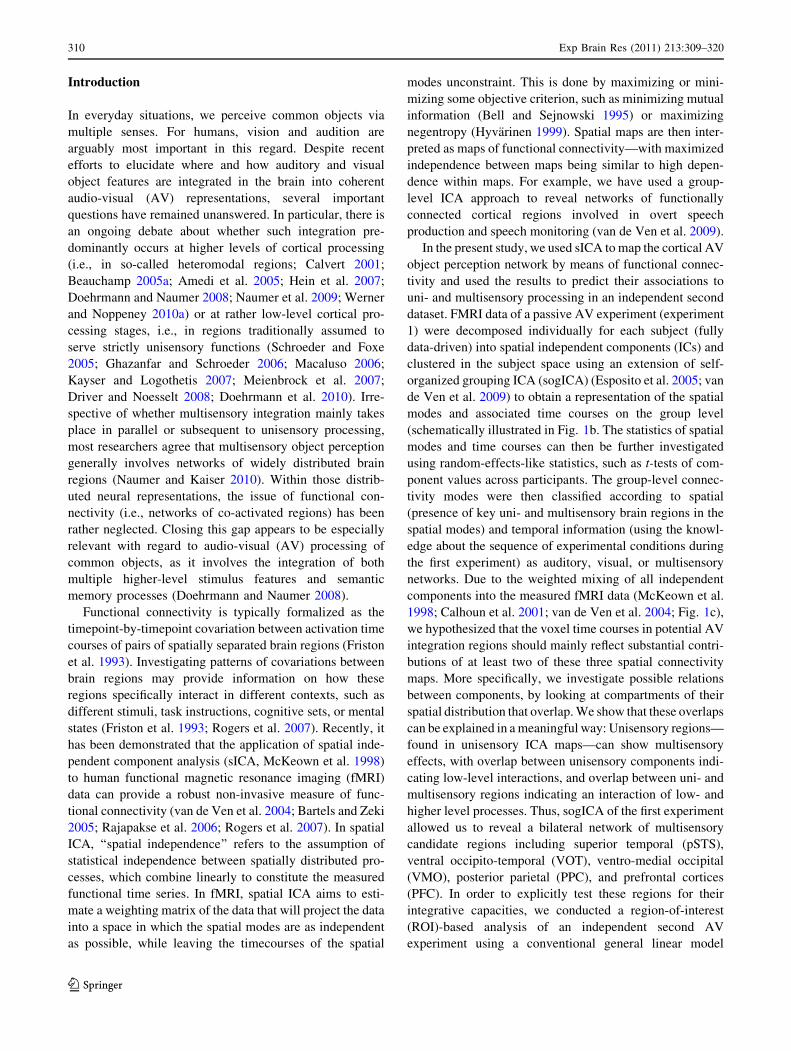
Introduction
In everyday situations, we perceive common objects via
multiple senses. For humans, vision and audition are
arguably most important in this regard. Despite recent
efforts to elucidate where and how auditory and visual
object features are integrated in the brain into coherent
audio-visual (AV) representations, several important
questions have remained unanswered. In particular, there is
an ongoing debate about whether such integration pre-
dominantly occurs at higher levels of cortical processing
(i.e., in so-called heteromodal regions; Calvert 2001;
Beauchamp 2005a; Amedi et al. 2005; Hein et al. 2007;
Doehrmann and Naumer 2008; Naumer et al. 2009; Werner
and Noppeney 2010a) or at rather low-level cortical pro-
cessing stages, i.e., in regions traditionally assumed to
serve strictly unisensory functions (Schroeder and Foxe
2005; Ghazanfar and Schroeder 2006; Macaluso 2006;
Kayser and Logothetis 2007; Meienbrock et al. 2007;
Driver and Noesselt 2008; Doehrmann et al. 2010). Irre-
spective of whether multisensory integration mainly takes
place in parallel or subsequent to unisensory processing,
most researchers agree that multisensory object perception
generally involves networks of widely distributed brain
regions (Naumer and Kaiser 2010). Within those distrib-
uted neural representations, the issue of functional con-
nectivity (i.e., networks of co-activated regions) has been
rather neglected. Closing this gap appears to be especially
relevant with regard to audio-visual (AV) processing of
common objects, as it involves the integration of both
multiple higher-level stimulus features and semantic
memory processes (Doehrmann and Naumer 2008).
Functional connectivity is typically formalized as the
timepoint-by-timepoint covariation between activation time
courses of pairs of spatially separated brain regions (Friston
et al. 1993). Investigating patterns of covariations between
brain regions may provide information on how these
regions specifically interact in different contexts, such as
different stimuli, task instructions, cognitive sets, or mental
states (Friston et al. 1993; Rogers et al. 2007). Recently, it
has been demonstrated that the application of spatial inde-
pendent component analysis (sICA, McKeown et al. 1998)
to human functional magnetic resonance imaging (fMRI)
data can provide a robust non-invasive measure of func-
tional connectivity (van de Ven et al. 2004; Bartels and Zeki
2005; Rajapakse et al. 2006; Rogers et al. 2007). In spatial
ICA, ‘‘spatial independence’’ refers to the assumption of
statistical independence between spatially distributed pro-
cesses, which combine linearly to constitute the measured
functional time series. In fMRI, spatial ICA aims to esti-
mate a weighting matrix of the data that will project the data
into a space in which the spatial modes are as independent
as possible, while leaving the timecourses of the spatial
modes unconstraint. This is done by maximizing or mini-
mizing some objective criterion, such as minimizing mutual
information (Bell and Sejnowski 1995) or maximizing
negentropy (Hyvarinen 1999). Spatial maps are then inter-
preted as maps of functional connectivity—with maximized
independence between maps being similar to high depen-
dence within maps. For example, we have used a group-
level ICA approach to reveal networks of functionally
connected cortical regions involved in overt speech
production and speech monitoring (van de Ven et al. 2009).
In the present study, we used sICA to map the cortical AV
object perception network by means of functional connec-
tivity and used the results to predict their associations to
uni- and multisensory processing in an independent second
dataset. FMRI data of a passive AV experiment (experiment
1) were decomposed individually for each subject (fully
data-driven) into spatial independent components (ICs) and
clustered in the subject space using an extension of self-
organized grouping ICA (sogICA) (Esposito et al. 2005; van
de Ven et al. 2009) to obtain a representation of the spatial
modes and associated time courses on the group level
(schematically illustrated in Fig. 1b. The statistics of spatial
modes and time courses can then be further investigated
using random-effects-like statistics, such as t-tests of com-
ponent values across participants. The group-level connec-
tivity modes were then classified according to spatial
(presence of key uni- and multisensory brain regions in the
spatial modes) and temporal information (using the knowl-
edge about the sequence of experimental conditions during
the first experiment) as auditory, visual, or multisensory
networks. Due to the weighted mixing of all independent
components into the measured fMRI data (McKeown et al.
1998; Calhoun et al. 2001; van de Ven et al. 2004; Fig. 1c),
we hypothesized that the voxel time courses in potential AV
integration regions should mainly reflect substantial contri-
butions of at least two of these three spatial connectivity
maps. More specifically, we investigate possible relations
between components, by looking at compartments of their
spatial distribution that overlap. We show that these overlaps
can be explained in a meaningful way: Unisensory regions—
found in unisensory ICA maps—can show multisensory
effects, with overlap between unisensory components indi-
cating low-level interactions, and overlap between uni- and
multisensory regions indicating an interaction of low- and
higher level processes. Thus, sogICA of the first experiment
allowed us to reveal a bilateral network of multisensory
candidate regions including superior temporal (pSTS),
ventral occipito-temporal (VOT), ventro-medial occipital
(VMO), posterior parietal (PPC), and prefrontal cortices
(PFC). In order to explicitly test these regions for their
integrative capacities, we conducted a region-of-interest
(ROI)-based analysis of an independent second AV
experiment using a conventional general linear model
310 Exp Brain Res (2011) 213:309–320
123

(GLM)-based approach. We hypothesized that activation in
all ROIs should fulfill the max-criterion for AV convergence
(AV [ max[A, V]). Based on the recent literature on effects
of semantic congruency versus incongruency during AV
object processing (Lewis 2010; Meyer et al. in press; Nop-
peney et al. 2010; van Atteveldt et al. 2010), we expected
higher BOLD signal increases for semantically congruent
AV stimuli in pSTS and VOT ROIs and for incongruent AV
pairings in VMO, PPC, and PFC ROIs, respectively.
Materials and methods
Subjects
Twelve subjects (three female) participated in this study;
their mean age was 28.8 years (range 21–38 years). All
subjects had normal or corrected-to-normal (four subjects)
vision. Of these subjects, 10 participated in experiment 1
and six in experiment 2. All participants received infor-
mation on MRI and a questionnaire to check for potential
health risks and contraindications. Volunteers gave their
written informed consent after having been introduced to
the procedure in accordance with the declaration of
Helsinki.
Stimuli
Visual stimulation consisted of eight gray-scale common
object photographs (mean stimulus size 12.8� visual angle).
Each visual stimulation block consisted of eight photo-
graphs that were presented in the center of the screen at a
rate of 0.5 Hz. In the center of the white screen, a black
fixation cross was displayed during the entire experiment.
Auditory stimulation consisted of complex sounds related
to the same eight common objects. Each auditory
Fig. 1 Relationship between spatial independent component analysis
(sICA) and voxel-based GLM analysis. FMRI raw data (a) were
decomposed into spatially independent components (b) that, mixed
together (c) reproduced the data for each voxel. Otherwise, the data
can be analyzed using the knowledge on the stimulation time course
(d) via a hypothesis-driven voxel-based GLM, resulting in statistical
information based on the individual voxel time courses (e). SICA a
results in spatially independent maps b, left column that cover the
whole geometrical extent of the raw data and contain weights that
vary strongly within each map, such that clusters of voxel weights
may appear after thresholding. Each map is associated with a single
time course b, right column. When these component time courses are
tested using the knowledge about the stimulation time course d the
components may be classified as mainly auditory, visual, or AV
(among others like physiological components related to breathing,
heartbeat, etc.). The voxel time courses (e) can be thought of as the
sum of all component time courses weighted by the values of the
respective component maps at that voxel (c). This can result in a
variety of voxel characteristics: voxels in a region where only one
spatial component has large map values will show a time course very
similar to the respective component time course, e.g., mainly auditory
(voxel 1 in c and e, top row) or mainly visual activation (voxel 2 in
c and e, second row). Due to the weighted mixing of components c,
both visual and auditory unisensory components can contribute
equally to a voxel time course (voxel 3 in c and e, third row). In a
GLM analysis, the effects of auditory and visual stimulation may be
simply additive at this voxel. If the mixing comprises non-zero
coefficients for components that describe purely multisensory
processing, i.e., processing that is absent during purely unimodal
stimulation, the respective voxel might show superadditive effects
(voxel 4 in c and e, bottom row). Inferences of sICA results refer to
systems-level (i.e., multivariate) behavior, whereas inferences of
GLM results refer to voxel (or voxel-cluster) behavior.
M multisensory
Exp Brain Res (2011) 213:309–320 311
123

stimulation block consisted of eight of these sounds that
were presented at a rate of 0.5 Hz.
Procedure
In both experiments, stimuli were presented in a block
design with a block length of approximately 16 s (eight
measurement volumes), separated from the next stimula-
tion block by a fixation period of equal length. In experi-
ment 1, we employed the following conditions: common
sounds (A), common sounds played backwards (A-bw),
gray-scale images of common objects (V), AV combina-
tions that were semantically congruent (CON), and AV
combinations that were semantically incongruent (INC)
(see Fig. 2 for an overview). In addition to the A, V, and
CON conditions of experiment 1, experiment 2 comprised
two different types of semantically incongruent AV com-
binations consisting of auditory and visual stimuli stem-
ming either from the same (‘‘low incongruency,’’ INL) or
from different object categories (‘‘high incongruency,’’
INH). Both experiments consisted of two runs each. Within
each run, each of the experimental conditions was repeated
four times. While subjects were asked to fixate and be
attentive during experiment 1, they had to perform a
repetition detection task in experiment 2.
Imaging
FMRI scanning was performed on a 1.5 Tesla Siemens
Magnetom Vision scanner (Siemens, Erlangen, Germany) at
the Institute of Neuroradiology of Frankfurt Medical School.
An echo-planar-imaging (EPI) sequence was used with the
following parameters: 16 slices, oriented approximately in
parallel to the AC-PC plane (AC, anterior commisure; PC,
posterior commissure); TR, 2081 ms; TE, 60 ms; FA, 90�;
FOV, 200 mm; in-plane resolution, 3.13 9 3.13 mm2; slice
thickness, 5 mm; gap thickness, 1 mm. In addition, a
detailed T1-weighted anatomical scan was acquired for all
subjects using a Siemens fast low-angle-shot (FLASH)
sequence (isotropic voxel size 1 mm3). For each subject, an
additional magnetization-prepared rapid-acquisition gradi-
ent-echo (MP-RAGE) sequence was used (TR = 9.7 ms,
TE = 4 ms, FA = 12�, matrix = 256 9 256, voxel size
2.0 9 1.0 9 1.0 mm3) in each fMRI scanning session for
later realignment with the detailed anatomical scan that had
been measured in a separate session.
Data analysis
Preprocessing
Data were preprocessed using the BrainVoyagerTM QX
(version 1.8) software package (Brain Innovation,
Maastricht, The Netherlands). The first four volumes of
each experimental run were discarded to preclude T1 sat-
uration effects. Preprocessing of functional data included
the following steps: (1) linear trend removal and temporal
high-pass filtering at * 0.01 Hz (2) slice-scan-time
Fig. 2 Experimental conditions. We employed the following exper-
imental conditions: unimodal auditory (yellow), unimodal visual
(blue), semantically congruent audio-visual (AV; light green),
semantically incongruent AV stimuli (from the same semantic
category; medium green), and semantically incongruent AV stimuli
(from different semantic categories; dark green)
312 Exp Brain Res (2011) 213:309–320
123

correction with sinc interpolation, (3) spatial smoothing
using Gaussian kernels of 6 mm (experiment 1) and 8 mm
(experiment 2), and (4) three-dimensional motion correc-
tion (only for experiment 2). The functional data were then
resampled into a 3-dimensional standardized space
(Talairach and Tournoux 1998) with a resampled voxel
size of 3 9 3 9 3 mm3.
Hypothesis-generating functional connectivity analysis
of experiment 1
Functional connectivity modes of the time series of
experiment 1 were analyzed using an extension of a
multi-subject data-driven analysis (sogICA, Esposito
et al. 2005; van de Ven et al. 2009) in Matlab (Math-
works Inc.) using freely available toolboxes (FastICA,
Hyvarinen 1999; Icasso, Himberg et al. 2004) and cus-
tom-made routines. Individual runs were decomposed
using spatial ICA (McKeown et al. 1998; Calhoun et al.
2001; van de Ven et al. 2004) into 35 spatially inde-
pendent components and associated activation profiles,
than clustered in a data-driven hierarchical sense (over
runs, then over subjects) based on similarity between
component pairs, with an average group-level activation
profile. See Electronic Supplementary Material for more
details. Selection of target maps obtained from a data-
driven analysis can be done by utilizing (a combination
of) spatial (van de Ven et al. 2004, 2009; Greicius et al.
2003; Castelo-Branco et al. 2002) or temporal hypotheses
(McKeown et al. 1998; Calhoun et al. 2004; Moritz et al.
2003). Spatial templates were obtained as masks in
which voxels belonging to key regions were set to 1 and
all other voxels to 0. Separate spatial templates were
generated for visual, auditory, and posterior parietal
cortex from an independent dataset (van de Ven et al.
2004). Temporal hypotheses comprised the haemody-
namically convolved sequences of unimodal (visual or
auditory) or bimodal experimental conditions. Clusters
were selected according to maximum spatial and
temporal correlations with spatial templates of the two
unimodal (bilateral auditory cortex, bilateral visual cor-
tex) and bimodal candidate regions (posterior parietal
cortex). This selection procedure yielded a single unique
cluster for each of the unimodal sensory modalities and a
single bimodal cluster that was correlated with unimodal
as well as bimodal stimulus conditions (see Electronic
Supplementary Material). We then computed intersec-
tions between these between-subject maps in order to
define candidate regions for AV integration that served
as ROIs for the analysis of experiment 2 (Fig. 1a, right
column). For each cluster, the activation profiles of the
clustered connectivity modes were averaged to obtain a
group-level activation profile.
Hypothesis-testing analysis of ROIs in experiment 2
For the statistical analysis of experiment 2, we employed
conventional hypothesis testing using multiple linear
regression of voxel time courses of the ROIs as defined in
experiment 1. For every voxel, the time course was
regressed on a set of dummy-coded predictors representing
the five experimental conditions. To account for the shape
and delay of the hemodynamic response (Boynton et al.
1996), the predictor time courses (box-car functions) were
convolved with a gamma function. We used group-based
conjunction analyses (a fixed effects model with separate
subject predictors) on the data of experiment 2, which were
spatially restricted to the ROIs obtained on the basis of
experiment 1 to effectively test the potential role of these
ROIs in the context of AV object perception. More spe-
cifically, we employed the so-called max-criterion (i.e.,
AV [ max[A, V]; e.g., Beauchamp 2005b) to test for
multisensory integration defined as enhanced activation
during bimodal stimulation. Although most widely used in
neuroimaging analyses of multisensory integration, and
therefore our choice in this context, its validity for com-
putational and psychophysical research is debated
(Angelaki et al. 2009). The ROI activation profiles were
visualized using bar plots of the group-based regression
coefficients (beta estimates) for each experimental
condition.
Results
Experiment 1 (sICA)
We detected three between-subject clusters that appeared
to be involved in sensory processing (Fig. 3). Two of
them reflected unisensory processing based on their
respective prominent spatial coverage of unisensory
cortices and associated time courses. The spatial distri-
bution of the auditory cluster, which ranked third in the
intra-cluster similarity rating (Fig. 3a; FDR-corrected
visualization threshold, t = 2.74) included superior–lat-
eral parts of the temporal lobes. The right-hand panels of
Fig. 3 show the time courses of the respective IC clusters.
The time course peaked on blocks of auditory as well as
AV stimulation. The spatial distribution of the visual
cluster, which ranked second (Fig. 3b; corrected visuali-
zation threshold t = 2.54) included bilateral occipital and
posterior parietal cortices. The associated time course
peaked on blocks of visual as well as AV stimulation.
Finally, only one of the lower-ranked IC clusters (ranked
7th; corrected visualization threshold t = 3.44) showed a
prominent spatial distribution and time course that could
be associated to AV processing (Fig. 3c) and contained
Exp Brain Res (2011) 213:309–320 313
123

bilateral posterior parietal and left prefrontal cortex. The
temporal associations of these three IC clusters to the
experimental paradigm were further quantified by sub-
mitting the component time courses to a GLM with
contrasts testing for both auditory or visual modality
preference and AV integration (see Table 1 for statistical
parameters). This analysis confirmed our tentative char-
acterization of these IC clusters as auditory, visual, and
AV, respectively.
We then identified regions of overlap between these
group-level connectivity maps (Table 2) in order to define
a set of candidate ROIs potentially involved in AV inte-
gration. This resulted in a network of ROIs including
bilateral superior temporal (pSTS), ventral occipito-tem-
poral (VOT), ventro-medial occipital (VMO), posterior
parietal (PPC), and prefrontal cortex (PFC) as well as left
auditory (AC) and dorsal pre-motor cortex (dPMC)
(Table 3).
Experiment 2 (ROI-based analysis)
The AV candidate regions defined on the basis of experi-
ment 1 served as ROIs for the analysis of experiment 2.
Applying the max-criterion for AV integration (i.e.,
AV [ max[A, V]; e.g., Beauchamp 2005b), we revealed
integrative activation profiles (Fig. 4; for statistical
parameters see Table 3) for the highly incongruent AV
stimulation in bilateral pSTS (left; t = 4.4, P \ 0.000,
right; t = 3.6, P \ 0.000), VOT (left; t = 4.2, P \ 0.000,
right; t = 3.5, P = 0.001), VMO (left; t = 2.7, P = 0.007,
right; t = 2.7, P = 0.006), and PFC (left; t = 3.6,
P \ 0.000, right; t = 3.5, P \ 0.000) as well as in left PPC
(t = 2.8, P = 0.005). Only a subsample of these, namely
bilateral pSTS (left; t = 5.5, P \ 0.000, right; t = 3.5,
P \ 0.000), VOT (left; t = 2.9, P = 0.004, right; t = 2.7,
P = 0.008), left VMO (t = 2.5, P = 0.012) and left PPC
(t = 2.0, P = 0.049) also met the criterion during
Fig. 3 Independent component IC clusters of interest. Three IC
cluster maps with activations in predominantly auditory (a), visual
(b), and heteromodal (c) cortices are shown with their respective
averaged time courses. Data are projected on group-averaged
anatomical images according to neurological convention, with
Talairach coordinates (x, y, and z) for the main cluster in view. Left
hemisphere depicted on the left of image. Graphs in the middle show
the respective component time courses against the background of the
experimental conditions. Graphs on the right show the time courses
averaged over blocks of the same condition (twelve time points,
starting from the start of the block)
Table 1 Characterization and selection of independent components (ICs)
IC A V CON [ A CON [ V INC [ A INC [ V MAX2-INC
no t P t P t P t P t P t P t P
2 2.36 0.010 17.27 0.000 11.13 0.000 -0.35 0.637 10.83 0.000 -0.64 0.737 -0.64 0.737
4 17.75 0.000 6.24 0.000 -1.26 0.895 7.59 0.000 -1.19 0.883 7.66 0.000 -1.19 0.883
7 3.81 0.000 7.03 0.000 1.62 0.053 -0.86 0.806 4.25 0.000 1.77 0.039 1.77 0.039
The three selected ICs as characterized by their time courses’ correspondence to a GLM with contrasts testing for auditory (A), visual (V), and AVactivation (congruent, CON; incongruent, INC). MAX2, max-criterion (A \ AV [ V). Bold value is significant as per the MAX-criterion
314 Exp Brain Res (2011) 213:309–320
123

incongruent same-category stimulation. Only the left pSTS
(t = 2.8, P = 0.005) and left VOT (t = 2.8, P = 0.005)
ROIs were found to meet the max-criterion during each
type of AV stimulation including semantically congruent
stimuli in particular.
GLM-based ROI definition (experiment 1) and analysis
(experiment 2)
For comparison with the ICA-based ROI analysis, data of
experiment 1 were also analyzed using a conventional
whole-brain GLM, in which AV integration maps were
computed using the max-criterion (AV [ max[A, V];
t = 3.25 P \ 0.05, cluster-size corr.; estimated cluster-size
threshold = 281 voxels). Similar to the ICA approach, we
corrected the GLM estimates for multiple comparisons
using the FDR (q = 0.05). This procedure did not provide
any significant results, which suggested that the ICA
method had greater power in localizing candidate ROIs.
We followed up on this result by comparing the GLM
and ICA methods in more detail. Direct comparison of the
results of these methods is not a trivial issue because the
underlying data come from different distributions (i.e., beta
coefficients from time course analysis of the GLM and
multivariate estimates from ICA). However, in both
methods, the final statistical test is performed on the sub-
ject-level, with the GLM as well as the sogICA method
culminating in a T test across participants. Thus, we
compared the P values of the GLM and ICA results in two
situations. Firstly, we equalized the number of visualized
voxels of the GLM-estimated results to those of the ICA-
based results and ascertained the visualization threshold
and spatial overlap of the equalized GLM map with the
ICA-based map. Spatial overlap was calculated as the
proportion of overlapping voxels of the total amount of
GLM voxels. These procedures resulted in a minimum
visualization threshold of the GLM map of P = 0.012,
uncorrected, which showed an overlap with the ICA-based
map of 4.23%. Second, we applied cluster-size correction
as an alternative method for multiple comparison correc-
tion (Forman et al. 1995). This procedure yielded three
voxel clusters (compared to 9 ICA-based ROIs) that
overlapped with the ICA-based ROIs (see Electronic
Supplementary Material for further details). Thus, both
post hoc comparisons between the two analysis methods
showed a higher detection power for the ICA-based
method.
Discussion
Group ICA of an AV fMRI data set allowed us to define an
exclusive set of cortical candidate regions for AV inte-
gration from uni- and multisensory connectivity networks.
An independent follow-up experiment further confirmed
AV convergence in these regions. While left pSTS and
VOT regions were found to integrate auditory and visual
stimuli largely irrespective of their particular semantic
relationship, PPC and PFC regions showed a parametric
sensitivity to semantically incongruent AV stimuli. We
thus showed and validated sensory convergence in func-
tional networks of uni- and multisensory brain regions. In
the following paragraphs, we first discuss these findings
with regard to their potential implications for our under-
standing of multisensory object perception and discuss the
possible methodological implications for multisensory
neuroimaging research.
The human cortical network for object-related AV
convergence
While the auditory and visual connectivity maps of
experiment 1 (Fig. 3a, b) showed predominantly unisen-
sory spatial activation patterns at least at a general level,
both also included cortical regions belonging to ‘unisen-
sory’ cortices traditionally designated to the processing of
the other sensory modality. This might contribute to
multisensory interactions observed at lower levels of the
cortical processing hierarchy that have been reported based
on a variety of methodologies ranging from invasive
electrophysiology in non-human primates to human neu-
roimaging approaches enabling either temporal or spatial
high-resolution measurements (Belardinelli et al. 2004;
Baier et al. 2006; Martuzzi et al. 2007; Meienbrock et al.
2007; Eckert et al. 2008; see Driver and Noesselt 2008 for
a recent review) and manipulation of an additive factor
such as temporal correspondence (Noesselt et al. 2007).
Table 2 Experiment 1: Regions of overlap between IC cluster
maps 2 (visual), 4 (auditory), and 7 (AV)
Visual Auditory AV
pSTS L x x
R x x
VOT L x x x
R x x
VMO L x x
R x x
PPC L x x
PFC L x x
R x x
pSTS posterior superior temporal sulcus, VOT ventral occipito-tem-
poral cortex, VMO ventro-medial occipital cortex, PPC posterior
parietal cortex, PFC prefrontal cortex, L left hemisphere, R right
hemisphere
Exp Brain Res (2011) 213:309–320 315
123

In classical physiological studies, another criterion for
multisensory integration findings is superadditivity, where
the response to bimodal stimuli exceeds the sum of the
responses to the unimodal stimuli. So far, only few fMRI
studies managed to obtain such an effect. The lack of such
a strong difference in this study may be due to several
reasons. This study used optimal stimuli, whereas degraded
stimuli, in accordance with the inverse-effectiveness prin-
ciple (Stein and Meredith 1993) can evoke stronger mul-
tisensory integration responses (see e.g., Stevenson et al.
2007). The spatiotemporal alignment of the auditory and
visual stimulation was found to be another factor of
importance in this regard (Werner and Noppeney 2010b).
Additionally, the usage of an additive factor in the design
may increase sensitivity to superadditive responses
(Stevenson et al. 2009).
Group ICA of experiment 1 revealed multisensory
candidate regions in left VOT and pSTS that demonstrated
robust AV convergence effects during experiment 2, irre-
spective of the exact semantic relation between the audi-
tory and visual stimulus components. While activations of
pSTS and neighboring regions belong to the most
frequently reported fMRI findings regarding AV integration
(Beauchamp et al. 2004; van Atteveldt et al. 2004; Hein
et al. 2007; Naumer et al. 2009; Werner and Noppeney
2010a; see also Doehrmann and Naumer 2008 for a recent
review), the significance of these findings has recently been
questioned (Hocking and Price 2008) and the exact role of
this particular region still remains under debate. Please
note that our conjunction-of-contrasts approach (i.e., the
max-criterion) is conceptually similar to whole-brain
analyses in previous multisensory fMRI studies (e.g.,
Beauchamp et al. 2004; van Atteveldt et al. 2004), which
first calculated the overlap of unisensory maps as a way to
map candidate sites for multisensory integration and sub-
sequently performed comparisons between bi- versus
Table 3 Functional activation profiles of ROIs in experiment 2
ROI Stat V [ 0 A [ 0 CON [ V CON [ A INL [ V INL [ A INH [ V INH [ A CON M4 INL M4 INH 4
Left_pSTS t 10.4 7.2 2.8 5.2 5.5 7.9 4.4 6.8 2.8 5.5 4.4
P 0.000 0.000 0.005 0.000 0.000 0.000 0.000 0.000 0.005 0.000 0.000
Right_pSTS t 13.1 15.1 1.4 -0.1 5.0 3.5 5.1 3.6 -0.1 3.5 3.6
P 0.000 0.000 0.148 0.960 0.000 0.000 0.000 0.000 0.960 0.000 0.000
Left_VOT t 19.3 8.4 2.8 10.9 2.9 11.2 4.2 12.2 2.8 2.9 4.2
P 0.000 0.000 0.005 0.000 0.004 0.000 0.000 0.000 0.005 0.004 0.000
Right_VOT t 14.6 8.1 1.3 6.1 2.7 7.7 3.5 8.3 1.3 2.7 3.5
P 0.000 0.000 0.197 0.000 0.008 0.000 0.001 0.000 0.197 0.008 0.001
Left_VMO t 5.8 7.2 1.8 0.8 3.6 2.5 3.8 2.7 0.8 2.5 2.7
P 0.000 0.000 0.068 0.435 0.000 0.012 0.000 0.007 0.435 0.012 0.007
Right_VMO t 6.5 5.9 1.0 1.4 1.4 1.8 2.7 3.2 1.0 1.4 2.7
P 0.000 0.000 0.324 0.151 0.176 0.069 0.006 0.001 0.324 0.176 0.006
Left_PPC t 12.5 6.4 -0.4 4.2 2.0 6.7 2.8 7.3 -0.4 2.0 2.8
P 0.000 0.000 0.717 0.000 0.049 0.000 0.005 0.000 0.717 0.049 0.005
Right_PPC t 12.3 9.4 -1.6 0.5 -0.1 2.1 0.8 2.9 -1.6 -0.1 0.8
P 0.000 0.000 0.110 0.615 0.906 0.040 0.433 0.004 0.615 0.906 0.433
Left_PFC t 10.5 13.4 1.5 -0.7 3.4 1.1 5.8 3.6 -0.7 1.1 3.6
P 0.000 0.000 0.126 0.511 0.001 0.267 0.000 0.000 0.511 0.267 0.000
Right_PFC t 8.5 13.8 3.6 -0.3 3.6 -0.5 7.5 3.5 -0.3 -0.5 3.5
P 0.000 0.000 0.000 0.738 0.000 0.610 0.000 0.000 0.738 0.610 0.000
Left_AC t 2.5 15.8 8.4 -1.6 9.7 -0.6 11.6 1.6 -1.6 -0.6 1.6
P 0.014 0.000 0.000 0.119 0.000 0.540 0.000 0.101 0.119 0.540 0.101
Left_dPMC t 9.0 13.1 1.6 -1.4 1.7 -1.5 4.1 1.0 -1.4 -1.5 1.0
P 0.000 0.000 0.110 0.149 0.092 0.143 0.000 0.304 0.149 0.143 0.304
Results of the group GLM on data from experiment 2 for the ROIs as defined in experiment 1. The columns represent statistical contrasts for
which t and P values are provided for each ROI. Wherever the extended max-criterion (M4, i.e., 0 \ A \ AV [ V [ 0) was found to be met,
P values are highlighted. Bold values are significant as per the MAX-criterion
A auditory, V visual, CON AV congruent, INL AV incongruent same category, INH AV incongruent different categories, pSTS posterior superior
temporal sulcus, VOT ventral occipito-temporal cortex, VMO ventro-medial occipital cortex, PPC posterior parietal cortex, PFC prefrontal
cortex, AC auditory cortex, dPMC dorsal pre-motor cortex
316 Exp Brain Res (2011) 213:309–320
123
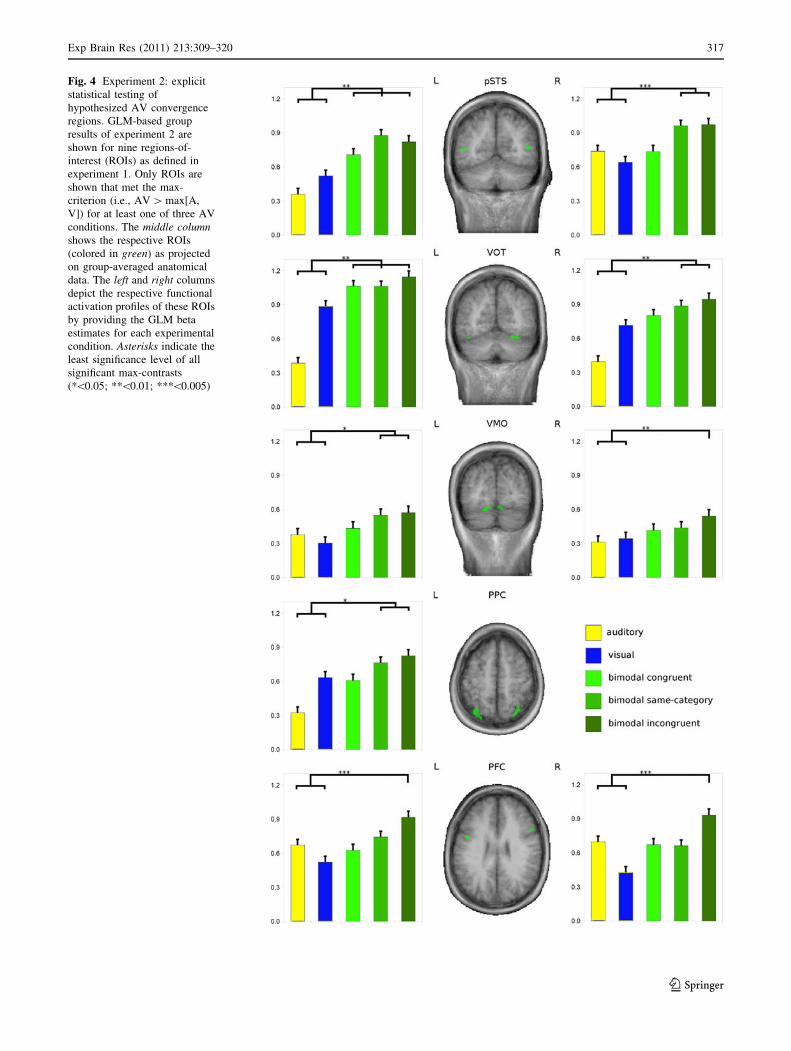
Fig. 4 Experiment 2: explicit
statistical testing of
hypothesized AV convergence
regions. GLM-based group
results of experiment 2 are
shown for nine regions-of-
interest (ROIs) as defined in
experiment 1. Only ROIs are
shown that met the max-
criterion (i.e., AV [ max[A,
V]) for at least one of three AV
conditions. The middle columnshows the respective ROIs
(colored in green) as projected
on group-averaged anatomical
data. The left and right columns
depict the respective functional
activation profiles of these ROIs
by providing the GLM beta
estimates for each experimental
condition. Asterisks indicate the
least significance level of all
significant max-contrasts
(*\0.05; **\0.01; ***\0.005)
Exp Brain Res (2011) 213:309–320 317
123

unimodal experimental conditions within these candidate
regions. The findings from our GLM-based whole-brain
analysis correspond to the finding of AV integration in
these studies.
All three PFC and PPC ROIs appeared to be more
strongly activated (but this was not supported by a post hoc
ANOVA, F = 0.1352, P [ 0.05) when the stimuli in the
two modalities were semantically incongruent and para-
metrically increasing the level of semantic incongruency
(i.e., the conceptual distance between the auditory and
visual stimulus components). This suggests that the fronto-
parietal network is likely concerned with higher-level
(cognitive rather than perceptual) AV processing, when a
certain amount of stimulus abstraction has already been
achieved (van Atteveldt et al. 2004; Hein et al. 2007;
Doehrmann and Naumer 2008; Naumer et al. 2009; Werner
and Noppeney 2010a). An effective connectivity study
(Noppeney et al. 2008) using a crossmodal priming para-
digm has shed some light on the (hierarchical) roles of
these congruency-sensitive integration sites, suggesting
that their activation during incongruent stimulation con-
stitutes unsuppressed input from low-level regions.
Another distinction of several integrative regions can be
made on the basis of what stimulus types affect them, as
shown in a study in which irrelevant auditory cues affected
the perception and processing of visual motion stimuli
(Sadaghiani et al. 2009).
How ICA-based analysis can contribute to multisensory
fMRI research
We employed a two-step fMRI data analysis approach to
investigate object-related AV convergence in human
cerebral cortex. This approach combined hypothesis-gen-
erating ICA used to define a widely distributed set of AV
candidate regions (experiment 1) and the hypothesis-testing
GLM as employed to explicitly test the hypothesized sites
of AV convergence using established statistical criteria
(experiment 2). Even though there is a continuing debate
about both the inclusion and the particular roles of diverse
brain regions (Calvert 2001; Beauchamp 2005b; Hocking
and Price 2008; Stevenson et al. 2009), there is a growing
consensus that object-related multisensory integration
critically involves distributed processing, presumably
within a multi-level hierarchy of brain regions (Amedi
et al. 2005; Doehrmann and Naumer 2008; Driver and
Noesselt 2008; Naumer and Kaiser 2010). The use of sICA
appears to be of particular value for human multisensory
research, as it provides a robust non-invasive measure of
neural coactivation. The use of an IC grouping method,
such as the hierarchical clustering method applied here,
does not only facilitate the generalization to the population
level but also precludes the potential effects of local
minima in ICA (Himberg et al. 2004). However, as sICA is
a data-driven approach, which can be used for the gener-
ation of specific hypotheses (Castelo-Branco et al. 2002), it
is recommended to complement it by explicit statistical
hypothesis testing based on independent data. Interestingly,
increased attention to data-driven methods such as sICA
has already been given in the context of complex and
ecologically valid environmental perception (van de Ven
et al. 2004, 2008, 2009; Bartels and Zeki 2005; Esposito
et al. 2005; Malinen et al. 2007) of which multisensory
object perception can be regarded as another prominent
example. In addition, the clustering approach of single-
subject decompositions within the sogICA framework
essentially provides a random effects approach that is
similar to its GLM-based counterpart and allowed us to
compare their detection power in our study. Thus, we are
confident that independent statistical testing of hypotheses
generated using sICA might provide important results for
the debate on rivaling models of multisensory integration
in the human brain.
We demonstrated that sICA is able to effectively reveal
a comprehensive ensemble of candidate regions for AV
convergence. These are less likely detected in whole-brain
GLM contrasts (e.g., AV [ max[A, V]) such as the one we
computed and reported here for comparison (see Electronic
Supplementary Material for details). An attempt to com-
pare our two-step method directly with a classical whole-
brain GLM approach resulted in a lack of results for the
latter when using the similar correction criterion of FDR,
and a disadvantage in detection (three sites as compared
two nine) and specificity (only one of the whole-brain
GLM detected regions showed a significant ROI-based
integration effect) when using the more liberal threshold.
While multivariate sICA also allows the detection and
removal of typical fMRI-related artifacts (Thomas et al.
2002; Liao et al. 2006; see also Electronic Supplementary
Material) its increased sensitivity in the detection of
functionally coupled multisensory networks is mainly due
to the fact that this method makes implicit use of functional
connectivity information in the data via its one time course
per map constraint.
Potential limitations and future directions
This study aimed at comprehensively revealing the human
cortical network involved in object-related AV integration.
As the experimentally manipulated dimension of
integration—semantic congruency—could not be directly
compared to multisensory convergence based on spatio-
temporal proximity, we were not able to differentiate fur-
ther between diverse hierarchical levels of multisensory
convergence. In order to achieve a more precise functional
characterization of the reported clusters in unisensory
318 Exp Brain Res (2011) 213:309–320
123

cortices, future studies should include topographic (i.e.,
tonotopic and retinotopic) mappings. Finally, measure-
ments of effective connectivity, as provided by methods
such as dynamic causal modelling (DCM; Friston et al.
2003; Werner and Noppeney 2010a) should enable the
determination of interdependencies between the diverse
components of the described cortical network.
Conclusion
The combination of hypothesis-generating group ICA and
hypothesis-testing ROI-based GLM analysis of fMRI data
allowed us to reveal the distributed cortical network of
multisensory convergence regions involved in human AV
object perception. Our findings support the assumption of a
coordinated interplay between lower- and higher-level
cortical regions specialized for distinct sub-processes of
human AV object perception and demonstrate how sICA
can be fruitfully applied in multisensory neuroimaging
research.
Acknowledgments This work was supported by the Bundesminis-
terium fur Bildung und Forschung (Brain Imaging Center Frankfurt;
BMBF DLR 01GO0508); the Hessisches Ministerium fur Wissen-
schaft und Kultur (LOEWE Forschungsschwerpunkt Neuronale
Koordination Frankfurt); The Netherlands Organization for Scientific
Research; and the Max Planck Society. We are grateful to Ariane
Meienbrock for the development of the auditory stimulation setup,
and Giancarlo Valente for helpful statistical suggestions. Correspon-
dence should be addressed to [email protected].
Open Access This article is distributed under the terms of the
Creative Commons Attribution Noncommercial License which
permits any noncommercial use, distribution, and reproduction in any
medium, provided the original author(s) and source are credited.
References
Amedi A, von Kriegstein K, van Atteveldt NM, Beauchamp MS,
Naumer MJ (2005) Functional imaging of human crossmodal
identification and object recognition. Exp Brain Res 166:559
Angelaki DE, Gu Y, DeAngelis GC (2009) Multisensory integration:
psychophysics, neurophysiology, and computation. Curr Opin
Neurobiol 19:452–458
Baier B, Kleinschmidt A, Muller NG (2006) Cross-modal processing
in early visual and auditory cortices depends on expected
statistical relationship of multisensory information. J Neurosci
26:12260
Bartels A, Zeki S (2005) The chronoarchitecture of the cerebral
cortex. Phil Trans R Soc B Biol Sci 360:733
Beauchamp MS (2005a) See me, hear me, touch me: multisensory
integration in lateral occipital-temporal cortex. Curr Opin
Neurobiol 15:145
Beauchamp MS (2005b) Statistical criteria in fMRI studies of
multisensory integration. Neuroinformatics 3:93–113
Beauchamp MS, Lee KE, Argall BD, Martin A (2004) Integration of
auditory and visual information about objects in superior
temporal sulcus. Neuron 41(5):809–823
Belardinelli MO, Sestieri C, Di Matteo R, Delogu F, Del Gratta C,
Ferretti A, Caulo M, Tartaro A, Romani GL (2004) Audio-visual
crossmodal interactions in environmental perception: an fMRI
investigation. Cogn Process 5:167–174
Bell AJ, Sejnowski TJ (1995) An information-maximization approach
to blind separation and blind deconvolution. Neural Comput
7:1129–1159
Boynton GM, Engel SA, Glover GH, Heeger DJ (1996) Linear
systems analysis of functional magnetic resonance imaging in
human V1. J Neurosci 16:4207–4221
Calhoun VD, Adali T, Pearlson GD, Pekar JJ (2001) Spatial and
temporal independent component analysis of functional MRI
data containing a pair of task-related wave-forms. Hum Brain
Mapp 13:43–53
Calhoun V, Adali T, Pekar J (2004) A method for comparing group
fMRI data using independent component analysis: application to
visual, motor and visuomotor tasks. Magn Reson Imaging
22(9):1181–1191
Calvert G (2001) Crossmodal processing in the human brain: insights
from functional neuroimaging studies. Cereb Cortex
11:1110–1123
Castelo-Branco M, Formisano E, Backes W, Zanella F, Neuensch-
wander S, Singer W, Goebel R (2002) Activity patterns in human
motion-sensitive areas depend on the interpretation of global
motion. Proc Natl Acad Sci USA 99:13914–13919
Doehrmann O, Naumer MJ (2008) Semantics and the multisensory
brain: how meaning modulates processes of audio-visual inte-
gration. Brain Res 1242:136–150
Doehrmann O, Weigelt S, Altmann CF, Kaiser J, Naumer MJ (2010)
Audio-visual fMRI adaptation reveals multisensory integration
effects in object-related sensory cortices. J Neurosci
30:3370–3379
Driver J, Noesselt T (2008) Multisensory interplay reveals crossmodal
influences on ‘sensory-specific’ brain regions, neural responses,
and judgments. Neuron 57:11
Eckert MA, Kamdar NV, Chang CE, Beckmann CF, Greicius MD,
Menon V (2008) A cross-modal system linking primary auditory
and visual cortices: evidence from intrinsic fMRI connectivity
analysis. Hum Brain Mapp 29:848–857
Esposito F, Scarabino T, Hyvarinen A, Himberg J, Formisano E,
Comani S, Tedeschi G, Goebel R, Seifritz E, Di Salle F (2005)
Independent component analysis of fMRI group studies by self-
organizing clustering. NeuroImage 25:193
Forman SD, Cohen JD, Fitzgerald M, Eddy WF, Mintun MA, Noll
DC (1995) Improved assessment of significant activation in
functional magnetic resonance imaging (fMRI): use of a cluster-
size threshold. Magn Reson Med 33:636–647
Friston KJ, Frith CD, Liddle PF, Frackowiak RS (1993) Functional
connectivity: the principal-component analysis of large (PET)
data sets. J Cereb Blood Flow Metab 13:5–14
Friston KJ, Harrison L, Penny W (2003) Dynamic causal modelling.
NeuroImage 19:1273
Ghazanfar A, Schroeder C (2006) Is neocortex essentially multisen-
sory? Trends Cogn Sci 10:278
Greicius MD, Krasnow B, Reiss AL, Menon V (2003) Functional
connectivity in the resting brain: a network analysis of the default
mode hypothesis. Proc Natl Acad Sci USA 100(1):253–258
Hein G, Doehrmann O, Muller NG, Kaiser J, Muckli L, Naumer MJ
(2007) Object familiarity and semantic congruency modulate
responses in cortical audio-visual integration areas. J Neurosci
27:7881–7887
Himberg J, Hyvarinen A, Esposito F (2004) Validating the indepen-
dent components of neuroimaging time series via clustering and
visualization. NeuroImage 22:1214–1222
Hocking J, Price CJ (2008) The role of the posterior superior temporal
sulcus in audiovisual processing. Cereb Cortex 18:2439–2449
Exp Brain Res (2011) 213:309–320 319
123

Hyvarinen A (1999) Fast and robust fixed-point algorithms for
independent component analysis. IEEE Trans Neural Netw
10:626–634
Kayser C, Logothetis NK (2007) Do early sensory cortices integrate
cross-modal information? Brain Struct Funct 212:121
Lewis JW (2010) Audio-visual perception of everyday natural
objects–Hemodynamic studies in humans. In: Naumer MJ,
Kaiser J (eds) Multisensory object perception in the primate
brain. Springer, New York, pp 155–190
Liao R, McKeown MJ, Krolik JL (2006) Isolation and minimization
of head motion-induced signal variations in fMRI data using
independent component analysis. Magn Reson Med 55:1396–
1413
Macaluso E (2006) Multisensory processing in sensory-specific
cortical areas. Neuroscientist 12:327
Malinen S, Hlushchuk Y, Hari R (2007) Towards natural stimulation
in fMRI—issues of data analysis. NeuroImage 35:131
Martuzzi R, Murray MM, Michel C, Thiran J, Maeder P, Clarke S,
Meuli RA (2007) Multisensory interactions within human
primary cortices revealed by BOLD dynamics. Cereb Cortex
17:1672–1679
McKeown MJ, Makeig S, Brown GG, Jung TP, Kindermann SS, Bell
AJ, Sejnowski TJ (1998) Analysis of fMRI data by blind
separation into independent spatial components. Hum Brain
Mapp 6:160–188
Meienbrock A, Naumer MJ, Doehrmann O, Singer W, Muckli L
(2007) Retinotopic effects during spatial audio-visual integra-
tion. Neuropsychologia 45:531
Meyer GF, Wuerger S, Greenlee M (In press) Interactions between
auditory and visual semantic stimulus classes: evidence for
common processing networks for speech and body actions.
J Cogn Neurosci
Moritz CH, Rogers BP, Meyerand ME (2003) Power spectrum ranked
independent component analysis of a periodic fMRI complex
motor paradigm. Hum Brain Mapp 18(2):111–122
Naumer MJ, Kaiser J (eds) (2010) Multisensory object perception in
the primate brain. Springer, New York
Naumer MJ, Doehrmann O, Muller NG, Muckli L, Kaiser J, Hein G
(2009) Cortical plasticity of audio-visual object representations.
Cereb Cortex 19:1641–1653
Noesselt T, Rieder JW, Schoenfeld MA, Kanowski M, Hinrichs H,
Heinze HJ, Driver J (2007) Audiovisual temporal correspon-
dence modulates human multisensory superior temporal sulcus
plus primary sensory cortices. J Neurosci 27:11431–11441
Noppeney U, Josephs O, Hocking J, Price CJ, Friston KJ (2008) The
effect of prior visual information on recognition of speech and
sounds. Cereb Cortex 18:598–609
Noppeney U, Ostwald D, Werner S (2010) Perceptual decisions
formed by accumulation of audiovisual evidence in prefrontal
cortex. J Neurosci 30:7434–7446
Rajapakse JC, Tan CL, Zheng X, Mukhopadhyay S, Yang K (2006)
Exploratory analysis of brain connectivity with ICA. IEEE Eng
Med Biol Mag 25:102–111
Rogers BP, Morgan VL, Newton AT, Gore JC (2007) Assessing
functional connectivity in the human brain by fMRI. Magn
Reson Imaging 25:1347–1357
Sadaghiani S, Maier JX, Noppeney U (2009) Natural, metaphoric, and
linguistic auditory direction signals have distinct influences on
visual motion processes. J Neurosci 29:6490–6499
Schroeder CE, Foxe JJ (2005) Multisensory contributions to low-
level, ‘unisensory’ processing. Curr Opin Neurobiol 15:454
Stein BE, Meredith MA (1993) The merging of the senses. MIT Press,
Cambridge
Stevenson R, Geoghegan M, James T (2007) Superadditive BOLD
activation in superior temporal sulcus with threshold non-speech
objects. Exp Brain Res 179(1):85–95
Stevenson RA, Kim S, James TW (2009) An additive-factors design
to disambiguate neuronal and areal convergence: measuring
multisensory interactions between audio, visual, and haptic
sensory streams using fMRI. Exp Brain Res 198:183–194
Talairach J, Tournoux P (1998) Co-planar stereotaxic atlas of the
human brain. Thieme Medical, New York
Thomas CG, Harshman RA, Menon RS (2002) Noise reduction in
BOLD-based fMRI using component analysis. Neuroimage
17:1521–1537
van Atteveldt NM, Formisano E, Goebel R, Blomert L (2004)
Integration of letters and speech sounds in the human brain.
Neuron 43:271–282
van Atteveldt NM, Blau VC, Blomert L, Goebel R (2010) fMR-
adaptation indicates selectivity to audiovisual content congru-
ency in distributed clusters in human superior temporal cortex.
BMC Neuroscience 11:11
van de Ven VG, Formisano E, Prvulovic D, Roeder CH, Linden DEJ
(2004) Functional connectivity as revealed by spatial indepen-
dent component analysis of fMRI measurements during rest.
Hum Brain Mapp 22:165–178
van de Ven VG, Bledowski C, Prvulovic D, Goebel R, Formisano E,
Linden DEJ, Di Salle F, Esposito F (2008) Visual target
modulation of functional connectivity networks revealed by self-
organizing group ICA. Hum Brain Mapp 29:1450–1461
van de Ven V, Esposito F, Christoffels IK (2009) Neural network of
speech monitoring overlaps with overt speech production and
comprehension networks: a sequential spatial and temporal ICA
study. Neuroimage 47:1982–1991
Werner S, Noppeney U (2010a) Distinct functional contributions of
primary sensory and association areas to audiovisual integration
in object categorization. J Neurosci 30:2662–2675
Werner S, Noppeney U (2010b) Superadditive responses in superior
temporal sulcus predict audiovisual benefits in object categori-
zation. Cereb Cortex 20(8):1829–1842
320 Exp Brain Res (2011) 213:309–320
123