Inverse freezing in molecular binary mixtures of alpha-cyclodextrin and 4-methylpyridine
6
Inverse freezing in molecular binary mixtures of a-cyclodextrin and 4-methylpyridine Marie Plazanet,* abc Paolo Bartolini, a Claudio Sangregorio, d Andrea Taschin, a Renato Torre ae and Hand-Peter Trommsdorff bc Received 13th November 2009, Accepted 17th March 2010 First published as an Advance Article on the web 13th May 2010 DOI: 10.1039/b923682a Ternary solutions of a-cyclodextrin (aCD) in 4-methylpyridine (4MP)/water mixtures solidify when heated and melt when cooled, and the crystalline solid phase exhibits a rich phase behavior as a function of temperature. In this work, we extend these earlier investigations to pure binary mixtures of aCD in water free 4MP, characterized via temperature and time dependent measurements of viscosity, X-ray diffraction, and infrared spectroscopy, complemented by observations of acoustic properties and small angle neutron diffraction. At high concentrations (4500 g l 1 ), these solutions enter an amorphous solid phase not only with decreasing but also with increasing temperature, before crystallizing at higher temperatures. This inverse solidification is attributed to the growth of hydrogen bonded clusters, leading to a steep increase of the viscosity with temperature. 1. Introduction Contrary to everyday experience, reversible solidification upon heating and melting upon cooling may occur for some substances. This phenomenon of ‘‘inverse’’ melting or freezing was already predicted hundred years ago 1 and was also experimentally observed in a number of systems, see for example ref. 2–4. Liquid–solid transitions with increasing temperature are usually termed inverse melting when the solid state is crystalline and inverse freezing for a transition towards a glassy or gel state. A non exhaustive review of inverse transitions was recently published by Schupper and Shnerb, 5 together with a description of mechanisms leading to these phenomena. A central issue concerns the source of entropy upon heating, when at least part of the system enters a more ordered state. The problem is common to binary mixtures, undergoing demixing with temperature, 6 or to the cold denaturation of proteins: 7 the high temperature state appears to be more ordered than the low temperature one. Many organic systems undergoing inverse freezing are based on polymer mixtures, for example PEO-PPO-PEO 3 or methyl-cellulose. 4 In the case of methyl cellulose, the chain conformation extends upon increasing temperature to form a network that blocks the polymer mobility and leads to a dramatic increase of the viscosity. At the same time, this conformational modification provides a source of the entropy as more configurations become accessible to the polymer and also because the water trapped within the chain becomes free to circulate in the network formed by the aggregated chains. As a result, a gel is formed. Other mixtures prone to complex behavior are colloidal solutions. As a function of concentration and time, these solutions undergo either a glass transition or crystallization as well as re-entrant melting 8 or enter multiple glassy states. 9,10 For example, glass–liquid–glass transitions have been observed upon increasing the addition of a non adsorbing polymer to a colloid suspension of nearly hard spheres. In order to induce the reentrant transition, a difference in size and in short time mobility of the polymeric components was postulated in addition to effective depletive attraction at higher polymer concentrations. 11 The terminology employed to describe the dynamical arrest of a liquid does not always distinguish between a glass transition and gelation. As addressed by several authors, 12–14 a simplified scenario of the sol–gel transition is characterized by an aggregation (clusters formation, phase separation...), leading to percolation and eventually the dynamical arrest of the system. This transition is related to a large increase of the structure factor, S(Q), at small Q. In contrast, the glass formation is due to a purely dynamical arrest of a homo- geneous system at all length scales. However, both transitions lead to a loss of ergodicity and have numerous other features in common. In both cases, the entropy lost by the apparent ordering and/or dynamic arrest of one component is compensated by an increase of entropy of the other component (solvent). The phenomenological scenario of inverse freezing described above requires more work in order to better define common features of inverse liquid–glass and liquid–gel transitions regarding both dynamics and thermodynamics. We report here experi- mental evidence of an inverse freezing transition in a novel binary mixture composed of relatively simple and non-polymeric molecules: a-cyclodextrin (aCD) and 4-methylpyridine (4MP). a European Laboratory for Non-Linear Spectroscopy (LENS), Universita di Firenze, Via N. Carrara 1, I-50019 Sesto Fiorentino, Firenze, Italy. E-mail: [email protected]; Fax: +33 (0) 476 63 54 95; Tel: +33 (0) 476 51 43 35 b Institut Laue Langevin, BP 156X, 38042 Grenoble Cx, France c Laboratoire de Spectrome ´trie Physique, Universite ´ Joseph Fourier, CNRS (UMR 5588), BP 87, 38402 St Martin d’He `res Cx, France d Dipartimento di Chimica and INSTM, Universita ` di Firenze, Via Della Lastruccia 3, I-50019 Sesto Fiorentino, Firenze, Italy e Dipartimento di Fisica, Universita ` di Firenze, Via Sansone 1, I-50019 Sesto Fiorentino, Firenze, Italy 7026 | Phys. Chem. Chem. Phys., 2010, 12, 7026–7031 This journal is c the Owner Societies 2010 PAPER www.rsc.org/pccp | Physical Chemistry Chemical Physics
-
Upload
independent -
Category
Documents
-
view
1 -
download
0
Transcript of Inverse freezing in molecular binary mixtures of alpha-cyclodextrin and 4-methylpyridine
Inverse freezing in molecular binary mixtures of a-cyclodextrin and
4-methylpyridine
Marie Plazanet,*abc Paolo Bartolini,a Claudio Sangregorio,d Andrea Taschin,a
Renato Torreae
and Hand-Peter Trommsdorffbc
Received 13th November 2009, Accepted 17th March 2010
First published as an Advance Article on the web 13th May 2010
DOI: 10.1039/b923682a
Ternary solutions of a-cyclodextrin (aCD) in 4-methylpyridine (4MP)/water mixtures solidify
when heated and melt when cooled, and the crystalline solid phase exhibits a rich phase behavior
as a function of temperature. In this work, we extend these earlier investigations to pure binary
mixtures of aCD in water free 4MP, characterized via temperature and time dependent
measurements of viscosity, X-ray diffraction, and infrared spectroscopy, complemented by
observations of acoustic properties and small angle neutron diffraction. At high concentrations
(4500 g l�1), these solutions enter an amorphous solid phase not only with decreasing but also
with increasing temperature, before crystallizing at higher temperatures. This inverse solidification
is attributed to the growth of hydrogen bonded clusters, leading to a steep increase of the
viscosity with temperature.
1. Introduction
Contrary to everyday experience, reversible solidification
upon heating and melting upon cooling may occur for some
substances. This phenomenon of ‘‘inverse’’ melting or freezing
was already predicted hundred years ago1 and was also
experimentally observed in a number of systems, see for
example ref. 2–4. Liquid–solid transitions with increasing
temperature are usually termed inverse melting when the solid
state is crystalline and inverse freezing for a transition towards
a glassy or gel state. A non exhaustive review of inverse
transitions was recently published by Schupper and Shnerb,5
together with a description of mechanisms leading to these
phenomena. A central issue concerns the source of entropy
upon heating, when at least part of the system enters a more
ordered state. The problem is common to binary mixtures,
undergoing demixing with temperature,6 or to the cold
denaturation of proteins:7 the high temperature state appears
to be more ordered than the low temperature one.
Many organic systems undergoing inverse freezing are
based on polymer mixtures, for example PEO-PPO-PEO3 or
methyl-cellulose.4 In the case of methyl cellulose, the chain
conformation extends upon increasing temperature to form a
network that blocks the polymer mobility and leads to a
dramatic increase of the viscosity. At the same time, this
conformational modification provides a source of the entropy
as more configurations become accessible to the polymer and
also because the water trapped within the chain becomes free
to circulate in the network formed by the aggregated chains.
As a result, a gel is formed.
Other mixtures prone to complex behavior are colloidal
solutions. As a function of concentration and time, these
solutions undergo either a glass transition or crystallization
as well as re-entrant melting8 or enter multiple glassy states.9,10
For example, glass–liquid–glass transitions have been observed
upon increasing the addition of a non adsorbing polymer to a
colloid suspension of nearly hard spheres. In order to induce
the reentrant transition, a difference in size and in short time
mobility of the polymeric components was postulated in
addition to effective depletive attraction at higher polymer
concentrations.11
The terminology employed to describe the dynamical arrest
of a liquid does not always distinguish between a glass transition
and gelation. As addressed by several authors,12–14 a simplified
scenario of the sol–gel transition is characterized by an
aggregation (clusters formation, phase separation. . .), leading
to percolation and eventually the dynamical arrest of the
system. This transition is related to a large increase of the
structure factor, S(Q), at small Q. In contrast, the glass
formation is due to a purely dynamical arrest of a homo-
geneous system at all length scales. However, both transitions
lead to a loss of ergodicity and have numerous other features
in common. In both cases, the entropy lost by the apparent
ordering and/or dynamic arrest of one component is compensated
by an increase of entropy of the other component (solvent).
The phenomenological scenario of inverse freezing described
above requires more work in order to better define common
features of inverse liquid–glass and liquid–gel transitions regarding
both dynamics and thermodynamics. We report here experi-
mental evidence of an inverse freezing transition in a novel binary
mixture composed of relatively simple and non-polymeric
molecules: a-cyclodextrin (aCD) and 4-methylpyridine (4MP).
a European Laboratory for Non-Linear Spectroscopy (LENS),Universita di Firenze, Via N. Carrara 1, I-50019 Sesto Fiorentino,Firenze, Italy. E-mail: [email protected];Fax: +33 (0) 476 63 54 95; Tel: +33 (0) 476 51 43 35
b Institut Laue Langevin, BP 156X, 38042 Grenoble Cx, Francec Laboratoire de Spectrometrie Physique, Universite Joseph Fourier,CNRS (UMR 5588), BP 87, 38402 St Martin d’Heres Cx, France
dDipartimento di Chimica and INSTM, Universita di Firenze,Via Della Lastruccia 3, I-50019 Sesto Fiorentino, Firenze, Italy
eDipartimento di Fisica, Universita di Firenze, Via Sansone 1,I-50019 Sesto Fiorentino, Firenze, Italy
7026 | Phys. Chem. Chem. Phys., 2010, 12, 7026–7031 This journal is �c the Owner Societies 2010
PAPER www.rsc.org/pccp | Physical Chemistry Chemical Physics

For concentrations higher than B500 g l�1 of aCD in 4MP,
the solution becomes an isotropic, transparent solid when
heated to temperatures above B46 1C that returns to the
homogeneous liquid state with unchanged chemical composition
upon cooling. To the best of our knowledge, this is the first
example of such a reversible, inverse liquid–gel transition for
a non-polymeric, molecular system. As explained below in
section 3, the system is metastable with respect to crystal-
lization, which may occur within months at ambient temperature.
Crystallization is also observed to occur within hours above
60 1C.
This binary system has similarities with the solutions of
aCD in 4MP, containing about 2% of water, which have been
studied previously.15–17 For these ternary solutions, the solid
phase, formed upon heating, is inhomogeneous and is a
mixture of crystals of ca. 10 mm size and residual solvent. In
contrast, in the binary solutions studied here, the solid phase is
homogeneous down to at least 100 nm.
In the following, after explaining materials and methods, we
present this system and report in subsequent sections different
characterizations: measurements as a function of temperature
and time of the viscosity, of the structure, and of infrared
spectra. Relevant observations from optical transient grating
and small angle neutron scattering measurements are also
included. Finally, we discuss these results and conclude.
2. Materials and methods
Commercial aCD (Sigma-Aldrich) is a hydrate and contains
six water molecules per aCD. The hydration water was
eliminated by heating the compound under vacuum for about
one hour above 80–90 1C. 4MP (98% Aldrich) was vacuum
distilled and stored over a 3 A molecular sieve to remove
water. Samples are prepared and stored under inert atmosphere
in order to avoid water contamination. Under these conditions,
very high concentration samples, up to 1000 g l�1, could be
prepared. The increase of viscosity with aCD concentration
and the ensuing very long times required to reach homo-
geneous samples become the main limiting factors. Note that
the solubility at ambient temperature of aCD-hydrate in water
free 4MP is limited to about 450 g l�1 and drops to about
350 g l�1 when 2% water is added.16
Except when otherwise specified, all measurements where
made with samples of 600 g l�1 concentration.
The viscosity was measured using a home-built falling ball
viscometer. The measurement tube (1 cm diameter and 10 cm
length) containing a stainless steel ball of 1.58 mm diameter
(weight 16.7 mg) was filled under controlled, water-free
atmosphere with the sample and sealed. The steel ball was
manipulated with magnets and was filmed during its fall. The
speed of the ball is obtained from the movie, and geometric
corrections, taking into account the dimensions of the tube,
are included before extracting the shear viscosity. The
temperature of the tube was regulated to better than �0.2 1C.
The accessible range of viscosities that can be conveniently
measured with this system lies between 10�2 and about
300 Poise and is limited, on one side, by the time it takes
to reach thermal equilibrium and, on the other, by the
requirement that the evolution of the solution should be
negligible during the measurement.
X-ray diffraction measurements were performed using a
perfectly tight cell, built to ensure a homogeneous temperature
of the sample. The sample was placed between thin glass cover
slides (thickness 100 mm) separated by a teflon spacer of 500 mm.
The signal from the empty cell was subtracted. The data were
recorded for a momentum transfer (Q) of 0.13–1.8 A�1, using
the Ka radiation of a rotating copper anode (l = 1.54 A).
Infrared spectra were recorded with a commercial spectro-
meter in the region of the first overtone of the OH stretch
mode using quartz cells of 2 and 10 mm thickness. The
temperature of the cell was controlled to �0.2 1C.
The transient grating measurements of the acoustic properties
as well as the small angle neutron scattering studies on this
system, which have also been made, will be presented in detail
in a separate publication and only some relevant results are
included here.
3. System and phase diagram
aCD, composed of six glucose units, is the smallest member of
the family of cyclodextrins, cyclic glucose oligomers of conical
shape, known to form inclusion compounds with a large
variety of small molecules.18,19 The three OH groups per
glucose unit are capable of forming intra- or inter-molecular
hydrogen bonds. Cyclodextrins easily form supramolecular
assemblies,20,21 for example carbohydrate nanotubular
structures,22 and the formation of isotropic physical gels
has been reported for solutions of rigorously anhydrous
b-cyclodextrine and dry pyridine.23
We recently reported the phase behavior of solutions
composed of aCD, 4MP and water,16 in which the solubility
of aCD decreases with increasing temperature with a sudden
drop around 70 K. The formed solid is a crystalline gel and
undergoes a series of further phase transitions as a function of
temperature. All transitions are endothermic.16,24,25 As all
measurements are strongly dependent on the presence of
water, a rearrangement of hydrogen bonds and the formation
of intermolecular at the expense of intramolecular bonds was
invoked to explain and to model the inverse melting transition.
It therefore seemed important to investigate water-free
solutions of aCD in 4MP. At ambient temperature, these
strictly water free solutions are perfectly transparent and
appear to be homogeneous down to below 5 nm as born out
by small angle neutron scattering.
Below B500 g l�1, the behavior of the dry solution is
reminiscent of solutions containing water: when heated, a
white solid is formed but the fraction of solid phase is much
smaller than in equivalent water-containing solutions.
Solutions with concentrations above ca. 500 g l�1 transform,
when heated, to a perfectly transparent and homogeneous
solid, which returns to the liquid state when cooled to
ambient temperature. This transformation is accompanied
by a significant contraction of the sample and leads to cracks
and voids in the sample. In a 600 g l�1 sample the solidification
takes place around 48 1C in about one hour. Measurements of
the speed of sound during this transformation indicate a
density increase of at least 2%. After several hours, the sample
This journal is �c the Owner Societies 2010 Phys. Chem. Chem. Phys., 2010, 12, 7026–7031 | 7027
becomes slightly translucent. At higher temperatures, the
sample turns turbid in a shorter time (280 min at 60 1C,
45 min at 70 1C). These samples return to the liquid state upon
cooling. At 100 1C, the sample becomes white and X-rays
measurements indicate the formation of crystals. Crystals that
have grown sufficiently by maintaining the sample at 100 1C
do not melt upon cooling.
Cooling of these samples leads to ‘‘normal’’ glass formation
as frequently observed for such molecular systems. At ambient
temperature, solutions can be kept in the liquid state for
several months. However, we observed that some samples
turned solid after long times (months), forming large
(transparent) crystals soaked in a small excess of solvent.
The concentration of aCD in the residual solvent is 120 g l�1.
The crystals show a diffraction pattern that is similar, but not
identical to the one observed for crystals formed at high
temperatures and could not be melted by changing the
temperature by�20 1C. The liquid–solid transitions characterized
in the following take therefore place in a system that is
metastable with respect to crystallization.
4. Viscosity
The measurements were performed at fixed temperatures at
various waiting times, tw: starting at an equilibration temperature
of 40 1C, the final temperature is approached as rapidly as
possible; typically thermalization is reached within 1 min.
Then, the viscosity is measured after variable waiting times,
from a minimum of 1 to a maximum of 120 min. The duration
of viscosity measurements, tm, is always shorter than the
waiting times, tw, for all temperatures/viscosities tm o 0.1 tw.
Between measurements, the sample is cooled to room
temperature for a time laps sufficient to re-establish the
homogeneous liquid state.
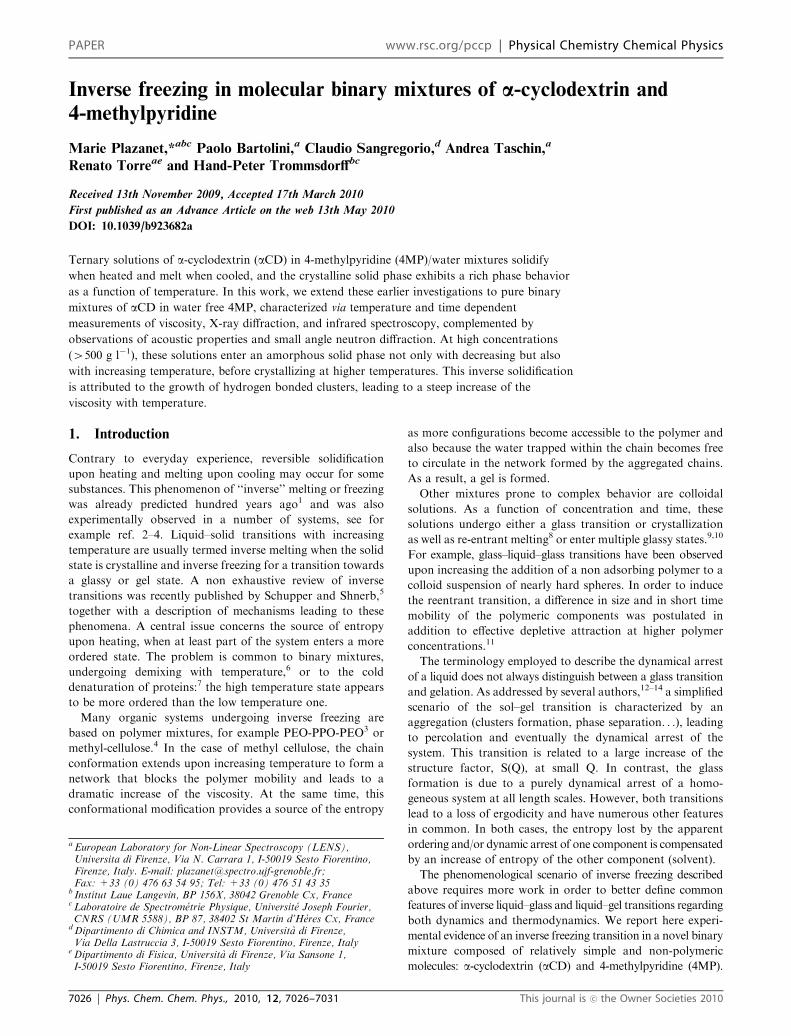
The results are shown in Fig. 1. In Fig. 1, left panel, are
shown viscosity data versus temperature taken at three
different waiting times, tw = 1, tw = 8, and tw = 60 min.
For temperatures T o 45 1C, the viscosity shows a typical
Arrhenius dependence as expected for a normal liquid phase,
and does not exhibit any time dependence (even for tens of
hours). In contrast, for T 4 45 1C, the viscosity depends on
the waiting time and a clear departure from Arrhenius behavior
is observed. In the Fig. 1, right panel, the time dependence of
the viscosity is shown for three fixed temperatures. For the
lowest temperature, 45 1C, the viscosity remains nearly stable
at its liquid state value for about 2 h. Afterward a slow
increase is observed. At the other two temperatures, 47 and
50 1C, the viscosity increases strongly after a waiting time,
and both data sets suggest that this increase approaches
asymptotically a power law dependence, the exponent being
the same for both temperatures. In fact, all data can be
represented by the following single master curve:
Z(tw,T) = A(T) F(tw/t) (1)
with F(t) = 1 + tg
This is illustrated in Fig. 2. A(T) is the temperature dependence
of the viscosity at 0 waiting time and the values of A(T)
are obtained by extrapolating the Arrhenius dependence of
the viscosity data in Fig. 1, left panel. The temperature
dependence of the scaling factor, t, is shown as inset of
Fig. 2; t decreases by two orders of magnitude between
45 and 50 1C. At long waiting times, the master function,
F(t), approaches asymptotically a power law, tg, with
g = 3.0 � 0.05. The data show that in this system a physical
process appears on heating that gradually leads to a complete
solidification. In the solid state, the viscosity exceeds 106 poise,
as demonstrated by the arrest of the steel ball to within an
accuracy of 0.1 mm over more than 10 h, but quantitative
measurements with our apparatus are no longer possible for
the reasons explained in section 2.
5. Diffraction
The structure of the solid phase was characterized by X-ray
diffraction. The liquid phase was investigated at fixed
temperatures, and the time dependence of the diffractograms
was also investigated for temperatures of 48, 60 and 100 1C, in
order to determine the kinetics of the solid phase formation.
The measuring time for one spectrum was 60 s, a short time
compared to the characteristic timescale of the kinetics around
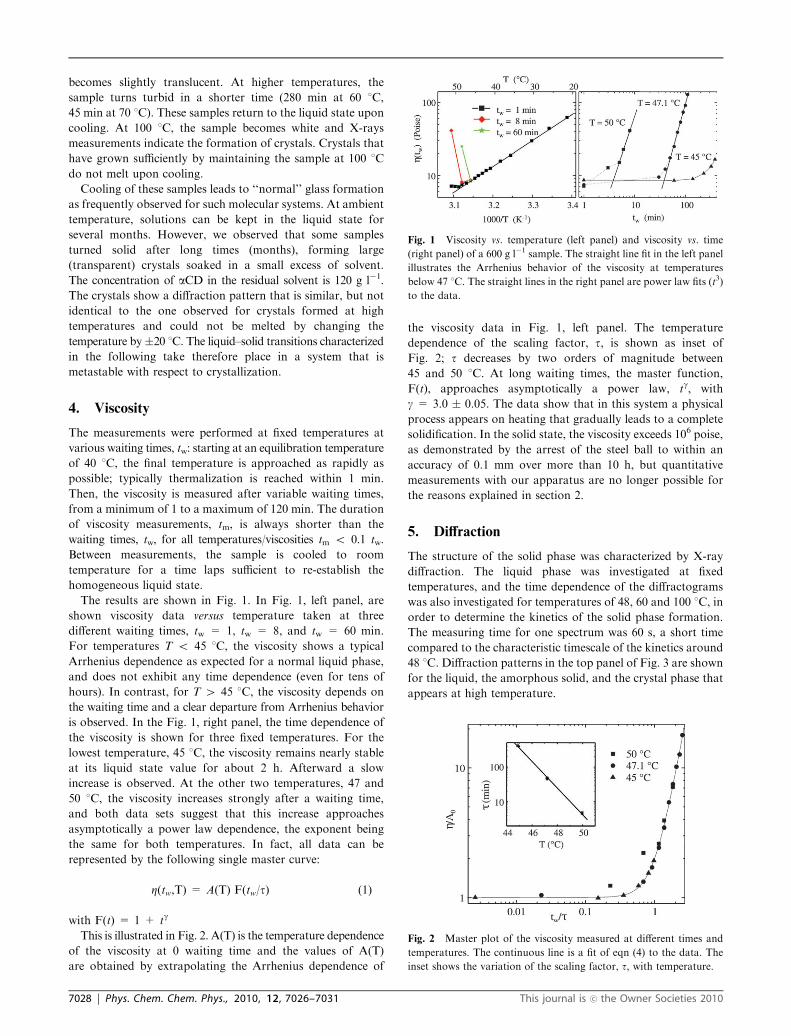
48 1C. Diffraction patterns in the top panel of Fig. 3 are shown
for the liquid, the amorphous solid, and the crystal phase that
appears at high temperature.
Fig. 1 Viscosity vs. temperature (left panel) and viscosity vs. time
(right panel) of a 600 g l�1 sample. The straight line fit in the left panel
illustrates the Arrhenius behavior of the viscosity at temperatures
below 47 1C. The straight lines in the right panel are power law fits (t3)
to the data.
Fig. 2 Master plot of the viscosity measured at different times and
temperatures. The continuous line is a fit of eqn (4) to the data. The
inset shows the variation of the scaling factor, t, with temperature.
7028 | Phys. Chem. Chem. Phys., 2010, 12, 7026–7031 This journal is �c the Owner Societies 2010
The bottom graph of Fig. 3 exhibits diffraction patterns for
temperatures r48 1C. The time dependence at 48 1C was
measured over 120 min and no evolution was observed. The
diffractograms are typical of a liquid or amorphous solid state.
The broad peaks at Q higher than ca. 0.6 A�1 are related to the
structure of the two molecules, the one at 1.1 A�1 increases in
intensity with aCD concentration. The peak appearing at the
smallest angles covers the edge of the detector and its position
cannot be measured with precision. Clearly, a significant
increase of the structure factor, S(Q), is observed for
wave-vectors Q o 0.5 A�1. The intensity in this region is
temperature dependent for Q o 0.3 A�1, but time independent.
This feature, at the smallest wave-vector range, suggests the
formation of clusters of about 3 nm size already in the liquid
phase of the binary mixture. This aggregation is temperature
activated, an observation that parallels spectroscopic observations
that will be presented in the next section.
At 48 1C, S(Q) was monitored during 2 h, without
presenting any variation in the spectra. During this time, the
data presented in the previous section showed that the
viscosity increases by two orders of magnitude. During these
measurements, the sample stayed perfectly transparent as
monitored by the transmission of a He–Ne laser beam. Small
angle neutron scattering around these temperatures, exploring
smaller Q-vectors, complete this study and indicate that during
the solidification structures at the scale of 10 nm appear. We
therefore conclude that the reversible formation of the
amorphous solid upon heating is not accompanied by any
significant segregation of the two molecular components and
the formation of larger structural inhomogeneities.
At 60 1C, the scattering at small angles increases drastically,
and visible inspection shows the sample to become opalescent.
This confirms the formation of inhomogeneous structures
extending at this temperature over length scales reaching
B100 nm. On the time scale of our experimental resolution,
this Q-dependence of the structure factor is formed
instantaneously. No further evolution over 20 min, a long
time compared to the timescale of the increase of the viscosity
at 60 1C, was observed. After a sufficient long time (several
hours) the sample becomes white, indicating that it would
eventually crystallize. When increasing the temperature
further, the spectrum changes continuously from the one at
60 1C to the one of the crystalline phase, recorded here at
100 1C. This transition is not instantaneous and the nucleation
process is relatively slow. The scattering at small angles has
dropped, confirming the conversion of the scattering objects
into larger crystals. The sample has turned completely white in
a second transition from the amorphous phase to a crystal
phase on heating. Both transitions are not sharp and show
some metastability phenomena.
We conclude that as a first step toward crystallization,
spatial density fluctuations with increasing length scales
develop due to partial segregation of the two molecular
components. These fluctuations reach sizes that scatter visible
light and the more dense regions finally transform into
crystals.
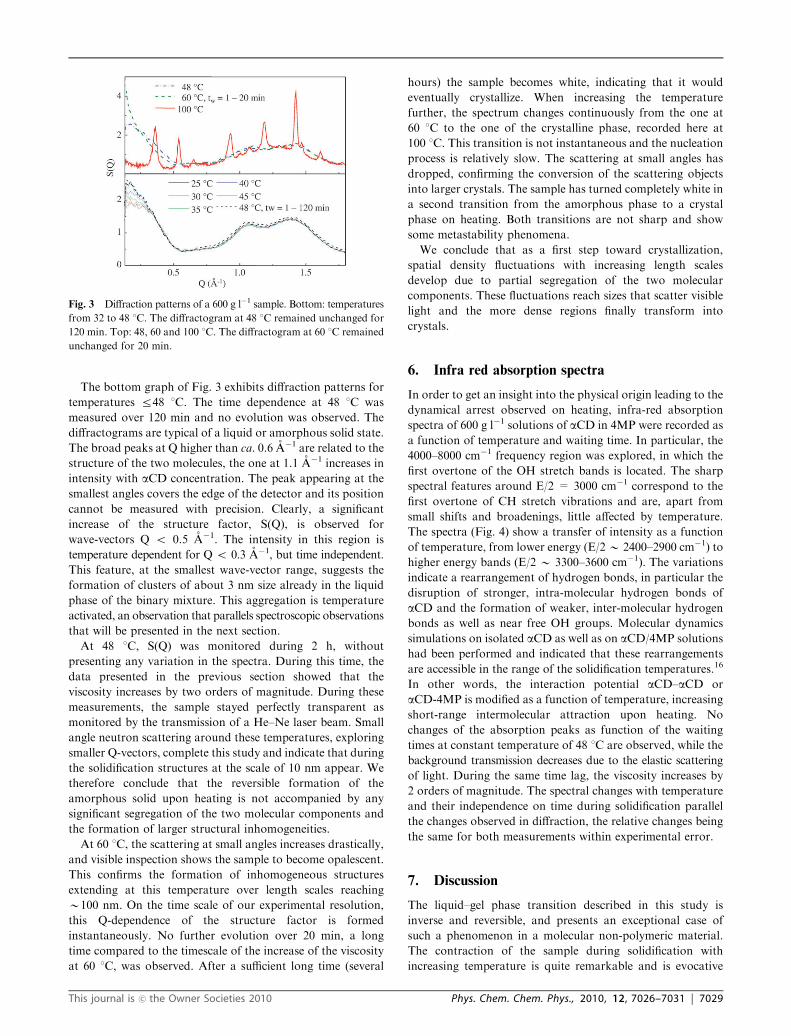
6. Infra red absorption spectra
In order to get an insight into the physical origin leading to the
dynamical arrest observed on heating, infra-red absorption
spectra of 600 g l�1 solutions of aCD in 4MP were recorded as
a function of temperature and waiting time. In particular, the
4000–8000 cm�1 frequency region was explored, in which the
first overtone of the OH stretch bands is located. The sharp
spectral features around E/2 = 3000 cm�1 correspond to the
first overtone of CH stretch vibrations and are, apart from
small shifts and broadenings, little affected by temperature.
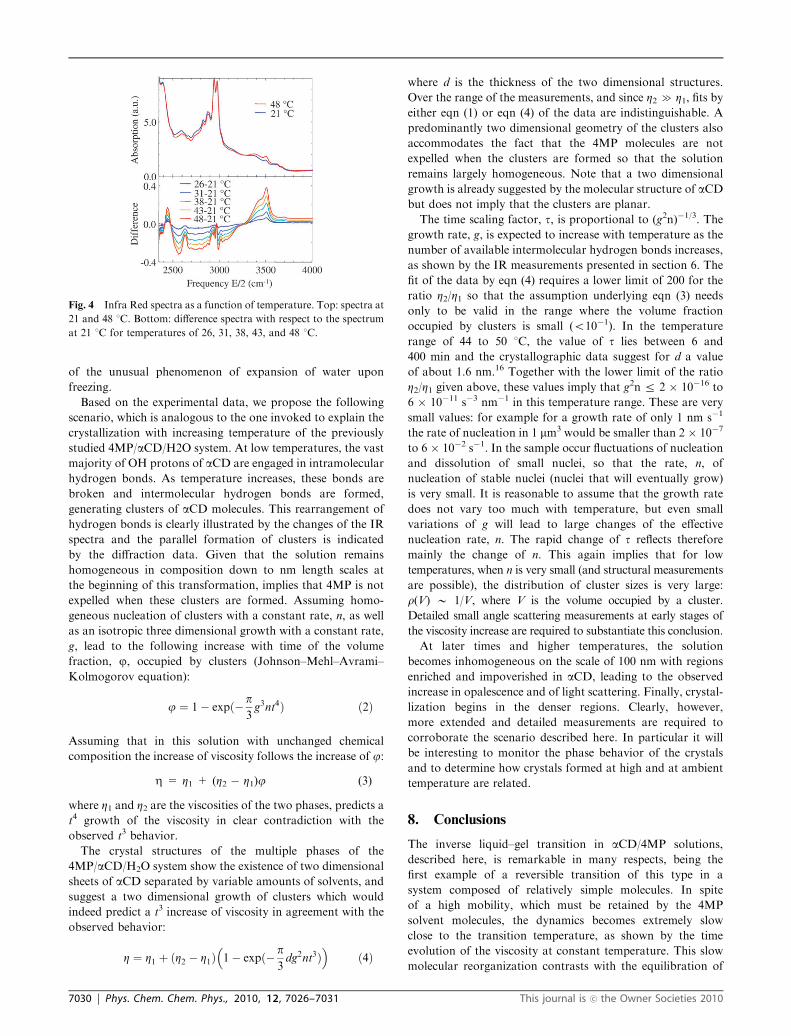
The spectra (Fig. 4) show a transfer of intensity as a function
of temperature, from lower energy (E/2B 2400–2900 cm�1) to
higher energy bands (E/2 B 3300–3600 cm�1). The variations
indicate a rearrangement of hydrogen bonds, in particular the
disruption of stronger, intra-molecular hydrogen bonds of
aCD and the formation of weaker, inter-molecular hydrogen
bonds as well as near free OH groups. Molecular dynamics
simulations on isolated aCD as well as on aCD/4MP solutions
had been performed and indicated that these rearrangements
are accessible in the range of the solidification temperatures.16
In other words, the interaction potential aCD–aCD or
aCD-4MP is modified as a function of temperature, increasing
short-range intermolecular attraction upon heating. No
changes of the absorption peaks as function of the waiting
times at constant temperature of 48 1C are observed, while the
background transmission decreases due to the elastic scattering
of light. During the same time lag, the viscosity increases by
2 orders of magnitude. The spectral changes with temperature
and their independence on time during solidification parallel
the changes observed in diffraction, the relative changes being
the same for both measurements within experimental error.
7. Discussion
The liquid–gel phase transition described in this study is
inverse and reversible, and presents an exceptional case of
such a phenomenon in a molecular non-polymeric material.
The contraction of the sample during solidification with
increasing temperature is quite remarkable and is evocative
Fig. 3 Diffraction patterns of a 600 g l�1 sample. Bottom: temperatures
from 32 to 48 1C. The diffractogram at 48 1C remained unchanged for
120 min. Top: 48, 60 and 100 1C. The diffractogram at 60 1C remained
unchanged for 20 min.
This journal is �c the Owner Societies 2010 Phys. Chem. Chem. Phys., 2010, 12, 7026–7031 | 7029
of the unusual phenomenon of expansion of water upon
freezing.
Based on the experimental data, we propose the following
scenario, which is analogous to the one invoked to explain the
crystallization with increasing temperature of the previously
studied 4MP/aCD/H2O system. At low temperatures, the vast
majority of OH protons of aCD are engaged in intramolecular
hydrogen bonds. As temperature increases, these bonds are
broken and intermolecular hydrogen bonds are formed,
generating clusters of aCD molecules. This rearrangement of
hydrogen bonds is clearly illustrated by the changes of the IR
spectra and the parallel formation of clusters is indicated
by the diffraction data. Given that the solution remains
homogeneous in composition down to nm length scales at
the beginning of this transformation, implies that 4MP is not
expelled when these clusters are formed. Assuming homo-
geneous nucleation of clusters with a constant rate, n, as well
as an isotropic three dimensional growth with a constant rate,
g, lead to the following increase with time of the volume
fraction, j, occupied by clusters (Johnson–Mehl–Avrami–
Kolmogorov equation):
j ¼ 1� expð� p3g3nt4Þ ð2Þ
Assuming that in this solution with unchanged chemical
composition the increase of viscosity follows the increase of j:
Z = Z1 + (Z2 � Z1)j (3)
where Z1 and Z2 are the viscosities of the two phases, predicts a
t4 growth of the viscosity in clear contradiction with the
observed t3 behavior.
The crystal structures of the multiple phases of the
4MP/aCD/H2O system show the existence of two dimensional
sheets of aCD separated by variable amounts of solvents, and
suggest a two dimensional growth of clusters which would
indeed predict a t3 increase of viscosity in agreement with the
observed behavior:
Z ¼ Z1 þ ðZ2 � Z1Þ 1� expð� p3dg2nt3Þ
� �ð4Þ
where d is the thickness of the two dimensional structures.
Over the range of the measurements, and since Z2 c Z1, fits byeither eqn (1) or eqn (4) of the data are indistinguishable. A
predominantly two dimensional geometry of the clusters also
accommodates the fact that the 4MP molecules are not
expelled when the clusters are formed so that the solution
remains largely homogeneous. Note that a two dimensional
growth is already suggested by the molecular structure of aCDbut does not imply that the clusters are planar.
The time scaling factor, t, is proportional to (g2n)�1/3. The
growth rate, g, is expected to increase with temperature as the
number of available intermolecular hydrogen bonds increases,
as shown by the IR measurements presented in section 6. The
fit of the data by eqn (4) requires a lower limit of 200 for the
ratio Z2/Z1 so that the assumption underlying eqn (3) needs
only to be valid in the range where the volume fraction
occupied by clusters is small (o10�1). In the temperature
range of 44 to 50 1C, the value of t lies between 6 and
400 min and the crystallographic data suggest for d a value
of about 1.6 nm.16 Together with the lower limit of the ratio
Z2/Z1 given above, these values imply that g2n r 2 � 10�16 to
6 � 10�11 s�3 nm�1 in this temperature range. These are very
small values: for example for a growth rate of only 1 nm s�1
the rate of nucleation in 1 mm3 would be smaller than 2 � 10�7
to 6 � 10�2 s�1. In the sample occur fluctuations of nucleation
and dissolution of small nuclei, so that the rate, n, of
nucleation of stable nuclei (nuclei that will eventually grow)
is very small. It is reasonable to assume that the growth rate
does not vary too much with temperature, but even small
variations of g will lead to large changes of the effective
nucleation rate, n. The rapid change of t reflects therefore
mainly the change of n. This again implies that for low
temperatures, when n is very small (and structural measurements
are possible), the distribution of cluster sizes is very large:
r(V) B 1/V, where V is the volume occupied by a cluster.
Detailed small angle scattering measurements at early stages of
the viscosity increase are required to substantiate this conclusion.
At later times and higher temperatures, the solution
becomes inhomogeneous on the scale of 100 nm with regions
enriched and impoverished in aCD, leading to the observed
increase in opalescence and of light scattering. Finally, crystal-
lization begins in the denser regions. Clearly, however,
more extended and detailed measurements are required to
corroborate the scenario described here. In particular it will
be interesting to monitor the phase behavior of the crystals
and to determine how crystals formed at high and at ambient
temperature are related.
8. Conclusions
The inverse liquid–gel transition in aCD/4MP solutions,
described here, is remarkable in many respects, being the
first example of a reversible transition of this type in a
system composed of relatively simple molecules. In spite
of a high mobility, which must be retained by the 4MP
solvent molecules, the dynamics becomes extremely slow
close to the transition temperature, as shown by the time
evolution of the viscosity at constant temperature. This slow
molecular reorganization contrasts with the equilibration of
Fig. 4 Infra Red spectra as a function of temperature. Top: spectra at
21 and 48 1C. Bottom: difference spectra with respect to the spectrum
at 21 1C for temperatures of 26, 31, 38, 43, and 48 1C.
7030 | Phys. Chem. Chem. Phys., 2010, 12, 7026–7031 This journal is �c the Owner Societies 2010
the hydrogen bonding (intra- vs. inter-molecular), which is
immediate on the timescale of the measurements.
The exploratory measurements made here should be
complemented by more detailed studies to fully understand
more aspects of this unusual phenomenon. Beyond the struc-
tural measurements already mentioned, it will be important to
study the mobility of each of the two molecules by different
complementary methods (NMR, quasi elastic neutron scattering,
optical Kerr effect,. . .). It will also be interesting to vary the
sample composition: aCD concentration, hydrogen/deuterium
replacement, addition of (non-)hydrogen bonding co-solvents.
Given the metastability of the sample with respect to crystal-
lization, all these changes are expected to have profound
influence on the phase behavior of the samples. Additional
and more extended molecular dynamics simulations would
also be of interest, but may be beyond present computational
possibilities, given the complexity of the system and of its
behavior.
Acknowledgements
We are grateful to Efim Kats, Mark Johnson, Roberto Righini
and Paolo Foggi for many interesting discussions and valuable
suggestions. We thank the Interdisciplinary Center for Struc-
tural Crystallography (Crist) of the University of Florence for
the use of the X-ray diffraction facility. This work was
supported by the EC grant N.RII3-CT-2003-506350, by
CRS-INFM-Soft Matter (CNR) and MIUR- COFIN-2005
grant N. 2005023141-003.
References
1 G. Tammann, in Kristallisieren und Schmelzen, Johann AmbrosiusBarth, Leipzig, 1903, pp. 26–48.
2 S. Rastogi, G. W. H. Hohne and A. Keller, Macromolecules, 1999,32, 8897.
3 K. Mortensen, W. Brown and B. Norden, Phys. Rev. Lett., 1992,68, 2340.
4 E. Heymann, Trans. Faraday Soc., 1935, 31, 846.5 N. Schupper and N. M. Shnerb, Phys. Rev. E: Stat., Nonlinear,Soft Matter Phys., 2005, 72, 046107.
6 T. Narayanan and A. Kumar, Phys. Rep., 1994, 249, 135.7 A. Zipp A and W. Kauzmann, Biochemistry, 1973, 12,4217.
8 C. P. Royall, M. E. Leunissen, A. P. Hynninen, M. Djikstra andA. van Blaaderen, J. Chem. Phys., 2006, 124, 244706.
9 K. N. Pham, A. M. Puertas, J. Bergenholtz, S. U. Egelhaaf,A. Moussaıd, P. N. Pusey, A. B. Schofield, M. E. Cates,M. Fuchs and W. C. K. Poon, Science, 2002, 296, 104.
10 T. Eckert and T. Bartsch, Phys. Rev. Lett., 2002, 89, 125701.11 E. Zaccarelli, H. Lowen, P. P. F. Wessels, F. Sciortino, P. Tartaglia
and C. N. Likos, Phys. Rev. Lett., 2004, 92, 225703.12 H. Tanaka, J. Meunier and D. Bonn, Phys. Rev. E: Stat.,
Nonlinear, Soft Matter Phys., 2004, 69, 031404.13 E. Zaccarelli, J. Phys.: Condens. Matter, 2007, 19, 323101.14 B. Ruzicka, L. Zulian, R. Angelini, M. Sztucki, A. Moussaıd and
G. Ruocco, Phys. Rev. E: Stat., Nonlinear, Soft Matter Phys.,2008, 77, 020402.
15 M. Plazanet, C. Floare, M. R. Johnson, R. Schweins andH. P. Trommsdorff, J. Chem. Phys., 2004, 121, 5031.
16 M. Plazanet, M. Dean, M. Merlini, A. Huller, H. Emerich,C. Meneghini, M. R. Johnson and H. P. Trommsdorff, J. Chem.Phys., 2006, 125, 154504.
17 M. Plazanet, M. R. Johnson, R. Schweins and H. P. Trommsdorff,Chem. Phys., 2006, 331, 35.
18 W. Saenger, Angew. Chem., Int. Ed. Engl., 1980, 19, 344.19 W. Saenger and T. Steiner, Acta Crystallogr., Sect. A: Found.
Crystallogr., 1998, 54, 798.20 A. Harada, Acc. Res. Rev., 2001, 34, 456.21 A. Harada, J. Li and K. Kamachi, Nature, 1993, 364, 516.22 G. Gattuso, S. Menzer, S. A. Nepogodiev, J. F. Stoddart and
D. J. Williams, Angew. Chem., Int. Ed. Engl., 1997, 36,1451.
23 C. de Rango, P. Charpin, J. Navaza, N. Keller, I. Nicolis,F. Villain and A. W. Coleman, J. Am. Chem. Soc., 1992, 114,5475.
24 E. Tombari, C. Ferrari, G. Salvetti and G. P. J. Johari, J. Chem.Phys., 2005, 123, 051104.
25 C. Ferrari, E. Tombari, G. Salvetti and G. P. J. Johari, J. Chem.Phys., 2007, 126, 124506.
This journal is �c the Owner Societies 2010 Phys. Chem. Chem. Phys., 2010, 12, 7026–7031 | 7031