INTRODUCTION Air pollution is a major public health threat in ...
10
INTRODUCTION Air pollution is a major public health threat in cities across the world. Air pollution is one of the highest ranking environmental and public health challenges globally, and especially in Southeast Asia. This project covers air pollution levels and source in Ahmedabad, India, the Air Quality Index (AQI) best practices, and identifies the elements of applying a successful AQI, including effective health risk communication. To protect local communities from rising air pollution levels, the Ahmedabad Municipal Corporation (AMC) is developing an AQI. AMC is working with the Indian Institute of Tropical Meteorology using a monitoring network called SAFAR (System of Air Quality and Weather Forecasting And Research). The Natural Resources Defense Council (NRDC) is working with the AMC on information, education, and communication strategies for the AQI being launched in Ahmedabad. In 2010, the Indian government found that, average concentrations of particulate matter (PM) in the air of 180 Indian cities was about six times higher than World Health Organization (WHO) standards 1 . In the most recent WHO assessment in 2014, 13 Indian cities ranked in the top 20 in the world for the worst fine particulate air pollution 2 . The 2012 Global Burden of Disease assessment led by the WHO, identified the top priority air pollutants in India as PM, nitrogen oxides, ground-level ozone smog, and sulfur dioxide. Exposure to each of these air pollutants is associated with considerable risks to respiratory health. By reducing local air pollution, cities can reduce the burden of disease from stroke, heart disease, lung cancer, and both chronic and acute respiratory diseases, including asthma 3 . Furthermore, the lower the levels of air pollution, the better the cardiovascular and respiratory health of the population will be, both long-term and short-term 4 . AQI systems already operate in key cities in India, including Pune, Delhi, and Mumbai, among others, as well as internationally. The AQI not only informs people about air pollution, but also provides detailed data on how to protect health and to guide pollution reducing policies and regulations. Many people and organizations support the effectiveness of the AQI for informing city residents about the health threats of air pollution. Many people support the effectiveness of the AQI for its ability to inform residents about the levels and health threats of air pollution. With the AQI as the base, Ahmedabad’s Air Information & Response (AIR) Plan 5 , in conjunction with the NRDC and the Indian Institute of Public Health Gandhinagar, focuses on health risk communication. The AIR Plan creates immediate and longer-term actions to increase preparedness, information- sharing, and response coordination to reduce the health impacts on vulnerable populations like children. 1 Michael Greenstone and Rohini Pande, “India’s particulate problem.” New York Times, February 9, 2014, http://www.nytimes.com/2014/02/10/opinion/indias-particulate-problem.html Accessed December 2, 2016. 2 World Health Organization, Global Health Observatory Data Repository, Ambient (Outdoor) Air Pollution Database, by Country and City, 2014. http://www.who.int/gho/phe/outdoor_air_pollution/en/ Accessed December 1, 2016. 3 Climate & Clean Air Coalition. www.ccacoalition.org Accessed December 2, 2016. 4 World Health Organization, Ambient (outdoor) air quality and health, 2016. http://www.who.int/mediacentre/factsheets/fs313/en/ Accessed December 2, 2016. 5 NRDC. https://www.nrdc.org/sites/default/files/ahmedabad_air_plan_feb_2017_final_pdf.pdf Accessed February 17, 2017.
-
Upload
khangminh22 -
Category
Documents
-
view
0 -
download
0
Transcript of INTRODUCTION Air pollution is a major public health threat in ...
INTRODUCTION
Air pollution is a major public health threat in cities across the world. Air pollution is one of
the highest ranking environmental and public health challenges globally, and especially in
Southeast Asia. This project covers air pollution levels and source in Ahmedabad, India, the
Air Quality Index (AQI) best practices, and identifies the elements of applying a successful
AQI, including effective health risk communication. To protect local communities from rising
air pollution levels, the Ahmedabad Municipal Corporation (AMC) is developing an AQI.
AMC is working with the Indian Institute of Tropical Meteorology using a monitoring
network called SAFAR (System of Air Quality and Weather Forecasting And Research). The
Natural Resources Defense Council (NRDC) is working with the AMC on information,
education, and communication strategies for the AQI being launched in Ahmedabad.
In 2010, the Indian government found that, average concentrations of particulate matter (PM)
in the air of 180 Indian cities was about six times higher than World Health Organization
(WHO) standards1. In the most recent WHO assessment in 2014, 13 Indian cities ranked in
the top 20 in the world for the worst fine particulate air pollution2. The 2012 Global Burden of
Disease assessment led by the WHO, identified the top priority air pollutants in India as PM,
nitrogen oxides, ground-level ozone smog, and sulfur dioxide. Exposure to each of these air
pollutants is associated with considerable risks to respiratory health. By reducing local air
pollution, cities can reduce the burden of disease from stroke, heart disease, lung cancer, and
both chronic and acute respiratory diseases, including asthma3. Furthermore, the lower the
levels of air pollution, the better the cardiovascular and respiratory health of the population
will be, both long-term and short-term4.
AQI systems already operate in key cities in India, including Pune, Delhi, and Mumbai,
among others, as well as internationally. The AQI not only informs people about air
pollution, but also provides detailed data on how to protect health and to guide pollution
reducing policies and regulations. Many people and organizations support the effectiveness
of the AQI for informing city residents about the health threats of air pollution.
Many people support the effectiveness of the AQI for its ability to inform residents about
the levels and health threats of air pollution. With the AQI as the base, Ahmedabad’s Air
Information & Response (AIR) Plan5, in conjunction with the NRDC and the Indian
Institute of Public Health Gandhinagar, focuses on health risk communication. The AIR
Plan creates immediate and longer-term actions to increase preparedness, information-
sharing, and response coordination to reduce the health impacts on vulnerable populations
like children.
1 Michael Greenstone and Rohini Pande, “India’s particulate problem.” New York Times, February 9, 2014,
http://www.nytimes.com/2014/02/10/opinion/indias-particulate-problem.html Accessed December 2,
2016. 2 World Health Organization, Global Health Observatory Data Repository, Ambient (Outdoor) Air Pollution
Database, by Country and City, 2014. http://www.who.int/gho/phe/outdoor_air_pollution/en/ Accessed
December 1, 2016. 3 Climate & Clean Air Coalition. www.ccacoalition.org Accessed December 2, 2016. 4 World Health Organization, Ambient (outdoor) air quality and health, 2016.
http://www.who.int/mediacentre/factsheets/fs313/en/ Accessed December 2, 2016. 5 NRDC. https://www.nrdc.org/sites/default/files/ahmedabad_air_plan_feb_2017_final_pdf.pdf Accessed
February 17, 2017.

AIR POLLUTION IN AHMEDABAD
Ahmedabad is one of India’s largest cities with a population over seven million and lists as
one of the cities with the worst air pollution in the world, along with New Delhi and Beijing. In
2010, Ahmedabad experienced approximately 4,900 premature deaths attributed to excessive
ambient air pollution6. Worsening air quality in Ahmedabad has resulted in serious health
concerns, including increased morbidity, especially in vulnerable populations7.
Particulate Matter
Research in air pollution epidemiology has increasingly focused on the harmful effects of
exposure to particulate matter (PM). PM is the primary pollutant of concern and most
frequently monitored in Ahmedabad because it can penetrate deeply into the respiratory tract,
posing serious health risks. PM10 is made up of coarse particles that are 2.5 to 10
micrometers in diameter. PM2.5 is made up of finer particles that are 2.5 micrometers in
diameter or smaller. Because of its tiny size, PM2.5 can penetrate deep into airways, lungs
and the respiratory system causing adverse health effects, even in low pollutant
concentrations. Exposure to PM2.5 is linked to heart and lung disease and heart attacks. Other
health effects associated with exposure to PM2.5 are increased respiratory symptoms,
irregular heartbeat, non-fatal heart attacks, development of chronic bronchitis, and decreased
lung function8. The most vulnerable populations to air pollution are the very young, the
elderly, and those with preexisting cardiovascular conditions and asthma, and air pollution
affects lung development9. A prominent study conducted in North American cities showed
that a 10 µg/m3 increase in PM10 was associated with an increase in all-cause mortality of
about 0.3% to 0.5%10.
Ahmedabad has exceeded both WHO standards and India’s air quality standards for
particulate matter since at least 2008. The WHO interactive map reports annual mean air
pollution concentrations for Ahmedabad of 100 µg/m3 for PM2.5 and 83 µg/m3 for PM10, for
2013 and 2012, respectively11. PM10 levels in Ahmedabad exceeded permissible limits for all
6 WHO, Global Ambient Air Interactive Map, 2016.http://maps.who.int/airpollution/ (accessed December 2,
2016) 7Guttikunda, S.K. and P. Jawahar, “Application of SIM-Air Modeling Tools to Assess Air Quality in Indian
Cities,” Atmospheric Environment 62 (2012); Pathak and Shukla. Co-benefits of low carbon passenger
transport actions in Indian cities: Case study of Ahmedabad. Transportation Research Part D: Transport and
Environment. Volume 44, May 2016, 303–316. 8 C. A. Pope III et al., “Lung Cancer, Cardiopulmonary Mortality, and Long-Term Exposure to Fine Particulate Air Pollution,” JAMA: The Journal of the American Medical Association 287, no. 9 (2002): 1132–41. 9 Hassan N.A. et al., “Impact of climate change on air quality and public health in urban areas,” Asia Pac Journal of Public Health (2015); Public Health Foundation of India, Ambient Air Pollution and Public Health: A Call to Action, March 2014. 10 C. A. Pope III et al., “Lung Cancer, Cardiopulmonary Mortality, and Long-Term Exposure to Fine Particulate Air Pollution,” JAMA: The Journal of the American Medical Association 287, no. 9 (2002): 1132–41; Samet J.M. et al, “Morbidity and mortality from air pollution in the United States,” The National Morbidity, Mortality, and Air Pollution Study, Research Report 94, Health Effects Institute, Cambridge, MA (2000). 11 World Health Organization, Global Ambient Air Interactive Map, 2016,
http://maps.who.int/airpollution/ Accessed December 2, 2016; Ahmedabad’s yearly
averages for PM for 2014-15: state program (SAMP), S. No. 14-15; national program
(NAMP), S. No. 22-18.
five years between 2008 and 2012, exceeding by 30–50% the national standards in India,
which are less restrictive than the WHO guidelines12. Studies also show that PM2.5 levels in
Ahmedabad exceed national standards13.
Pollution Sources
Air pollution comes from several sources. PM is a mixture of solids and liquids in the air that
can be emitted directly or formed by chemical reactions in the atmosphere. PM10 comes
primarily from motor vehicles, dust and construction and PM2.5 comes from many types of
combustion, including vehicles, power plants, industry, waste burning, agricultural burning and
cooking. A 2012 emissions study examined air pollution levels and sources and then modeled
emissions. The study found that the major sources for PM10 in Ahmedabad are: 30% road dust;
25% power plants; 20% vehicle exhaust; 15% industry; 5% domestic cooking and heating; 2%
diesel generator sets; 2% waste burning and 1% construction activities14. Ahmedabad has two
thermal coal- fired power stations: the 800MW Gandhinagar power plant and the 400MW
Sabarmati power plant, which is one of the oldest in India. The surrounding low-efficiency brick
kilns and trash burning also contribute to air pollution. Ahmedabad’s rapid growth, including increased vehicle-related emissions and stationary sources
are two of the major sources of pollution. Direct vehicle exhaust is a dominant source of air
pollution. From 2001 to 2011, vehicles, including motorcycles and scooters, doubled in
Ahmedabad, while the population grew at a rate of 58%15. Vehicles, especially two-wheelers
and diesel- based trucks, account for over 20% of PM10 levels in Ahmedabad16. The number of
two-wheelers (mopeds, scooters, motorcycles, all with a mix of 2 and 4 stroke engines) has
grown rapidly in Ahmedabad. Compared to 2-wheelers, 4 stroke models are considered more
fuel-efficient; an estimated 30-40% of 2-wheelers have 2 stroke engines. As in Ahmedabad,
most cities ban heavy-duty vehicles during daytime. However, the number of light-duty vehicles
increased during the daytime and a greater number of heavy-duty vehicles are on the roadways
at night. Road dust from automobiles, 2-wheelers, trucks and other vehicles is a major problem in
Ahmedabad, and other cities. Road dust accounts for over 25% of PM10 levels in Ahmedabad and
road dust is the largest contributor for PM10 and direct vehicle exhaust is the largest contributor of
PM2.517.
12 WHO, Global Urban Ambient Air Pollution Database, 2016,
http://www.who.int/phe/health_topics/outdoorair/databases/cities/en/ Accessed September 27, 2016; Pathak
and Shukla. Co-benefits of low carbon passenger transport actions in Indian cities: Case study of
Ahmedabad. Transportation Research Part D: Transport and Environment. Volume 44, May 2016, 303–316. 13 WHO, Global Urban Ambient Air Pollution Database, 2016,
http://www.who.int/phe/health_topics/outdoorair/databases/cities/ en/ Accessed September 27, 2016; Dey,
S. et al., “Variability of outdoor fine particulate (PM2.5) concentration in the Indian Subcontinent," Remote
Sensing of Environment (2012): 153 161. Pathak and Shukla. Co-benefits of low carbon passenger transport
actions in Indian cities: Case study of Ahmedabad. Transportation Research Part D: Transport and
Environment. Volume 44, May 2016, 303–316. 14 Guttikunda, S.K. and P. Jawahar, “Application of SIM-Air Modeling Tools to Assess Air Quality in
Indian Cities,” Atmospheric Environment 62 (2012). 15 Parth Shastri, “Vehicle population grew at double the rate than human population in Ahmedabad,”
Economic Times, January 15, 2014,
http://economictimes.indiatimes.com/industry/auto/news/industry/vehicle-population-grew-at-double-the-
rate-than-human-population-in-ahmedabad/articleshow/28827664.cms Accessed December 2, 2016. 16 Guttikunda, S.K. and P. Jawahar, “Application of SIM-Air Modeling Tools to Assess Air Quality in
Indian Cities,” Atmospheric Environment 62 (2012). 17 Ibid; Urban Emissions, Urban Air Pollution Analysis in India, September 2011.
Ahmedabad’s electricity grid is supplied by two thermal power stations, both coal-fired, and
are major sources of emissions18. One is plant is near the Sabarmati River, the Sabarmati 400
MW power station, with a second, larger 800MW power station in Gandhinagar. The Sabarmati
plant is one of the oldest power stations in India, operating since 1934. The Sabarmati power
plant is in the city and can directly impact air quality while the Gandhinagar power plant is on
the located on the northeastern edge of Ahmedabad. Dispersion models have found high
emissions levels related to the plants for PM10 and PM2.5. Communities living near thermal
plants experience higher rates of chronic respiratory illness, asthma, cancer and premature
death19. Brick kilns surrounding Ahmedabad and diesel generators, which are often used for
back-up power and for telecom towers, are other sources of pollution. Waste burning, is another
major source of pollution. Domestic cooking and heating emissions, especially from low-
income communities that use coal, biomass, and biofuels can contribute to outdoor air
pollution.
AIR QUALITY INDEX
An AQI is a tool employed by cities, states, and countries around to the world to communicate
present and future health risks of air pollution to residents. The AQI provides an index
number for reporting daily air quality, on a scale from 0 to 500. The higher the AQI numerical
value, the higher the level of air pollution that day. Additionally, the greater the potential
health concerns. Typically, AQI values of 100 correspond to the national air quality standard
for each pollutant, so AQI values of 100 or less are generally considered satisfactory. An AQI
value of 50 would represent good air quality with low risks to public health, but an AQI value
of 300 would represent air quality so hazardous that even healthy people may feel its
respiratory effects20. The AQI serves as a communication bridge to members of the public that
can summarize complex air quality information in a single number and associated color code.
Most AQI systems have two common characteristics: a table with different levels of air
pollution and health risks, ranging from minimal to severe, and color-coding to distinguish
these levels, also known as breakpoints. The breakpoints distinguishing different AQI levels
http://shaktifoundation.in/wp-content/uploads/2014/02/urban%20air%20pollution%20analysis%20-
%20india%206%20cities%202011%2009%2013.pdf Accessed December 1, 2016. 18 Guttikunda, S.K. and P. Jawahar, “Application of SIM-Air Modeling Tools to Assess Air Quality in
Indian Cities,” Atmospheric Environment 62 (2012). 19 Guttikunda S.K. and R. Goel, “Health Impacts of Particulate Pollution in a Megacity—Delhi, India.”
Environmental Development 6 (2013): 8-20; WHO, Air Quality Standards Report
http://www.who.int/mediacentre/factsheets/fs313/en/ Accessed February 27, 2017; WHO, Quantification of
the Health Effects of Exposure to Air Pollution, 2000; Analitis, A., et al., “Short-term Effects of Ambient
Particles on Cardiovascular and Respiratory Mortality,” Epidemiology 17, no. 2 (2006): 230-3; Health
Effects Institute, Outdoor Air Pollution and Health in the Developing Countries of Asia: A Comprehensive
Review, 2010; WHO, “Seven Million Premature Deaths Annually Linked to Air Pollution,” News Release,
March 25, 2014. http://www.who.int/mediacentre/news/releases/2014/air-pollution/en/ Accessed December
2, 2016. 20 United States Environmental Protection Agency, AQI: A Guide to Air Quality and Your Health, EPA-
456/F-14- 002, February 2014, https://www3.epa.gov/airnow/aqi_brochure_02_14.pdf Accessed December
2, 2016.
are tied to scientific and epidemiologic evidence that links air pollution to adverse health effects
among specific vulnerable populations. As such, the communication of AQI information to
members of the public also depends on the identification of specific target audiences that are
especially vulnerable to air pollution.
An AQI summarizes a rating for the quality of the air city residents are breathing, and an
associated level of potential health impacts. In situations where multiple air pollutants are
monitored concurrently, the AQI typically reflects the air quality and associated health effects
for the most dominant pollutant. The AQI is calculated through an analysis of local weather
and outdoor air pollution data, and values tend to vary seasonally, and on the time of day.
Ahmedabad’s Air Pollution Monitoring
In India, the air quality monitoring network is coordinated on the national level by the Central
Pollution Control Board (CPCB) and the Indian Institute of Tropical Meteorology (IITM)
network, which is called SAFAR (System of Air Quality and Weather Forecasting And
Research)21. Several entities operate about 20 monitoring stations in Ahmedabad, including the
Gujarat State Pollution Control Board (GPCB), Gujarat Environmental Management Institute
(GEMI), and new stations installed by the AMC and the IITM. The monitoring stations in
Ahmedabad report results after 7 -10 days of monitoring, but periodically the monitoring
results are unavailable because of technical difficulties. CPCB monitoring stations record data
twice a week, for at least 104 samples per year, per their guidelines. Ambient air and
meteorological data are submitted by the local meteorological department to the CPCB for
compilation and reporting. GPCB also collects ambient air pollution data from all stations once
each week for 12 hours, and calculates annual air pollution averages for each year from that
data. Multiple monitoring systems provide complementary methods and more information to help
evaluate future meteorological or air quality conditions, and health risks.
To protect public health and improve air quality the Ahmedabad Municipal Corporation is
partnering with IITM to develop a new AQI for the city. Currently, SAFAR’s AQI operates in
New Delhi, Pune, and Mumbai with plans to expand to Ahmedabad. SAFAR provides location -
specific information on air quality in near real-time and forecasts 1-2 days in advance22. This
information is combined with an early warning system of weather parameters. The purpose of
SAFAR is public engagement to increase people’s awareness of local air quality issues. SAFAR is
designed to provide useful for informing locally- appropriate air pollution control measures and
systematic actions to reduce health risks associated with air pollution exposure. SAFAR systems
monitor several pollutants and sensors should always operational and record data in 5 minute
intervals23. SAFAR currently uses multiple approaches to reach the public with their AQI alerts,
including its website, SAFAR-app for smart phones, email alerts, and digital display boards.
21 Central Pollution Control Board, About National Air Quality Index, 2008,
http://cpcb.nic.in/About_AQI.pdf Accessed September 28, 2016; Indian Institute of Tropical Meteorology,
SAFAR Monitoring Network, http://safar.tropmet.res.in Accessed September 27, 2016. 22 Indian Institute of Tropical Meteorology, SAFAR Monitoring Network, 2016, http://safar.tropmet.res.in
Accessed September 27, 2016; Indian Institute of Tropical Meteorology, SAFAR Forecast Modelling and
Supercomputing, http://safar.tropmet.res.in/FORECASTING-46-4-Details Accessed December 2, 2016. 23 Dr. Gufran Beig, GAW Report No. 217, System of Air Quality Forecasting and Research (SAFAR-INDIA), Annual Report, Geneva: World Meteorological Organization, 2015.
SAFAR’s AQI Scale
SAFAR uses an AQI system in which the reported AQI is the highest AQI value from among
the criteria pollutants being measured and reported for the time-period in question. SAFAR
calculates its AQI in two parts: first by forming sub-indices and individual AQI readings for each
air pollutant; and second, by determining the health-relevant breakpoints of these sub-indices.
SAFAR uses a segmented linear function to relate the actual concentrations of each pollutant to a
non-dimensional number, the AQI. A linear segmented function uses straight-line segments to join
discrete coordinates, the AQI breakpoints24. Breakpoints are decided by each country’s national
ambient air quality standards, in conjunction with epidemiological studies describing the relation
between air pollution exposures and adverse health risks.
Different air pollutants pose health risks to different sensitive groups, when their AQI exceeds
100. The raw concentration measurements from monitoring stations are converted into separate
AQI sub-index values for each air pollutants that comprise the AQI. The highest of these sub-
index AQI values determines the overall AQI value for the day. When the AQI is above 100, in
some countries’ agencies also report which groups are especially vulnerable or sensitive to
that pollutant—for example, children, or people with asthma or heart disease. If two or more
individual air pollutants have AQI values over 100, all sensitive groups should be reported25.
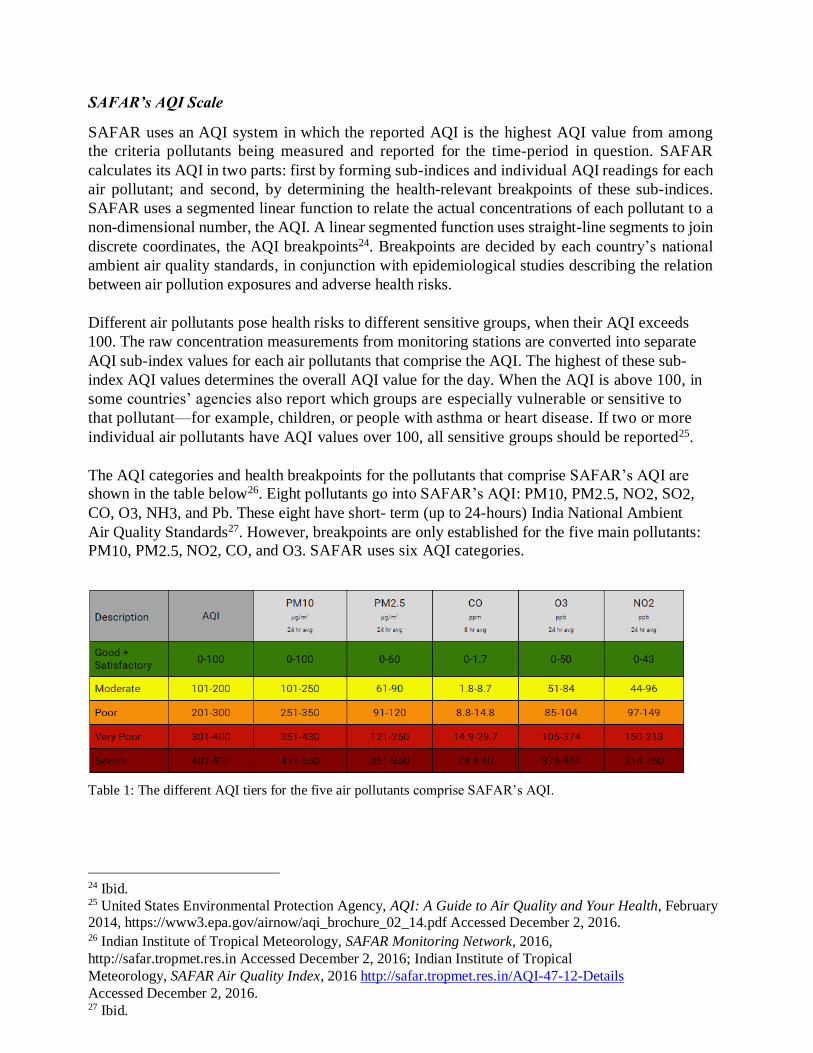
The AQI categories and health breakpoints for the pollutants that comprise SAFAR’s AQI are
shown in the table below26. Eight pollutants go into SAFAR’s AQI: PM10, PM2.5, NO2, SO2,
CO, O3, NH3, and Pb. These eight have short- term (up to 24-hours) India National Ambient
Air Quality Standards27. However, breakpoints are only established for the five main pollutants:
PM10, PM2.5, NO2, CO, and O3. SAFAR uses six AQI categories.
Table 1: The different AQI tiers for the five air pollutants comprise SAFAR’s AQI.
24 Ibid. 25 United States Environmental Protection Agency, AQI: A Guide to Air Quality and Your Health, February 2014, https://www3.epa.gov/airnow/aqi_brochure_02_14.pdf Accessed December 2, 2016. 26 Indian Institute of Tropical Meteorology, SAFAR Monitoring Network, 2016,
http://safar.tropmet.res.in Accessed December 2, 2016; Indian Institute of Tropical
Meteorology, SAFAR Air Quality Index, 2016 http://safar.tropmet.res.in/AQI-47-12-Details
Accessed December 2, 2016. 27 Ibid.
.
ELEMENTS OF EFFECTIVE AQI SYSTEMS
AQI systems that have been effectively communicated to air pollution-affected communities
are based on a strong foundation of scientific evidence on air pollution -health effects, well-
designed monitoring programs, and agency and public coordination that communicates the
evidence base to affected communities. The dual goals of protecting public health from air
pollution and improving air quality are strengthened by effective AQI systems, which provide
the evidence base for municipal or state agencies to act on air pollution.
From the evidence base provided by AQI systems in India and globally, six of the key
elements of successful, effective AQI systems include: 1. Robust, streamlined interagency
coordination; 2. Strong communication channels and direct involvement with the general
public, and with communities vulnerable to air pollution’s effects: schoolchildren, older
adults, people with respiratory or cardiovascular ailments, outdoor workers, people who
engage in sports outdoors; 3. Range of different policy interventions that can reduce air
pollution from its sources; 4. Scientific studies that expand local air pollution-health
evidence base; 5. Media engagement and outreach; 6. Build capacity among health
professionals on air pollution and health.
Interagency Coordination
Air pollution is not a localized problem, especially since pollutants and emissions are affected by
regional and long-range transport. Since air pollution can affect large geographic areas as well as
concern many different sectors, state-wide coordination of agencies is an effective mechanism to
combat air pollution. Combating air pollution requires professionals and experts in many areas
such as scientists, data analysts, engineers, law makers, politicians, economists, health officials,
accountants, and more. Furthermore, the fact that air pollution can arise from many different
sources such as industry, transportation, and agriculture, makes it an interagency issue.
International experiences show that interagency coordination is a pivotal part in reducing air
pollution, as well as informing and protecting the public from its effects.
Interagency coordination is a necessary and productive tool to address the broad problem of
air pollution. Agencies have found that collaborative efforts have helped in other ways than
combating air pollution, such as 1) fostered positive interagency coordination, cooperation
and consultation 2) created a functional framework for improving working relationship s for
better understanding the work of other agencies 3) stressed the importance of environmental
concerns earlier in the project development process 4) built trust and understanding amongst
agencies 5) increased the credibility and support of projects and programs by involving
affected agencies in the planning process 6) streamlined the conformity analysis by getting
interagency groups to an early agreement on technical and procedural requirements.
Strong communication channels to reach air pollution-affected communities
An AQI is a tool to disseminate information on air quality in qualitative terms (good,
satisfactory, moderate, poor, very poor, severe) with corresponding color codes28. The AQI
should be easy to associate with health effects and provide additional information relating to
potential health symptoms and advice as to what action to take. Improvements in air quality
depend on the support of citizens who are well-informed about local and national air pollution
problems and about the progress of mitigation efforts. Many air pollution guidelines consider
the importance of alerts when air pollution becomes serious and action needs to be taken29.
The public should be involved in developing risk communication from the outset and can
contribute to the assessment and management of risk. Essential elements for effective risk
communication are information quality, transparency, the simplicity and coherence of the
message, receptivity to public concerns and timing. Communication approaches should be
participatory and integrate sociological methods into traditional public health-oriented ones.
While this may increase effort and cost, it is useful in managing controversy, when and if it
develops during high air pollution emergencies.
Involving the public as stakeholders helps establish effective communication and reciprocal
exchange of information and is conducive to finding innovative solutions, thus moving away
from one-way communication models30.
Develop a range of possible policy interventions to reduce air pollution at its sources
As the local scientific evidence base concerning the health harms from air pollution grows, so
will the need for a range of possible policy interventions to reduce air pollution sources. Plans
to reduce vehicle, industrial, construction, agricultural and other air pollution sources will be a
necessary complement to air pollution monitoring and health risk communication, under
systems like the AQI. Other plans like planting trees to reduce fine particulate air pollution
show promising results. By combining several approaches, air pollution sources can be reduced
while AQI programs help people adjust their behavior to protect themselves from current levels
of air pollution.
Scientific studies can expand local air pollution-health evidence base
An evidence base provides the foundation for acting. Examples of the types of scientific
studies that could serve to build this evidence base include: epidemiologic studies to examine
possible relationships between levels of daily air pollution and respiratory hospitalizations or
emergency department visits in Ahmedabad or describing the range of air pollution exposures
among highly-exposed outdoor workers.
Media engagement and outreach
The media in India has been covering the nation’s deteriorating air quality, and has a very
critical role to play in raising public awareness of air pollution’s effects on health. Moving
28 Central Pollution Control Board. http://www.cpcb.nic.in/FINAL-REPORT_AQI_.pdf 29 Shooter, D. and P. Brimblecombe, “Air quality indexing,” Int. J. Environment and Pollution 36 (2009):
305–323. 30 WHO Regional Office for Europe, Health and environment: communicating the risks, 2013,
http://www.euro.who.int/__data/assets/pdf_file/0011/233759/e96930.pdf Accessed December 2, 2016.
forward, continuing to involve the media in efforts to raise public awareness and reduce air
pollution is essential. The media provide expert points of view on what could be some of the
tough questions in the minds of a wide range of local stakeholders, from air pollution-
vulnerable city residents to local businesspeople to local policymakers.
Build capacity and engagement among health professionals on air pollution-health
AQI reporting to the public provides important information about potentially unhealthy air
pollution days, and gives people ways to reduce their air pollution exposures. Health
professionals can provide specific information on personal health risks of air pollution
information and can encourage vulnerable people to take health-protective actions.
Medical and health professionals should consider routinely advising patients, especially those
with asthma and other respiratory or cardiovascular illness, to avoid strenuous outdoor activity
when the AQI is high. Besides advocating for individual patients’ health, the same health
professionals have the expertise that informs local interventions and policy strategies to reduce
air pollution. Building capacity, advocacy, and engagement among health professionals benefits
everyone.
Discussion
Ahmedabad’s Communication and Outreach Plans and Experiences
An AQI would not be very effective without proper community outreach, and the message must
reach the intended audience. The Ahmedabad AIR Plan31, in development with the NRDC and
Public Health Foundation of India, is a health-based program designed to protect and increase
awareness among residents on air pollution. The AIR Plan creates immediate and longer-term
actions to increase preparedness, information-sharing, and response coordination to reduce the
health impacts of air pollution on vulnerable populations. As part of the AIR Plan, the Ahmedabad
AQI and air quality forecasts will be available on the AMC website. The website will also provide
access to useful information on air quality related FAQs. Ahmedabad is also planning to use a
Digital Display Board System that displays current air quality data to citizens by setting up large
LED screens in populated areas in the city. Public awareness and outreach includes engaging
media on the AQI and AIR Plan and developing information, education, and communication
materials. Social media can be used to reach large masses of people.
Also, including organizations who advocate for the health of people with illnesses can help reach
some of the most health-vulnerable people. The AIR Plan is also proposing a school flag program
that would coordinates with schools to display colored flags corresponding to the daily AQI. Media
engagement includes regular broadcast of AQI in newspapers and associated health advisories
whenever issued by AMC. Moving forward, continuing to involve the media in efforts to raise
public awareness and reduce air pollution is essential.
Ahmedabad is the economic center of the state of Gujarat. Ahmedabad includes the surrounding
suburban and rural areas, and is predicted to be one of the world’s fastest-growing urban areas in
the coming decade32. However almost two million residents live in slums. In 2013, the city of
31 NRDC. https://www.nrdc.org/sites/default/files/ahmedabad_air_plan_feb_2017_final_pdf.pdf Accessed
February 27, 2017. 32 Joel Kotkin. Forbes.com. October 7, 2010. https://www.forbes.com/2010/10/07/cities-china-chicago-
opinions-columnists-joel-kotkin.html Accessed December 1, 2016.
Ahmedabad through the AMC, the NRDC and others, became the first Indian city to create a
comprehensive early warning system and heat preparedness plan.33 The goal of which was to
protect the publics’ health and save lives. This plan has provided valuable information on how to
reach Ahmedabad’s vulnerable populations. For example, slum residents lack access to (or cannot
afford) reliable electricity, transportation, and/ or health care. Slum residents that lack access to
information (or do not seek out information) are less able to prepare or modify behavior.
The heat plan shows that effective communication to vulnerable populations should include
displaying the information and forecast, early warnings, media campaigns, and distributing
informational pamphlets34. Ahmedabad should publicly display air quality and forecasts in high-
traffic locations where many people can view the information and at vulnerable sites (schools,
slums). As with the heat plan, even rickshaws were used to spread awareness. Forecasts enable
people to plan to avoid unnecessary outdoor travel/work on poor air quality predicted days.
Ahmedabad can identify neighborhood unofficial leaders to disseminate air quality warnings and
information to slum areas, and these individuals could help activate community networks to spread
the word. AMC and partner stakeholders can promote and coordinate public service
announcements via television, radio, newspapers, and text messages. Telephone companies can
play an important role in sending text messages as alerts. AMC can work with the health
department to create pamphlets on air pollution in English, Gujarati, and Hindi to distribute to
hospital staff, community groups, and schools.
These communication and outreach strategies have been very effective in Ahmedabad’s heat plan.
Ahmedabad’s heat action plan is now used as a model for other cities in India looking to become
more heat resilient. Success will hopefully continue with Ahmedabad’s air quality plan.
33 NRDC. https://www.nrdc.org/resources/rising-temperatures-deadly-threat-preparing-communities-india-
extreme-heat-events Accessed December 1, 2016. 34 NRDC. https://www.nrdc.org/sites/default/files/india-heat-slum-communities-IB.pdf Accessed December
1, 2016.