Introducing B-COP: A Methodology to Benchmark Competitive Online Performance
21
Introducing B-COP: A Methodology to B enchmark C ompetitive O nline P erformance Sandeep Krishnamurthy* Associate Professor of E-Commerce and Marketing Business Administration Program University of Washington, Bothell Box 358533, 18115 Campus Way NE, Room UW1-233 Bothell, WA 98011-8246 Phone: (425) 352 5229 Fax: (425) 352 5277 E-mail: [email protected] URL: http://faculty.washington.edu/sandeep Rahul Patel [email protected] Ajay Kaushal Systems Analyst Deloitte Consulting LLP 705 Fifth Avenue South, Suite 1100 Seattle, WA 98104-2845 [email protected] *Corresponding Author
-
Upload
independent -
Category
Documents
-
view
0 -
download
0
Transcript of Introducing B-COP: A Methodology to Benchmark Competitive Online Performance

Introducing B-COP: A Methodology to Benchmark Competitive Online Performance
Sandeep Krishnamurthy* Associate Professor of E-Commerce and Marketing
Business Administration Program University of Washington, Bothell
Box 358533, 18115 Campus Way NE, Room UW1-233 Bothell, WA 98011-8246 Phone: (425) 352 5229 Fax: (425) 352 5277
E-mail: [email protected] URL: http://faculty.washington.edu/sandeep
Rahul Patel
Ajay Kaushal Systems Analyst
Deloitte Consulting LLP 705 Fifth Avenue South, Suite 1100
Seattle, WA 98104-2845 [email protected]
*Corresponding Author
2
Introducing B-COP:
A Methodology to Benchmark Competitive Online Performance
Article Summary
Assessing one’s online competition poses unique challenges due to the absence of
tangible cues. We provide a practical methodology that managers can use to benchmark
competitive online performance using publicly available free dataset. We provide details about
the methodology and apply it to three well-known companies with a strong online presence-
Google.com, NYTimes.com, and Amazon.com.
3
WHAT ARE THEY DOING ONLINE?
Benchmarking competitive performance is an established business practice.
Understanding who one’s competitors are and tracking one’s performance vis-à-vis these players
is vital to the financial health of every corporation. Benchmarking lets companies track new
entrants into the market and track surges or dips in performance of established players. As such,
benchmarking oneself against competitors is a robust method to ensure a long-term, sustainable,
and substantial competitive advantage (Porter, 1998).
Maintaining a strong presence over the Internet has become an indispensable aspect of
conducting business in today’s global economy (Hoffman, Novak and Chatterjee, 1995). By
reducing the barriers to entry, the Internet has made it possible for companies to compete online,
regardless of firm size. At the same time, competition for traffic is intense on the Web. Traffic
on the Web exhibits a “winner-take-all” nature with only a few large players garnering high
levels of traffic while most languish with low levels of consumer interest (Adamic and
Huberman 2000, Huberman 2003). Therefore, understanding one’s relative position in the
marketplace takes on a greater sense of urgency.
Benchmarking in the online environment poses unique challenges. Unlike the physical
environment where physical cues (e.g. size of buildings, traffic in a physical store, working
hours, and size of parking lot) help one understand the size of competition, online one is left
guessing about the extent and nature of competition.
Managers who are interested in assessing the traffic to a particular site and benchmarking
it against key competitors run into many difficulties. First, analysis of the traffic to one’s own
web sites may provide some insight into the competitive picture. However, this analysis does
not provide a comparative perspective. Second, measuring traffic on the Internet and selling

4
marketing research reports is big business. The two most well known companies in this market
are Nielsen//Netratings and comScore (including Media Metrix). Both companies provide some
general information publicly. One has to become a member by paying a hefty fee to gain access
to detailed data- something not everybody can afford.
In this paper, we introduce a methodology called Benchmarking Competitive Online
Performance (B-COP) based on free information that helps managers answer questions such as
these- Who are our competitors online? Are there some competitors we have not considered or
tracked? How many of our competitors are stronger? How many are weaker? Who competes
directly with us for traffic? Who is an indirect competitor (i.e., a competitor of a competitor)?
Our methodology is built on a publicly available, free data repository- Alexa.com. This
site has been in operation since 1996 and was acquired by Amazon.com in 1999. Alexa collects
web traffic data based on a toolbar. Individuals who download the Alexa toolbar become part of
the system that transmits information back to the company. Alexa toolbar runs on over 10
million personal computers worldwide- in comparison, Nielsen Net/Ratings “uses a panel of
40,000 to 50,000 people with software meters installed on their computers”1 . The Alexa web
site indicates that it collects 1.6 Terabytes per day and has collected information about 4.5 billion
pages from over 16 million sites. We use Alexa information to identify competitors and study
their relative strength only.
As with any methodology, B-COP is not without its limitations. First, we are focusing on
Web traffic only while conversion rates (i.e., the rate at which traffic is converted to dollars) may
be more important for commerce-oriented sites. Moreover, traffic is measured at the aggregate
level and we are not accounting for specific demographic preferences- e.g. a niche site with
desirable demographics may be in a better situation than our methodology allows. Second, our 1 http://www.urlwire.com/news/022305.html
5
methodology is subject to all the problems faced by Alexa.com. These are detailed later in the
paper. It must be noted, however, that the ideas presented in this paper are equally applicable to
proprietary information from companies such as Comscore Networks. However, these
companies may not provide detailed data to managers. Third, managerial judgment is not
explicitly incorporated in the methodology, as outlined in this paper. However, the tacit
knowledge of those who are involved with front-line competition is vital in such a process.
Similarly, secondary informational sources (both online and offline) are very important.
Therefore, when conducting an online benchmarking exercise within a corporation, the results
from our methodology must be tempered by inputs from other sources (e.g. judgment of relevant
managers and salespeople, SEC filings, market share reports).
WHAT ALEXA.COM IS ALL ABOUT
Overview
Alexa.com encourages individuals to download a toolbar. The toolbar follows users as they
navigate through different websites and collects information on their browsing patterns, user’s IP
address, and a cookie that tracks the user’s ID, all of which is submitted to Alexa services. This
information is aggregated and made publicly available at www.alexa.com. The site identifies the
top 500 sites on the Web and provides information about traffic rank, reach and average number
of page views per visitor. A more comprehensive dataset is available for a price. Alexa provides
the following detailed information for every major web site-
o Description: A short description of the nature of the site with a screenshot.
o Overall traffic rank.
6
o Detailed Traffic Information: This includes information about overall traffic to the site,
number of unique visitors (or reach) and average number of page views per visitor.
Detailed charts are available for a period of two years.
o Related links: This section provides a list of links that visitors to the site also visit. This
uses the cutting-edge personalization technology developed by Amazon.com.
o Other Information: Load-time, Number of sites that link to the site, If pop-ups are
enabled and the date since the site was online.
o Contact Information: This includes Owner, Address, Phone Number, and Contact email
address.
Pros and Cons of Alexa.com
Advantages
There are several advantages of using the Alexa toolbar. First, the Web information
gathered by Alexa services is free and publicly available through its website. Therefore, Alexa
qualifies as a very cost effective way for companies to gather data on site traffic. This is a
tremendous advantage for many populations- including the managers of medium and small size
enterprises and those with small information technology (IT) departments. In our experience, the
B-COP methodology is ideal for MBA classes on E-Commerce, Marketing and Strategy. It
provides instructors a simple way to get students to think about online competition. Second,
Alexa, which is a part of Amazon, is a reputable company operating since 1996. The company is
able to leverage its brand and its established trust to encourage consumers to install its toolbar.
Third, the user community of the Alexa toolbar has been growing. At the time of writing, the
Alexa toolbar runs on at least 10 million personal computers worldwide.

7
Disadvantages of Alexa
Although there are several advantages to Alexa’s toolbar, it is also accompanied with
certain constraints. It is important to note that, in our view, the toolbar’s advantages outweigh its
disadvantages and hence makes B-COP a practical model that many managers can use.
First, Alexa has some technical limitations since it uses toolbar technology. It only works
with Internet Explorer and Windows operating systems. Notably, the Alexa toolbar does not
work for those who might use the AOL browser or any of the Netscape browsers (including
Mozilla Firefox). Second, since Amazon owns Alexa.com, the data may over-represent the
prominence of Amazon.com. Third, Alexa is not able to distinguish between sub-domains and
sub-pages from its parent domains, it only provides rankings for top-level rankings. For
example, Alexa is not able to distinguish between traffic to http:/www.apple.com/support and
http://www.apple.com/retail/. All information is reported at the web property level- i.e., at the
www.apple.com level. Therefore, we are unable to track some important sites (e.g.
news.google.com is a competitor of NYTimes.com, but does not show up as one due to this
problem). Fourth, the data excludes “secure” sites (i.e., the sites whose URLs begin with https).
Fifth, some privacy advocates have criticized Alexa.com for being too intrusive and some have
even called it spyware. This may have led to some self-selection effects with those who are
paranoid about their privacy not adopting the toolbar.
In order to judge the relative size of these limitations, we compared the rankings for the
top 10 sites as identified by Nielsen//Net Ratings in August 2005 (home+work usage) and those
identified by Alexa.com. The results are summarized in Table 1. Six out of the top 10 Web sites
identified by Nielsen//Net Ratings were in the top 10 Alexa.com rankings. AOL.com was ranked
at 11- surely a sign of the acknowledged limitation above. As a comparison, if the median rank
8
of the top 10 Nielsen//Net Ratings sites was 5.5 (axiomatically), the median rank of these sites on
Alexa.com was 6.5. Thus, overall, it would seem that the differences are not that large.
Importantly, from this limited analysis, we see that there is no systematic direction of bias- four
rank scores were higher on Nielsen//Net Ratings, five rank scores were higher on Alexa.com and
one was identical. However, it is possible for a site to be ranked very high on Nielsen//Net
Ratings and quite low on Alexa.com- see the example of Real.com in Table 1.
[Insert Table 1 About Here.]
THE B-COP METHODOLOGY
In this section, we identify the steps in applying B-COP-
1. Identification of the subject company:
B-COP is developed for a company that is interested in benchmarking its traffic.
Therefore, the first step is to identify the company whose perspective will be taken for the
analysis. Managers may consider their own company, key competitors, partners and distributors
as potential candidates. We will call this company the “subject site” from now.
2. Identification of ten competitors:
B-COP results in the identification of ten competitors. We have chosen the number ten to
provide a manageable list of competitors. As we will see soon, in some cases only a small subset
of the ten matters. To identify competitors, we identify the Alexa.com page for a company and
then study the related links (i.e., “people who visited this site also visited” links). These are
chosen as initial candidates for competitors. If some of the links represent sites that are not
relevant, we delete them. We also delete sites of the form http://auctions.yahoo.com to avoid
overstating of traffic. The list of sites that remain are labeled direct competitors.
9
Then, we invoke the Alexa.com page for each of the direct competitors and once again
study the “related links”. Our interest here is in investigating whom the direct competitors
compete with. A competitor of a competitor is counted as an indirect competitor. Frequently,
we find that indirect competition is strong and ignoring it leads to misleading results.
Then, we compile all direct and indirect competitors into a list. The top ten members of
this list in terms of traffic rank over the last 3 months are chosen as the competitors of the
company. This approach allows us to identify competitors based on actual data.
3. Computing absolute and relative ranks, reach and page views. .
We calculate the traffic rank for each of the ten competitors. Relative ranks are
calculated by dividing a competitor’s absolute rank by the subject company’s absolute rank. For
instance, if we are benchmarking Google’s competition, the relative rank of Yahoo is given by
absolute rank of Yahoo/absolute rank of Google. A relative rank higher than the numeric value 1
is an indication of a strong competitor. For example, in the Amazon.com case study provided
below you will find eBay’s relative rank is 1.9 indicating that it is stronger. A relative rank less
than 1 is an indication of a weak competitor. Similar calculations are performed for reach and
page views. The formulas are shown below-
• Relative Rank = Subject Absolute Rank / Competitor Absolute Rank.
• Relative Strength = Competitor Reach / Subject Reach
• Relative Page Views = Competitor Page Views / Subject Page Views
Usually, competitiveness among brands is defined using an us/(us+them) index. Our
point is that doing that on the Internet is not always effective since competitive boundaries are
amorphous. There is no clear way of identifying a universal set of competitors even- for
instance, the managers at New York Times may not have considered BBC.co.uk as an important

10
competitor while our analysis indicates that they should have done so. Moreover, as point # 4
will elucidate, the interaction among the web sites is complicated and it is not clear if an
us/(us+them) would apply. Therefore, we advocate using a referent company for analysis and
then conducting the analysis from that company’s point of view.
4. Identification of traffic directions:
One of the biggest factors that differentiates the Web from other content repositories is
that the content is connected through hyperlinks. Thus, online competition involves
characterizing traffic to and from sites. We categorize traffic among competitors online in four
ways-
a. Two-way: individuals who visit the subject site also visit the competitor’s site and vice
versa. e.g. Individuals who visit Amazon.com visit ebay.com and vice versa.
b. To subject site: Individuals who visit a competitor’s site visit the subject site, but not vice
versa. e.g. individuals who target.com visit amazon.com, but not vice versa.
c. From subject site: Individuals who visit the subject site visit the competitor’s site, but not
vice versa. e.g. individuals who Amazon.com visit wal-mart.com, but not vice versa.
d. Tertiary: This is the most interesting category. In this case, individuals who visit the
subject site do not visit such a site. Similarly, individuals who visit this site do not visit
the subject site. However, individuals who visit an indirect competitor of the subject site
visit this site. e.g. In the NYTimes.com case, individuals who visit NYTimes.com do not
BBC.co.uk and individuals who visit BBC.co.uk do not visit NYTimes.com. However,
individuals who visit CNN.com (a direct competitor of NYTimes.com) visit BBC.co.uk
and those who visit BBC.co.uk visit CNN.com.
5. Prepare RVP (Relative Rank Vs. Page View) Chart:
11
A plot of relative rank vs. relative page view provides further insights. In all charts, the
subject site occupies the position (1,1). The four quadrants of the chart can be labeled in this
way. The companies that fall in quadrant I (see Figure 1a for labeling of quadrants) are labeled
“Niche-1” competitors since they have higher page view/visitor, but low traffic rank. Companies
in quadrant II are the strongest competitors since they have higher page views/visitor and high
traffic rank. Companies in quadrant III are the weakest competitors since they have low page
views/visitor and low traffic rank. Companies in quadrant IV are labeled “Niche-2” competitors
since they have higher traffic rank, but lower page views.
6. Prepare competitive landscape charts.
We prepare competitive landscape charts to map the complicated nature of
competition. On this chart, we highlight the flow of traffic as discussed in point # 4.
Specifically, we highlight direct/indirect competitors and direction of traffic flow (i.e., two-way,
from subject site, to subject site, tertiary).
CASE STUDIES
Using this methodology, the case studied on the following companies have been
conducted— Amazon.com, nytimes.com and google.com. All data presented here was collected
during early May 2005.
Case Study # 1- Amazon.com
Amazon.com is, arguably, the pioneer of E-Commerce (Kotha, 1998). The company
started out as an online book retailer. However, since then, it has diversified into numerous
product categories, international markets and even offers selling services. According to the latest
financial reports of the company, 44.41% of its revenue comes from international markets and
73.71% of revenue comes from “media” (a category that includes the sales of books, CDs and
12
DVDs). In its early days as an online retailer, barnesandnoble.com was widely regarded as its
online competitor. However, in today’s environment, given the multi-faceted nature of the
company it is somewhat hard to guess who the competitors of this company may be. Therefore,
our methodology is very useful as a way of identifying the competitive landscape of the
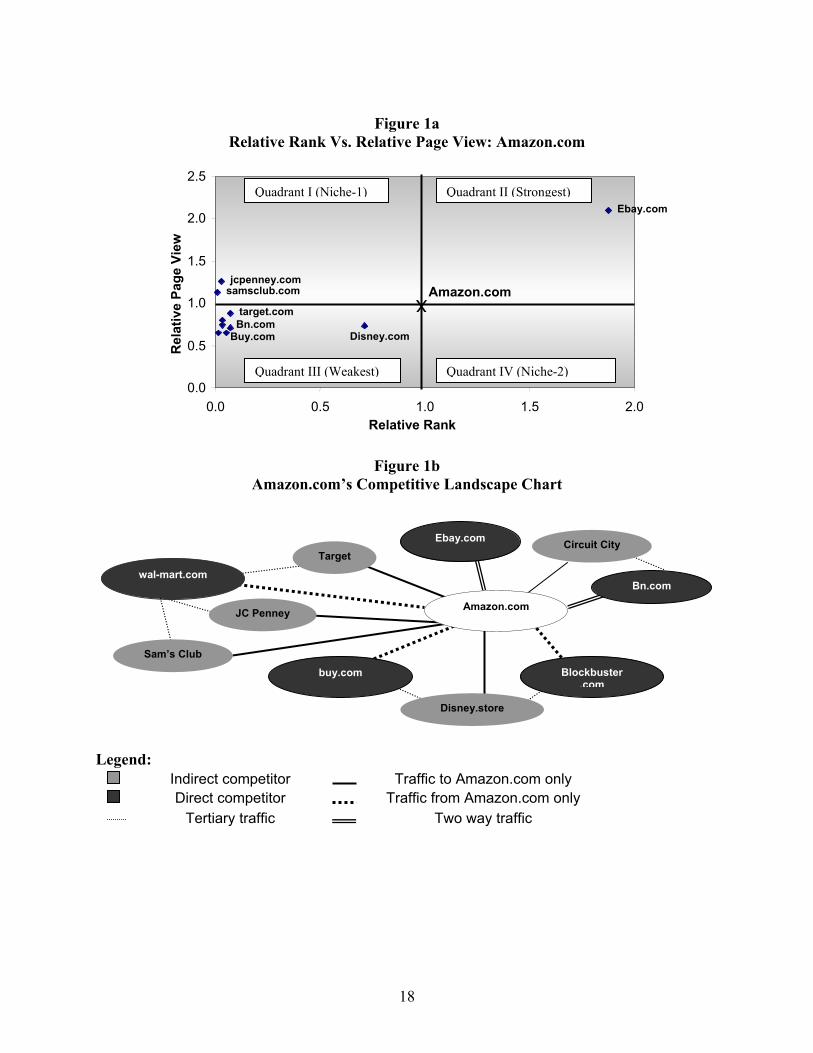
company. The application of B-COP to Amazon.com is shown in Figures 1a and 1b.
[Insert Figures 1a and 1b About Here.]
We make the following observations about Amazon.com’s competition online-
1) The company has one strong competitor online and nine weak competitors. eBay is
the strong competitor and a dominant one, at that. It is 1.2 times stronger in terms of
the number of visitors (i.e., reach) and 2.1 times stronger in terms of page views. [The
raw data for these calculations is available from the authors in Table form.]
2) Amazon.com is much stronger in terms of visitors as well as page views. Disney.com
is a moderately strong competitor in terms of visitors.
3) The weaker competitors of the company might be classified into two clusters. Two
competitors JCPenney.com and Samsclub.com are Niche-1 while all others are
“weakest”.
4) As shown in Figure 1b, Amazon.com has five direct competitors- eBay.com, Bn.com,
Wal-mart.com, blockbuster.com and Buy.com. All other competitors are indirect.
5) As shown in Figure 1b, of the direct competitors, consumers who visit Amazon.com,
visit eBay.com and Bn.com and vice versa (i.e., two-way traffic). However,
consumers who visit Amazon.com visit buy.com, wal-mart.com and blockbuster.com
while those who visit buy.com, wal-mart.com and blockbuster.com do not visit
Amazon.com (i.e., one-way traffic).
13
Case Study # 2- Nytimes.com
The New York Times Company publishes the prestigious The New York Times
newspaper, which has a circulation of 1.1 million and operates the web site “NYTimes.com”. In
addition, the company owns The Boston Globe and is part-owner of The International Herald
Tribune. It recently bought About.com, a content provider that links users to experts. The
content industry is fragmented and highly competitive.
B-COP points out these features about NYTimes.com’s online competition-
1. Nytimes.com has three stronger competitors (abcnews.go.com, bbc.co.uk, and cnn.com)
and seven weaker competitors. In terms of traffic, Abcnews.go.com is 3.77 times
stronger than nytimes.com, bbc.co.uk is 3.22 times stronger, and cnn.com is 3.79 times
stronger.
2. Abcnews.com is 1.27 stronger in terms of page views compared to nytimes.com and
bbc.co.uk is 1.38 times stronger than nytimes.com. On the other hand, CNN.com is 0.03
times weaker than nytimes.com in terms of page views.
3. As shown in Figure 2a, nytimes.com’s competitors can be classified into three clusters.
One (boston.com) is a Niche-1 competitor, one (cnn.com) is a Niche-2 competitor while
all else fall in the “weakest” category.
4. Nytimes.com has six direct competitors- cnn.com, usatoday.com, guardian.co.uk,
reuter.com, boston.com, and wsj.com. All other competitors are indirect.
5. As shown in Figure 2b, of the direct competitors, consumers who visit nytimes.com, visit
usatoday.com and wsj.com and vice versa (i.e., two-way traffic). However, consumers
who visit nytimes.com visit reuters.com, boston.com and guardian.com while those who
14
visit reuters.com, boston.com and guardian.com do not visit nytimes.com (i.e., one-way
traffic). BBC.co.uk is a tertiary competitor.
[Insert Figures 2a and 2b About Here.]
Case Study # 3- Google.com
Google Inc. is one of the dominant search engines in the world. At the time of writing, it
indexes over 8 billion web pages and offers services in 35 languages. The company has grown
its revenues from $19 million in 2000 to $3.2 billion in 2004 with a net profit of $399.1 million
(or $ 2.07 per share) in 2004. The company offers a wide array of services including Gmail
(web-based e-mail), Google News (news consolidation service), Google Groups (online
communities), Froogle (price comparison engine) and Google Local (information about local
merchants). The company’s revenue is mostly derived from its two advertising programs-
AdSense and AdWords. Given its high level of diversification, Google competes with multiple
companies in different domains- e.g. it may compete with hotmail in the e-mail arena and
Superpages.com in the local information space.
The B-COP model once again helps us identify the competitive picture. The results are
shown in Figures 3a and 3b. The key findings are these-
1. Google has two strong competitors (Yahoo, MSN) and eight weak competitors. Yahoo is
1.59 times stronger than Google in terms of traffic where as MSN is 1.41 times stronger.
Yahoo is 2.73 stronger in page views compared to Google. On the other hand, MSN is
1.1 times stronger than Google.
2. As shown in Figure 3a, Google’s weaker competitors all fall into the “weakest” category.
15
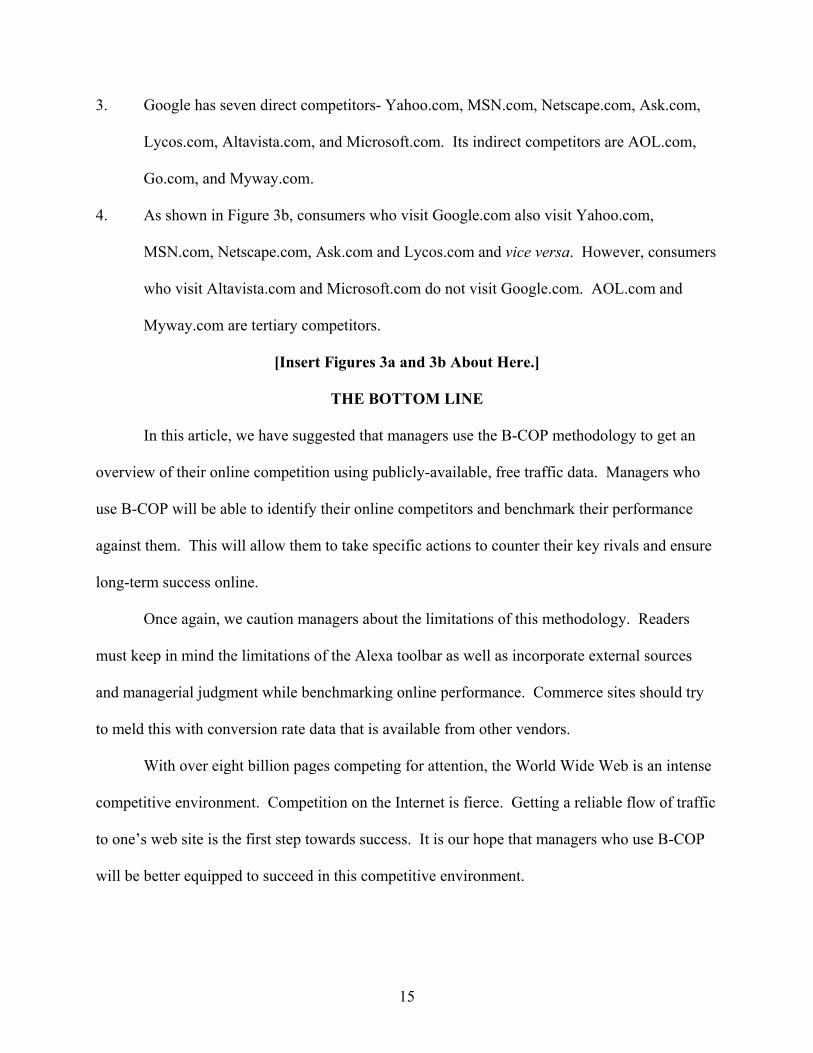
3. Google has seven direct competitors- Yahoo.com, MSN.com, Netscape.com, Ask.com,
Lycos.com, Altavista.com, and Microsoft.com. Its indirect competitors are AOL.com,
Go.com, and Myway.com.
4. As shown in Figure 3b, consumers who visit Google.com also visit Yahoo.com,
MSN.com, Netscape.com, Ask.com and Lycos.com and vice versa. However, consumers
who visit Altavista.com and Microsoft.com do not visit Google.com. AOL.com and
Myway.com are tertiary competitors.
[Insert Figures 3a and 3b About Here.]
THE BOTTOM LINE
In this article, we have suggested that managers use the B-COP methodology to get an
overview of their online competition using publicly-available, free traffic data. Managers who
use B-COP will be able to identify their online competitors and benchmark their performance
against them. This will allow them to take specific actions to counter their key rivals and ensure
long-term success online.
Once again, we caution managers about the limitations of this methodology. Readers
must keep in mind the limitations of the Alexa toolbar as well as incorporate external sources
and managerial judgment while benchmarking online performance. Commerce sites should try
to meld this with conversion rate data that is available from other vendors.
With over eight billion pages competing for attention, the World Wide Web is an intense
competitive environment. Competition on the Internet is fierce. Getting a reliable flow of traffic
to one’s web site is the first step towards success. It is our hope that managers who use B-COP
will be better equipped to succeed in this competitive environment.

16
ADDITIONAL READING
Adamic, L. & Huberman, B. (2000). The Nature of Markets in the World Wide Web. Quarterly Journal of Electronic Commerce, 1(1):5-12. Hoffman, D.L., Novak, T.P. & Chatterjee, P. (1995). Commercial Scenarios for the Web: Opportunities and Challenges. Journal of Computer-Mediated Communication, Special Issue on Electronic Commerce, 1(3), Retrieved May 24, 2005, from- http://www.ascusc.org/jcmc/vol1/issue3/hoffman.html. Huberman, B. & Adamic, A. (1999). Growth Dynamics of the World Wide Web. Nature, 401:131. Huberman, B. (2003). The Laws of the Web: Patterns in the Ecology of Information. MIT Press. Kotha, S. (1998). Competing on the Internet: - The Case of Amazon.com. European Management Journal, 16(2), 212-222. Porter, M. (1998). Competitive Advantage : Creating and Sustaining Superior Performance. Free Press.

17
Table 1 Comparison of Nielsen//NetRatings and Alexa.com Results
Nielsen//Net Ratings Top 10 Brands, August 2005
NNR Rank
Alexa.com Rank
Rank Disparity (NNR-Alexa)
Yahoo.com 1 1 0 Microsoft.com 2 6 -4 MSN.com 3 2 +1 Google.com 4 3 +1 AOL.com 5 11 -6 eBay.com 6 5 +1 Mapquest.com 7 28 -21 Amazon.com 8 7 +1 Real.com 9 209 -200 Weather.com 10 30 -20
MEDIAN 5.5 6.5 -2
18
Figure 1a
Relative Rank Vs. Relative Page View: Amazon.com
Figure 1b Amazon.com’s Competitive Landscape Chart
Legend:
Indirect competitor Traffic to Amazon.com only Direct competitor Traffic from Amazon.com only Tertiary traffic Two way traffic
Ebay.com
Disney.com
target.com
Buy.com Bn.com
jcpenney.com samsclub.com
0.0
0.5
1.0
1.5
2.0
2.5
0.0 0.5 1.0 1.5 2.0 Relative Rank
Rel
ativ
e Pa
ge V
iew
XAmazon.com
Quadrant I (Niche-1) Quadrant II (Strongest)
Quadrant III (Weakest) Quadrant IV (Niche-2)
Circuit City
Bn.com
Ebay.com
wal-mart.com
buy.com Blockbuster .com
Target
Sam’s Club
JC Penney
Disney.store
Amazon.com

19
Figure 2a
Relative Rank Vs. Relative Page View: NYTimes.com
Figure 2b
NYTimes.com’s Competitive Landscape Chart LEGEND Indirect competitor Traffic to nytimes.com only Direct competitor Traffic from nytimes.com only Tertiary traffic Two way traffic
bbc.co.uk
cnn.com
usatoday.com
washingtonpost.comwsj.com
reuters.com
boston.com
0.00
0.20
0.40
0.60
0.80
1.00
1.20
1.40
1.60
1.00 2.00 3.00 4.00 5.00
XNytimes.com
abcnews.go.com
Relative Rank
Rel
ativ
e Pa
ge V
iew
Nytimes.com
Usatoday.com
WSJ.com
CNN.com
Foxnews.com
Bbc.co.uk
Guardian.co.uk
Boston.com
Washington post.com Abcnews.
go.com
Reuters.com

20
Figure 3a
Relative Rank Vs. Relative Page View: Google.com
Figure 3b Google.com’s Competitive Landscape Chart
LEGEND Indirect competitor Traffic to google.com only Direct competitor Traffic from google.com only Tertiary traffic Two way traffic
Yahoo.com
msn.comgo.com
ask.com
0.00
0.50
1.00
1.50
2.00
2.50
3.00
0.50 1.00 1.50 2.00 2.50 3.00 3.50
lyvos.com
altavista.com aol.com
Xgoogle.com
Relative Rank
Rel
ativ
e Pa
ge V
iew
google.com
yahoo.com
Netscape.com
msn.com
myway.com
Microsoft.com
Ask.com altavista.com
lycos.com
Aol.com
Go.com

21