Introducing Network Analysis
15
4 Telektronikk 1.2008 1 Introduction Networks are everywhere! Let us start with the fam- iliar telecommunications industry. Telecommunica- tions operators around the world have for more than a hundred years built infrastructure enabling people to talk to each other. The main building block of this physical network is copper wires and fibres, which connect people to each other in such a way that, in principle, anyone who is connected can call any other person connected to the same network. Another industry building a huge physical network infrastruc- ture is the electric power industry. The power lines transport electricity from the point of production (i.e. a power plant) and all the way out to households that need electric power for lighting, hot water, and heat- ing. It is not immediately apparent when you power up the DVD player or the laptop at home that you are tapping into a huge network to in fact get the electric- ity that you need. Still, a network is the main building block lurking in the background that enables you to draw off the electricity that you need for your house- hold appliances. Let us stop one moment, and think about the above two examples. Deliberately, the examples are two very familiar types of networks that everyone should know very well. The telecommunications network is a mediating type of network, where a physical net- Introducing Network Analysis GEOFFREY S CANRIGHT, KENTH ENGØ-MONSEN Geoffrey S. Canright is senior researcher in Telenor R&I Kenth Engø- Monsen is senior researcher in Telenor R&I This article serves as an introduction to this special issue of Telektronikk on network analysis. The introduction consists of three parts. In part 1 we give the motivation for studing networks as a general concept with wide applicability. We support this idea with a variety of example applications. Then in part 2 we offer an overview of many of the basic ideas and terms in modern network analysis, including where possible, clear quantitative definitions. The terms in part 2 are terms that turn up in a wide variety of fields where networks are important. Finally, in part 3 we give a “reader’s guide” to the other articles in this issue. Figure 1 The London tube map! ISSN 0085-7130 © Telenor ASA 2008
Transcript of Introducing Network Analysis

4 Telektronikk 1.2008
1 IntroductionNetworks are everywhere! Let us start with the fam-iliar telecommunications industry. Telecommunica-tions operators around the world have for more thana hundred years built infrastructure enabling peopleto talk to each other. The main building block of thisphysical network is copper wires and fibres, whichconnect people to each other in such a way that, inprinciple, anyone who is connected can call any otherperson connected to the same network. Anotherindustry building a huge physical network infrastruc-ture is the electric power industry. The power linestransport electricity from the point of production (i.e.a power plant) and all the way out to households that
need electric power for lighting, hot water, and heat-ing. It is not immediately apparent when you powerup the DVD player or the laptop at home that you aretapping into a huge network to in fact get the electric-ity that you need. Still, a network is the main buildingblock lurking in the background that enables you todraw off the electricity that you need for your house-hold appliances.
Let us stop one moment, and think about the abovetwo examples. Deliberately, the examples are twovery familiar types of networks that everyone shouldknow very well. The telecommunications network isa mediating type of network, where a physical net-
Introducing Network AnalysisG E O F F R E Y S C A N R I G H T , K E N T H E N G Ø - M O N S E N
Geoffrey S.
Canright is
senior researcher
in Telenor R&I
Kenth Engø-
Monsen is senior
researcher in
Telenor R&I
This article serves as an introduction to this special issue of Telektronikk on network analysis. The
introduction consists of three parts. In part 1 we give the motivation for studing networks as a general
concept with wide applicability. We support this idea with a variety of example applications. Then in
part 2 we offer an overview of many of the basic ideas and terms in modern network analysis, including
where possible, clear quantitative definitions. The terms in part 2 are terms that turn up in a wide
variety of fields where networks are important. Finally, in part 3 we give a “reader’s guide” to the other
articles in this issue.
Figure 1 The London tube map!
ISSN 0085-7130 © Telenor ASA 2008

5Telektronikk 1.2008
work has been built in order to support people indoing what they love the most; namely, to talk toeach other. Before the era of telecommunications,people living far apart had to rely on a functioningpostal service in order to communicate with eachother, whereas with a telephone you just dial thenumber and when there is an answer at the other endyou just start chatting. The electricity network, how-ever, is an example of a transportation network. Whatis transported in this particular example is electricpower, from the producer to the household. Maybea more hands-on example of a transportation networkis the network of public transportation in a large city.The unit being transported is people. These peopleare maybe going to work, visiting relatives or friends,or maybe they are just tourists travelling aroundsightseeing. What enables these people to travelaround in the city is a network of bus lines, tramways, and/or underground tube lines. To see thewhole map of the London underground is nothingless than fascinating! And the map you see is a bril-liant example of a transportation network(http://www.tfl.gov.uk/).
Often network systems are best understood as ‘net-works-on-top-of-networks’. This is also known asoverlay networks. Again, let us consider a bus trans-portation network in a city. At the lowest level, thereis a network of streets and roads that defines wherecars and buses can drive. Similarly, the railroadtracks define where trains can go within a country.Then, on top of this physical infrastructure of streetsand roads (railroad tracks) the public transportationcompany decides to operate bus lines on some of thestreets. There does not need to be a bus line on everystreet; but we can view the set of all these bus lines asa bus transportation network that is running on top of– laid over – the network of streets and roads. Like-wise, one can consider the network of fax machinesto be a network that is running on top of the ordinarytelecommunications network.
The examples so far have been mostly of a physicalnature. Let us now look at networks that are of amore non-physical character. Even though owning amobile phone enables you to call everybody else thatalso owns a mobile phone, you will most likely notdo that. People are used to talking to their closestfriends, family, and co-workers, etc., and it is notusual to call up a random person. Having a mobilephone enables you in principle to contact everyoneelse in the world having a phone, since the telecom-munication infrastructure enables an all-to-all con-nection pattern among the end-users of a telecommu-nication service. However, people usually communi-cate with people within their social circles. Theresulting logical, intangible network, with links
defined by ‘who communicates with whom’, is anexample of a social network. A telecommunicationsoperator can in fact map out large parts of this socialnetwork by analyzing traffic records, and one willthen most likely find that people are communicatingwith a few, on average tens, and in some rare extremecases, hundreds of people. Nobody is talking toeverybody else.
Other examples of networks are: airline networks;food webs (where the nodes are species, and adirected link S1 ==> S2 means “species 1 eatsspecies 2”); film actor networks (where the nodes areactors, and actors are linked when they have playedin one or more films together); scientific collabora-tion networks (like actor networks, but with linksdefined by joint papers rather than films); boardroomnetworks (here the nodes are companies, and a linkmeans common board members); ownership net-works of companies; trade networks; gas distributionnetworks; neural networks; gene regulatory networks(here the nodes are genes, and a directed link G1 ==>G2 means “gene 1 regulates the expression of gene2”); value networks (see below); and there are manymore. The examples continue into every field of sci-ence, and any conceivable application. The point is,whenever the objects of study are discrete, and therelationships between these objects can be definedand are of interest, a network model is appropriateand useful. By now we should have set the sceneto be really thinking in terms of networks, and thereader should be able to spot networks everywhere!
The next fascinating thing about networks is howcomplex and counter-intuitive they can be whenapplied in modelling. For instance, model a systemof city streets and roads as a network and analyze thethroughput capacity of this network. What is impor-tant for planning purposes is to have a city traffic net-work that is able to handle varying demands in traf-fic. When adding a new tunnel or road, one is chang-ing the capacity of the network, and one can in factrun the risk of making things worse traffic-wise, andcausing more congestion for the cars in the streetsafter a new street or tunnel has been added to thetraffic network. This phenomenon is usually calledBraess’ paradox, and can be stated as follows: addingextra capacity to a network, when the moving entitiesselfishly choose their route, can in some cases reduceoverall performance [1]. This is because the equilib-rium of such a system is not necessarily optimal.Hence, it can be of great importance to analyzesystems that can be modeled as networks, becausetampering with their topology can have the rathercounter-intuitive effect of making things worse thanwhat was planned for.
ISSN 0085-7130 © Telenor ASA 2008

6 Telektronikk 1.2008
Combining economic and network modeling is a doorinto a world of problems that every telecommunica-tions operator has to struggle with every day. Con-sider for example the following predicament: whomdo you call, when you are the only one having a tele-phone? This is in fact the case for many people hav-ing a video-enabled 3G-phone today. They do notknow whom to call (via video telephony) – hencethe service of video telephony lacks utility for mostusers having the right type of mobile phone. Hence,the value for you – as an owner of a video-enabledmobile phone – depends on how many other usershave the same video-enabled telephone for you tocall. In economics this is called a network effect. Anetwork effect is characterized by a good or servicehaving a value to a potential customer which dependson the number (and/or identity) of other customerswho own the good or are users of the service. Consid-ering the whole life-cycle of a network service, net-work effects play the role of a barrier to adoption inthe beginning, until the base of customers that haveadopted the service reaches some critical mass. Afterthat, network effects will make a positive contribu-tion to the further adoption of the service, in that theywill act as a catalytic force.
An example of everyday systems which display net-work effects is web marketplaces and exchanges.
A well-known international example is eBay, whilefinn.no is a good Norwegian example. In each ofthese cases, the value of the marketplace to a newuser is proportional to the number of other users inthe market already. This is a good example of a ratherpure “global network effect”: because a new user isopen to interacting with anyone who is already in themarketplace, the utility to new users depends only onthe total number of users and not on who they are.The online, collaborative encyclopedia Wikipedia isanother example illustrating global network effects.When the number of editors of the encyclopediagrows, the quality of the information on the websiteincreases, which again encourages more users to turnto this website when looking for high-quality infor-mation. The process then continues when some of thenew users are recruited as editors.
Social networking sites such as Facebook(http://www.facebook.com/), LinkedIn(http://www.linkedin.com/), and Nettby(http://www.nettby.no/), also display network effects,in that the more people that register for the social net-work service, the more useful the website is to itsmembers. Here however we have a clear example of“local” network effects: the utility of Facebook to meis not determined only by the total number of existingFacebook members, but also by who they are: I want
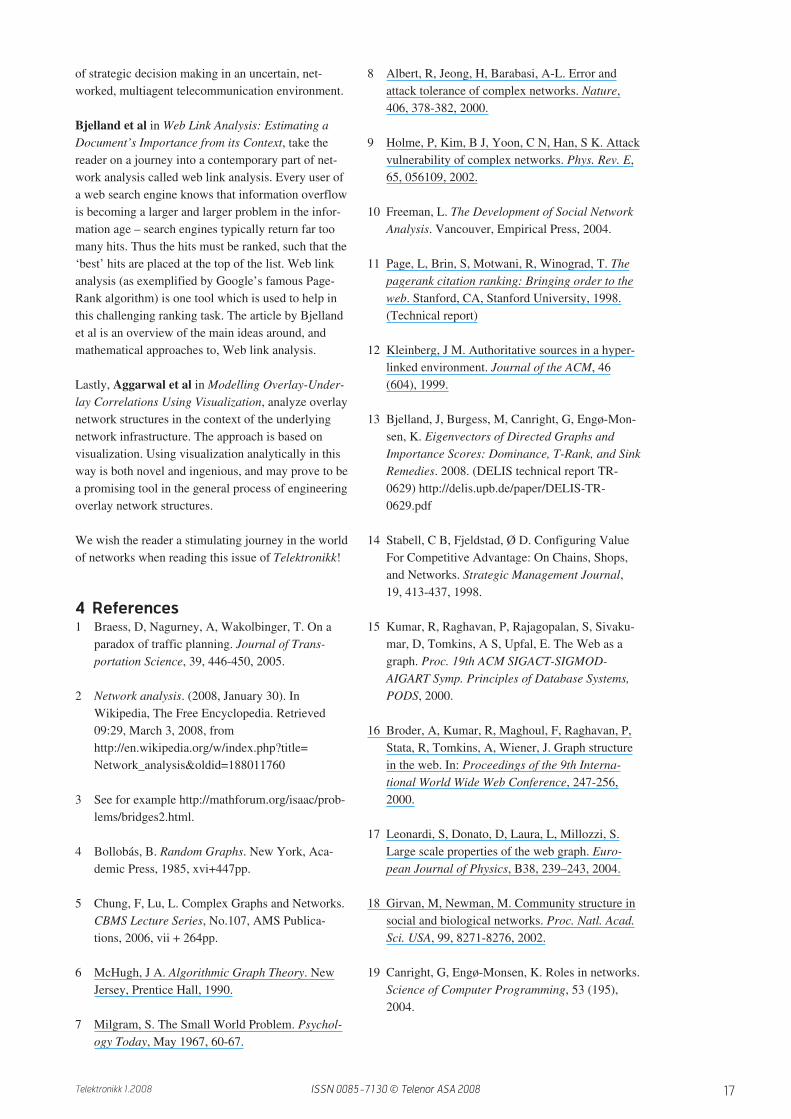
Figure 2 This shows the mind map obtained from the Network Analysis entry in Wikipedia, when using theWikiMindMap-tool at http://www.wikimindmap.com/
ISSN 0085-7130 © Telenor ASA 2008

7Telektronikk 1.2008
my friends to be members, and am less interested inpeople I do not know.
We also see here that network effects are seldompurely global or purely local1). After all, I as a newuser will also want to use Facebook to meet new peo-ple – and the expected value of Facebook for meetingthat need grows with the total number of Facebookmembers. Hence social networks like Facebookexhibit both local and global network effects.
The theme of this issue of Telektronikk is NetworkAnalysis. In the above introductory remarks, we havetried to guide the reader into the world of networksthrough some examples. Contemporary networkanalysis is not just one, easily stated classical fieldof study – it is more the intersection of very differentclassical disciplines. And some of the ingredientsmight even come as a surprise to the reader.
What is network analysis? Let us try to answer thisquestion by showing a visualization of the NetworkAnalysis entry in Wikipedia [2]. We have used theWiki mind-mapping tool at http://www.wikimind-map.org/, which is a very fascinating tool to use tolearn about a particular topic (assuming that topichas an entry in Wikipedia).
Historically, network analysis has its origins in“graph theory”, coming from mathematics and com-puter science. As can be seen from the mind-map inFigure 2, “graph theory” and “network theory” arepresent at the very top. Classically these fields in-volve the study of graphs – mathematical structuresused to model pairwise relations between objectsfrom a certain collection. Historically, graph theoryhas been considered as being born with the publica-tion of a paper by Leonard Euler in 1736 on ‘Theseven bridges of Königsberg’. Euler considered theproblem of finding a path crossing the seven bridgesof Königsberg exactly once, and solved the problemby representing each connected piece of land as a ver-tex (node) of a graph, and each bridge as a link [3].
Mathematical graph theory was long occupied withsorting out the different structures that regular graphshave and witnessed a revitalization of the subjectwhen the study of random graphs started in themiddle of the 1900s. (For some recent overviewsof graph theory, see [4] and [5].) Computer scienceaddresses algorithmic aspects of graphs [6] – forexample, how to find the shortest path between anytwo nodes in the graph, when knowing the globaltopology (the complete set of nodes and edges) of
the graph. Another example is finding structural sub-graphs within a larger graph (e.g. finding cliques –all-to-all connected subgraphs), finding link sets ofmaximum or minimum flow capacity, etc.
Returning for a moment to random graphs, the appli-cation of random graphs in describing real-world phe-nomena has had only limited success. Some recentdevelopments that have advanced the understandingof naturally occurring network structures have beenthe understanding of small-world networks and scale-free networks.
Loosely speaking, a small-world network displaysfavorable properties according to both local andglobal criteria. First, a small-world network is locallywell-connected – more quantitatively, one says thatthe network has high local clustering (see below). Atthe same time, the average shortest path (a global cri-terion) between two arbitrary nodes in a small-worldnetwork is small. This means that on average one canreach any other node in the network within a fairlysmall number of hops.
Let us set the small-world graph idea into context,by recalling a famous experiment done by Stanley Mil-gram in 1967 [7]. Milgram was speculating about howthe network of acquaintances is structured: do we livein a ‘small world’, or not? The naïve assumption, lead-ing to a negative answer, is this: people you know(acquaintances) usually live geographically close toyou. By this assumption, it would seemingly require avery long chain of intermediate acquaintances for a let-ter/message to be delivered to some unknown personliving geographically (and perhaps also socially) faraway. A requirement for the experiment – which afterall was seeking to probe properties of the acquain-tanceship network – was that the letter/message canonly be delivered to someone that you know person-ally. Milgram’s experiment was constructed to find outhow many intermediate acquaintances one would needon average to get a letter from the middle US (Kansasor Nebraska) to the east coast (Boston). What Milgramdiscovered was that those letters that reached theirrightful destination used on average 5–6 hops. Thissmall number of hops then contradicted the muchlarger number of hops that one expected based on thenaïve assumption. The small-world network structure,in contrast, represents a good ‘minimal’ model todescribe the network of acquaintances: one can modeland measure local geographical acquaintances (and thefact that your friends are often friends of each other)by clustering, and the small number of hops needed to
1) We thank Øystein D. Fjeldstad for introducing us to the ideas and thinking on local and global network effects in our joint researchcollaboration NABIRI.
ISSN 0085-7130 © Telenor ASA 2008

8 Telektronikk 1.2008
travel between arbitrary nodes in the network is welldescribed by the small average shortest-path length.
The defining property of a scale-free network is thatthe distribution of the node degrees follows a powerlaw. Roughly speaking, this means that, for a largescale-free network, there will be some (few) nodeswith very large node degree, somewhat more nodeswith slightly lower degree, and so on. This smoothvariation of the node degree distribution (see the nextsection for details) – so that the fraction of nodeswith very high node degree is not negligible – makesscale-free networks very well connected. Scale-freenetworks typically also satisfy the criteria for beingsmall-world networks: they typically have high localclustering, and invariably have a small averageshortest-path length. Some examples of scale-free net-works are the World-Wide Web, Internet-scale routernetworks, social networks, and protein-protein interac-tion networks. The extremely well-connected nodes ina scale-free network are usually called ‘hubs’, and playa central role in the structure of a scale-free network.Simulation experiments have been done [8,9] in whichrandom nodes have been removed from a scale-freenetwork, resulting in little effect on the function (asmeasured by average path length) of the overall net-work. Hence, a scale-free network withstands randomnode (and link) attacks very well. However, if the tar-geting of the node removal is changed to include onlyhubs, that is nodes in the scale-free network with verymany connections, the overall function of the net-work deteriorates very fast, and the network soonbreaks down into many small, unconnected parts.
Social Network Analysis (SNA) can be consideredas a large and important subfield of network analysis(see the right-hand side of Figure 2). SNA has reachedmaturity as a scientific discipline, after beginning inthe late 1800s and picking up considerable momentumin the beginning of the 1900s [10]. The idea behindsocial network analysis can best be understood interms of how it differs from classical psychologicalstudies of the individual. Classically, one treats theindividual as isolated from other individuals, and thebehavior of the individual is viewed as the result of allthe individual’s attributes: gender, age, interests (foot-ball, technology savvy, etc.), personality, intelligence,etc. Social network analysis, on the other hand, real-izes that the individual is not isolated and separatedfrom the other individuals in the world. Social net-work analysis tries to uncover ties and relationshipsamong the individuals, and tries further to understandthe individual in the context of the other individualsand all the interdependences among them. This typeof analysis is not only applicable to persons as indi-viduals; thinking like this is also highly relevant fororganizations, companies, and even countries.
Consider for example an organization. Every organi-zation has implemented a hierarchical structure,which is the line-of-command. The implementationand utilization of the human resources in an organiza-tion can be efficient, and it can also be very ineffi-cient. Inefficiencies are often due to overloadedbosses that are not able to respond to all informationrequests and decisions that need to be made. It is inthe nature of a hierarchy that decisions tend not tobe distributed, while the expert knowledge is. It isthe job of leaders and management to make andimplement wise decisions, but doing this withoutthoroughly aggregating and utilizing the wisdom andknowledge of the ‘grass roots’ of the organization ishard, if not impossible. Management and leaders canthus become bottlenecks for the whole organization,instead of being the driving force.
Performing a network analysis of the communicationpatterns of the workers in an organization can aid inidentifying workers and leaders that are key nodes,and possibly bottlenecks, in the information flow.Having knowledge of for example who is discussingwith whom, who seeks advice from whom, and whotrusts whom, is very valuable. Utilizing this informa-tion in the correct manner can help the organizationto implement a more efficient organization. It allboils down to analyzing internal communicationwithin the organization, and, based on this analysis,pinpointing the right people that need to talk to eachother. This is invaluable information for an organiza-tion – and social network analysis is a first step inthe direction of finding this information.
One concept that plays a major role in social networkanalysis is the notion of centrality. There are manydifferent centrality measures and metrics that are usedin order to extract useful information from the net-work perspective that social network theory gives.Given a network, a natural question that can be askedis ‘which node is the most central, relative to theother nodes in the network?’. Measures such aseigenvector centrality, degree centrality and between-ness centrality try to answer this question by mathe-matizing the following ideas: ‘you are central if youknow other central people’, ‘you are central if youknow many different persons’, and ‘you are centralif you lie on many short paths of information flowbetween individuals’, respectively. Other usefuldescriptors of social networks include density, clus-tering, and cohesion. These measures seek to assesshow complete the link structure of the network is(which can be assessed both on a local and a globallevel).
Another area where network analysis plays a majorrole is Link analysis (LA – see the left hand side of
ISSN 0085-7130 © Telenor ASA 2008

9Telektronikk 1.2008
Figure 2). In link analysis one seeks meaningfulinformation from the regularities and irregularitiesin the patterns of linking which make up the graph’stopology. As can be seen from Figure 2, link analysiscan be used in a broad range of disciplines – forexample, in the banking and insurance industries (inrelation to fraud detection), in law enforcement (forexample, analyzing communication patterns), and inthe medical sector (epidemiology and spreading overnetworks). With link analysis one tries to find crucialrelationships and associations between diverseobjects of different types, so as to give a meaningfulwhole, in which all the pieces fit together. Eachobject treated by itself will just be an isolated pieceof information that will not give any useful insightunless it is put into some type of context with theother objects and pieces of information. Link analysisaims at doing this, by putting the separate and iso-lated pieces of information into a useful context, fromwhich a coherent and logical picture can be extracted.In a police investigation, it may be of crucial impor-tance to examine the addresses of suspects and vic-tims, the telephone numbers they have dialed, thefinancial transactions that they have partaken in dur-ing a given timeframe, and the family relationshipsbetween these subjects.
Web link analysis is that part of link analysis inwhich one uses the set of hyperlinks to place theweb pages of the World Wide Web in context. Linkanalysis is used by web search engines to rank hitlists using (along with other measures such as textrelevance) link-based centrality metrics – such asGoogle’s PageRank algorithm [11], Kleinberg’sHITS algorithm [12], and T-Rank [13]. The mainmotivation behind Web link analysis is the following:When you search for information on the Internettoday, you will most likely find thousands (maybemillions!) of hits in response to the query you typeinto the web search engine. There is no way in whichyou can sift through all these hits to find the very bestones; hence the web search engine has to make thejob easier for you by sorting (ranking!) the hits suchthat the most important hits are at the top. The link-based centrality algorithms contribute to the rankingby analyzing the network structure of all the webpages, and generating from this some kind of central-ity or ‘importance’ score for each page. Rememberthat millions of people have carefully designed anduploaded their web pages to the Internet, and theyhave linked their web pages to other web pages thatthey think are important or relevant in relation to theirown web page. Hence, one can think of the linkingbetween web pages on the World Wide Web as a wayof ‘voting’ for other web pages. There is thus a typeof recommendation built into the network structureof the World Wide Web, and the link analysis algo-
rithms try to harvest information from all these col-lective recommendations, with the aim of givingbetter ranking of long hit lists generated from searchqueries.
A field that does not lie centrally in our WikiMind-Map for ‘network analysis’, but that nevertheless canbe considered to be very closely related, is value net-work analysis (bottom left, Figure 2). Value networkanalysis [14] is usually viewed as an economic disci-pline, and may be viewed as a generalization of theearlier, and simpler, notion of ‘value chains’.Wikipedia (http://en.wikipedia.org/wiki/Value_net-work) defines a value network as “… complex sets ofsocial and technical resources [that] work together viarelationships to create social goods (public goods) oreconomic value”. We profoundly believe that com-bining economic theory and network analysis will bean extremely fruitful line of endeavor, and that valuenetwork analysis as a separate discipline has much togain from cross-fertilization with other areas of net-work analysis.
The last theme we would like to address, in this gen-tle introduction to network analysis, is something thatFigures 1 and 2 are living examples of: visualizationof networks. For a fairly small and hierarchical net-work, such as the mind-map visualized in Figure 2,the task of laying out the network on a 2D page isfairly straightforward. However, the complexity ofthe visualization task increases tremendously whenthe graph is not a hierarchical tree, when the nodeshave different states, when the links can represent dif-ferent types of relationships, and (not least!) when thenumber of nodes and links extend into the millions.For example: how can a telecommunication operatorvisualize the social network of all of its customers?What information is it possible to extract from avisual map of the underlying computer network onwhich the Internet is running?
Visualization of networks is about making accessiblecomplex sets of data and interactions among them.In fact, the underlying data might yield zero insightor understanding when presented in tabular form; buta good visualization will literally make some under-lying structure visible for any viewer, regardless ofthe complexity of the original data. In other words,visualization of networks is about communication,and how to communicate understanding of the dataat hand.
In the next section you will find a ‘beginner’s guide’to some of the principal technical concepts of net-work analysis. We will introduce basic terminologywhich lies at the foundation of network analysis,and provide concise definitions wherever possible.
ISSN 0085-7130 © Telenor ASA 2008

10 Telektronikk 1.2008
Understanding of the terms presented in this sectionshould be useful for the reader who then moves onto the other articles in this issue.
Finally, in the last section of this Introduction, wewill offer a reader’s guide to the many and variedcontributions in this special issue of Telektronikk. Wewill briefly introduce and describe each article, andalso seek to put each contribution in contextwith respect to network analysis.
Welcome to the fascinating world of networks!
2 Basic Concepts – An Introductionto Network Analysis
Now we establish a basic foundation of ideas and ter-minology for network analysis. The terms ‘network’and ‘graph’ will be used interchangeably throughoutthe presentation.
2.1 Networks Come in Two Flavors
2.1.1 Undirected Graphs
A graph/network is an abstract structure, composedof nodes connected by links. In fact, in the most sim-ple picture of a network, there is no other information– only the set of nodes, and the specification of thelinks connecting the nodes. Such a simple networkis typically termed an undirected graph. It is “undi-rected” because no information about the direction ofthe links has been given – just presence or absence.Such links (without any directional information) arealso termed symmetric links. An undirected graph isusually represented in one of two ways; 1) the undi-rected network may be represented as a list of links(this link list implicitly also gives the nodes, assum-ing no isolated nodes), or by 2) the adjacency matrixA. The adjacency matrix has the same information,stored as follows: if there is a link from node i tonode j, then, in the adjacency matrix, Aij = Aji = 1. Allother elements of A are zero. Clearly, for symmetriclinks, the adjacency matrix is symmetric: A = AT.A simple extension of the simple undirected graph isto allow for weights (other than 1 or 0) on the links,where the weights now may represent, for example,capacities of the links, or probability of transmissionof a virus. Such a graph is termed a weighted undi-rected graph. As real networks grow in the numberof nodes N, the average number of links connectingto each node tends to be roughly constant, rather thanbeing proportional to N. This makes the total numberof links roughly (constant) × N, resulting in the corre-sponding adjacency matrix being sparse. Sparsematrices are most efficiently represented by not stor-ing the zero elements in memory.
2.1.2 Directed Graphs
The obvious extension of the above undirected graphis to allow for directionality of the links – that is, alink between i and j may be from i to j (i → j), orfrom j to i (j → i). Such links are termed ‘directed’links, and the resulting graph is a directed graph.Directed links are used to represent asymmetric rela-tionships between nodes. For example: Web pagesare linked in the ‘Web graph’ [15,16,17] by hyper-links. These hyperlinks are one-way; so the Webgraph is a directed graph. Directed graphs can alsobe represented by an adjacency matrix A. The asym-metry of the links shows up in the asymmetry of theadjacency matrix: for directed graphs, A ≠ AT. Onecan also associate weights (other than 0 or 1) with thelinks of a directed graph. Thus directed graphs andundirected graphs have many features in common.Nevertheless (as we will see below), the structure ofa directed graph differs from that of an undirectedgraph in a rather fundamental way.
2.2 Structural Properties of Graphs
How then can one describe the structure of a graph –both on a microscopic and macroscopic level? Werefer the reader to [18] and [19] for some interestingideas about what is meant by the ‘structure’ of a net-work, and begin the discussion here with a very basicnotion: the network’s size. How big is a network? Avery crude measure of a network’s size is the numberN of nodes. Another measure of the network size isthe distance between a typical pair of nodes. The dis-tance between any two nodes can be counted as thelength (in “hops”, ie, number of edges) of the shortestpath between them. This definition is quite precise –except for the misleading term “the” in “the shortestpath” – since there may be many paths which areequally short. Hence a more precise wording for thedefinition of distance is the length (in hops) of anyshortest path between the nodes.
The definition of distance may be modified forweighted graphs. Here the ‘length’ of any path fromi to j may (as for undirected graphs) be taken to besimply the sum of weights taken from the links tra-versed by the path. The distance between i and j isthen unchanged (in words): it is the length of anyshortest path connecting i and j.
2.2.1 Undirected Graphs
We now restrict our discussion to the case of undi-rected graphs; we will treat directed graphs in a sepa-rate subsection, below. We return to the notion of thesize of a network, based on distances between nodes.For N nodes, there are N(N-1)/2 pairs of nodes – andeach pair has a shortest distance. So we want some-thing like an “average distance” between nodes, thatwe denote by L. One can define L simply as the arith-
ISSN 0085-7130 © Telenor ASA 2008

11Telektronikk 1.2008
metic mean of the N(N-1)/2 path lengths (althoughother definitions of ‘average’ can be useful). Thus,we now have another notion of the size of a graph– the average distance L between pairs of nodes.Another common notion of the size of a graph is thegraph diameter D. The diameter is simply the lengthof the ‘longest shortest path’. That is, of all theN(N-1)/2 shortest path lengths, D is the greatestlength found in this set. The diameter is clearly largerthan the average path length; yet, for large N, it typi-cally differs from L only by a constant (ie, N-inde-pendent) factor.
We make the following assumption (unless weexplicitly state the contrary) throughout this presenta-tion: we assume that any graph under discussion isconnected. An undirected graph is connected if thereis a path from any node to any other. Further, a con-nected graph does not ‘fall to pieces’: it is not in factmore than one graph. Our assumption requires thenthat any ‘recipe’ for ‘growing’ a network withincreasing N gives a connected graph for every N.This requirement is readily satisfied for certain typesof highly regular graphs; but it cannot always beguaranteed for graphs with randomness involved intheir construction (see [20] and [5] for details).Finally, in this regard, we mention the small-worldsphenomenon. Recall that the idea of the small worldscame from the sociologist Stanley Milgram, in the1960s [7]. Milgram performed letter-passing experi-ments which supported the idea that, in the UnitedStates with hundreds of millions of individuals, thetypical path length between any two individuals(where a link represents acquaintance) is about 6 – anastonishingly small number. We note that a propertyof random graphs – L ~ ln(N) – offers an explanationfor these small distances; but there is no reason tobelieve that the network of acquaintances is set uplike a random graph. Watts and Strogatz [20] offereda new class of graphs which has much less random-ness, but still gives (approximately) L ~ ln(N). Thesegraphs are often referred to as Watts-Strogatz(WS-)graphs.
The Watts-Strogatz work has sparked a great deal offurther research, which we will not attempt to reviewhere. A principal lesson of the Watts-Strogatz resultmay be stated as follows: for networks for which thenodes’ connections reflect some reasonable notion ofgeographic distance, the addition of a very small per-centage of long-range links can drastically change theaverage path length. And, stated in this way, webelieve that the Watts-Strogatz result does indeedexplain the small-worlds effect.
2.2.2 Directed Graphs
Introducing a direction to the links of a networkcan have profound effects on the properties of thatnetwork.
The definition of a path length needs just a minormodification to still be valid; the updated definitionof a path must take into account the direction. Hence,a path from i to j in a directed graph is a series ofdirected links, always traversed in the direction from‘tail’ to ‘head’ of the arc. Then, with this definition ofa path (a ‘directed path’), the path length is the sameas before (number of hops, or sum of weights).
The notion of connectedness for directed graphs is abit more complicated. A directed graph is connected(also called weakly connected) if, when one ignoresthe directions of the links (thus making it undirected),it is connected. However, it is clear that there can benode pairs in a connected, directed graph, for whichthere is no (directed) path from one node of the pairto the other. Hence we need a further notion, namelythat of being strongly connected. A directed graph isstrongly connected if there is a directed path fromevery node to every other node.
We will as usual insist that any directed graph underconsideration be connected. However, typically, con-nected directed graphs are not strongly connected;and we will lose generality if we only discussstrongly connected directed graphs. Instead, one canalways find subgraphs of a directed graph that arestrongly connected. By subgraph, we mean simply asubset of the nodes, plus all links (that are present inthe whole graph) connecting these nodes. For exam-ple, if one can find, in a given directed graph, anytwo nodes that point to each other, then these nodesconstitute a strongly connected subgraph of the givengraph. Strongly connected component (SCC) is theterm for a ‘maximal’ strongly connected subgraph –that is, a strongly connected subgraph that is ‘as bigas possible’, in that it loses its property of beingstrongly connected if any other node is added to thesubgraph. A typical directed graph is thus composedof multiple SCCs, with each node belonging to one,and only one, SCC. Also, the linking relationshipsbetween the SCCs are necessarily asymmetric, ie,one-way (since two hypothetical SCCs which areconnected by links in both directions must in factbelong to a single SCC).
Using the SCCs, one can define a ‘coarse structure’for a directed graph. This coarse structure is termeda component graph [21], where each SCC is repre-sented as a node, and each pair of SCCs which isdirectly linked gets a one-way link connecting themin the component graph. The component graph is
ISSN 0085-7130 © Telenor ASA 2008

12 Telektronikk 1.2008
loop-free, that is, it is a directed acyclic graph orDAG. If we think of any kind of flow or movement(say, of information, or of a computer virus [22,23])which follows the direction of the arcs, then it is clearfrom the acyclic nature of the component graph thatflow is essentially one-way. Thus we see that thenotion of connectivity is considerably more involvedfor directed graphs than for undirected graphs. Thismakes a directed graph profoundly different from anundirected graph.
Now we proceed to the question of path lengths.For a typical directed graph with more than oneSCC, there will exist pairs of nodes for which thepath length is – as for some pairs in an unconnectedgraph – undefined (or infinite). This is because therewill be node pairs (a,b) for which there is no directedpath from a to b. Therefore, the definition of averagepath length and diameter for directed graphs is lessstraightforward than it is for undirected graphs.
One possibility is to ignore the direction of the links.However, if directionality of the links is meaningful,then it should not be ignored. Another is to only lookat a strongly connected component – for which allnodes are reachable from all others – perhaps thelargest SCC [24]. A third choice is to only averageover those pairs for which a directed path exists [25].This latter strategy actually somewhat resemblesMilgram’s [7]; after all, he did not count those letterswhich failed to reach their target.
2.3 Node Degree Distribution
Next we come to a concept which is heavily used innetwork analysis, namely the node degree distribu-tion or NDD. We consider first the case of an undi-rected graph.
2.3.1 Undirected Graphs
When links are undirected, then for each node i wecan define a node degree ki which is simply the num-ber of links to that node. Now we define pk to be thefraction of nodes in a graph which have node degreek. The set of pk then defines the node degree distribu-tion. Clearly 0 ≤ pk ≤ 1; also, Σ
kpk = 1. Thus the pk
have all the properties of a probability distribution,and can in fact be used to describe families of graphs,subject to the constraint that the probability (averagedover the family) for a node to have degree k is pk.
In a regular graph, every node has the same degreeK, so that pk = 1, and all other pk = 0. A completegraph is regular, with K = N-1. Small perturbationson regular graphs give graphs with a peak at k = K,and some weight around this peak at K. Such graphsare in many ways much like regular graphs; but at thesame time, some properties of graphs (such as the
average path length) can vary strongly upon only aslight deviation from a regular graph with an orderedstructure of short-range links. Here we are thinking ofthe small-worlds effect [20].
In fact, the node degree distribution is far from offer-ing a complete description of any graph. Two graphswith roughly equal NDD can have similar link struc-ture, but very different average path lengths. Anothertwo graphs, also with roughly the same NDD, canhave very different link structures, but similar aver-age path length. What’s worth remembering is thatgraphs that are structurally very different can in facthave the same node degree distribution.
A very important class of graphs is the scale-freegraphs. These are graphs whose NDD follows aninverse power law: pk ~ k-α. They are termed ‘scale-free’ because the NDD itself is scale free: a powerlaw remains a power law (with the same exponent)under a change of scale of the k axis. Scale-free net-works are also called ‘heavy-tailed’, because theydecay more slowly than exponentially at large k – soslowly, in fact, that they can have an unbounded vari-ance. Scale-free graphs are also (typically) small-world graphs [26,27] – in the sense given above, ie,that their average path length grows no faster thanln(N). However, the reverse is not true: not all small-worlds graphs are scale free. An obvious counter-example is the class of Watts-Strogatz graphs, whichare small-world graphs, but which have an NDD verydifferent from power-law. A good discussion of therelationships between these two aspects of networksis given in [27].
2.3.2 Directed Graphs
For directed graphs we can define, for each node i,two types of node degree: the indegree ki
in, and theoutdegree ki
out. Each of these types of node degreehas its own node degree distribution over the entiredirected network – denoted by pk
in and pkout, respec-
tively. Then, for a directed graph to be consideredscale free, both of the node degree distributionsshould display a power-law. The two distributionstypically have different exponents.
2.4 Clustering Coefficient
The clustering coefficient measures to what extent anetwork has dense local structure – ie, how close thenetwork is to being a clique (a network with all-to-allconnections). As an example, consider the acquain-tanceship network. Suppose node j has five one-hopneighbors (ie, acquaintances). Do we expect thesefive people (at least, some pairs taken from them) tobe acquainted with one another? The answer is surelyyes: acquaintanceship tends to be clustered. Friendsare not chosen at random; and the likelihood that
ISSN 0085-7130 © Telenor ASA 2008

13Telektronikk 1.2008
two of my friends are acquainted with one another ismuch higher than that for two randomly chosen peo-ple. Therefore, acquaintanceship networks will nor-mally show higher clustering than a random networkwith the same number of nodes and links.
In order to quantify the extent of clustering, one cancompare the ratio of the number of triangles in thenetwork to the number of connected triples in thenetwork. A triangle is a connected subgraph of threenodes which is a clique – that is; all the possible threelinks among the three nodes are present. A connectedtriple, in contrast, is a connected subgraph of threenodes which have only two links connecting the threenodes.
One approach to defining a clustering coefficient Cfor a graph is as follows. First one defines a localclustering coefficient around each node i:
then one takes the average of this local clusteringcoefficient over all nodes:
This definition comes from the work of Watts andStrogatz [20]. Implicitly, in the above discussion, wehave considered an undirected graph, but the sameidea of defining the clustering coefficient as theratio of triangles to triples may be generalized to thedirected case. A definition of the clustering coeffi-cient which is distinct from the above definition canbe obtained by doing the averaging in a differentmanner. In the above definition, the Ci are localratios, defined for each node i, and the average is
taken over these local ratios. One can readily modifythe definition to be the ratio of two whole-graph aver-ages – that is, the ratio of the average number of tri-angles to the average number of triples [26].
Quite often one simply refers to “the” clustering co-efficient – thus ignoring these differences. The pointis that, for some types of graphs (ie, for some recipesfor growing graphs), the clustering, by either of thesedefinitions, tends to vanish as N grows; while forother types, neither of them vanishes, even for verylarge N. Intuitively, we expect “real” networks tohave some degree of neighbourhood structure, andhence to fall into the second category. In contrast,random graphs fall into the first category – they haveno correlations among the links, and hence no cluster-ing. For this reason, even though random graphs havevery small path lengths, they are not considered asrealistic models for empirical networks.
Seeking a definition which is more in harmony withwhat we know and believe about empirical networks,Duncan Watts [20] has proposed a definition of asmall-world graph which includes two criteria: (i) theaverage path length L should be like that of a randomgraph; but (ii) at the same time, the clustering coeffi-cient C should be much larger than that for a randomgraph. That is, by this (widely accepted) definition,a small-worlds network should have a significantdegree of neighborhood structure, and also enough‘long-range’ links that the network diameter is verysmall. Scale-free networks fit this definition [27]. Itseems in fact that an enormous variety of measurednetworks are small-world graphs by this definition.
Figure 3 This is an example of the node degree distribution of a real communications network. The plot of the indegree is in theleft, and on the right we see the outdegree. Both these plots display a typical scale-free structure observed in real systems
Ci =number of triangles connected to node i
number of triples centered on node i;
C =1
N
∑
i
Ci.
# subscribers # subscribers106 106
105 105
104 104
103 103
102 102
101 101
100 100101 101102 102103 103104
InDegree OutDegree
100 100
ISSN 0085-7130 © Telenor ASA 2008

14 Telektronikk 1.2008
As a final note of this subsection we mention that theabove definition for clustering coefficients can beadapted to networks with weighted links.
2.5 Centrality on Networks
We now turn to the concept of centrality of the nodesin a network. The purpose of the centrality concept isto find out how “important” each node is, in the con-text defined by the other nodes in the network and thegiven link structure. For example, in a computer net-work, some computers are more important/centralthan other, more peripheral, computers, since thefunctioning of the computer network relies more onthese central computers than on the others. Also, inthe case of a social network, we humans (as socialcreatures) intuitively understand that there can belarge differences in ‘centrality’ among the membersof the social network. Hence, it is clear that ideas ofcentrality can play a significant role in the analysisof networks, and in the way that we are able to under-stand the functioning of large and complex networks– including those that usually defeat our intuition.
There exist many distinct definitions of centrality,and we will discuss some of them in the followingsubsections.
2.5.1 Degree Centrality
Degree centrality is the first and simplest example ofa centrality measure for nodes in a network: Degreecentrality of a node i is simply its degree ki. This def-inition is consistent with the intuitive notion that hav-ing more contacts makes one more central. Also, it isvery easily calculated, since for each node one justcounts the number of nearest neighbors. Is there any-thing missing then from this definition? Well, itclearly ignores every aspect of the network’s structurebeyond the one-hop neighborhood view from eachnode, and is thus purely local in nature. Also, degreecentrality takes no consideration of the “quality” ofyour neighbors – it is only their number that matters.Degree centrality can be used in assessing the imme-diate risk of a node for catching whatever is flowingthrough the network, such as a virus, or information.It is important then to understand that degree central-ity measures this risk only locally, and applies whenin fact the virus or information is within the one-hopneighborhood of the node.
In the directed case, the degree centrality is modifiedby taking into account the asymmetry of the links.Hence, for each node it is natural to speak aboutindegree and outdegree centrality.
2.5.2 Betweenness Centrality
Another type of centrality is captured with thebetweenness centrality of a node. The idea of
betweenness is simply this: a node has high between-ness centrality – also termed simply ‘betweenness’ –if it lies (in some sense) ‘between’ lots of other pairsof nodes. Thus, if I have high betweenness, thenmany node pairs within the network wishing to com-municate with each other will likely do so throughme. Clearly, the measure of betweenness centralitydepends on the entire network topology.
Mathematically, one resorts to finding shortest pathsamong the nodes in order to find a quantitative mea-sure of betweenness centrality. Look at each pair ofnodes (i,j), and define gij as the number of shortestpaths between i and j. The betweenness is then con-sidered for some other node k; so we define gikj asthe number of shortest paths connecting i and j whichgo through node k. The contribution to node k’sbetweenness coming from the pair (i,j) is thengikj / gij. Then, the betweenness of node k is simplythe sum of this quantity over all pairs of nodes:
This definition seems complicated; but note that, inthe (rare, but simple) case that there is a unique short-est path between every pair of nodes, this definitionfor bk simply reduces to counting the number ofshortest paths that node k lies on (but is not an end-point of). Thus the extra complications arise from thefact that there are often multiple shortest paths for agiven pair of nodes.
Betweenness centrality thus measures the importanceof a node in transmissions over the network – forexample, of information, traffic, viruses, etc. A pos-sible weakness is the choice to count only shortestpaths, since all paths between two nodes can playsome role in transmission – with the shortest pathshaving most weight, but not the only weight.
2.5.3 Eigenvector Centrality
Eigenvector centrality tries to capture the followingidea: ‘It’s just not how many you know, but who youknow that matters’. In other words: your centralityalso depends on your neighbors’ centralities. Actu-ally, the first centrality measure we discussed above,degree centrality, is only counting the number ofneighbors. In this sense, we can think of eigenvectorcentrality as a modification of degree centrality. Thesimplest way of making these words precise is to takethe sum; so, letting ei be the eigenvector centrality ofnode i, we write
Here “j = nn(i)” means only include nodes j whichare nearest neighbors of i in the sum. We use a pro-
bk =∑
pairs i,j
i �=k;j �=k
(gikj/gij)
ei ∝
∑
j=nn(i)
ej .
ISSN 0085-7130 © Telenor ASA 2008

15Telektronikk 1.2008
portionality sign rather than equality here, becausewe have made a circular definition: my centralitydepends on my neighbors’, but theirs depends on thatof their neighbors – including mine. Hence we mustseek a self-consistent solution; and this requires somefactor in front of the summation:
Now our reasoning has given us this parameter λ:what is it? Can it be chosen freely? In fact the answeris simple. We rewrite the above as:
Ae = λe,
where A is the adjacency matrix, and e is the vectorof centralities. Here we have used the fact that
ej = (Ae)i.
Thus we have come to an eigenvector equationinvolving the adjacency matrix A. From this we knowthat there are N possible eigenvalues λ to choosefrom – each with its corresponding eigenvector. Wecan however quickly narrow down this choice: theadjacency matrix is non-negative and real, which(along with Perron-Frobenius theory [28]) tells usthat one, and only one, eigenvector has all positiveelements – namely, the eigenvector corresponding tothe principal (largest) eigenvalue. We want a node’scentrality to be a positive quantity. Hence we choosethe principal eigenvector e as the solution to theabove equation; and its i’th component ei is then theeigenvector centrality (EVC) [29] of node i. Definedthis way, a node’s EVC ei is sensitive to the EVC val-ues of its neighbors – and their values in turn to thoseof their neighbors, etc.
Eigenvector centrality has been used in studies of epi-demic spreading on undirected graphs. Simulationsreveal that there is a close connection between thetime at which the rate of new infections (or adop-tions) takes off, and the time when the most centralnode, as given by the eigenvector centrality, isinfected (or adopts) [30,31].
Carrying this seemingly orderly picture of the undi-rected case over to the directed case is not straightfor-ward. The asymmetry of the adjacency matrix for adirected graph suggests that every node in the net-work plays two distinct roles: a node can point toother nodes (the set of out-neighbors), and at thesame time a node can be pointed to (by the in-neigh-bors). These properties, ‘pointing-to’ and ‘being-pointed-to’, have found useful application in onlineweb search engines for ranking hit-lists; in this field,these two properties correspond to, respectively, a
node’s hub and authority score. For a more thoroughdiscussion of the directed case, see the paper byBjelland et al in this issue of Telektronikk.
2.6 K-Cores of a Network
The k-core of a network is a subgraph, which may bedefined by the procedure which generates it, for eachk. The 1-core of a network is found by removing allthe nodes of degree zero (which are isolated nodes).The 2-core is found by pruning off nodes of degreeone or less in a recursive manner. That is: afterremoving all nodes of degree one or less, examine theresulting network, and remove all nodes which nowhave degree one or less; and repeat until nothingchanges. Thus the 2-core of a network is the largestsubgraph for which every node has degree at leasttwo. We can illustrate these ideas by considering anetwork which has a tree structure (no loops). As thereader can verify (by recursively pruning leaves – endnodes – from the tree), a tree has a non-zero 1-core;but the k-cores for all higher k are empty (have nonodes). The general definition for any k should bynow be clear: the k-core of a network consists of allremaining nodes and links, after the recursive pruningof all the nodes (and their respective links) havingdegree less than k. The concept of k-core is in fact afairly recent construction [32,33], which has foundapplications in the structural study of networks, inbiology, in information filtering, and in graph visual-ization. This last application brings us to the nextsubsection.
2.7 Visualizing Networks
One should never underestimate the power of com-municating by visualization. Everyone has heard thesaying: “a picture is worth a thousand words”. Thisis more or less true also in the case of network visual-ization, or graph drawing [34]. Recall the fact that anetwork may be simply represented as two lists – alist of nodes, and a list of all the links between theconnected nodes – and that such a representationin fact completely specifies the (abstract) network.However, humans have an easier time digestingvisual information, and in order for humans to under-stand what their network data is telling them, theinformation contained in the lists may be better con-veyed by a drawing of the network. We emphasizehere that several visually different network diagramscan indeed depict the same underlying, abstract net-work, but the way the drawing has been done canreveal different aspects of the network. The point isthen that different methods can be used to learn dif-ferent things about the network.
There are several different graph layout strategies.(See [35,36,37] for sites with working visualizationtools.) A very popular approach is the method of the
ei =
(1
λ
) ∑j=nn(i)
ej .
∑
j=nn(i)
ISSN 0085-7130 © Telenor ASA 2008

16 Telektronikk 1.2008
force-directed layout. Here the idea is to treat the net-work as a physical system, where the nodes are elec-trically charged and connected with springs (with thelinks weights as spring constants). So the electriccharge acts to repel the nodes from one another,whereas the springs are working to keep linked pairsof nodes together. The force-directed layout thenminimizes the energy function of this system, andproduces very appealing network diagrams. Nodesthat are tightly connected (large link weight) will bedisplayed close together, and weakly connected nodeswill be displayed far from each other. For a humanthis is visually intuitive, and what one would expect.
3 What You Can Read About in thisIssue on Network Analysis
In this Telektronikk special issue on network analysisyou can dive deeper into network-analytic topics andclosely related themes. The different contributionsthat are contained in this issue of Telektronikk arediverse and cover different aspects of network analy-sis.
Heegaard et al. in The Cross Entropy Ant System forNetwork Path Management address the problem offinding optimal routes in a network. “Isn’t this an oldand solved problem?” you might ask, but the differ-ence lies in the information needed to find the routes.All the classical approaches and algorithms for find-ing shortest paths in a network assume that globalinformation about the network is available. Thismeans that the algorithm has information about thefull network topology when running. The approachdiscussed in this paper, Cross-Entropy Ant System(CEAS), assumes no such knowledge. Hence, theapproach is a fully distributed, and no globalknowledge of the network topology is needed. Theapproach is based on borrowing ideas from biology,more specifically the foraging process used by ants.When ants are out exploring they tag their paths witha scent (that over time will decay). The more ants thatwalk down the same path, the stronger is the scent ofthat path. This tells newcomer ants that, if they godown paths of strong scent, they will reach an inter-esting target faster. Mimicking this on a network iswhat the CEAS approach does. The advantage of theapproach is that it is fully distributed, and it is alsovery adaptable (unlike most global methods) in thecase of node and link failure.
There are three contributions within social networkanalysis. The first, The Social Networks of Teens andYoung Adults, by Ling, studies the social networks ofteens and young adults. The question raised is howco-present (face-to-face) contact is an important fac-tor in the development and maintenance of social
groups. Mediating interaction will support the alreadyexisting social ties, but it is the copresence of the per-sons in the group that builds the social ties, whichthen later can be cultivated by mediating interactions,for example by means of telecommunication services.
Schnorf, in the second contribution ForwardingMessages in Mobile Social Networks – an Explora-tory Study, discusses how social network analysis canbe used as a tool for understanding diffusion of infor-mation in social networks. This exploratory studyexemplifies how social network analysis can be usedby for example a mobile telecommunication operatorin gaining a new perspective on their customers. Forexample, customer segmentation should also be con-sidered in the context of the customers’ social net-work, and not only using the attribute-based approachof traditional marketing.
Thirdly, Julsrud in Collaboration Patterns inDistributed Work Groups: A Cognitive NetworkApproach, takes us into the realm of organizationalnetwork analysis, by investigating collaborationpatterns in distributed work groups. The suggestedmethod to use is the cognitive network approach,where perceived relations among the users shouldalso be taken account of in the analysis. Interaction-based ties should be handled with care, and possiblysupplemented with other relational network indicatorsin network studies of distributed groups.
Fjeldstad, in Innovation in a Value Network Per-spective, guides us into that area of network analysis– value networks – that is closest in content to eco-nomic theory. In this article, an innovation is definedas an exploratory activity which results in new skills,practices, technologies, services or products of a firm.Fjeldstad discusses innovations in the context ofvalue networks; the core innovations for a networkedservice are those that increase network connectivity(the number of people that can be reached by the ser-vice) and network conductivity (what can be trans-acted over the network). With this view in mind; themain task of a mobile telecommunications operator isto serve existing relations among its customers moreefficiently, and to enable and serve potentially newrelations.
Becker and Gaivoronski offer a different avenueinto the world of networks in Quantitative NetworkAnalysis and Modelling of Networked MultiagentEnvironment. By taking the reader on a trip into theworld of stochastic optimization, coupled with con-temporary investment science and game theory, theyoffer the reader a glimpse of a tool that can be used inthe evaluation of business models and in the support
ISSN 0085-7130 © Telenor ASA 2008
17Telektronikk 1.2008
of strategic decision making in an uncertain, net-worked, multiagent telecommunication environment.
Bjelland et al in Web Link Analysis: Estimating aDocument’s Importance from its Context, take thereader on a journey into a contemporary part of net-work analysis called web link analysis. Every user ofa web search engine knows that information overflowis becoming a larger and larger problem in the infor-mation age – search engines typically return far toomany hits. Thus the hits must be ranked, such that the‘best’ hits are placed at the top of the list. Web linkanalysis (as exemplified by Google’s famous Page-Rank algorithm) is one tool which is used to help inthis challenging ranking task. The article by Bjellandet al is an overview of the main ideas around, andmathematical approaches to, Web link analysis.
Lastly, Aggarwal et al in Modelling Overlay-Under-lay Correlations Using Visualization, analyze overlaynetwork structures in the context of the underlyingnetwork infrastructure. The approach is based onvisualization. Using visualization analytically in thisway is both novel and ingenious, and may prove to bea promising tool in the general process of engineeringoverlay network structures.
We wish the reader a stimulating journey in the worldof networks when reading this issue of Telektronikk!
4 References1 Braess, D, Nagurney, A, Wakolbinger, T. On a
paradox of traffic planning. Journal of Trans-portation Science, 39, 446-450, 2005.
2 Network analysis. (2008, January 30). InWikipedia, The Free Encyclopedia. Retrieved09:29, March 3, 2008, fromhttp://en.wikipedia.org/w/index.php?title=Network_analysis&oldid=188011760
3 See for example http://mathforum.org/isaac/prob-lems/bridges2.html.
4 Bollobás, B. Random Graphs. New York, Aca-demic Press, 1985, xvi+447pp.
5 Chung, F, Lu, L. Complex Graphs and Networks.CBMS Lecture Series, No.107, AMS Publica-tions, 2006, vii + 264pp.
6 McHugh, J A. Algorithmic Graph Theory. NewJersey, Prentice Hall, 1990.
7 Milgram, S. The Small World Problem. Psychol-ogy Today, May 1967, 60-67.
8 Albert, R, Jeong, H, Barabasi, A-L. Error andattack tolerance of complex networks. Nature,406, 378-382, 2000.
9 Holme, P, Kim, B J, Yoon, C N, Han, S K. Attackvulnerability of complex networks. Phys. Rev. E,65, 056109, 2002.
10 Freeman, L. The Development of Social NetworkAnalysis. Vancouver, Empirical Press, 2004.
11 Page, L, Brin, S, Motwani, R, Winograd, T. Thepagerank citation ranking: Bringing order to theweb. Stanford, CA, Stanford University, 1998.(Technical report)
12 Kleinberg, J M. Authoritative sources in a hyper-linked environment. Journal of the ACM, 46(604), 1999.
13 Bjelland, J, Burgess, M, Canright, G, Engø-Mon-sen, K. Eigenvectors of Directed Graphs andImportance Scores: Dominance, T-Rank, and SinkRemedies. 2008. (DELIS technical report TR-0629) http://delis.upb.de/paper/DELIS-TR-0629.pdf
14 Stabell, C B, Fjeldstad, Ø D. Configuring ValueFor Competitive Advantage: On Chains, Shops,and Networks. Strategic Management Journal,19, 413-437, 1998.
15 Kumar, R, Raghavan, P, Rajagopalan, S, Sivaku-mar, D, Tomkins, A S, Upfal, E. The Web as agraph. Proc. 19th ACM SIGACT-SIGMOD-AIGART Symp. Principles of Database Systems,PODS, 2000.
16 Broder, A, Kumar, R, Maghoul, F, Raghavan, P,Stata, R, Tomkins, A, Wiener, J. Graph structurein the web. In: Proceedings of the 9th Interna-tional World Wide Web Conference, 247-256,2000.
17 Leonardi, S, Donato, D, Laura, L, Millozzi, S.Large scale properties of the web graph. Euro-pean Journal of Physics, B38, 239–243, 2004.
18 Girvan, M, Newman, M. Community structure insocial and biological networks. Proc. Natl. Acad.Sci. USA, 99, 8271-8276, 2002.
19 Canright, G, Engø-Monsen, K. Roles in networks.Science of Computer Programming, 53 (195),2004.
ISSN 0085-7130 © Telenor ASA 2008

18 Telektronikk 1.2008
20 Watts, D. Small Worlds: The Dynamics of Net-works between Order and Randomness. Prince-ton, Princeton University Press, 1999.
21 Cormen, T H, Leiserson, C E, Rivest, R L. Algo-rithms. Cambridge, Massachusetts, MIT Press,1990.
22 Kephart, J O, White, S R. Directed-Graph Epi-demiological Models of Computer Viruses. Pro-ceedings of the 1991 IEEE Computer SocietySymposium on Research in Security and Privacy.Oakland, California, May 20-22, 1991, 343-359.
23 Newman, M E J, Forrest, S, Balthrop, J. Emailnetworks and the spread of computer viruses.Phys. Rev. E, 66, 035101, 2002.
24 Adamic, L A. The Small World Web. Proc. 3rdEuropean Conf. Research and Advanced Technol-ogy for Digital Libraries, ECDL, 1999.
25 Albert, R, Jeong, H, Barabási, A-L. Diameter ofthe World-Wide Web. Nature, 401, 130-131,Sept. 1999.
26 Newman, M E J. The structure and function ofcomplex networks. SIAM Review, 45, 167-256,2003.
27 Amaral, L A N, Scala, A, Barthélémy, M, Stan-ley, H E. Classes of small-world networks. ProcNatl Acad Sci USA, October 10, 2000, 97 (21),11149-11152.
28 Minc, H. Nonnegative Matrices. New York,Wiley Interscience, 1987.
29 Bonacich, P. Power and centrality: a family ofmeasures. American Journal of Sociology, 92,1170-1182, 1987.
30 Canright, G, Engø-Monsen, K. Spreading on net-works: a topographic view. Proceedings, Euro-pean Conference on Complex Systems, (ECCS05),2005.
31 Canright, G S, Engø-Monsen, K. Epidemicspreading over networks: a view from neighbour-hoods. Telektronikk, 101 (1), 65-85, 2005.
32 Seidman, S B. Network structure and minimumdegree. Social Networks, 5, 269-287, 1983.
33 Bollobas, B. The evolution of sparse graphs. In:Graph Theory and Combinatorics, Proc. Cam-bridge Combinatorial Conf. in honor of PaulErdos. Academic Press, 1984, 35-57.
34 Di Battista, G, Eades, P, Tamassia, R, Tollis, I G.Graph Drawing: Algorithms for the Visualizationof Graphs. Upper Saddle River, NJ, Prentice HallPTR, 1998.
35 Netdraw. http://www.analytictech.com/Netdraw/netdraw.htm
36 de Nooy, W, Mrvar, A, Batagelj, V. ExploratorySocial Network Analysis with Pajek. CambridgeUniversity Press, 2005. See alsohttp://vlado.fmf.uni-lj.si/pub/networks/pajek/
37 Tulip. http://www.labri.fr/perso/auber/projects/tulip/
38 Barabási, A-L. Linked: The new science of net-works. Cambridge, Massachusetss, Perseus Pub-lishing, 2002.
39 Bornholdt, S, Schuster, H G (eds). Handbook ofGraphs and Networks: From the genome to theInternet. Weinheim, Wiley-VCH, 2003.
40 Strogatz, S H. Exploring complex networks.Nature, 410, 268-276, 2001.
41 Golub, G H, Van Loan, C H. Matrix Computa-tions. The Johns Hopkins University Press, Sec-ond Edition, 1989.
42 Motwani, R, Raghavan, P. Randomized Algo-
rithms. Cambridge, UK, Cambridge UniversityPress, 1995.
43 Rogers, E M. Diffusion of Innovations, 3rd ed.New York, Free Press, 1983.
For a presentation of the authors please turn to page 3.
ISSN 0085-7130 © Telenor ASA 2008