Archipelago: A Network Security Analysis Tool
15
Archipelago: A Network Security Analysis Tool Tuva Stang , Fahimeh Pourbayat , Mark Burgess , Geoffrey Canright , Kenth Engø and ˚ Asmund Weltzien Oslo University College, Norway and Telenor Research, Oslo, Norway July 26, 2003 Abstract Archipelago is system analysis and visualization tool which implements several methods of auto- mated resource and security analysis for human- computer networks; this includes physical net- works, social networks, knowledge networks and networks of clues in a forensic analysis. Access control, intrusions and social engineering can be discussed in the framework of graphical and in- formation theoretical relationships. Groups of users and shared objects, such as files or con- versations, provide communications channels for the spread of both authorized and un-authorized information. We present a Java based analysis tool that evaluates numerical criteria for the secu- rity of such systems and implements algorithms for finding the vulnerable points. 1 Introduction Network security is a subject that can be dis- cussed from many viewpoints. Many dis- cussions focus entirely upon the technolo- gies that protect individual system transac- tions, e.g. authentication methods, ciphers and tunnels. Less attention has been given to the matter of security management, where a general theoretical framework has been lacking. In this work, we explore two theoreti- cal methods to estimate systemic security, as opposed to system component security. describe a tool (Archipelago) for scanning systems, calculating and visualizing the data and testing the results. Our paper starts with the assumption that security is a property of an entire system[1] and that covert channels, such as social chat- ter and personal meetings, are often viable ways to work around so-called strong se- curity mechanisms. File access security is a generic representation of communication flow around a system, and we use it as a way of discussing several other problems. Other issues like social engineering have previ- ously been notoriously difficult to address in quantitative terms, but fit easily into our discussion. We have made some progress in this area by applying graph theoretical tech- niques to the analysis of systems[2]. In this paper we implement a tool for using these techniques and demonstrate its use in a num- ber of examples. The paper begins with a brief discussion of the graph-theoretical model of security, and how it is used to represent associations that lead to the possible communication of data. Next we consider how complex graphs can be easily represented in a simplified vi- sual form. The purpose of this is to shed light on the logical structure of the graph, rather than its raw topological structure. We describe a method of eigenvector centrality for ranking nodes according to their impor- tance, and explain how this can be used to organize the graph into a logical structure. Finally, we discuss the problem of how eas- ily information can flow through a system and find criteria for total penetration of in- formation. 2 Graphs A graph is a set of nodes joined together by edges or arcs. Graph theoretical meth- ods have long been used to discuss issues in computer security[3, 4], typically trust re- lationships and restricted information flows (privacy). To our knowledge, no one has 1
Transcript of Archipelago: A Network Security Analysis Tool
Archipelago: A Network Security Analysis Tool
Tuva Stang�, Fahimeh Pourbayat
�, Mark Burgess
�,
Geoffrey Canright�, Kenth Engø
�and Asmund Weltzien
�
Oslo University College, Norway � and Telenor Research, Oslo, Norway �
July 26, 2003
Abstract
Archipelago is system analysis and visualizationtool which implements several methods of auto-mated resource and security analysis for human-computer networks; this includes physical net-works, social networks, knowledge networks andnetworks of clues in a forensic analysis. Accesscontrol, intrusions and social engineering can bediscussed in the framework of graphical and in-formation theoretical relationships. Groups ofusers and shared objects, such as files or con-versations, provide communications channels forthe spread of both authorized and un-authorizedinformation. We present a Java based analysistool that evaluates numerical criteria for the secu-rity of such systems and implements algorithmsfor finding the vulnerable points.
1 Introduction
Network security is a subject that can be dis-cussed from many viewpoints. Many dis-cussions focus entirely upon the technolo-gies that protect individual system transac-tions, e.g. authentication methods, ciphersand tunnels. Less attention has been givento the matter of security management, wherea general theoretical framework has beenlacking.
In this work, we explore two theoreti-cal methods to estimate systemic security,as opposed to system component security.describe a tool (Archipelago) for scanningsystems, calculating and visualizing the dataand testing the results.
Our paper starts with the assumption thatsecurity is a property of an entire system[1]and that covert channels, such as social chat-ter and personal meetings, are often viable
ways to work around so-called strong se-curity mechanisms. File access security isa generic representation of communicationflow around a system, and we use it as a wayof discussing several other problems. Otherissues like social engineering have previ-ously been notoriously difficult to addressin quantitative terms, but fit easily into ourdiscussion. We have made some progress inthis area by applying graph theoretical tech-niques to the analysis of systems[2]. In thispaper we implement a tool for using thesetechniques and demonstrate its use in a num-ber of examples.
The paper begins with a brief discussionof the graph-theoretical model of security,and how it is used to represent associationsthat lead to the possible communication ofdata. Next we consider how complex graphscan be easily represented in a simplified vi-sual form. The purpose of this is to shedlight on the logical structure of the graph,rather than its raw topological structure. Wedescribe a method of eigenvector centralityfor ranking nodes according to their impor-tance, and explain how this can be used toorganize the graph into a logical structure.Finally, we discuss the problem of how eas-ily information can flow through a systemand find criteria for total penetration of in-formation.
2 Graphs
A graph is a set of nodes joined togetherby edges or arcs. Graph theoretical meth-ods have long been used to discuss issuesin computer security[3, 4], typically trust re-lationships and restricted information flows(privacy). To our knowledge, no one has
1
considered graphical methods as a practi-cal tool for performing a partially automatedanalysis of real computer system security.Computer systems can form relatively largegraphs. The Internet is perhaps the largestgraph that has ever been studied, and muchresearch has been directed at analyzing theflow of information through it. Researchshows that the Internet[5] and the Web[6](the latter viewed as a directed graph) eachhave a power-law degree distribution. Sucha distribution is characteristic[7, 8, 9] ofa self-organized network, such as a socialnetwork, rather than a purely technologicalone. Increasingly we see technology be-ing deployed in a pattern that mimics socialnetworks, as humans bind together differenttechnologies, such as the Internet, the tele-phone system and verbal communication.
Social networks have may interesting fea-tures, but a special feature is that they do notalways have a well defined centre, or pointof origin; this makes them highly robustto failure, but also extremely transparent toattack[10]. A question of particular inter-est to a computer security analyst, or evena system administrator deploying resourcesis: can we identify likely points of attack ina general network of associations, and usethis information to build analytical tools forsecuring human-computer systems?
3 Associations
Users relate themselves to one another byfile sharing, peer groups, friends, messageexchange, etc. Every such connection repre-sents a potential information flow. An anal-ysis of these can be useful in several in-stances:
� For finding the weakest points of asecurity infrastructure for preventativemeasures.
� In forensic analysis of breaches, totrace the impact of radiated damage ata particular point, or to trace back tothe possible source.
Communication takes place over manychannels, some of which are controlled andothers that are covert. A covert channel is a
pathway for information that is not subjectto security controls.
Our basic model is of a number of users,related by associations that are mediated byhuman-computer resources. The graphs wediscuss in this paper normally represent asingle organization or computer system. Wedo not draw any nodes for outsiders; ratherwe shall view outsiders as a kind of reser-voir of potential danger in which our orga-nization is immersed.
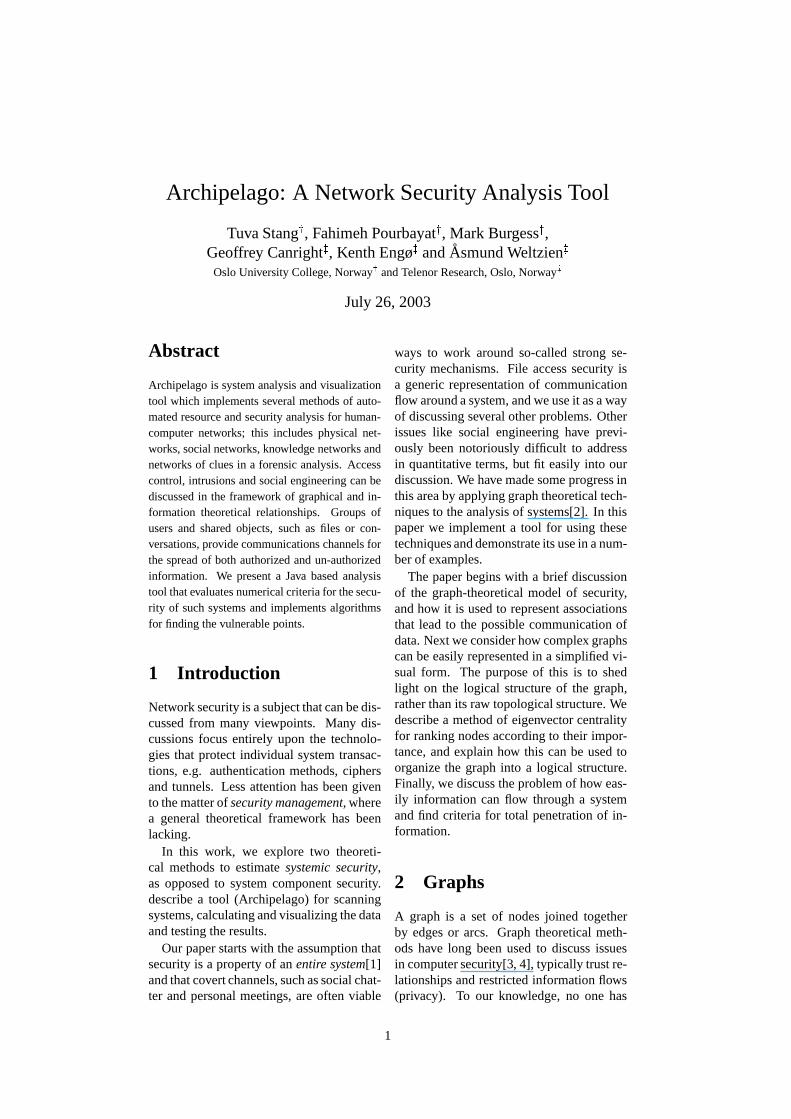
In the simplest case, we can imagine thatusers have access to a number of files. Over-lapping access to files allow information tobe passed from user to user: this is a channelfor information flow. For example, considera set of
�files, shared by � users (fig. 1).
1 2 3 4 5 6 7
Users
Files
a b c d e
uif
i
Figure 1: Users (dark spots) are associated withone another through resources (light spots) thatthey share access to. Each light spot contains���
files or sub-channels and defines a group � ,through its association with � � links to users. Incomputer parlance, they form ‘groups’.
Here we see two kinds of object (a bi-partite graph), connected by links that repre-sent associations. A bipartite form is usefulfor theoretical discussions, but in a graphicaltool it leads to too much ‘mess’ on screen.Bi-partite graphs have been examined be-fore to provide a framework for discussingsecurity[11]. We can eliminate the non-user nodes by simply colouring the links todistinguish them, or keeping their charactersolely for look-up in a database.
Any channel that binds users together isa potential covert security breach. Since weare estimating the probability of intrusion,all of these must be considered. For exam-ple, a file, or set of files, connected to severalusers clearly forms a system group, in com-puter parlance. In graph-theory parlancethe group is simply a complete subgraph or
2
clique. In reality, there are many levels ofassociation between users that could act aschannels for communication:
� Group work association (access).
� Friends, family or other social associa-tion.
� Physical location of users.
In a recent security incident at a Universityin Norway, a cracker gained complete ac-cess to systems because all hosts had a com-mon root password. This is another com-mon factor that binds ‘users’ at the hostlevel, forming a graph that looks like a giantcentral hub. In a post factum forensic inves-tigation, all of these possible routes of as-sociation between possible perpetrators of acrime are potentially important clues linkingpeople together. Even in an a priori analysissuch generalized networks might be used toaddress the likely targets of social engineer-ing.
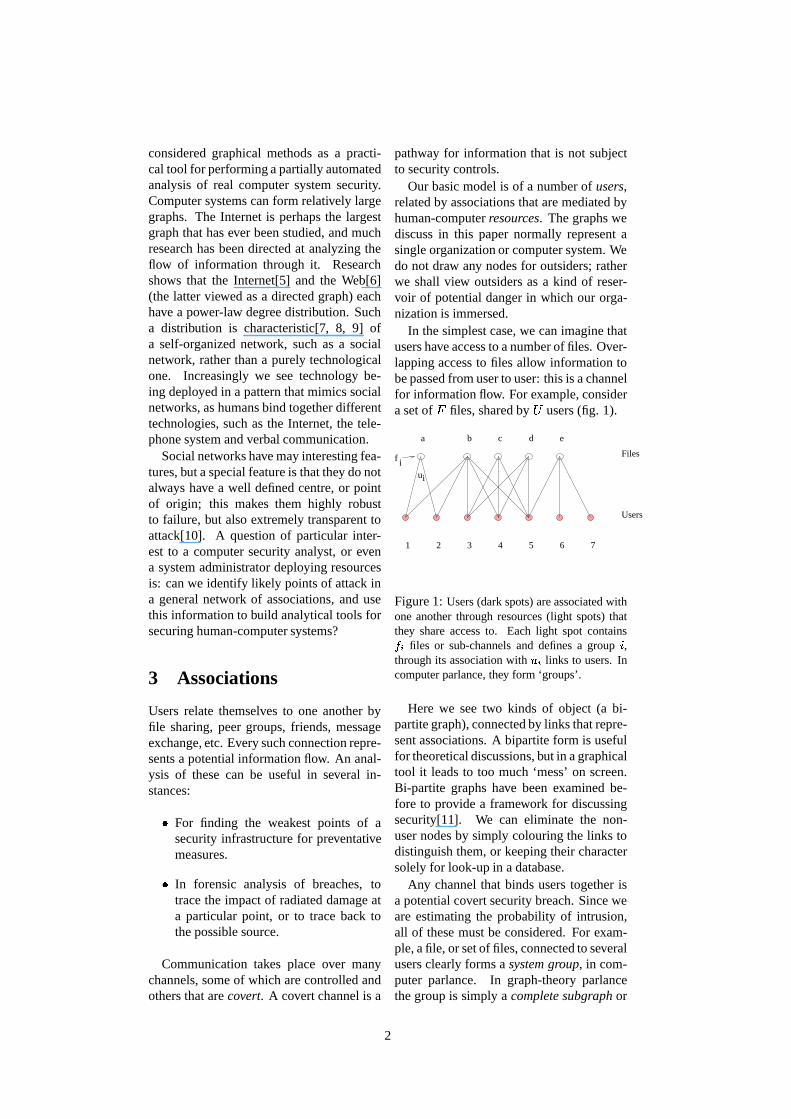
Each user naturally has a number of fileobjects that are private. These are repre-sented by a single line from each user toa single object. Since all users have these,they can be taken for granted and removedfrom the diagram in order to emphasize therole of more special hubs (see fig. 2).
Figure 2: An example of the simplest level atwhich a graph may be reduced to a skeleton formand how hot-spots are identified. This is essen-tially a histogram, or ‘height above sea-level’ forthe contour picture.
The resulting contour graph, formed bythe Venn diagrams, is the first indication ofpotential hot-spots in the local graph topol-ogy. Later we can replace this with a bet-ter measure — the ‘centrality’ or ‘well-connectedness’ of each node in the graph.
4 Visualizing graphs inshorthand
The complexity of the basic bi-partite graphand the insight so easily revealed fromthe Venn diagrams beg the question: isthere a simpler representation of the graphsthat summarizes their structure and whichhighlights their most important informationchannels? An important clue is providedby the Venn diagrams; these reveal a con-venient level of detail in simple cases.
Let us define a simplification procedurebased on this.
Definition 1 (Trivial group) An ellipsethat encircles only a single user node is atrivial group. It contains only one user.
Definition 2 (Elementary group) Foreach file node � , obtain the maximal groupof users connected to the node and encirclethese with a suitable ellipse (as in fig. 2).An ellipse that contains only trivial groups,as subgroups, is an elementary group.
Our aim in simplifying a graph is to orga-nize the graph using the low resolution pic-ture generated by a simplification rule.
Definition 3 (Simplification rule) Foreach file node � , obtain the maximal groupof users connected to the node and encirclethese with a suitable ellipse or other enve-lope (as in fig. 2). Draw a super-node foreach group, labelled by the total degree ofgroup (the number of users within it). Foreach overlapping ellipse, draw an unbrokenline between the groups that are connectedby an overlap. These are cases where oneor more users belongs to more than onegroup, i.e. there is a direct association. Foreach ellipse that encapsulates more thanone elementary groups, draw a dashed line.
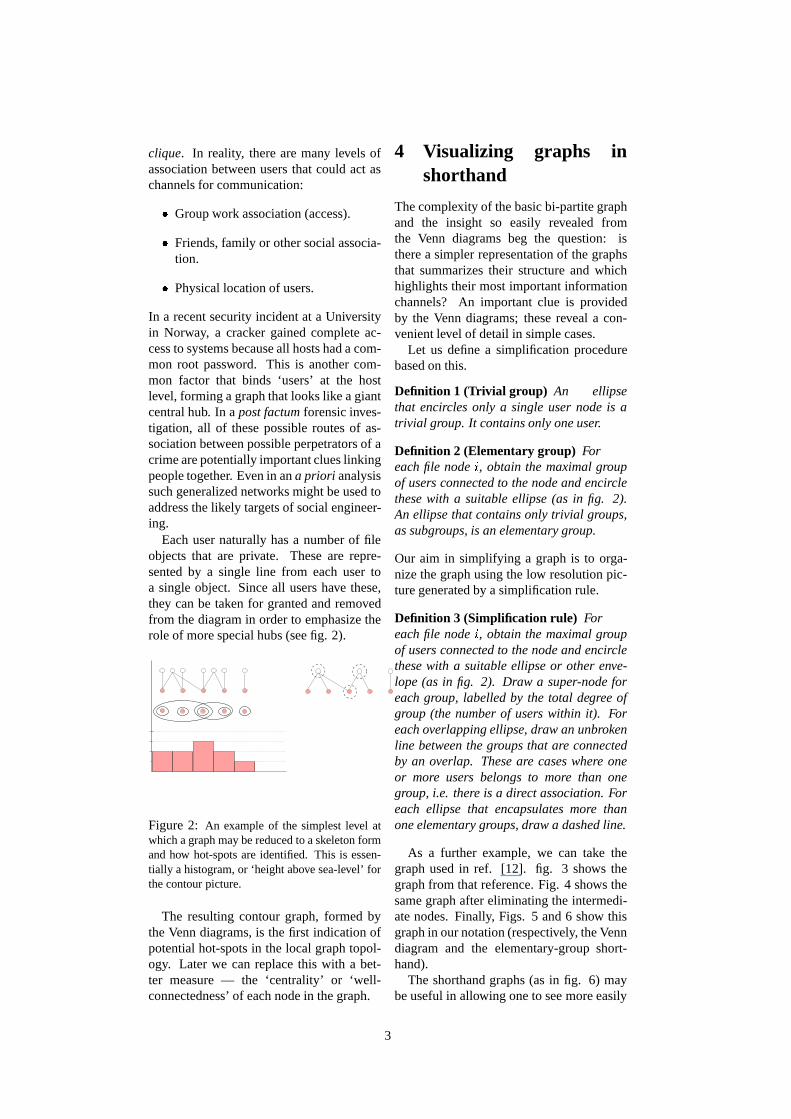
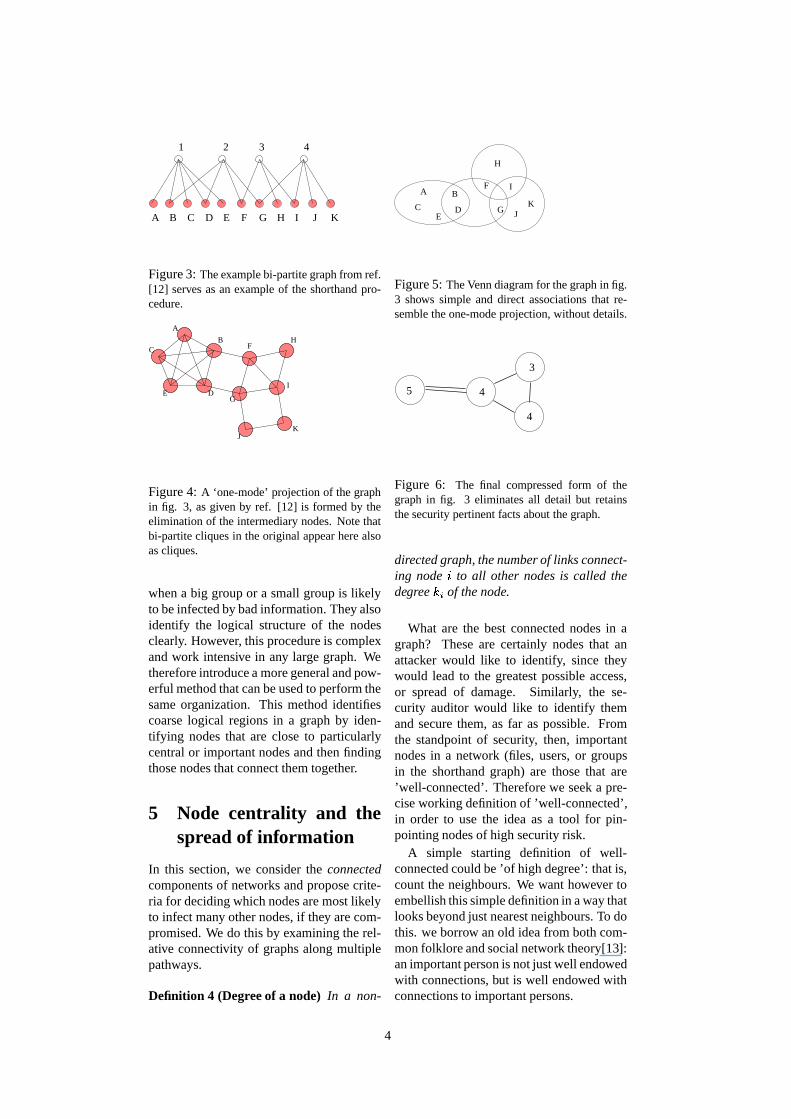
As a further example, we can take thegraph used in ref. [12]. fig. 3 shows thegraph from that reference. Fig. 4 shows thesame graph after eliminating the intermedi-ate nodes. Finally, Figs. 5 and 6 show thisgraph in our notation (respectively, the Venndiagram and the elementary-group short-hand).
The shorthand graphs (as in fig. 6) maybe useful in allowing one to see more easily
3
A B C D E F G H I J K
1 2 3 4
Figure 3: The example bi-partite graph from ref.[12] serves as an example of the shorthand pro-cedure.
E
C
A
B
D
J
G
K
I
HF
Figure 4: A ‘one-mode’ projection of the graphin fig. 3, as given by ref. [12] is formed by theelimination of the intermediary nodes. Note thatbi-partite cliques in the original appear here alsoas cliques.
when a big group or a small group is likelyto be infected by bad information. They alsoidentify the logical structure of the nodesclearly. However, this procedure is complexand work intensive in any large graph. Wetherefore introduce a more general and pow-erful method that can be used to perform thesame organization. This method identifiescoarse logical regions in a graph by iden-tifying nodes that are close to particularlycentral or important nodes and then findingthose nodes that connect them together.
5 Node centrality and thespread of information
In this section, we consider the connectedcomponents of networks and propose crite-ria for deciding which nodes are most likelyto infect many other nodes, if they are com-promised. We do this by examining the rel-ative connectivity of graphs along multiplepathways.
Definition 4 (Degree of a node) In a non-
A
CE
B
D G
F
H
I
JK
Figure 5: The Venn diagram for the graph in fig.3 shows simple and direct associations that re-semble the one-mode projection, without details.
5 4
3
4
Figure 6: The final compressed form of thegraph in fig. 3 eliminates all detail but retainsthe security pertinent facts about the graph.
directed graph, the number of links connect-ing node � to all other nodes is called thedegree ��� of the node.
What are the best connected nodes in agraph? These are certainly nodes that anattacker would like to identify, since theywould lead to the greatest possible access,or spread of damage. Similarly, the se-curity auditor would like to identify themand secure them, as far as possible. Fromthe standpoint of security, then, importantnodes in a network (files, users, or groupsin the shorthand graph) are those that are’well-connected’. Therefore we seek a pre-cise working definition of ’well-connected’,in order to use the idea as a tool for pin-pointing nodes of high security risk.
A simple starting definition of well-connected could be ’of high degree’: that is,count the neighbours. We want however toembellish this simple definition in a way thatlooks beyond just nearest neighbours. To dothis. we borrow an old idea from both com-mon folklore and social network theory[13]:an important person is not just well endowedwith connections, but is well endowed withconnections to important persons.
4
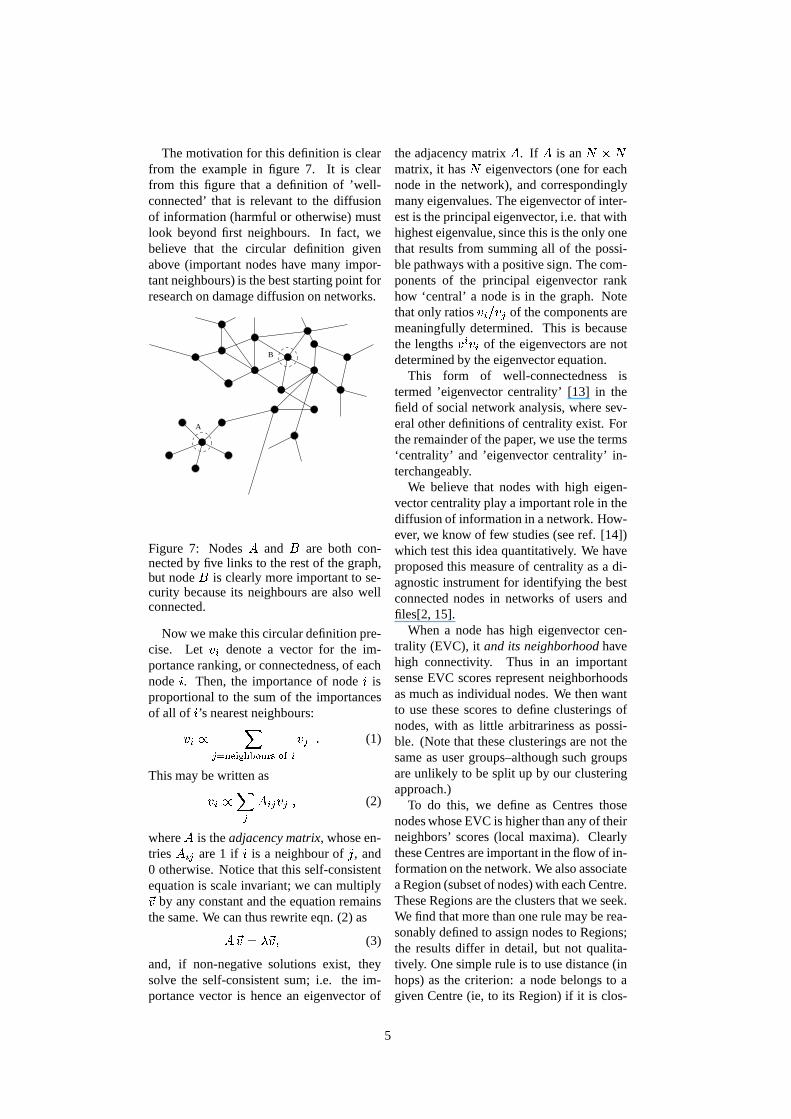
The motivation for this definition is clearfrom the example in figure 7. It is clearfrom this figure that a definition of ’well-connected’ that is relevant to the diffusionof information (harmful or otherwise) mustlook beyond first neighbours. In fact, webelieve that the circular definition givenabove (important nodes have many impor-tant neighbours) is the best starting point forresearch on damage diffusion on networks.
A
B
Figure 7: Nodes � and � are both con-nected by five links to the rest of the graph,but node � is clearly more important to se-curity because its neighbours are also wellconnected.
Now we make this circular definition pre-cise. Let � � denote a vector for the im-portance ranking, or connectedness, of eachnode � . Then, the importance of node � isproportional to the sum of the importancesof all of � ’s nearest neighbours:
� ��� ������� ����������������� �
� ��� (1)
This may be written as
� ��� � � � �� � � � (2)
where � is the adjacency matrix, whose en-tries � � � are 1 if � is a neighbour of ! , and0 otherwise. Notice that this self-consistentequation is scale invariant; we can multiply"� by any constant and the equation remainsthe same. We can thus rewrite eqn. (2) as
� "�$#&% "� � (3)
and, if non-negative solutions exist, theysolve the self-consistent sum; i.e. the im-portance vector is hence an eigenvector of
the adjacency matrix � . If � is an ')(*'matrix, it has ' eigenvectors (one for eachnode in the network), and correspondinglymany eigenvalues. The eigenvector of inter-est is the principal eigenvector, i.e. that withhighest eigenvalue, since this is the only onethat results from summing all of the possi-ble pathways with a positive sign. The com-ponents of the principal eigenvector rankhow ‘central’ a node is in the graph. Notethat only ratios � ��+ � � of the components aremeaningfully determined. This is becausethe lengths � � � � of the eigenvectors are notdetermined by the eigenvector equation.
This form of well-connectedness istermed ’eigenvector centrality’ [13] in thefield of social network analysis, where sev-eral other definitions of centrality exist. Forthe remainder of the paper, we use the terms‘centrality’ and ’eigenvector centrality’ in-terchangeably.
We believe that nodes with high eigen-vector centrality play a important role in thediffusion of information in a network. How-ever, we know of few studies (see ref. [14])which test this idea quantitatively. We haveproposed this measure of centrality as a di-agnostic instrument for identifying the bestconnected nodes in networks of users andfiles[2, 15].
When a node has high eigenvector cen-trality (EVC), it and its neighborhood havehigh connectivity. Thus in an importantsense EVC scores represent neighborhoodsas much as individual nodes. We then wantto use these scores to define clusterings ofnodes, with as little arbitrariness as possi-ble. (Note that these clusterings are not thesame as user groups–although such groupsare unlikely to be split up by our clusteringapproach.)
To do this, we define as Centres thosenodes whose EVC is higher than any of theirneighbors’ scores (local maxima). Clearlythese Centres are important in the flow of in-formation on the network. We also associatea Region (subset of nodes) with each Centre.These Regions are the clusters that we seek.We find that more than one rule may be rea-sonably defined to assign nodes to Regions;the results differ in detail, but not qualita-tively. One simple rule is to use distance (inhops) as the criterion: a node belongs to agiven Centre (ie, to its Region) if it is clos-
5
5
3 DB
8
910
11
12
13
OUTSIDE WORLD
Marketing7. system admin4 Web server
1 Dispatch
6 Registerorders
2 Orderprocessing
14 Management
Staff
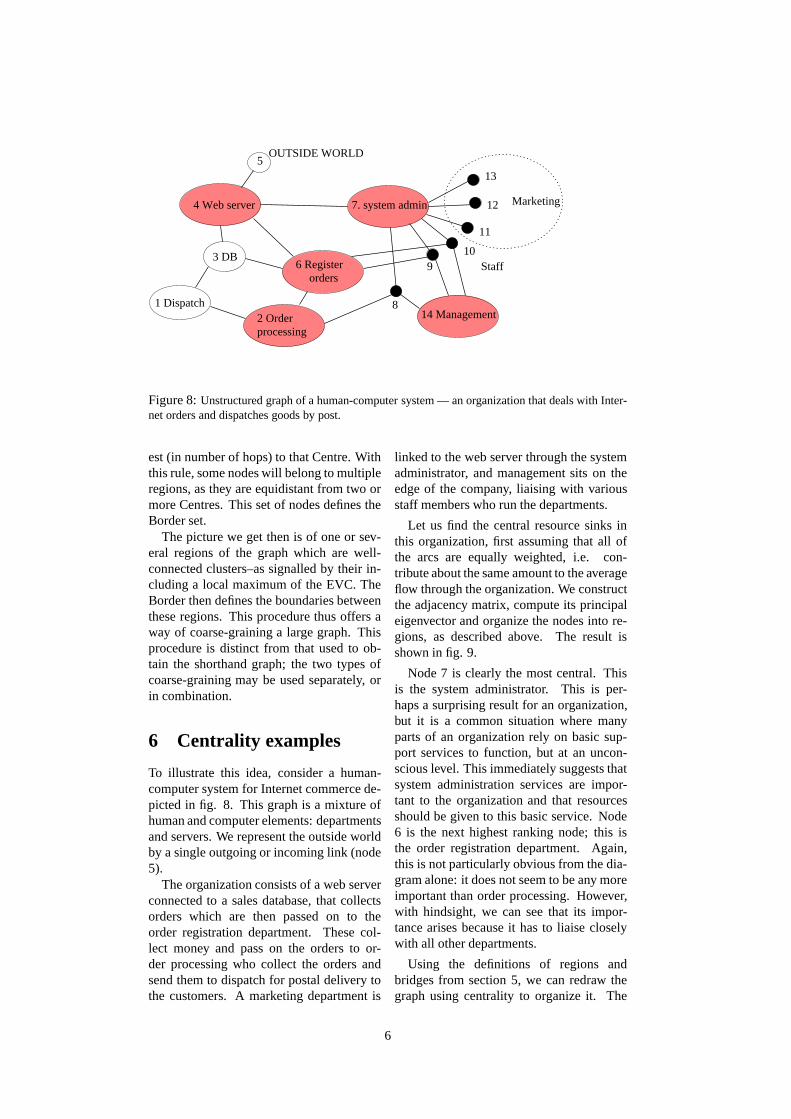
Figure 8: Unstructured graph of a human-computer system — an organization that deals with Inter-net orders and dispatches goods by post.
est (in number of hops) to that Centre. Withthis rule, some nodes will belong to multipleregions, as they are equidistant from two ormore Centres. This set of nodes defines theBorder set.
The picture we get then is of one or sev-eral regions of the graph which are well-connected clusters–as signalled by their in-cluding a local maximum of the EVC. TheBorder then defines the boundaries betweenthese regions. This procedure thus offers away of coarse-graining a large graph. Thisprocedure is distinct from that used to ob-tain the shorthand graph; the two types ofcoarse-graining may be used separately, orin combination.
6 Centrality examples
To illustrate this idea, consider a human-computer system for Internet commerce de-picted in fig. 8. This graph is a mixture ofhuman and computer elements: departmentsand servers. We represent the outside worldby a single outgoing or incoming link (node5).
The organization consists of a web serverconnected to a sales database, that collectsorders which are then passed on to theorder registration department. These col-lect money and pass on the orders to or-der processing who collect the orders andsend them to dispatch for postal delivery tothe customers. A marketing department is
linked to the web server through the systemadministrator, and management sits on theedge of the company, liaising with variousstaff members who run the departments.
Let us find the central resource sinks inthis organization, first assuming that all ofthe arcs are equally weighted, i.e. con-tribute about the same amount to the averageflow through the organization. We constructthe adjacency matrix, compute its principaleigenvector and organize the nodes into re-gions, as described above. The result isshown in fig. 9.
Node 7 is clearly the most central. Thisis the system administrator. This is per-haps a surprising result for an organization,but it is a common situation where manyparts of an organization rely on basic sup-port services to function, but at an uncon-scious level. This immediately suggests thatsystem administration services are impor-tant to the organization and that resourcesshould be given to this basic service. Node6 is the next highest ranking node; this isthe order registration department. Again,this is not particularly obvious from the dia-gram alone: it does not seem to be any moreimportant than order processing. However,with hindsight, we can see that its impor-tance arises because it has to liaise closelywith all other departments.
Using the definitions of regions andbridges from section 5, we can redraw thegraph using centrality to organize it. The
6
1
2
3
614
8
5
12
13
7
MARKETING ORDER PROCESSING
MANAGER
11 4
OUTSIDE WORLD
10
9
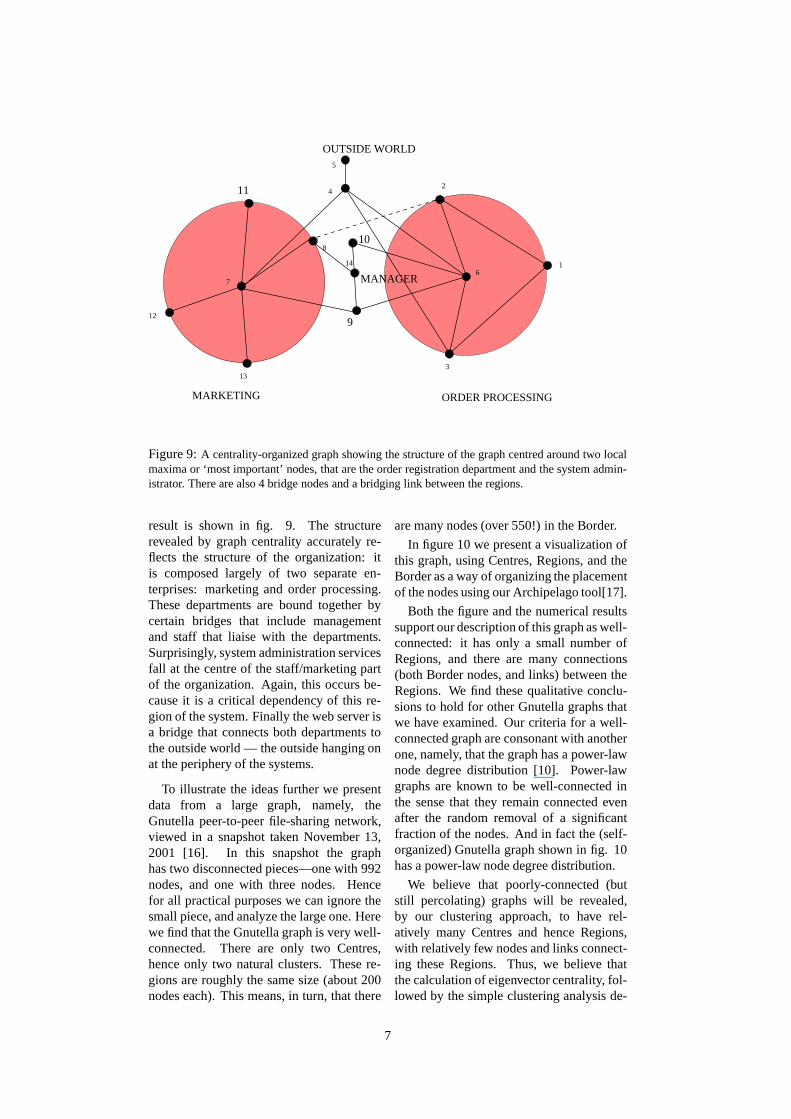
Figure 9: A centrality-organized graph showing the structure of the graph centred around two localmaxima or ‘most important’ nodes, that are the order registration department and the system admin-istrator. There are also 4 bridge nodes and a bridging link between the regions.
result is shown in fig. 9. The structurerevealed by graph centrality accurately re-flects the structure of the organization: itis composed largely of two separate en-terprises: marketing and order processing.These departments are bound together bycertain bridges that include managementand staff that liaise with the departments.Surprisingly, system administration servicesfall at the centre of the staff/marketing partof the organization. Again, this occurs be-cause it is a critical dependency of this re-gion of the system. Finally the web server isa bridge that connects both departments tothe outside world — the outside hanging onat the periphery of the systems.
To illustrate the ideas further we presentdata from a large graph, namely, theGnutella peer-to-peer file-sharing network,viewed in a snapshot taken November 13,2001 [16]. In this snapshot the graphhas two disconnected pieces—one with 992nodes, and one with three nodes. Hencefor all practical purposes we can ignore thesmall piece, and analyze the large one. Herewe find that the Gnutella graph is very well-connected. There are only two Centres,hence only two natural clusters. These re-gions are roughly the same size (about 200nodes each). This means, in turn, that there
are many nodes (over 550!) in the Border.
In figure 10 we present a visualization ofthis graph, using Centres, Regions, and theBorder as a way of organizing the placementof the nodes using our Archipelago tool[17].
Both the figure and the numerical resultssupport our description of this graph as well-connected: it has only a small number ofRegions, and there are many connections(both Border nodes, and links) between theRegions. We find these qualitative conclu-sions to hold for other Gnutella graphs thatwe have examined. Our criteria for a well-connected graph are consonant with anotherone, namely, that the graph has a power-lawnode degree distribution [10]. Power-lawgraphs are known to be well-connected inthe sense that they remain connected evenafter the random removal of a significantfraction of the nodes. And in fact the (self-organized) Gnutella graph shown in fig. 10has a power-law node degree distribution.
We believe that poorly-connected (butstill percolating) graphs will be revealed,by our clustering approach, to have rel-atively many Centres and hence Regions,with relatively few nodes and links connect-ing these Regions. Thus, we believe thatthe calculation of eigenvector centrality, fol-lowed by the simple clustering analysis de-
7
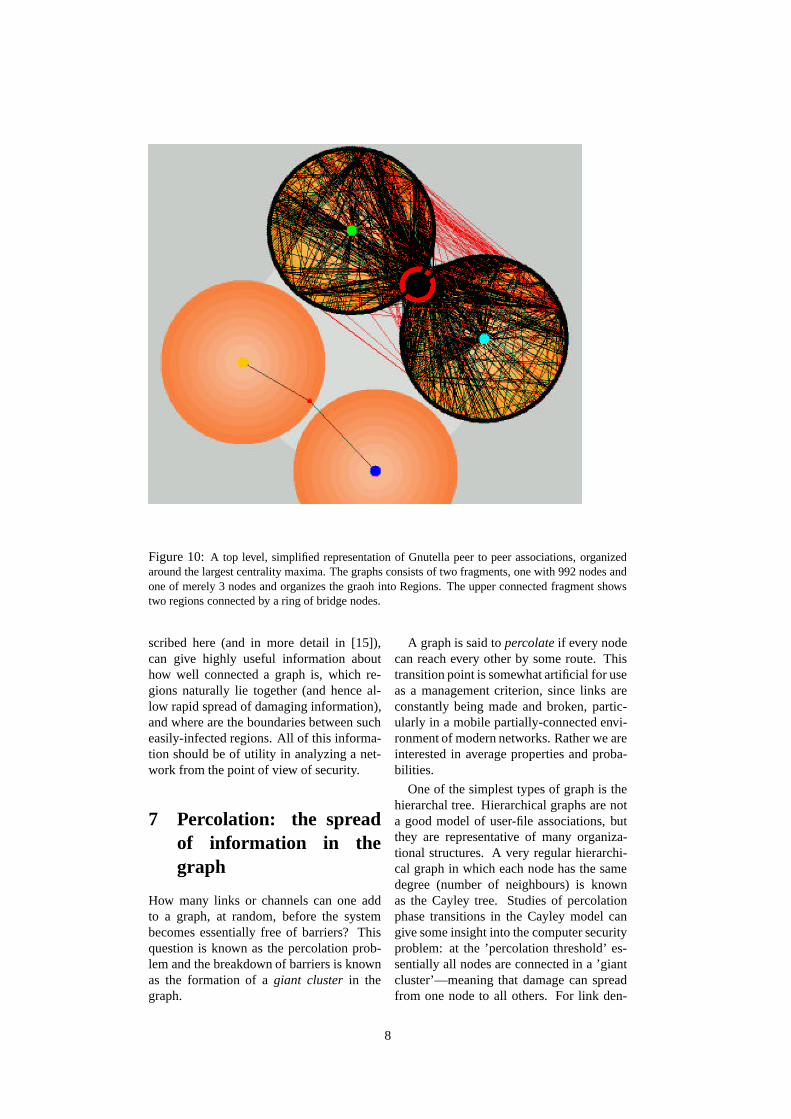
Figure 10: A top level, simplified representation of Gnutella peer to peer associations, organizedaround the largest centrality maxima. The graphs consists of two fragments, one with 992 nodes andone of merely 3 nodes and organizes the graoh into Regions. The upper connected fragment showstwo regions connected by a ring of bridge nodes.
scribed here (and in more detail in [15]),can give highly useful information abouthow well connected a graph is, which re-gions naturally lie together (and hence al-low rapid spread of damaging information),and where are the boundaries between sucheasily-infected regions. All of this informa-tion should be of utility in analyzing a net-work from the point of view of security.
7 Percolation: the spreadof information in thegraph
How many links or channels can one addto a graph, at random, before the systembecomes essentially free of barriers? Thisquestion is known as the percolation prob-lem and the breakdown of barriers is knownas the formation of a giant cluster in thegraph.
A graph is said to percolate if every nodecan reach every other by some route. Thistransition point is somewhat artificial for useas a management criterion, since links areconstantly being made and broken, partic-ularly in a mobile partially-connected envi-ronment of modern networks. Rather we areinterested in average properties and proba-bilities.
One of the simplest types of graph is thehierarchal tree. Hierarchical graphs are nota good model of user-file associations, butthey are representative of many organiza-tional structures. A very regular hierarchi-cal graph in which each node has the samedegree (number of neighbours) is knownas the Cayley tree. Studies of percolationphase transitions in the Cayley model cangive some insight into the computer securityproblem: at the ’percolation threshold’ es-sentially all nodes are connected in a ’giantcluster’—meaning that damage can spreadfrom one node to all others. For link den-
8
sity (probability) below this threshold value,such widespread damage spreading cannotoccur.
For small, fixed graphs there is often noproblem in exploring the whole graph struc-ture and obtaining an exact answer to thisquestion. The most precise small-graph cri-terion for percolation comes from askinghow many pairs of nodes, out of all possiblepairs, can reach one another in a finite num-ber of hops. We thus define the ratio ��� ofconnected pairs of nodes to the total numberof pairs that could be connected:
� � # �� ����� ����� �����
�� �� � ������� '� '������ #��� (4)
This is simply the criterion that the graph beconnected.
If we wish to simplify this rule for ease ofcalculation, we can take � ����� ��� � , where� � is the number of links in cluster � . Then,if � is the total number of links in the graph,criterion (4) becomes
� � # � �!� ���'� '������
" � � (5)
Thus we have one ’naive’ small-graph testwhich is very simple, and one ’exact’ cri-terion which requires a little more work tocompute.
The problem with these criteria is that onedoes not always have access to perfect in-formation about real organizations. Evenif such information were available, securityadministrators are not so much interested inwhat appears to be an accurate snapshot ofthe present, as in what is likely to happenin the near future. Socially motivated net-works are not usually orderly, like hierarchi-cal trees, but have a strong random compo-nent. We therefore adapt results from thetheory of random graphs to obtain a statis-tical estimate for the likelihood of percola-tion, based on remarkably little knowledgeof the system.
To study a random graph, all we need isan estimate or knowledge of their degreedistributions. Random graphs, with arbi-trary node degree distributions #�$ have beenstudied in ref. [12], using the method ofgenerating functionals. This method usesa continuum approximation, using deriva-tives to evaluate probabilities, and hence it is
completely accurate only in the continuumlimit of very large number of nodes ' .
We shall not reproduce here the argu-ment of ref. [12] to derive the conditionfor the probable existence of a giant cluster,but simply quote it for a uni-partite randomgraph with degree distribution # $ .Result 1 The large-graph condition for theexistence of a giant cluster (of infinite size)is simply
�$
�� �%�'&��(#)$+*-, � (6)
This provides a simple test that can be ap-plied to a human-computer system, in orderto estimate the possibility of complete fail-ure via percolating damage. If we only de-termine the # $ , then we have an immediatemachine-testable criterion for the possibilityof a systemwide security breach.
The problem with the above expressionis clearly that it is derived under the as-sumption of there being a smooth differen-tiable structure to the average properties ofthe graphs. For a small graph with ' nodesthe criterion for a giant cluster becomes in-accurate. Clusters do not grow to infinity,they can only grow to size ' at the most,hence we must be more precise and use adimensionful scale rather than infinity as areference point. The correction is not hardto identify; the threshold point can be takento be as follows.
Result 2 The small-graph condition forwidespread percolation in a uni-partitegraph of order ' is:
.�0/ �
�$
�� �1�2&3��#($ "�465�7 '!� � (7)
This can be understood as follows. If agraph contains a giant component, it is oforder ' and the size of the next largest com-ponent is typically 89 465�7 '!� ; thus, accord-ing to the theory of random graphs the mar-gin for error in estimating a giant compo-nent is of order : 465�7 ' . In the criterionabove, the criterion for a cluster that is muchgreater than unity is that the right hand sideis greater than zero. To this we now add themagntitude of the uncertainty in order to re-duce the likelihood of an incorrect conclu-sion.
9
The expression in eqn. (7) is not muchmore complex than the large-graph crite-rion. Moreover, all of our small-graph cri-teria retain thier validity in the limit of large' . Hence we expect these small-graph cri-teria to be the most reliable choice for test-ing percolation in small systems. This ex-pectation is borne out in the examples be-low.
From testing of the various criteria, theexact and statistical estimates are roughlycomparable in their ability to detect perco-lation. The statistical tests we have exam-ined are useful when only partial informa-tion about a graph is available.
8 Archipelago
Our reference implementation of the abovecriteria for testing node vulnerability and in-formation flow, is a Java application pro-gram, with associated Perl scripts, whichwe call Archipelago. The name of the pro-gram is based on the whimsical associationof our model of regions and bridges. Anarchipelago is a volcanic island that usuallytakes the form of a characteristic arc of topsjutting out of the water level. The tops lookseparate but are actually bridged just underwater by a volcanic saddle. This is the formthat arises naturally from organizing the vi-sual layout of graphs according to centrality.
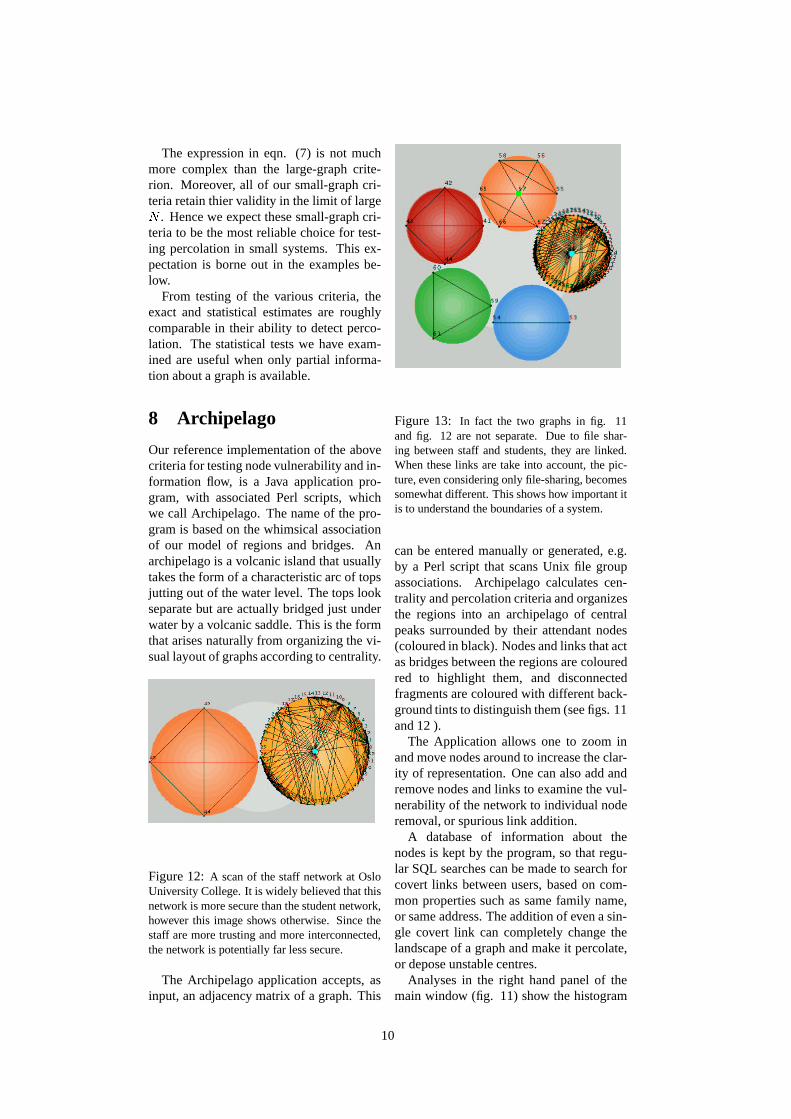
Figure 12: A scan of the staff network at OsloUniversity College. It is widely believed that thisnetwork is more secure than the student network,however this image shows otherwise. Since thestaff are more trusting and more interconnected,the network is potentially far less secure.
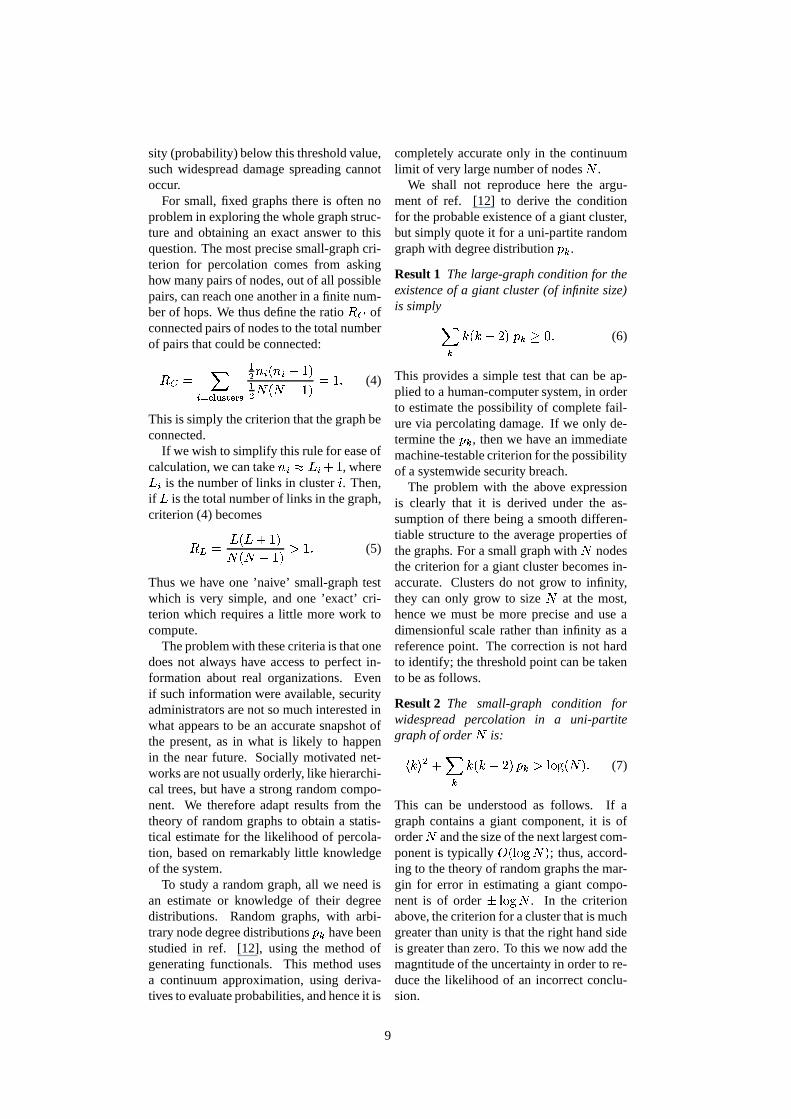
The Archipelago application accepts, asinput, an adjacency matrix of a graph. This
Figure 13: In fact the two graphs in fig. 11and fig. 12 are not separate. Due to file shar-ing between staff and students, they are linked.When these links are take into account, the pic-ture, even considering only file-sharing, becomessomewhat different. This shows how important itis to understand the boundaries of a system.
can be entered manually or generated, e.g.by a Perl script that scans Unix file groupassociations. Archipelago calculates cen-trality and percolation criteria and organizesthe regions into an archipelago of centralpeaks surrounded by their attendant nodes(coloured in black). Nodes and links that actas bridges between the regions are colouredred to highlight them, and disconnectedfragments are coloured with different back-ground tints to distinguish them (see figs. 11and 12 ).
The Application allows one to zoom inand move nodes around to increase the clar-ity of representation. One can also add andremove nodes and links to examine the vul-nerability of the network to individual noderemoval, or spurious link addition.
A database of information about thenodes is kept by the program, so that regu-lar SQL searches can be made to search forcovert links between users, based on com-mon properties such as same family name,or same address. The addition of even a sin-gle covert link can completely change thelandscape of a graph and make it percolate,or depose unstable centres.
Analyses in the right hand panel of themain window (fig. 11) show the histogram
10

Figure 11: A scan of the student network at Oslo University College. This network is actually (inthe absence of further links) quite secure against damage spreading, as it consists of many isolatedpieces.
of the degree distribution in the graph and alog-log plot of the same, in order to revealpower law distributions that are consideredto be particularly robust.
9 Potential uses forArchipelago
We envisage several potential uses for thisnetwork analysis tool. We have already dis-cussed some of these. Even armed with onlycentrality and percolation estimates, there isgreat flexibility in this mode of analysis.
9.1 Network robustness
Determining how robust a network is to at-tack is an obvious task for the tool. Central-ity determines the nodes that play the great-est role in the functioning of the system, andthus the obvious targets for attack. We canuse Archipelago to identify these nodes and
secure them from attack. Percolation, on theother hand, tells us that if an attack shouldsucceed somewhere, what is the probabil-ity that it will lead to a significant securitybreach? Techniques like these have been ap-plied to the spread of viruses like HIV in theworld of medicine.
One result that is of future interest tonetwork services is that from analyzing theGnutella graph in fig. 10. Peer to peer tech-nology has been claimed to be extremely de-centralized and therefore robust: there is nocentral control, and hence no obvious pointof attack. Our graph seems to contradict thisnotion, at first glance: it shows that the en-tire Gnutella file sharing network seems tosplit into two regions with two central peaks.However, these peaks are extremely shal-low. One can use Archipelago to try ‘tak-ing out’ these centres to see if the networkcan be broken up, and the spread of filescurtailed. Attempting this has very little ef-fect on the graph, however. The centres are
11
barely above their neighbours, and the re-moval of a node simply makes way for aneghbour. The structure of the graph is al-most immune to node deletions. That wouldnot be the case in a hub-centralized network.
The same is not true of the other graphs,e.g. fig. 11. Here, taking out a central nodeof the largest fragment can cause the ap-parently tightly knit region to fall apart intomore tenuously bridged, logically separateregions.
9.2 Resource investment
In fig. 8, we considered how graphical anal-ysis could be used to identify the places ina network where resources should be in-vested in order to maintain workflow. Here,a reorganization based on centrality illumi-nates the logical structure of the organiza-tion nicely. It consists of two regions: mar-keting and order processing, bound togetherby a human manager and a web server. Themost central players in this web are the sys-tem administrator (who is relied upon by thestaff and the servers), and the order process-ing department. The secure, continued func-tioning of this organization thus relies onsufficient resources being available to thesetwo pieces of the puzzle. We see also aneconomic interpretation to the system thatspeaks of continuity in the face of compo-nent failure. ISO17799 considers this to bea part of systemic security, and we shall notargue.
9.3 Forensic evidence
Finally, a speculative, but plausible way ofusing this analysis is in the solving of puz-zles, crimes and other associative riddles. Aforensic investigator is interested in piecingtogether various clues about who or whatcaused a breach of security. Such webs ofclues are networks or graphs. The investiga-tor would like to find the percolating frag-ments of a graph to see how associationslink different persons together. It is not im-plausible that the most central nodes in sucha graph would be key to solving the mystery,either as places to look for more clues, or asmasterminds behind the scheme.
One example, where this has been testedis in a case involving cheating on an elec-
tronic computer aided exam at OUC. Cheat-ing was made possible by a failure of secu-rity in a server at an inopportune time. Fromprinter logs it was possible to find out whohad printed out a copy of the solutions tothe exam during the test. From submissionsof results and server logs, it was possible tomatch IP addresses to MAC addresses andstudent numbers and find out who was sit-ting close together during the test. From pat-terns of group project work, it was knownwhich students generally worked togetherand would be likely to share the solutionwith one another. Finally, the submittedwork, time and grades provided other corre-lations between students. The resulting net-work had a percolating component that im-plicated a group of students. It was laterfound that many of these were also con-nected as another kind of social subgroup ofthe class. Thus all of the clues resulted inthe formation of a percolating web of ‘sus-pects’.
The results, while not conclusive, pro-vided a better than chance picture of whowas likely implicated in the deception. Laterinformation, from concerned students con-firmed which of these were definite offend-ers and showed the central nodes in the net-work to be at the heart of the group who hadoriginally printed out the solution. Whilethis did not solve the crime completely, itpointed obvious fingers that made it possibleto extend the analysis and learn much morethan would otherwise have been possible.
We hope to go back to this kind of in-vestigative work for further study and seewhether it is possible to develop it into atruly useful tool.
Archipelago’s database was intended forstoring the kind of supporting informationthat could possibly lead to ‘hidden links’being identified in graphs. For instance, ifone searched the database for users who liveat the same address, this would be a goodcause to add a possible link to a graph, as-sociating nodes with one another. Differ-ent strengths of connections between nodescould also be used to add a further level ofgradation to the importance of connections.This added feature may be implementedeasily, since it simply entails changing thebinary entries of the adjacency matrix to realnumbers, reflecting bond strengths.
12
10 Conclusions
We have implemented a graphical analysistool for probing security and vulnerabilitywithin a human-computer network. We haveused a number of analytical tests derived inref. [2]; these tests determine approximatelywhen a threshold of free flow of informationis reached, and localize the important nodesthat underpin such flows.
We take care to note that the results wecite here depend crucially on where onechooses to place the boundaries for the net-work analysis. The methods will natu-rally work best when no artificial limits areplaced on communication, e.g. by restrict-ing to a local area network if there is fre-quent communication with the world be-yond its gateway. On the other hand, ifcommunication is dominated by local activ-ity (e.g. by the presence of a firewall) thenthe analysis can be successfully applied to asmaller vessel.
At the start of this paper, we posed somebasic questions that we can now answer.
1. How do we identify weak spots in asystem? Eigenvalue centrality is themost revealing way of finding a sys-tem’s vulnerable points. In order tofind the true eigencentre of a system,one must be careful to include everykind of association between users, i.e.every channel of communication, in or-der to find the true centre.
2. How does one determine when systemsecurity is in danger of breaking down?We have provided two simple tests thatcan be applied to graphical represen-tations. These tests reveal what theeye cannot necessarily see in a complexsystem, namely when its level of ran-dom connectivity is so great that infor-mation can percolate to almost any userby some route. These tests can easilybe calculated. The appearance or exis-tence of a giant cluster is not related tothe number of groups, but rather to howthey are interconnected.
An attacker could easily perform thesame analyses as a security administratorand, with only a superficial knowledge ofthe system, still manage to find the weak
points. An attacker might choose to attack anode that is close to a central hub, since thisattracts less attention but has a high proba-bility of total penetration, so knowing wherethese points are allows one to implement asuitable protection policy. It is clear that thedegree of danger is a policy dependent is-sue: the level of acceptable risk is differentfor each organization. What we have foundhere is a way of comparing strategies, thatwould allow us to minimize the relative risk,regardless of policy. This could be used ina game-theoretical analysis as suggested inref. [18]. The measurement scales we haveobtained can easily be programmed into ananalysis tool that administrators and secu-rity experts can use as a problem solving‘spreadsheet’ for security. We are construct-ing such a graphical tool that administratorscan use to make informed decisions[17].
There are many avenues for future re-search here. Understanding the percolationbehaviour in large graphs is a major fieldof research; several issues need to be un-derstood here, but the main issue is howa graph splits into different clusters in realcomputer systems. There are usually twomechanisms at work in social graphs: purelyrandom noise and node attraction — a ‘richget richer’ accumulation of links at heav-ily connected sites. Further ways of mea-suring centrality are also being developedand might lead to new insights. Various im-provements can be made to our software,and we shall continue to develop this intoa practical and useful tool.
Availability
Archipelago is availablefrom Oslo University Collegehttp://www.iu.hio.no/archipelago.
Acknowledgement
GC and KE were partially supported by theFuture & Emerging Technologies unit of theEuropean Commission through Project BI-SON (IST-2001-38923).
Author information
Tuva Stang and Fahimeh Pourbayat are fi-nal year bachelor students at Oslo Univer-
13
sity College; they are the principal eigen-vectors of Archipelago. They can be con-tacted at [email protected], [email protected] for a limitedtime.
Mark Burgess is an associate professorat Oslo University College. He is the au-thor of several books and of the system ad-ministration tool cfengine and is especiallyinterested in mathematical methods in sys-tem administration. He can be contacted [email protected].
Geoff Canright works with the Peer-to-peer Computing Group at TelenorR&D. He is interested in networkanalysis, self-organizing networks, andsearch on distributed information sys-tems. He can be contacted at [email protected].
Kenth Engø works with the Future ComBusiness Group at Telenor R&D. He is in-terested in network analysis, risk analysis,and search on networks.
Asmund Weltzien works with the Peer-to-peer Computing Group at Telenor R&D. Heis interested in (social) network analysis, in-novation theory and spontaneous local net-work technologies.
References
[1] M. Burgess. Principles of Networkand System Administration. J. Wiley& Sons, Chichester, 2000.
[2] M. Burgess, G. Canright, and K. Engø.A graph theoretical model of computersecurity: from file access to social en-gineering. Submitted to InternationalJournal of Information Security, 2003.
[3] L.E. Moser. Graph homomorphismsand the design of secure computer sys-tems. Proceedings of the Symposiumon Security and Privacy, IEEE Com-puter Society, page 89, 1987.
[4] J.C. Williams. A graph theoreticformulation of multilevel secure dis-tributed systems: An overview. Pro-ceedings of the Symposium on Securityand Privacy, IEEE Computer Society,page 97, 1987.
[5] M. Faloutsos, P. Faloutsos, andC. Faloutsos. On power-law rela-tionships of the internet topology.Computer Communications Review,29:251, 1999.
[6] A.L. Barabasi, R. Albert, andH. Jeong. Scale-free characteristicsof random networks: topology of theworld-wide web. Physica A, 281:69,2000.
[7] A.L. Barabasi and R. Albert. Emer-gence of scaling in random networks.Science, 286:509, 1999.
[8] R. Albert, H. Jeong, and A.L.Barabasi. Diameter of the world-wideweb. Nature, 401:130, 1999.
[9] B. Huberman and A. Adamic. Growthdynamics of the world-wide web. Na-ture, 401:131, 1999.
[10] R. Albert and A. Barabasi. Statisticalmechanics of complex networks. Rev.Mod. Phys, 74, 2002.
[11] M.Y. Kao. Data security equals graphconnectivity. SIAM Journal on Dis-crete Mathematics, 9:87, 1996.
[12] M. E. J. Newman, S.H. Strogatz, andD.J. Watts. Random graphs with ar-bitrary degree distributions and theirapplications. Physical Review E,64:026118, 2001.
[13] P. Bonacich. Power and centrality: afamily of measures. American Journalof Sociology, 92:1170–1182, 1987.
[14] G. Canright and A. Weltzien. Multi-plex structure of the communicationsnetwork in a small working group.Proceedings, International Sunbelt So-cial Network Conference XXIII, Can-cun, Mexico, 2003.
[15] G. Canright and K. Engø. A naturaldefinition of clusters and roles in undi-rected graphs. Paper in preparation,2003.
[16] Mihajlo Jovanovic. Private communi-cation, 2001.
14

[17] M. Burgess, G. Canright, T. HasselStang, F. Pourbayat, K. Engø and A.Weltzien. Automated security anal-ysis. Paper submitted to LISA2003,2003.
[18] M. Burgess. Theoretical system ad-ministration. Proceedings of the Four-teenth Systems Administration Confer-ence (LISA XIV) (USENIX Associa-tion: Berkeley, CA), page 1, 2000.
15