Prox-1 Promotes Invasion of Kaposiform Hemangioendotheliomas

BIOLOGICAL INVASION IN SOIL: COMPLEX NETWORK ANALYSIS
F Perez-Reche", S. N Taraskini", FM Neri$, C.A. Gilligan",L. da F Costa', M P Viana§, W Otten', D. Grinev'
£Department of Chemistry, University of Cambridge, Cambridge, UKtSt. Catharine's College, University of Cambridge, Cambridge, UK
$Department of Plant Sciences, University of Cambridge, Cambridge, UK§ Instituto de Fisica de Sao Carlos, Universidade de Sao Paulo, Sao Carlos, SP, Brazil
+SIMBIOS, University of Abertay Dundee, Dundee UK
ABSTRACT
A network model for soil pore space is developed and applied to the analysis of biological invasion of microorganisms in soil. The model was parameterized for two soil samples with different compaction (loosely and densely packed)from images derived from an X-ray micro-tomography system. The data were then processed using 3-D imaging techniques, to construct the networks ofpore structures with in thesoil samples. The network structure is characterized by themeasurement of features that are relevant for biological colonization through soil. These include the distribution of channel lengths, node coordination numbers, location and size ofchannel bottlenecks, and the topology of the largest connectedcluster. The pore-space networks are then used to investigate the spread of a microorganism through soil, in which thetransmissibility between pores is defined as a function of thechannel characteristics. The same spreading process is investigated in artificially constructed homogeneous networkswith the same average properties as the original ones. Thecomparison shows that the extent of invasion is lower in theoriginal networks than in the homogeneous ones: this provesthat inherent heterogeneity and correlations contribute to theresilience of the system to biological invasion.
Index Terms- Soil image analysis, complex network,biological invasion, percolation.
1. INTRODUCTION
The structure of soil and its transport properties are of significant interest for various physical, geological, biological andagricultural reasons [1, 2, 3, 4, 5]. Usually soil is treated asa medium of pores of various sizes and shapes. It is a challenging experimental task to obtain reliable information about
FPR, SNT, FMN and CAG thank BBSRC for funding (Grant No.RG46853), L. da F. Costa thanks FAPESP (05/00587-5) and CNPq(301303/06- 1) for sponsorship and M. P. Viana thanks FAPESP (07/508829) for financial support. WO and DG thank the Scottish Alliance for Geoscience, Environment and Society (SAGES) for support.
978-1-4244-3298-1/09/$25.00 ©2009 IEEE
soil structure and, in particular, about the spatial arrangementsof pores. Several techniques have been used for soil structure analysis including serial sectioning [6], laser scanningconfocal microscopy [7], X-ray tomography [8] and nuclearmagnetic resonance imaging [9]. The structure of soil is obtained in the form of an image, which can then be processedby image analysis techniques and used for construction of anetwork model representing the soil structure [10, 11, 12].The network model can then be used for studying transportproperties of soil, e.g. water flow through the soil (see e.g.[13, 2]). Nowadays commercially available X-ray computerized tomography systems (also known as CT scanners)arecapable of resolving micron-sized pores in undisturbed soilsamples in three dimensions. Here we introduce the resultsfrom a X-ray computerized micro-tomography system thatachieves a resolution of 74JLm for contrasting samples of approximately 2 x 2 x 4 cm representing loosely and denselypacked field soils. The resulting network structures are deconvoluted into a series probability distributions for channel lengths, node coordination numbers, location and size ofchannel bottlenecks, and the topology ofthe largest connectedcluster defined. The invasion of a microorganism through thelargest connected cluster is then modelled using a set of rulesin which the transmissibility between each pair of connectednodes in the network is a function of channel properties linking the nodes. Under these rules, the transmission process isequivalent to an epidemiological process described by an SIR(susceptible-infected-removed) model. This, in tum, can bemapped onto isotropic bond percolation. According to thismapping, the system (i.e. the microorganism invading soil)exhibits a second-order phase transition from a non-invasiveto an invasive regime. The model enables us to compare artificially constructed homogeneous networks with the same average transmissibilities as the original ones. We show that thereare shifts in the invasion curves between the homogeneousand heterogeneous networks (as a function of transmissibility. Those shifts are due to the existence of local correlationsin channel properties that reduce the extent of invasion in the
DSP 2009

Fig. 1. Images ofloosely (a) and densely (b) packed soil. Thegray colour represents the pore space in soil. The insets showthe middle slice (along the vertical axis) of the volumes withthe pores shown in yellow.
III
<, I_ .-~
r - \
\
\
I.
Examples of visualization of loosely and densely packedsoil samples are provided in Figs. Ia and Ib, respectively.The filled space represents the pores in the soil.
In order to construct the network representing the porevolume, all the pores were processed by a thinning algorithm[19,20,21], required in order to reduce each object (pore)to a respective l-voxel skeleton. The skeleton is a thin structure located at the most central parts of the respective original shape. The skeleton retains all the topological features ofthe original shape (e.g. branching structure and cycles). Theskeletonized pores were then mapped onto a network as follows. The skeleton is a set of intersecting curves with somedead ends (where the skeleton terminates). Each intersectionpoint and all dead ends were associated with the nodes of thenetwork [21]. The pore space around the skeleton betweentwo nodes is called a channel or link (edge) between twonodes. The axis of the channel thus coincides with the skeleton. Figs. 2 (a) and (b) show the pore networks obtained forthe loosely and densely packed samples presented in Fig. I.
2. EXPERIMENTAL DETAILS
3. NETWORK ANALYSIS OF THE SOILSTRUCTURE
original networks , with greater effect of heterogeneity in thedensely packed soil.
The paper is organized as follows. In Sec. 2, the experimental technique used for soil sample analysis is described.Sec. 3 describes the details of the network models associatedwith the soil samples. Sec. 4 deals with biological invasion inthe in the network models. Concluding remarks are presentedin Sec. 5.
Soil aggregates (1 - 2 mm) of an arable sandy loam werepacked to attain bulk densities of 1.2 or 1.4 Mg/m', representing two characteristic examples of a loosely and denselypacked field soil, respectively for this soil type. Full detailscan be found in Ref. [14]. We refer to these two soil samplesas loosely (1.2 Mg/rn") and densely (1.4 Mg/rn") packedsoils hereafter.
We scanned these samples with a Metris X-TEK Benchtop micro-tomography system [4, 15], using a molybdenumtarget, X-ray source settings of 155 kV and 25 ILA, and analuminum filter (0.25 mm) to reduce beam-hardening artefacts.
2-D radiographs were collected at 1169 angular positionsand then reconstructed using a filtered back projection algorithm with a resolution of 74 ILm and isotropic voxel size).Each radiograph was averaged over 32 frames to improvesignal-to-noise ratio and ring artefacts were minimized during data acquisition. Numerical corrections were also applied during the reconstruction to minimize remaining beamhardening artefacts. Both 3-D volumes were then importedinto VGStudioMax v.I.2 .1 [16] and converted into 260 x 5258-bit TIFF image stacks with voxel-thick slices. Binary datasets were created by thresholding the grey-scale image stacksin Image] [17]. The choice of the threshold parameter wasbased on the 3-D statistical analysis of the histogram regioncorresponding to the pore-solid interface. In order to obtain an optimal threshold value this analysis took into accountvariation of the grey-scale values in pores of different shapesand sizes.
3.1. Network construction
After conversion into binary format, pore networks for bothsoil samples were reconstructed in 3-D by using the Visualization Toolkit (VTK) [18]. Isolated pores with volumesmaller than 104 voxels were discarded to aid data visualization and analysis (below we use I pixel = 74JLm as a unitof length). This has negligible impact on the topology of theresulting network on which we perform our analysis .
Fig. 2. The network models for the loosely (a) and densely (b)packed soil shown in Fig. I. The complete network (a) consists of Nnode = 10316 nodes and Nlink = 11502 links, whileNnode = 3612 and Nlink = 3846 for the complete network (b).Different colors correspond to distinct isolated clusters withthe largest connected component in blue.

Fig. 3. Probability density function of the arc-lengths of channels (in pixels), p(L), in the LCC of the networks representing loosely (solid circles) and densely (open squares) packedsoil. The upper right inset magnifies the region of small arclengths. The lower left inset shows the probability densityfunction of the node degrees, p(Z) for networks corresponding to loosely (circles) and densely (squares) packed soil samples. Open and solid symbols are used to denote the completenetwork and the largest connected component in the network,respectively. Open and solid circles are not distinguishable atthis scale.
from the straight line connecting two nodes, so that be = 0in the case of zero deviations. The distribution of be for theLCC in both networks is shown in Fig. 4(a). It is evidentfrom Fig. 4(a) that the majority of channels (which are relatively short in length) do not deviate strongly from the shortestpath between two nodes. The deviations (the value of be) increase with the arc-length of the channels . This can be seenin Fig. 4(b) which demonstrates correlations between valuesof be and the arc-length .
The bottleneck diameter distribution is shown in Fig. 5(a). It follows from this figure that the number of channelswith large bottleneck diameters is reduced in the denselypacked soil in comparison with the loosely packed one.In order to characterize the position of the bottleneck ina channel {ij} it is convenient to introduce a parameter,bij = IL ib - Lbj II L ij, where Lib and Lbj are the arc-lengthsfrom node i to the bottleneck and from the bottleneck to thenode j , respectively. This parameter reflects the relative distance from the bottleneck to the middle of the channel. If thebottleneck is in the middle of the channel then bij = 0 andif it is at one of the ends of the channel then bij = 1. Thedistribution of the values of parameter bij for both networksis shown in Fig. 5(b). The dip around b = 1 indicates that thebottlenecks mainly occur inside the channels but not close tothe nodes. This indicates that the crossing points of severalchannels (nodes) are characterized by relatively large pore
3.2. Network characteristics
The networks constructed according to the algorithm described in Sec. 3.1 represent the pore (or equivalently soil)topology of two soil samples. The networks are embeddedin 3D-space and each node is characterized by a positionvector R i . The nodes are connected to each other in a complicated way and, in general, the network consists of isolated(not connected to each other) clusters of different sizes. Thelargest connected component (LCC) (the blue clusters inFig. 2) which can be identified for each network is of particular interest for biological invasions as described below. Inthe case of loosely packed soil, the LCC percolates throughthe sample and contain N;o~~ = 10183 nodes connected byNkn1c = 11369 channels. The LCC for densely packed soildoes not percolate through the sample volume and containsN LCC = 2613 nodes and N LCC = 2823 channels.node hnk
One of the standard characteristics of network connectivity is the node degree (Z) distribution, p(Z), where Z is thenumber of links attached to a node (coordination number).These distributions are shown in Fig.3 (left lower inset) bothfor complete networks and LCe. The value of Z = 1 corresponds to the number of dead ends in the networks. Byconstruction, there are no nodes with coordination numberZ = 2. As seen from Fig. 3, the probability density functionsreach a maximum value at Z = 3 and then quickly decaywith increasing Z. The complete networks are found rathersparsely connected with mean degrees ((Z ) = 2NlinkINnodc),
(Zl) ':::' 2.229 and (Z2) ':::' 2.130, for loosely and denselypacked soil samples, respectively. The LCC exhibit similarvalues, (Z l) ':::' 2.233 and (Z2) ':::' 2.161. Therefore, thedensely packed soil have smaller degree numbers (pores collapse under compaction).
The other important structural characteristics of the network are the arc-length, Lij, of the channel between nodes iand j , and bottleneck diameter of the channel, ¢Jij . The arclength is defined as the length of the axis of the channel. Thebottleneck diameter, cPij, is defined as the minimal diameterof the maximally inscribed circle for crossection of the channel. The values of cPij were obtained by calculating the maximum distance transform value along the skeletons [22]. Boththese characteristics play an important role for biological invasions (see Sec. 4). In the case of limited image resolution,the value of cP* can also be associated with the resolution, i.e.all the pores of sizes less than the resolution are not represented by the network model.
The distribution of the arc-lengths for both samples arepresented in Fig. 3. It can be seen from Fig. 3 that the numbersof short and very long channels are reduced in the denselypacked sample as compared with the loosely packed one.
The shape of the channels can be characterized by theirrelative arc-length as compared with the Euclidean distancebetween nodes, i.e. by the parameter be = 1- IRj -Ri IILij.The value of be describes the deviations of the channel axis
10-3 •10"2
••10"3 :10·.1
I 2 J 4 5 6
10-40 z20
5
ODJJ[J] [] D..-.. .[] [] «J mo .[]. ..•
• •••••••40
L
L10
60

100 2.0
,pftf: 1Ib •
10-1 •lo'~ c n co C
IJ e c l} IJ
. 110~ c . " '" 0
'~..:-"," . ~.. ~,-..., ~.;~ c~1 0-2 ~~. ~ ..f" ~ DC
. i'~ 'i 0"*.C- 08 . · .. D D . C [J IJ~
lJ III .". .amII .' ..
10-3 "",' 0.5 't.••..11- 'i
10-40•••
10 20 30 40 50 60 70 0.00 0.2 0.4 0.6 0.8 I
<P 8•
, .20 40 60
L-0. 1
se
0.01
0.4
10 ..."\ (a) (b)..0.3 c
\ ' . .,~Q)I
C
cc _ •••..
",
(..Q
\ c (..Q Q) 0.2 • ..<::» C • til' •Q. ~ D C C
~.... ...... c \,.~ • •
0.1 c.lf,0.1 c if c e- ", ••'Is,!, " •-_. CC ~ .
cae I-a D ~c ~
Fig. 4. (a) Probability density function, p(Oe ), of the relative arc-length, oe, for the LCC of the networks representingloosely (solid circles) and densely (open squares) packed soil.(b) Dependence of the parameter oeon the arc-length of thechannels, L (in pixels). The symbols have the same mean ingas in (a).
space.The size of the bottleneck is determined by the mechan
ical properties of the soil and the topology of the channel.Fig. 6 demonstrates apparent correlations between the valueof the bottleneck diameter and arc-length of the channel , suggesting that cPij ex: Li/' with 0: 1 ~ 0.41 and 0:2 ~ 0.46 forloosely and densely packed soil, respectively.
4. BIOLOGICAL INVASION IN SOIL
The following transport processes can occur in the soil: (i)the spread of liquids such as water; (ii)the spread of gas (e.g.oxygen) and (iii) dispersal of microorganisms. The first twophenomena have many important applications and have attracted huge attention from the scientific community (see e.g.[11] and references therein) The last phenomenon, of greatimportan ce for biological processes including the spread ofpathogen, has attracted much less attention [23] and still exhibits several unsolved problems.
In this section, we address the probl em of invasion ofmicroorganisms through the system of soil pores represented bya network (see Sec. 3). A question to answer is the following.Given a network of pores and dynamical rules for dispersal,can soil be invaded (occupied) by microorganisms and, if so,what are the conditions for such invasion? We approach thisproblem using standard methods of statistical physics for description of non-equilibrium phenomena in complex systems.
4.1. Theoretical background
We consider invasion of a microorganism in structured soil,typified by hyphal (filamentous) growth through soil pores of
Fig. 5. Probability density function of (a) bottleneck diameters (in pixels) , p(cPij ), and (b) relative distances to the bottleneck, p(0), in the LCC of the networks representing loosely(sol id circles) and densely (open squares) packed soil.
a fungal colony expanding from an initial site of introductionwith a fixed source ofnutrients at the site of introduction. Thedynamical rules are as follows: (i) We place an initial sourceof microorganisms on an arbitrary node i (as defined in Sec. 3)of the LCC of the network representing the pore space in thesoil. (ii) The organi sm can spread stochastically along any ofZ, channels linked to node i and thus , with given probability,Pij , can reach node j (j = 1, ... , Zi ), so that node j becomescoloni zed (occupied) by the microorganism. (iii) From nodej, the process of invasion continues in a similar manner withthe only exception that the organisms cannot move back topreviously colonized nodes.
The motion of the organism s along a channel is assumedto be a Poisson process, so that the probability, dPij (t), toreach node j for organisms moving from node i to node jalong the channel of length Lij in an infinitesimall y smalltime interval between t and t + dt is [24], dPij (t ) = (1 Pij(t ))f3ijdt , with straightforward solution , Pij(t) = 1 e -{3i j t , where the coefficient f3ij is the invasion rate along thechannel {ij} . The invasion rate can be estimated as f3i j =
Vij / L ij , with Vij being the typical velocity of motion of organisms through the channel {ij} and L ij being the lengths(arc-length as defined in Sec. 3) of the channel between nodesi and j . According to the equation above the probability ofinvasion of node i . dPij (t ), approaches unity when t ----; 00 .
This leads to a scenario in which the whole LCC network isinvaded in the long-tim e limit, something that is unlikely tohappen in practice when nutrient is limited for the invadingmicroorganism. Accordingly, we introduce a time Tij , available for exploration ofeach {ij} channel , i.e. the microorganism can only move along the channel for t :::; Tij ' The finiteexploration time may be a consequence of a limited amountof nutrients inside the channel or a limited life-time of themicroorganisms. Rapid invasion is often of great importance

(2)¢ijin > ¢*¢ijin < ¢*
ifif
We have investigated spread on two networks describing invasion of loosely and densely packed soil samples . In bothcases, the analysis has been performed on the LCC of the network (see Sec. 3). The topology of the largest connected component obviously depends on the value of ¢* , because all thechannel s with the bottleneck size less than ¢* are closed tospread.
4.2. Results
into the chann el. If the bottleneck diameter is greater than thebound value, ¢*, then the organisms can fit into the channel,so that invasion can occur with certain given probability alongthis channel. Therefore, the transmissibility of channel {ij}is defined as
Under these rules, the invasion process is identical to anepidemic process described by an SIR (susceptible-infectedremoved) model which can be mapped onto isotropic percolation [25] by identifying the channel transmissibility withthe bond probability. In this mapping, the system (organisms invading soil) exhibits a second-order phase transitionfrom a non-invasive to an invasive regime with an increase ofthe control parameter, k. The order parameter, Any, invasionprobability in infinite system (probability that the initially infected site belongs to the spanning cluster), changes from zerovalue Any = 0 for k ~ kc to finite values for k > kc, wherekc is the critical value of the local invasion scale.
In bond-percolation, the bond probability plays the role ofthe control parameter [26]. For the sake of comparison withbond percolation, it is convenient to introduce an alternativecontrol parameter for invasion of soil, namely the mean transmissibility, (T) = J(l - e -k/ L i j ) p (Lij ) d Lij, where p(Li j)
is an experimentally known probability density function ofthe channel lengths and averaging is taken only through thechannels with ¢ijin > ¢* which are accessible for invasion.
Invasion of soil is inherently heterogeneous because thechannel transmissibilities and coordination numbers varythrough the system. However, if the channel transmissibilities are independent random variables for each channel,then spread on a heterogeneous network characterized bythe distribution of T i j is equivalent to spread on the samenetwork with a homogeneous transmissibility, Ti j = (T)[27,28,29], meaning that the function Any ((T) ) is the samein the systems with heterogeneous and homogeneous (meanfield) transmissibilities. One of the aims of this study is toverify this property for the spreading process in soil.
The other aim of our analysis is to find how the order parameter depends on both control parameters (k and (T) ) andthus identify the conditions for invasion of soil by microorganisms.
(1)
•
T . . - 1 _ e - Vi j Ti j / L i j'J - .
as new niches are colonized predominantly by rapid invaders.Here we assume a local clock for colonisation ofeach successive pore, which amounts to an assumption of a limited andequal amount of nutrient available for microorganism growthwithin each pore. Under these assumptions, the probability ofinvasion of node j from node i in the long-time limit (calledtransmissibility) is
Fig. 6. Dependence of the bottleneck diameter (in pixels) vsarc-length of the channel (in pixels) for loosely (solid circlesand solid line) and densely (open squares and dashed curve)packed soil, respectively. The straight lines represent the linear fit by regression.
All the parameters affecting the transmissibility T i j dependon channel characteristics and vary from channel to channeldue to their dependence on e.g. channel topology. The parameters Vij and Ti j can also depend on the node characteristics(such as amount of nutrient available at the node and the volume of the pore associated with the node). This can result inmutual dependence of transmissibilities of the channels originating from the same node. For simplicity, we assume thatthe values of Vij and Tij are the same for all channels withthe same local invasion scale, k = Vij Ti j , being a control parameter in further analysis. The local invasion scale has themeaning of a typical channel length such that the channelswith L i j > k are more likely to be closed for invasion whilethe channels with L i j < k are more likely to be opened.
The bottleneck size plays the role of a geometrical cutofffor the channel, so that all the channels with bottleneck sizesless than a critical one, ¢*, are deterministically closed forbiological invasion. The value of ¢* can depend on the typeof microorganisms and soil properties. It is reasonable to assume, that if the minimal cross-section size along the channel(the diameter of the bottleneck or throat in the channel), ¢'I'/ ,is small enough, ¢ijin < ¢*, then the organisms do not fit

T
e-c-e $,=00.8
4 0.6......... 6.......... 8 0.44-<l 10
0.2
60 80 100 120 1400
0
k
0.8 (d)
0.6
0.4
0.2
0.9
Fig. 8. Invasion probability Anv versus local invasion scalek (in pixels) (a and b) and transmissibility T (c and d) forloosely (a and c) and densely (b and d) packed soil for different values of ¢* (in pixels) as indicated in the figures.
0.2
0.8
0.2
~ 06
~- 0.4
f 06
~- 0.4
0.8
Fig. 7(b) shows how the invasion probability Anv changeswith the mean transmissibility, (T), which is analogous tobond probability for a percolation problem. For small transmissibilities (bond probabilities), the invasion probability (themass of the spanning cluster) is close to zero and it increaseswith (T) . The point where it starts significantly to depart fromzero is called the invasion threshold or critical transmissibility, Te . For the percolation problem this value is known asa percolation threshold. It should be noticed that the valuesof the critical transmissibility (percolation threshold) are relatively high (Te ':::' 0.81 for loosely packed soil and T; ':::' 0.96for the densely packed one) , as compared with Te ':::' 0.25for bond percolation in simple cubic lattice and T; = 0.5 forbond percolation in square lattice [31], and approach T; = 1for bond percolation in a linear chain. This is a consequenceof the low node coordination in both networks with the meancoordination number (Z) ':::' 2.23 for loosely and (Z) ':::' 2.16for densely packed soil (see Fig. 3).
Fig. 7(b) also presents the data (open symbols) for Anv(k)obtained for the effective (mean-field) networks with homogeneous transmissibility (T) . If the transmissibilities Ti j areindependent random variables then the invasion probabilityshould be the same both in heterogeneous and homogeneousmean-field networks characterized by the mean value of thetransmissibility [27, 28, 32, 33] , i.e. the open and solid symbol curves in Fig. 7(b) should coincide. However, as seenfrom Fig. 7(b), this is not the case for both networks and thusthe correlations in transmissibilities playa significant role forboth networks. They reduce the transmissibility for a givenvalue of (T) and thus make the real networks more resilientto invasion as compared to the homogeneous ones (the opensymbol curves are above the solid-symbol ones in Fig. 7(b)).
140
<1>* = 0
120100
> 0.6<:
~- 0.4
0.2
O......,~~:;--'-----f,;:-'-~----'--;-k----'--~--'---,~
(b)0.8
Fig. 7. Invasion probability Anv versus (a) local invasionscale k (in pixels) and (b) mean transmissibility (T) in twonetworks representing loosely (circles) and densely (squares)soil samples. The solid symbols are used for heterogeneous networks with transmissibilities calculated accordingto Eq. (2), while the open symbols refer to the effective networks with homogeneous transmissibility equal to the meanvalue, (T). The networks with all the channels (i.e, ¢* = 0)were used for the analysis.
f 0.6
~- 0.4
0.2
0 t..4Iii~~-----'-It------.-~~d~~~
<T>
First, we present the data obtained for the networks withall the channels included, i.e. with ¢* = O. Fig. 7(a) showsthe dependence of the invasion probability versus the localinvasion scale for loosely (solid circles) and densely (solidsquares) packed soil samples. The value of Anv increaseswith increasing k in such a way that Anv ':::' 0 for k ;S ke andAnv > 0 for k ~ ke , where ke is the critical value of the localinvasion scale (the absence of a sharp transition at k = ke isdue to finite-size effects). For loosely packed soil , k; ':::' 15,while ke ':::' 35 for densely packed soil reflecting the shift ofthe whole curve for Anv(k) to the higher values of k. Thismeans that the densely packed soil is more resilient with respect to invasion due to the fact that the pore sizes under compression decrease. Therefore, the local invasion scale shouldbe larger in order to activate more channels for the same levelof invasion as in the loosely packed soil. The open symbolsin Fig. 7(a) represent the invasion probability for topologically the same networks but with homogeneous transmissibility, Ti j = (T) . It is clear from Fig . 7(a) that the homogeneous(mean-field in transmissibility) networks are less resilient toinvasion (the open symbols are above the solid ones for thesame value ofk). This effect is much more pronounced for thedensely packed network. Therefore, heterogeneity in transmissibilities makes the networks less acceptable for invasion.A similar effect has been observed in lattice models for spreadof epidemics [30].
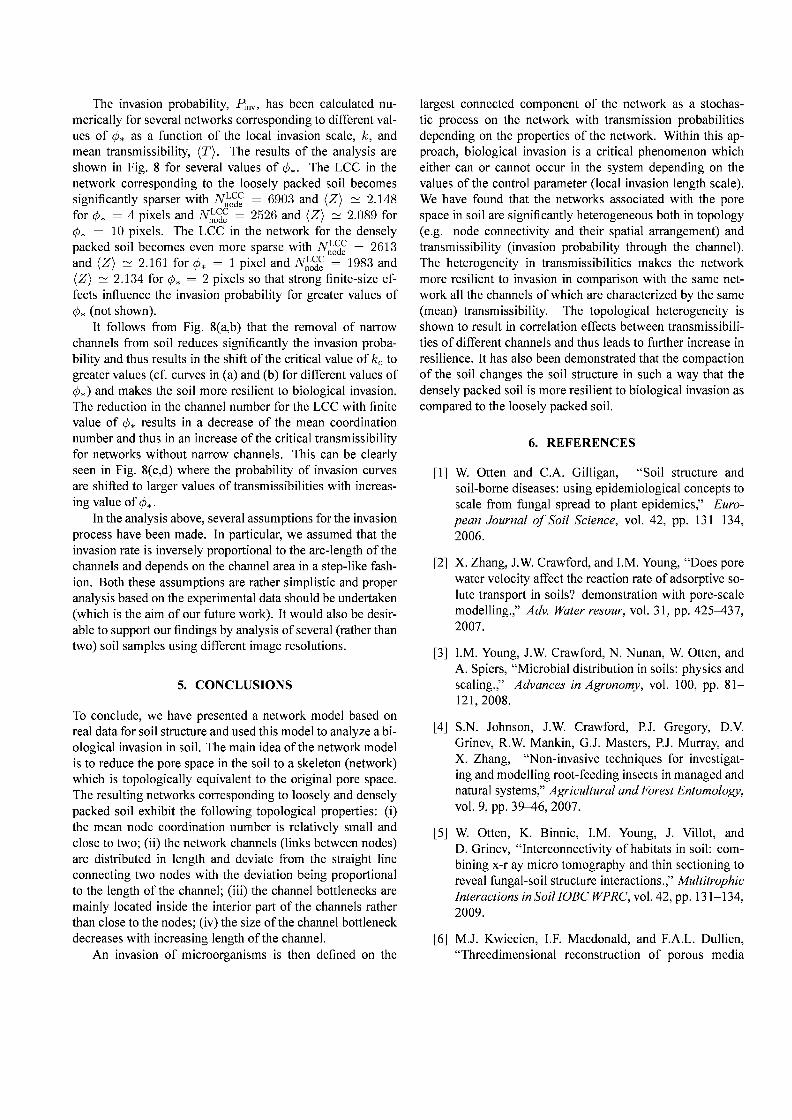
The invasion probability, Finv, has been calculated numerically for several networks corresponding to different values of ¢* as a function of the local invasion scale, k, andmean transmissibility, (T). The results of the analysis areshown in Fig. 8 for several values of ¢*. The LCC in thenetwork corresponding to the loosely packed soil becomessignificantly sparser with N;o~~ == 6903 and (Z) ~ 2.148for o; == 4 pixels and N;o~~ == 2526 and (Z) ~ 2.089 for¢* == 10 pixels. The LCC in the network for the denselypacked soil becomes even more sparse with N;o~~ == 2613and (Z) ~ 2.161 for o; == 1 pixel and N;o~~ == 1983 and(Z) ~ 2.134 for o; == 2 pixels so that strong finite-size effects influence the invasion probability for greater values of¢* (not shown).
It follows from Fig. 8(a,b) that the removal of narrowchannels from soil reduces significantly the invasion probability and thus results in the shift of the critical value of k; togreater values (cf. curves in (a) and (b) for different values of¢*) and makes the soil more resilient to biological invasion.The reduction in the channel number for the LCC with finitevalue of ¢* results in a decrease of the mean coordinationnumber and thus in an increase of the critical transmissibilityfor networks without narrow channels. This can be clearlyseen in Fig. 8(c,d) where the probability of invasion curvesare shifted to larger values of transmissibilities with increasing value of ¢*.
In the analysis above, several assumptions for the invasionprocess have been made. In particular, we assumed that theinvasion rate is inversely proportional to the arc-length of thechannels and depends on the channel area in a step-like fashion. Both these assumptions are rather simplistic and properanalysis based on the experimental data should be undertaken(which is the aim of our future work). It would also be desirable to support our findings by analysis of several (rather thantwo) soil samples using different image resolutions.
5. CONCLUSIONS
To conclude, we have presented a network model based onreal data for soil structure and used this model to analyze a biological invasion in soil. The main idea of the network modelis to reduce the pore space in the soil to a skeleton (network)which is topologically equivalent to the original pore space.The resulting networks corresponding to loosely and denselypacked soil exhibit the following topological properties: (i)the mean node coordination number is relatively small andclose to two; (ii) the network channels (links between nodes)are distributed in length and deviate from the straight lineconnecting two nodes with the deviation being proportionalto the length of the channel; (iii) the channel bottlenecks aremainly located inside the interior part of the channels ratherthan close to the nodes; (iv) the size of the channel bottleneckdecreases with increasing length of the channel.
An invasion of microorganisms is then defined on the
largest connected component of the network as a stochastic process on the network with transmission probabilitiesdepending on the properties of the network. Within this approach, biological invasion is a critical phenomenon whicheither can or cannot occur in the system depending on thevalues of the control parameter (local invasion length scale).We have found that the networks associated with the porespace in soil are significantly heterogeneous both in topology(e.g. node connectivity and their spatial arrangement) andtransmissibility (invasion probability through the channel).The heterogeneity in transmissibilities makes the networkmore resilient to invasion in comparison with the same network all the channels of which are characterized by the same(mean) transmissibility. The topological heterogeneity isshown to result in correlation effects between transmissibilities of different channels and thus leads to further increase inresilience. It has also been demonstrated that the compactionof the soil changes the soil structure in such a way that thedensely packed soil is more resilient to biological invasion ascompared to the loosely packed soil.
6. REFERENCES
[1] W. Otten and C.A. Gilligan, "Soil structure andsoil-borne diseases: using epidemiological concepts toscale from fungal spread to plant epidemics," European Journal of Soil Science, vol. 42, pp. 131-134,2006.
[2] X. Zhang, J.W. Crawford, and I.M. Young, "Does porewater velocity affect the reaction rate of adsorptive solute transport in soils? demonstration with pore-scalemodelling.," Adv. Water resour, vol. 31, pp. 425--437,2007.
[3] I.M. Young, J.W. Crawford, N. Nunan, W. Otten, andA. Spiers, "Microbial distribution in soils: physics andscaling.," Advances in Agronomy, vol. 100, pp. 81121,2008.
[4] S.N. Johnson, J.W. Crawford, P.J. Gregory, D.V.Grinev, R.W. Mankin, G.J. Masters, P.J. Murray, andX. Zhang, "Non-invasive techniques for investigating and modelling root-feeding insects in managed andnatural systems," Agricultural and Forest Entomology,vol. 9,pp.39--46,2007.
[5] W. Otten, K. Binnie, I.M. Young, J. Villot, andD. Grinev, "Interconnectivity of habitats in soil: combining x-r ay micro tomography and thin sectioning toreveal fungal-soil structure interactions.," MultitrophicInteractions in Soil IOBC WPRC, vol. 42, pp. 131-134,2009.
[6] MJ. Kwiecien, I.F. Macdonald, and F.A.L. Dullien,"Threedimensional reconstruction of porous media

from serial section data," Journal ofMicroscopy, vol.159,pp.343-359, 1990.
[7] J. T. Fredrich, "3d imaging of porous media using laserscanning confocal microscopy with application to microscale transport processes," Phys. Chem. Earth, vol.24,pp. 551-561,1999.
[8] P. Spanne, J. F. Thovert, C. J. Jacquin, W. B. Lindquist,K. W. Jones, and P. M. Adler, "Synchrotron computed microtomography of porous media: Topologyand transports," Phys. Rev. Lett., vol. 73, pp. 20012004,1994.
[9] L. F. Gladden, M. P. Hollewand, and P. Alexander, "Characterization of structural inhomogeneitiesin porous media," American Institute ofChemical Engineers Journal, vol. 41, pp. 894-906, 1995.
[10] L.A. Ferrand, M.A. Celia, and W.A. SolI, "Percolationbased models for pore-to-lab scale calculations in multifluid porous media," in Dynamics ofFluids in Hierarchical Porous Media, J.H. Cushman, Ed., pp. 463--483.Academic Press, San Diego, California, 1990.
[11] B. Berkovitz and R. P. Ewing, "Percolation theory andnetwork modeling applications in soil physics," Surveys in Geophysics, vol. 19, pp. 23-72, 1998.
[12] A. Santiago, J. P. Cardenas, J. C. Losada, R. M. Benitol, A. M. Tarquis, and F. Borondo, "Multiscalingof porous soils as heterogeneous complex networks,"Nonlin. Processes Geophys., vol. 15, pp. 893 - 902,2008.
[13] A.G. Hunt, "Percolative transport in fractal porous media," Chaos, Solitons and Fractals, vol. 19, pp. 309325,2004.
[14] K. Harris, I.M. Young, C.A. Gilligan, W. Otten, andK. Ritz, "Effect of bulk density on the spatial organisation of the fungus rhizoctonia solani in soil.," FEMSMicrobio!. Eco!., vol. 44, pp. 45-56, 2003.
[15] http://www.simbios.ac.uk.
[16] http://www.volumegraphics.com.
[17] http://rsbweb.nih.gov/ij/.
[18] W. Schroeder, K. Martin, and B. Loresen, The Visualization Toolkit, Prentice Hall, Upper Saddle River, NJ,1997.
[19] R. C. Gonzales and R. E. Woods, Digital Image processing, Addison-Wesley, 1992.
[20] L. F. Costa and R. M. Cesar Jr, Shape Analysis andClassification: Theory and Practice, CRC Press BocaRaton, 2001.
[21] M. P. Viana, E. Tanck, M. E. Beletti, and L. F. Costa,"Modularity and robustness of bone networks," Molecular Biosystems, vol. submitted, 2009.
[22] L. F. Costa, G. Mutinari, and D. Schubert, "Characterizing width uniformity by wave propagation," PhysicalReview E, vol. 68.
[23] C. A. Glasbey, G. W. Horgan, and J.F. Darbyshire,"Image analysis and threedimensional modelling ofpores in soil aggregates," Journal ofSoil Science, vol.42, pp. 479, 1991.
[24] D.T. Gillespie, Markov Processes, Academic Press,San Diego, 1992.
[25] P. Grassberger, "On the critical behavior of the generalepidemic process and dynamical percolation," Math.Biosc., vol. 63, pp. 157-172, 1983.
[26] D. Stauffer and A. Aharony, Introduction to Percolation Theory, Taylor and Francis, London, 2nd edition,1992.
[27] L. Sander, C. P. Warren, I. M. Sokolov, C. Simon, andJ. Koopman, "Percolation on heterogeneous networksas a model for epidemics," Math. Biosc., vol. 180, pp.293-305, 2002.
[28] L. M. Sander, C. P. Warren, and I.M. Sokolov, "Epidemics, disorder, and percolation.," Physica A, vol.325, pp. 1-8,2003.
[29] M.E.J. Newman, "The spread of epidemic disease onnetworks," Phys. Rev. E, vol. 66, pp. 016128,2002.
[30] F. M. Neri, F. J. Perez-Reche, S. Taraskin, and C. A.Gilligan, "Heterogeneity in sir epidemics on lattices,"2009, To be submitted.
[31] M. B. Isichenko, "Percolation, statistical topography,and transport in random media," Rev. Mod. Phys., vol.64,pp.961-1043, 1992.
[32] E. Kenah and J. M. Robins, "Second look at the spreadof epidemics on networks," Phys. Rev. E, vol. 76, pp.036113, 2007.
[33] 1. C. Miller, "Epidemic size and probability in populations with heterogeneous infectivity and susceptibility," Phys. Rev. E, vol. 76, pp. 010101(R), 2007.
Copyright © 2022 FDOKUMEN