Intraspecific variations in carbon-isotope and oxygen-isotope compositions of a brachiopod Basiliola...
22
Intraspecific variations in carbon-isotope and oxygen-isotope compositions of a brachiopod Basiliola lucida collected off Okinawa-jima, southwestern Japan Hideko Takayanagi a,⇑ , Ryuji Asami b , Osamu Abe c , Toshihiro Miyajima d , Hiroyuki Kitagawa c , Keiichi Sasaki e , Yasufumi Iryu a,1 a Department of Earth and Planetary Sciences, Graduate School of Environmental Studies, Nagoya University, Chikusa, Nagoya 464-8601, Japan b Trans-disciplinary Research Organization, Subtropical Island Studies (TRO-SIS), University of the Ryukyus, c/o Department of Physics and Earth Sciences, University of the Ryukyus, 1 Senbaru, Nishihara, Okinawa 903-0213, Japan c Hydrospheric–Atmospheric Science, Graduate School of Environmental Studies, Nagoya University, Chikusa, Nagoya 464-8601, Japan d Department of Chemical Oceanography, Atmosphere and Ocean Research Institute, University of Tokyo, Kashiwa 277-8564, Japan e Department of Cultural Properties and Heritage, Kanazawa Gakuin University, 10 Sue-machi, Kanazawa 920-1392, Japan Received 28 August 2012; accepted in revised form 20 March 2013; Available online 3 April 2013 Abstract This study presents intraspecific variations in carbon-isotope (d 13 C) and oxygen-isotope (d 18 O) compositions of nine spec- imens of a subtropical brachiopod, Basiliola lucida, collected west of Okinawa-jima, Ryukyu Islands, southwestern Japan. The d 13 C values of samples collected along the maximum growth axis (ontogenetic samples) from two modern and seven older (pre-1945 cal AD) shells show no seasonal changes. The modern shells, which were collected from comparable depths, have similar d 13 C values that fall within the range of calcite precipitated in isotopic equilibrium with ambient seawater (equilibrium calcite) (d 13 C EC values), and their mean d 13 C values are 1.1–1.6& less than those from the older shells. This decrease in d 13 C values is similar in magnitude to the decreases in atmospheric CO 2 and the oceanic dissolved inorganic carbon at the sea sur- face in recent years ( 13 C Suess effect), suggesting that the effect can even be detected at water depths of 200–300 m in the sub- tropical northwestern Pacific Ocean. The d 18 O values fluctuate within a narrow range (0.26–0.41&) with no seasonal changes, and they exhibit small (0.14–0.51&)offsets from those of equilibrium calcite (d 18 O EC values). A statistically significant neg- ative linear relationship is established between seawater temperature and mean d 18 O values of the nine shells, but the slope (0.31&/°C) is steeper than those of equilibrium calcite (0.23&/°C) and other calcareous organisms (0.15& to 0.26&/°C). The cross-plots of the d 13 C and d 18 O values suggest that the degree of the vital effect varies among individuals in this species. The d 13 C and d 18 O values of B. lucida are potentially useful for reconstructing the d 13 C and d 18 O evolution of ancient oceans, because both values show small intraspecific variations, the former is identical to the d 13 C EC values, and the latter shows small within-shell variations and small, nearly constant offsets from the d 18 O EC values. Ó 2013 Elsevier Ltd. All rights reserved. 1. INTRODUCTION The carbon-isotope (d 13 C) and oxygen-isotope (d 18 O) evolution of Phanerozoic oceans is one of the most contro- versial issues in isotope geochemistry (Qing and Veizer, 1994; Land, 1995; Veizer, 1995, 1999; Land and Lynch, 1996, 1999; Veizer et al., 1999; Wallmann, 2001). It is gen- erally accepted that the changes in d 13 C values of marine 0016-7037/$ - see front matter Ó 2013 Elsevier Ltd. All rights reserved. http://dx.doi.org/10.1016/j.gca.2013.03.026 ⇑ Corresponding author. Tel.: +81 052 789 3022; fax: +81 052 789 3033. E-mail address: [email protected] (H. Takayanagi). 1 Present address: Institute of Geology and Paleontology, Graduate School of Science, Tohoku University, Aobayama, Sendai 980-8578, Japan. www.elsevier.com/locate/gca Available online at www.sciencedirect.com Geochimica et Cosmochimica Acta 115 (2013) 115–136
-
Upload
independent -
Category
Documents
-
view
1 -
download
0
Transcript of Intraspecific variations in carbon-isotope and oxygen-isotope compositions of a brachiopod Basiliola...

Intraspecific variations in carbon-isotope andoxygen-isotope compositions of a brachiopod Basiliolalucida collected off Okinawa-jima, southwestern Japan
Hideko Takayanagi a,⇑, Ryuji Asami b, Osamu Abe c, Toshihiro Miyajima d,Hiroyuki Kitagawa c, Keiichi Sasaki e, Yasufumi Iryu a,1
a Department of Earth and Planetary Sciences, Graduate School of Environmental Studies, Nagoya University, Chikusa, Nagoya 464-8601, Japanb Trans-disciplinary Research Organization, Subtropical Island Studies (TRO-SIS), University of the Ryukyus, c/o Department of Physics
and Earth Sciences, University of the Ryukyus, 1 Senbaru, Nishihara, Okinawa 903-0213, Japanc Hydrospheric–Atmospheric Science, Graduate School of Environmental Studies, Nagoya University, Chikusa, Nagoya 464-8601, Japan
d Department of Chemical Oceanography, Atmosphere and Ocean Research Institute, University of Tokyo, Kashiwa 277-8564, Japane Department of Cultural Properties and Heritage, Kanazawa Gakuin University, 10 Sue-machi, Kanazawa 920-1392, Japan
Received 28 August 2012; accepted in revised form 20 March 2013; Available online 3 April 2013
Abstract
This study presents intraspecific variations in carbon-isotope (d13C) and oxygen-isotope (d18O) compositions of nine spec-imens of a subtropical brachiopod, Basiliola lucida, collected west of Okinawa-jima, Ryukyu Islands, southwestern Japan.The d13C values of samples collected along the maximum growth axis (ontogenetic samples) from two modern and seven older(pre-1945 cal AD) shells show no seasonal changes. The modern shells, which were collected from comparable depths, havesimilar d13C values that fall within the range of calcite precipitated in isotopic equilibrium with ambient seawater (equilibriumcalcite) (d13CEC values), and their mean d13C values are !1.1–1.6& less than those from the older shells. This decrease in d13Cvalues is similar in magnitude to the decreases in atmospheric CO2 and the oceanic dissolved inorganic carbon at the sea sur-face in recent years (13C Suess effect), suggesting that the effect can even be detected at water depths of 200–300 m in the sub-tropical northwestern Pacific Ocean. The d18O values fluctuate within a narrow range (0.26–0.41&) with no seasonal changes,and they exhibit small (0.14–0.51&) offsets from those of equilibrium calcite (d18OEC values). A statistically significant neg-ative linear relationship is established between seawater temperature and mean d18O values of the nine shells, but the slope("0.31&/!C) is steeper than those of equilibrium calcite ("0.23&/!C) and other calcareous organisms ("0.15& to"0.26&/!C). The cross-plots of the d13C and d18O values suggest that the degree of the vital effect varies among individualsin this species. The d13C and d18O values of B. lucida are potentially useful for reconstructing the d13C and d18O evolution ofancient oceans, because both values show small intraspecific variations, the former is identical to the d13CEC values, and thelatter shows small within-shell variations and small, nearly constant offsets from the d18OEC values." 2013 Elsevier Ltd. All rights reserved.
1. INTRODUCTION
The carbon-isotope (d13C) and oxygen-isotope (d18O)evolution of Phanerozoic oceans is one of the most contro-
versial issues in isotope geochemistry (Qing and Veizer,1994; Land, 1995; Veizer, 1995, 1999; Land and Lynch,1996, 1999; Veizer et al., 1999; Wallmann, 2001). It is gen-erally accepted that the changes in d13C values of marine
0016-7037/$ - see front matter " 2013 Elsevier Ltd. All rights reserved.http://dx.doi.org/10.1016/j.gca.2013.03.026
⇑ Corresponding author. Tel.: +81 052 789 3022; fax: +81 052 789 3033.E-mail address: [email protected] (H. Takayanagi).
1 Present address: Institute of Geology and Paleontology, Graduate School of Science, Tohoku University, Aobayama, Sendai 980-8578,Japan.
www.elsevier.com/locate/gca
Available online at www.sciencedirect.com
Geochimica et Cosmochimica Acta 115 (2013) 115–136
carbonates reflect those in d13C values of dissolved inor-ganic carbon (d13CDIC) triggered by 13C-depleted CO2 re-lease by volcanism (Renne et al., 1995), dissociation ofmethane hydrate (Dickens et al., 1997), or upwelling of an-oxic bottom waters (Knoll et al., 1996) as well as burial andre-oxidation of 12C-enriched organic matter (Scholle andArthur, 1980; Schidlowski and Aharon, 1992; Kump andArthur, 1999). Seawater d18O values (d18OSW) are con-trolled mainly by expansion and contraction of 16O-en-riched ice sheets (Shackleton and Opdyke, 1973;Railsback, 1990). However, larger variations on time scalesof >106 years may have been related to changes in d18OSW
values caused by interaction of seawater with the litho-sphere driven by tectonic activities (Veizer et al., 1999;Wallmann, 2001, 2004; Kasting et al., 2006). Whereas,Land (1995) argued that diagenetic alteration is the maincause of why sedimentary rocks are depleted in 18O withincreasing age.
The well-known Phanerozoic trends in d13C and d18Ovalues were delineated based on more than 4000 measure-ments of d13C and d18O values of biogenic carbonates:low-magnesium calcite (brachiopods, belemnites, oysters,and foraminifers) and aragonitic (mollusks) fossils (Veizeret al., 1997, 1999). Of these, d13C and d18O values ofrhynchonelliform brachiopods (Williams et al., 1996; here-after called “brachiopods”) are the most important datasource for delineating the Phanerozoic trends, especiallythose in the Paleozoic and Mesozoic (Veizer et al., 1997,1999). Source data used for delineating the trend are pro-vided via the Web site “http://mysite.science.uottawa.ca/jveizer/isotope_data/index.html”.
The preferential use of brachiopod shells is attributed totheir abundance and widespread distribution throughoutthe Phanerozoic, relatively lower susceptibility to diageneticalteration, and d13C and d18O values that are identical tothose of calcite precipitated in isotopic equilibrium withambient seawater (equilibrium calcite). The last fact, whichwas first reported by Lowenstam (1961), means that bra-chiopod d13C and d18O values can be used as reliable prox-ies for d13CDIC values and seawater temperature and/ord18OSW values. However, recent high-resolution analysesdemonstrated that brachiopod shell d13C and d18O valuesare highly variable within a single shell, as well as amongtaxa, and that the shells may or may not be precipitatedin isotopic equilibrium with ambient seawater (Carpenterand Lohmann, 1995; Curry and Fallick, 2002; Auclairet al., 2003; Brand et al., 2003; Parkinson et al., 2005;Yamamoto et al., 2010a,b, 2011, 2013; Cusack et al.,2012; Takayanagi et al., 2012). The precipitation of shellin isotopic equilibrium/disequilibrium raises a serious flawwith regard to the use of fossil brachiopod d13C and d18Ovalues for constructing the isotopic evolution of Phanerozo-ic oceans. It is likely that such precipitation is one of theexplanations for the wide range of values at a given horizonin the Phanerozoic trends reconstructed in previous studies(Veizer et al., 1986, 1997; Brand, 1989a,b; Bates and Brand,1991; Grossman et al., 1991; Wadleigh and Veizer, 1992;Qing and Veizer, 1994). Therefore, it is of great importanceto elucidate interarea, inter-/intraspecific, and within-shellvariations in brachiopod d13C and d18O values, as well as
to identify shell portions that are precipitated in isotopicequilibrium with ambient seawater (Table 1). High-resolu-tion analyses were conducted on minor element (mainlymagnesium) concentrations (England et al., 2007; Perez-Huerta et al., 2008, 2011; Cusack et al., 2008a,b), showingthat there is large within-shell variability. However, theyfound shell portions (termed an equilibrium zone) in whichthe concentration remains virtually constant. Such portionsare potentially useful for paleoceanographic proxies.
The brachiopod genus Basiliola Dall, 1908 occurs fromthe Cretaceous onward (Williams et al., 2002). CenozoicBasiliola has been reported from the Paleocene in the Wes-tern Australia (Craig, 2000), the Eocene on Seymour Islandoff Antarctic Peninsula (Bitner, 1996), the Mio-Pliocene inFiji and New Hebrides (Cooper, 1978), and the Pleistoceneon the Ryukyu Islands (Hatai, 1940; Cooper, 1957). Thisgenus is distributed in modern tropical/subtropical to tem-perate Indian and Pacific oceans (Yabe and Hatai, 1934;Cooper, 1981; Bitner, 2008, 2010). In the MediterraneanSea, Basiliola occurs most frequently in the shallow partbut persists to the middle part of the bathyal zone (Voros,2005). A compilation of occurrence data in previous studiessuggests that it is the same in the Indian and Pacific oceans.These indicate that d13C and d18O values from Basiliolalucida shells are potentially useful to reconstruct paleocea-nographic environments in the upper bathyal zone.
Yamamoto et al. (2010b) investigated within-shell varia-tions of d13C and d18O values from a living specimen of B.lucida collected at a water depth of!200 m off Amami-o-shi-ma, Ryukyu Islands, southwestern Japan. They showed thatthe d13C profile along the maximum growth axis exhibits agradual decrease and that the values mostly fall within therange of equilibrium calcite (d13CEC values); however, thed18O values fell within a narrow range and were enriched in18O by!0.2& to!0.5& relative to those of equilibrium cal-cite (d18OEC values). Based on these results, they concludedthat the d13C and d18O values of this genus could be usedas proxies for d13CDIC values and seawater temperatureand/or d18OSW values, if appropriate shell portions are usedand corrections for the offsets from the range of equilibriumcalcite are made. However, they examined the d13C and d18Ovalues of a single specimen, and the intraspecific variations ofthose values were not assessed. Therefore, it is essential todetermine the intraspecific variations of those values forBasiliola to use them as reliable paleoceanographic proxies.The specimens examined in this study were collected froma subtropical shelf slope environment off Okinawa-jima,Ryukyu Islands, southwestern Japan. Because the peakdiversity of brachiopods occurred within 30! of the equatorfrom the Paleozoic to the middle Mesozoic (Powell, 2009),this study is expected to provide a sound basis for interpret-ing tropical to subtropical paleoceanographic conditionsusing fossil brachiopod d13C and d18O values.
2. MATERIALS AND METHODS
2.1. Site location and climate regime
The Ryukyu Islands are located to the southwest ofmainland Japan and encompass several tens of islands
116 H. Takayanagi et al. / Geochimica et Cosmochimica Acta 115 (2013) 115–136

and islets, extending from Tanega-shima (30!440N,131!000E) in the northeast to Yonaguni-jima (24!450N,123!000E) in the southwest. These islands are arranged ina curve called the Ryukyu Island Arc, which is boundedby the East China Sea on the northwest and by the PacificOcean on the southeast. The Kuroshio Current (North Pa-cific Current) flows into the East China Sea through thestrait between Taiwan and Yonaguni-jima, passes north-eastward along the Ryukyu Islands, and then bifurcatesto the southwest of Yaku-shima. The main current changesits direction and exits to the Pacific through Tokara Strait(the strait between Amami-o-shima and Yaku-shima).
The climate in the Ryukyu Islands is subtropical.According to long-term (1906–2003) oceanographic dataoff Okinawa-jima (26–27!N, 127–128!E) provided by JapanOceanographic Data Center (JODC Data Online ServiceSystem; http://www.jodc.jhd.go.jp), monthly mean seawa-ter temperatures off Okinawa-jima range from 21.5 to29.0 !C at the sea surface with annual mean temperaturesbeing 25.2 !C. Annual mean salinity is 34.6 at the sea sur-face. Most of the islands are rimmed by fringing reefs (coralreefs). The shelf around the Ryukyu Islands slopes gentlyseaward. Its seaward margin (shelf edge) is at 90–170 mwater depths. The width of the shelf ranges from 0 to25 km (Kato et al., 1982).
2.2. Materials
Shells of dead B. lucida were collected by a K-grab sam-pler west of Okinawa-jima during the GH09 cruise of theR/V Daini Hakurei-maru, which was conducted by the Geo-logical Survey of Japan of the National Institute of Ad-
vanced Industrial Science and Technology (AIST/GSJ).We selected nine pristine specimens (OK1–9) from theshells collected on the fine to coarse sandy bottom at waterdepths of 211–317 m on 21 July–11 August 2009 (Figs. 1and 2, Table 2). We selected relatively large shells to obtaind13C and d18O profiles of all the live stages of this brachio-pod species. Their shell length, shell width, and length ofthe maximum growth axis (= length from the posterior toanterior shell edges) are 9.6–12.1 mm, 8.9–11.7 mm, and12.5–15.5 mm, respectively (Table 2). Because there was in-ter-individual variability in shell thickness, we selected spec-imens with nearly equal thickness (!250 lm). The d13C andd18O values of samples from the outer and inner surfaces ofthe secondary shell layer along the maximum growth axisare nearly identical for thin-shelled brachiopods living atrelatively deep growth sites (>200 m water depths) in trop-ical to subtropical seas (B. lucida, Yamamoto et al., 2010b;Campages japonica, Takayanagi et al., 2012). This indicatesthat shell thickness does not impact our stable isotope re-cords. The selected B. lucida shells were articulated andfew or no encrusting organisms, such as bryozoans or cor-alline algae, were found. The shells had not been subjectedto bioerosion or diagenetic alteration, and no bioclasts orsediments indicative of a shallow-water origin were recov-ered. These data indicate that the B. lucida shells wereautochthonous.
2.3. Seawater samples, oceanic environments, and isotopemeasurements
Bottom seawater for isotopic analyses was collectedwith a 6 L Van Dorn water sampler at 40 sites west of
Table 1Isotopic equilibrium/disequilibrium precipitation of brachiopod shells delineated by high-resolution analyses.
Brachiopod species d13C d18O Reference
Ontogenetic transect1 Inner transect2 Ontogenetic transect1 Inner transect2
Basiliola lucida E E + + Yamamoto et al. (2010b)E Not analyzed + Not analyzed This study3
Campages japonica E in the very earlystage of growthand " in thesubsequnet stage
" + Mostly +,partly E
Takayanagi et al. (2012)
Kikaithyrishanzawai
E to + in the early stageof growth and mostly "in the late stage
E + in the early stage ofgrowthand mostly E in the latestage
+ Yamamoto et al. (2010b)
Laqueus rubellus " " Mostly E, partly+ E to + Yamamoto et al. (2010a)Terebrataliacoreanica
" " E to " E Yamamoto et al. (2011,2013)
Terebrataliatransversa
?4 " E Auclair et al. (2003)
Not analyzed " E Cusack et al. (2012)Notosaria nigricans Not analyzed " E Cusack et al. (2012)Terebratulinacrossei
Mostly ", partly E Mostly ",partly E
E E Yamamoto et al. (2011,2013)
Terebratulinaretusa
Not analyzed " E Cusack et al. (2012)
E, identical or nearly identical to d13CEC or d18OEC values; +, greater than d13CEC or d18OEC values; ", lower than d13CEC or d18OEC values.1, outer part of the secondary layer; 2, innermost secondary layer; 3, modern specimen; 4, d13CEC values were not estimated.
H. Takayanagi et al. / Geochimica et Cosmochimica Acta 115 (2013) 115–136 117

Okinawa-jima between 20 July and 12 August 2009 duringthe GH09 cruise, as well as between 4 and 20 November2010 during the GH10 cruise (Table 3). Temperature andsalinity were measured with a Conductivity–Temperature–
Depth profiler (CTD; Ocean Seven-305, IDRONAUTS.r.l., Italy) at the bottom seawater-sampling sites(Fig. 1). Water samples were filtered with a 0.45 lm mem-brane filter, collected in a 30 mL glass vial, sealed immedi-ately after collection, and stored in a cool and dark place.Water samples for measurement of d13CDIC values werefixed with !100 lL of a saturated HgCl2 solution.
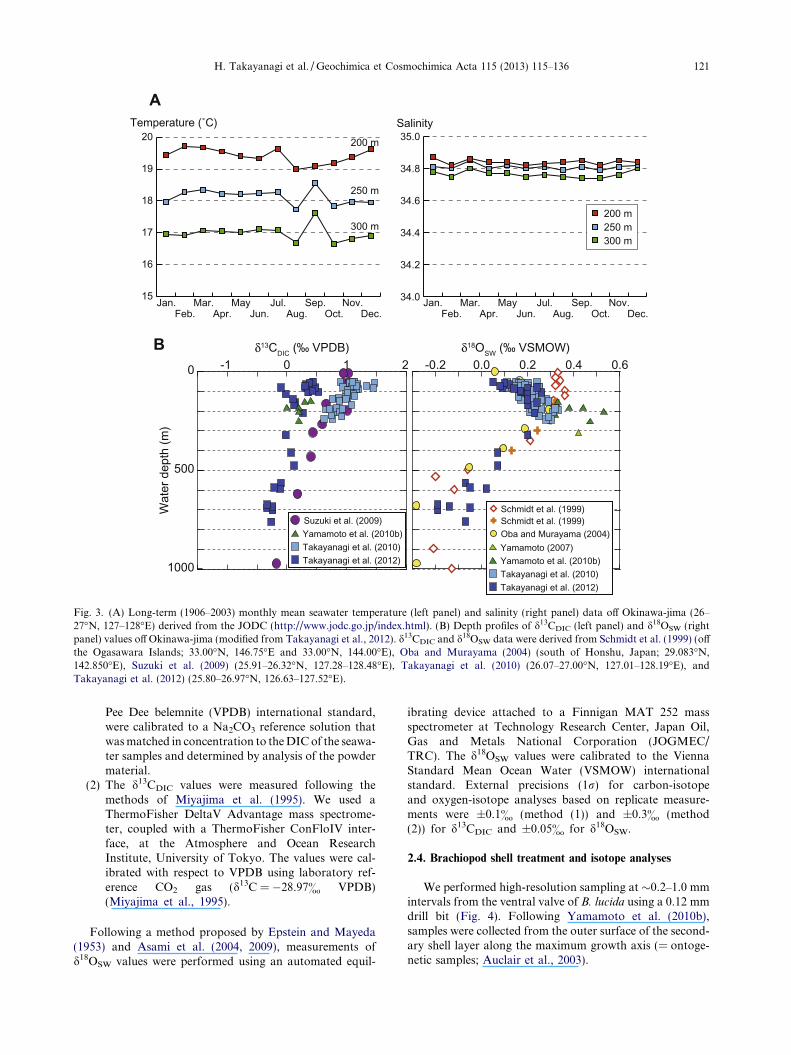
According to the JODC data collected off Okinawa-jima(26!N–27!N, 127!E–128!E), the temperature and salinity atwater depths between 200 and 300 m are relatively con-stant: 19.0–19.7 !C (mean = 19.4 !C, 1r = 0.2 !C) and16.7–17.6 !C (mean = 17.0 !C, 1r = 0.3 !C) and 34.82–34.87 (mean = 34.84, 1r < 0.05) and 34.74–34.80(mean = 34.76, 1r < 0.05) at 200 and 300 m water depth,respectively (Fig. 3). The annual mean temperature de-creases by !1.3 !C for every 50 m increase in water depth.
Two methods were used to measure d13CDIC values ofseawater samples.
(1) Following the method proposed by Sampei et al.(2005), dissolved inorganic carbon (DIC) wasexpelled as CO2 by acidifying with H3PO4 and Hebubbling in a vacuum line, and the purified CO2
was analyzed with a Finnigan Delta Plus mass spec-trometer at Nagoya University (HyARC-NU). Isoto-pic ratios, expressed as d values relative to the Vienna
Fig. 1. Map showing the brachiopod-collection sites (stars with numbers) and the seawater-sampling sites during the R/V Daini Hakurei-maruGH09 (squares with numbers) and GH10 (triangles with numbers) cruises.
OK1 OK2 OK3
OK4 OK5 OK6
OK8OK7 OK9
Fig. 2. Photograph of the ventral valve of the nine B. lucida shellsstudied. Note that both the modern (OK6 and OK7) and older(OK1–OK5, OK8, and OK9) shells are pristine, with few or nocover of encrusting organisms.
118 H. Takayanagi et al. / Geochimica et Cosmochimica Acta 115 (2013) 115–136
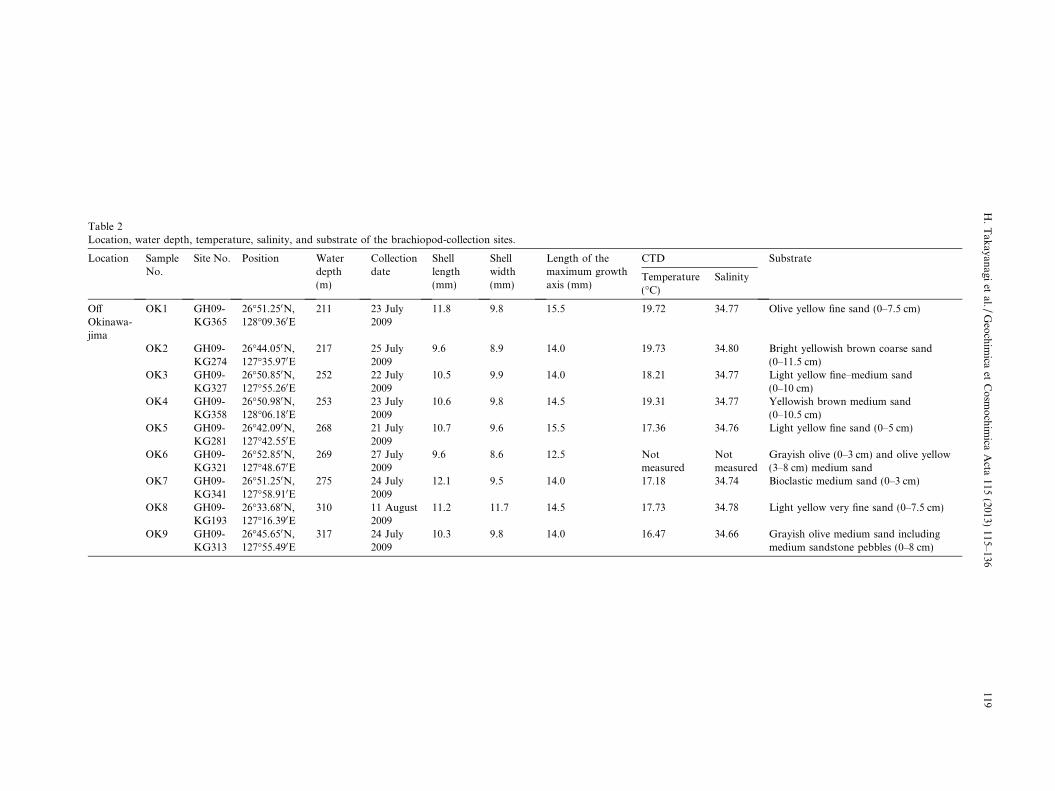
Table 2Location, water depth, temperature, salinity, and substrate of the brachiopod-collection sites.
Location SampleNo.
Site No. Position Waterdepth(m)
Collectiondate
Shelllength(mm)
Shellwidth(mm)
Length of themaximum growthaxis (mm)
CTD Substrate
Temperature(!C)
Salinity
OffOkinawa-jima
OK1 GH09-KG365
26!51.250N,128!09.360E
211 23 July2009
11.8 9.8 15.5 19.72 34.77 Olive yellow fine sand (0–7.5 cm)
OK2 GH09-KG274
26!44.050N,127!35.970E
217 25 July2009
9.6 8.9 14.0 19.73 34.80 Bright yellowish brown coarse sand(0–11.5 cm)
OK3 GH09-KG327
26!50.850N,127!55.260E
252 22 July2009
10.5 9.9 14.0 18.21 34.77 Light yellow fine–medium sand(0–10 cm)
OK4 GH09-KG358
26!50.980N,128!06.180E
253 23 July2009
10.6 9.8 14.5 19.31 34.77 Yellowish brown medium sand(0–10.5 cm)
OK5 GH09-KG281
26!42.090N,127!42.550E
268 21 July2009
10.7 9.6 15.5 17.36 34.76 Light yellow fine sand (0–5 cm)
OK6 GH09-KG321
26!52.850N,127!48.670E
269 27 July2009
9.6 8.6 12.5 Notmeasured
Notmeasured
Grayish olive (0–3 cm) and olive yellow(3–8 cm) medium sand
OK7 GH09-KG341
26!51.250N,127!58.910E
275 24 July2009
12.1 9.5 14.0 17.18 34.74 Bioclastic medium sand (0–3 cm)
OK8 GH09-KG193
26!33.680N,127!16.390E
310 11 August2009
11.2 11.7 14.5 17.73 34.78 Light yellow very fine sand (0–7.5 cm)
OK9 GH09-KG313
26!45.650N,127!55.490E
317 24 July2009
10.3 9.8 14.0 16.47 34.66 Grayish olive medium sand includingmedium sandstone pebbles (0–8 cm)
H.
Tak
ayanagi
etal./G
eoch
imica
etC
osm
och
imica
Acta
115(2013)
115–136119

Table 3Seawater samples collected off Okinawa Island. Salinity and pH data are derived from Suzuki et al. (2010, 2011) and Amano et al. (2011).
Site No. Date Water depth (m) Temperature (!C) Salinity pH at 25 !C d13CDIC (& VPDB) d18OSW (& VSMOW)
GH09-KG104 12 August 09 104 23.9 34.65 8.0 1.08 0.24GH09-KG364 20 July 09 105 22.0 34.71 8.0 1.01 0.17GH09-KG328 27 July 09 113 Not measured Not measured 8.0 1.12 0.19GH09-KG131 12 August 09 118 23.8 34.66 8.1 1.05 0.26GH09-KG366 22 July 09 124 23.0 34.66 8.0 1.13 0.16GH09-KG118 12 August 09 127 23.2 34.68 8.0 0.99 0.25GH09-KG217 29 July 09 133 21.2 34.77 8.0 0.86 0.22GH09-KG116 12 August 09 136 22.3 34.74 8.0 1.01 0.28GH09-KG343 27 July 09 138 Not measured Not measured 8.0 0.76 0.26GH09-KG349 23 July 09 138 22.0 34.69 8.0 0.99 0.17GH09-KG263 25 July 09 148 20.7 34.78 8.0 0.88 0.29GH09-KG371 22 July 09 168 20.9 34.77 8.0 1.08 0.23GH09-KG278 21 July 09 185 20.2 34.81 8.0 0.83 0.32GH09-KG307 24 July 09 188 19.9 34.78 8.0 0.93 0.22GH09-KG330 27 July 09 189 Not measured Not measured 8.0 0.72 0.26GH09-KG270 21 July 09 191 20.4 34.79 8.0 0.65 0.33GH09-KG273 25 July 09 203 19.5 34.81 8.0 0.79 0.31GH09-KG280 21 July 09 203 20.7 34.77 8.0 0.89 0.21GH09-KG442 26 July 09 222 18.9 34.79 7.9 0.74 0.25GH09-KG351 22 July 09 227 19.1 34.78 7.9 0.92 0.29GH09-KG218 29 July 09 239 18.9 34.79 7.9 0.76 0.28GH09-KG211 29 July 09 240 18.2 34.80 7.9 0.62 0.30
GH10-KG47 20 November 10 103 24.0 34.63 8.1 0.53 0.17GH10-KG115 7 November 10 104 24.0 34.58 8.1 0.36 0.26GH10-KG73 15 November 10 113 22.8 34.75 8.1 "0.02 0.20GH10-KG169 7 November 10 139 21.6 34.73 8.0 0.10 0.20GH10-KG53 15 November 10 156 20.6 34.79 8.0 0.14 0.24GH10-KG102 7 November 10 169 18.7 34.77 8.0 0.12 0.20GH10-KG41 15 November 10 209 19.0 34.94 8.0 0.27 0.23GH10-KG103 20 November 10 321 16.6 34.71 8.0 "0.02 0.20GH10-KG7 18 November 10 410 14.2 34.49 7.9 0.07 0.07GH10-KG39 19 November 10 476 12.8 34.41 7.8 0.12 0.07GH10-KG22 16 November 10 564 10.2 34.26 7.8 "0.10 "0.07GH10-KG82 13 November 10 587 10.6 34.28 7.7 "0.21 "0.05GH10-KG40 19 November 10 593 9.9 34.25 7.7 "0.11 0.02GH10-KG436 4 November 10 673 9.8 34.34 7.5 "0.33 "0.19GH10-KG202 12 November 10 683 9.8 34.35 7.6 "0.24 "0.14GH10-KG172 12 November 10 690 9.9 34.34 7.6 "0.33 "0.05GH10-KG192 12 November 10 702 9.6 34.34 7.6 "0.24 "0.19GH10-KG182 12 November 10 760 9.3 34.35 7.6 "0.26 "0.07
120H
.T
akayan
agiet
al./Geo
chim
icaet
Co
smo
chim
icaA
cta115
(2013)115–136
Pee Dee belemnite (VPDB) international standard,were calibrated to a Na2CO3 reference solution thatwas matched in concentration to the DIC of the seawa-ter samples and determined by analysis of the powdermaterial.
(2) The d13CDIC values were measured following themethods of Miyajima et al. (1995). We used aThermoFisher DeltaV Advantage mass spectrome-ter, coupled with a ThermoFisher ConFloIV inter-face, at the Atmosphere and Ocean ResearchInstitute, University of Tokyo. The values were cal-ibrated with respect to VPDB using laboratory ref-erence CO2 gas (d13C = "28.97& VPDB)(Miyajima et al., 1995).
Following a method proposed by Epstein and Mayeda(1953) and Asami et al. (2004, 2009), measurements ofd18OSW values were performed using an automated equil-
ibrating device attached to a Finnigan MAT 252 massspectrometer at Technology Research Center, Japan Oil,Gas and Metals National Corporation (JOGMEC/TRC). The d18OSW values were calibrated to the ViennaStandard Mean Ocean Water (VSMOW) internationalstandard. External precisions (1r) for carbon-isotopeand oxygen-isotope analyses based on replicate measure-ments were ±0.1& (method (1)) and ±0.3& (method(2)) for d13CDIC and ±0.05& for d18OSW.
2.4. Brachiopod shell treatment and isotope analyses
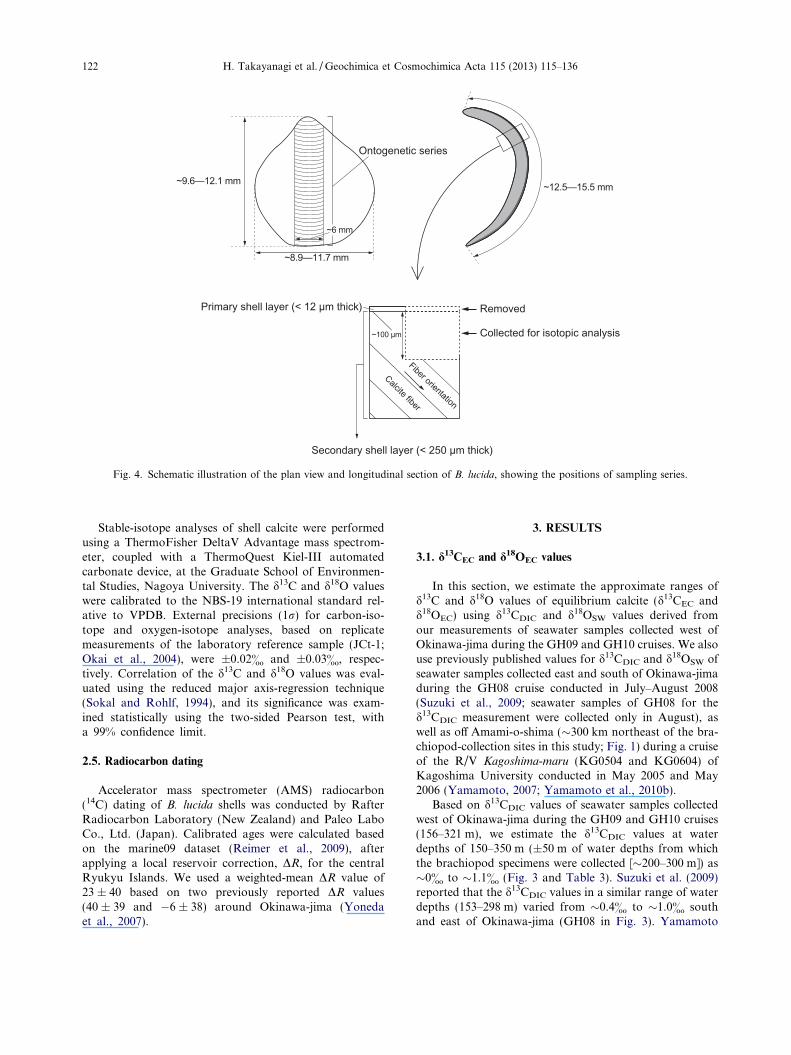
We performed high-resolution sampling at !0.2–1.0 mmintervals from the ventral valve of B. lucida using a 0.12 mmdrill bit (Fig. 4). Following Yamamoto et al. (2010b),samples were collected from the outer surface of the second-ary shell layer along the maximum growth axis (= ontoge-netic samples; Auclair et al., 2003).
Temperature (˚C)
Feb. Apr. Jun. Aug. Oct. Dec.Jan. Mar. May Jul. Sep. Nov. 34.0
34.2
34.4
34.6
34.8
35.0
Feb. Apr. Jun. Aug. Oct. Dec.
Salinity 200 m
250 m
300 m
15
16
17
18
19
20
Jan. Mar. May Jul. Sep. Nov.
200 m250 m300 m
A
B
Wat
er d
epth
(m)
δ18OSW (‰ VSMOW)-0.2 0.0 0.2 0.4 0.6-1 00
500
1000
1 2δ13CDIC (‰ VPDB)
Suzuki et al. (2009)
Takayanagi et al. (2010)Takayanagi et al. (2012)
Yamamoto et al. (2010b)
Schmidt et al. (1999)Schmidt et al. (1999)Oba and Murayama (2004)Yamamoto (2007)Yamamoto et al. (2010b)Takayanagi et al. (2010)Takayanagi et al. (2012)
Fig. 3. (A) Long-term (1906–2003) monthly mean seawater temperature (left panel) and salinity (right panel) data off Okinawa-jima (26–27!N, 127–128!E) derived from the JODC (http://www.jodc.go.jp/index.html). (B) Depth profiles of d13CDIC (left panel) and d18OSW (rightpanel) values off Okinawa-jima (modified from Takayanagi et al., 2012). d13CDIC and d18OSW data were derived from Schmidt et al. (1999) (offthe Ogasawara Islands; 33.00!N, 146.75!E and 33.00!N, 144.00!E), Oba and Murayama (2004) (south of Honshu, Japan; 29.083!N,142.850!E), Suzuki et al. (2009) (25.91–26.32!N, 127.28–128.48!E), Takayanagi et al. (2010) (26.07–27.00!N, 127.01–128.19!E), andTakayanagi et al. (2012) (25.80–26.97!N, 126.63–127.52!E).
H. Takayanagi et al. / Geochimica et Cosmochimica Acta 115 (2013) 115–136 121
Stable-isotope analyses of shell calcite were performedusing a ThermoFisher DeltaV Advantage mass spectrom-eter, coupled with a ThermoQuest Kiel-III automatedcarbonate device, at the Graduate School of Environmen-tal Studies, Nagoya University. The d13C and d18O valueswere calibrated to the NBS-19 international standard rel-ative to VPDB. External precisions (1r) for carbon-iso-tope and oxygen-isotope analyses, based on replicatemeasurements of the laboratory reference sample (JCt-1;Okai et al., 2004), were ±0.02& and ±0.03&, respec-tively. Correlation of the d13C and d18O values was eval-uated using the reduced major axis-regression technique(Sokal and Rohlf, 1994), and its significance was exam-ined statistically using the two-sided Pearson test, witha 99% confidence limit.
2.5. Radiocarbon dating
Accelerator mass spectrometer (AMS) radiocarbon(14C) dating of B. lucida shells was conducted by RafterRadiocarbon Laboratory (New Zealand) and Paleo LaboCo., Ltd. (Japan). Calibrated ages were calculated basedon the marine09 dataset (Reimer et al., 2009), afterapplying a local reservoir correction, DR, for the centralRyukyu Islands. We used a weighted-mean DR value of23 ± 40 based on two previously reported DR values(40 ± 39 and "6 ± 38) around Okinawa-jima (Yonedaet al., 2007).
3. RESULTS
3.1. d13CEC and d18OEC values
In this section, we estimate the approximate ranges ofd13C and d18O values of equilibrium calcite (d13CEC andd18OEC) using d13CDIC and d18OSW values derived fromour measurements of seawater samples collected west ofOkinawa-jima during the GH09 and GH10 cruises. We alsouse previously published values for d13CDIC and d18OSW ofseawater samples collected east and south of Okinawa-jimaduring the GH08 cruise conducted in July–August 2008(Suzuki et al., 2009; seawater samples of GH08 for thed13CDIC measurement were collected only in August), aswell as off Amami-o-shima (!300 km northeast of the bra-chiopod-collection sites in this study; Fig. 1) during a cruiseof the R/V Kagoshima-maru (KG0504 and KG0604) ofKagoshima University conducted in May 2005 and May2006 (Yamamoto, 2007; Yamamoto et al., 2010b).
Based on d13CDIC values of seawater samples collectedwest of Okinawa-jima during the GH09 and GH10 cruises(156–321 m), we estimate the d13CDIC values at waterdepths of 150–350 m (±50 m of water depths from whichthe brachiopod specimens were collected [!200–300 m]) as!0& to !1.1& (Fig. 3 and Table 3). Suzuki et al. (2009)reported that the d13CDIC values in a similar range of waterdepths (153–298 m) varied from !0.4& to !1.0& southand east of Okinawa-jima (GH08 in Fig. 3). Yamamoto
Removed
Collected for isotopic analysis
Calcite fiber
Fiber orientation
Secondary shell layer (< 250 µm thick)
Primary shell layer (< 12 µm thick)
~100 µm
~8.9–11.7 mm
~9.6–12.1 mm ~12.5–15.5 mm
~6 mm
Ontogenetic series
Fig. 4. Schematic illustration of the plan view and longitudinal section of B. lucida, showing the positions of sampling series.
122 H. Takayanagi et al. / Geochimica et Cosmochimica Acta 115 (2013) 115–136

et al. (2010b) reported that the d13CDIC values at waterdepths of !150–250 m off Amami-o-shima fall within arange of !0& to !0.3& (Fig. 3). These are in accordancewith our data, as well as those in the World Ocean Circula-tion Experiment database (Schmidt et al., 1999).
We estimated the d13CHCO3" values following the proce-
dure presented by Yamamoto et al. (2010b). Because thepH of all seawater at water depths of !150–350 m collectedaround Okinawa-jima ranged from 7.9 to 8.0 (Table 3),
which is the typical value for surface seawater at this tem-perature, it was assumed that d13CHCO3
" values in such sea-water are !0.2& greater compared with d13CDIC values(Grossman, 1984; Romanek et al., 1992; Zhang et al.,1995). Therefore, the d13CEC values calculated using themeasured d13CDIC values (0–1.1&) and the calciteHCO3
"-enrichment factor (1.0 ± 0.2&; Romanek et al.,1992) should range from 1.0& to 2.5& at the brachio-pod-collection sites.
Table 4The ranges in d13C and d18O values from B. lucida shells collected off Okinawa-jima.
Sample No. Site No. Water depth (m) n d13C (& VPDB) d18O (& VPDB)
OK1 GH09-KG365 211 39 2.77"3.62 "0.16 to 0.13OK2 GH09-KG274 217 33 2.60"3.36 "0.23 to 0.15OK3 GH09-KG327 252 35 2.88"3.41 0.24"0.51OK4 GH09-KG358 253 35 3.20"3.72 0.26"0.52OK5 GH09-KG281 268 32 3.00"3.41 0.14"0.48OK6 GH09-KG321 269 29 1.37"2.35 0.21"0.58OK7 GH09-KG341 275 28 1.23"2.17 0.02"0.38OK8 GH09-KG193 310 42 3.13"3.65 0.52"0.81OK9 GH09-KG313 317 36 2.86"3.32 0.50"0.91
5 10 15
OK1 OK2 OK3 OK4 OK5 OK6 OK7 OK8 OK9
15.514.0
14.5
15.5
12.5
1.0
2.0
3.0
4.0
δ13 C
(VP
DB)
Sample No.
14.5
14.0
AMYOK2 OK7
14.0
Distance from the posterior shell edge (mm)Growth direction
14.0
Range of δ13CEC values (1.0–2.5‰)
1.0
2.0
3.0
4.0
δ13C
(VP
DB)
15.0
OK1 (211 m)
OK3 (252 m)OK2 (217 m)
OK6 (269 m)OK5 (268 m)OK4 (253 m)
OK8 (310 m)OK9 (315 m)
OK7 (275 m)AMY (200 m; Yamamoto et al., 2010b)
‰‰
Fig. 5. Profile (top panel) and box plots (bottom panel) of the ontogenetic d13C values derived from B. lucida. The shaded areas represent therange of d13CEC values at the brachiopod-collection sites. In the box plots, the box represent the middle 50% of the data, the black horizontalline represents the median, and the vertical lines indicate the total range without outliers. Outliers (outside threefold of the whole box length)are indicated by circles. Numbers in the box plots indicate length (in mm) of the maximum growth axis.
H. Takayanagi et al. / Geochimica et Cosmochimica Acta 115 (2013) 115–136 123
The d18OSW values of samples collected at water depthsof 156–321 m from 21 to 29 July 2009 and from 7 to 20November 2010 during the GH09 and GH10 cruises,respectively, fall within a range from 0.20& to 0.33&
(Fig. 3 and Table 3). These d18OSW values are close to thosefrom a similar range of water depths (151–310 m) collectedon 15 May 2005 and 21 May 2006 off Amami-o-shima andreported by Yamamoto (2007) and Yamamoto et al.
Range of δ18OEC values (−0.1 to 0.2‰)
Range of δ18OEC values (−0.3 to 0‰)
Range of δ18OEC values (−0.6 to −0.2‰)
~300 m water depth
~250 m water depth
~200 m water depth
5 10 15
5 10 15
-1.0
0
1.0
5 10 15
OK6 (269 m)OK7 (275 m)
OK5 (268 m)OK4 (253 m)OK3 (252 m)
OK8 (310 m)OK9 (315 m)
δ18 O
(‰ V
PDB)
δ18 O
(‰ V
PDB)
δ18 O
(‰ V
PDB)
Distance from the posterior shell edge (mm)Growth direction
-1.0
0
1.0
-1.0
0
1.0
AMYSample No.
δ18O
( ‰
VPD
B)
OK1 OK2 OK3 OK4 OK5 OK6 OK7 OK8 OK9-0.2
0
0.2
0.4
0.6
0.8
1.0
15.5
14.0 14.5 15.512.5
14.014.5
14.0
14.0
15.0
OK1 (211 m)OK2 (217 m)
AMY (200 m; Yamamoto et al., 2010b)
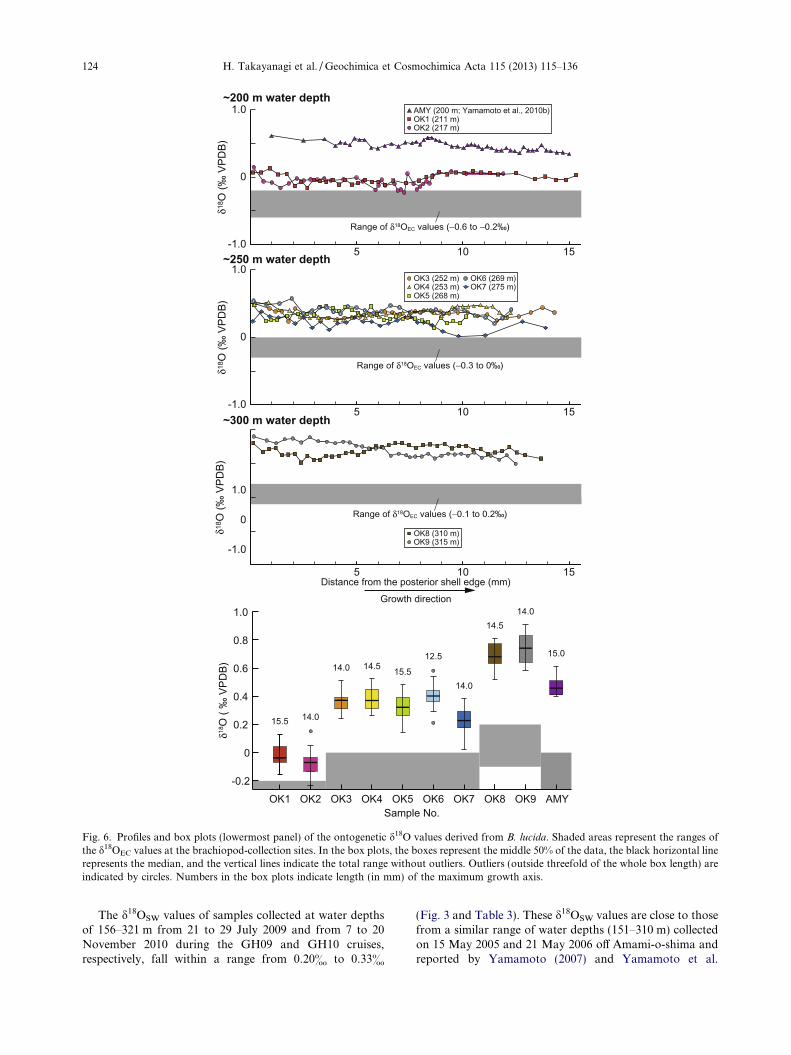
Fig. 6. Profiles and box plots (lowermost panel) of the ontogenetic d18O values derived from B. lucida. Shaded areas represent the ranges ofthe d18OEC values at the brachiopod-collection sites. In the box plots, the boxes represent the middle 50% of the data, the black horizontal linerepresents the median, and the vertical lines indicate the total range without outliers. Outliers (outside threefold of the whole box length) areindicated by circles. Numbers in the box plots indicate length (in mm) of the maximum growth axis.
124 H. Takayanagi et al. / Geochimica et Cosmochimica Acta 115 (2013) 115–136
(2010b) (d18OSW = 0.28–0.53&). Taking into account pos-sible seasonal changes in d18OSW values, we use both dataand assume that the d18OSW values range from 0.20& to0.53& at the brachiopod-collection sites in this study.According to the JODC data, seawater temperature andsalinity around the brachiopod-collection sites fall withinnarrow ranges of 19.0–19.7 !C and 34.82–34.87, 17.7–18.6 !C and 34.79–34.85, and 16.7–17.6 !C and 34.74–34.80 at water depths of 200, 250, and 300 m, respectively(Fig. 3). These values agree well with those measured withthe CTD at water-sampling sites during the GH09 andGH10 cruises (16.6–20.94 !C and 34.71–34.94 at waterdepths of 156–321 m). Therefore, we calculated d18OEC val-ues for the brachiopod-collection sites using JODC temper-ature data and the equation proposed by Friedman andO’Neil (1977). The estimated d18OEC values at the brachio-pod-collection sites range from "0.6& to "0.2& (200 mwater depth), "0.3& to 0& (250 m water depth), and"0.1& to 0.2& (300 m water depth).
3.2. d13C and d18O values of B. lucida
The d13C and d18O values of nine B. lucida shells areshown in Appendix A and Table 4. There is no statisticallysignificant relationship (p > 0.05) between shell size and thed13C/d18O values.
The studied specimens can be divided into two groupsbased on the ontogenetic d13C values: low (OK6 andOK7) and high (OK1–5, OK8, and OK9) (Fig. 5). The for-mer group includes d13C values from !1.2& to !2.4&,which fall within the range of the d13CEC values (1.0–2.5&). The d13C values of the latter group range between!2.6& and !3.7&, which are !0.1& to !1.2& greaterthan the d13CEC values. The shell d13C values do not exhibitany seasonal changes, and they vary within ranges of 0.41–0.85& and 0.94–0.98& in the high- and low-d13C groups,respectively (Fig. 5). Each profile consists of an initial in-crease (up to !0.6&; within 0.9 mm from the posteriorshell edge), a prolonged period of stable values, and a finaldecrease (0.17–0.91&; within 7 mm from the anterior shelledge).
The ontogenetic d18O values fluctuate within a narrowrange (0.26–0.41&), showing no seasonal changes(Fig. 6). This does not enable us to estimate growth ratesof analyzed brachiopod shells. The mean ontogeneticd18O values are similar between shells at each of the threedepths, regardless of the d13C values, whereas the meanontogenetic d18O values increase with water depth. Theontogenetic d18O values are identical to or slightly greaterthan the d18OEC values. The differences between the meanontogenetic d18O values and the mean d18OEC values are0.3–0.4&, 0.4–0.6&, and 0.7& at !200, !250, and!300 m water depths, respectively, showing a clear increasewith water depth.
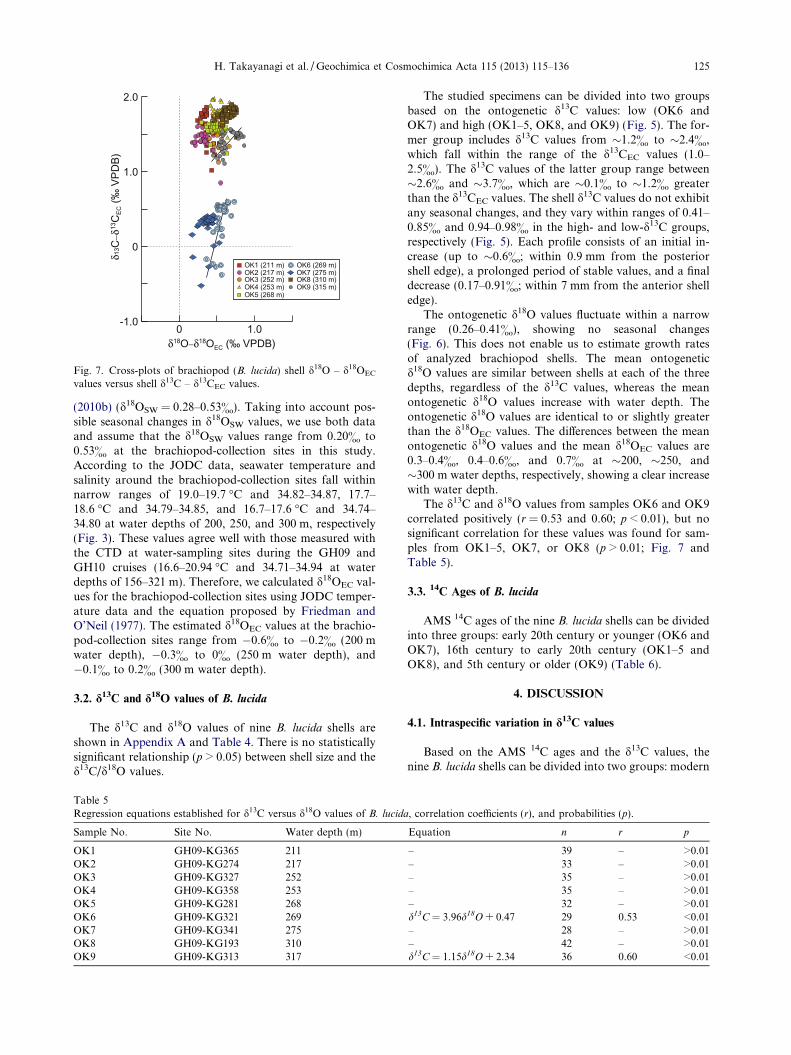
The d13C and d18O values from samples OK6 and OK9correlated positively (r = 0.53 and 0.60; p < 0.01), but nosignificant correlation for these values was found for sam-ples from OK1–5, OK7, or OK8 (p > 0.01; Fig. 7 andTable 5).
3.3. 14C Ages of B. lucida
AMS 14C ages of the nine B. lucida shells can be dividedinto three groups: early 20th century or younger (OK6 andOK7), 16th century to early 20th century (OK1–5 andOK8), and 5th century or older (OK9) (Table 6).
4. DISCUSSION
4.1. Intraspecific variation in d13C values
Based on the AMS 14C ages and the d13C values, thenine B. lucida shells can be divided into two groups: modern
0 1.0-1.0
0
1.0
2.0
δ18O−δ18OEC (‰ VPDB)
δ13C
−δ13
CEC
(‰ V
PDB)
OK8 (310 m)
OK1 (211 m)
OK9 (315 m)OK5 (268 m)OK4 (253 m)
OK6 (269 m)OK7 (275 m)
OK3 (252 m)OK2 (217 m)
Fig. 7. Cross-plots of brachiopod (B. lucida) shell d18O – d18OEC
values versus shell d13C – d13CEC values.
Table 5Regression equations established for d13C versus d18O values of B. lucida, correlation coefficients (r), and probabilities (p).
Sample No. Site No. Water depth (m) Equation n r p
OK1 GH09-KG365 211 – 39 – >0.01OK2 GH09-KG274 217 – 33 – >0.01OK3 GH09-KG327 252 – 35 – >0.01OK4 GH09-KG358 253 – 35 – >0.01OK5 GH09-KG281 268 – 32 – >0.01OK6 GH09-KG321 269 d13C = 3.96d18O + 0.47 29 0.53 <0.01OK7 GH09-KG341 275 – 28 – >0.01OK8 GH09-KG193 310 – 42 – >0.01OK9 GH09-KG313 317 d13C = 1.15d18O + 2.34 36 0.60 <0.01
H. Takayanagi et al. / Geochimica et Cosmochimica Acta 115 (2013) 115–136 125

shells with lower d13C values (OK6 and OK7) and older(pre-1945 cal AD) shells with higher d13C values (OK1–5,OK8, and OK9) (Fig. 5 and Table 6). The mean d13C valuesof the older shells are !1.4–1.8& greater than the meand13CEC values, whereas, in the modern shells, the d13C val-ues fall within the range of the d13CEC values. Yamamotoet al. (2010b) showed that ontogenetic d13C values from liv-ing B. lucida collected in 2005 at a water depth of !200 moff Amami-o-shima are identical to the d13CEC values atthat site.
Taking into account narrow ranges in d13CDIC values(1r = ±0.4&) and pH (1r = ±0.05) within the water-depthrange of the brachiopod-collection sites off Okinawa-jima(Fig. 3 and Table 3), as well as the small intraspecific vari-ations in the shell d13C exhibited by modern shells(2.07 ± 0.30& [OK6] and 2.00 ± 0.22& [OK7]; Fig. 5),our data suggest a significant decrease in d13CDIC values(!1.1–1.6&) at the sites after 1945.
The atmospheric d13CCO2data obtained from
Antarctic ice core and firn samples by Francey et al.(1999) indicate its decrease by 1.5& for the last 300 years(A.D. 1700–2000). The decrease began to accelerate inthe early to mid-20th century (!"0.019&/year in the sec-ond half of the 20th century; !"0.030&/yearr between1960 and 1990). Comparable decreases are known fromdirect measurements of atmospheric d13CCO2
(e.g. Keeling,2005). Such rapid changes in the d13C values after theIndustrial Revolution are attributable to the addition ofanthropogenically derived CO2 (depleted in 13C) to theatmosphere, known as the 13C Suess effect (Druffel andBenavides, 1986). This effect is evident in seawaterd13CDIC (Quay et al., 2003) and skeletal carbonate d13C(e.g. Bohm et al., 1996; Quinn et al., 1998; Asamiet al., 2005; Swart et al., 2010; Dassie et al., 2013) re-cords. The latter indicates the decrease begins to acceler-
ate at the sea surface in the mid-20th century. Therefore,the B. lucida shells examined in this study show that theaccelerating decrease in seawater d13CDIC values even oc-curs at water depths of !200–300 m off Okinawa-jima.The d13C values from living B. lucida off Amami-o-shima(2.22 ± 0.24&; Yamamoto et al., 2010b) are nearly equalto those off Okinawa-jima (Fig. 5), suggesting that seawa-ter with DIC depleted in 13C to an equal degree is dis-tributed in such a water-depth range throughout thecentral Ryukyu Islands. Taking into account a long-termdecreasing trend in pH (0.01–0.02 pH unit per decade) insurface waters in subtropical to equatorial regions (alonglongitude 137!E) in the western North Pacific Ocean(Midorikawa et al., 2010), the changes in the carbonatesystem producing ocean acidification extend down tothe upper bathyal zone. The oceanic 13C Suess effecthas high spatial variability (Quay et al., 1992) becausea rate of gas exchange between the atmosphere and theocean (Wanninkhof and McGillis, 1999) and bufferingcapacity of seawater (Revelle factor; Revelle and Suess,1957; Zeebe and Wolf-Gladrow, 2001) are location-dependent. Therefore, further investigations are neededto evaluate influence of the 13C Suess effect to oceans.Brachiopods from a shelf to shelf slope environment(including B. lucida) are expected to provide invaluabled13CDIC data, which are essential to estimate the oceanicSuess effect, from relatively deeper sites where shallow-water carbonate producers, such as corals, cannotinhabit.
The nine B. lucida shells show similar ontogeneticd13C profiles, with no significant seasonal variations.The two modern specimens, which were collected at com-parable water depths (OK6 and OK7 collected at 269 and273 m water depths, respectively), have similar d13C pro-files and values that are identical to those of d13CEC,
Table 6AMS 14C ages for two modern (OK6 and OK7) and seven older (OK1–5, OK8, and OK9) specimens of B. lucida.
Sample No. Site No. Waterdepth (m)
LaboratoryNo.
Conventional radiocarbonage (years BP, 1r)
Calibrated ageranges (cal BP, 2r)(DR = 23 ± 40 years)
OK1 GH09-KG365
211 NZA-36676 444 ± 25 147–5
OK2 GH09-KG274
217 PLD-19353 450 ± 15 146–5
OK3 GH09-KG327
252 NZA-36677 597 ± 25 305–57
OK4 GH09-KG358
253 NZA-36678 502 ± 25 230–5
OK5 GH09-KG281
268 NZA-36679 553 ± 30 266–45
OK6 GH09-KG321
269 NZA-36680 "693 ± 15 Modern
OK7 GH09-KG341
275 PLD-19356 "575 ± 15 Modern
OK8 GH09-KG193
310 NZA-36681 692 ± 15 430–242
OK9 GH09-KG313
317 NZA-36682 2124 ± 15 1804–1557
126 H. Takayanagi et al. / Geochimica et Cosmochimica Acta 115 (2013) 115–136
which was also reported in a living specimen (Yamamotoet al., 2010b). Therefore, the ontogenetic d13C values ofthis species are a useful proxy for seawater d13CDIC
values.A typical d13C profile consists of an initial increase
(up to !0.6&; within 0.9 mm from the posterior shelledge), a prolonged period of stable values, and a final de-crease (up to !0.9&; within 7 mm from the anterior shelledge). The initial increase was not reported from the liv-ing material (Yamamoto et al., 2010b), which can beattributed to the low-resolution sampling performed nearthe posterior shell edge. There is no statistically signifi-cant relationship (p > 0.05) between shell size and theontogenetic d13C decrease. Distinct ontogenetic decreasesin shell d13C values were noted in some bivalves (Krantzet al., 1987; Kennedy et al., 2001; Keller et al., 2002; El-liot et al., 2003; Lorrain et al., 2004). Lorrain et al.(2004) proposed a simple model in which the ontogeneticdecrease in d13C values is caused by an increase in theamount of respiratory CO2 produced by the bivalve. Thismodel is based on the relationship between metabolic rateand body size. As mollusks grow, more metabolic CO2 isavailable, whereas the amount needed for shell growth isreduced, resulting in more metabolic carbon (12C-en-riched) being incorporated into the shell. Further studiesare needed to elucidate whether this model is applicableto brachiopod species showing the ontogenetic decreases:Kikaithyris hanzawai (Yamamoto et al., 2010b), C. japon-ica (Takayanagi et al., 2012), Terebratalia coreanica(Yamamoto et al., 2013), and B. lucida (Yamamotoet al., 2010b; this study).
4.2. Intraspecific variation in d18O values
Reconstructions of Northern Hemisphere sea surfacetemperatures suggest that the annual mean temperaturevaried within a relatively narrow range (±0.2 !C) duringthe past 2000 years, with the exception of the last!100 years (Rutherford et al., 2005; Ljungqvist, 2010).According to the Web site of the Japan MeteorologicalAgency (http://www.data.kishou.go.jp/db/nagasaki/naga-saki_warm/nagasaki_warm_areaB.html), the annual meansea surface temperature increased by 1.12 ± 0.18 !Caround Okinawa-jima from 1901 to 2011, which corre-sponds to a decrease in d18OEC values of 0.26 ± 0.04&based on the calcite–water oxygen-isotope fractionation(–0.23&/!C;Friedman and O’Neil, 1977). However, thechanges in seawater temperature at water depths of!200–300 m off Okinawa-jima during the same periodare expected to be smaller than the changes in sea surfacetemperatures, because the mean ontogenetic d18O valuesof older brachiopod shells (0.35 ± 0.08&) are identicalto those of modern shells (0.31 ± 0.12&), which wereboth collected at !250 m water depth (Fig. 6). Therefore,we consider that there have been very minimal changes inthe d18OEC values at the brachiopod-collection sites(!200–300 m) off Okinawa-jima during the past2000 years.
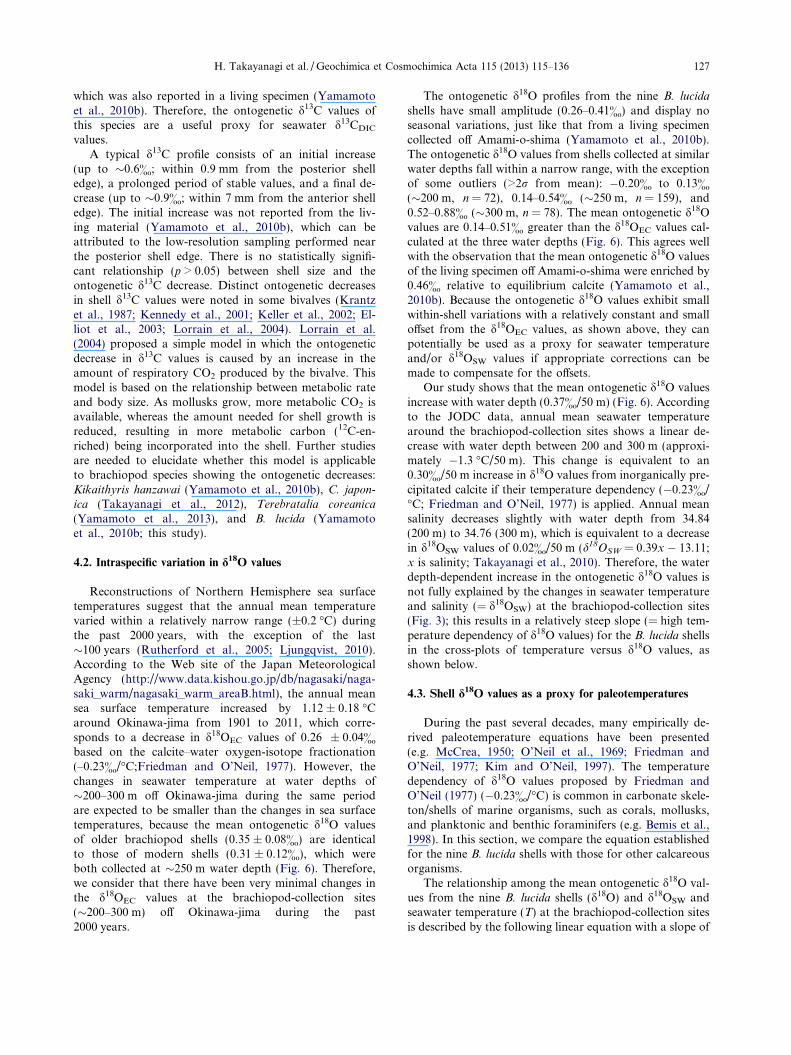
The ontogenetic d18O profiles from the nine B. lucidashells have small amplitude (0.26–0.41&) and display noseasonal variations, just like that from a living specimencollected off Amami-o-shima (Yamamoto et al., 2010b).The ontogenetic d18O values from shells collected at similarwater depths fall within a narrow range, with the exceptionof some outliers (>2r from mean): "0.20& to 0.13&(!200 m, n = 72), 0.14–0.54& (!250 m, n = 159), and0.52–0.88& (!300 m, n = 78). The mean ontogenetic d18Ovalues are 0.14–0.51& greater than the d18OEC values cal-culated at the three water depths (Fig. 6). This agrees wellwith the observation that the mean ontogenetic d18O valuesof the living specimen off Amami-o-shima were enriched by0.46& relative to equilibrium calcite (Yamamoto et al.,2010b). Because the ontogenetic d18O values exhibit smallwithin-shell variations with a relatively constant and smalloffset from the d18OEC values, as shown above, they canpotentially be used as a proxy for seawater temperatureand/or d18OSW values if appropriate corrections can bemade to compensate for the offsets.
Our study shows that the mean ontogenetic d18O valuesincrease with water depth (0.37&/50 m) (Fig. 6). Accordingto the JODC data, annual mean seawater temperaturearound the brachiopod-collection sites shows a linear de-crease with water depth between 200 and 300 m (approxi-mately "1.3 !C/50 m). This change is equivalent to an0.30&/50 m increase in d18O values from inorganically pre-cipitated calcite if their temperature dependency ("0.23&/!C; Friedman and O’Neil, 1977) is applied. Annual meansalinity decreases slightly with water depth from 34.84(200 m) to 34.76 (300 m), which is equivalent to a decreasein d18OSW values of 0.02&/50 m (d18OSW = 0.39x " 13.11;x is salinity; Takayanagi et al., 2010). Therefore, the waterdepth-dependent increase in the ontogenetic d18O values isnot fully explained by the changes in seawater temperatureand salinity (= d18OSW) at the brachiopod-collection sites(Fig. 3); this results in a relatively steep slope (= high tem-perature dependency of d18O values) for the B. lucida shellsin the cross-plots of temperature versus d18O values, asshown below.
4.3. Shell d18O values as a proxy for paleotemperatures
During the past several decades, many empirically de-rived paleotemperature equations have been presented(e.g. McCrea, 1950; O’Neil et al., 1969; Friedman andO’Neil, 1977; Kim and O’Neil, 1997). The temperaturedependency of d18O values proposed by Friedman andO’Neil (1977) ("0.23&/!C) is common in carbonate skele-ton/shells of marine organisms, such as corals, mollusks,and planktonic and benthic foraminifers (e.g. Bemis et al.,1998). In this section, we compare the equation establishedfor the nine B. lucida shells with those for other calcareousorganisms.
The relationship among the mean ontogenetic d18O val-ues from the nine B. lucida shells (d18O) and d18OSW andseawater temperature (T) at the brachiopod-collection sitesis described by the following linear equation with a slope of
H. Takayanagi et al. / Geochimica et Cosmochimica Acta 115 (2013) 115–136 127

"3.27, indicating a temperature dependency of "0.31&/!C(Fig. 8).
T ð$CÞ ¼ 18:51" 3:27ðd18O" d18OSW Þ; R2 ¼ 0:88; n
¼ 9; p < 0:01:
The unit of measure for both d18O and d18OSW is &VPDB.We followed Craig (1965) for the relationship betweend18OSW (VPDB) and d18OSW (VSMOW): d18OSW (VPDB) =d18OSW (VSMOW) " 0.20&. The standard error for thisequation is ±0.3 !C (1r). The equation established in thisstudy has a steeper slope than those in previous studies:"0.15& to "0.20&/!C for corals (Wellington and Dunber,1995; Quinn et al., 1996; Abe et al, 1998; Asami et al.,2004), "0.23& to "0.26&/!C for giant clams (Aharon,1983; Aharon and Chappell, 1986; Watanabe and Oba,1999), "0.17& to "0.21&/!C for mollusks (Craig, 1965;Horibe and Oba, 1972; Grossman and Ku, 1986), "0.20&to "0.21&/!C for planktonic foraminifers (Erez and Luz,1983; Bouvier-Soumagnac and Duplessy, 1985;Bemis et al., 1998), and"0.25&/!C for benthic foraminifers(Shackleton, 1974) (Fig. 9). However, the equationfor a giant clam, Hippopus hippopus, has a slope ("0.35&/!C; Aubert et al., 2009) similar to that established for B.lucida.
The steep slope for B. lucida ("0.31&/!C) indicates thatunknown factor(s), in addition to the fractionation betweeninorganically precipitated calcite and water ("0.23&/!C),affect the temperature–d18O relationship and that such fac-tor(s) should be negatively temperature dependent (see dis-cussion below).
4.4. Biological fractionation effects
The cross-plots of the ontogenetic d13C versus d18O val-ues display a positive correlation (r = 0.53 and 0.60 forOK6 and OK9, respectively; p < 0.01) or no correlation at
a significance level of <0.01 (Table 5). The shell of livingB. lucida off Amami-o-shima also showed a positive corre-lation (r = 0.75; Yamamoto et al., 2010b). The positive cor-relations of the ontogenetic d13C versus d18O values are alsoknown from other species: K. hanzawai (r = 0.99 and 0.85for the second and third growth stages, respectively), Laqu-eus rubellus (r = 0.65), Terebratalia transversa (r = 0.90), T.coreanica (r = 0.70), and Terebratulina crossei (r = 0.79)(Auclair et al., 2003; Yamamoto et al., 2010a,b, 2013).
This positive correlation of d13C and d18O values frombiogenic carbonates can be ascribed to the kinetic iso-tope-fractionation effect. The kinetic isotope effect is mostprominent in rapidly calcifying organisms and in rapidlygrowing parts of the skeleton (McConnaughey, 1989a,b;McConnaughey et al., 1997). This effect increases the incor-poration of 12C and 16O into the skeleton, resulting in a po-sitive correlation between its d13C and d18O values. In thismodel, d18O values of the portions with slow growth rates(higher d13C- and d18O-value end-members on the cross-plots) must be equivalent or very similar to those of equilib-rium calcite. However, all of the ontogenetic samples fromB. lucida shells off Okinawa-jima, as well as Amami-o-shi-ma, are enriched in 18O compared with equilibrium calcite.Therefore, such enrichment cannot be explained by the ki-netic effect. Although the process causing such disequilib-rium is unknown, the resultant fractionation effect is
-0.1 0 0.1 0.2 0.3 0.4 0.5 0.6 0.7
OK8 (310 m)
OK1 (211 m)
OK9 (315 m)OK5 (268 m)OK4 (253 m)
OK6 (269 m)OK7 (275 m)
OK3 (252 m)OK2 (217 m)
15
16
17
18
19
20
T (ºC) = 18.51− 3.27( 18O - 18OSW)R2 = 0.88 (n = 9, p < 0.01)
Seaw
ater
tem
pera
ture
(ºC
)
δ18O - δ18OSW (‰ VPDB)-0.2
Fig. 8. Relationship between brachiopod (B. lucida) shell d18O –d18OSW values (±1r) and seawater temperature. Dashed linerepresents 95% confidence intervals.
This study
F H
I J
K
E G
OP
A CD B
L
M
N
δ18O
- δ18
OSW
(‰ V
PDB)
Seawater temperature (ºC)
-0.5
-1.5026151
-1.0
0
0.5
1.0
17 18 19
1.5
2.0
Fig. 9. Comparison of seawater temperature–d18O relationships ofB. lucida (this study; with 95% confidence interval) and publishedpaleotemperature equations: A, Epstein et al. (1953); B, Craig(1965); C, Horibe and Oba (1972); D, Shackleton (1974); E and F,Bouvier-Soumagnac and Duplessy (1985); G–K, Bemis et al.(1998); L, Aharon (1983); M, Watanabe and Oba (1999); N, Aubertet al. (2009); O, McCrea (1950); and P, O’Neil et al. (1969). A–C(red), mollusk; D (black), benthic foraminifer; E–K (blue), plank-tonic foraminifer; L–N (green), giant clams; O–P (purple),inorganic calcite. (For interpretation of the references to color inthis figure legend, the reader is referred to the web version of thisarticle.)
128 H. Takayanagi et al. / Geochimica et Cosmochimica Acta 115 (2013) 115–136

temperature dependent, because offsets in mean shell d18Ovalues from the d18OEC values increase with water depth(decrease with water temperature) (Fig. 6). It was reportedthat brachiopod shells are precipitated from an internalfluid with varying pH (Hughes et al., 1988) and that pHcan affect d13C and d18O values of skeletal carbonates(Zhang et al., 1995; Rollion-Bard et al., 2003). However,the effect of pH on brachiopod d13C and d18O values is un-known. Therefore, further studies are needed to clarify thisrelationship.
4.5. d13C and d18O values of B. lucida shells aspaleoceanographic proxies
Because ontogenetic d13C values from the two modernB. lucida shells (OK6 and OK7) are very similar (=smallintraspecific variations) and fall completely within the rangeof d13CEC values, they can be used as a proxy for thed13CDIC values of ancient oceans. If samples are collectedalong the entire ontogenetic transect, the d13C values(=mean d13C values; 2.07& [OK6] and 2.00& [OK7]) aresimilar to mean d13CEC values (1.75&).
The ontogenetic d18O values shows small within-shelland intraspecific variation and exhibit small, nearly con-stant offsets from the d18OEC values. If samples are col-lected along the entire ontogenetic transect, thedifference between the mean ontogenetic d18O valuesand the mean d18OEC values is 0.34–0.39&, 0.37–0.55&, and 0.65–0.66& at !200, !250, and !300 mwater depths, respectively, yielding an annual mean sea-water temperature that is biased toward cooler valuesby !1.7, !2.4, and !2.9 !C or mean salinity that isbiased toward higher values by !0.6, !0.8, and !1.0.Therefore, the values can be used as proxies for seawatertemperature and d18OSW after correction of the offsetsfrom the d18OEC values. Because the within-shell varia-tions in the ontogenetic d18O values are minimal, evensmall fragments are useful for reconstructing seawatertemperature and salinity.
The fossil Basiliola occurs from the Cretaceous onward(Williams et al., 2002). If we can collect specimens that havenot been diagenetically altered and if we analyze d13C andd18O values of samples from the appropriate portions ofthe shell, it will be possible to reconstruct paleoceanograph-ic conditions with greater accuracy.
5. SUMMARY
This study elucidated the intraspecific variation in d13Cand d18O values of a tropical to subtropical brachiopod spe-cies (B. lucida) based on nine specimens collected at waterdepths of !200–300 m off Okinawa-jima, southwestern Ja-pan. The results of this study are summarized as follows.
(1) Based on the AMS 14C ages and ontogenetic d13Cvalues, the nine specimens are divided into twogroups: two modern specimens with lower d13C val-
ues and seven older specimens with mean d13C valuesthat are !1.1–1.6& greater than the modern speci-mens. This contrast indicates that a decrease in sea-water d13CDIC values, which has been driven by theanthropogenic addition of 12CO2 to the oceans (13CSuess effect), occurs even at water depths of !200–300 off Okinawa-jima.
(2) The ontogenetic profiles of d13C and d18O valuesshow no seasonal changes and small intraspecificvariations. The d13C values of the two modernspecimens fall within the range of d13CEC values.Each d13C profile consists of three stages: an initialincrease, a prolonged period of stable values, and afinal decrease. The d18O values show small within-shell variations. The shells collected at comparablewater depths have similar d18O values, with small,nearly constant offsets from the d18OEC values.The ontogenetic d13C and d18O values areexpected to serve as an excellent data source forreconstructing the isotopic composition of ancientoceans.
(3) A linear relationship was established between seawa-ter temperature at brachiopod-collection sites and themean ontogenetic d18O values. The slope of theregression line for this species ("0.31&/!C) was stee-per than those for inorganic calcite, corals, plank-tonic and benthic foraminifers, giant clams, andmollusks ("0.15& to "0.26&/!C).
(4) Cross-plots of the ontogenetic d13C and d18O val-ues display positive relationships; however, morecommonly they do not show statistically significantrelationships. All of the ontogenetic samples areenriched in 18O compared with equilibrium calcite.These cannot be explained by the kinetic effect andsuggest the existence of an unknown factor in car-bon-isotope and oxygen-isotope fractionationduring the precipitation of shell calcite of thisspecies.
ACKNOWLEDGMENTS
We are most grateful to K. Arai and T. Itaki (AIST/GSJ) forproviding specimens of B. lucida collected during the GH09 cruiseof the R/V Daini Hakurei-maru. Special thanks are due to K. Endo(Graduate School of Science, University of Tokyo) for taxonomicidentification of brachiopod specimens and for providing usefulinformation on modern brachiopods in Japan. Deep appreciationis expressed to Y. Tsuji, K. Ariyoshi, and E. Shinbo (JOGMEC/TRC) for their assistance with the d18OSW measurements. This re-search was financially supported, in part, by a research fellowshipfrom the Japan Society for the Promotion of Science (to H.T.), aGrant-in-Aid for Scientific Research from the Japan Society forthe Promotion of Science (21340152 to Y.I.), and the Rising StarProgram for Subtropical Island Sciences, University of the Ryu-kyus (to R.A.). The manuscript was significantly improved by thecomments and suggestions of Y. Rosenthal and two anonymousreviewers.
H. Takayanagi et al. / Geochimica et Cosmochimica Acta 115 (2013) 115–136 129

APPENDIX A.
Distance from theposterior shell edge (mm)
d13C (& VPDB) d18O (& VPDB) Distance from theposterior shell edge (mm)
d13C (& VPDB) d18O (& VPDB)
OK1 (GH09-KG365)0.10 2.98 0.07 5.08 3.31 0.360.50 3.40 0.07 5.38 3.31 0.330.90 3.50 0.13 5.68 3.34 0.461.30 3.43 0.04 5.98 3.35 0.341.70 3.50 0.05 6.28 3.31 0.262.08 3.41 "0.13 6.58 3.35 0.272.38 3.43 "0.07 6.88 3.34 0.312.68 3.44 "0.16 7.18 3.31 0.272.98 3.51 "0.04 7.48 3.38 0.313.28 3.57 "0.06 7.78 3.38 0.283.58 3.58 "0.07 8.08 3.39 0.253.88 3.62 "0.04 8.38 3.30 0.234.18 3.54 "0.11 8.68 3.41 0.144.48 3.59 "0.04 8.98 3.35 0.294.78 3.53 "0.11 9.28 3.37 0.215.08 3.51 "0.09 9.58 3.39 0.245.40 3.53 "0.04 9.88 3.35 0.215.72 3.50 "0.07 10.18 3.34 0.316.04 3.50 "0.07 OK6 (GH09-KG321)6.36 3.47 "0.12 0.15 2.16 0.546.75 3.40 "0.05 0.75 2.35 0.497.35 3.38 "0.09 1.35 2.33 0.507.95 3.28 "0.05 1.95 2.35 0.588.31 3.29 0.00 2.50 2.31 0.368.59 3.32 0.01 2.89 2.28 0.398.90 3.29 0.08 3.23 2.26 0.449.30 3.34 0.04 3.57 2.30 0.449.70 3.35 0.07 3.91 2.28 0.3810.10 3.33 0.06 4.25 2.28 0.3510.50 3.33 0.09 4.60 2.29 0.4610.90 3.34 0.07 5.00 2.23 0.4411.30 3.37 0.06 5.40 2.28 0.4011.70 3.04 0.04 5.80 2.24 0.3612.55 3.13 0.06 6.20 2.24 0.3913.43 3.21 "0.03 6.60 2.23 0.4713.93 3.29 0.01 7.03 2.21 0.4514.42 3.10 "0.04 7.53 2.13 0.3714.90 3.01 "0.04 8.03 2.06 0.3715.38 2.77 0.03 8.52 1.98 0.40
8.76 1.99 0.41OK2 (GH09-KG274) 9.13 1.99 0.350.15 2.60 0.15 9.62 1.89 0.420.60 3.20 "0.06 10.11 1.50 0.401.00 3.20 "0.08 10.60 1.48 0.331.40 3.35 "0.16 11.09 1.94 0.301.80 3.34 "0.09 11.53 1.58 0.212.18 3.36 "0.02 11.92 1.52 0.292.50 3.26 "0.05 12.31 1.37 0.412.82 3.22 "0.033.14 3.21 "0.04 OK7 (GH09-KG341)3.46 3.13 "0.02 0.10 1.48 0.243.78 3.13 "0.05 0.50 1.80 0.384.38 3.12 "0.03 0.90 1.76 0.314.98 3.19 "0.01 1.30 2.11 0.295.28 3.16 "0.06 1.70 2.12 0.315.88 3.10 "0.19 2.10 2.08 0.206.03 3.15 "0.12 2.50 2.06 0.296.18 3.16 "0.04 2.90 2.10 0.146.33 3.16 "0.12 3.30 2.10 0.23
130 H. Takayanagi et al. / Geochimica et Cosmochimica Acta 115 (2013) 115–136

Appendix A. (continued)
Distance from theposterior shell edge (mm)
d13C (& VPDB) d18O (& VPDB) Distance from theposterior shell edge (mm)
d13C (& VPDB) d18O (& VPDB)
6.78 3.16 "0.10 3.70 2.05 0.116.93 3.14 "0.20 4.10 2.10 0.217.08 3.15 "0.18 4.50 2.08 0.227.23 3.14 "0.23 4.90 2.06 0.297.38 3.24 0.05 5.30 2.07 0.237.68 3.24 "0.10 5.70 2.05 0.237.98 3.24 "0.14 6.10 2.05 0.177.83 3.22 "0.18 6.50 2.10 0.218.13 3.26 "0.10 6.90 2.14 0.258.28 3.23 "0.06 7.30 2.17 0.308.43 3.23 "0.09 7.55 2.16 0.308.58 3.28 0.03 7.85 2.16 0.229.45 3.30 0.09 8.15 2.13 0.2210.15 3.33 0.05 8.55 2.13 0.1811.90 3.04 0.05 9.05 2.02 0.09
9.80 1.91 0.02OK3 (GH09-KG358) 11.05 1.61 0.030.20 3.09 0.51 12.80 2.00 0.230.88 3.35 0.43 13.90 1.23 0.141.18 3.33 0.391.48 3.33 0.39 OK8 (GH09-KG193)1.78 3.33 0.24 0.13 3.21 0.812.10 3.40 0.43 0.58 3.59 0.682.50 3.41 0.35 0.88 3.52 0.722.90 3.39 0.40 1.18 3.62 0.743.30 3.38 0.26 1.48 3.48 0.633.70 3.36 0.29 1.78 3.58 0.644.09 3.32 0.27 2.08 3.61 0.654.43 3.27 0.29 2.38 3.44 0.524.78 3.28 0.30 2.68 3.53 0.625.18 3.28 0.31 2.98 3.48 0.565.58 3.24 0.35 3.27 3.51 0.565.97 3.25 0.37 3.55 3.45 0.626.33 3.26 0.39 3.84 3.49 0.616.69 3.26 0.37 4.16 3.45 0.627.05 3.27 0.34 4.49 3.50 0.667.41 3.26 0.29 4.79 3.49 0.687.78 3.27 0.39 5.07 3.51 0.638.18 3.31 0.40 5.35 3.42 0.688.58 3.29 0.38 5.63 3.47 0.728.98 3.29 0.38 5.91 3.50 0.769.38 3.32 0.36 6.20 3.49 0.759.80 3.38 0.37 6.52 3.51 0.7810.26 3.37 0.37 6.84 3.54 0.8110.72 3.35 0.32 7.16 3.58 0.8111.18 3.32 0.34 7.48 3.58 0.7811.64 3.19 0.25 7.81 3.56 0.7412.12 3.13 0.30 8.15 3.58 0.7812.68 3.09 0.31 8.49 3.60 0.7913.24 3.07 0.37 8.83 3.58 0.7713.80 3.14 0.44 9.17 3.61 0.8014.36 2.88 0.37 9.51 3.60 0.73
9.85 3.62 0.77OK4 (GH09-KG327) 10.19 3.60 0.770.18 3.20 0.49 10.53 3.61 0.710.83 3.67 0.52 10.87 3.61 0.721.33 3.68 0.41 11.21 3.55 0.651.83 3.70 0.40 11.55 3.54 0.672.33 3.72 0.31 11.89 3.51 0.692.80 3.70 0.29 12.23 3.65 0.753.20 3.70 0.30 12.57 3.57 0.673.60 3.71 0.29 12.98 3.37 0.63
H. Takayanagi et al. / Geochimica et Cosmochimica Acta 115 (2013) 115–136 131
REFERENCES
Abe O., Matsumoto E. and Isdale P. (1998) Paleo-SST reconstruc-tion during the last two centuries by Ishigaki coral, Japan. InProceedings of the Third International Marine Science Sympo-sium (eds. P. M. Thieux and F. T. Frough). CambridgeUniversity Press, Cambridge, pp. 8–14.
Aharon P. (1983) 140,000-year isotope climatic record from raisedcoral reefs in New Guinea. Nature 304, 720–723.
Aharon P. and Chappell J. (1986) Oxygen isotopes, sea levelchanges and the temperature history of a coral reef environmentin New Guinea over the last 105 years. Palaeogeogr. Palaeo-climatol. Palaeoecol. 56, 337–379.
Amano A., Itaki T. and Katayama H. (2011) Oceanographiccondition in the southwest off the Okinawa Island. In MarineGeological and Geophysical Studies around Okinawa Islands –
Western Off of Okinawa Island, Preliminary Reports onResearches in the 2010 Fiscal Year, GSJ Interim Report, vol.55 (ed. K. Arai). Geol. Surv. Jpn., Natl. Inst. Adv. Ind. Sci.Technol., Tsukuba, pp. 68–75.
Asami R., Yamada T., Iryu Y., Meyer C. P., Quinn T. M. and PaulayG. (2004) Carbon and oxygen isotopic composition of a Guam coraland their relationships to environmental variables in the westernPacific. Palaeogeogr. Palaeoclimatol. Palaeoecol. 212, 1–22.
Asami R., Yamada T., Iryu Y., Quinn T. M., Meyer C. P. andPaulay G. (2005) Interannual and decadal variability of theWestern Pacific Sea surface condition for the years 1787–2000:reconstruction based on stable isotope record from a Guamcoral. J. Geophy. Res. Oceans 110(C5). http://dx.doi.org/10.1029/2004JC002555.
Asami R., Felis T., Deschamps P., Hanawa K., Iryu Y., Bard E.,Durand N. and Murayama M. (2009) Evidence for tropical
Appendix A. (continued)
Distance from theposterior shell edge (mm)
d13C (& VPDB) d18O (& VPDB) Distance from theposterior shell edge (mm)
d13C (& VPDB) d18O (& VPDB)
4.00 3.63 0.26 13.72 3.13 0.584.40 3.62 0.264.78 3.58 0.29 OK9 (GH09-KG313)5.10 3.53 0.34 0.15 3.10 0.915.42 3.53 0.29 0.75 3.27 0.855.74 3.50 0.32 1.20 3.27 0.816.06 3.51 0.31 1.60 3.25 0.876.40 3.51 0.34 2.00 3.22 0.886.80 3.53 0.36 2.40 3.26 0.827.20 3.50 0.37 2.80 3.22 0.907.60 3.56 0.39 3.20 3.20 0.848.00 3.57 0.38 3.60 3.25 0.838.38 3.54 0.41 4.00 3.25 0.818.68 3.55 0.36 4.38 3.27 0.839.03 3.56 0.32 4.68 3.24 0.829.28 3.57 0.36 4.98 3.28 0.779.53 3.55 0.45 5.28 3.29 0.769.78 3.51 0.46 5.58 3.32 0.7310.03 3.54 0.46 5.91 3.31 0.7310.28 3.53 0.46 6.27 3.29 0.7410.55 3.54 0.47 6.63 3.29 0.6210.85 3.51 0.48 6.99 3.27 0.6511.15 3.48 0.45 7.35 3.23 0.6311.45 3.47 0.46 7.53 3.15 0.6011.75 3.53 0.37 7.78 3.06 0.6112.05 3.44 0.29 8.09 3.19 0.6112.30 3.37 0.36 8.40 3.13 0.65
8.71 3.10 0.58OK5 (GH09-KG281) 9.02 3.16 0.620.15 3.00 0.48 9.33 3.08 0.650.73 3.29 0.24 9.64 2.99 0.640.98 3.11 0.26 9.95 2.86 0.651.23 3.37 0.26 10.26 3.06 0.621.73 3.38 0.32 10.57 3.06 0.672.23 3.38 0.35 10.93 2.96 0.592.68 3.30 0.35 11.34 3.02 0.622.98 3.40 0.34 11.75 2.93 0.563.28 3.28 0.45 12.11 2.91 0.633.58 3.30 0.46 12.52 2.97 0.503.88 3.26 0.444.18 3.29 0.394.48 3.33 0.454.78 3.30 0.41
132 H. Takayanagi et al. / Geochimica et Cosmochimica Acta 115 (2013) 115–136

South Pacific climate change during the Younger Dryas and theBølling–Allerød from geochemical records of fossil Tahiticorals. Earth Planet. Sci. Lett. 288, 96–107.
Aubert A., Lazareth C. E., Cabioch G., Boucher H., Yamada T.,Iryu Y. and Farman R. (2009) The tropical giant clam Hippopushippopus shell, a new archive of environmental conditions asrevealed by sclerochronological and d18O profiles. Coral Reefs28, 989–998.
Auclair A., Joachimski M. M. and Lecuyer C. (2003) Decipheringkinetic, metabolic and environmental controls on stable isotopefractionations between seawater and the shell of Terebrataliatransversa (Brachiopoda). Chem. Geol. 202, 59–78.
Bates N. R. and Brand U. (1991) Environmental and physiologicalinfluences on isotopic and elemental composition of brachiopodshell calcite: implications for the isotopic evolution of Paleozoicoceans. Chem. Geol. 94, 67–78.
Bemis B. E., Spero H. J., Bijma J. and Lea D. W. (1998)Reevaluation of the oxygen isotopic composition of planktonicforaminifera: experimental results and revised paleotempera-ture equations. Paleoceanography 13, 150–160.
Bitner M. A. (1996) Brachiopods from the Eocene La MesataFormation of Seymour Island, Antarctic Peninsula. Palaeontol.Pol. 55, 65–100.
Bitner M. A. (2008) New data on the recent brachiopods from theFiji and Wallis and Futuna Islands, South-West Pacific.Zoosystema 30, 419–461.
Bitner M. A. (2010) Biodiversity of shallow-water brachiopodsfrom New Caledonia, SW Pacific, with description of a newspecies. Sci. Mar. 74, 643–657.
Bohm F., Joachimski M. M., Lehnert H., Morgenroth G.,Kretschmer W., Vacelet J. and Dullo W. (1996) Carbon isotoperecords from extant Caribbean and South Pacific sponges:evolution of d13C in surface water DIC. Earth Planet. Sci. Lett.139, 291–303.
Bouvier-Soumagnac Y. and Duplessy J.-C. (1985) Carbon andoxygen isotopic composition of planktonic foraminifera fromlaboratory culture, plankton tows and recent sediment: impli-cations for the reconstruction of paleoclimatic conditions andof the global carbon cycle. J. Foramin. Res. 15, 302–320.
Brand U. (1989a) Biogeochemistry of late Paleozoic Americanbrachiopods and secular variation of seawater composition.Biogeochemistry 7, 159–193.
Brand U. (1989b) Global climatic change during the Devonian–Mississippian: stable isotope biogeochemistry of brachiopods.Palaeogeogr. Palaeoclimatol. Palaeoecol. 75, 311–329.
Brand U., Logan A., Hiller N. and Richardson J. (2003)Geochemistry of modern brachiopods: applications and impli-cations for oceanography and paleoceanography. Chem. Geol.198, 305–334.
Carpenter S. J. and Lohmann K. C. (1995) d18O and d13C valuesfrom modern brachiopod shells. Geochim. Cosmochim. Acta 59,3749–3764.
Cooper G. A. (1957) Tertiary and Pleistocene brachiopods ofOkinawa, Ryukyu Islands. US Geol. Surv. Prof. Pap. 314A, 1–20.
Cooper G. A. (1978) Tertiary and Quaternary brachiopodsfrom the Southwest Pacific. Smithson. Contrib. Paleobiol. 38,1–23.
Cooper G. A. (1981) Brachiopoda from the southern Indian Ocean(recent). Smithson. Contrib. Paleobiol. 43, 1–93.
Craig H. (1965) The measurement of oxygen isotope paleotemper-atures. In Stable Isotopes in Oceanographic Studies and Paleo-temperatures (ed. E. Tongiorgi). Laboratorio di GeologiaNucleare, Pisa, pp. 161–182.
Craig R. S. (2000) The Cenozoic brachiopods of the CarnarvonBasin, Western Australia. Palaeontology 43, 111–152.
Curry G. B. and Fallick A. E. (2002) Use of stable oxygen isotopedeterminations from brachiopod shells in palaeoenvironmentalreconstruction. Palaeogeogr. Palaeoclimatol. Palaeoecol. 182,133–143.
Cusack M., Parkinson D., Perez-Huerta A., England J., Curry G.B. and Fallick A. E. (2008a) Relationship between d18O andminor element composition of Terebratalia transversa. EarthEnviron. Sci. Trans. Roy. Soc. Edinb. 98, 443–449.
Cusack M., Perez-Huerta A., Janousch M. and Finch A. A.(2008b) Magnesium in the lattice of calcite-shelled brachiopods.Chem. Geol. 257, 59–64.
Cusack M., Perez-Huerta A. and EIMF (2012) Analyzed high-resolution d18O composition of inner surface of brachiopodshells using SIMS. Chem. Geol. 334, 139–143.
Dall W. H. (1908) Reports on the dredging operations off the west coastof Central America to the Galapagos, to the west coast of Mexico,and in the Gulf of California, in charge of Alexander Agassiz,carried on by the U.S. Fish Commission Steamer Albatross during1891, Lieut. Commander Z. L. Tanner, U. S. N., Commanding, 37:Reports on the Scientific Results of the Expedition to the EasternTropical Pacific, in Charge of Alexander Agassiz, by the U. S. FishCommission Steamer Albatross from October, 1904 to March,1905, Lieut. Commander L. M. Garrett, U. S. N., Commanding, 14:The Mollusca and Brachiopoda. Bull. Mus. Comp. Zool. HarvardUniv. 43, 205–487.
Dassie E. O., Lemley G. M. and Linsley B. K. (2013) The Suesseffect in Fiji coral d13C and its potential as a tracer ofanthropogenic CO2 uptake. Palaeogeogr. Palaeoclimatol. Pal-aeoecol. 370, 30–40.
Dickens G. R., Castillo M. M. and Walker J. C. G. (1997) A blastof gas in the latest Paleocene: simulating first-order effects ofmassive dissociation of oceanic methane hydrate. Geology 25,259–262.
Druffel E. R. M. and Benavides L. M. (1986) Input of excess CO2
to the surface ocean based on C13/C12 ratios in a bandedJamaican sclerosponge. Nature 321, 58–61.
Elliot M., deMenocal P. B., Linsley B. K. and Howe S. S. (2003)Environmental controls on the stable isotopic composition ofMercenaria mercenaria: potential application to paleoenviron-mental studies. Geochem. Geophys. Geosyst. 4, 1056. http://dx.doi.org/10.1029/2002GC000425.
England J., Cusack M. and Lee M. R. (2007) Magnesium andsulphur in the calcite shells of two brachiopods, Terebratulinaretusa and Novocrania anomala. Lethaia 40, 2–10.
Epstein S. and Mayeda T. (1953) Variations in O18 contents ofwaters from natural sources. Geochim. Cosmochim. Acta 27,213–224.
Epstein S., Buchsbaum R., Lowenstam H. and Urey H. C. (1953)Revised carbonate–water isotopic temperature scale. Geol. Soc.Am. Bull. 64, 1315–1326.
Erez J. and Luz B. (1983) Experimental paleotemperature equationfor planktonic foraminifera. Geochim. Cosmochim. Acta 47,1025–1031.
Francey R. J., Allison C. E., Etheridge D. M., Trudinger C. M.,Enting I. G., Leuenberger M., Langenfelds R. L., Michel E. andSteele L. P. (1999) A 1000-year high precision record of d13C inatmospheric CO2. Tellus 53B, 170–193.
Friedman I. and O’Neil J. R. (1977) Compilation of stable isotopefractionation factors of geochemical interest. US Geol. Surv.Prof. Pap. 440, KK1–KK9.
Grossman E. L. (1984) Carbon isotopic fractionation in livebenthic foraminifera comparison with inorganic precipitatestudies. Geochim. Cosmochim. Acta 48, 1505–1512.
Grossman E. L. and Ku T. L. (1986) Oxygen and carbon isotopefractionation in biogenic aragonite: temperature effects. Chem.Geol. (Isotope Geosci. Sec.) 59, 59–74.
H. Takayanagi et al. / Geochimica et Cosmochimica Acta 115 (2013) 115–136 133
Grossman E. L., Zhang C. and Yancey T. E. (1991) Stable-isotopestratigraphy of brachiopods from Pennsylvanian shales inTexas. Geol. Soc. Am. Bull. 103, 953–965.
Hatai K. (1940) The Cenozoic Brachiopoda of Japan. Sci. Rep.Tohoku Imp. Univ., 2nd ser. (Geology) 20, 1–413.
Horibe Y. and Oba T. (1972) Temperature scales of aragonite–water and calcite–water systems. Fossils (Palaeontol. Soc. Jpn.)23/24, 69–79 (in Japanese with English abstract).
Hughes W. W., Rosenberg G. D. and Trachuck R. D. (1988)Growth increments in the shell of the living brachiopodTerebratalia transversa. Mar. Biol. Berl. 98, 511–518.
Kasting J. F., Howard M. T., Wallmann K., Veizer J., Shields G.and Jaffres J. (2006) Paleoclimates, ocean depth, and the oxygenisotopic composition of seawater. Earth Planet. Sci. Lett. 252,82–93.
Kato S., Katsura T. and Hirano K. (1982) Submarine geology offOkinawa Island. Rep. Hydrogr. Res., Japan Coast Guard 17, 31–70 (in Japanese with English abstract).
Keeling R. F. (2005) Comment on “The Ocean Sink for Anthro-pogenic CO2”. Science 308, 1743.
Keller N., Del Piero D. and Longinelli A. (2002) Isotopiccomposition, growth rates and biological behaviour of Cham-elea gallina and Callista chione from the Gulf of Trieste (Italy).Mar. Biol. 140, 9–15.
Kennedy H., Richardson C. A., Duarte C. M. and Kennedy D. P.(2001) Oxygen and carbon stable isotopic profiles of the fanmussel, Pinna nobilis, and reconstruction of sea surfacetemperatures in the Mediterranean. Mar. Biol. 139, 1115–1124.
Kim S.-T. and O’Neil J. R. (1997) Equilibrium and nonequilibriumoxygen isotope effects in synthetic carbonates. Geochim. Cos-mochim. Acta 61, 3461–3475.
Knoll A. H., Bambach R. K., Canfield D. E. and Grotzinger J. P.(1996) Comparative Earth history and late Permian massextinction. Science 273, 452–457.
Krantz D. E., Williams D. F. and Jones D. S. (1987) Ecological andpaleoenvironmental information using stable isotope profilesfrom living and fossil molluscs. Palaeogeogr. Palaeoclimatol.Palaeoecol. 58, 249–266.
Kump L. R. and Arthur M. A. (1999) Interpreting carbon-isotopeexcursions: carbonates and organic matter. Chem. Geol. 161,181–198.
Land L. S. (1995) Comment on “Oxygen and carbon isotopiccomposition of Ordovician brachiopods: Implications forcoeval seawater” by H. Qing and J. Veizer. Geochim. Cosmo-chim. Acta 59, 2843–2844.
Land L. S. and Lynch F. L. (1996) d18O of mudrocks: moreevidence for an 18O buffered ocean. Geochim. Cosmochim. Acta60, 3347–3352.
Land L. S. and Lynch F. L. (1999) Reply to “Comment on ‘d18Ovalues of mudrocks: More evidence for an 18O-buffered ocean’”.Geochim. Cosmochim. Acta 63, 2313.
Ljungqvist F. C. (2010) A new reconstruction of temperaturevariability in the extra-tropical Northern Hemisphereduring the last two millennia. Geogr. Ann. A: Phys. Geogr. 92,339–351.
Lorrain A., Paulet Y.-M., Chauvaud L., Dunbar R., MucciaroneD. and Fontugne M. (2004) d13C variation in scallop shells:increasing metabolic carbon contribution with body size?.Geochim. Cosmochim. Acta 68 3509–3519.
Lowenstam H. A. (1961) Mineralogy, O18/O16 ratios, and stron-tium and magnesium contents of recent and fossil brachiopodsand their bearing on the history of the oceans. J. Geol. 69, 241–260.
McConnaughey T. A. (1989a) 13C and 18O isotopic disequilibriumin biological carbonates: I. Patterns. Geochim. Cosmochim. Acta53, 151–162.
McConnaughey T. A. (1989b) 13C and 18O isotopic disequilibriumin biological carbonates: II. In vitro simulation of kineticisotope effects. Geochim. Cosmochim. Acta 53, 163–171.
McConnaughey T. A., Burdett J., Whelan J. F. and Paull C. K.(1997) Carbon isotopes in biological carbonates: respirationand photosynthesis. Geochim. Cosmochim. Acta 61, 611–622.
McCrea J. M. (1950) On the isotopic chemistry of carbonates and apaleotemperature scale. J. Chem. Phys. 18, 849–857.
Midorikawa T., Ishii M., Saito S., Sasano D., Kosugi N., Motoi T.,Kamiya H., Nakadate A., Nemoto K. and Inoue H. Y. (2010)Decreasing pH trend estimated from 25-yr time series ofcarbonate parameters in the western North Pacific. Tellus 62,649–659.
Miyajima T., Yamada Y., Hanba Y. and Yoshii K. (1995)Determining the stable isotope ratio of total dissolved inorganiccarbon in lake water by GC/C/IRMS. Limnol. Oceanogr. 40,994–1000.
Oba T. and Murayama M. (2004) Sea-surface temperature andsalinity changes in the northwest Pacific since the Last GlacialMaximum. J. Quatern. Sci. 18, 335–346.
Okai T., Suzuki A., Terashima S., Inoue M., Nohara M.,Kawahata H. and Imai N. (2004) Collaborative analysis ofGSJ/AIST geochemical reference materials JCp-1(Coral) andJCt-1(Giant Clam). Chikyu Kagaku 38, 281–286.
O’Neil J. R., Clayton R. N. and Mayeda T. K. (1969) Oxygenisotope fractionation in divalent metal carbonates. J. Chem.Phys. 51, 5547–5558.
Parkinson D., Curry G. B., Cusack M. and Fallick A. E. (2005)Shell structure, patterns and trends of oxygen and carbon stableisotopes in modern brachiopods shells. Chem. Geol. 219, 193–235.
Perez-Huerta A., Cusack M., Jeffries T. and Williams C. T. (2008)High resolution distribution of magnesium and strontium andthe evaluation of Mg/Ca thermometry in recent brachiopodshells. Chem. Geol. 247, 229–241.
Perez-Huerta A., Cusack M. and Dalbeck P. (2011) Crystallo-graphic contribution to the vital effect in biogenic carbonatesMg/Ca thermometry. Earth Environ. Sci. Trans. Roy. Soc.Edinb. 102, 35–41.
Powell M. G. (2009) The latitudinal diversity gradient of brachio-pods over the past 530 million Years. J. Geol. 117, 585–594.
Qing H. and Veizer J. (1994) Oxygen and carbon isotopiccomposition of Ordovician brachiopods: implications for coe-val seawater. Geochim. Cosmochim. Acta 58, 4429–4442.
Quay P. D., Tilbrook B. and Wong C. S. (1992) Oceanic uptake offossil fuel CO2: carbon-13 evidence. Science 256, 74–79.
Quay P., Sonnerup R., Westby T., Stutsman J. and McNichol A.(2003) Changes in the 13C/12C of dissolved inorganic carbon inthe ocean as a tracer of anthropogenic CO2 uptake. Glob.Biogeochem. Cycles 17, 4-1–4-20.
Quinn T. M., Taylor F. W., Crowley T. J. and Link S. M. (1996)Evaluation of sampling resolution in coral stable isotoperecords: a case study using records from New Caledonia andTarawa. Paleoceanography 11, 529–542.
Quinn T. M., Crowley T. J., Taylor F. W., Henin C., Joannot P.and Join Y. (1998) A multicentury stable isotope record from aNew Caledonia coral: interannual and decadal sea surfacetemperature variability in the southwest Pacific since 1657A.D.. Paleoceanography 13, 412–426.
Railsback L. B. (1990) Influence of changing deep ocean circulationon the Phanerozoic oxygen isotope record. Geochim. Cosmo-chim. Acta 54, 1501–1509.
Reimer P. J., Baillie M. G. L., Bard E., Bayliss A., Beck J. W.,Blackwell P. G., Bronk Ramsey C., Buck C. E., Burr G. S.,Edwards R. L., Friedrich M., Grootes P. M., Guilderson T. P.,Hajdas I., Heaton T. J., Hogg A. G., Hughen K. A., Kaiser K.
134 H. Takayanagi et al. / Geochimica et Cosmochimica Acta 115 (2013) 115–136
F., Kromer B., McCormac F. G., Manning S. W., Reimer R.W., Richards D. A., Southon J. R., Talamo S., Turney C. S.M., van der Plicht J. and Weyhenmeyer C. E. (2009) IntCal09and Marine09 radiocarbon age calibration curves, 0–50,000years cal BP. Radiocarbon 51, 1111–1150.
Renne P. R., Zichao Z., Richards M. A., Black M. T. and Basu A.R. (1995) Synchrony and causal relations between Permian–Triassic boundary crises and Siberian flood volcanism. Science269, 1413–1416.
Revelle R. and Suess H. (1957) Carbon dioxide exchange betweenatmosphere and ocean and the question of an increase in CO2
during the past decades. Tellus 9, 18–27.Romanek C. S., Grossman E. L. and Morse J. W. (1992) Carbon
isotopic fractionation in synthetic aragonite and calcite: effectsof temperature and precipitation rate. Geochim. Cosmochim.Acta 56, 419–430.
Rollion-Bard C., Chaussidon M. and France-Lanord C. (2003) PHcontrol on oxygen isotopic composition of symbiotic corals.Earth Planet. Sci. Lett. 215, 275–288.
Rutherford S., Mann M. E., Osborn T. J., Briffa K. R., Jones P. D.,Bradley R. S. and Hughes M. K. (2005) Proxy-based NorthernHemisphere surface temperature reconstructions: sensitivity tomethod, predictor network, target season, and target domain. J.Climate 18, 2308–2329.
Sampei Y., Matsumoto E., Dettman D. L., Tokuoka T. and AbeO. (2005) Paleosalinity in a brackish lake during the Holocenebased on stable oxygen and carbon isotopes of shell carbonatein Nakaumi Lagoon, southwest Japan. Palaeogeogr. Palaeocli-matol. Palaeoecol. 224, 352–366.
Schidlowski M. and Aharon P. (1992) Carbon cycle and carbonisotope record: geochemical impact of life over 3.8 Ga of Earthhistory. In Early Organic Evolution: Implications for Mineraland Energy Resources (eds. M. Schidlowski, S. Golubic and M.M. Kimberley). Springer, Berlin, Heidelberg, pp. 147–175.
Schmidt G. A., Bigg G. R. and Rohling E. J. (1999) GlobalSeawater Oxygen-18 Database [online]. <http://data.giss.nasa.-gov/o18data/> (cited 22.12.09).
Scholle P. A. and Arthur M. A. (1980) Carbon isotope fluctuationsin Cretaceous pelagic limestones: potential stratigraphic andpetroleum exploration tool. Am. Assoc. Petrol. Geol. Bull. 64,67–87.
Shackleton N. J. and Opdyke N. D. (1973) Oxygen isotope andpalaeomagnetic stratigraphy of equatorial Pacific core V28-238:oxygen isotope temperatures and ice volumes on a 105 year and106 year scale. Quatern. Res. 3, 39–55.
Shackleton N. J. (1974) Attainment of isotopic equilibriumbetween ocean water and benthonic foraminifera genus Uvige-rina: isotopic changes in the ocean during the last glacial.Colloq. Int. C.N.R.S. 219, 203–209.
Sokal R. R. and Rohlf F. J. (1994) Biometry: The Principles andPractice of Statistics in Biological Research, third ed. W.H.Freeman, New York.
Suzuki A., Kawamura N., Itaki T., Katayama H., Murakami S.,Usami T. and Kuroyanagi A. (2009) Geochemical analyses onseawater samples collected during the GH08 cruise in theeastern offshore of Okinawa Island. In Marine Geological andGeophysical Studies around Okinawa Islands – Eastern Off ofOkinawa Island, Preliminary Reports on Researches in the 2008Fiscal Year, GSJ Interim Report, vol. 46 (ed. K. Arai). Geol.Surv. Jpn., Natl. Inst. Adv. Ind. Sci. Technol., Tsukuba, pp.86–92.
Suzuki A., Ushie H., Shinmen K., Amano A., Kaneko N., Itaki T.,Katayama H., Inamura A., Yasuhara M., Yoshinaga Y.,Maruyama S. and Usami T. (2010) Geochemical analyses onseawater samples collected during the GH09 cruise in thewestern offshore of Okinawa Island. In Marine Geological and
Geophysical Studies around Okinawa Islands – Northwestern Offof Okinawa Island, Preliminary Reports on Researches in the2009 Fiscal Year, GSJ Interim Report, vol. 51 (ed. K. Arai).Geol. Surv. Jpn., Natl. Inst. Adv. Ind. Sci. Technol., Tsukuba,pp. 76–85.
Suzuki A., Shimamura M., Lee S., Ushie H., Shinmen K., AmanoA., Itaki T., Katayama H., Yasunaga E. and Yoshinaga Y.(2011) Geochemical analyses on seawater samples collectedduring the GH10 cruise in the southwestern offshore ofOkinawa Island. In Marine Geological and Geophysical Studiesaround Okinawa Islands – Western Off of Okinawa Island,Preliminary Reports on Researches in the 2010 Fiscal Year, GSJInterim Report, vol. 55 (ed. K. Arai). Geol. Surv. Jpn., Natl.Inst. Adv. Ind. Sci. Technol., Tsukuba, pp. 194–199.
Swart P. K., Greer L., Rosenheim B. E., Moses C. S., Waite A. J.,Winter A., Dodge R. E. and Helmle K. (2010) The 13C Suesseffect in scleractinian corals mirror changes in the anthropo-genic CO2 inventory of the surface oceans. Geophys. Res. Lett.110. http://dx.doi.org/10.1029/2009GL041397.
Takayanagi H., Abe O., Asami R. and Iryu Y. (2010) Carbon andoxygen isotope compositions of bottom-seawater samplescollected west off Okinawa Island. In Marine Geological andGeophysical Studies around Okinawa Islands – Northwestern Offof Okinawa Island, Preliminary Reports on Researches in the2009 Fiscal Year, GSJ Interim Report, vol. 51 (ed. K. Arai).Geol. Surv. Jpn., Natl. Inst. Adv. Ind. Sci. Technol., Tsukuba,pp. 86–92.
Takayanagi H., Asami R., Abe O., Miyajima T., Kitagawa H. andIryu Y. (2012) Carbon- and oxygen-isotope compositions of adeep-water modern brachiopod Campagea japonica collected offAguni-jima, Central Ryukyu Islands, southwestern Japan.Geochem. J. 46, 77–87.
Veizer J. (1995) Reply to the Comment by L.S. Land on “Oxygenand carbon isotopic composition of Ordovician brachiopods:Implications for coeval seawater”. Geochim. Cosmochim. Acta59, 2845–2846.
Veizer J. (1999) Comment on “d18O values of mudrocks: Moreevidence for an 18O buffered ocean” L.S. Land and F.L. LynchJr.. Geochim. Cosmochim. Acta 63, 2311–2312.
Veizer J., Fritz P. and Jones B. (1986) Geochemistry of brachio-pods: oxygen and carbon isotopic records of Paleozoic oceans.Geochim. Cosmochim. Acta 50, 1679–1696.
Veizer J., Bruckschen P., Pawellek F., Diener A., Podlaha O. G.,Carden G. A. F., Jasper T., Korte C., Strauss H., Azmy K. andAla D. (1997) Oxygen isotope evolution of Phanerozoicseawater. Palaeogeogr. Palaeoclimatol. Palaeoecol. 132, 159–172.
Veizer J., Ala D., Azmy K., Bruckschen P., Buhl D., Bruhn F.,Carden G. A. F., Diener A., Ebneth S., Godderis Y., Jasper T.,Korte C., Pawellek F., Podlaha O. G. and Strauss H. (1999)87Sr/86Sr, d13C and d18O evolution of Phanerozoic seawater.Chem. Geol. 161, 59–88.
Voros A. (2005) The smooth brachiopods of the MediterraneanJurassic: refugees or invaders? Palaeogeogr. Palaeoclimatol.Palaeoecol. 223, 222–224.
Wadleigh M. A. and Veizer J. (1992) 18O/16O and 13C/12C in LowerPaleozoic articulate brachiopods: implication for the isotopiccomposition of seawater. Geochim. Cosmochim. Acta 56, 431–443.
Wallmann K. (2001) The geological water cycle and the evolutionof marine d18O values. Geochim. Cosmochim. Acta 65, 2469–2485.
Wallmann K. (2004) Impact of atmospheric CO2 and galacticcosmic radiation on Phanerozoic climate change and the marined18O record. Geochem. Geophys. Geosyst. 5, Q06004. http://dx.doi.org/10.1029/2003GC000683.
H. Takayanagi et al. / Geochimica et Cosmochimica Acta 115 (2013) 115–136 135
Wanninkhof R. and McGillis W. R. (1999) A cubic relationshipbetween air–sea CO2 exchange and wind speed. Geophys. Res.Lett. 26. http://dx.doi.org/10.1029/1999GL900363.
Watanabe T. and Oba T. (1999) Daily reconstruction of watertemperature from oxygen isotopic ratios of a modern Tridacnashell using a freezing microtome sampling technique. J.Geophys. Res. 104, 20,667–20,674.
Wellington G. M. and Dunber R. B. (1995) Stable isotopicsignature of El Nino-Southern Oscillation events in easterntropical Pacific reef corals. Coral Reefs 14, 5–25.
Williams A., Carlson S. J., Brunton C. H. C., Holmer L. E. andPopov L. (1996) A supra-ordinal classification of the Brachio-poda. Philos. Trans. Roy. Soc. Lond. B 351, 1171–1193.
Williams A., Carlson S. J. and Brunton C. H. C. (2002)Rhynchonelliformea. In Treatise on Invertebrate Paleontology:Part H. Brachiopoda, vol. 4 (ed. R. Kaesler). Geol. Soc. Am.,Boulder, Colorado.
Yabe H. and Hatai K. (1934) The recent brachiopod fauna ofJapan: 1. New genera and subgenera. Proc. Imp. Acad. Jpn. 10,586–589.
Yamamoto K. (2007) Evaluation of carbon and oxygen isotopiccompositions of modern brachiopod shells as paleoenviron-mental proxies. Ph.D. thesis, Tohoku Univ.
Yamamoto K., Asami R. and Iryu Y. (2010a) Carbon and oxygenisotopic compositions of modern brachiopod shells from awarm-temperate shelf environment, Sagami Bay, central Japan.Palaeogeogr. Palaeoclimatol. Palaeoecol. 291, 348–359.
Yamamoto K., Asami R. and Iryu Y. (2010b) Within-shellvariations in carbon and oxygen isotope compositions of twomodern brachiopods from a subtropical shelf environment offAmami-o-shima, southwestern Japan. Geochem. Geophys. Geo-syst. 11, Q10009. http://dx.doi.org/10.1029/2010GC003190.
Yamamoto K., Asami R. and Iryu Y. (2011) Brachiopod taxa andshell portions reliably recording past ocean environments:toward establishing a robust paleoceanographic proxy. Geo-phys. Res. Lett. 38. http://dx.doi.org/10.1029/2011GL047134.
Yamamoto K., Asami R. and Iryu Y. (2013) Correlative relation-ships between carbon- and oxygen-isotope records in two cool-temperate brachiopod species off Otsuchi Bay, northeasternJapan. Paleontol. Res. 17, 12–26.
Yoneda M., Uno H., Shibata Y., Suzuki R., Kumamoto Y.,Yoshida K., Sasaki T., Suzuki A. and Kawahata H. (2007)Radiocarbon marine reservoir ages in the western Pacificestimated by pre-bomb molluscan shells. Nucl. Instrum. Meth.B 259, 432–437.
Zeebe R. and Wolf-Gladrow D. (2001) CO2 in Seawater: Equilib-rium, Kinetics, Isotopes. Elsevier Science B.V., Amsterdam.
Zhang J., Quay P. D. and Wilbur D. O. (1995) Carbon isotopefractionation during gas–water exchange and dissolution ofCO2. Geochim. Cosmochim. Acta 59, 107–114.
Associate editor: Yair Rosenthal
136 H. Takayanagi et al. / Geochimica et Cosmochimica Acta 115 (2013) 115–136