Intraspecific variability in Karlodinium veneficum: Growth rates, mixotrophy, and lipid composition
14
Intraspecific variability in Karlodinium veneficum: Growth rates, mixotrophy, and lipid composition Albert Calbet a, *, Mireia Bertos a , Claudio Fuentes-Gru ¨ newald a,b , Elisabet Alacid a , Rosa Figueroa c,1 , Berta Renom a , Esther Garce ´s a a Department of Marine Biology and Oceanography, Institut de Cie `ncies del Mar (CSIC), P. Marı´tim de la Barceloneta 37-49. 08003, Barcelona, Spain b Institut de Cie `ncia i Tecnologia Ambientals, Universitat Auto `noma de Barcelona, (ICTA-UAB), Edifici Cn Campus UAB - 08193 Cerdanyola del Valle ´s, Barcelona, Spain c Instituto Espan ˜ol de Oceanografıa (IEO), C.O. Vigo, 36280, Vigo, Spain 1. Introduction A microalgal bloom is caused by a rapid increase in the growth of a group or species of algae, resulting in its preferential and abundant accumulation. When the species involved in such blooms are potentially harmful, either for the environment or socio-economically, they are referred to as harmful algal blooms (HABs). Traditionally, HABs have been seen to derive from a clone of cells (i.e., genetically identical) that interact with other organisms and with the environment in an identical manner. Similarly, blooms formed by the same species are presumed to exhibit the same traits and behaviors. However, recent evidence points to differences in the toxin content of strains comprising many bloom-forming species, such as cyanobacteria (Carrillo et al., 2003) prymnesiophytes (Ichimi et al., 2002; Nejstgaard et al., 2007), and dinoflagellates (Loret et al., 2002; Nascimento et al., 2005; Wang et al., 2006; Adolf et al., 2008; Bachvaroff et al., 2009; Paz et al., 2007), as well as in the feeding behavior of some dinoflagellates (Adolf et al., 2008) and the growth rates of diatoms (Rynearson and Armbrust, 2000) and dinoflagellates (Loret et al., 2002). The conclusions of most such studies, especially those concerning dinoflagellates, were based on cultures of different strains obtained from different locations. In some reports, the strains were considered to be genetically identical, based on similarities in various molecular markers (Loret et al., 2002), while in others differences were determined (Adolf et al., 2008). The present work extends the research of Adolf et al. (2008) and Bachvaroff et al. (2009), who examined different strains of Karlodinium veneficum from different locations, by characterizing differences in the growth and feeding activities of 11 strains of K. veneficum originating from the same sample, obtained from a bloom in Alfacs Bay (Catalonia, Spain) in June 2007. The question asked in this work was first posed by Bachvaroff et al. (2009): whether there is functional variability (in terms of growth and mixotrophy) within a bloom population, with some individuals more adapted to certain conditions than others. Specifically, we Harmful Algae 10 (2011) 654–667 A R T I C L E I N F O Article history: Received 8 February 2011 Received in revised form 6 May 2011 Accepted 6 May 2011 Available online 13 May 2011 Keywords: Dinoflagellate Fatty acids Growth Grazing Harmful algal blooms Karlodinium veneficum A B S T R A C T We isolated eleven strains of the harmful algal bloom (HAB)-forming dinoflagellate Karlodinium veneficum during a bloom event in the NW Mediterranean coastal waters and we studied the inter-strain variability in several of their physiological and biochemical traits. These included autotrophic growth parameters, feeding capabilities (mixotrophy), lipid composition, and, in some cases, their responses to biotic and abiotic factors. The strains were found to differ in their growth rates (0.27–0.53 d 1 ) and in the maximum cell concentrations achieved during stationary phase (6.1 10 4 –8.6 10 4 cells mL 1 ). Their ingestion performance, when offered Rhodomonas salina as prey, was also diverse (0.22–1.3 cells per K. veneficum per day; 8–52% of their daily ration). At least two strains survived for several months under strict heterotrophic conditions (no light, low inorganic nutrients availability, and R. salina as food source). These strains also showed very distinct fatty acid compositions, with very low contents of monounsaturated and polyunsaturated fatty acids. According to a Bray Curtis similarity analysis, three or four strain groups able to perform different roles in bloom development were identified. We further analyzed one strain from each of the two most distinct groups with respect to prey concentration, light intensity, nutrient availability, and we determined the functional responses (growth and feeding rates) to food concentration. Taken together, the results served to highlight the role of mixotrophy and clone variability in the formation of HABs. ß 2011 Elsevier B.V. All rights reserved. * Corresponding author. Tel.: +34 932309519; fax: +34 932309555. E-mail address: [email protected] (A. Calbet). 1 Present address: Limnology Division, Department of Ecology, Lund University, S-22362 Lund, Sweden. Contents lists available at ScienceDirect Harmful Algae jo u rn al h om epag e: ww w.els evier.c o m/lo cat e/hal 1568-9883/$ – see front matter ß 2011 Elsevier B.V. All rights reserved. doi:10.1016/j.hal.2011.05.001
Transcript of Intraspecific variability in Karlodinium veneficum: Growth rates, mixotrophy, and lipid composition

Harmful Algae 10 (2011) 654–667
Intraspecific variability in Karlodinium veneficum: Growth rates, mixotrophy,and lipid composition
Albert Calbet a,*, Mireia Bertos a, Claudio Fuentes-Grunewald a,b, Elisabet Alacid a, Rosa Figueroa c,1,Berta Renom a, Esther Garces a
a Department of Marine Biology and Oceanography, Institut de Ciencies del Mar (CSIC), P. Marıtim de la Barceloneta 37-49. 08003, Barcelona, Spainb Institut de Ciencia i Tecnologia Ambientals, Universitat Autonoma de Barcelona, (ICTA-UAB), Edifici Cn Campus UAB - 08193 Cerdanyola del Valles, Barcelona, Spainc Instituto Espanol de Oceanografıa (IEO), C.O. Vigo, 36280, Vigo, Spain
A R T I C L E I N F O
Article history:
Received 8 February 2011
Received in revised form 6 May 2011
Accepted 6 May 2011
Available online 13 May 2011
Keywords:
Dinoflagellate
Fatty acids
Growth
Grazing
Harmful algal blooms
Karlodinium veneficum
A B S T R A C T
We isolated eleven strains of the harmful algal bloom (HAB)-forming dinoflagellate Karlodinium
veneficum during a bloom event in the NW Mediterranean coastal waters and we studied the inter-strain
variability in several of their physiological and biochemical traits. These included autotrophic growth
parameters, feeding capabilities (mixotrophy), lipid composition, and, in some cases, their responses to
biotic and abiotic factors. The strains were found to differ in their growth rates (0.27–0.53 d�1) and in the
maximum cell concentrations achieved during stationary phase (6.1 � 104–8.6 � 104 cells mL�1). Their
ingestion performance, when offered Rhodomonas salina as prey, was also diverse (0.22–1.3 cells per K.
veneficum per day; 8–52% of their daily ration). At least two strains survived for several months under
strict heterotrophic conditions (no light, low inorganic nutrients availability, and R. salina as food
source). These strains also showed very distinct fatty acid compositions, with very low contents of
monounsaturated and polyunsaturated fatty acids. According to a Bray Curtis similarity analysis, three or
four strain groups able to perform different roles in bloom development were identified. We further
analyzed one strain from each of the two most distinct groups with respect to prey concentration, light
intensity, nutrient availability, and we determined the functional responses (growth and feeding rates)
to food concentration. Taken together, the results served to highlight the role of mixotrophy and clone
variability in the formation of HABs.
� 2011 Elsevier B.V. All rights reserved.
Contents lists available at ScienceDirect
Harmful Algae
jo u rn al h om epag e: ww w.els evier .c o m/lo cat e/ha l
1. Introduction
A microalgal bloom is caused by a rapid increase in the growthof a group or species of algae, resulting in its preferential andabundant accumulation. When the species involved in suchblooms are potentially harmful, either for the environment orsocio-economically, they are referred to as harmful algal blooms(HABs). Traditionally, HABs have been seen to derive from a cloneof cells (i.e., genetically identical) that interact with otherorganisms and with the environment in an identical manner.Similarly, blooms formed by the same species are presumed toexhibit the same traits and behaviors. However, recent evidencepoints to differences in the toxin content of strains comprisingmany bloom-forming species, such as cyanobacteria (Carrillo et al.,2003) prymnesiophytes (Ichimi et al., 2002; Nejstgaard et al.,
* Corresponding author. Tel.: +34 932309519; fax: +34 932309555.
E-mail address: [email protected] (A. Calbet).1 Present address: Limnology Division, Department of Ecology, Lund University,
S-22362 Lund, Sweden.
1568-9883/$ – see front matter � 2011 Elsevier B.V. All rights reserved.
doi:10.1016/j.hal.2011.05.001
2007), and dinoflagellates (Loret et al., 2002; Nascimento et al.,2005; Wang et al., 2006; Adolf et al., 2008; Bachvaroff et al., 2009;Paz et al., 2007), as well as in the feeding behavior of somedinoflagellates (Adolf et al., 2008) and the growth rates of diatoms(Rynearson and Armbrust, 2000) and dinoflagellates (Loret et al.,2002). The conclusions of most such studies, especially thoseconcerning dinoflagellates, were based on cultures of differentstrains obtained from different locations. In some reports, thestrains were considered to be genetically identical, based onsimilarities in various molecular markers (Loret et al., 2002), whilein others differences were determined (Adolf et al., 2008). Thepresent work extends the research of Adolf et al. (2008) andBachvaroff et al. (2009), who examined different strains ofKarlodinium veneficum from different locations, by characterizingdifferences in the growth and feeding activities of 11 strains of K.
veneficum originating from the same sample, obtained from abloom in Alfacs Bay (Catalonia, Spain) in June 2007. The questionasked in this work was first posed by Bachvaroff et al. (2009):whether there is functional variability (in terms of growth andmixotrophy) within a bloom population, with some individualsmore adapted to certain conditions than others. Specifically, we

Fig. 1. Representative micrographs of Karlodinium veneficum feeding on Rhodomonas salina (ca.10 and 6.5 mm equivalent spherical diameter, respectively).
Table 1Summary of the experiments conducted and the strains of Karlodinium veneficum
used in each experiment. The corresponding ICM (Institut de Ciencies del Mar-CSIC)
code and GenBank (BankIt1450636 Seq.) sequence code is also indicated.
Experiment Strains
Growth kinetics in L1 medium, variability
in feeding behavior, and variability in
fatty acid contents
K1, K3, K4, K6, K12, K16,
K17, K21, K22, K24, K30
Functional feeding and growth responses K4, K24
Effects of light on feeding behavior K4, K24
Effect of low nutrient availability on
feeding behavior
K4, K24
Effects of long-term heterotrophic
conditions
K3, K4, K21, K22, K24, K30
Effects of feeding on lipid composition K24
Sequence codes:
K1: ICMB-256, not sequenced K17: ICMB-271, JF906087
K3: ICMB-258, JF906074 K21: ICMB-274, JF906089
K4: ICMB-259, JF906075 K22: ICMB-275, JF906090
K6: ICMB-261, JF906077 K24: ICMB-277, JF906092
K12: ICMB-266, JF906082 K30: ICMB-282, JF906096
K16: ICMB-270, JF906086
A. Calbet et al. / Harmful Algae 10 (2011) 654–667 655
hypothesized that strains with relatively lower autotrophic growthrates would be those adapted to a more mixotrophic (i.e., ingestionof prey) energetic path and, accordingly, should manifest acharacteristic lipid profile, i.e., low in the essential lipids usuallyobtained in a heterotrophic diet, including several polyunsaturatedfatty acids (PUFAs) (Klein Breteler et al., 1999; Adolf et al., 2007). Inaddition, we examined the ecology of K. veneficum in further detailby investigating the effects of several biotic and abiotic variables(prey availability, light intensity, nutrient concentration, etc.) onits growth, feeding rates, and biochemical lipid composition.
The microalga chosen, K. veneficum (previously, Woloszynskia
micra, Gyrodinium esturiale, Gyrodinium galatheanum, Gymnodi-
nium veneficum, K. micrum), is a widespread and cosmopolitanHAB-forming dinoflagellate. Blooms of K. veneficum were firstdescribed in South Africa by Braarud (1957) and later in Europe(Bjornland and Tangen, 1979), North America (Li et al., 2000a,b;Terlizzi, 2000), and Australia (Ajani et al., 2001; Cosgrove et al.,2000). In addition to the proven ability of this species to captureand ingest prey (Li et al., 1999, 2000a,b, 2001; Adolf et al., 2008;Sheng et al., 2010; this work, Fig. 1), mixotrophy may be a relevantsurvival strategy in this species (Li et al., 1999, 2000a), with thepresence of suitable prey acting as a trigger for toxic K. veneficum
blooms (Adolf et al., 2008).
2. Methods
2.1. Strain variability
2.1.1. Sample collection, cell isolation, and culture
We isolated eleven strains of the dinoflagellate K. veneficum
from single cells of one live sample collected in Alfacs Bay (NWMediterranean; Table 1) in June 2007, during a bloom (>1.6 � 106
cells L�1) that coincided with high mortalities of the mollusk Ensis
ensis (Fernandez-Tejedor et al., 2009). Based on morphologicalcharacteristics, determined by optical and epifluorescence micros-copy and by the number of chloroplasts per cell, all of the studied
strains were identified as members of K. veneficum. Analyses of the5.8S rDNA-ITS regions confirmed the microscopic identification.The ITS sequence codes for GenBank are presented in Table 1.
We transferred the isolated cells into IWAKI tissue-culturemulti-wall plates filled with L1 medium without silicate (Guillard,1975) adjusted to 34 psu (after few months transferred to 38 psu).All established cultures were maintained at 20 8C under a 12:12light:dark cycle. Illumination was provided by fluorescence tubes(Gro-lux, Sylvania, Germany), generating a photon irradiance of100 mE m�2 s�1.
2.1.2. Growth kinetics in L1 medium
Growth rate parameters were compared for the eleven K.
veneficum strains. To ensure consistency with future work, weretained the original labeling of the strains, even if not correlative.

A. Calbet et al. / Harmful Algae 10 (2011) 654–667656
For the experiments presented here, we kept the strains in 75-mLpolystyrene culture flasks, in exponential growth phase, for severaldays prior to the experiment. Duplicate 1.3-L Pyrex bottles filledwith L1 medium (38 psu) were then inoculated with aliquots of thedifferent strains to reach an initial concentration of ca. 3000cells mL�1. Almost daily, the bottles were gently mixed and a 10-mL aliquot was removed to monitor the growth rates. Cells of themicroalgae were counted in duplicate samples of 0.5 mL in aMultisizer III particle counter. The experiments lasted 14 days andwere carried out at 18 8C under a 12:12 h light:dark cycle(120 mE m�2 s�1). The growth rates of K. veneficum were calculatedas the slope of the linear phase using Ln-transformed data(exponential growth phase).
2.1.3. Strain variability in feeding behavior
We verified the mixotrophic capacities of all eleven strains of K.
veneficum by providing them with Rhodomonas salina as prey, basedon the hypothesis that any given difference in autotrophic growthrates would be reflected by differences in feeding rates. We filledculture flasks with 75 mL of L1 medium at 38 psu and added R. salina
to a final concentration of 5000 cells mL�1. We set three (plus oneinitial) bottles as controls for R. salina growth, and we inoculatedbatches of three (plus one initial) bottles with the different strains ofK. veneficum to reach a final concentration of 1500 cells mL�1. Tocompensate for any dilution effect on the R. salina suspensionresulting from addition of the grazers, a similar volume of L1 mediumwas added to all initial and control bottles. One bottle per treatmentwas sacrificed as the initial sample and the remaining bottles wereincubated on a slowly rotating plankton wheel (0.2 rpm) for 48 h at18 8C under a 12:12 h light:dark cycle (50–100 mE m�2 s�1).
Due to the similarity in size between R. salina and K. veneficum
(6.5–7 and 9.5–11 mm equivalent spherical diameter, respective-ly), they could not be accurately distinguished in an electronicparticle counter. Therefore, in the grazing experiments, wepreserved duplicate (sometimes triplicate) samples of the cellswith Lugol and we counted them microscopically using a SedgwickRafter counting chamber. Additionally, evidence of feeding wasobtained microscopically for live samples. An example of R. salina
engulfment by K. veneficum is shown in Fig. 1.Feeding rates were calculated only when significant differences
(p < 0.05) were found between the growth rates of prey in thecontrol and experimental bottles (t-test), based on the equations ofFrost (1972) and using the average concentration of grazersthroughout the incubation.
2.1.4. Strain variability in fatty acid contents
To characterize the fatty acid profile (FA) of autotrophicallygrowing K. veneficum, we sampled the cultures in triplicate (10 mL/sample) during stationary growth phase. The samples were filteredthrough Whatman GF/F (25 mm) pre-combusted glass-fiber filters,immediately frozen in liquid nitrogen, freeze-dried for 12 h, andstored at �20 8C until analysis. Cell extracts were prepared using3:1 DCM:MeOH (dichloromethane–methanol) according to themethod of (Ruiz et al., 2004). The samples were subsequentlyredissolved in 0.5 mL of chloroform and eluted through a 500-mgaminopropyl mini-column (Waters Sep-Pak1 Cartridges) previ-ously activated with 4 mL of n-hexane, according to (Fuentes-Grunewald et al., 2009). The first fraction (neutral lipids) waseluted with 3 mL of chloroform:2-propanol (2:1) and the fattyacids recovered with 8.5 mL of diethyl ether:acetic acid (98:2). Thefree fatty acid (FFA) fraction was methylated using a 20% solutionof MeOH/BF3 followed by heating at 90 8C for 1 h, yielding fattyacid methyl esters (FAMEs). The reaction was quenched with 4 mLof NaCl-saturated water and the FAMEs recovered by extractingthe samples twice with 3 mL of n-hexane. The combined extractswere taken to near dryness, re-dissolved with 1.5 mL of chloro-
form, eluted through a glass column filled with Na2SO4 (to removeresidual water), and, after chloroform removal, subjected tonitrogen evaporation. The extracts were stored at �20 8C untilanalyzed by gas chromatography, using a Thermo Finnigan TraceGC ultra instrument equipped with a flame ionization detector andsplitless injector and fitted with a DB-5 Agilent column (30-mlength, 0.25-mm internal diameter and 0.25-mm phase thickness).Helium was used as the carrier gas at a flow rate of 33 cm s�1. Theoven temperature was programmed to increase from 50 8C to320 8C at 10 8C min�1. The injector and detector temperatureswere 300 8C and 320 8C, respectively. Methyl esters of the fattyacids were identified by comparing their retention times withthose of the standards (37 FAME compounds, Supelco1 Mix C4-C24) Finally, the fatty acids were quantified by integrating theareas under the peaks in the gas chromatograph traces (Chrom-quest 4.1 software) with calibrations derived from internalstandards (2-octyldodecanoic acid and 5b-cholanic acid), andconsidering losses through the process.
Additionally, we examined whether the ingestion of prey (R.
salina) modified the lipid composition of K. veneficum. Accordingly,the fatty acid profiles of mixotrophic cultures of K. veneficum (K24)and R. salina were characterized using the above-describedmethodology. Samples were withdrawn from triplicates culturesinitially consisting of 5000 R. salina mL�1 and 1500 K.
veneficum mL�1 in 150-mL bottles at time 0, 1, 2 days, and 4 daysof incubation. The experiment was terminated when neither freecells of R. salina nor cryptophyte pigments inside K. veneficum cellswere observed by epifluorescence microscopy, interpreted ascomplete digestion of the prey. This occurred after 4 days ofincubation at 18 8C and a 12:12 h light:dark regime. The controlconsisted of autotrophic cultures of K. veneficum K24 and R. salina
exposed to the same culture conditions.
2.1.5. Statistical similarity analysis
To explore similarities in the data obtained from the different K.
veneficum strains, we used PRIMER software to obtain a multi-dimensional scaling of growth rate, biovolume, ingestion rates, andfatty acids concentration. The resemblance was based on the Bray-Curtis similarity, and similarity boundaries (70, 80, 85, and 90)were estimated.
2.2. Response of K. veneficum to environmental factors
2.2.1. Functional feeding and growth responses
We examined the functional responses of feeding and growthrates with respect to food concentration in the two strains of K.
veneficum with the highest and lowest autotrophic growth rates(K4 and K24, respectively), based on the results shown in Table 2.The experimental design consisted of a range of prey concentra-tions (R. salina) prepared in three initial and three experimental75-mL culture flasks filled with L1 medium (Table 2). An additionalseries of triplicate R. salina controls was prepared for eachconcentration to obtain prey growth rates. The initial concentra-tions of predators and prey are shown in Table 2. The bottles wereincubated for 48 h under the same conditions as in the previousexperiment. An incubation >24 h guaranteed that the dinoflagel-lates had adapted to the presence of the prey (Skovgaard, 1996)and provided a better growth response to prey availability. Inparallel with this experiment, K4 and K24 strains in L1 (1500cells mL�1) were incubated with 5000 R. salina mL�1 and withoutprey, to estimate any growth enhancement due to feeding.
2.2.2. Effects of light on feeding behavior
We examined the response of K. veneficum to a short-termdeprivation of light in order to evaluate whether its feedingbehavior was modified under darkness. Therefore, simultaneous

Table 2Initial predator (Karlodinium veneficum) and prey (Rhodomonas salina) concentra-
tions used for the feeding and growth functional-response experiments of strains
K4 and K24.
Strain R. salina � mL�1 SD K. veneficum
� mL�1
SD
K4 15476 1683.6 4404 89.3
K4 4289 691.4 1857 30.7
K4 2220 349.0 839 131.4
K4 1206 25.5 716 211.5
K4 721 20.4 514 20.5
K4 431 23.3 274 6.4
K24 15642 1831.6 5548 146.9
K24 4522 63.3 2141 236.2
K24 2400 147.5 1139 50.4
K24 1302 117.9 914 94.3
K24 661 33.4 555 28.8
K24 407 32.9 327 46.0
SD: standard deviation.
A. Calbet et al. / Harmful Algae 10 (2011) 654–667 657
with the functional response experiment, we added a treatment inwhich 1500 K. veneficum (K4 and K24 strains) mL�1 wereincubated with 5000 R. salina mL�1 in L1 medium at 18 8C intriplicate bottles and complete darkness (the bottles were coveredwith aluminum foil). An additional three samples, consisting of R.
salina (5000 cells mL�1) controls, were included to estimate thegrowth of these algae in the dark.
2.2.3. Effect of low nutrient availability on feeding behavior
To test whether the feeding behavior of K. veneficum wasnutrient-dependent, K24 and K4 strains were grown in sterilizedfiltered seawater (FSW) for 3 days and then used in an experimentin which their feeding rates on R. salina were assessed followingthe same protocol as described above. Accordingly, we incubated1500 K. veneficum (K4 and K24) mL �1 in FSW with 5000 R.
salina mL�1 in triplicate for 48 h at 18 8C. In addition, we carriedout the same experiment but using L1 medium to compare theingestion and growth rates of the two strains with and withoutnutrients. Triplicate controls consisted of R. salina alone in FSW andin L1-medium-enriched water (883 mM nitrate, 36 mM phos-phate). After 3 days of acclimation to FSW, inorganic nutrientconcentrations in the cultures were 7.6 mM nitrate and 0.6 mMphosphate. By the end of the experiment, the FSW culturescontained 2 mM nitrate and 0.2 mM phosphate. Nutrients wereanalyzed with an AA3 Bran + Luebbe Technicon.
2.2.4. Effects of long-term acclimation to heterotrophic conditions
We kept parallel cultures of K. veneficum (K3, K4, K21, K22, K24,and K30) in pasteurized FSW with R. salina as prey for 6 months inthe dark to determine whether the selected strains could thriveunder strict heterotrophic conditions. At the end of the 6-monthperiod, a feeding experiment was set up as described above, inwhich the ingestion rates of the surviving strains were comparedwith those of parallel cultures grown for the same period in L1medium containing an excess of nutrients. As in the previousexperiments, the prey concentration was 5000 R. salina mL�1 andthe grazer concentration 1500 K. veneficum mL�1. Incubations forthe feeding experiment lasted 24 h instead of 48-h to avoid anychange in feeding behavior that the presence of nutrients may havehad on the heterotrophic strains.
3. Results
3.1. Growth kinetics in L1 medium
The eleven strains of K. veneficum showed distinct growthresponses, differing in their maximum concentrations at stationary
Table 3Summary of the results of the autotrophic growth experiment. Growth rates of K. veneficum
curve. Max. cells are the maximum cell concentration attained in the stationary phase. Ce
stationary phases of the growth curve. Asterisks indicate the cases in which the cell vo
Strain Growth
rate (d�1)
SE slope r2 Max. cells
(cells mL�1)
K1 0.32 0.018 0.98 79585
K3 0.36 0.013 0.99 86600
K4 0.27 0.011 0.99 69815
K6 0.37 0.009 1.00 71665
K12 0.43 0.056 0.97 81895
K16 0.36 0.028 0.98 72510
K17 0.40 0.000 1.00 69365
K21 0.40 0.014 0.99 60960
K22 0.47 0.030 0.99 70535
K24 0.53 0.042 0.99 76060
K30 0.48 0.031 0.99 75755
SE: standard error.
phase and in their growth rates (Fig. 2, Table 3). By the end of theexperiment (day 14), all strains, except K1 and K3, had enteredstationary phase. The estimated growth rates ranged from 0.27 to0.53 d�1 (Table 3). Note that K17 was not sampled at the sameintensity as the other strains due to the unexplained presence ofaggregates during the exponential phase of growth, whichprecluded accurate measurement of the cell concentration.
The maximum K. veneficum concentration reached was notsignificantly correlated with the growth rate; however, growthrates were significantly linearly related (p < 0.01) with cellvolume, i.e., the larger the cells, the faster the growth rate(Fig. 3). Interestingly, upon reaching stationary phase many of thestrains significantly reduced their cell volume, except K16, K17,and K22, whose volumes increased (Table 3).
3.2. Strain variability in feeding behavior
Table 4 shows the R. salina ingestion rates by the differentstrains of K. veneficum. The differences between the strains wereobvious, ranging from 0.22 to 1.34 cells per K. veneficum per day,corresponding to a daily ration (specific ingestion rates � 100)between 8% and 52% of cell carbon (Table 4).
K. veneficum ingestion rates were linearly related to theirautotrophic growth rates and cell volume (Fig. 4). Assuming thatthe relationship between K. veneficum growth rate and cell volume(Fig. 3) drove the relationship between ingestion rates and growthrates, we asked whether the significance was retained when thevariability associated with cell volume was excluded. Fig. 4 showsa plot of the relationship between K. veneficum growth rates and
were calculated on Ln-transformed values in the exponential section of the growth
ll volume (obtained with a Coulter counter) is also indicated for the exponential and
lume was different between exponential and stationary phases at p < 0.05 (t-test).
Cell volume
(mm3) exponential
phase
SE Cell volume
(mm3) stationary
phase
SE
470.6 1.5 450.1 11.3
449.9 7.0 401.8* 4.8
433.8 5.9 389.8* 7.6
416.6 8.1 421.8 1.3
597.1 21.9 531.8* 10.6
509.0 9.9 544.6* 11.0
463.5 4.9 501.6* 1.0
581.4 22.1 564.1 2.9
521.9 2.6 610.3* 7.2
646.8 11.6 516.4* 3.6
585.0 5.3 496.5* 17.9

0
2 104
4 104
6 104
8 104
1 105
1 2 3 4 5 6 7 8 9 10 11 12 13 14 15
Cel
ls m
l-1
K 1
0
2 104
4 104
6 104
8 104
1 105
1 2 3 4 5 6 7 8 9 10 11 12 13 14 15
K 3
0
2 104
4 104
6 104
8 104
1 105
1 2 3 4 5 6 7 8 9 10 11 12 13 14 15
K 4
0
2 104
4 104
6 104
8 104
1 105
1 2 3 4 5 6 7 8 9 10 11 12 13 14 15
Cel
ls m
l-1
K 6
0
2 104
4 104
6 104
8 104
1 105
1 2 3 4 5 6 7 8 9 10 11 12 13 14 15
K 12
0
2 104
4 104
6 104
8 104
1 105
1 2 3 4 5 6 7 8 9 10 11 12 13 14 15
K 16
0
2 104
4 104
6 104
8 104
1 105
1 2 3 4 5 6 7 8 9 10 11 12 13 14 15
Cel
ls m
l-1
K 17
0
2 104
4 104
6 104
8 104
1 105
1 2 3 4 5 6 7 8 9 10 11 12 13 14 15
K 21
0
2 104
4 104
6 104
8 104
1 105
1 2 3 4 5 6 7 8 9 10 11 12 13 14 15
K 22
0
2 104
4 104
6 104
8 104
1 105
1 2 3 4 5 6 7 8 9 10 11 12 13 14 15
Cel
ls m
l-1
Days
K 24
0
2 104
4 104
6 104
8 104
1 105
1 2 3 4 5 6 7 8 9 10 11 12 13 14 15Days
K 30
Fig. 2. Karlodinium veneficum cell abundance over a period of 14 days in L1 rich medium. The data were fitted to a logistic curve for illustrative purposes. The autotrophic
growth rates corresponding to the exponential phase are given in Table 3.
A. Calbet et al. / Harmful Algae 10 (2011) 654–667658

Table 4Ingestion rates (cells K. veneficum�1 day�1) and carbon-specific ingestion rates
(mgCprey mgCpredator�1 d�1) of the different strains of K. veneficum feeding on R.
salina.
Strain Ingestion
rate
SD Specific
ingestion
rate
SD
K1 0.69 0.092 0.24 0.033
K3 0.36 0.068 0.13 0.023
K4 0.22 0.146 0.08 0.055
K6 1.34 0.081 0.52 0.031
K12 1.26 0.116 0.37 0.035
K16 0.98 0.119 0.32 0.043
K17 0.79 0.084 0.28 0.029
K21 1.12 0.041 0.33 0.021
K22 1.22 0.070 0.40 0.021
K24 1.03 0.144 0.28 0.040
K30 1.09 0.099 0.32 0.029
SD: standard deviation.
–K
30
:a
uto
tro
ph
icg
row
th;
K2
4m
ixo
tr.:
mix
otr
op
hic
gro
wth
).S
AFA
:sa
tura
ted
fatt
ya
cid
;M
UFA
:m
on
ou
nsa
tura
ted
fatt
ya
cid
;P
UFA
:
ati
on
.
SD
K1
7S
DK
21
SD
K2
2S
DK
24
SD
K3
0S
DK
24
mix
otr
.S
DR
ho
dS
D
0.7
0.9
0.2
1.0
0.1
6.6
0.0
3.4
4.9
3.6
4.5
––
2.8
1.2
0.9
0.6
0.4
1.3
0.0
1.0
1.5
2.6
1.4
–2
.82
.4
0.3
0.2
0.1
––
–0
.10
.1–
–
0.8
1.6
0.2
1.2
0.1
––
0.3
0.4
1.2
0.0
1.2
0.4
0.3
0.6
0.1
0.2
0.3
––
0.1
0.1
–2
.40
.0
––
––
0.1
0.1
––
––
––
––
–
0.5
14
.80
.81
8.9
1.9
8.8
0.0
16
.21
.61
6.7
2.0
15
.50
.31
6.4
0.3
1.4
1.3
0.3
2.6
1.9
––
0.4
0.6
2.8
0.6
2.3
1.2
–0
.70
.1–
–0
.20
.3–
–
––
––
––
–
0.4
1.6
1.7
2.1
2.0
––
0.3
0.5
1.9
0.3
1.8
0.7
0.1
1.8
2.6
0.6
0.8
––
0.9
1.3
–2
.50
.0
–2
.33
.2–
––
––
12
.01
5.2
2.6
20
.12
.22
1.6
0.0
8.5
12
.01
4.2
1.6
15
.61
.01
7.7
0.6
––
––
0.2
0.3
––
1.2
1.3
0.3
1.4
0.1
1.4
0.0
5.9
0.2
4.1
4.0
5.7
1.1
4.6
2.2
––
––
0.3
0.4
––
1.4
1.9
––
––
0.7
1.0
–
18
.72
2.3
16
.72
0.6
23
.91
6.6
20
.4
5.1
3.4
0.0
0.0
1.4
3.5
7.3
16
.52
3.8
23
.02
2.8
18
.52
1.3
22
.3
A. Calbet et al. / Harmful Algae 10 (2011) 654–667 659
weight-specific (carbon-based) ingestion rate. While the ten-dency was the same, the relationship was no longer significant(p = 0.16). In addition to describing the relationships betweenvariables, the information in Fig. 4 is also useful to characterizeassociations between plots. For instance, plot 1 (cell volume vs.
ingestion rates) provides clear evidence for three majorgroups of strains: those of high volume and high ingestionrates (K12, K16, K21, K22, K24, K30), those with intermediatevalues (K1, K17), and those of small volume and low ingestionrates (K3, K4). This association is only slightly modified in plot 2(ingestion rate vs. growth rate), with the exception that K6 hasmoved closer to the main group. Finally, the plot of growth ratevs. specific ingestion rate also differs moderately from theother plots, with K4 and K6 defining the upper and lower limitsof the specific ingestion rates, respectively. K24 is revealed as astrain with a high growth rate under autotrophic conditions anda medium biomass-specific feeding performance, whereas K22seems to exhibit considerable growth and ingestion rates.
0.25
0.3
0.35
0.4
0.45
0.5
0.55
0.6
400 450 500 550 600 650 700
K1
K3
K4
K6
K12
K16
K17 K21
K22
K24
K30
Gro
wth
rat
e (d
-1)
Cellular volume (µm3 cell
-1)
y = -0.107 + 0.001x, R2=0.63, p < 0.01
Fig. 3. Relationship between K. veneficum cellular volume in the exponential phase
and the growth rate under autotrophic conditions (values from Table 3). Deming
(Model II) equations were fitted for different variances. The determination
coefficient and significance level are shown. Error bars are SE. Ta
ble
5R
ela
tiv
ea
bu
nd
an
ce(%
)o
ffa
tty
aci
d(F
A)
com
po
siti
on
of
dif
fere
nt
clo
ne
so
fK
arl
od
iniu
mv
enefi
cum
(K1
po
lyu
nsa
tura
ted
fatt
ya
cid
s;S
D:
sta
nd
ard
de
via
tio
n;
–:
be
low
de
tect
ion
lim
its.
SD
:st
an
da
rdd
ev
i
FAK
1S
DK
3S
DK
4S
DK
6S
DK
12
SD
K1
6
C8
:0–
–1
.30
.50
.60
.00
.70
.20
.5
C1
1:0
2.5
2.0
1.5
0.4
2.0
1.4
1.2
0.8
0.9
0.1
2.6
C1
2:0
5.8
4.6
1.1
1.1
0.3
0.0
0.2
0.1
0.1
0.1
0.2
C1
4:0
5.1
3.7
1.7
0.7
1.3
0.2
1.6
0.2
1.4
0.0
0.5
C1
4:1
–1
.41
.10
.40
.60
.30
.20
.40
.20
.2
C1
5:0
6.2
4.0
1.6
1.7
0.1
0.2
–0
.20
.0–
C1
5:1
7.1
0.0
––
––
–
C1
6:0
9.9
3.6
11
.52
.41
2.5
1.8
16
.41
.11
7.5
0.9
17
.6
C1
6:1
–0
.60
.91
.20
.31
.10
.10
.80
.51
.0
C1
7:0
––
0.2
0.3
0.6
0.1
0.6
0.0
–
C1
7:1
––
–0
.81
.1–
–
C1
8:0
4.6
3.8
0.4
0.6
0.9
0.3
0.4
0.1
0.4
0.0
0.3
C1
8:1
–1
.11
.52
.20
.74
.00
.01
.92
.23
.9
C1
8:2
–1
.41
.93
.20
.4–
1.9
2.7
–
C1
8:3
–1
2.5
13
.61
7.2
2.7
15
.40
.51
6.6
1.4
8.5
C2
0:5
––
––
––
C2
2:6
–0
.60
.91
.50
.31
.00
.21
.20
.21
.7
C2
4:0
––
––
0.3
0.5
–
C2
4:1
––
0.5
0.8
–0
.30
.4–
SA
FA2
9.3
17
.31
7.8
20
.62
1.6
21
.4
MU
FA7
.13
.14
.36
.23
.85
.1
PU
FA0
.01
4.5
22
.01
6.4
19
.71
0.2

0
0.2
0.4
0.6
0.8
1
1.2
1.4
1.6
400 450 500 550 600 650
K1
K3
K4
K12
K16
K17
K21
K22
K24
K30
K6
Inge
stio
n ra
tes
(cel
ls K
. ven
efic
um-1
d-1
)
Cell volume (µm3 cell
-1)
y = -1.7 + 0.005x, R2=0.62, p < 0.01
A
0
0.2
0.4
0.6
0.8
1
1.2
1.4
1.6
0.2 0.25 0.3 0.35 0.4 0.45 0.5 0.55 0.6
K1
K3
K4
K6
K12
K16
K17
K21
K22
K24
K30
Inge
stio
n ra
tes
(cel
ls K
. ven
efic
um-1
d-1
)
Growth rate (d-1
)
B
y = -1 + 4.8x, R2=0.57, p < 0.05
0
0.1
0.2
0.3
0.4
0.5
0.6
0.2 0.25 0.3 0.35 0.4 0.45 0.5 0.55 0.6
K1
K3
K4
K6
K12
K16
K17
K21
K22
K24
K30
Spe
cific
inge
stio
n ra
tes
(d-1
)
Growth rate (d-1
)
C
Fig. 4. (A) Relationship between rates of K. veneficum ingestion of R. salina and cell
volume at exponential growth. (B) Relationship between rates of K. veneficum
ingestion of R. salina and the autotrophic growth rates. (C) Relationship between
carbon-specific rates of R. salina ingestion and K. veneficum autotrophic growth
rates. One outlier (open circle; K6) in the ingestion rates vs. cell volume relationship
Fig. 5. (A) Fatty acids concentration per mm3 of cells of the K. veneficum strains. (B)
Relative abundance (%) of fatty acid composition in K. veneficum strains at the
stationary phase of culture. K24mixotr. refers to the strain K24 fed with R. salina (see
text). Error bars are SD.
A. Calbet et al. / Harmful Algae 10 (2011) 654–667660
3.3. Strain variability in fatty acid contents
Under autotrophic conditions, the strains varied considerably interms of FA content, which ranged from 0.24 to 1.4 pg mm�3
(Fig. 5). In autotrophic K. veneficum strains, C16:0 accounted for8.8–18.9%, C18:3n3 for 8.5–21.6%, and C22:6n3 for 0.6–5.9% oftotal FA. The corresponding values for mixotrophic K. veneficum
were 15.5%, 15.6%, 5.7%, respectively (Table 5). The highest fattyacid contents were measured in strains K3, K4, and K6, and thelowest in strains K22 and K24. The latter result reflected the non-significant amount of monounsaturated FAs (MUFAs) in both
was not considered for the equation. Deming (Model II) equations were fitted for
different variances. The determination coefficient and significance level are also
shown. Error bars are SE.

Table 6Effects of nutrient depletion on Karlodinium veneficum (strains K4 and K24)
ingestion (cells K. veneficum d�1) and growth rates (d�1). L1: cells grown in
nutrient-rich medium, FSW: cells grown for 3 days in filtered seawater.
Treatment Ingestion rate SD Growth rate SD
K4 L1 0.00 – 0.056 0.070
K4 FSW 0.00 – 0.059 0.055
K24 L1 0.67 0.043 0.27 0.043
K24 FSW 0.48 0.012 0.39 0.012
SD: standard deviation.
A. Calbet et al. / Harmful Algae 10 (2011) 654–667 661
strains (Fig. 5; Table 5). Saturated (SAFA) and polyunsaturated(PUFA) FAs accounted for most of the bulk fatty acids in the cells,and MUFAs for the minor proportion in the lipid profiles of thedifferent strains. The phagocytosis by K. veneficum of its preyresulted in the incorporation of lipids into the cell, as evidenced bythe presence of MUFAs in strain K24mixotr. after feeding on R. salina
(Fig. 5; Table 5).
3.4. Statistical similarity analysis
The multi-dimensional scaling test based on similitudes amongthe strains with respect to growth rate, biovolume, ingestion rates,and fatty acid concentrations is presented in Fig. 6. The graphshows the relationship between similarities in the item–itemmatrix and the location of each strain in low-dimensional space.Some strains were highly similar and appear as a closed group,such as K3–K4 (90% similarity), K22–K24 (85% similarity), and K1–K12–K16–K17–K21–K30 (90% similarity). K6 was similar to thelatter group at a similarity boundary of 85%, but differed at 90%.
3.5. Functional feeding and growth responses
The ingestion rate of strain K24 showed a typical functionalcurve (Holling II), with feeding saturation at ca. 3300 cells mL�1
and maximum ingestion rates of ca. 1 cell R. salinas per K. veneficum
per day (Fig. 7). The K. veneficum growth rates also correspondedwith the feeding response, although growth seemed to becomesaturated faster than ingestion (at ca. 800 cells mL�1; Fig. 7).Conversely, K4 showed only significant feeding on R. salina at twoconcentrations of prey. The growth rates for K4 were actually quitelow, with unexplained negative values at lower prey concentra-tions (Fig. 7). However, the presence of R. salina at highconcentrations seemed to stimulate growth of the dinoflagellate,
K1
K3K4
K6
K17
Fig. 6. Multi-dimensional scaling of the K. veneficum strai
even if no feeding was detected. This pattern was corroboratedwhen the growth rates obtained during K. veneficum feeding on R.
salina were compared with those achieved by autotrophicmetabolism only (L1 medium; Fig. 8). For K4, the ingestion ratewas not significant (data not shown), although the presence of preylargely and unexplainably enhanced growth rates. However, K24ingested 0.66 � 0.029 SE R. salina cells per K. veneficum per day,which resulted in a slight (4.15%) but not significant enhancement ofgrowth (Fig. 8).
3.6. Effects of light and nutrients on feeding behavior
The effects of short-term light deprivation on the ingestion andgrowth rates of strains K4 and K24 are shown in Fig. 7. Incubationsin the dark did not cause differences in the ingestion rates whereasthe growth rates were adversely affected. Indeed, the negativegrowth (cells were actually dying) of these two strains of K.
veneficum indicated detrimental effects due to the short-termabsence of light. This contrasts with the fact that strain K24(hereafter K24h) was able to thrive in the dark for at least 6months, feeding only on R. salina. Strain K22 (hereafter K22h) alsosurvived for the entire duration of the experiment, with a higher R.
salina ingestion rate than controls grown in L1 (p < 0.01, t-test;Fig. 9). Strain K24h was, unfortunately, accidentally lost before thefeeding experiment was completed, and K3, K4, K21, and K30perished after a few days/weeks of light and nutrient deprivation.It is worth mentioning that both K22h and K24h retained theirchloroplasts during light deprivation but these appeared lessbright on epifluorescence microscopy.
When grown under conditions of nutrient depletion for 3 days,strains K4 and K24 showed no enhancement of feeding (Table 6).K4 did not exhibit detectable grazing on R. salina under eithernutrient-rich or nutrient-depleted conditions (data not shown),while there was a slight (although significant, p < 0.05 t-test)decrease in the ingestion rates of K24 in nutrient depleted vs.
nutrient-rich conditions (0.48 � 0.007 vs. 0.67 � 0.025 SE cells R.
salina per K. veneficum per day, respectively).
4. Discussion
This study had two main, interconnected objectives: (1) toassess the physiological and biochemical variability amongdifferent strains of K. veneficum isolated from one sample of thesame bloom, and (2) in a further step, to determine whether these
K12
K16
K21
K22
K24
K30
2D Stress: 0,02
Similarity70808590
ns. Similarity boundaries (70, 80, 85, 90) are drawn.

0
0.2
0.4
0.6
0.8
1
1.2
0 5000 10000 15000 20000 25000
Light treatment
Dark treatmentIn
gest
ion
rate
(ce
lls K
. ven
efic
um-1
d-1
)
R. salina concentration (cells ml-1 )
K4
0
0.2
0.4
0.6
0.8
1
0 5000 10000 15000 20000
Inge
stio
n ra
te (
cells
K. v
enef
icum
-1 d
-1)
R. salina concentration (cells ml-1
)
K24
y = m1*x/(m2+x)ErrorValue
0.10.86m1 978.463317.7m2
NA0.17Chisq
NA0.8R2
-0.3
-0.2
-0.1
0
0.1
0.2
0.3
0.4
0 5000 10000 15000 20000 25000
Gro
wth
rat
e (d
-1)
R. salina concentration (cells ml-1 )
K4
-0.3
-0.2
-0.1
0
0.1
0.2
0.3
0.4
0 5000 10000 15000 20000
Gro
wth
rat
e (d
-1)
R. salina concentration (cells ml-1
)
K24
y = m1*x/(m2+x)ErrorValue0.030.24m1
347.37791.59m2 NA0.04Chisq
NA0.43R2
Fig. 7. Functional responses in ingestion and growth rates of strains K4 and K24 of K. veneficum feeding on R. salina. Open symbols correspond to incubations conducted in the
dark. Fittings correspond to a Holling type II functional response.
A. Calbet et al. / Harmful Algae 10 (2011) 654–667662
strains, based on their autotrophic growth parameters, differed intheir responses to certain biotic and abiotic factors, such as thepresence of prey, light intensity, and nutrient availability. Theseobjectives will be discussed in this order, followed by two brief,more general sections comparing the feeding capacities of K.
veneficum with those of other protists and examining the role ofmixotrophy in K. veneficum and other HAB-forming dinoflagellates.Our discussion concludes with remarks about the relevance of thisstudy.
4.1. Strain variability
A significant result of our experiments was that K. veneficum
strains originating from the same bloom varied remarkably in theirgrowth rates, size, feeding behavior, and lipid composition.Nucleotide sequences analysis of the strains’ internal transcribedspace regions (ITS; Andree, K. unpublished data) failed to detectany differences among them, indicating genetic homogeneity inthis region. It has been reported, however, that dinoflagellates(Karenia brevis) with homogeneous ribosomal DNA sequences candiffer significantly in growth rates and toxin content (Loret et al.,
2002). As pointed out by these authors, ITS sequences, a commonmarker for species and/or subspecies designation, may not be thebest indicator of strain variability; instead, other, faster evolvingDNA regions may be more informative. A recent study of thegenetic markers of the K. veneficum strains analyzed herein foundsignificant genetic differences between some of the strains, asdetermined by amplified fragment-length polymorphisms (AFLP)(Walworth pers. comm.). This result supports the conclusion thatthe different strains of K. veneficum, or at least certain groups, aredistinct clones and is in agreement with our data on metabolicperformance and lipid composition.
In this regard, according to our original hypothesis, cells withlow autotrophic growth rates should exhibit an enhancedheterotrophic/mixotrophic metabolism, which should be evi-denced by a negative relationship between autotrophic growthand ingestion rates. This could be understood as a specializationwithin a bloom; some cells being able to take advantage of otheralgae as a resource, thereby also reducing competition, while othercells being fast-growing when nutrients are available in highconcentrations (Adolf et al., 2008). However, we found that cellswith higher autotrophic growth also had a higher capability to
0
0.1
0.2
0.3
0.4
0.5
K4 K4 + prey K24 K24 + prey
Gro
wth
rat
e (d
-1)
Treatment
Fig. 8. Growth rates of strains K4 and K24 of K. veneficum incubated only with L1
medium or with L1 and prey (Rhodomonas salina). Error bars are SE.
A. Calbet et al. / Harmful Algae 10 (2011) 654–667 663
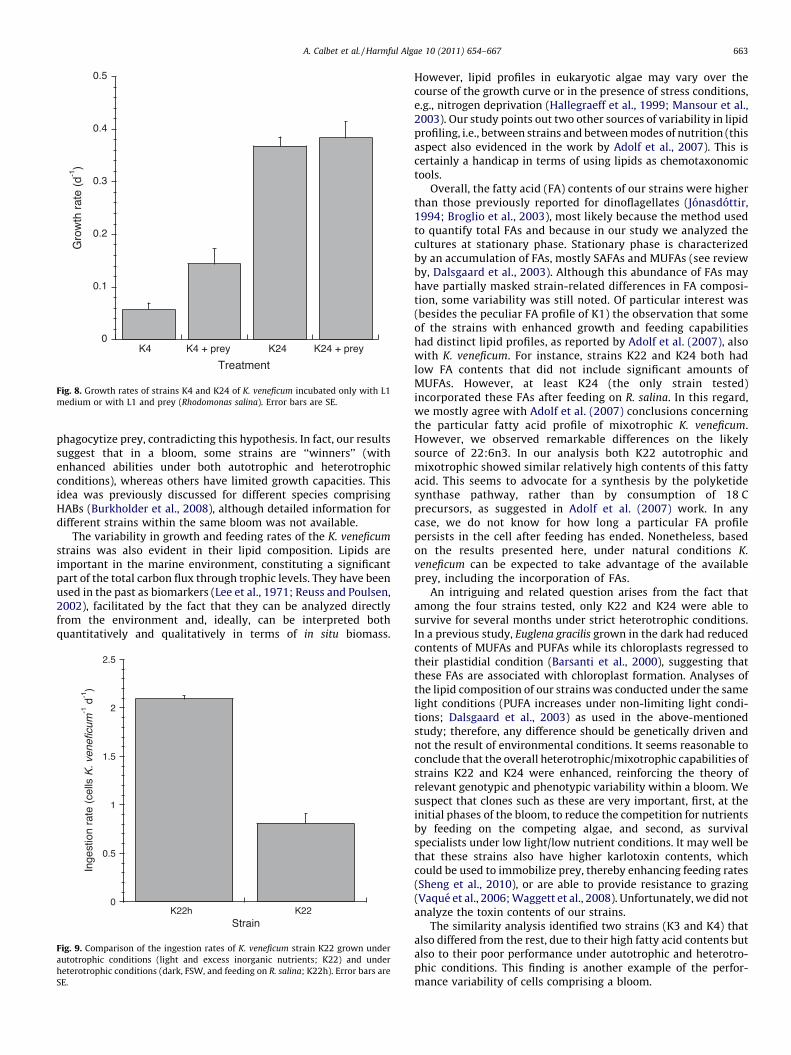
phagocytize prey, contradicting this hypothesis. In fact, our resultssuggest that in a bloom, some strains are ‘‘winners’’ (withenhanced abilities under both autotrophic and heterotrophicconditions), whereas others have limited growth capacities. Thisidea was previously discussed for different species comprisingHABs (Burkholder et al., 2008), although detailed information fordifferent strains within the same bloom was not available.
The variability in growth and feeding rates of the K. veneficum
strains was also evident in their lipid composition. Lipids areimportant in the marine environment, constituting a significantpart of the total carbon flux through trophic levels. They have beenused in the past as biomarkers (Lee et al., 1971; Reuss and Poulsen,2002), facilitated by the fact that they can be analyzed directlyfrom the environment and, ideally, can be interpreted bothquantitatively and qualitatively in terms of in situ biomass.
0
0.5
1
1.5
2
2.5
K22h K22
Inge
stio
n ra
te (
cells
K. v
enef
icum
-1 d
-1)
Strain
Fig. 9. Comparison of the ingestion rates of K. veneficum strain K22 grown under
autotrophic conditions (light and excess inorganic nutrients; K22) and under
heterotrophic conditions (dark, FSW, and feeding on R. salina; K22h). Error bars are
SE.
However, lipid profiles in eukaryotic algae may vary over thecourse of the growth curve or in the presence of stress conditions,e.g., nitrogen deprivation (Hallegraeff et al., 1999; Mansour et al.,2003). Our study points out two other sources of variability in lipidprofiling, i.e., between strains and between modes of nutrition (thisaspect also evidenced in the work by Adolf et al., 2007). This iscertainly a handicap in terms of using lipids as chemotaxonomictools.
Overall, the fatty acid (FA) contents of our strains were higherthan those previously reported for dinoflagellates (Jonasdottir,1994; Broglio et al., 2003), most likely because the method usedto quantify total FAs and because in our study we analyzed thecultures at stationary phase. Stationary phase is characterizedby an accumulation of FAs, mostly SAFAs and MUFAs (see reviewby, Dalsgaard et al., 2003). Although this abundance of FAs mayhave partially masked strain-related differences in FA composi-tion, some variability was still noted. Of particular interest was(besides the peculiar FA profile of K1) the observation that someof the strains with enhanced growth and feeding capabilitieshad distinct lipid profiles, as reported by Adolf et al. (2007), alsowith K. veneficum. For instance, strains K22 and K24 both hadlow FA contents that did not include significant amounts ofMUFAs. However, at least K24 (the only strain tested)incorporated these FAs after feeding on R. salina. In this regard,we mostly agree with Adolf et al. (2007) conclusions concerningthe particular fatty acid profile of mixotrophic K. veneficum.However, we observed remarkable differences on the likelysource of 22:6n3. In our analysis both K22 autotrophic andmixotrophic showed similar relatively high contents of this fattyacid. This seems to advocate for a synthesis by the polyketidesynthase pathway, rather than by consumption of 18 Cprecursors, as suggested in Adolf et al. (2007) work. In anycase, we do not know for how long a particular FA profilepersists in the cell after feeding has ended. Nonetheless, basedon the results presented here, under natural conditions K.
veneficum can be expected to take advantage of the availableprey, including the incorporation of FAs.
An intriguing and related question arises from the fact thatamong the four strains tested, only K22 and K24 were able tosurvive for several months under strict heterotrophic conditions.In a previous study, Euglena gracilis grown in the dark had reducedcontents of MUFAs and PUFAs while its chloroplasts regressed totheir plastidial condition (Barsanti et al., 2000), suggesting thatthese FAs are associated with chloroplast formation. Analyses ofthe lipid composition of our strains was conducted under the samelight conditions (PUFA increases under non-limiting light condi-tions; Dalsgaard et al., 2003) as used in the above-mentionedstudy; therefore, any difference should be genetically driven andnot the result of environmental conditions. It seems reasonable toconclude that the overall heterotrophic/mixotrophic capabilities ofstrains K22 and K24 were enhanced, reinforcing the theory ofrelevant genotypic and phenotypic variability within a bloom. Wesuspect that clones such as these are very important, first, at theinitial phases of the bloom, to reduce the competition for nutrientsby feeding on the competing algae, and second, as survivalspecialists under low light/low nutrient conditions. It may well bethat these strains also have higher karlotoxin contents, whichcould be used to immobilize prey, thereby enhancing feeding rates(Sheng et al., 2010), or are able to provide resistance to grazing(Vaque et al., 2006; Waggett et al., 2008). Unfortunately, we did notanalyze the toxin contents of our strains.
The similarity analysis identified two strains (K3 and K4) thatalso differed from the rest, due to their high fatty acid contents butalso to their poor performance under autotrophic and heterotro-phic conditions. This finding is another example of the perfor-mance variability of cells comprising a bloom.

A. Calbet et al. / Harmful Algae 10 (2011) 654–667664
In summary, the substantial differences among the elevenstrains examined herein allowed them to be functionally groupedin terms of growth and mixotrophic feeding capacities. However, itis not clear whether these groups were constituted by the same orby different clones. Nevertheless, based on the physiological data,it is highly likely that our strains of K. veneficum are derived from atleast three or four different clones.
4.2. Effects of light on K. veneficum mixotrophy
According to Stickney et al. (2000), in an ideal mixotroph therate of feeding is inversely related to irradiance, whereas inphagocytic alga, when dissolved inorganic nutrients are limiting,the feeding rate directly depends on the irradiance. However, whennutrients are provided in excess, low light levels (or darkness)should trigger an enhanced feeding response in either mixotrophymode, as previously observed for dinoflagellates (Bird and Kalff,1989; Jones et al., 1993; Skovgaard, 1996; Legrand et al., 1998). Inour experiments, and similar to those of Skovgaard et al. (2000)with Fragilidium subglobosum, no significant differences in inges-tion rates after 2 days of light deprivation were noted, although thegrowth rates of the dinoflagellates were certainly adverselyaffected. By contrast, Li et al. (1999) observed a negative effectof low light intensities on K. veneficum feeding activity. Thiscontrasting response to light intensity may reflect differences inthe strains used or they may merely be the result of differentexperimental set-ups. For example, the study of Li et al. (1999)included longer acclimation periods. At very low light intensities,this may have negatively affected the organisms, which, as notedby the authors, are unable to survive in prolonged darkness. Theexplanation is consistent with our own findings, as four out of sixstrains did not survive prolonged darkness. By contrast, strainsK22h and K24h were able to survive, feed, and grow for monthsunder complete darkness.
There is also a second aspect, not considered thus far, thatdistinguishes our experiments from those of Li et al. (1999): theuse of a plankton wheel. By keeping the culture bottles inmovement, we ensured a homogeneously distributed suspensionof prey, precluding the formation of patches. In a standing set-up,such that light is more intense on one side of the bottle, bothgrazers and prey may aggregate, enhancing the encounter ratesand artificially increasing ingestion rates. The effect should bemore evident at higher light intensities, becoming irrelevant underdarkness, although it is likely that cells aggregate according to theirgeotaxis or vertical migration patterns, if any; however, this doesnot necessarily produce the same outcome as in a feedingexperiment.
4.3. Effects of nutrient limitation on feeding rates
Nutrient limitation is considered a trigger for mixotrophy(Raven, 1997; Jones, 1997, 2000; see also review by Burkholderet al., 2008). For instance, Heterocapsa triquetra ingestion offluorescently labeled algae only occurred in nutrient-depletedmedium, not when the dinoflagellate was cultured under highnutrient conditions (Legrand et al., 1998). Similar findings wereobtained for other microalgae (Stoecker et al., 1997; Estep et al.,1986; Sanders, 1991; Arenovski et al., 1995). In K. veneficum,inorganic nutrient limitation was shown to stimulate feeding onStoreatula major, with P deficiency enhancing feeding more than Ndeficiency (Li et al., 2000a). We did not observe this response in ourshort nutrient limitation experiment, as even feeding by K24 wasslightly adversely affected during nutrient deprivation. However, itshould be noted that, by the end of the incubations, nutrients werenot fully depleted, and the remaining nutrients could have beenenough to sustain autotrophic growth, masking any effect.
However, strain K22h, cultivated under complete darkness andin nutrient-poor FSW, significantly increased its feeding rates overthose of the control grown in nutrient-rich medium. The ability ofthis strain (and K24h) to endure fully heterotrophic conditions,whereas other strains could not, and its particular lipid composi-tion indicate extreme variability and thus calls into question mostof the research on mixotrophy based on a single strain (see reviewby Stoecker, 1999).
4.4. Performance of K. veneficum in relation to other dinoflagellates
K. veneficum has been previously described as a mixotrophicspecies, exhibiting inter-strain variability with respect to ingestionrates (Li et al., 1999, 2001; Adolf et al., 2008). The data presentedhere corroborate this finding, extending this variability to isolatesfrom the same bloom. Our estimated ingestion rates are in themedium-low range of those reported by Adolf et al. (2008): 0.22–1.34 (2.1 for K22h) vs. 0–4 cells K. veneficum�1 d�1, respectively.This indicates that the variability observed within our isolates fromthe same bloom is lower than that between strains from differentlocations. However, in terms of absolute numbers, our experimentsare not easily comparable with those of Adolf et al. (2008), as weestimated ingestion rates as cell (R. salina) disappearance in 48-hincubations, whereas Adolf et al. (2008) measured orange (S.
major) fluorescent inclusions after 6.5-h incubations. In addition,not only the prey but also the methods to estimate grazing differedbetween the two studies. Incubations of 6.5 h may mask anypossible feeding rhythm and result in an overestimate of grazing ifthe digestion time is >6.5 h, which seems to be the case (Li et al.,2001). Other studies, more comparable to ours, showed in situ
ingestion rates of this species in Chesapeake Bay of 0–0.26cryptophytes dinoflagellate�1 d�1 (Li et al., 2001), and from 0 to �7cryptophytes dinoflagellate�1 d�1, depending on the light condi-tions (Li et al., 1999).
The ingestion rates of our K. veneficum strains corresponded todaily rations of 8–50% of body carbon consumed per day.Compared to other mixotrophic dinoflagellates, reviewed by Yooet al. (2010), these values are in the high range, trailing only thoseof Paragymnodinium shiwhaense, Karlodinium armiger, and Fragi-
lidinium mexicanum (Fig. 10). However, heterotrophic dinoflagel-lates, as expected, have much higher specific ingestion ratesbecause feeding is the only means of obtaining nourishment. Thissurplus of directly ingested carbon is cheaper to metabolicallyincorporate than carbon fixed from photosynthesis (e.g., therespiration rate of mixotrophic F. subglobosum is less than that ofautotrophic F. subglobosum; Hansen et al., 2000), and is lesspreferably respired (Putt, 1990). In the case of K. veneficum,particulate carbon assimilation reportedly contributes 31–72% ofgross carbon uptake during mixotrophic growth (Adolf et al.,2006). Our lower values likely reflected the fact that the cells werenot fully adapted to growth under mixotrophic conditions (48-hexperiments). However, in the case of K4, there was anunexplainable enhancement of growth that did not correspondto any significant rate of ingestion. This result does not seem tohave been an experimental artifact, because it was obtained in twoindependent experiments (Figs. 4 and 5); thus, it may be related tothe capacity of dinoflagellates to absorb not only particulate butalso dissolved carbon released by prey (Glibert and Legrand, 2006).
It has also been suggested that mixotrophs require certainessential elements or growth factors from their prey, even ifconsumed at very low rates (Caron et al., 1993; Raven, 1997; Jones,1997). If this is indeed the case for K4, then this dinoflagellatewould belong to group C of the mixotrophs classification proposedby Jones (1997): organisms whose primary mode of nutrition isphototrophy, but which must supplement their diet by ingestingprey.

Fig. 10. Comparison of the maximum carbon-specific ingestion rates (d�1) of
different mixotrophic and heterotrophic dinoflagellates. The discontinuous line
indicates the average for mixotrophs and heterotrophs. Data for mixotrophs other
than K6 (this study) are from the review by Yoo et al. (2010), Table 5. PM:
Prorocentrum micans, GP: Gonyaulax polygramma, PD: P. donghaiense, CP:
Cochlodinium polykrikoides, LP: Lingulodinium polyedrum, HT: Heterocapsa
triquetra, KV: Karlodinium veneficum, K6: Strain K6 of K. veneficum, FM:
Fragilidium mexicanum, PS: Paragymnodinium shiwhaense, KA: Karlodinium
armiger, Asp: Amphidinium sp. (Strom and Morello, 1998), GD: Gyrodinium
dominans (Nakamura et al., 1995), GS: Gyrodinium spirale (Hansen, 1992), Gsp1:
Gymnodinium sp. (Bjørnsen and Kuparinen, 1991), Gsp2: Gymnodinium sp. (Strom
and Morello, 1998), OM: Oxyrrhis marina (Hansen et al., 1996), OR: Oblea rotunda
(Strom and Buskey, 1993), PH: Protoperidinium hirobis (Jacobson and Anderson,
1986).
A. Calbet et al. / Harmful Algae 10 (2011) 654–667 665
4.5. Ecological role of mixotrophy in K. veneficum
The benefits of mixotrophy for a bloom-forming organism havebeen extensively discussed in the literature. For instance,according to Glibert et al. (2009), mixotrophy in K. brevis mayplay a substantial role in sustaining natural populations ininorganic nutrient-poor waters. It has been also suggested thattoxic dinoflagellates enhance their growth by using otherphytoplankton as prey, a behavior that contributes to bloominitiation (Stoecker et al., 1997; Adolf et al., 2008). The benefits forthe mixotrophs would be twofold: they would obtain extranutrients through feeding while simultaneously reducing thenumber of competitors for inorganic nutrients. But is this extraenergy really relevant for the metabolism of a bloom-formingmixotroph? Assuming the ingested food is converted into growthwith an efficiency of 25% (Straile, 1997), the specific maximumingestion rates shown in Table 6 render a growth rate of0.17 � 0.075 d�1, which may be a relevant amount during bloominitiation, when cells are leaving lag phase but have not yet enteredexponential phase; however, it is not substantial by the time the algaeare exponentially growing.
The literature contains contrasting results regarding the impactof a harmful species feeding on other algae. Li et al. (2001)estimated that the daily grazing impact of K. veneficum (G.
galatheanum) on naturally occurring populations of cryptophytesin Chesapeake Bay was <4% of the standing stock. However, Jeonget al. (2005) derived daily removals of >100% of cryptophytepopulations by Prorocentrum donghaiense, H. triquetra, andProrocentrum micans populations in Masan Bay, Korea, and forGonyaulax polygramma in the coastal waters off Saemankeum,
Korea. These later results suggest that, during blooms, algal grazershave a considerable grazing impact on populations of co-occurringautotrophic prey species. On the whole, it is clear from the presentstudy and others discussed herein that the role of mixotrophy inthe formation of HABs cannot be easily explained; rather, moreinformation is needed before the dynamics of these complex andimportant organisms are fully understood.
4.6. Final remarks
Our data and those from other studies leave little room for doubtthat HABs are characterized by and may indeed rely on strainvariability. It is particularly remarkable that the eleven strainsretained their metabolic differences long after being cultivatedunder homogeneous conditions. It has been suggested that undernon-limiting conditions fast growth would be selected duringexponential phase (Lakeman et al., 2009), which over a sufficientamount of time could homogenize differences between strains.Similarly, in-culture selection for increased performance of one traitshould reduce the presence of a negatively correlated trait (Lakemanet al., 2009). Therefore, for strains of the same species, the ability togrow in rich medium would be negatively correlated with thealternative, trophic pathway (mixotrophy). However, according toour data this is not the case; rather, the opposite may occur.Moreover, the strains compared in the present study were isolated atthe same time, from the same fully developed bloom, which,according to the conceptual model of Adolf et al. (2008) could havereduced the variability among them. Similar strain variability wasalso reported regarding the toxin profiles of 18 strains of K. veneficum
isolated from different locations (Bachvaroff et al., 2009), and for thespecific growth rates of Alexandrium tamarense strains simulta-neously isolated from the east coast of Scotland (Tillmann et al.,2009). Thus, it is likely that strain variability is a more resilient traitthan previously thought. But what about the ability of those cellswith lower performance to compete and survive? That questionmight be answered by our observation of very few poorlyperforming strains; although it may be that many of such strainswere unable to survive the selection process. Nevertheless, it can beassumed that most cells in a bloom are fast growing, as it guaranteesthat the community prospers. However, genetic variability is crucialfor any species/population to evolve and survive; thus, strains/cellsnot well adapted to fast growth may be better at surviving undervery different conditions, due, for example, to a higher resistance tograzing or to a higher capacity to form cysts. These hypotheses needto be tested in future works.
Acknowledgements
This work was funded through projects CTM2004-02575/MARand CTM2009-08783 from the Ministry of Science and Innovationto A.C. E.G. was supported by a Ramon y Cajal contract of theSpanish Ministry of Science and Innovation (MICINN), and C.F-G.by Comision Nacional de Investigacion Ciencia y Tecnologıa(CONICYT) Chile. We thank IRTA Institute from the Generalitat
de Catalunya for the continuous monitoring of HABs and forproviding the natural samples. We also thank K. Andree forsubmitting the ITS sequences. Sequencing work was fundedthrough the project INIA and project RTA2005-00109-00-0. [SS]
References
Adolf, J.E., Bachvaroff, T., Place, A.R., 2008. Can cryptophyte abundance trigger toxicKarlodinium veneficum blooms in eutrophic estuaries? Harmful Algae 8 (1),119–128.
Adolf, J.E., Place, A.R., Stoecker, D.K., Harding, L.W., 2007. Modulation of polyunsat-urated fatty acids in mixotrophic Karlodinium veneficum (Dinophyceae) and itsprey, Storeatula major (Cryptophyceae). Journal of Phycology 43, 1259–1270.

A. Calbet et al. / Harmful Algae 10 (2011) 654–667666
Adolf, J.E., Stoecker, D.K., Harding, L.W., 2006. The balance of autotrophy andheterotrophy during mixotrophic growth of Karlodinium micrum (Dinophy-ceae). Journal of Plankton Research 28 (8), 737–751.
Arenovski, A.L., Lim, E.L., Caron, D.A., 1995. Mixotrophic nanoplankton in oligotro-phic surface waters of the Sargasso Sea may employ phagotrophy to obtainmajor nutrients. Journal of Plankton Research 17, 801–820.
Ajani, P., Hallegraeff, G., Pritchard, T., 2001. Historic overview of algal blooms inmarine and estuarine waters of New South Wales, Australia. In: Proceedings ofthe Linnean Society of New South Wales 123, Australia, pp. 1–22.
Bachvaroff, T.R., Adolf, J.E., Place, A.R., 2009. Strain variation in Karlodinium vene-ficum (Dinophyceae): toxin profiles, pigments, and growth characteristics.Journal of Phycology 45 (1), 137–153.
Barsanti, L., Bastianini, A., Passarelli, V., Tredici, M.R., Gualtieri, P., 2000. Fatty acidcontent in wild type and WZSL mutant of Euglena gracilis. Effects of carbonsource and growth conditions. Journal of Applied Phycology 12 (3), 515–520.
Bird, D.F., Kalff, J., 1989. Phagotrophic sustenance of a metalimnetic phytoplanktonpeak. Limnology and Oceanography 34, 155–162.
Bjornland, T., Tangen, K., 1979. Pigmentation and morphology of a marine Gyro-dinium (Dinophyceae) with a major carotenoid different from peridinin andfucoxanthin. Journal of Phycology 15, 457–463.
Bjørnsen, P.K., Kuparinen, J., 1991. Growth and herbivory by heterotrophic dino-flagellates in the Southern Ocean, studied by microcosm experiments. MarineBiology 109, 397–405.
Braarud, T., 1957. A red water organism from Walvis Bay. Galathea Reports 1, 137–138.
Broglio, E., Jonasdottir, S.H., Calbet, A., Jakobsen, H.H., Saiz, E., 2003. Effect ofheterotrophic versus autotrophic food on feeding and reproduction of thecalanoid copepod Acartia tonsa: relationship with prey fatty acid composition.Aquatic Microbial Ecology 31 (3), 267–278.
Burkholder, J., Glibert, P., Skelton, H., 2008. Mixotrophy, a major mode of nutritionfor harmful algal species in eutrophic waters. Harmful Algae 8 (1), 77–93.
Caron, D.A., Sandres, R.W., Lim, E.L., Marrase, C., Amaral, L.A., Whitney, S., Aoki, R.B.,Porter, K.G., 1993. Light-dependent phagotrophy in the freshwater mixotrophicChrysophyte Dinobryon cylindricum. Microbial Ecology 25, 93–111.
Carrillo, E., Ferrero, L.M., Alonso Andicoberry, C., Basanta, A., Martin, A., Lopez Rodas,V., Costas, E., 2003. Interstrain variability in toxin production in populations ofthe cyanobacterium Microcystis aeruginosa from water-supply reservoirs ofAndalusia and lagoons of Donana National Park (Southern Spain). Phycologia42 (3), 269–274.
Cosgrove, J., Grigo, S., Hosja, W., Hallegraeff, G., 2000. The investigation of adinoflagellate associated with a fish kill event in the Murray River/estuary,Western Australia. In: Hallegraeff, G.M., Blackburn, S.I., Bolch, C.J., Lewis, R.J.(Eds.), Abstract in 9th International Conference on Harmful Algal Bloom.UNESCO, Hobart, Tasmania (Australia), p. 518.
Dalsgaard, J., St John, M., Kattner, G., Muller-Navarra, D., Hagen, W., 2003. Fatty acidtrophic markers in the pelagic marine environment. Advances in MarineBiology 46, 227–318.
Estep, K.W., Davis, P.G., Keller, M.D., Sieburth, J.M., 1986. How important areoceanic algal flagellates in bacterivory? Limnology and Oceanography 31,646–650.
Fernandez-Tejedor, M., Gimenez, G., de la Iglesia, P., Diogene, J., 2009. Resultados delprograma de seguimiento de fitoplancton toxico y biotoxinas en las zonas deproduccion de bivalvos de Cataluna: anos 2007–2008. In: Costa, P.R., Botelho,M.J., Rodrigues, S.M., Palma, A.S., Moita, M.T. (Eds.), Proceedings de la X ReunionIberica sobre Fitoplancton Toxico y Biotoxinas 2009. IPIMAR, Lisboa, Portugal,pp. 15–29.
Frost, B.W., 1972. Effects of size and concentration of food particles on the feedingbehavior of the marine planktonic copepod Calanus pacificus. Limnology andOceanography 17, 805–815.
Fuentes-Grunewald, C., Garces, E., Rossi, S., Camp, J., 2009. Use of the dinoflagellateKarlodinium veneficum as a sustainable source of biodiesel production. Journalof Industrial Microbiology and Biotechnology 36 (9), 1215–1224.
Glibert, P.M., Burkholder, J.M., Kana, T.M., Alexander, J., Skelton, H., Shilling, C., 2009.Grazing by Karenia brevis on Synechococcus enhances its growth rate and mayhelp to sustain blooms. Aquatic Microbial Ecology 55, 17–30.
Glibert, P.M., Legrand, C., 2006. The diverse nutrient strategies of harmful algae:focus on osmotrophy. In: Graneli, E., Turner, J.T. (Eds.), Ecology of HarmfulAlgae. Springer-Verlag, Berlin Heidelberg (Ecological Studies, vol. 189).
Guillard, R.R.L., 1975. Culture of phytoplankton for feeding marine invertebrates. In:Smith, W.L., Chanley, M.H. (Eds.), Culture of Marine Invertebrate Animals.Plenum Press, New York, pp. 29–60.
Hallegraeff, G.M., Nichols, P.D., Volkman, J.K., Blackburn, S.I., Everit, D., 1999.Pigments, fatty acids, and sterols of the toxic dinoflagellate Gymnodiniumcatenatum. Journal of Phycology 27, 591–599.
Hansen, P.J., 1992. Particle size selection, feeding rates and growth dynamics ofmarine heterotrophic dinoflagellates, with special emphasis on Gyrodiniumspirale. Marine Biology 114, 327–334.
Hansen, F.C., Witte, H.J., Passarge, J., 1996. Grazing in the heterotrophic dinoflagel-late Oxyrrhis marina: size selectivity and preference for calcified Emilianahuxleyi cells. Aquatic Microbial Ecology 10, 307–313.
Hansen, G., Daugbjerg, N., Henriksen, P., 2000. Comparative study of Gymnodiniummikimotoi and Gymnodinium aureolum, comb. nov. (=Gyrodinium aureolum)based on morphology, pigment composition, and molecular data. Journal ofPhycology 36 (2), 394–410.
Ichimi, K., Suzuki, T., Ito, A., 2002. Variety of PSP toxin profiles in various culturestrains of Alexandrium tamarense and change of toxin profile in natural A.
tamarense population. Journal of Experimental Marine Biology and Ecology273 (1), 51–60.
Jacobson, D.M., Anderson, D.M., 1986. Thecate heterotrophic dinoflagellates feedingbehavior and mechanisms. Journal of Phycology 22, 249–258.
Jeong, H.J., Yoo, Y.D., Park, J.Y., Song, J.Y., Kim, S.T., Lee, S.H., Kim, K.Y., Yih, W.H.,2005. Feeding by phototrophic red-tide dinoflagellates: five species newlyrevealed and six species previously known to be mixotrophic. Aquatic MicrobialEcology 40, 133–150.
Jonasdottir, S.H., 1994. Effects of food quality on the reproductive success of Acartiatonsa and Acartia hudsonica: laboratory observations. Marine Biology 121, 67–81.
Jones, H.L.J., 1997. A classification of mixotrophic protists based on their behaviour.Freshwater Biology 37, 35–43.
Jones, H.L.J., Leadbeater, B.S.C., Green, J.C., 1993. Mixotrophy in marine species ofChrysochromulina (Prymnesiophyceae): ingestion and digestion of a small greenflagellate. Journal of Marine Biology Association UK 73, 283–296.
Jones, R.I., 2000. Mixotrophy in planktonic protists: an overview. FreshwaterBiology 45 (2), 219–226.
Klein Breteler, W.C.M., Schogt, N., Baas, M., Schouten, S., Kraay, G.W., 1999. Trophicupgrading of food quality by protozoans enhancing copepod growth: role ofessential lipids. Marine Biology 135 (1), 191–198.
Lakeman, M.B., von Dassow, P., Cattolico, R.A., 2009. The strain concept in phyto-plankton ecology. Harmful Algae 8 (5), 746–758.
Lee, R.F., Nevenzel, J.C., Paffenhofer, G.A., 1971. Importance of wax ester and otherlipids in the marine food chain: phytoplankton and copepods. Marine Biology 9,99–108.
Legrand, C., Graneli, E., Carlsson, P., 1998. Induced phagotrophy in the photosyn-thetic dinoflagellate Heterocapsa triquetra. Aquatic Microbial Ecology 15,65–75.
Li, A.S., Stoecker, D.K., Adolf, J.E., 1999. Feeding, pigmentation, photosynthesis andgrowth of the mixotrophic dinoflagellate Gyrodinium galatheanum. AquaticMicrobial Ecology 19 (2), 163–176.
Li, A.S., Stoecker, D.K., Coats, D.W., 2000a. Mixotrophy in Gyrodinium galatheanum(Dinophyceae): Grazing responses to light intensity and inorganic nutrients.Journal of Phycology 36 (1), 33–45.
Li, A.S., Stoecker, D.K., Coats, D.W., 2000b. Spatial and temporal aspects of Gyrodi-nium galatheanum in Chesapeake Bay: distribution and mixotrophy. Journal ofPlankton Research 22 (11), 2105–2124.
Li, A.S., Stoecker, D.K., Coats, D.W., 2001. Use of the ‘food vacuole content’ method toestimate grazing by the mixotrophic dinoflagellate Gyrodinium galatheanum oncryptophytes. Journal of Plankton Research 23 (3), 303–318.
Loret, P., Tengs, T., Villareal, T.A., Singler, H., Richardson, B., McGuire, P., Morton, S.,Busman, M., Campbell, L., 2002. No difference found in ribosomal DNAsequences from physiologically diverse clones of Karenia brevis (Dinophyceae)from the Gulf of Mexico. Journal of Plankton Research 24 (7), 735–739.
Mansour, M.P., Volkman, J.K., Blackburn, S.I., 2003. The effect of growth phase on thelipid class, fatty acid and sterol composition in the marine dinoflagellate,Gymnodinium sp in batch culture. Phytochemistry 63 (2), 145–153.
Nakamura, Y., Suzuki, S.Y., Hiromi, J., 1995. Growth and grazing of a nakedheterotrophic dinoflagellate. Gyrodinium dominans. Aquatic Microbial Ecology9 (2), 157–164.
Nascimento, S.M., Purdie, D.A., Morris, S., 2005. Morphology, toxin composition andpigment content of Prorocentrum lima strains isolated from a coastal lagoon insouthern UK. Toxicon 45 (5), 633–649.
Nejstgaard, J., Tang, K., Steinke, M., Dutz, J., Koski, M., Antajan, E., Long, J., 2007.Zooplankton grazing on Phaeocystis: a quantitative review and future chal-lenges. Biogeochemistry 83, 147–172.
Paz, B., Riobo, P., Ramilo, I., Franco, J.M., 2007. Yessotoxins profile in strains ofProtoceratium reticulatum from Spain and USA. Toxicon 50 (1), 1–17.
Putt, M., 1990. Metabolism of photosynthate in the chloroplastretaining ciliateLaboea strobila. Marine Ecology Progress Series 60, 271–282.
Raven, J.A., 1997. Phagotrophy in phototrophs. Limnology and Oceanography 42 (1),198–205.
Reuss, N., Poulsen, L.K., 2002. Evaluation of fatty acids as biomarkers for a naturalplankton community. A field study of a spring bloom and a post-bloom periodoff West Greenland. Marine Biology 141, 423–434.
Rynearson, T.A., Armbrust, E.V., 2000. DNA fingerprinting reveals extensive geneticdiversity in a field population of the centric diatom Ditylum brightwellii.Limnology and Oceanography 45, 1329–1340.
Ruiz, J., Antequera, T., Andres, A.I., Petron, M.J., Muriel, E., 2004. Improvement of asolid phase extraction method for analysis of lipid fractions in muscle foods.Analytica Chimica Acta 520 (1–2), 201–205.
Sanders, W.R., 1991. Mixotrophic protists in marine and freshwater ecosystems.Journal of Protozoology 38, 76–81.
Sheng, J., Malkiel, E., Katz, J., Adolf, J.E., Place, A.R., 2010. A dinoflagellate exploitstoxins to immobilize prey prior to ingestion. Proceedings of the NationalAcademy of Sciences 107 (5), 2082–2087.
Skovgaard, A., 1996. Mixotrophy in Fragilidium subglobosum (Dinophyceae): growthand grazing responses as function of light intensity. Marine Ecology ProgressSeries 143, 247–253.
Skovgaard, A., Hansen, P.J., Stoecker, D.K., 2000. Physiology of the mixotrophicdinoflagellate Fragilidium subglobosum. I. Effects of phagotrophy and irradianceon photosynthesis and carbon content. Marine Ecology Progress Series 201,129–136.
Stickney, H.L., Hood, R.R., Stoecker, D.K., 2000. The impact of mixotrophy onplanktonic marine ecosystems. Ecological Modelling 125, 203–230.

A. Calbet et al. / Harmful Algae 10 (2011) 654–667 667
Stoecker, D.K., Li, A., Coats, D.W., Gustafson, D.E., Nannen, M.K., 1997. Mixotrophy inthe dinoflagellate Prorocentrum minimum. Marine Ecology Progress Series 152,1–12.
Straile, D., 1997. Gross growth efficiencies of protozoan and metazoan zooplanktonand their dependence on food concentration, predator-prey weight ratio, andtaxonomic group. Limnology Oceanography 42 (6), 1375–1385.
Strom, S.L., Buskey, E.J., 1993. Feeding, growth, and behavior of the thecate hetero-trophic dinoflagellate Oblea rotunda. Limnology and Oceanography 38, 965–977.
Strom, S.L., Morello, T.A., 1998. Comparative growth rates and yields of ciliates andheterotrophic dinoflagellates. Journal of Plankton Research 20 (3), 571–584.
Terlizzi, D.E., 2000. Gyrodinium galatheanum: a threat to estuarine aquaculture. re-sponsible aquaculture in the new millenium. In: Flos, R., Creswell, L. (Eds.), Ab-stracts of contributions presented at the International Conference AQUA 2000.Nice, France, May 2–6, 2000. European Aquaculture Society Special Publication No28 Oostende, Belgium.
Tillmann, U., Alpermann, T.L., da Purificacao, R.C., Krock, B., Cembella, A., 2009.Intra-population clonal variability in allelochemical potency of the toxigenicdinoflagellate Alexandrium tamarense. Harmful Algae 8 (5), 759–769.
Vaque, D., Felipe, J., Sala, M.M., Calbet, A., Estrada, M., Alcaraz, M., 2006. Effects of thetoxic dinoflagellate Karlodinium sp. (cultured at different N/P ratios) on microand mesozooplankton. Scientia Marina 70 (1), 59–65.
Waggett, R.J., Tester, P.A., Place, A.R., 2008. Anti-grazing properties of the toxicdinoflagellate Karlodinium veneficum during predator–prey interactions withthe copepod Acartia tonsa. Marine Ecology Progress Series 366, 31–42.
Wang, D.Z., Zhang, S.G., Gu, H.F., Chan, L.L., Hong, H.S., 2006. Paralytic shellfish toxinprofiles, and toxin variability of the genus Alexandrium (Dinophyceae) isolatedfrom the Southeast China Sea. Toxicon 48 (2), 138–151.
Yoo, Y.D., Jeong, H.J., Kang, N.S., Song, J.Y., Kim, K.Y., Lee, G., Kim, J., 2010. Feeding bythe newly described mixotrophic dinoflagellate Paragymnodinium shiwhaense:feeding mechanism, prey species, and effect of prey concentration. Journal ofEukaryotic Microbiology 57 (2), 145–158.