Intra-Site Analysis and Photogrammetry: the Case Study of the ‘Buca Di Spaccasasso’ (Grosseto,...
13
295 Intra-Site Analysis and Photogrammetry: the Case Study of the ‘Buca Di Spaccasasso’ (Grosseto, Italy) an Eneolithic Funerary Site Giovanna Pizziolo, Daniele Pirisino, Carlo Tessaro and Nicoletta Volante University of Siena, Italy Abstract: Here we present the outcome of a project that involved the implementation of an intra-site GIS based on photogrammetric methodologies at Spaccasasso Cave (Grosseto, Italy), an Eneolithic funerary site, the main burial chamber of which shows evidence of complex depositional practices. Due to their peculiar archaeological context, traditional excavation procedures are ineffective in recording these prehistoric palaeosurfaces. As a result, we have turned to using photogrammetric applications. The goal is to obtain 3D photorealistic restitutions in order to create DEM and ortophotographs, which are useful for managing archaeological information in a GIS. Two different methodologies are employed. The first is based on ERDAS IMAGINE LPS software, while the other makes use of open source software based on multi-vision scene reconstruction. 3D survey methodologies make it possible to render a realistic model of the archaeological site, which is an asset for recording qualitative data and 3D information, which is then used for performing intra-site analyses. We assess the different methods by focusing on the practical and logistical requirements of the excavation process. Keywords:: Intra-site GIS, Photogrammetry, Copper Age 1. Introduction This paper deals primarily with the archaeological application of digital photogrammetry and the implementation of GIS for taphonomic analysis. After a brief presentation of the archaeological context of Spaccasasso Cave, we focus on its morphological and archaeological characteristics, which have heavily influenced the choice of data- acquisition methodologies. Due to its peculiar archaeological context, traditional documentation maps are not effective tools for recording this prehistoric site; we therefore used photogrammetric elaboration. The paper presents the application of different methodologies based on photogrammetry and discusses the pros and cons of each application. The general assessment is intended to determine the most efficient tools for our real case study, not for an abstract or merely theoretical situation. We have tested whether the methodologies adopted fit well into the standard archaeological documentation procedure and allow us to carry out an intra-site analysis. The process Corresponding author: [email protected] of photogrammetric elaboration started in 2010, though only in an experimental phase, and in previous years was carried out via photographs which had not been taken with photogrammetric application in mind. The paper presents a comparison between the different methods adopted and provides an assessment focusing on the practical and logistic needs of the excavation process. 2. The Buca di Spaccassasso: Archaeological Background The Buca di Spaccasasso Cave is a prehistoric site located on a calcareous hill in Maremma Regional Natural Park in Uccellina (Southern Tuscany, Grosseto, Italy). The cave is characterised by thermal action, which causes mercury sulphide to be deposited on the limestone rock and results in cinnabar veins. Cinnabar minerals were harvested in different phases of occupation, and the site shows evidence of occupation over a long period of time, which offers the main proof connecting
Transcript of Intra-Site Analysis and Photogrammetry: the Case Study of the ‘Buca Di Spaccasasso’ (Grosseto,...

295
Intra-Site Analysis and Photogrammetry: the Case Study of the ‘Buca Di Spaccasasso’
(Grosseto, Italy) an Eneolithic Funerary Site
Giovanna Pizziolo, Daniele Pirisino, Carlo Tessaro and Nicoletta Volante University of Siena, Italy
Abstract:Here we present the outcome of a project that involved the implementation of an intra-site GIS based on photogrammetric methodologies at Spaccasasso Cave (Grosseto, Italy), an Eneolithic funerary site, the main burial chamber of which shows evidence of complex depositional practices. Due to their peculiar archaeological context, traditional excavation procedures are ineffective in recording these prehistoric palaeosurfaces. As a result, we have turned to using photogrammetric applications. The goal is to obtain 3D photorealistic restitutions in order to create DEM and ortophotographs, which are useful for managing archaeological information in a GIS. Two different methodologies are employed. The first is based on ERDAS IMAGINE LPS software, while the other makes use of open source software based on multi-vision scene reconstruction. 3D survey methodologies make it possible to render a realistic model of the archaeological site, which is an asset for recording qualitative data and 3D information, which is then used for performing intra-site analyses. We assess the different methods by focusing on the practical and logistical requirements of the excavation process.
Keywords::Intra-site GIS, Photogrammetry, Copper Age
1. Introduction
This paper deals primarily with the archaeological application of digital photogrammetry and the implementation of GIS for taphonomic analysis. After a brief presentation of the archaeological context of Spaccasasso Cave, we focus on its morphological and archaeological characteristics, which have heavily influenced the choice of data-acquisition methodologies. Due to its peculiar archaeological context, traditional documentation maps are not effective tools for recording this prehistoric site; we therefore used photogrammetric elaboration. The paper presents the application of different methodologies based on photogrammetry and discusses the pros and cons of each application. The general assessment is intended to determine the most efficient tools for our real case study, not for an abstract or merely theoretical situation. We have tested whether the methodologies adopted fit well into the standard archaeological documentation procedure and allow us to carry out an intra-site analysis. The process
Corresponding author: [email protected]
of photogrammetric elaboration started in 2010, though only in an experimental phase, and in previous years was carried out via photographs which had not been taken with photogrammetric application in mind. The paper presents a comparison between the different methods adopted and provides an assessment focusing on the practical and logistic needs of the excavation process.
2. The Buca di Spaccassasso: Archaeological Background
The Buca di Spaccasasso Cave is a prehistoric site located on a calcareous hill in Maremma Regional Natural Park in Uccellina (Southern Tuscany, Grosseto, Italy). The cave is characterised by thermal action, which causes mercury sulphide to be deposited on the limestone rock and results in cinnabar veins. Cinnabar minerals were harvested in different phases of occupation, and the site shows evidence of occupation over a long period of time, which offers the main proof connecting

CAA2012 Proceedings of the 40th Conference in Computer Applications and Quantitative Methods in Archaeology, Southampton, United Kingdom, 26-30 March 2012
296
Figure 1. The archaeological and morphological context of Spaccasasso site.
it to the Copper Age, the Early and Middle Bronze Age, and Late Antiquity (V-VI cen. A.D.). During the Late Copper Age the site was also used as a funerary area, characterised by secondary deposition rituals.
The archaeological investigation, which is still in progress, was begun by the Board of Archaeological Heritage in Tuscany (Soprintendenza per i Beni Archeologici della Toscana) in 2000, and has been overseen by Siena University since 2004. The excavation is focused on the funerary area located in the external side of the cave and at the base of a sub-vertical rock shelter (Fig. 1). The area is delimited on the western side by three boulders and on the southern and northern sides by medium-sized stones that form a sort of wall. These features border the funerary chamber, which is about 2.5 meters wide. Due to its particular natural location and the style of its pottery, Spaccasasso can be classed as part of the ‘Grosseto Group’ (Leonini and Volante 2005). The stratigraphy shows evidence of complex secondary funerary rituals, in which substantial deposition occurred between the Late Copper Age and Early Bronze Age. Similar funerary rituals are not so common for the Late Eneolithic in central Italy, but are in fact more common in northern Italy. In secondary funerary rituals, human bones were laid down following the initial removal of flesh, sometimes resulting from the effects of a fire that took
place somewhere else. At Spaccasasso, human bones and grave goods have consequently been displaced and arranged in the funerary chamber according to the different deposition processes, resulting in a chaotic array of bones. They are arranged out of anatomical order, are fragmented, and are mixed with other items such as pottery and to a lesser extent lithic artefacts and beads. In several cases, layers of stones were prepared to support or to cover unarticulated bones that had been either arranged randomly or spatially organised according to different conditions.
3. General Aims and On-Site Methodology
Due to this complex situation, it is fundamental that taphonomic analyses are carried out very carefully, using the maximum amount of detailed information acquired during the excavation, and with the additional aim of using the information related to the depth of bones and palaeosurfaces. For this reason, the standard way of drawing maps on site is insufficient for recording all the data related to bones, artefacts, and possible stone floors without the documentation process being very time-consuming and affecting the logistics of the excavation. Therefore, since 2005 some experimental strategies have been applied using different methods of photographic documentation. Since then we have chosen the following strategy: after a quick rectification is carried out, photographs are printed on-site so as to use them to record data during the excavation. The photo prints are then used as a ‘background’ onto which the ID and x-y-z coordinates of the centre of every single bone, artefacts and stone (when necessary) are recorded, while every shape is outlined in different colours according to their characteristics. These sketches represent raw information, which is then developed by means of the methods that we will discuss in the following paragraphs to obtain regular archaeological documentation maps.
Intra-Site Analysis and Photogrammetry: the Case Study of the ‘Buca Di Spaccasasso’ Giovanna Pizziolo et al.
297
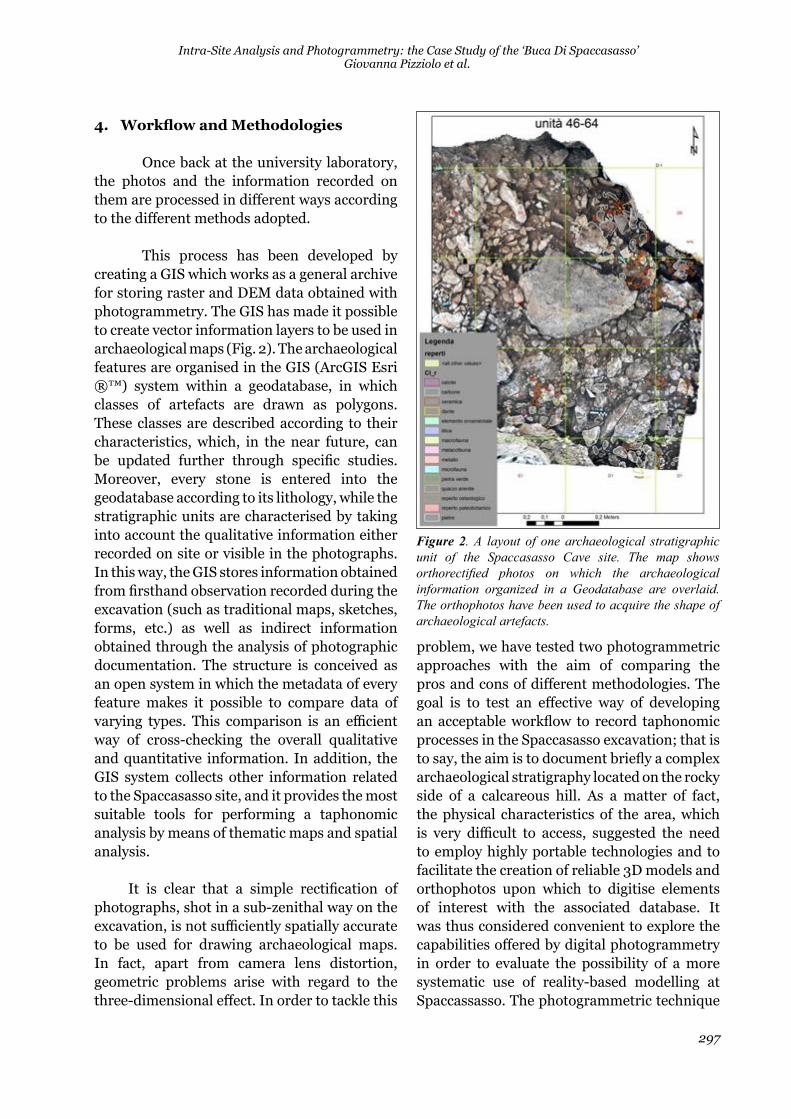
Figure 2. A layout of one archaeological stratigraphic unit of the Spaccasasso Cave site. The map shows orthorectified photos on which the archaeological information organized in a Geodatabase are overlaid. The orthophotos have been used to acquire the shape of archaeological artefacts.
4. Workflow and Methodologies
Once back at the university laboratory, the photos and the information recorded on them are processed in different ways according to the different methods adopted.
This process has been developed by creating a GIS which works as a general archive for storing raster and DEM data obtained with photogrammetry. The GIS has made it possible to create vector information layers to be used in archaeological maps (Fig. 2). The archaeological features are organised in the GIS (ArcGIS Esri ®™) system within a geodatabase, in which classes of artefacts are drawn as polygons. These classes are described according to their characteristics, which, in the near future, can be updated further through specific studies. Moreover, every stone is entered into the geodatabase according to its lithology, while the stratigraphic units are characterised by taking into account the qualitative information either recorded on site or visible in the photographs. In this way, the GIS stores information obtained from firsthand observation recorded during the excavation (such as traditional maps, sketches, forms, etc.) as well as indirect information obtained through the analysis of photographic documentation. The structure is conceived as an open system in which the metadata of every feature makes it possible to compare data of varying types. This comparison is an efficient way of cross-checking the overall qualitative and quantitative information. In addition, the GIS system collects other information related to the Spaccasasso site, and it provides the most suitable tools for performing a taphonomic analysis by means of thematic maps and spatial analysis.
It is clear that a simple rectification of photographs, shot in a sub-zenithal way on the excavation, is not sufficiently spatially accurate to be used for drawing archaeological maps. In fact, apart from camera lens distortion, geometric problems arise with regard to the three-dimensional effect. In order to tackle this
problem, we have tested two photogrammetric approaches with the aim of comparing the pros and cons of different methodologies. The goal is to test an effective way of developing an acceptable workflow to record taphonomic processes in the Spaccasasso excavation; that is to say, the aim is to document briefly a complex archaeological stratigraphy located on the rocky side of a calcareous hill. As a matter of fact, the physical characteristics of the area, which is very difficult to access, suggested the need to employ highly portable technologies and to facilitate the creation of reliable 3D models and orthophotos upon which to digitise elements of interest with the associated database. It was thus considered convenient to explore the capabilities offered by digital photogrammetry in order to evaluate the possibility of a more systematic use of reality-based modelling at Spaccassasso. The photogrammetric technique

CAA2012 Proceedings of the 40th Conference in Computer Applications and Quantitative Methods in Archaeology, Southampton, United Kingdom, 26-30 March 2012
298
provides new data for our taphonomic studies and offers the invaluable benefit of being able to recover 3D data that would otherwise be lost. Part of our project is dedicated to the use of photogrammetry and to the use of photographical documentation taken years ago when we did not foresee any specific use for photogrammetric elaboration.
Before attempting photogrammetric elaboration, we have experimented with the use of laser scanner techniques on the Spaccasasso site. The scanning, carried out by Tecsette with a Laser Scanner (Mensi GF200), was executed with TOF technology (optimal range 2-100m distance with millimetric accuracy), obtaining different scanned areas, which have subsequently been merged. The scanning was set up every 3mm along each surface, and the laser was placed in different positions in order to scan the funerary chamber, the rock shelter, and the cave.
The data have been used to reconstruct the whole funerary environment and to explore the spatial relationship between these features in order to understand the ‘scenographic’ settings of the funerary area. Moreover, the scanning of the funerary chamber was used as a reference measurement in order to compare it with other 3D reconstructions of the palaeosurfaces. Evidently the scanning techniques represent the best solution for obtaining 3D data from a surface; however, in practical terms it is not feasible to use this tool continually on the excavation to document the different archaeological layers. In this archaeological context, we need 3D data for every single archaeological layer in order to develop a taphonomic analysis, and we need to link that information to our geodatabase.
5. First Use of Photogrammetry: Leica Photogrammetry Suite
The decision to resort to photogrammetric methods was made in the fall of 2010, after
the conclusion of that year’s campaign. At this point, it is relevant to discuss the experimental nature of the way in which the project was first carried out. Indeed, our workflow was heavily affected by the fact that the set of data available had not been recorded with the use of digital photogrammetry in mind, and that not all the imagery at our disposal could successfully be used in the photogrammetric process. Notwithstanding that, it has been possible to generate very accurate DEMs and orthophotos for the implementation of an intra-site 3D GIS. In addition, the project tested the validity of the excavation records and highlighted the interaction between the data produced with traditional archaeological documentation techniques (both written and visual records) and the operational procedures of the software available to us, namely Leica Photogrammetry Suite 9.2. 2
The first step required a thorough examination of the excavation’s archive in order to collect the necessary data, such as digital images and ground measurements. The most suitable photographs were selected from among the many available according to the criteria of area coverage and image overlap. Special attention was paid to the uniformity of the principal factors that affect the scale of the images, namely the focal length and the camera’s height above the ground. The consistency of camera rotation angles were also taken into account, and the best results were obtained by processing images produced with a minimal angle of inclination in relation to the vertical. However, the absolute validity of the imagery was assessed following a somewhat time-consuming and empirical process, and several projects were run with different sets of data. Most of the photographs available were produced so as to represent one square of the excavation grid at a time; however, our archaeological focus did not necessarily revolve around contiguous areas of the grid, and the
2 The procedures of use for the software are briefly summarised in the present paragraph. An exhaustive analysis of the settings and operational workflow can be found in the user guides 2008 ‘Project Manager’ and ‘Automatic Terrain Extraction’ of Leica Photogrammetry Suite software.

Intra-Site Analysis and Photogrammetry: the Case Study of the ‘Buca Di Spaccasasso’ Giovanna Pizziolo et al.
299
Figure 3. In the foreground the Triangulation Summary and the Triangulation Report with control points and the check points’ residuals. In the background, the Point Measurement view.
sequence of the exposure stations did not follow the logic of a continuous strip or a consistent direction of flight, nor were the neighbouring grid squares always photographed at the same stage of the excavation. Most of the overlapping photographs thus displayed only one square at a time, with a very high degree of overlap percentage (often exceeding 85%). There were also gaps of unrecorded space between adjacent excavation grid squares which were not covered by the overlapping images. For this reason, modules of two photographs had to be used for each one of the required photogrammetric restitutions, as it has not been possible to process blocks containing larger numbers of images.
Another essential issue to overcome was identifying and retrieving the ground control points coordinates for the successive steps of the photogrammetric workflow. These were recovered from the set of excavation plans, which were traced in the field using the photo print-outs as a reference. The excavation plans display many of the features that are also identifiable in the images used for the photogrammetric process, and clearly indicate the measured elements of interest (e.g. artefacts, bones, removed stones, grid vertices). Each element of interest was assigned an identification number and was recorded on catalogue sheets along with all the necessary information, including their spatial coordinates, since they were measured on the field by means
of optical instruments. In this way, a redundant number of ground coordinates were collected and used as ground control points. Moreover, some of the measured features were used as checkpoints to assess the overall accuracy of the triangulation solution. The tie points, on the other hand, were automatically generated by the software. Overall, the retrieval of the data through the examination of the excavation archive proved effective. In fact, the outcomes of the aerial triangulations of the most successful projects yielded a very high standard of accuracy, and the residuals of both control points and checkpoints were kept below a very low threshold (Fig. 3).
Having obtained good triangulation results, it was possible to automatically generate high quality elevation models. Extraction reports and Point Status images were used to verify the validity and accuracy of the output DTMs. The following stage was the creation of orthorectified images, for which the DEMs were used as elevation source in the ortho resampling process. Afterwards, the 3D digital representations and the related orthophotos were uploaded into ArcGis, where the excavation view could be reconstructed, and these data were used as a background reference for the digitisation of the elements of interest and the implementation of the excavation GIS.
To conclude this concise description, the results of the photogrammetric processing and

CAA2012 Proceedings of the 40th Conference in Computer Applications and Quantitative Methods in Archaeology, Southampton, United Kingdom, 26-30 March 2012
300
the 3D GIS implementation were satisfactory. However, having to deal with incomplete and sometimes unsuitable data proved to be complex and time-consuming. In fact, the results of this work again revealed the importance of the most significant phase of the whole photogrammetric pipeline, namely project planning and the acquisition of the images. On the other hand, it has been possible to fully exploit the data produced in the field and to appreciate the potential of traditional archaeological documentation, even when its recording strategy has not been specifically devised for digital photogrammetric applications.
Nevertheless, our experiment was taken further, and the following paragraphs will discuss the employment of computer vision techniques in order to process the data from the subsequent campaign of excavations. In fact, given the validity of the 2010 results, we decided to use the Agisoft PhotoScan software to process the new 2011 set of data.
6. Computer Vision
Our first attempt aimed to increase the informative content of our existing 2D documentation, in order to render it into 3D documentation. The application of computer vision techniques can achieve this goal with an easy, fast, and low-cost solution. As far as the management of the data in the laboratory and during the excavation is concerned, this method is very convenient. In the field, only the standard equipment needed for the survey is necessary, such as a total station for measuring certain ground control points (which is useful for georeferencing the 3D models) and a standard digital camera for taking a sequence of images, which is the only necessary tool for the photogrammetric 3D reconstruction.
Computer vision (CV), sometimes called machine vision is a field of computer science that includes methods for the reconstruction and description of 3D reality from 2D images. It
is a scientific discipline that reconstructs, with mathematical methods, the 3D morphologies of objects represented in the images (Szelisky 2010) (Lillesand, Kiefer and Chipman 2007):
The goal of the computer vision is the construction of scene description from images […] (Shapiro-Stockman 2011).
State-of-the-art photogrammetric methodologies related to CV can provide archaeology with a methodology of surveying that is easy to manage, completely automated, and low-cost in comparison with other methods of 3D reconstruction, such as laser-scanning techniques.
There are a variety of different tools that have been developed as a result of CV and which are useful for 3D reconstructions based on 2D data. One such example is that of multi-view stereo algorithms. They differ from the stereo algorithms that produce dense depth maps using a pair of binocular images, in that their goal is to reconstruct a 3D scene from a set of images taken from known camera viewpoints. 3
Our work is not the first example to employ imaged-based 3D modelling in an archaeological context (Anderson 2010; Campana and Remondino 2008; El-Hakim et al. 2008; Ducke et al. 2011; Verhoeven 2011; Doneus et al. 2011), but it seems to stand out due to its development of a concrete surveying method based on a 3D photogrammetric reconstruction, and its goal to improve the standard of quality of the documentation and to increase the possibility of providing a better interpretation of the archaeological context.
The methodology can be summarised by the following set of tasks, and the workflow is an integration of different software:
• Unordered image sequence
• Structure from motion
3 A quantitative comparison of several multi-view stereo reconstruction algorithms are available online at http://vision.middlebury.edu/mview (Seitz et al. 2006).

Intra-Site Analysis and Photogrammetry: the Case Study of the ‘Buca Di Spaccasasso’ Giovanna Pizziolo et al.
301
Figure 4. Spars 3d point cloud obtained from Bundler and managed and visualized in Photoscan. The image shows the 3d information and the relative positions of the camera when the photos have been shot.
Figure 5. Dense point cloud.
Figure 6. Surface reconstruction on which the orthophoto has been draped.
• Feature extraction
• Image matching and camera reconstruction (3D sparse point cloud) (Fig. 4)
• Dense 3D point cloud (Fig. 5)
• Surface reconstruction (Fig. 6)
• Generation of a georeferenced 3D model and processing of DEM (digital elevation model) and ortho-photos.
This method consists of the integration of different software. The first step is achieved with the use of the open source software
Bundler (http://phototour.cs.washington.edu/bundler/) (Snavely, Seitz and Szeliski 2007). This first step can be broken down into smaller sequences: feature extraction (keypoints), image matching, camera position, and sparse 3D point reconstruction.
The process starts with an unordered sequence of digital images. The next step is features extraction, consisting of an automatic identification of characteristic regions for every image, and the task is further expanded by using the Scale Invariant Feature Transformation (SIFT) algorithm (Lowe 2004). The software implementation of SIFT made by its author allows the extraction of around 2000 features for every image of 500 x 500 pixels (Lowe 2004).4 In this case, the features are the regions where a particular variance of grey values are recorded, since the software implementation of the algorithm works with the copies of grey scales of the original images. The task consists of using this relation data in combination with the focal length and camera CCD width, which are parameters recorded inside the exif properties of the files. A technique known as bundle adjustment is adopted for reconstructing 3D scene geometry. The Bundler software is a structure-from-motion software that works in this way. This technique does not require any kind of parameters such as, for example, the specification of the spatial coordinates of the camera, or a set of ground control points for image rectification. The result of the Bundler elaboration is a 3D sparse scene geometry.
This output can be used to generate a 3D dense point reconstruction. There are different approaches for generating a 3D dense point cloud. One of the most accurate algorithms is PMVS (Patch-based Multi-View Stereo) (Furokawa and Ponce 2007). In any case, there are various pieces of software dedicated to this technique, some of which are open-
4 The software’s application of SIFT algorithm was written the first time by its creator D. Lowe, but it has not been released in an open license. It is, however, possible to use it for educational and research purposes: US Patent 6,711,293 (March 23, 2004). The software link is available at http://www.cs.ubc.ca/~lowe/keypoints/.

CAA2012 Proceedings of the 40th Conference in Computer Applications and Quantitative Methods in Archaeology, Southampton, United Kingdom, 26-30 March 2012
302
Method Time (s) Points
number
Min Max Mean Dev. st
PMVS 960 27239 115.1450 115.3593 115.2192 0.04461
Photoscan (point
cloud)
12 3540 115.1692 115.3239 115.2230 0.031
Photoscan (lowest) 3782 3560 115.1611 115.3415 115.2279 0.0365
Photoscan (low) 454 14161 115.1516 115.3472 115.2267 0.03819
Photoscan (medium) 3019 57364 115.1476 115.3593 115.2222 0.04072
Laser - 5034 115.1586 115.3695 115.2275 0.045
Table 1. Some processing parameters and statistics derived from the z values inside the square selected area.
source and which may be based on server webs such as Arc3d (http://homes.esat.kuleuven.be/~visit3d/webservice/v2/) or stand-alone platforms such as Photomodeler (http://www.photomodeler.com/). It is important to underline the hypothetical accuracy of the result: more than 1/200 (1mm for an object of 20cm) from a sequence of images with a resolution of less of 640 x 800 pixels (Furokawa and Ponce 2009).
The last step consists of the formation of a three-dimensional surface defined by the interpolation of the 3D dense point clouds. Some particular interpolation techniques are necessary for defining the surface (a mesh) that can be easily managed with the OS software Meshlab (http://meshlab.sourceforge.net/). The most popular algorithms are ball pivoting (Bernardini et al. 1999), poisson reconstruction (Kazhdan, Bolitho and Hoppe 2006), power crust (Amenta, Choi and Kolluri 2000), and tight cocoon (Dey and Goswami 2003). The specific method best applied is determined by the particular context. Poisson reconstruction appears to be a universal technique and it generally provides good results in all cases (Ducke 2011). Ball pivoting gives an accurate surface reconstruction, which saves time, but tends to leave many holes in the surface.
At the end of the process we need to produce a 3D georeferenced model. This step requires a complete data set of digital elevation models of units of stratifications (Harris 1975). For this task we used the software Photoscan, produced by Agisoft (LCC 2011). This software offers a complete suite for the creation of 3D models,
including the integration of SFM techniques. Photoscan is also capable of managing the 3D meshes and textures that allow for the possibility of importing the result of PMV/CMVS processes through the use of a PLY file extension. Before the photographic survey can be carried out, it is necessary to define some ground control points, which are useful for georeferencing the 3D model with Photoscan and for managing the surface in a georeferenced coordinate system. This is used to export the results with file extensions that are capable of being fed into a GIS, such as DEM (ASCII-grid) and orthophoto-mosaics (.jpeg or .tiff). These models are fed into a geodatabase where the archaeological documentation is stored. Inside this platform, the raster and vector datasets are correlated and table archives are derived from the archaeological surveying on the excavation.
7. Comparison of Methods
It is very easy to manage and create 3D models with the computer vision technique. However, it is necessary to test the method’s accuracy before confirming its use as a standard method of mapping and documenting an archaeological excavation. In order to assess the final accuracy of different modelling techniques, we should compare the results achieved with the laser scanner and the CV 3D model.
In order to assess the method’s accuracy, an area of 50cm2 was selected, which was located in the middle of the burial chamber. This area is characterised by a very non-homogenous

Intra-Site Analysis and Photogrammetry: the Case Study of the ‘Buca Di Spaccasasso’ Giovanna Pizziolo et al.
303
Figure 7. DEM surfaces obtained from laser-scanner (1), Photoscan(medium)(2) , PMVS (3) and the position of two profiles A-B.
surface layer, essentially made of small- and medium-sized stones. These stones are characterised by sharper edges, resulting from the collapse of the roof shelter. 31 photographs were necessary for the 3D reconstruction, which covers the whole funerary area. The images, the resolution of which is 4288 x 4248 pixels, were shot using a Nikon D5000 with a 24mm focal length lens. The set of images was processed using PMVS after being elaborated with Bundler, and also using the Photoscan software with some selected algorithms available for the last one (Table 1). 5
The 3D CV reconstruction was accomplished using Photoscan for the georeferencing process and for exporting the results into grid ASCII files. After this step, the
5 The algorithms of Photoscan not considered are those classified by the software such as Height field (Object type) and Sharp (geometry type). The first one is optimised for modelling planar surfaces; the second one leads to an accurate reconstruction but does not incorporate extra geometry, such as hole-filling patches. These reconstruction methods are not considered adequate for this particular context. The computations were performed with an ASUS Notebook model K53Sj, CPU Intel® Core™ i7-2630QM CPU 2.00Ghz, on a Microsoft® Windows 7 Home Premium Service Pack 1 - 64bit machine with 6.00 GB of RAM.
grid ASCII files obtained with Photoscan and the laser-scanner were entered into ESRI’s ArcGis 10 as a point geometry shapefile. These feature classes were then interpolated with the same method (ordinary kriging) and parameters, with a resolution of 0.003m cells (Fig. 4). This dimension is, to a certain extent, similar to the grid density of the laser scanner.
The laser-scanner result was considered the basis of comparison, and was treated as if it were a 100% accurate result. By comparing the difference between the CV and laser-scanner elaborations (Fig. 7), several metric and statistic values are extracted from the georeferenced surfaces (Table 2).
The amount of variation between the digital elevation models can be measured using a standard deviation. In this case the values show a similar distribution between the Photoscan medium and the PMVS algorithm. The RMSE (root mean square error) was used with the aim of illustrating the vertical position accuracy. It is similar to a standard deviation but is based on the assumption that errors in DEM are random and normally distributed (Wechsler, 1999). In this context, the accuracy is expressed in ground distance at a 95% confidence level. The reported accuracy value reflects, in theory, all uncertainties, including those introduced by geodetic control coordinates, compilation, and final computation of ground coordinate values in the product. 6 The RMSE values show that the most accurate surface, as far as the vertical accuracy is concerned, is obtained using PMVS (0,038). Nevertheless, all other results are not greatly inaccurate in terms of the vertical metric accuracy.
Moreover, an analysis of the raster maps (obtained using the difference between the DEM derived from the laser-scanner and all other 3D surfaces) shows how the PMVS algorithm tends to delineate a more homogenous surface (Fig.
6 The vertical accuracy expressed at the 95% confidence interval is based on the National Standard For Spatial Data Accuracy (NSSDA): 1.96RMSEz (Federal Geographic Data Committee 1998).

CAA2012 Proceedings of the 40th Conference in Computer Applications and Quantitative Methods in Archaeology, Southampton, United Kingdom, 26-30 March 2012
304
Method Min (diff) Max (diff) St. Dev Mean RMSE*
Photoscan (point-
cloud)
-0.075 0.065 0.0189 0.00438 0.044
Photoscan (lowest) -0.096 0.051 0.018 0.00057 0.037
Photoscan (low) -0.092 0.061 0.019 0.00073 0.040
Photosca(med) -0.92 0.061 0.019 0.00053 0.043
PMVS -0.97
Figure 10. Profile B. Visual comparison between the different surfaces along the profile line B.
Figure 9. Profile A. Visual comparison between the different surfaces along the profile line A.
Figure 8. Map algebra elaboration. These maps express the altimetric difference between the laser-scanner information (Terrestrial Laser Scanner TLS) and the other surfaces. TLS minus Photoscan-point coud (1), TLS minus Photoscan-lowest (2), TLS minus Photoscan-low (3), TLS minus Photoscan-medium (4) and TLS minus PMVS (5).
Table 2. Statistics and RMSE* (Roo t -Med ium-S tandard-Error). The values are the result of the difference between the laser scanner and the other 3d surfaces.
8). This seems to fit better with the laser-scanner result, while the Photoscan algorithm seems to outline a surface with a similar morphology. This argument, along with the RMSE* error, seems to confirm the superior accuracy of the PMVS process in respect to other computer vision software.
If we consider that the RMSE of the georeferencing process (developed
via Photoscan) reaches an accuracy of approximately 1-2 cm, and that the TLS data have a noise of +/- 1-2 cm (Böhler, Bordas and Marbs 2003; Staiger 2005) in a -10m range, we could then expect the RMSE calculation to fall in the typical random range, as we have verified (Table 2).
This test shows that the CV approach is approximately as accurate as the laser-scanner. Furthermore, a perusal of the map-algebra results and the two profiles (Figs. 7, 9 and 10) helps reveal the analogous accuracy of the two methods. The two profiles show a similar shape, where the difference seems to be due not to vertical accuracy but to a horizontal error, which is a consequence of the georeferencing process not being based on reliable ground control points (in other words, the GCP may have an error of 1-2 cm). All the measurements have been anchored to the excavation grid system

Intra-Site Analysis and Photogrammetry: the Case Study of the ‘Buca Di Spaccasasso’ Giovanna Pizziolo et al.
305
Time in data
acquisition/
elaboration
Handy in field Re-use recycle data Output
Laser Scanner One day Not much portable Not possible DEM
3D model
Leica
Photogrammetry
Suite
One day Yes but need of “ad hoc” set of
photos, difficult to shot
Possible but with some limits
in making use of a large
number of images together
DEM
orthophoto
Computer Vision 3 hours Yes, not specific requirements
for taking picture
Good flexibility in using “old”
photos. High level of re-use of
previous information
DEM
Orthophoto
3D model
Table 3. Assessment of different methods.
(50 cm2 areas) which has been georeferenced in the UTM ED 50 reference system.
At Spaccasasso, we have applied different survey techniques which showed the pros and cons regarding their flexibility, according to the needs of our archaeological documentation. The assessment of the different methods is summarised in the following table (Table 3). To sum up, we can affirm that photogrammetry proved to be the most appropriate solution for dealing with the problems of the archaeological archive of Spaccasasso. Our need for spatial accuracy was fulfilled through all the methods implemented. However, there are some differences concerning the practical side of the excavation process, as well as the amount of time required in the laboratory to manage the 3D elaboration and its GIS implementation. Moreover, it is important to note that CV allows for an easier treatment of ‘old’ photographs, i.e., those related to excavation layers shot in previous years and which had not been taken with photogrammetric application in mind. These photos, in fact, do not follow any specific schema and are obtained from different points of capture. The re-use of old photographs is a great advantage in the management of the whole archaeological recording process of the site.
Indeed, we can conclude that CV gives the best results in terms of photograph management and 3D data processing time.
8. Conclusions
In conclusion, computer vision could make it possible for GIS to become a standard for 3D archaeological documentation. CV can re-render 2D data into a complete 3D reconstruction of stratigraphy by means of spatial (geometrical) models for GIS implementation, such as 3D grid (Voxels) (Bezzi et al. 2006) or 3D boundary representation (Multipatch Geometry Type – Esri®)(Stoter and Zlatova, 2003; Katsianis et al. 2008; Lieberwirth, 2007).
A complete 3D restitution can be employed for two main purposes. The first is to create a 3D model of the archaeological stratigraphic deposit; the second is to use the model as a reference to perform spatial analyses in a volumetric space and to explore the spatial relationship between the artefacts and the stratigraphic units. Excavation and study are still in progress at Spaccasasso Cave: thus we will discuss the results of the whole system of documentation and elaboration of taphonomic data in future papers.
Acknowledgments
We are sincerely grateful to Paolo Machetti, Moris Faccone and Vincenzo De Troia of Tecsette srl for their availability to scan Spaccasasso Cave and to collaborate with us in the field.

CAA2012 Proceedings of the 40th Conference in Computer Applications and Quantitative Methods in Archaeology, Southampton, United Kingdom, 26-30 March 2012
306
This work has been carried out in full collaboration by the Authors. In particular paragraph 2 has to be attributed to N. Volante, paragraph 3 to G. Pizziolo and N. Volante, paragraph 4 has to be attributed to G. Pizziolo, paragraph 5 has to be attributed to D. Pirisino, paragraph 6 has to be attributed to C. Tessaro, paragraph 7 has to be attributed to G. Pizziolo and C. Tessaro.
References
Agisoft LCC. 2011. “Agisoft Photoscan.” Accessed 5 march
2011. http://www.agisoft.ru.
Amenta, N., C. Sunghee, and K. Revi. 2011. “The Power
Crust.” In 6th ACM Symposium on Solid Modeling, edited
by D. C. Anderson and K. Lee, 249-260. Ann Arbor: ACM.
Anderson, M. 2010. “Precision Recording of Pompeian
Standing Remains via Stitched Rectified Photography.
In: Making History Interactive.” In Proceedings of the
37th CAA Conference. Willinsburg, Virginia, March 22-
26, 2009, edited by B. Frischer, J. Webb Crawford and D.
Koller, 22-26. Oxford: Archaeopress.
Bernardini, F., J. Mittleman, H. Rushmeier, C. Silva, and
G. Taubin. 1999. The Ball-Pivoting Algorithm for Surface
Recostruction. IEEE - Transaction on Visualization and
Computer Grapichs 3: 349-359.
Bezzi, A., L. Bezzi, D. Francisci, and R. Gietl. 2006.
“L’utilizzo di voxel in campo archeologico.” Geomatic
workbooks 6.
Böhler, W., A. Morbs, and V. Border. 2003. “Investigating
Laser Scanner Accuracy.” In Proceedings of the XIXthe
CIPA Symposium. Antalya, Turkey, 30 September-4
October, 2003, edited by O. Altan, 696-701.
Campana, S., and F. Remondino. 2008. “Fast and Detailed
Digital Documentation of Archaeological Excavations and
Heritage Artifacts.” In Layers of Perception. Proceedings
of the 35th CAA Conference. Berlin, Germany, April, 2007,
edited by A. Posluschny, K. Lambers and I. Herzog. Bonn:
Dr. Rudolf Habelt GmbH.
Dey, T. K., and S. Goswami. 2003. “Tight Cocone: A Water-
tight Surface reconstruction.” Journal of Computing and
Information Science in Engineering 302 (3): 127-134.
Doneus, M., G. Verhoeven, M. Fera, Ch. Briese, M.
Kucera, and W. Neubauer. 2011. “From deposit to point
cloud – a study of low-cost computer vision approaches
for the straightforward documentation of archaeological
excavations.” In Proceedings of the CIPA XIII Symposium.
Prague, Czech Republic, 12/16 September, 2011, edited by
K. Pavelka, 181-198. Prague.
Ducke, B., D. Score, and J. Reeves. 2011. “Multiview 3D
Recostruction of the Archaeological Site at Weymouth
from Image Series.” Computers & Graphics 19: 375-382.
El-Hakim, S. F., F. Remondino, G. Lorenzo, and F.
Voltolini. 2008. “Effective High Resolution 3D Geometric
Reconstruction of Heritage and Archaeological Sites from
Images.” In Layers of Perception. Proceedings of the 35th
CAA Conference. Berlin, Germany, April, 2007, edited by
Rudolf Habel, 43-50. Berlin
Harris, E. C. 1977. Units of archaeological stratification.
Norwegian Archaeological Review 10: 84-94.
Furukawa, Y., and J. Ponce. 2008. “Accurate, Dense, and
Robust Multi-View Stereopsis.” In IEEE Transactions on
Pattern Analysis and Machine Intelligence.
Furukawa, Y., and J. Ponce. 2007. “Accurate, Dense,
and Robust Multi-View Stereopsis.” In IEEE Computer
Society Conference on Computer Vision and Pattern
Recognition, July 2007.
Katsianis, M., S. Tsipidis, K. Kostakis, and A. Kausoulakou.
2008. “A 3D digital workflow for archaeological intra-site
research using GIS.” Journal of Archaeological Science
35: 655-677.
Kazhadan, M., M. Bolitho, and H. Hoppe. 2006. “Poisson
Surface reconstruction.” In Eurographics Symposium on
Geometry Processing, edited by A. Shepper and K. Polthier
2006, 61-70. Aire de Ville: Eurographics Association
Leica Geosystems Geospatial Imaging LLC. 2008. Leica
Photogrammetry Suite Project Manager. User’s Guide.
Norcross.

Intra-Site Analysis and Photogrammetry: the Case Study of the ‘Buca Di Spaccasasso’ Giovanna Pizziolo et al.
307
Leica Geosystems Geospatial Imaging LLC. 2008. Leica
Photogrammetry Suite. Automatic Terrain Extraction.
User’s Guide. Norcross.
Lieberwidth, U. 2007. “3D GIS Voxel-Based Model Biulding
in Archaeology.” In Layers of Perception. Proceedings of
the 35th CAA Conference. Berlin, Germany, April, 2007,
edited by A. Posluschny, K. Lambers and I. Herzog. Bonn:
Dr. Rudolf Habelt GmbH.
Leonini, V., and N. Volante. 2005. “Le ricerche nella Buca
di Spaccasasso (Alberese, GR): osservazioni preliminari.”
In Askategi. Miscellanea in memoria di Georges
Laplace, edited by F. Martini, 541-551. Rivista di Scienze
Preistoriche, Supp. 1.
Lillesand, T., R. W. Kiepher, and R. Szeliski. 2007. Remote
Sensing and Image Interpretation. John Wiley.
Lowe, D. G. 2004. “Distinctive image features from scale-
invariant keypoints.” International Journal of Computer
Vision 60 (2): 91-110.
Snavely, N., S. M. Seitz, and R. Szeliski. 2007. “Modeling
the World from Internet Photo Collections.” International
Journal of Computer Vision 80 (2): 189-210.
Shapiro, L. G., and G. C. Stockman. 2001. Computer
Vision. Prentice Hall.
Staiger, R. 2005. “The Geometrical Quality of Terrestrial
Laser Scanner (TLS).” Paper presented at From Pharaohs
to Geomatics. FIG Working Week 2005 ad GSDI-8. Cairo,
Egypt April 16-21, 2005.
Stoter, J. E., and S. Zlattatova. 2003. “Visualizing
and editing of 3D objects organised in a DBMS.” In
Proceedings of the EUROSDR Commission 5 Workshop
on Visualitation and Rendering, Euro SDR, Cambridge.
Szelisky, R. 2010. Computer Vision: Algorithms and
Application. London: Springer.
Verhoeven, G. 2010. “Taking Computer Vision Aloft
- Archaeological Threedimensional Recostruction
from Aerial Photographs with Photoscan.” Journal
ofArchaeological Prospection 18 (1): 67-73.
Wechsler, S. P. 1999. “Digital Elevation Model (DEM)
uncertainty: evaluation and effect on topographic
parameters.” In Proceedings 19th Annual ESRI User
Conference, San Diego, California, USA.