INTERNATIONAL MONETARY FUND SOUTH AFRICA Staff ...
66
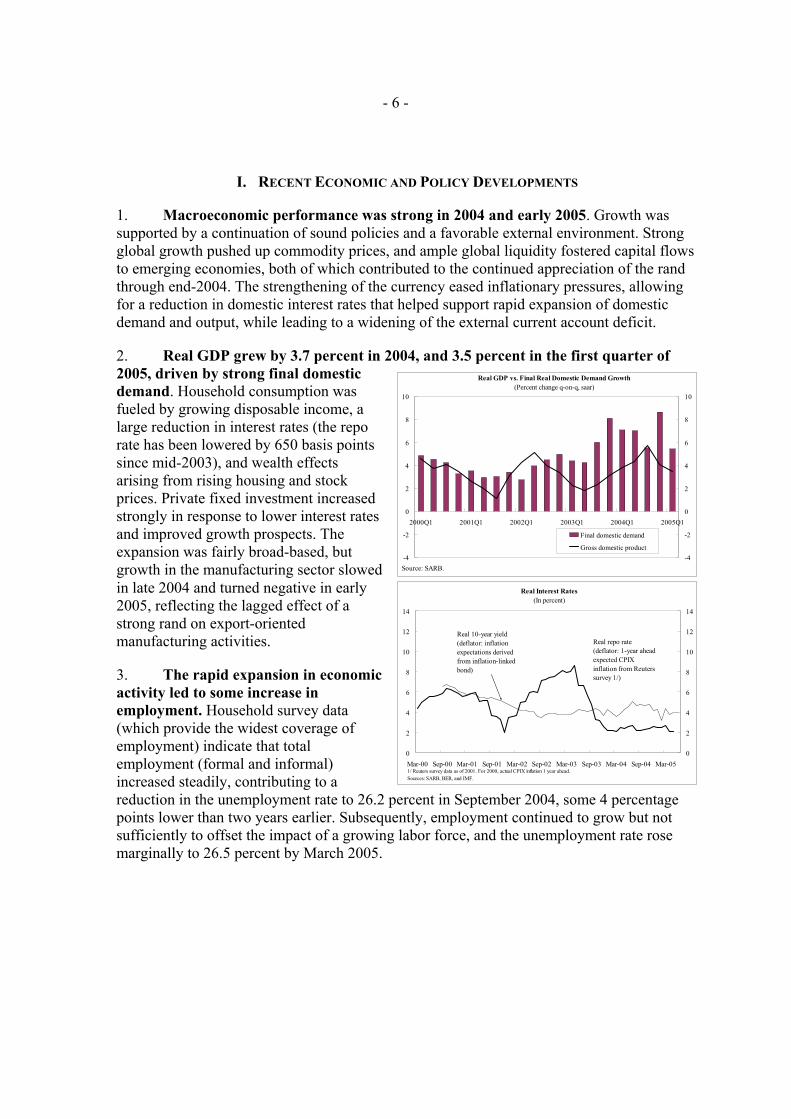
INTERNATIONAL MONETARY FUND SOUTH AFRICA Staff Report for the 2005 Article IV Consultation Prepared by the Staff Representatives for the 2005 Consultation with South Africa (In consultation with other Departments) Approved by Benedicte Vibe Christensen and Carlos Muñiz August 10, 2005 The 2005 Article IV consultation discussions were held in Pretoria and Cape Town during May 25–June 10, 2005. The mission met with the Minister of Finance, the Deputy Governors of the South African Reserve Bank, other senior officials at the government and the Reserve Bank, and representatives from business, the academic community, trade unions, and civil society. The staff team comprised Messrs. Lizondo (head), Funke, Harjes (all AFR), Burgess (PDR), Debrun (FAD), and Sy (MFD). Mr. Arora, the Senior Resident Representative in Pretoria, participated in the work of the mission. Mr. Milton (Senior Advisor to the Executive Director) also took part in the discussions. The First Deputy Managing Director, accompanied by Ms. Christensen (AFR) and Mr. Ingham (EXR), joined the mission during June 8–10 for the concluding discussions and outreach activities. At the time of the 2004 Article IV consultation, Executive Directors commended the authorities for their success over the last years in stabilizing the economy through skillful macroeconomic management and considerable progress in structural reforms. Looking forward, Directors noted that the primary policy challenges were to achieve higher sustainable economic growth and substantive reductions in unemployment, poverty, and the prevalence of HIV/AIDS. South Africa accepted the obligations of Article VIII in 1973, and maintains an exchange system free of restrictions on payments and transfers for current international transactions.
-
Upload
khangminh22 -
Category
Documents
-
view
3 -
download
0
Transcript of INTERNATIONAL MONETARY FUND SOUTH AFRICA Staff ...

INTERNATIONAL MONETARY FUND
SOUTH AFRICA
Staff Report for the 2005 Article IV Consultation
Prepared by the Staff Representatives for the2005 Consultation with South Africa
(In consultation with other Departments)
Approved by Benedicte Vibe Christensen and Carlos Muñiz
August 10, 2005
The 2005 Article IV consultation discussions were held in Pretoria and Cape Town during May 25–June 10, 2005. The mission met with the Minister of Finance, the Deputy Governors of the South African Reserve Bank, other senior officials at the government and the Reserve Bank, and representatives from business, the academic community, trade unions, and civil society.
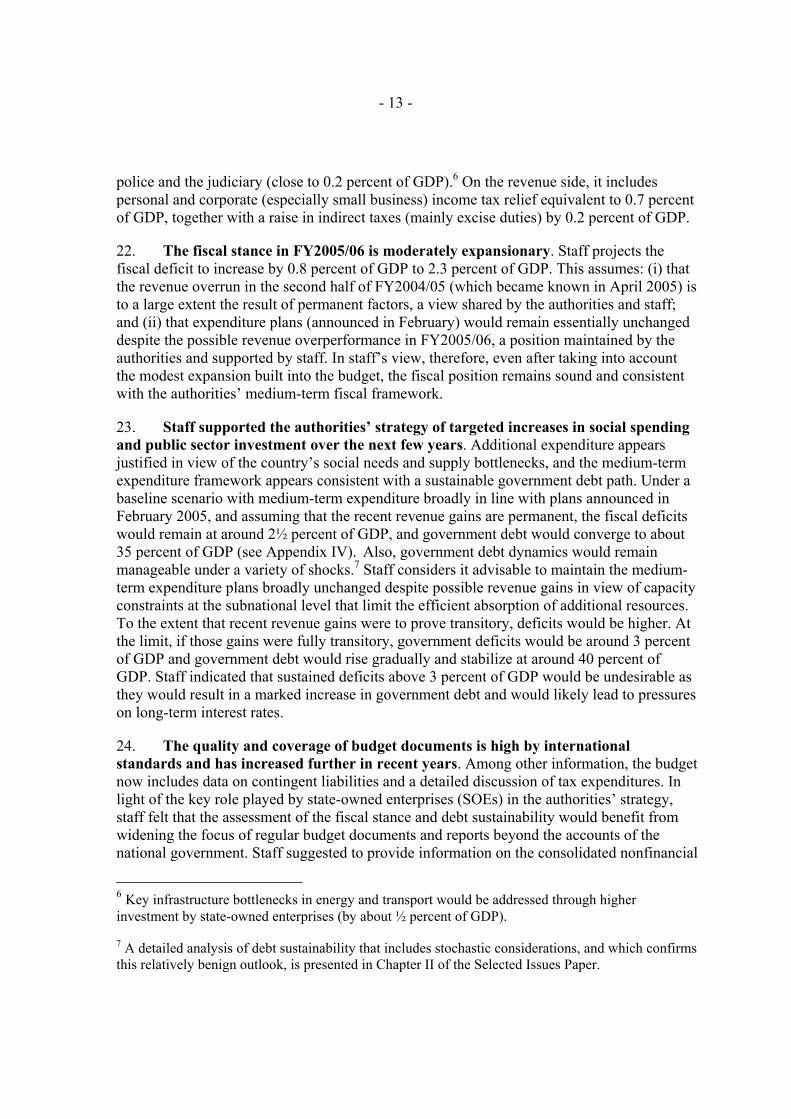
The staff team comprised Messrs. Lizondo (head), Funke, Harjes (all AFR), Burgess (PDR), Debrun (FAD), and Sy (MFD). Mr. Arora, the Senior Resident Representative in Pretoria, participated in the work of the mission. Mr. Milton (Senior Advisor to the Executive Director) also took part in the discussions.
The First Deputy Managing Director, accompanied by Ms. Christensen (AFR) and Mr. Ingham (EXR), joined the mission during June 8–10 for the concluding discussions and outreach activities.
At the time of the 2004 Article IV consultation, Executive Directors commended the authorities for their success over the last years in stabilizing the economy through skillful macroeconomic management and considerable progress in structural reforms. Looking forward, Directors noted that the primary policy challenges were to achieve higher sustainable economic growth and substantive reductions in unemployment, poverty, and the prevalence of HIV/AIDS.
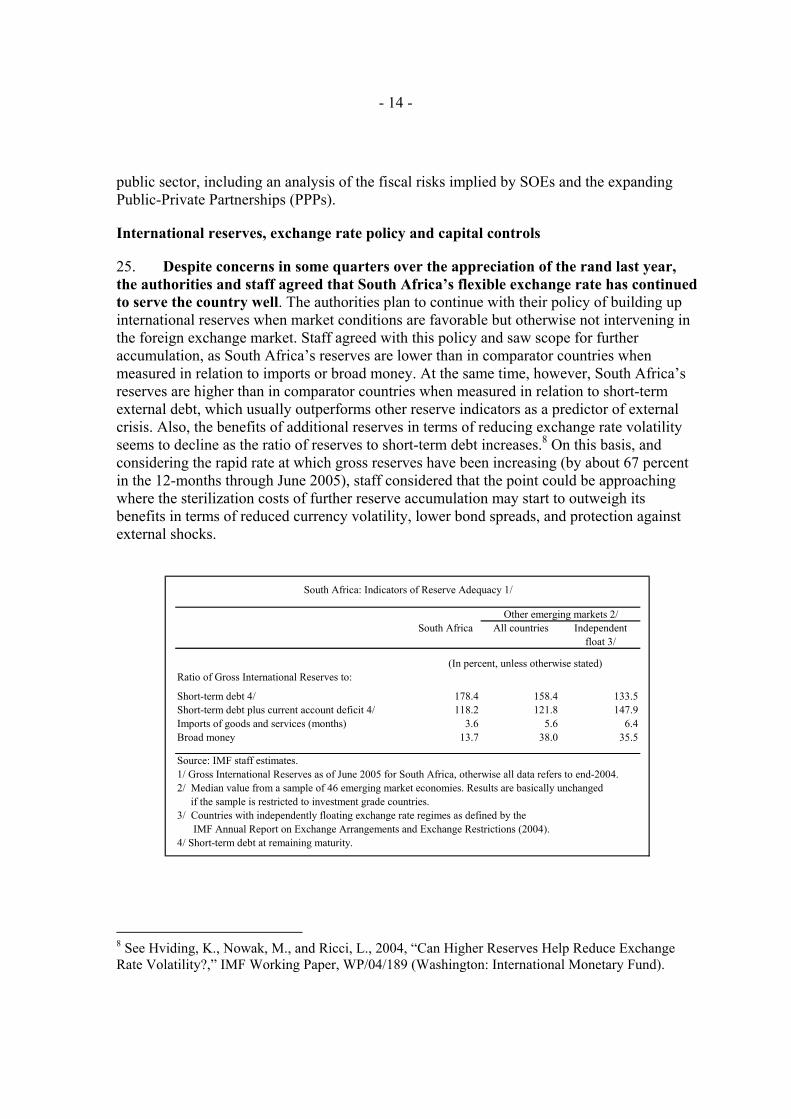
South Africa accepted the obligations of Article VIII in 1973, and maintains an exchange system free of restrictions on payments and transfers for current international transactions.

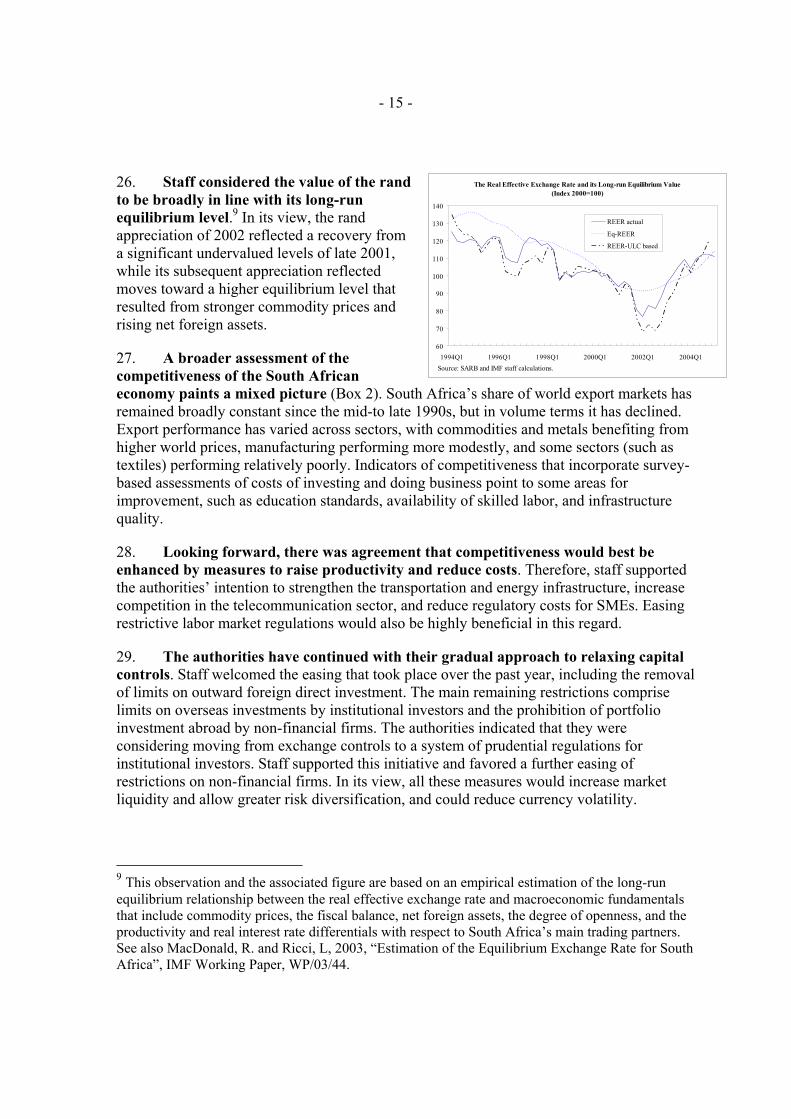
- 2 -
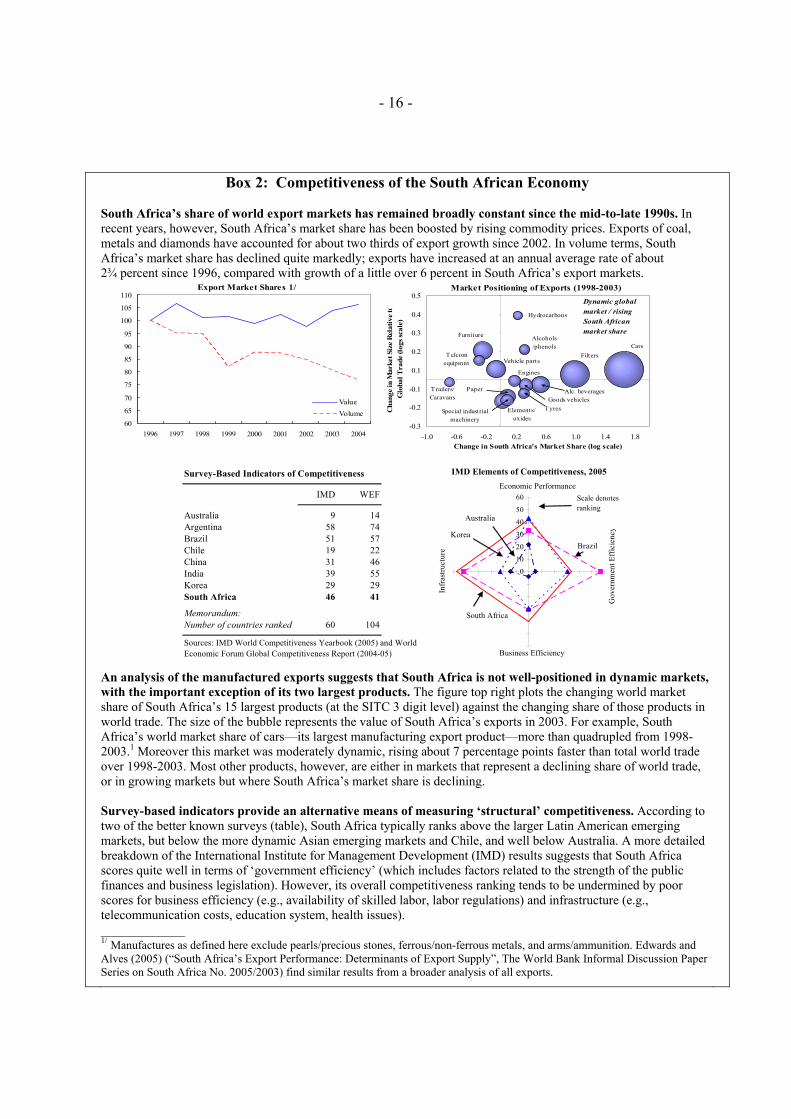
Contents Page
Glossary .....................................................................................................................................4
Executive Summary ...................................................................................................................5
I. Recent Economic and Policy Developments..........................................................................6
II. Policy Discussions.................................................................................................................9A. Overview...................................................................................................................9B. Short-Term Outlook ................................................................................................11 C. Macroeconomic Policies and Financial Sector Issues.............................................11
Inflation targeting and interest rate policy .......................................................11 Fiscal policy .....................................................................................................12 International reserves, exchange rate policy and capital controls....................14 Financial sector ................................................................................................17
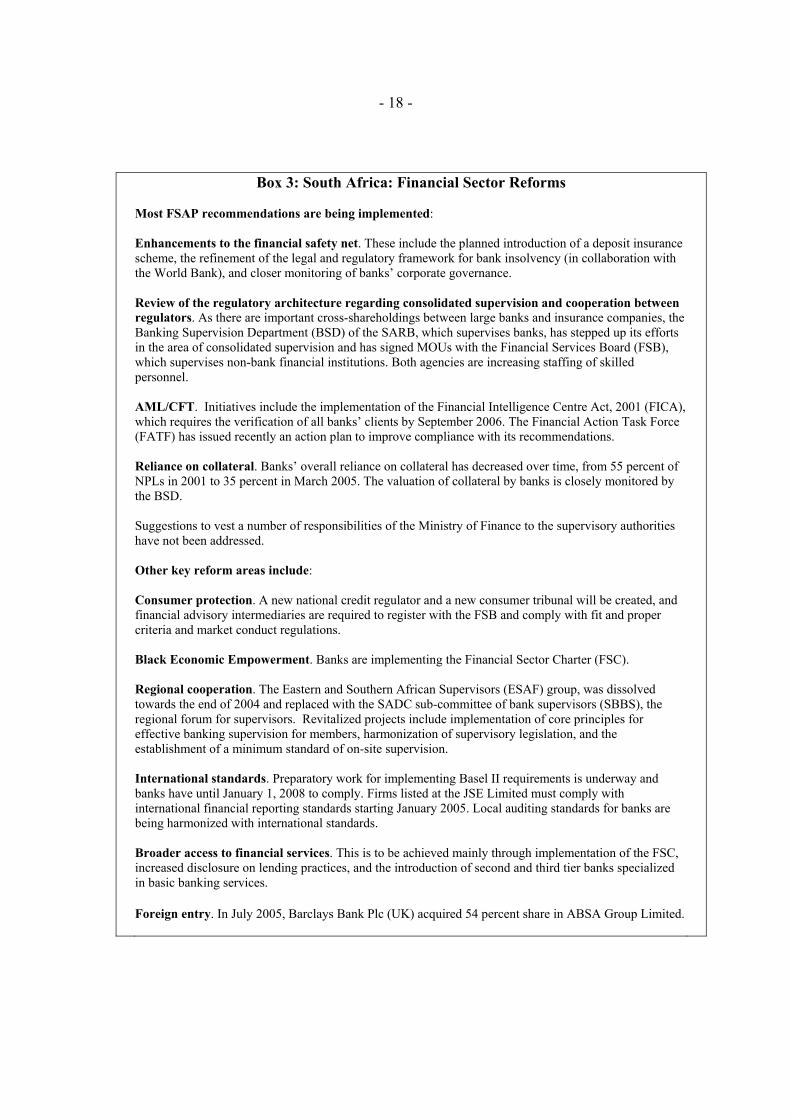
D. Structural Policies and Medium-Term Outlook......................................................19 Labor market....................................................................................................19 Trade policy and regional impact ....................................................................21 State-owned enterprises ...................................................................................22 Medium-term outlook ......................................................................................23
E. Social and Other Issues ...........................................................................................23 Social issues .....................................................................................................23 Other issues......................................................................................................24
III. Staff Appraisal ...................................................................................................................25
Tables1. Selected Economic and Financial Indicators, 2001-2006...................................................34 2. National Government Main Budget, 2001/02 - 2006/07 ....................................................35 3. Nonfinancial Public Sector Operations, 2001/02-2006/07 .................................................36 4. Balance of Payments, 2001-10 ...........................................................................................37 5. Monetary Survey, 2001-2004 .............................................................................................38 6. Indicators of External Vulnerability, 2001-2005 ................................................................39 7. Financial Soundness Indicators, 2001-2005 .......................................................................40 8. Social and Demographic Indicators ....................................................................................41 9. Millenium Developments Goals, 1990-2003......................................................................42
Figures1. Real Sector Developments and Outlook .............................................................................28 2. Money, Prices and Interest Rates........................................................................................29 3. External Sector Developments............................................................................................30 4. Fiscal Developments...........................................................................................................315. Exchange Rates, Asset Prices and Spreads.........................................................................32

- 3 -
6. Banking and Corporate Sector Developments....................................................................33
Boxes1. South Africa’s Development in an International Perspective..............................................10 2. Competitiveness of the South African Economy.................................................................16 3. Financial Sector Reforms.....................................................................................................184. Labor Market Flexibility......................................................................................................20
AppendicesI. Relations with the Fund.....................................................................................................43II. Relations with the World Bank Group.............................................................................45 III. Statistical Issues ................................................................................................................46IV. Medium-Term Outlook and Debt Sustainability ..............................................................49
- 4 -
GLOSSARY
AML Anti-Money Laundering ARV Anti-Retroviral Drugs BEE (Broad Based) Black Economic Empowerment CPI Consumer Price Index CPIX CPI Excluding the Interest on Mortgage Bonds EU European Union EFTA European Free Trade Association EPWP Expanded Public Works Program FATF Financial Action Task Force FICA Financial Intelligence Center Act FSB Financial Services Board FSC Financial Sector Charter FTA Free Trade Agreement MIDP Motor Industry Development Programme MOU Memorandum of Understanding NSDS National Skills Development Strategy PPP Private Public Partnerships REER Real Effective Exchange Rate ROSC Report on the Observance of Standards and Codes SACU Southern African Customs Union SADC Southern African Development Community SARB South African Reserve Bank SDDS Special Data Dissemination Standard SME Small-and-medium-sized enterprise SOE State-owned enterprise WTO World Trade Organization
- 5 -
EXECUTIVE SUMMARY
Background
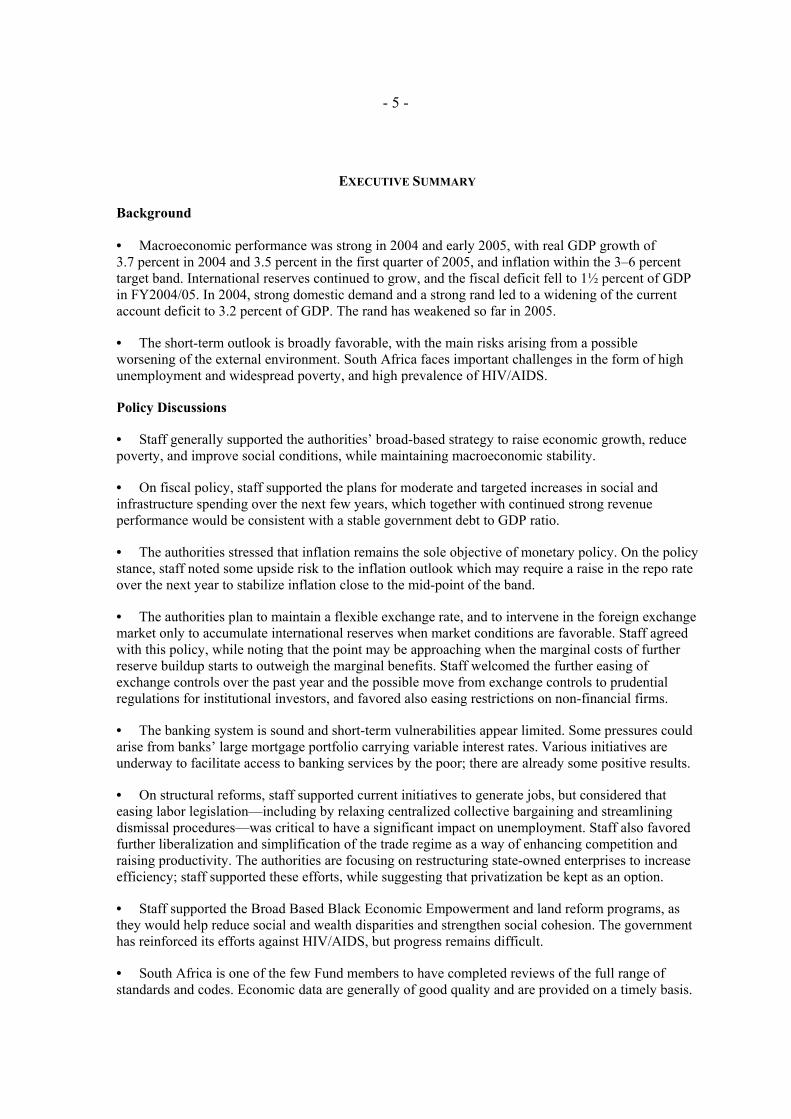
• Macroeconomic performance was strong in 2004 and early 2005, with real GDP growth of 3.7 percent in 2004 and 3.5 percent in the first quarter of 2005, and inflation within the 3–6 percent target band. International reserves continued to grow, and the fiscal deficit fell to 1½ percent of GDP in FY2004/05. In 2004, strong domestic demand and a strong rand led to a widening of the current account deficit to 3.2 percent of GDP. The rand has weakened so far in 2005.
• The short-term outlook is broadly favorable, with the main risks arising from a possible worsening of the external environment. South Africa faces important challenges in the form of high unemployment and widespread poverty, and high prevalence of HIV/AIDS.
Policy Discussions
• Staff generally supported the authorities’ broad-based strategy to raise economic growth, reduce poverty, and improve social conditions, while maintaining macroeconomic stability.
• On fiscal policy, staff supported the plans for moderate and targeted increases in social and infrastructure spending over the next few years, which together with continued strong revenue performance would be consistent with a stable government debt to GDP ratio.
• The authorities stressed that inflation remains the sole objective of monetary policy. On the policy stance, staff noted some upside risk to the inflation outlook which may require a raise in the repo rate over the next year to stabilize inflation close to the mid-point of the band.
• The authorities plan to maintain a flexible exchange rate, and to intervene in the foreign exchange market only to accumulate international reserves when market conditions are favorable. Staff agreed with this policy, while noting that the point may be approaching when the marginal costs of further reserve buildup starts to outweigh the marginal benefits. Staff welcomed the further easing of exchange controls over the past year and the possible move from exchange controls to prudential regulations for institutional investors, and favored also easing restrictions on non-financial firms.
• The banking system is sound and short-term vulnerabilities appear limited. Some pressures could arise from banks’ large mortgage portfolio carrying variable interest rates. Various initiatives are underway to facilitate access to banking services by the poor; there are already some positive results.
• On structural reforms, staff supported current initiatives to generate jobs, but considered that easing labor legislation—including by relaxing centralized collective bargaining and streamlining dismissal procedures—was critical to have a significant impact on unemployment. Staff also favored further liberalization and simplification of the trade regime as a way of enhancing competition and raising productivity. The authorities are focusing on restructuring state-owned enterprises to increase efficiency; staff supported these efforts, while suggesting that privatization be kept as an option.
• Staff supported the Broad Based Black Economic Empowerment and land reform programs, as they would help reduce social and wealth disparities and strengthen social cohesion. The government has reinforced its efforts against HIV/AIDS, but progress remains difficult.
• South Africa is one of the few Fund members to have completed reviews of the full range of standards and codes. Economic data are generally of good quality and are provided on a timely basis.
- 6 -
-4
-2
0
2
4
6
8
10
2000Q1 2001Q1 2002Q1 2003Q1 2004Q1 2005Q1
-4
-2
0
2
4
6
8
10
Final domestic demand
Gross domestic product
Real GDP vs. Final Real Domestic Demand Growth
(Percent change q-on-q, saar)
Source: SARB.
Real Interest Rates
(In percent)
0
2
4
6
8
10
12
14
Mar-00 Sep-00 Mar-01 Sep-01 Mar-02 Sep-02 Mar-03 Sep-03 Mar-04 Sep-04 Mar-05
0
2
4
6
8
10
12
14
Real 10-year yield
(deflator: inflation
expectations derived from inflation-linked
bond)
Real repo rate (deflator: 1-year ahead
expected CPIX
inflation from Reuters survey 1/)
1/ Reuters survey data as of 2001. For 2000, actual CPIX inflation 1 year ahead.
Sources: SARB, BER, and IMF.
I. RECENT ECONOMIC AND POLICY DEVELOPMENTS
1. Macroeconomic performance was strong in 2004 and early 2005. Growth was supported by a continuation of sound policies and a favorable external environment. Strong global growth pushed up commodity prices, and ample global liquidity fostered capital flows to emerging economies, both of which contributed to the continued appreciation of the rand through end-2004. The strengthening of the currency eased inflationary pressures, allowing for a reduction in domestic interest rates that helped support rapid expansion of domestic demand and output, while leading to a widening of the external current account deficit.
2. Real GDP grew by 3.7 percent in 2004, and 3.5 percent in the first quarter of 2005, driven by strong final domestic demand. Household consumption was fueled by growing disposable income, a large reduction in interest rates (the repo rate has been lowered by 650 basis points since mid-2003), and wealth effects arising from rising housing and stock prices. Private fixed investment increased strongly in response to lower interest rates and improved growth prospects. The expansion was fairly broad-based, but growth in the manufacturing sector slowed in late 2004 and turned negative in early 2005, reflecting the lagged effect of a strong rand on export-oriented manufacturing activities.
3. The rapid expansion in economic activity led to some increase in employment. Household survey data (which provide the widest coverage of employment) indicate that total employment (formal and informal) increased steadily, contributing to a reduction in the unemployment rate to 26.2 percent in September 2004, some 4 percentage points lower than two years earlier. Subsequently, employment continued to grow but not sufficiently to offset the impact of a growing labor force, and the unemployment rate rose marginally to 26.5 percent by March 2005.

- 7 -
International Reserves
(In US$ billions)
-15
-10
-5
0
5
10
15
20
Jan-00 Jul-00 Jan-01 Jul-01 Jan-02 Jul-02 Jan-03 Jul-03 Jan-04 Jul-04 Jan-05
-15
-10
-5
0
5
10
15
20
Gross International Reserves
International liquidity
position
Source: SARB.
CPIX Inflation and Average CPIX Inflation Expectations (in percent)
for 2005 and 2006 conducted during 2003Q1-2005Q2
2
3
4
5
6
7
8
9
10
2003Q1 2003Q2 2003Q3 2003Q4 2004Q1 2004Q2 2004Q3 2004Q4 2005Q1 2005Q2
2
3
4
5
6
7
8
9
10
2005 Inflation
Expectations
Sources: SARB and Bureau of Economic Research.
Survey conducted during
2006 Inflation
Upper target range
Lower target range
CPIX Inflation
4. Inflation has stayed within the official 3-6 percent target band since September 2003, and is expected to remain so during 2005-2006. CPIX inflation fell from a peak of 11 percent in late 2002 to the lower end of the target in February 2005, before edging up to 3.5 percent in June 2005.1 The continued strengthening of the rand during 2004 helped contain inflationary pressures and softened the impact of higher oil prices. Expected average CPIX inflation in 2005 and 2006, measured on the basis of surveys, has been within the target band since the third quarter of 2004.
5. Growth in broad money and bank credit to the private sector remain robust. In June 2005, broad money growth was 17 percent (12-month rate), while growth of bank credit to the private sector reached 22 percent, reflecting rapid expansion of mortgage lending.
6. The South African Reserve Bank (SARB) has maintained its flexible exchange rate policy while building up international reserves. The SARB does not intervene in currency markets to manage the exchange rate, but, as publicly announced, has bought foreign exchange at times of rand strength to improve its international reserves position. Gross international reserves increased from the equivalent of 70 percent of short-term external debt at end-2003 to an estimated 178 percent as of end-June 2005. The higher level of reserves was an important factor in Moody’s decision to upgrade South Africa’s foreign currency sovereign rating to Baa1 in early 2005. Standard and Poor’s upgraded South Africa’s long-term sovereign credit rating to BBB+ in August 2005.
7. After strengthening for three years through 2004, the rand weakened somewhat in the first half of 2005. Since the episode of market stress in late 2001, the rand appreciated by over 50 percent through late 2004 (almost one-fourth of which took place in 2004). This
1 The CPIX—the measure targeted by the SARB under its inflation-targeting framework—is equal to the CPI excluding interest payments on mortgage bonds.

- 8 -
appreciation—as that of other commodity-currencies, such as the Australian dollar—was associated with a rise in commodity prices. Also, large capital inflows resulting from strong global appetite for emerging assets, helped support the rand. During 2005 this pattern was reversed, with the rand depreciating by about 5 percent in real effective terms over the first four months of the year.
8. The external current account deficit widened to 3.2 percent of GDP in 2004, from 1.5 percent of GDP in 2003, owing to the rapid growth in domestic demand and the strength of the rand. Import volumes grew strongly, exceeding the growth in export volumes, while the terms of trade remained broadly unchanged. The current account deficit was easily financed by foreign portfolio inflows and “net errors and omissions.”2 As in previous years, gross FDI inflows in 2004 were weak. In July 2005, however, Barclays (U.K.) purchased a controlling interest in one of South Africa’s largest banks (ABSA), for the equivalent of 1.9 percent of GDP. As of end-2004, external debt was equivalent of 20 percent of GDP, with about one-third of the total denominated in rand.
9. The fiscal deficit fell to 1.5 percent of GDP in FY2004/05, from 2.3 percent of GDP a year earlier, reflecting strong tax revenue performance. Tax revenue rose significantly owing to buoyant domestic demand and greater efficiency in tax collection. An increase in social spending, mainly in the form of targeted grants, was partially offset by the impact of lower domestic interest rates on debt-service payments. At end-2004, national
2 The SARB is trying to identify the source of large errors and omissions (2.3 percent of GDP in 2004).
2002/03 2003/04 2004/05
Total revenue and grants 23.3 23.5 24.7
of which
Tax revenue 23.0 22.9 24.3
Income tax 13.8 13.5 13.9
Indirect taxes 8.2 8.6 9.4
Trade and other 1.0 0.8 1.0
Total expenditure 24.4 25.7 26.2
of which
Interest expenditure 3.9 3.6 3.5
Social expenditure 2/ 12.7 13.9 14.3
Budget Balance -1.1 -2.3 -1.5
Memorandum items:
Debt 35.8 35.7 35.8
Domestic 29.5 30.6 30.9
Foreign 6.2 5.1 4.9
Soure: South African authorities.
1/ For fiscal year beginning April 1. For 2004/05 estimate.
2/ Consolidated central and provincial government. Education
health, transfers, and other.
National Government Main Budget 1/
(In percent of GDP)
Commodity Currencies: Real Effective Exchange Rate
(Index 2000 = 100)
40
60
80
100
120
140
160
1998M1 1999M1 2000M1 2001M1 2002M1 2003M1 2004M1 2005M1
40
60
80
100
120
140
160
South Africa
Australia
Source: IMF.
Commodity Prices and Rand/US$ Exchange Rate
40
60
80
100
120
140
160
180
200
Dec-97 Dec-98 Dec-99 Dec-00 Dec-01 Dec-02 Dec-03 Dec-04
4
5
6
7
8
9
10
11
12
13
US$ based commodity price index,
comprising gold, platinum, and coal
(Jan. 1998=100, left scale)
Rand per US$ (right
scale)
Sources: IMF, Datastream

- 9 -
House and Stock Prices in Real Terms
(Index Jan 2000 = 100)
0
50
100
150
200
250
Jan-00 Jul-00 Jan-01 Jul-01 Jan-02 Jul-02 Jan-03 Jul-03 Jan-04 Jul-04 Jan-05
0
50
100
150
200
250
Residential property
price index
Stock price index
Sources: Absa, Datastream.
government debt was equivalent to about 36 percent of GDP.3
10. Asset prices rose strongly in 2004 and early 2005. Low domestic interest rates, favorable growth prospects, and improved business confidence pushed the JSE all-share index up by 18 percent in real terms during 2004, and a further 10 percent in the first half of 2005. Also, boosted by falling interest rates and new demand by an emerging black middle class, residential property prices rose by 28 percent in real terms in 2004, and at a lower rate in recent months.
II. POLICY DISCUSSIONS
A. Overview
11. South Africa has made significant macroeconomic gains over the past decade, but important challenges remain. Growth has increased, inflation has been brought under control, the public finances have been strengthened, and net international reserves have risen (Box 1). All this has been achieved while undertaking a major political and social transformation. Important challenges remain, however, as growth still lags behind that in comparator countries, unemployment and poverty remain high, wealth and income inequalities persist, and the HIV/AIDS epidemic has lowered life expectancy and is exacting a heavy toll on society.
12. In recent Article IV consultations, staff has emphasized the benefits of macroeconomic consolidation and further structural reforms. Staff has tended to agree with the focus of key macroeconomic policies, particularly fiscal policy, inflation-targeting, and international reserves management. Implementation of structural reforms has proven more difficult. Important advances were made in trade liberalization and privatization, but progress in these areas has slowed recently. Some progress has also been made on labor market reforms, but decision-making and policy action in this area have at times been constrained by differences within the governing coalition.4
3 The nonfinancial public sector debt is estimated at 47½ percent of GDP at end-2004. In addition to debt of the national government, this includes debt of local governments (1.5 percent of GDP) and of state-owned enterprises (10 percent of GDP). Information on provincial debt is not available but it is considered to be negligible.
4 The coalition includes the African National Congress (ANC), the Congress of South African Trade Unions (COSATU), and the South African Communist Party (SACP).

- 10 -
Box 1: South Africa’s Development in an International Perspective
Macroeconomic stabilization and structural reforms since democratization in 1994 have started to pay off. Average annual real GDP growth in South Africa has picked up to 3.4 percent during 2000-2004 from an average of 2.6 percent during 1994-99 and only 1 percent during 1980-93. Inflation has fallen appreciably, fiscal discipline has been achieved, and external vulnerability has been reduced.
While South Africa has performed better post-1994 than during apartheid, how does it compare with other countries? The table below compares economic developments in South Africa with those in 25 emerging markets that are broadly comparable in terms of GDP per capita, population and sovereign risk rating.1/
During the past 5 years South Africa performed better than the average comparator country in terms of fiscal discipline, government debt, and external debt. The reduction in inflation was somewhat lower than in comparator countries for the five-year period as a whole.
South Africa’s real GDP per capita growth remains lower than in its comparator countries. However, the gap has narrowed somewhat.
South Africa still lags behind its comparator countries in terms of unemployment, foreign direct investment, and holdings of international reserves.
1995-1999 2000-2004 1995-1999 2000-2004Annual real GDP growth (in percent) 2.6 3.4 2.9 3.9Annual real per capita GDP Growth (in percent) 0.8 2.2 1.6 2.6Annual CPI inflation (in percent) 7.3 5.5 8.0 4.4Unemployment rate 23.1 28.3 7.1 9.0Gross fixed capital formation (in percent of GDP) 16.2 15.6 21.4 19.8Central government balance (in percent of GDP) -3.5 -1.8 -2.4 -2.7Revenue and grants over GDP 23.1 23.5 24.3 25.5Government debt (in percent of GDP) 2/ 45.4 38.6 38.9 46.6Current account deficit (in percent of GDP) -1.3 -0.6 -2.0 1.3Foreign direct investment in economy (in percent of GDP) 1.1 1.6 2.6 2.4External debt (in percent of GDP) 26.2 24.9 42.1 43.4Reserves (in months of imports of goods and services) 1.5 2.4 4.6 6.41/ Median of 25 countries. 2/ For comparator countries median of 18 economies for which comparable data is available. Source: World Economic Outlook.
Comparator Countries 1/
Macroeconomic Performance Compared: South Africa and 25 Comparator Countries
South Africa
1/ The sample includes countries with per capita income (2004) between US$1,000 and US$15,000, population exceeding 10 million, and sovereign foreign currency risk rating B or higher. Qualitatively results are similar if the sample includes only investment grade countries, or a narrower income range.
- 11 -
13. The authorities’ main objectives in the period ahead are to accelerate growth, lower unemployment, improve social conditions, and address wealth disparities, within a low inflation environment. Their approach includes: (i) maintaining macroeconomic stability and a sound financial system; (ii) increasing saving through facilitating access to financial services; (iii) fostering growth by improving the regulatory environment for private sector development (particularly of SMEs), reforming state-owned enterprises and increasing their investment in infrastructure (including through public-private partnerships); and (iv) reducing unemployment through accelerated economic growth, skills-development and public works programs, and possibly some amendments to labor legislation. Priorities also include improving social conditions by ensuring appropriate budget allocations for social needs, dealing with the HIV/AIDS epidemic, and moving ahead with their programs for Broad Based Black Economic Empowerment (BEE) and land reform.
B. Short-Term Outlook
14. There was agreement that near-term economic prospects remain broadly favorable. The external environment is expected to stay generally positive, and business and consumer confidence indicators point to continued robust near-term growth, supported by somewhat expansionary macroeconomic policies. Staff projects real GDP growth of 4 percent in 2005 and 3.6 percent in 2006. Inflation is expected to increase from current levels, but to remain within the target band. The external current account deficit would widen to 3.8 percent of GDP in 2005, before narrowing moderately in 2006.
15. The authorities and staff considered that the main short-term risks arise from the possibility of a deterioration in the external environment. A pronounced slowdown in global growth––for instance due to a sharp increase in oil prices–– would reduce demand for South African exports, erode consumer and business confidence and dampen growth. Also, a weakening of global appetite for emerging market assets could put downward pressure on the rand and require an increase in domestic interest rates to keep inflation within the target band, with a potential adverse impact on growth. On the domestic front, staff saw somepossibility of a correction in real estate prices, particularly if interest rates rise, which could dampen domestic demand and growth.
C. Macroeconomic Policies and Financial Sector Issues
Inflation targeting and interest rate policy
16. The SARB has been enhancing its inflation targeting framework, which is now broadly in line with that in other successful inflation targeting countries. The SARB has moved from a yearly target on average annual inflation to a continuous target on 12-month inflation, increased the frequency of Monetary Policy Committee meetings, and removed the “escape clause,” which set conditions under which inflation could deviate from the target band. These changes and the SARB’s success in keeping inflation within the target band have strengthened monetary policy credibility, as evidenced in inflation expectations falling within the target band.

- 12 -
17. On the monetary policy stance, some upside risks to the inflation outlook may be emerging. The authorities indicated that their baseline scenario—under a constant interest rate—envisaged a period of increasing inflation with the CPIX inflation rate rising above 5 percent in early 2006 before slowing down gradually.5 They saw the risks to the outlook as evenly balanced and signaled no bias in either direction regarding future changes in interest rates. Staff agreed that inflation was on an upward trend, owing to the pickup in unit labor costs in 2004, increasing oil prices, the weakening of the rand in 2005, and the continued strength of domestic demand. It also considered that monetary policy was expansionary, as suggested by the rapid money and credit growth, and thus thought that the repo rate may need to be raised somewhat over the next year in order to stabilize inflation around the mid-point of the band.
18. The authorities restated that the overriding objective of monetary policy is to keep inflation within the target band. Staff noted that the April 2005 Monetary Policy Committee’s statement had generated some market uncertainty about the objectives of monetary policy, as it mentioned concerns about the impact of the level and volatility of the exchange rate on some sectors of the economy as a factor in the decision to lower interest rates. The authorities emphasized that the evolution of the exchange rate plays a role in their decisions on interest rates only to the extent that such evolution has implications for inflation. There was agreement on the importance of having a clear message about the basis for monetary policy decisions.
19. Staff suggested that the SARB—within its target band system—target inflation at the mid-point of the band over the medium term. At present, monetary policy focuses just on keeping inflation within the band. In the staff’s view, targeting inflation at the mid-point over the medium term would help anchor expectations and increase the likelihood that inflation stays within the band. The authorities saw some merit in this suggestion.
Fiscal policy
20. South Africa’s sustained fiscal adjustment and reforms over the last decade have enhanced fiscal management, reduced the size of the government sector, and lowered public indebtedness. The structure of tax revenues is sound and taxpayer compliance continues to improve. Expenditure control is generally effective, and improvements are underway at the provincial and municipal levels.
21. Fiscal consolidation has created room for higher spending on social needs and infrastructure, a cornerstone of the authorities’ pro-poor growth strategy. The national government budget for FY2005/06 includes additional resources for social grants (0.4 percent of GDP), health and education (0.2 percent of GDP), and land restitution, the
5 Chapter I of the Selected Issues Paper analyzes inflation dynamics in a calibrated small open economy model.
- 13 -
police and the judiciary (close to 0.2 percent of GDP).6 On the revenue side, it includes personal and corporate (especially small business) income tax relief equivalent to 0.7 percent of GDP, together with a raise in indirect taxes (mainly excise duties) by 0.2 percent of GDP.
22. The fiscal stance in FY2005/06 is moderately expansionary. Staff projects the fiscal deficit to increase by 0.8 percent of GDP to 2.3 percent of GDP. This assumes: (i) that the revenue overrun in the second half of FY2004/05 (which became known in April 2005) is to a large extent the result of permanent factors, a view shared by the authorities and staff; and (ii) that expenditure plans (announced in February) would remain essentially unchanged despite the possible revenue overperformance in FY2005/06, a position maintained by the authorities and supported by staff. In staff’s view, therefore, even after taking into account the modest expansion built into the budget, the fiscal position remains sound and consistent with the authorities’ medium-term fiscal framework.
23. Staff supported the authorities’ strategy of targeted increases in social spending and public sector investment over the next few years. Additional expenditure appears justified in view of the country’s social needs and supply bottlenecks, and the medium-term expenditure framework appears consistent with a sustainable government debt path. Under a baseline scenario with medium-term expenditure broadly in line with plans announced in February 2005, and assuming that the recent revenue gains are permanent, the fiscal deficits would remain at around 2½ percent of GDP, and government debt would converge to about 35 percent of GDP (see Appendix IV). Also, government debt dynamics would remain manageable under a variety of shocks.7 Staff considers it advisable to maintain the medium-term expenditure plans broadly unchanged despite possible revenue gains in view of capacity constraints at the subnational level that limit the efficient absorption of additional resources. To the extent that recent revenue gains were to prove transitory, deficits would be higher. At the limit, if those gains were fully transitory, government deficits would be around 3 percent of GDP and government debt would rise gradually and stabilize at around 40 percent of GDP. Staff indicated that sustained deficits above 3 percent of GDP would be undesirable as they would result in a marked increase in government debt and would likely lead to pressures on long-term interest rates.
24. The quality and coverage of budget documents is high by international standards and has increased further in recent years. Among other information, the budget now includes data on contingent liabilities and a detailed discussion of tax expenditures. In light of the key role played by state-owned enterprises (SOEs) in the authorities’ strategy, staff felt that the assessment of the fiscal stance and debt sustainability would benefit from widening the focus of regular budget documents and reports beyond the accounts of the national government. Staff suggested to provide information on the consolidated nonfinancial
6 Key infrastructure bottlenecks in energy and transport would be addressed through higher investment by state-owned enterprises (by about ½ percent of GDP).
7 A detailed analysis of debt sustainability that includes stochastic considerations, and which confirms this relatively benign outlook, is presented in Chapter II of the Selected Issues Paper.
- 14 -
public sector, including an analysis of the fiscal risks implied by SOEs and the expanding Public-Private Partnerships (PPPs).
International reserves, exchange rate policy and capital controls
25. Despite concerns in some quarters over the appreciation of the rand last year, the authorities and staff agreed that South Africa’s flexible exchange rate has continued to serve the country well. The authorities plan to continue with their policy of building up international reserves when market conditions are favorable but otherwise not intervening in the foreign exchange market. Staff agreed with this policy and saw scope for further accumulation, as South Africa’s reserves are lower than in comparator countries when measured in relation to imports or broad money. At the same time, however, South Africa’s reserves are higher than in comparator countries when measured in relation to short-term external debt, which usually outperforms other reserve indicators as a predictor of external crisis. Also, the benefits of additional reserves in terms of reducing exchange rate volatility seems to decline as the ratio of reserves to short-term debt increases.8 On this basis, and considering the rapid rate at which gross reserves have been increasing (by about 67 percent in the 12-months through June 2005), staff considered that the point could be approaching where the sterilization costs of further reserve accumulation may start to outweigh its benefits in terms of reduced currency volatility, lower bond spreads, and protection against external shocks.
South Africa: Indicators of Reserve Adequacy 1/
Other emerging markets 2/South Africa All countries Independent
float 3/
(In percent, unless otherwise stated)Ratio of Gross International Reserves to:
Short-term debt 4/ 178.4 158.4 133.5Short-term debt plus current account deficit 4/ 118.2 121.8 147.9Imports of goods and services (months) 3.6 5.6 6.4Broad money 13.7 38.0 35.5
Source: IMF staff estimates.1/ Gross International Reserves as of June 2005 for South Africa, otherwise all data refers to end-2004.2/ Median value from a sample of 46 emerging market economies. Results are basically unchanged if the sample is restricted to investment grade countries.3/ Countries with independently floating exchange rate regimes as defined by the IMF Annual Report on Exchange Arrangements and Exchange Restrictions (2004).4/ Short-term debt at remaining maturity.
8 See Hviding, K., Nowak, M., and Ricci, L., 2004, “Can Higher Reserves Help Reduce Exchange Rate Volatility?,” IMF Working Paper, WP/04/189 (Washington: International Monetary Fund).
- 15 -
The Real Effective Exchange Rate and its Long-run Equilibrium Value(Index 2000=100)
60
70
80
90
100
110
120
130
140
1994Q1 1996Q1 1998Q1 2000Q1 2002Q1 2004Q1
REER actual
Eq-REER
REER-ULC based
Source: SARB and IMF staff calculations.
26. Staff considered the value of the rand to be broadly in line with its long-run equilibrium level.9 In its view, the rand appreciation of 2002 reflected a recovery from a significant undervalued levels of late 2001, while its subsequent appreciation reflected moves toward a higher equilibrium level that resulted from stronger commodity prices and rising net foreign assets.
27. A broader assessment of the competitiveness of the South African economy paints a mixed picture (Box 2). South Africa’s share of world export markets has remained broadly constant since the mid-to late 1990s, but in volume terms it has declined. Export performance has varied across sectors, with commodities and metals benefiting from higher world prices, manufacturing performing more modestly, and some sectors (such as textiles) performing relatively poorly. Indicators of competitiveness that incorporate survey-based assessments of costs of investing and doing business point to some areas for improvement, such as education standards, availability of skilled labor, and infrastructure quality.
28. Looking forward, there was agreement that competitiveness would best be enhanced by measures to raise productivity and reduce costs. Therefore, staff supported the authorities’ intention to strengthen the transportation and energy infrastructure, increase competition in the telecommunication sector, and reduce regulatory costs for SMEs. Easing restrictive labor market regulations would also be highly beneficial in this regard.
29. The authorities have continued with their gradual approach to relaxing capital controls. Staff welcomed the easing that took place over the past year, including the removal of limits on outward foreign direct investment. The main remaining restrictions comprise limits on overseas investments by institutional investors and the prohibition of portfolio investment abroad by non-financial firms. The authorities indicated that they were considering moving from exchange controls to a system of prudential regulations for institutional investors. Staff supported this initiative and favored a further easing of restrictions on non-financial firms. In its view, all these measures would increase market liquidity and allow greater risk diversification, and could reduce currency volatility.
9 This observation and the associated figure are based on an empirical estimation of the long-run equilibrium relationship between the real effective exchange rate and macroeconomic fundamentals that include commodity prices, the fiscal balance, net foreign assets, the degree of openness, and the productivity and real interest rate differentials with respect to South Africa’s main trading partners. See also MacDonald, R. and Ricci, L, 2003, “Estimation of the Equilibrium Exchange Rate for South Africa”, IMF Working Paper, WP/03/44.
- 16 -
Box 2: Competitiveness of the South African Economy
South Africa’s share of world export markets has remained broadly constant since the mid-to-late 1990s. In recent years, however, South Africa’s market share has been boosted by rising commodity prices. Exports of coal, metals and diamonds have accounted for about two thirds of export growth since 2002. In volume terms, South Africa’s market share has declined quite markedly; exports have increased at an annual average rate of about 2¾ percent since 1996, compared with growth of a little over 6 percent in South Africa’s export markets.
Survey-Based Indicators of Competitiveness
IMD WEF
Australia 9 14Argentina 58 74Brazil 51 57Chile 19 22China 31 46India 39 55Korea 29 29South Africa 46 41
Memorandum:Number of countries ranked 60 104
IMD Elements of Competitiveness, 2005
Australia
Brazil
Korea
South Africa
0
10
20
30
40
50
60
Economic Performance
Gov
ernm
ent
Eff
icie
ncy
Business Efficiency
Infr
astr
uctu
re
Scale denotes
ranking
Sources: IMD World Competitiveness Yearbook (2005) and World Economic Forum Global Competitiveness Report (2004-05)
An analysis of the manufactured exports suggests that South Africa is not well-positioned in dynamic markets, with the important exception of its two largest products. The figure top right plots the changing world market share of South Africa’s 15 largest products (at the SITC 3 digit level) against the changing share of those products in world trade. The size of the bubble represents the value of South Africa’s exports in 2003. For example, South Africa’s world market share of cars—its largest manufacturing export product—more than quadrupled from 1998-2003.1 Moreover this market was moderately dynamic, rising about 7 percentage points faster than total world trade over 1998-2003. Most other products, however, are either in markets that represent a declining share of world trade, or in growing markets but where South Africa’s market share is declining.
Survey-based indicators provide an alternative means of measuring ‘structural’ competitiveness. According to two of the better known surveys (table), South Africa typically ranks above the larger Latin American emerging markets, but below the more dynamic Asian emerging markets and Chile, and well below Australia. A more detailed breakdown of the International Institute for Management Development (IMD) results suggests that South Africa scores quite well in terms of ‘government efficiency’ (which includes factors related to the strength of the public finances and business legislation). However, its overall competitiveness ranking tends to be undermined by poor scores for business efficiency (e.g., availability of skilled labor, labor regulations) and infrastructure (e.g., telecommunication costs, education system, health issues). _____________ 1/ Manufactures as defined here exclude pearls/precious stones, ferrous/non-ferrous metals, and arms/ammunition. Edwards and Alves (2005) (“South Africa’s Export Performance: Determinants of Export Supply”, The World Bank Informal Discussion Paper Series on South Africa No. 2005/2003) find similar results from a broader analysis of all exports.
Export Market Shares 1/
60
65
70
75
80
85
90
95
100
105
110
1996 1997 1998 1999 2000 2001 2002 2003 2004
Value
Volume
Market Positioning of Exports (1998-2003)
Tyres
Goods vehicles
Paper Alc. beverages
Engines
Elements/
oxidesSpecial industrial
machinery
Vehicle parts
T railers/
Caravans
Telcom
equipmnt
FurnitureAlcohols
/phenols
Filters
Cars
Hydrocarbons
-0.3
-0.2
-0.1
0.1
0.2
0.3
0.4
0.5
-1.0 -0.6 -0.2 0.2 0.6 1.0 1.4 1.8
Change in South Africa's Market Share (log scale)
Change
in M
ark
et S
ize
Rel
ati
ve
to
Glo
bal T
rade
(logs
scale
)
Dynamic global
market / rising
South African
market share

- 17 -
Financial sector
30. South Africa’s financial system is generally sound and well regulated. As of March 2005, the average capital adequacy ratio was 12.9 percent (compared with a regulatory minimum of 10 percent), non-performing loans accounted for 1.8 percent of total loans, and non-performing loans net of provisioning were equivalent to 6.1 percent of capital. Also, profitability remained healthy, with an average return on equity of 16.9 percent. The insurance sector also appears to be well-capitalized and corporate risks seem to be limited.10
31. There was broad agreement that short-term vulnerabilities in the banking sector remained limited, but staff felt that banks could face some risk from their mortgage portfolio. Mortgage advances account for about 37 percent of total bank loans and typically carry variable interest rates. Thus, a marked rise in interest rates could reduce household debt-servicing capacity, affecting bank asset quality, and also prompt a drop in property prices, lowering collateral value. The authorities noted that household indebtedness remained below historical highs and that the boom in residential property prices has been supported by fundamental factors, and also considered that a marked increase in interest rates was highly unlikely. It was agreed nevertheless that developments in this area needed to be closely monitored.
32. The authorities are undertaking important initiatives to facilitate access to banking services for the poor and increase competition in the banking sector. It is estimated that one third to one half of the adult population has no access to banking services and competition in retail and SME banking appears to be low. These problems are being addressed by the Financial Sector Charter (which provides incentives for banks to offer basic services at low cost) and the planned introduction of a regulatory framework for second and third tier banks, specialized in basic banking services.11 Substantial progress has been made, with reportedly about one million basic bank accounts (so called “Mzansi” accounts) opened between October 2004 and May 2005. The purchase of ABSA bank by Barclays (U.K.) should further increase competition.
33. The authorities have been implementing most of the FSAP recommendations and have continued to enhance the regulatory and supervisory framework (Box 3). Current initiatives include, among others, implementing AML/CFT legislation, helping banks move to Basel II, and the planned introduction of a deposit insurance scheme.
10 Chapter III of the Selected Issues Paper analyzes financial and corporate sector vulnerabilities in greater detail.
11 These new types of banks are not expected to increase financial vulnerability as their assets will be restricted to high quality and liquid investments.
- 18 -
Box 3: South Africa: Financial Sector Reforms
Most FSAP recommendations are being implemented:
Enhancements to the financial safety net. These include the planned introduction of a deposit insurance scheme, the refinement of the legal and regulatory framework for bank insolvency (in collaboration with the World Bank), and closer monitoring of banks’ corporate governance.
Review of the regulatory architecture regarding consolidated supervision and cooperation between regulators. As there are important cross-shareholdings between large banks and insurance companies, the Banking Supervision Department (BSD) of the SARB, which supervises banks, has stepped up its efforts in the area of consolidated supervision and has signed MOUs with the Financial Services Board (FSB), which supervises non-bank financial institutions. Both agencies are increasing staffing of skilled personnel.
AML/CFT. Initiatives include the implementation of the Financial Intelligence Centre Act, 2001 (FICA), which requires the verification of all banks’ clients by September 2006. The Financial Action Task Force (FATF) has issued recently an action plan to improve compliance with its recommendations.
Reliance on collateral. Banks’ overall reliance on collateral has decreased over time, from 55 percent of NPLs in 2001 to 35 percent in March 2005. The valuation of collateral by banks is closely monitored by the BSD.
Suggestions to vest a number of responsibilities of the Ministry of Finance to the supervisory authorities have not been addressed.
Other key reform areas include:
Consumer protection. A new national credit regulator and a new consumer tribunal will be created, and financial advisory intermediaries are required to register with the FSB and comply with fit and proper criteria and market conduct regulations.
Black Economic Empowerment. Banks are implementing the Financial Sector Charter (FSC).
Regional cooperation. The Eastern and Southern African Supervisors (ESAF) group, was dissolved towards the end of 2004 and replaced with the SADC sub-committee of bank supervisors (SBBS), the regional forum for supervisors. Revitalized projects include implementation of core principles for effective banking supervision for members, harmonization of supervisory legislation, and the establishment of a minimum standard of on-site supervision.
International standards. Preparatory work for implementing Basel II requirements is underway and banks have until January 1, 2008 to comply. Firms listed at the JSE Limited must comply with international financial reporting standards starting January 2005. Local auditing standards for banks are being harmonized with international standards.
Broader access to financial services. This is to be achieved mainly through implementation of the FSC, increased disclosure on lending practices, and the introduction of second and third tier banks specialized in basic banking services.
Foreign entry. In July 2005, Barclays Bank Plc (UK) acquired 54 percent share in ABSA Group Limited.
- 19 -
D. Structural Policies and Medium-Term Outlook
Labor market
34. Several factors appear to be constraining employment growth in South Africa.These include low skills and limited entrepreneurial experience in a large part of the population, mainly a legacy of the apartheid regime, as well as labor market regulations that increase the cost of labor.12 Moreover, high transport costs may raise reservation wages and deter workers, particularly from township and rural areas, from seeking urban jobs. Also, the informal sector seems to be relatively small in South Africa, a phenomenon that is not fully understood. A Fund technical assistance mission found that informal employment may be underestimated, but the underestimation was difficult to quantify, and could be small.
35. The authorities are using several instruments to reduce unemployment, an approach supported by staff. First, the government is implementing a National Skills Development Strategy (NSDS) aimed at enhancing skills through training initiatives and learnership programs, which seems to be relatively successful in providing the skills needed to obtain employment. On the other hand, the program is funded by a tax on labor, which tends to reduce employment.13 Second, the government is creating temporary jobs in infrastructure and other projects through its expanded public works program (EPWP), which may also be useful in training workers to obtain subsequent employment. Third, the 2005 budget introduced measures to support small business development, which should also stimulate job creation.
36. Staff considered however that easing labor legislation would be critical to make a significant dent in unemployment (Box 4). On the basis of international evidence showing that flexible labor markets are conducive to job creation, staff urged: (i) relaxing the “extension principle” in collective bargaining to allow small firms to negotiate agreements that reflect their own economic circumstances; (ii) simplifying the minimum-wage structure and moderating periodic minimum-wage adjustments to reduce labor costs and facilitate mobility across sectors; and (iii) further streamlining dismissal procedures, as well as educating stakeholders on the legal requirements for dismissal as reportedly some of the costs arise from misinterpretation of the law. The Department of Labor announced in July the launch of a study on whether labor legislation impedes job growth, SME development, and foreign direct investment in South Africa.
12 These regulations include centralized collective bargaining in some sectors, with agreements between large firms and unions being “extended” to smaller firms; sector-specific minimum wages in other sectors; and complex dismissal procedures.
13 The 2005 budget includes a proposal to widen the range of small businesses that would be exempt from this tax.
- 20 -
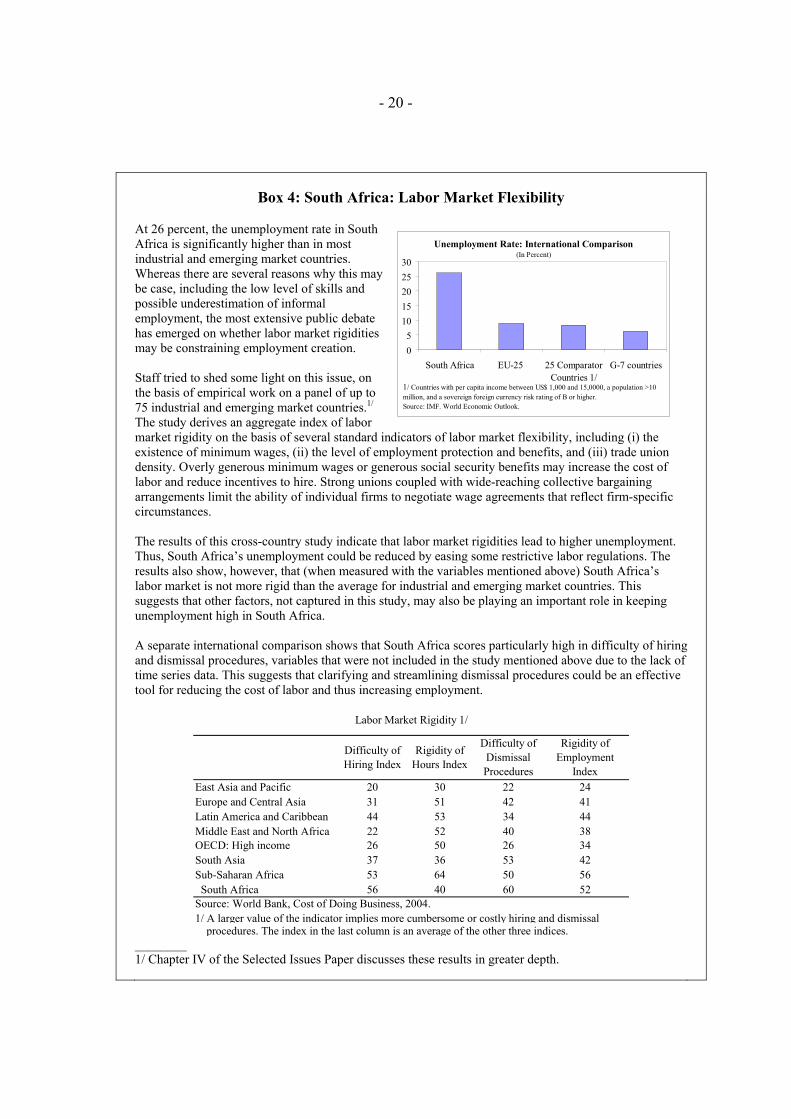
Box 4: South Africa: Labor Market Flexibility
At 26 percent, the unemployment rate in South Africa is significantly higher than in most industrial and emerging market countries. Whereas there are several reasons why this may be case, including the low level of skills and possible underestimation of informal employment, the most extensive public debate has emerged on whether labor market rigidities may be constraining employment creation.
Staff tried to shed some light on this issue, on the basis of empirical work on a panel of up to 75 industrial and emerging market countries.1/
The study derives an aggregate index of labor market rigidity on the basis of several standard indicators of labor market flexibility, including (i) the existence of minimum wages, (ii) the level of employment protection and benefits, and (iii) trade union density. Overly generous minimum wages or generous social security benefits may increase the cost of labor and reduce incentives to hire. Strong unions coupled with wide-reaching collective bargaining arrangements limit the ability of individual firms to negotiate wage agreements that reflect firm-specific circumstances.
The results of this cross-country study indicate that labor market rigidities lead to higher unemployment. Thus, South Africa’s unemployment could be reduced by easing some restrictive labor regulations. The results also show, however, that (when measured with the variables mentioned above) South Africa’s labor market is not more rigid than the average for industrial and emerging market countries. This suggests that other factors, not captured in this study, may also be playing an important role in keeping unemployment high in South Africa.
A separate international comparison shows that South Africa scores particularly high in difficulty of hiring and dismissal procedures, variables that were not included in the study mentioned above due to the lack of time series data. This suggests that clarifying and streamlining dismissal procedures could be an effective tool for reducing the cost of labor and thus increasing employment.
East Asia and Pacific 20 30 22 24
Europe and Central Asia 31 51 42 41
Latin America and Caribbean 44 53 34 44
Middle East and North Africa 22 52 40 38OECD: High income 26 50 26 34
South Asia 37 36 53 42
Sub-Saharan Africa 53 64 50 56
South Africa 56 40 60 52Source: World Bank, Cost of Doing Business, 2004.
procedures. The index in the last column is an average of the other three indices.
Labor Market Rigidity 1/
1/ A larger value of the indicator implies more cumbersome or costly hiring and dismissal
Difficulty of Hiring Index
Rigidity of Hours Index
Difficulty of DismissalProcedures
Rigidity of Employment
Index
________ 1/ Chapter IV of the Selected Issues Paper discusses these results in greater depth.
Unemployment Rate: International Comparison (In Percent)
0
5
10
15
20
25
30
South Africa EU-25 25 ComparatorCountries 1/
G-7 countries
1/ Countries with per capita income between US$ 1,000 and 15,0000, a population >10
million, and a sovereign foreign currency risk rating of B or higher.
Source: IMF. World Economic Outlook.

- 21 -
Trade policy and regional impact
37. South Africa’s trade regime has been liberalized substantially over the last decade. The simple average MFN tariff rate has been reduced from over 20 percent in the early 1990s to 11 percent in 2004 and virtually all quantitative restrictions have been eliminated.14
38. However, some sectors are still highly protected and the tariff structure remains complex. While average tariff rates are similar to the average in other emerging markets, the number of tariff peaks (i.e., tariff lines carrying tariff rates in excess of 15 percent) and the share of non ad valorem duties tend to be somewhat higher than in those other countries. Staff noted that lowering the overall level of protection and harmonizing protection across sectors, reducing the number of tariff bands, and applying ad valorem duties for most items, would enhance competition, increase productivity, and support growth. Staff also reiterated its call for an independent assessment of the Motor Industry Development Programme (MIDP), a complicated incentive scheme designed to make the local motor industry internationally competitive, which costs are unclear.15 The authorities explained that reviews of the tariff regime and the MIDP were ongoing. However, any reform of the tariff structure would need to be taken in concert with the partners in the Southern African Customs Union (SACU) and would likely also be linked to progress on multilateral trade negotiations.16
39. South Africa is playing an active role in multilateral trade negotiations, while at the same time pursuing regional and bilateral preferential trade arrangements. The authorities support the multilateral trade liberalization process through the WTO and have played a leadership role in the current Doha Round of negotiations. However, motivated in part by lack of progress with multilateral negotiations, South Africa and its SACU partners have been actively negotiating preferential trade arrangements.17 Staff noted that liberalization under these agreements should be broad-based and non-discriminatory, with simple and non-restrictive rules of origin, as this would limit the potential for trade diversion
14 Chapter V of the Selected Issues Paper discusses South Africa’s trade policy issues.
15 Experience in other countries suggests that local content programs in the motor industry tend to raise costs and prices, reduce competition, and generate few, if any, benefits for employment. Moreover, once established, such programs are difficult to remove. An independent review of the MIDP, which could take into account the consumer and general national interest in lower vehicle prices and a more efficient motor industry, would be a useful counterweight to strong vested interests in the continuation of the program. On the MIDP, see also the Box in Chapter V of the Selected Issues Paper.
16 SACU (Southern African Customs Union) also includes Botswana, Lesotho, Namibia, and Swaziland.
17 An agreement was recently concluded with Mercosur, negotiations are under way with the United States and EFTA, and envisaged with, among others, China and India. South Africa also has a bilateral trade agreement with the EU, which aims to establish a free trade area by 2012.
- 22 -
and complement multilateral liberalization efforts. It also indicated that the broad array of overlapping regional and bilateral arrangements in Southern Africa further complicates the trade system, and encouraged the authorities to explore ways in which such overlapping arrangements might be streamlined.
40. South Africa is the major economic driving force within the region, accounting for a substantial share of exports from its neighboring SACU partners.18 The stock of South Africa’s FDI in the rest of Africa has increased from 5 percent of total South Africa’s outward stock in 2000 to 9 percent in 2003. The peg of the currencies of Lesotho, Namibia and Swaziland to the rand within the Common Monetary Area (CMA) Agreement with South Africa has contributed to the maintenance of low inflation across the region, but, as in South Africa, the strength of the rand has put some pressure on their export sectors. Fiscal policies are also linked to some extent through the SACU agreement, as shared customs and excise duties constitute a major part of tax revenues in Lesotho, Namibia, and Swaziland. Further trade liberalization, including through South Africa’s bilateral agreement with the EU, may therefore lead to some region-wide pressure on government finances. The authorities explained that they viewed the rest of the region and Africa as a potentially important market. They therefore attach a high priority to participating in region-wide efforts to promote growth and macroeconomic convergence.
State-owned enterprises
41. State-owned enterprises continue to play a significant role in the economy, and the authorities see them as a key vehicle for strengthening infrastructure and public service delivery. The SOEs under the Department of Public Enterprises account for 1.2 percent of total employment, with combined assets equivalent of 12.8 percent of GDP and a turnover of 6.1 percent of GDP. This group includes, among others, the major SOE’s in the country, Eskom (energy), Transnet (transportation), and Denel (defense). Over the next few years, infrastructure investment by SOEs will focus mainly on electricity, ports, rails, roads and water resources.
42. The authorities have recently de-emphasized the role of privatization as a way of enhancing efficiency. A framework for SOE reform, announced in 2000, envisaged privatization and enterprise restructuring together with a strengthening of the regulatory framework, in order to improve service quality, promote competitiveness, and mobilize investment. This program gained momentum in 2003 with a sale of 28 percent of Telkom (telecommunications), which brought the company under majority private ownership. However, the strategy was subsequently reoriented, partly due to lower than anticipated privatization receipts in the aftermath of the downturn in the global telecoms market.
18 Assessing the level of trade flows within SACU is difficult, but South Africa may account for 38 percent of exports from Lesotho, 31 percent of exports from Namibia, and 50 percent of exports from Swaziland. Recent work by the staff (Arora, V. and Vamvakidis, A., 2005, “The Implications of South African Economic Growth for the Rest of Africa,” IMF/WP/05/58) suggests that South African economic growth has significant positive implications for the region.

- 23 -
43. The current approach focuses on the operational restructuring of large enterprises, together with the sale of their non-core assets. The staff supported these efforts to enhance efficiency. It also encouraged the authorities to explore the possibility of privatizing assets not involved in infrastructure, and to keep open the possibility of further privatization in the future—depending on the success of the restructuring program—within an effective regulatory framework.
Medium-term outlook
44. There was broad agreement that potential output growth had increased as a result of sound policies over the last decade. There were some differences, however, on the estimated magnitude of the improvement. The authorities considered that potential growth could be 4 percent or higher owing to efficiency gains that had not yet been reflected in the data. On the other hand, staff calculated current potential output growth at 3¼-3½ percent, on the basis of a filtering approach and a production function approach (taking into account the impact of structural changes) estimated over the last two decades.
45. The staff’s baseline scenario envisages average annual real GDP growth of 3½ percent over 2005-10. Reducing unemployment under the baseline would be difficult. Implementation of comprehensive reforms in the areas of labor markets, trade liberalization, and public enterprises, along the lines discussed in this report, would be conducive to higher growth and employment. Appendix IV presents a scenario in which real GDP growth is projected to increase to around 5½ percent over the medium term.
E. Social and Other Issues
Social issues
46. South Africa has made advances towards the Millennium Development Goals (MDGs), but significant challenges remain. Substantial progress has been made on the provision of basic amenities and literacy, but other social indicators—such as child mortality and life expectancy—have been adversely affected by the HIV/AIDS epidemic.
47. The government has reinforced its efforts to fight the HIV/AIDS epidemic.Around 17-25 percent of adult South Africans are officially estimated to be HIV-positive. In recent years, the government has increased sharply its spending to combat the disease, and in 2003 it launched a major program to provide anti-retroviral drug (ARVs) to the public through the national health system. The rollout of ARVs has been running behind schedule—with some 50,000 patients receiving treatment through public health facilities compared with 500,000-800,000 in need—partly due to the complexity of an initiative of this magnitude. The recent conclusion of an important procurement tender for ARV drugs is expected to ensure a sustainable supply of drugs. A challenge will be to administer efficiently the delivery of these drugs through the public health system.
48. The impact of HIV/AIDS on economic growth is highly uncertain. Estimates of the adverse impact on annual growth rates range from ½ to 2½ percentage points. The major
- 24 -
effects result from factors such as lower labor productivity, the loss of labor, higher production costs (including health costs), and reduced incentives to invest.
49. Staff expressed strong support for the government’s initiatives to reduce social and wealth disparities. These initiatives help foster social cohesion and consolidate an environment favorable to sustained economic and social progress. The increasingly broad-based nature of BEE, and the foundation of land reform on well-defined legal principles are important characteristics to maintain wide support for these policies.
50. Significant progress has been made with Broad Based Black Economic Empowerment. This initiative uses several tools to achieve empowerment of the black population, including voluntary sector-specific “charters” that set targets for a range of empowerment indicators, including percentage of black ownership, black participation in management, and skills development. Several sectors have made significant progress with their charters. Staff supported the authorities’ broad-based approach, which emphasizes several empowerment indicators and also aims at bringing new participants from the black population into ownership. It was agreed that tax incentives specifically aimed at BEE deals should be avoided as they are distortionary.
51. Progress on land reform remains mixed. In 1994, the market-based land reform set a target of 30 percent of agricultural land under black ownership by 2015. The program includes land restitution (return of land lost due to racially discriminatory laws) and land redistribution (purchase of land by black individuals facilitated by government grants and loans). To date only 4 percent of agricultural land is under black ownership. Staff welcomed the progress made with land restitution. Obstacles to faster progress with land redistribution seem to include (i) administrative capacity constraints coupled with the inherently difficult nature of the process; (ii) regressive taxation of land, which makes subdivided land less profitable; and (iii) legal obstacles to land subdivision.
Other issues
52. The authorities have completed reviews of the full range of standards and codes.As of end April 2005, South Africa was one of only two Fund members to have completed Reports on the Observation of Standards and Codes (ROSCs) in each area endorsed by the IMF and World Bank as important for their work.19 Five of these ROSCs have been published, covering data transparency, anti-money laundering and combating the financing of terrorism, corporate governance, accountancy, and auditing.
53. Economic data for South Africa are generally of good quality and are provided to the Fund and the public in a timely manner. South Africa subscribes to the SDDS and publishes all data on the reserves template. Progress in improving the quality of labor market and real sector data, and narrowing the scope of unidentified transactions in balance of
19 For details of the 12 standards and codes endorsed by the IMF and the World Bank, see http://www.imf.org/external/standards/scnew.htm
- 25 -
payments statistics, would facilitate economic analysis and support policy design and implementation. The authorities have indicated that they plan to address weaknesses in labor markets statistics but also need to overcome capacity constraints.
III. STAFF APPRAISAL
54. Economic progress since democratization has been remarkable. Sound macroeconomic management and structural reforms have led to faster economic growth, lower and more predictable inflation, stronger public finances, and a markedly improved external position. Furthermore, South Africa has emerged as a major driving force in the region and its stronger economic performance has benefited the rest of Africa.
55. Recent economic performance has been strong and the near-term outlook is broadly favorable. Economic activity has been supported by a continuation of sound policies and a positive external environment. Looking forward, growth is expected to remain robust, owing to low interest rates, a moderately expansionary fiscal policy, and healthy growth in the world economy. The main risks to this outlook arise from a possible worsening of external conditions, including a slowdown in global growth and a sharp fall in capital flows to emerging markets. On the domestic front, though less likely, a large correction in property prices could also dampen economic activity.
56. Serious economic challenges remain. Unemployment remains stubbornly high, poverty is widespread, large wealth disparities persist, and the high incidence of HIV/AIDS is causing untold human suffering and uncertain economic costs.
57. The authorities’ strategy focuses on raising economic growth within a stable macroeconomic environment, combined with initiatives to reduce unemployment and improve social conditions. Perseverance with these policies, together with ambitious labor market reforms, further trade liberalization, and a substantial improvement in state-owned enterprises’ efficiency, could put the country firmly on a higher growth path and raise the well-being of all South Africans.
58. Sound monetary policy management has successfully kept inflation within the target band and has enhanced the credibility of the inflation targeting regime. As a result, inflation expectations have declined to within the target band. The monetary authorities are aware that a clear communication of their decisions, emphasizing inflation as the overriding objective of monetary policy, would be important to continue strengthening credibility. Also, targeting inflation at the mid-point of the band over the medium-term would help anchor inflation expectations and increase monetary policy effectiveness.
59. Possible upside risks to the inflation outlook deserve close monitoring. Inflation is on an upward trend, and monetary policy remains expansionary, as suggested by the rapid money and credit growth. Thus, the repo rate may need to be raised somewhat above present levels over the next year to stabilize inflation around the mid-point of the target band.
60. The flexible exchange rate system, together with interventions to accumulate reserves when market conditions are favorable, has benefited the country. The flexible

- 26 -
exchange rate is an integral part of the inflation targeting regime, and facilitates the adjustment of the economy to external shocks. While the strength of the rand has adversely affected some export-oriented activities, the exchange rate seems to be broadly in line with its long-run equilibrium level. The authorities are properly focusing on increasing competitiveness through measures that raise productivity and reduce costs. Reserves accumulation has contributed to lowering currency volatility and bonds spreads. There is some room for this process to continue, but reserves are approaching levels at which the case for further accumulation would be less compelling.
61. The authorities have continued relaxing capital controls, and further progress in this direction would be beneficial. Importantly, limits on outward foreign direct investment were lifted last year. The possible move from exchange controls to prudential regulations for institutional investors would be a positive step, which could be complemented by easing restrictions on non-financial firms.
62. The planned moderate increase in social and infrastructure spending over the next few years seems appropriate. Fiscal consolidation over the last several years has created space for some additional spending, and well-targeted expenditure in these areas will help address pressing social needs and enhance the productive capacity of the economy. Given limits to the capacity to absorb additional resources efficiently, it would be advisable to maintain medium-term expenditure plans broadly unchanged despite possible revenue gains. It will be important in any event to keep the fiscal deficit below levels that would lead to an undesirable increase in the debt to GDP ratio, as this is likely to put upward pressure on interest rates.
63. The banking system is sound, and the authorities are taking important initiatives in the financial sector, including to facilitate access to banking services for the poor.Indicators of bank financial health are favorable, and the authorities continue to monitor risks closely, including those that could arise from banks’ large mortgage portfolio. Most of the FSAP’s recommendations are being implemented, which together with other initiatives to enhance the regulatory and supervisory framework would further strengthen financial sector soundness. Progress so far in facilitating access of previously disadvantaged groups to banking services is welcome. Further advances in implementing the Financial Sector Charter and the introduction of a regulatory framework for institutions specialized in basic banking services should help speed up this process.
64. Measurable success in reducing unemployment in the near-term is critical for maintaining support for sound economic policies and ongoing reform initiatives. Lowering unemployment continues to be a top official priority. The government’s approach includes programs to enhance skills and to provide temporary jobs in infrastructure and other projects, as well as measures to foster small business development. This strategy could benefit substantially from a relaxation of restrictive labor market regulations. International evidence indicates that labor market reforms that reduce the cost of labor could have an important impact on unemployment. Reforms could include reducing the scope of centralized collective bargaining, simplifying the minimum-wage structure and moderating minimum-wage adjustments, and further streamlining dismissal procedures.

- 27 -
65. Further trade liberalization and simplification of the tariff regime would increase productivity and support growth. Efforts could focus on lowering the overall level of protection, harmonizing protection across sectors, reducing the number of tariff bands, and applying ad valorem duties for most items. It would also be important that preferential trade agreements being negotiated by the country be broad-based and non-discriminatory so as to complement multilateral liberalization and limit the potential for trade diversion. The Motor Industry Development Programme (MIDP) entails a complex scheme of incentives with uncertain benefits and costs that merit an independent evaluation.
66. The government’s emphasis on improving the efficiency of state-owned enterprises is well placed. Success in this effort would raise productivity and reduce the cost of doing business in South Africa. While the official approach focuses on operational restructuring accompanied by the sale of non-core assets, it would be useful to keep open the possibility of future privatization, depending on the success of the restructuring program and provided that an effective regulatory framework is in place.
67. Reducing social and wealth disparities is crucial for enhancing the well-being of the population at large, and ensuring an environment in which further social and economic progress is possible. The government is advancing with its Broad Based Black Economic Empowerment strategy. Progress with the land reform program has been more limited; it will be important to address the difficulties that prevent faster progress, while keeping the program grounded on well-defined legal principles. Continued and firm action against the HIV/AIDS epidemic will help contain the serious social impact of the disease.
68. It is expected that the next Article IV consultation will be held on the standard 12-month cycle.
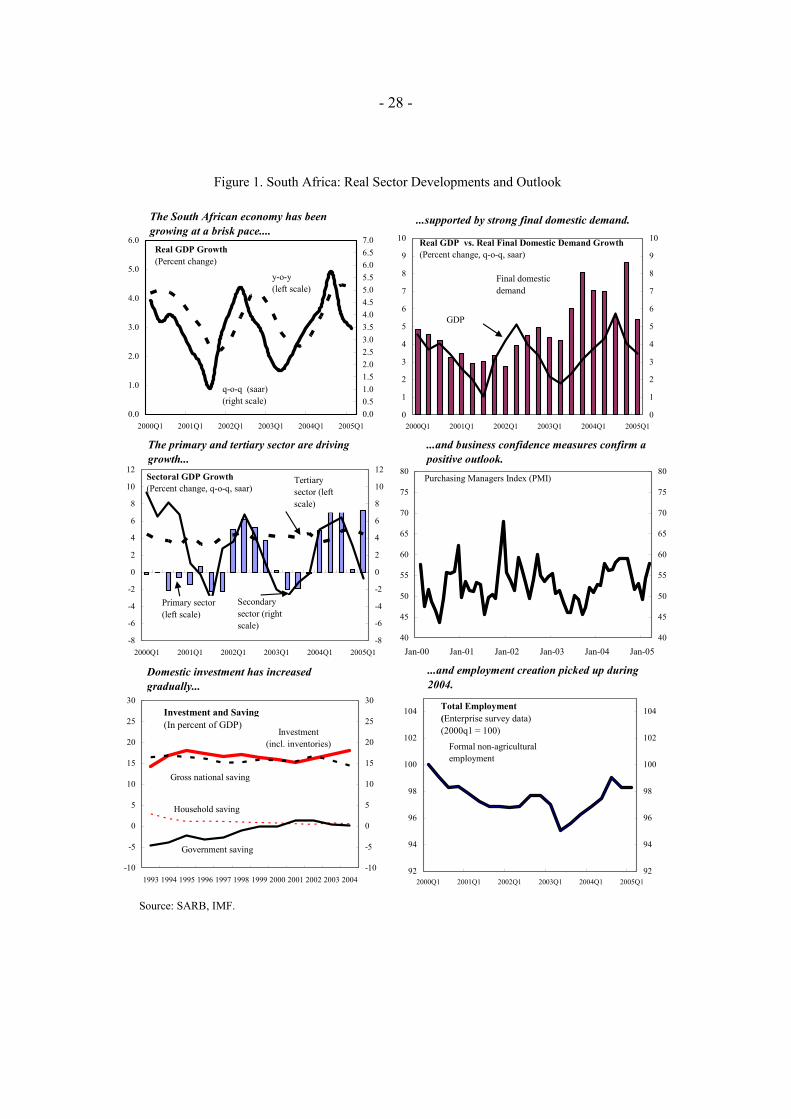
- 28 -
Figure 1. South Africa: Real Sector Developments and Outlook
Source: SARB, IMF.
0.0
1.0
2.0
3.0
4.0
5.0
6.0
2000Q1 2001Q1 2002Q1 2003Q1 2004Q1 2005Q1
0.0
0.5
1.0
1.5
2.0
2.5
3.0
3.5
4.0
4.5
5.0
5.5
6.0
6.5
7.0
q-o-q (saar)
(right scale)
y-o-y
(left scale)
Real GDP Growth
(Percent change)
0
1
2
3
4
5
6
7
8
9
10
2000Q1 2001Q1 2002Q1 2003Q1 2004Q1 2005Q1
0
1
2
3
4
5
6
7
8
9
10Real GDP vs. Real Final Domestic Demand Growth (Percent change, q-o-q, saar)
-8
-6
-4
-2
0
2
4
6
8
10
12
2000Q1 2001Q1 2002Q1 2003Q1 2004Q1 2005Q1
-8
-6
-4
-2
0
2
4
6
8
10
12Sectoral GDP Growth(Percent change, q-o-q, saar)
40
45
50
55
60
65
70
75
80
Jan-00 Jan-01 Jan-02 Jan-03 Jan-04 Jan-05
40
45
50
55
60
65
70
75
80
Investment and Saving(In percent of GDP)
-10
-5
0
5
10
15
20
25
30
1993 1994 1995 1996 1997 1998 1999 2000 2001 2002 2003 2004
-10
-5
0
5
10
15
20
25
30
Investment
(incl. inventories)
Gross national saving
Household saving
Government saving
92
94
96
98
100
102
104
2000Q1 2001Q1 2002Q1 2003Q1 2004Q1 2005Q1
92
94
96
98
100
102
104
Formal non-agricultural
employment
Total Employment
(Enterprise survey data)
(2000q1 = 100)
The South African economy has been growing at a brisk pace....
...supported by strong final domestic demand.
The primary and tertiary sector are driving growth...
...and business confidence measures confirm a positive outlook.
Domestic investment has increased gradually...
...and employment creation picked up during 2004.
GDP
Final domestic
demand
Tertiary
sector (left
scale)
Secondary
sector (right
scale)
Primary sector
(left scale)
Purchasing Managers Index (PMI)

- 29 -
Figure 2. South Africa: Money, Prices and Interest Rates
Source: SARB, BER, Datastream, IMF.
6
8
10
12
14
16
18
Jan-00 Jan-01 Jan-02 Jan-03 Jan-04 Jan-05
6
8
10
12
14
16
18
Repo rate
R153 bond yield
Repo Rate and Yield on R153 Bond
(maturing in 2010) (In percent)
-6
-4
-2
0
2
4
6
8
10
12
14
16
18
20
Jan-00 Jan-01 Jan-02 Jan-03 Jan-04 Jan-05
-6
-4
-2
0
2
4
6
8
10
12
14
16
18
20
Headline CPI
CPIX
PPI
Inflation(Percent change, y-o-y)
0
5
10
15
20
25
30
Jan-00 Jan-01 Jan-02 Jan-03 Jan-04 Jan-05
0
5
10
15
20
25
30
Private credit
Mortgage advancesDomestic Credit and Broad Money
(Percent change, y-o-y)
M3
0
2
4
6
8
10
12
14
16
2000Q1 2001Q1 2002Q1 2003Q1 2004Q1
0
2
4
6
8
10
12
14
Unit labor costs
Renumeration per
worker
Total Renumeration per Worker and Unit
Labor Costs(Percent change, y-o-y)
0
2
4
6
8
10
12
Jan-00 Jan-01 Jan-02 Jan-03 Jan-04 Jan-05
0
2
4
6
8
10
12Long-term Inflation Expectations(In percent)
6
8
10
12
14
16
Jan-00 Jan-01 Jan-02 Jan-03 Jan-04 Jan-05 Jan-06
6
8
10
12
14
16
Interest Rates (In percent)
Long-term
interest rate
(10-year bond)
Short-term interest rate
The repo rate was cut by 650 basis points since mid-2003...
.. .while CPIX inflation is in the lower half of the 3-6 percent target band.
Long-term inflation expectations have fallen since 2002, though picked-up somewhat recently.
Money and credit growth remain fairly strong...
and wage increases remain above inflation...... while markets are pricing in a stable repo rate
within the next 12 months.
Breakeven inflation
(Long-term government bond yield minus yield on
CPI-indexed government bond)
Forward rate
(3-month FRA,
25 July 2005)
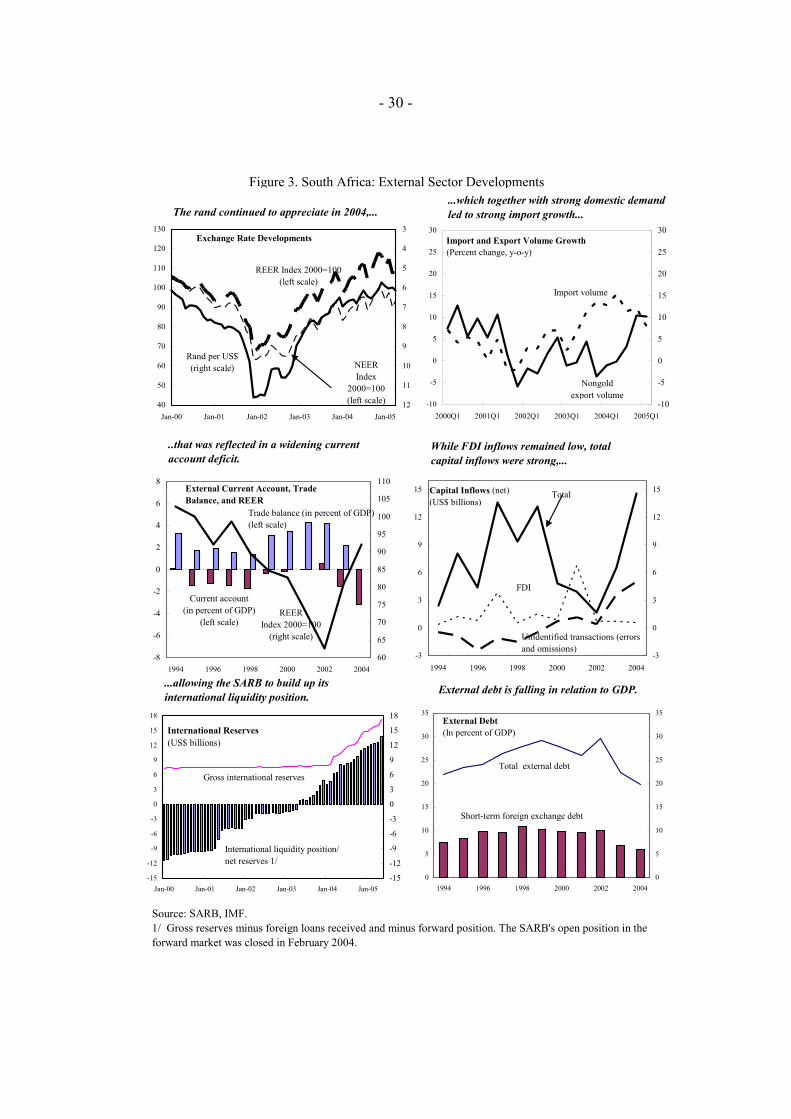
- 30 -
-10
-5
0
5
10
15
20
25
30
2000Q1 2001Q1 2002Q1 2003Q1 2004Q1 2005Q1
-10
-5
0
5
10
15
20
25
30
Import volume
Nongold
export volume
Import and Export Volume Growth(Percent change, y-o-y)
Figure 3. South Africa: External Sector Developments
Source: SARB, IMF. 1/ Gross reserves minus foreign loans received and minus forward position. The SARB's open position in the forward market was closed in February 2004.
-8
-6
-4
-2
0
2
4
6
8
1994 1996 1998 2000 2002 2004
60
65
70
75
80
85
90
95
100
105
110
REER
Index 2000=100
(right scale)
Trade balance (in percent of GDP)
(left scale)
Current account
(in percent of GDP)
(left scale)
External Current Account, Trade
Balance, and REER
40
50
60
70
80
90
100
110
120
130
Jan-00 Jan-01 Jan-02 Jan-03 Jan-04 Jan-05
3
4
5
6
7
8
9
10
11
12
NEER
Index
2000=100
(left scale)
REER Index 2000=100
(left scale)
Rand per US$
(right scale)
Exchange Rate Developments
-3
0
3
6
9
12
15
1994 1996 1998 2000 2002 2004
-3
0
3
6
9
12
15Total
FDI
Unidentified transactions (errors
and omissions)
Capital Inflows (net)
(US$ billions)
0
5
10
15
20
25
30
35
1994 1996 1998 2000 2002 2004
0
5
10
15
20
25
30
35
Total external debt
Short-term foreign exchange debt
External Debt(In percent of GDP)
The rand continued to appreciate in 2004,...
..that was reflected in a widening current account deficit.
...which together with strong domestic demand led to strong import growth...
While FDI inflows remained low, total capital inflows were strong,...
...allowing the SARB to build up its international liquidity position.
External debt is falling in relation to GDP.
-15
-12
-9
-6
-3
0
3
6
9
12
15
18
Jan-00 Jan-01 Jan-02 Jan-03 Jan-04 Jan-05
-15
-12
-9
-6
-3
0
3
6
9
12
15
18
International liquidity position/
net reserves 1/
Gross international reserves
International Reserves
(US$ billions)
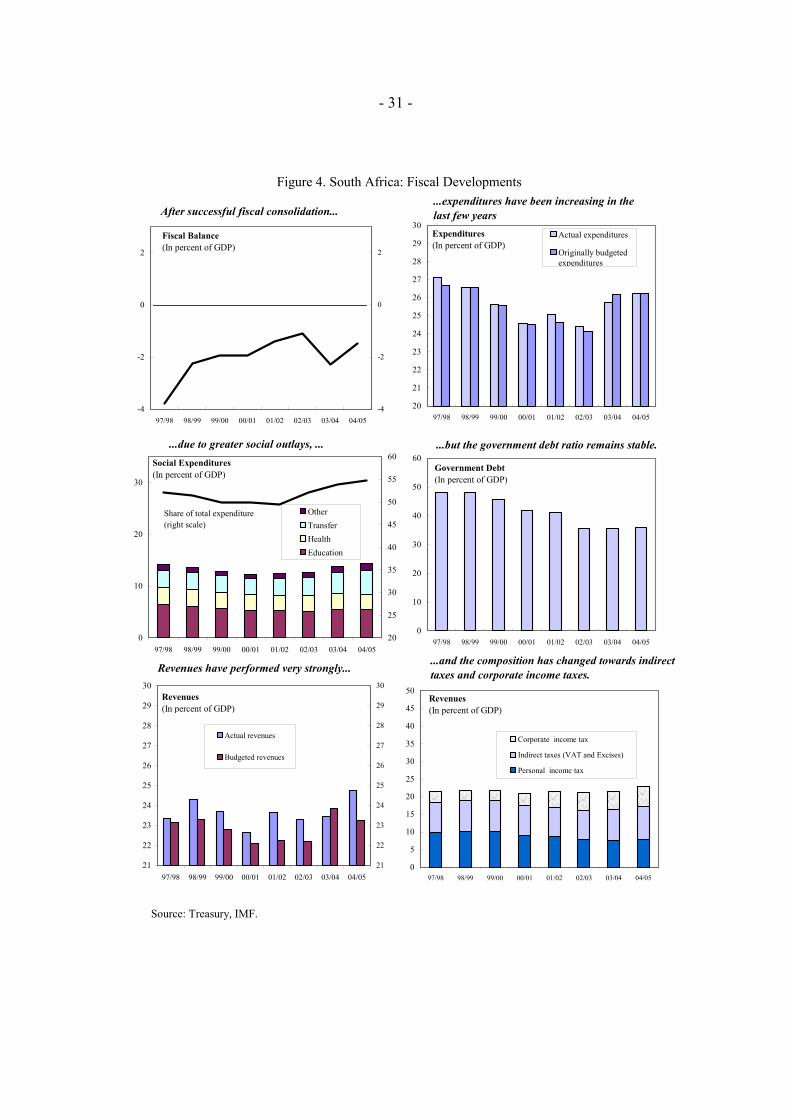
- 31 -
Figure 4. South Africa: Fiscal Developments
Source: Treasury, IMF.
-4
-2
0
2
97/98 98/99 99/00 00/01 01/02 02/03 03/04 04/05
-4
-2
0
2
20
21
22
23
24
25
26
27
28
29
30
97/98 98/99 99/00 00/01 01/02 02/03 03/04 04/05
Actual expenditures
Originally budgeted expenditures
Expenditures (In percent of GDP)
0
10
20
30
97/98 98/99 99/00 00/01 01/02 02/03 03/04 04/05
20
25
30
35
40
45
50
55
60
Other
Transfer
Health
Education
Social Expenditures
(In percent of GDP)
National government gross loan debt
0
10
20
30
40
50
60
97/98 98/99 99/00 00/01 01/02 02/03 03/04 04/05
Government Debt (In percent of GDP)
21
22
23
24
25
26
27
28
29
30
97/98 98/99 99/00 00/01 01/02 02/03 03/04 04/05
21
22
23
24
25
26
27
28
29
30
Actual revenues
Budgeted revenues
Revenues(In percent of GDP)
0
5
10
15
20
25
30
35
40
45
50
97/98 98/99 99/00 00/01 01/02 02/03 03/04 04/05
Corporate income tax
Indirect taxes (VAT and Excises)
Personal income tax
Revenues(In percent of GDP)
After successful fiscal consolidation......expenditures have been increasing in the last few years
...due to greater social outlays, ... ...but the government debt ratio remains stable.
Revenues have performed very strongly......and the composition has changed towards indirect taxes and corporate income taxes.
Fiscal Balance(In percent of GDP)
Share of total expenditure
(right scale)

- 32 -
Figure 5. South Africa: Exchange Rates, Asset Prices and Spreads
Source: SARB, Datastream, Absa, IMF.
100
200
300
400
500
600
700
800
900
1,000
Jan-00 Jan-01 Jan-02 Jan-03 Jan-04 Jan-05
4
6
8
10
12
14
Platinum price in US$
(left scale)
Rand per US$ (right
scale) inverted)
Platinum Prices and the Rand/US$ Exchange Rate
20
40
60
80
100
120
140
160
1997M1 1999M1 2001M1 2003M1 2005M1
20
40
60
80
100
120
140
160
Australia New Zealand South Africa
Commodity Currencies (REERs)
(Index 2000=100)
80
100
120
140
160
180
200
220
Jan-00 Jan-01 Jan-02 Jan-03 Jan-04 Jan-05
0
2
4
6
8
10
12
14
16
18
Total market, P/E
ratio (right scale)
Total market, return index,
Jan 2000=100, (left scale)
Stock Market Index and Stock Valuation
0
5
10
15
20
25
30
35
40
45
50
Jan-00 Jan-01 Jan-02 Jan-03 Jan-04 Jan-05
0
5
10
15
20
25
30
35
40
45
50
Real 12-month percent change, 3-
month moving average
Nominal 12-month percent change
Absa House Price Index
(Annual percent change)
0
100
200
300
400
500
600
700
800
900
1,000
1,100
1,200
Jan-00 Jan-01 Jan-02 Jan-03 Jan-04 Jan-05
0
100
200
300
400
500
600
700
800
900
1,000
1,100
1,200
Spread
(South Africa)
Spread (EMBI)
Sovereign Spreads on US$-Denominated
Government Bonds
(In basis points)
0
100
200
300
400
500
600
Jan-00 Jan-01 Jan-02 Jan-03 Jan-04 Jan-05
0
100
200
300
400
500
600Sovereign Spreads on US$ -Denominated
Government Bonds(In basis points)
The rand moved closely with metal prices...
...other commodity currencies have also strengthened.
Stock prices have been rising... ...and house prices have risen strongly but growth is slowing.
Sovereign spreads declined...
...partly in response to an increase in appetite for emerging market debt.
Thailand
(Baa1)
South Africa
(Baa2)
Mexico (Baa2)
Gold price in US$
(left scale)
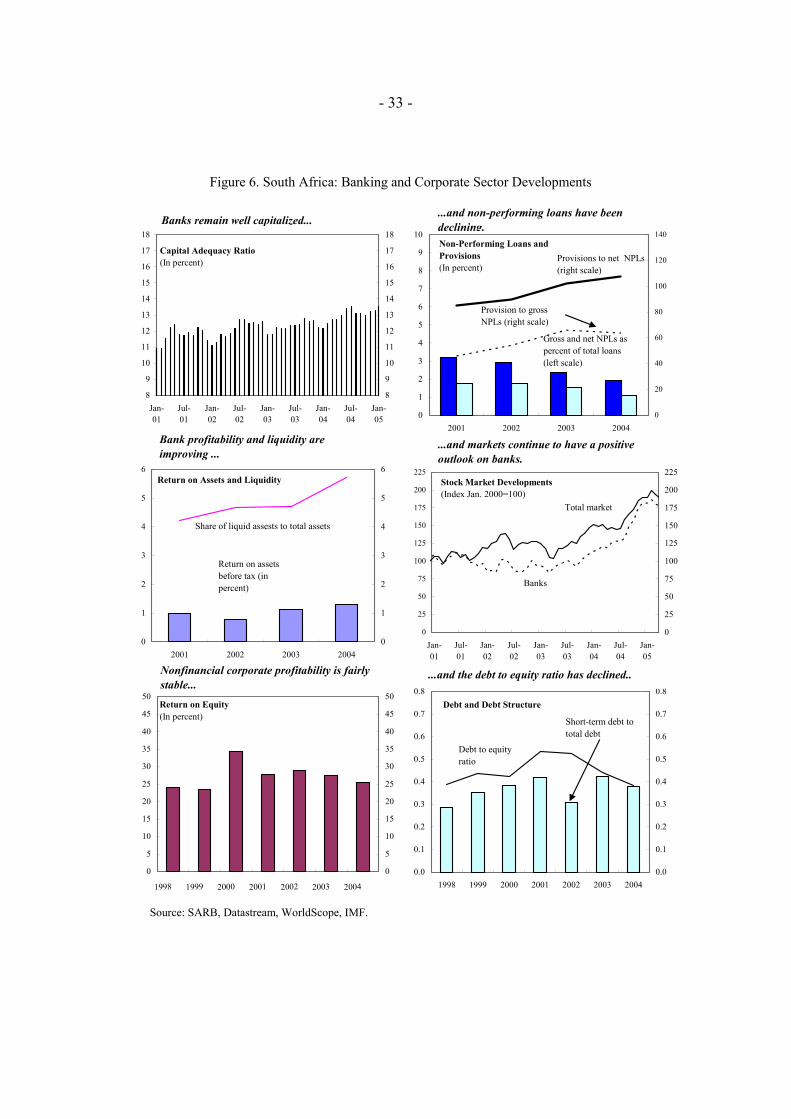
- 33 -
Figure 6. South Africa: Banking and Corporate Sector Developments
Source: SARB, Datastream, WorldScope, IMF.
8
9
10
11
12
13
14
15
16
17
18
Jan-
01
Jul-
01
Jan-
02
Jul-
02
Jan-
03
Jul-
03
Jan-
04
Jul-
04
Jan-
05
8
9
10
11
12
13
14
15
16
17
18
Capital Adequacy Ratio
(In percent)
0
1
2
3
4
5
6
7
8
9
10
2001 2002 2003 2004
0
20
40
60
80
100
120
140
Provisions to net NPLs
(right scale)
Provision to gross
NPLs (right scale)
Non-Performing Loans and
Provisions
(In percent)
Gross and net NPLs as
percent of total loans
(left scale)
0
1
2
3
4
5
6
2001 2002 2003 2004
0
1
2
3
4
5
6
Return on assets
before tax (in
percent)
Share of liquid assests to total assets
Return on Assets and Liquidity
0
25
50
75
100
125
150
175
200
225
Jan-
01
Jul-
01
Jan-
02
Jul-
02
Jan-
03
Jul-
03
Jan-
04
Jul-
04
Jan-
05
0
25
50
75
100
125
150
175
200
225
Total market
Banks
Stock Market Developments(Index Jan. 2000=100)
0
5
10
15
20
25
30
35
40
45
50
1998 1999 2000 2001 2002 2003 2004
0
5
10
15
20
25
30
35
40
45
50Return on Equity
(In percent)
0.0
0.1
0.2
0.3
0.4
0.5
0.6
0.7
0.8
1998 1999 2000 2001 2002 2003 2004
0.0
0.1
0.2
0.3
0.4
0.5
0.6
0.7
0.8
Debt to equity
ratio
Short-term debt to
total debt
Debt and Debt Structure
Banks remain well capitalized......and non-performing loans have been declining.
Bank profitability and liquidity are improving ...
...and markets continue to have a positive outlook on banks.
Nonfinancial corporate profitability is fairly stable...
...and the debt to equity ratio has declined..
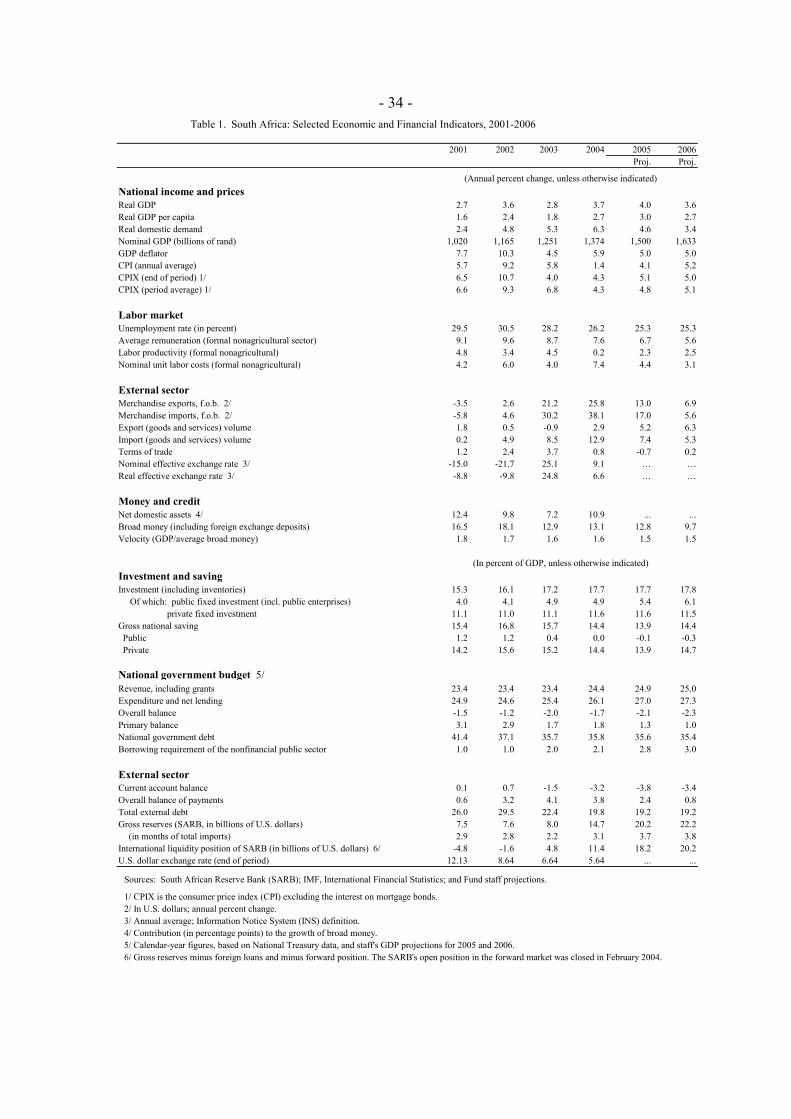
- 34 -
Table 1. South Africa: Selected Economic and Financial Indicators, 2001-2006
2001 2002 2003 2004 2005 2006
Proj. Proj.
National income and pricesReal GDP 2.7 3.6 2.8 3.7 4.0 3.6
Real GDP per capita 1.6 2.4 1.8 2.7 3.0 2.7
Real domestic demand 2.4 4.8 5.3 6.3 4.6 3.4
Nominal GDP (billions of rand) 1,020 1,165 1,251 1,374 1,500 1,633
GDP deflator 7.7 10.3 4.5 5.9 5.0 5.0
CPI (annual average) 5.7 9.2 5.8 1.4 4.1 5.2
CPIX (end of period) 1/ 6.5 10.7 4.0 4.3 5.1 5.0
CPIX (period average) 1/ 6.6 9.3 6.8 4.3 4.8 5.1
Labor marketUnemployment rate (in percent) 29.5 30.5 28.2 26.2 25.3 25.3
Average remuneration (formal nonagricultural sector) 9.1 9.6 8.7 7.6 6.7 5.6
Labor productivity (formal nonagricultural) 4.8 3.4 4.5 0.2 2.3 2.5
Nominal unit labor costs (formal nonagricultural) 4.2 6.0 4.0 7.4 4.4 3.1
External sectorMerchandise exports, f.o.b. 2/ -3.5 2.6 21.2 25.8 13.0 6.9
Merchandise imports, f.o.b. 2/ -5.8 4.6 30.2 38.1 17.0 5.6
Export (goods and services) volume 1.8 0.5 -0.9 2.9 5.2 6.3
Import (goods and services) volume 0.2 4.9 8.5 12.9 7.4 5.3
Terms of trade 1.2 2.4 3.7 0.8 -0.7 0.2
Nominal effective exchange rate 3/ -15.0 -21.7 25.1 9.1 … …
Real effective exchange rate 3/ -8.8 -9.8 24.8 6.6 … …
Money and creditNet domestic assets 4/ 12.4 9.8 7.2 10.9 ... ...
Broad money (including foreign exchange deposits) 16.5 18.1 12.9 13.1 12.8 9.7
Velocity (GDP/average broad money) 1.8 1.7 1.6 1.6 1.5 1.5
Investment and savingInvestment (including inventories) 15.3 16.1 17.2 17.7 17.7 17.8
Of which: public fixed investment (incl. public enterprises) 4.0 4.1 4.9 4.9 5.4 6.1
private fixed investment 11.1 11.0 11.1 11.6 11.6 11.5
Gross national saving 15.4 16.8 15.7 14.4 13.9 14.4
Public 1.2 1.2 0.4 0.0 -0.1 -0.3
Private 14.2 15.6 15.2 14.4 13.9 14.7
National government budget 5/Revenue, including grants 23.4 23.4 23.4 24.4 24.9 25.0
Expenditure and net lending 24.9 24.6 25.4 26.1 27.0 27.3
Overall balance -1.5 -1.2 -2.0 -1.7 -2.1 -2.3
Primary balance 3.1 2.9 1.7 1.8 1.3 1.0
National government debt 41.4 37.1 35.7 35.8 35.6 35.4
Borrowing requirement of the nonfinancial public sector 1.0 1.0 2.0 2.1 2.8 3.0
External sectorCurrent account balance 0.1 0.7 -1.5 -3.2 -3.8 -3.4
Overall balance of payments 0.6 3.2 4.1 3.8 2.4 0.8
Total external debt 26.0 29.5 22.4 19.8 19.2 19.2
Gross reserves (SARB, in billions of U.S. dollars) 7.5 7.6 8.0 14.7 20.2 22.2
(in months of total imports) 2.9 2.8 2.2 3.1 3.7 3.8
International liquidity position of SARB (in billions of U.S. dollars) 6/ -4.8 -1.6 4.8 11.4 18.2 20.2
U.S. dollar exchange rate (end of period) 12.13 8.64 6.64 5.64 ... ...
Sources: South African Reserve Bank (SARB); IMF, International Financial Statistics; and Fund staff projections.
1/ CPIX is the consumer price index (CPI) excluding the interest on mortgage bonds.
2/ In U.S. dollars; annual percent change.
3/ Annual average; Information Notice System (INS) definition.
4/ Contribution (in percentage points) to the growth of broad money.
5/ Calendar-year figures, based on National Treasury data, and staff's GDP projections for 2005 and 2006.
6/ Gross reserves minus foreign loans and minus forward position. The SARB's open position in the forward market was closed in February 2004.
(Annual percent change, unless otherwise indicated)
(In percent of GDP, unless otherwise indicated)

- 35 -
2001/02Rev. Staff Staff
est. 2/ Proj. 2/ 3/ Proj. 3/
Total revenue and grants 23.7 23.3 23.5 24.7 25.0 25.0Tax revenue 23.3 23.0 22.9 24.3 24.4 24.6
Income tax 14.0 13.8 13.5 13.9 13.6 14.0Of which : personal income tax (PIT) 8.6 7.9 7.7 8.0 7.7 7.8
corporate taxes (CIT+STC) 4.7 5.2 5.2 5.6 5.5 5.8Indirect taxes 8.3 8.2 8.6 9.4 9.5 9.4
Of which : value-added tax (VAT) 5.8 5.9 6.3 7.0 7.1 7.2Trade and other (less SACU payments) 0.9 1.0 0.8 1.0 1.2 1.2
Of which : trade taxes 0.8 0.8 0.7 1.0 1.0 1.0Of which : SACU payments 4/ 0.8 0.7 0.8 0.9 0.8 0.9
Nontax revenue 0.4 0.4 0.5 0.4 0.6 0.4
Total expenditure 25.0 24.4 25.7 26.2 27.2 27.3Interest 4.5 3.9 3.6 3.5 3.4 3.2Transfer to subnational governments 12.2 12.2 13.6 14.2 14.8 15.1Other 8.4 8.3 8.5 8.6 9.0 8.9
Budgetary balance -1.4 -1.1 -2.3 -1.5 -2.3 -2.3
Extraordinary payments 5/ -0.2 -0.7 -0.6 -0.5 -0.5 0.0
Augmented balance -1.6 -1.8 -2.9 -2.0 -2.7 -2.3
Financing 1.6 1.8 2.9 2.0 2.7 2.3Domestic borrowing (net) -1.7 0.1 3.0 2.8 1.5 2.1Foreign borrowing (net) 3.2 1.2 0.1 0.3 -0.2 0.1Privatization and other extraordinary receipts 0.4 0.7 0.1 0.0 0.1 0.0Change in cash and other items -0.3 -0.2 -0.3 -1.1 1.3 0.1
Total revenue and grants 248.3 278.5 299.4 347.3 382.5 417.3Tax revenue 244.1 274.0 292.8 341.1 373.3 410.5
Income tax 147.3 164.6 172.0 195.6 209.0 233.9Indirect taxes 86.9 97.6 110.2 131.4 146.1 157.4
Of which : value-added tax (VAT) 61.1 70.1 80.7 98.1 109.2 119.6Trade and other (less SACU payments) 9.9 11.8 10.6 14.1 18.2 19.2
Nontax revenue 4.2 4.4 6.6 6.2 9.2 6.8
Total expenditure 262.9 291.5 328.7 368.0 417.3 455.0
Budgetary balance -14.6 -13.0 -29.2 -20.7 -34.8 -37.7
Extraordinary payments 5/ -2.1 -8.0 -7.4 -7.1 -7.0 0.0
Augmented balance -16.7 -21.0 -36.6 -27.9 -41.8 -37.7
Memorandum items:Primary balance 3.1 2.8 1.4 2.0 1.1 1.0Debt 41.2 35.8 35.7 35.8 35.5 35.4
Domestic 33.4 29.5 30.6 30.9 30.9 30.5Foreign 7.8 6.2 5.1 4.9 4.6 4.9
Sources: South African authorities; and Fund staff estimates and projections.1/ For fiscal year beginning April 1. National government comprises the central government and subnational spending financed by
transfers from the national revenue fund.2/ Reflects latest tax revenue estimates for 2004/05 (South Africa Revenue Service).3/ Staff estimates based on the 2005 budget. 4/ Southern African Customs Union (SACU) payments are based on a revenue-sharing formula.5/ Provision of bonds to the South African Reserve Bank in settlement of the Gold and Foreign Exchange Contingency Account.
Table 2. South Africa: National Government Main Budget, 2001/02-2006/07 1/
2005/06 2006/07
(In percent of GDP)
(In billions of rand)
2003/042002/03 2004/05
(In percent of GDP)

- 36 -
2001/02 2002/03 2004/05Rev. Staff Staff
O Est. 2/ Proj. 2/ Proj.
General govt. (excl. local govts.)Total revenue and grants 24.9 24.8 25.1 26.4 26.5 26.6
National government 23.7 23.3 23.5 24.7 25.0 25.0Provinces (own revenue) 0.4 0.5 0.5 0.4 0.4 0.4Social security funds (own revenue) 0.7 0.9 1.1 1.1 1.1 1.1Extrabudgetary and other 0.1 0.1 0.1 0.1 0.1 0.1
Total expenditure 25.9 26.0 27.3 27.7 28.4 28.8Current 23.9 24.9 26.1 26.4 27.1 27.3
Wages and salaries 9.6 9.2 9.4 9.3 9.5 9.6Other goods and services 3.3 3.4 3.6 3.8 3.9 4.1Interest 4.5 3.9 3.6 3.5 3.4 3.2Transfers 6.5 8.4 9.5 9.8 10.2 10.4
Capital expenditure 2.0 1.1 1.2 1.2 1.3 1.5
Overall balance -1.0 -1.2 -2.2 -1.3 -1.9 -2.2
Public sector borrowing requirement (PSBR) 1.0 1.0 2.4 2.0 3.1 3.0National government 3/ 1.2 1.1 2.7 1.9 2.6 2.2Other government borrowing 4/ 0.1 0.3 0.3 0.3 0.0 0.1Nonfinancial public enterprises -0.2 -0.4 -0.7 -0.2 0.4 0.7
General govt. (excl. local govts.)Total revenue and grants 261.8 296.3 320.7 370.1 406.4 442.7
Total expenditure 272.4 310.1 348.6 388.5 434.8 479.7Current 250.9 296.6 333.3 371.3 415.2 454.2
Wages and salaries 100.9 109.8 119.8 130.8 146.0 159.8Other goods and services 34.3 40.4 45.8 53.5 60.3 67.6Interest 47.6 46.8 46.5 48.9 51.7 53.6Transfers 68.1 99.7 121.2 138.1 157.1 173.2
Capital expenditure 21.4 13.4 15.3 17.2 19.7 25.5
Overall balance -10.6 -13.8 -28.0 -18.4 -28.4 -37.0
Public sector borrowing requirement (PSBR) 10.9 12.1 30.5 27.5 46.8 50.4
Memorandum items:Social spending 5/ 12.4 12.7 13.9 14.3 14.7 15.0Defense spending 1.7 1.7 1.7 1.7 1.7 1.6
Sources: South African authorities; and Fund staff estimates and projections.1/ For fiscal year beginning April 1.2/ Staff estimates based on the 2005 budget and reflecting April 2005 revenue estimates by South Africa Revenue Service.3/ Includes net extraordinary payments.4/ "Other" includes provincial and local governments, social security funds, other extrabudgetary institutions, and privatization receipts.5/ Health, education, welfare and community development.
(In percent of GDP)
(In billions of rand)
2003/04 2005/06
Table 3. South Africa: Nonfinancial Public Sector Operations, 2001/02-2006/07 1/
2006/07
(In percent of GDP)

- 37 - Table 4. South Africa: Balance of Payments, 2001-2010
2001 2002 2003 2004 2005 2006 2007 2008 2009 2010
Balance on current account 0.1 0.8 -2.5 -6.9 -9.0 -8.5 -7.5 -6.8 -6.1 -5.5Balance on goods and services 4.6 4.1 2.9 -1.1 -3.0 -2.4 -1.3 -0.4 0.5 1.3
Exports of goods and services 35.5 36.3 45.9 56.6 63.2 67.2 71.6 76.2 81.2 86.4Exports of goods 30.9 31.7 38.4 48.3 54.6 58.4 62.5 66.8 71.5 76.5
Nongold 27.5 27.5 33.9 43.2 49.5 53.3 57.4 61.6 66.4 71.5Gold 3.4 4.1 4.5 5.1 5.1 5.0 5.1 5.2 5.2 5.1
Exports of services 4.6 4.7 7.5 8.3 8.6 8.8 9.1 9.3 9.6 9.9Imports of goods and services -30.9 -32.2 -42.9 -57.7 -66.2 -69.6 -72.9 -76.5 -80.7 -85.1
Imports of goods -25.7 -26.9 -35.0 -48.4 -56.6 -59.7 -62.7 -66.1 -69.9 -74.1Imports of services -5.2 -5.3 -7.9 -9.3 -9.6 -9.8 -10.1 -10.4 -10.7 -11.1
Balance on income -3.7 -2.8 -4.6 -4.3 -4.4 -4.5 -4.6 -4.7 -4.9 -5.0Income receipts 2.5 2.2 2.8 3.2 3.3 3.4 3.5 3.6 3.7 3.8Income payments -6.2 -5.0 -7.4 -7.5 -7.7 -7.9 -8.1 -8.3 -8.6 -8.8
Balance on transfers -0.7 -0.6 -0.8 -1.5 -1.5 -1.6 -1.6 -1.7 -1.7 -1.8
Capital flows (including errors and omissions) 0.6 2.8 9.3 15.0 14.5 10.5 9.0 7.8 7.6 7.0Balance on capital and financial account -0.5 2.4 5.7 10.0 14.5 10.5 9.0 7.8 7.6 7.0
Balance on capital account 0.0 0.0 0.0 0.1 0.1 0.1 0.1 0.1 0.1 0.1Balance on financial account -0.5 2.4 5.7 9.9 14.4 10.4 8.9 7.7 7.5 6.9
Direct investment 10.0 1.2 0.1 -1.0 2.3 0.9 0.0 0.0 0.1 0.1Liabilities 6.8 0.8 0.7 0.6 3.1 1.7 0.9 0.9 1.0 1.0Assets 3.2 0.4 -0.6 -1.6 -0.8 -0.9 -0.9 -0.9 -0.9 -0.9
Portfolio investment -7.9 -0.4 0.9 6.0 5.4 5.8 6.1 6.5 6.8 7.2Liabilities -2.8 0.5 1.0 7.0 6.5 6.8 7.2 7.6 8.1 8.5Assets -5.1 -0.9 -0.1 -0.9 -1.0 -1.1 -1.1 -1.2 -1.3 -1.3
Other investment -2.6 1.6 4.6 4.9 6.7 3.8 2.9 1.2 0.7 -0.3Liabilities -1.2 0.0 1.2 2.1 2.3 2.4 2.6 2.7 2.9 3.0Assets -1.4 1.6 3.4 2.8 4.4 1.4 0.3 -1.5 -2.2 -3.3
Errors and omissions 1.2 0.4 3.6 5.0 0.0 0.0 0.0 0.0 0.0 0.0
Overall balance of payments 0.8 3.5 6.9 8.1 5.5 2.0 1.5 1.0 1.5 1.5Gross reserves (SARB) 1/ 7.5 7.6 8.0 14.7 20.2 22.2 23.7 24.7 26.2 27.7Gross reserves (including the banking sector) 1/ 12.6 15.4 24.9 32.8 38.3 40.3 41.8 42.8 44.3 45.8International liquidity position of SARB 1/ 2/ -4.8 -1.6 4.8 11.4 18.2 20.2 21.7 22.7 23.7 25.2
Balance on current account 0.1 0.7 -1.5 -3.2 -3.8 -3.4 -2.9 -2.5 -2.1 -1.8Balance on goods and services 3.9 3.7 1.8 -0.5 -1.3 -1.0 -0.5 -0.1 0.2 0.4
Exports of goods and services 30.0 32.8 27.7 26.6 27.1 27.2 27.5 27.6 27.9 28.1Imports of goods and services -26.1 -29.1 -26.0 -27.1 -28.4 -28.2 -28.0 -27.7 -27.7 -27.7
Capital flows (including errors and omissions) 0.5 2.5 5.7 7.0 6.2 4.3 3.5 2.8 2.6 2.3Balance on capital and financial account -0.5 2.1 3.5 4.7 6.2 4.3 3.5 2.8 2.6 2.3Errors and omissions 1.0 0.4 2.2 2.3 0.0 0.0 0.0 0.0 0.0 0.0
Overall balance of payments 0.6 3.2 4.1 3.8 2.4 0.8 0.6 0.4 0.5 0.5Gross reserves (SARB) 1/ 6.3 6.9 4.8 6.9 8.7 9.0 9.1 8.9 9.0 9.0Gross reserves (including the banking sector) 1/ 10.6 13.9 15.0 15.4 16.4 16.3 16.1 15.5 15.2 14.9International Liqudity Position of SARB 1/ 2/ -4.0 -1.5 2.9 5.4 7.8 8.2 8.3 8.2 8.1 8.2
Memorandum items:Total external debt 26.0 29.5 22.4 19.8 19.2 19.2 19.0 18.4 17.5 16.4Foreign currency debt 20.3 22.6 16.5 13.1 12.6 12.6 12.5 12.1 11.6 10.8of which: short-term (at remaining maturity) 9.5 10.1 6.8 4.9 4.6 4.6 4.4 4.2 3.9 3.6Total external debt service (in billions of US dollars) 5.3 4.7 5.9 7.1 5.1 7.6 8.9 9.0 10.7 12.5
Sources: South African Reserve Bank (SARB); and Fund staff estimates and projections.
1/ End of period. 2/ Gross reserves minus foreign loans and minus forward position. The SARB's open position in the forward market was closed in February 2004.
Proj.
(In billions of US dollars)
(In percent of GDP)

- 38 -
Table 5. South Africa: Monetary Survey, 2001-2004
2001 2002 2003 2004
Dec. Dec. Dec. Dec
Net foreign assets 36.0 86.3 126.7 144.4
Gross reserves 183.7 167.0 214.5 232.5
SARB 90.6 66.0 52.9 82.8
Other monetary institutions 93.1 101.0 161.6 149.7
Liabilities 147.7 80.7 87.8 88.2
SARB 48.3 21.5 20.0 19.8
Other monetary institutions 99.4 59.2 67.8 68.4
Net domestic assets 570.3 629.5 681.4 769.8
Credit to government, net 32.7 59.2 46.7 45.4
Claims on government 67.5 84.9 104.2 116.1
Government deposits 34.8 25.7 57.4 70.7
Credit to private sector 1/ 673.7 703.4 838.3 951.1
Other items, net -136.1 -133.1 -203.7 -226.7
Broad money (M3) 606.3 715.8 808.0 914.1Of which: M1 315.6 358.3 387.8 421.5
Net foreign assets 144.6 139.9 46.8 14.0
Net domestic assets 12.7 10.4 8.2 13.0
Credit to private sector 14.2 4.4 19.2 13.5
Broad money (M3) 16.5 18.1 12.9 13.1
(Contribution to growth of M3, unless otherwise specified)
Net foreign assets 4.1 8.3 5.6 2.2
Net domestic assets 12.4 9.8 7.2 10.9
Credit to government, net -2.0 4.4 -1.7 -0.2
Credit to private sector 1/ 16.1 4.9 18.8 14.0
Other items, net -1.7 0.5 -9.9 -2.8
Memorandum item:
Income velocity of M3 (GDP/average broad money) 1.82 1.73 1.63 1.58
Sources: South African Reserve Bank (SARB).
1/ Part of the increase in private sector credit in 2003 is due to a change in accounting rules for derivatives.
(In billions of rand)
(Annual percentage change)
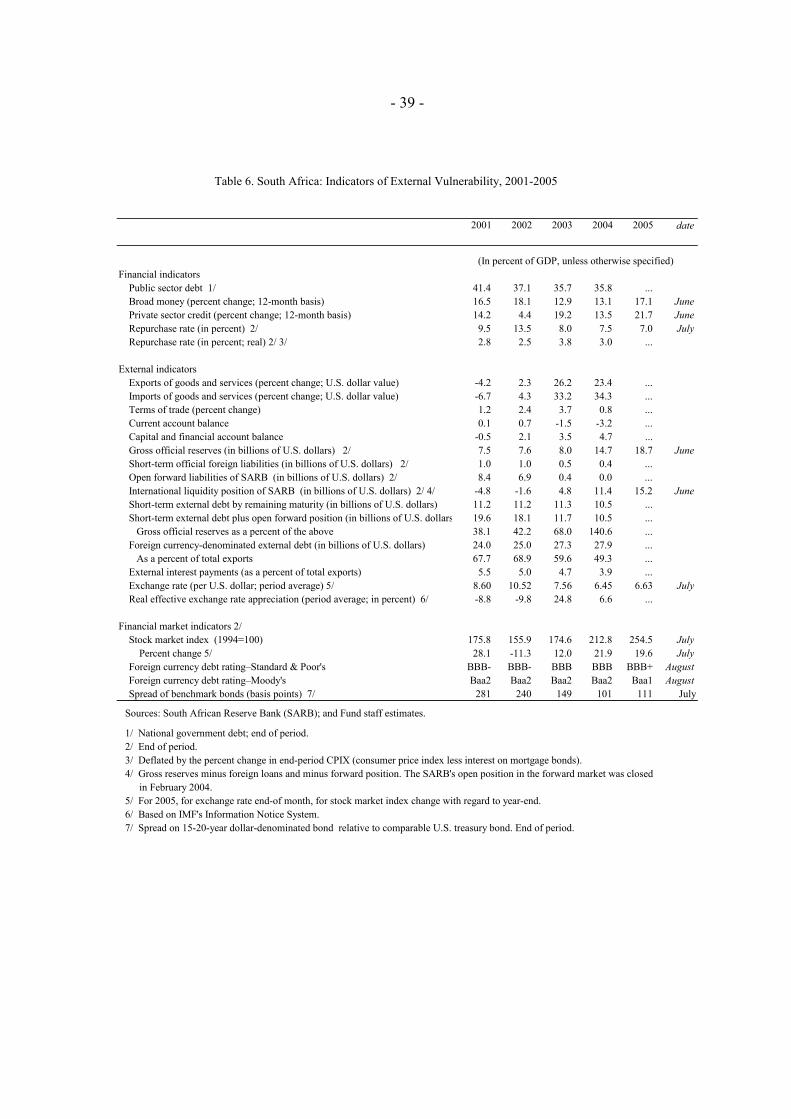
- 39 -
Table 6. South Africa: Indicators of External Vulnerability, 2001-2005
2001 2002 2003 2004 2005 date
Financial indicators
Public sector debt 1/ 41.4 37.1 35.7 35.8 ...
Broad money (percent change; 12-month basis) 16.5 18.1 12.9 13.1 17.1 June
Private sector credit (percent change; 12-month basis) 14.2 4.4 19.2 13.5 21.7 June
Repurchase rate (in percent) 2/ 9.5 13.5 8.0 7.5 7.0 July
Repurchase rate (in percent; real) 2/ 3/ 2.8 2.5 3.8 3.0 ...
External indicators
Exports of goods and services (percent change; U.S. dollar value) -4.2 2.3 26.2 23.4 ...
Imports of goods and services (percent change; U.S. dollar value) -6.7 4.3 33.2 34.3 ...
Terms of trade (percent change) 1.2 2.4 3.7 0.8 ...
Current account balance 0.1 0.7 -1.5 -3.2 ...
Capital and financial account balance -0.5 2.1 3.5 4.7 ...
Gross official reserves (in billions of U.S. dollars) 2/ 7.5 7.6 8.0 14.7 18.7 June
Short-term official foreign liabilities (in billions of U.S. dollars) 2/ 1.0 1.0 0.5 0.4 ...
Open forward liabilities of SARB (in billions of U.S. dollars) 2/ 8.4 6.9 0.4 0.0 ...
International liquidity position of SARB (in billions of U.S. dollars) 2/ 4/ -4.8 -1.6 4.8 11.4 15.2 June
Short-term external debt by remaining maturity (in billions of U.S. dollars) 11.2 11.2 11.3 10.5 ...
Short-term external debt plus open forward position (in billions of U.S. dollars 19.6 18.1 11.7 10.5 ...
Gross official reserves as a percent of the above 38.1 42.2 68.0 140.6 ...
Foreign currency-denominated external debt (in billions of U.S. dollars) 24.0 25.0 27.3 27.9 ...
As a percent of total exports 67.7 68.9 59.6 49.3 ...
External interest payments (as a percent of total exports) 5.5 5.0 4.7 3.9 ...
Exchange rate (per U.S. dollar; period average) 5/ 8.60 10.52 7.56 6.45 6.63 July
Real effective exchange rate appreciation (period average; in percent) 6/ -8.8 -9.8 24.8 6.6 ...
Financial market indicators 2/
Stock market index (1994=100) 175.8 155.9 174.6 212.8 254.5 July
Percent change 5/ 28.1 -11.3 12.0 21.9 19.6 July
Foreign currency debt rating–Standard & Poor's BBB- BBB- BBB BBB BBB+ August
Foreign currency debt rating–Moody's Baa2 Baa2 Baa2 Baa2 Baa1 August
Spread of benchmark bonds (basis points) 7/ 281 240 149 101 111 July
Sources: South African Reserve Bank (SARB); and Fund staff estimates.
1/ National government debt; end of period.
2/ End of period.
3/ Deflated by the percent change in end-period CPIX (consumer price index less interest on mortgage bonds).
4/ Gross reserves minus foreign loans and minus forward position. The SARB's open position in the forward market was closed
in February 2004.
5/ For 2005, for exchange rate end-of month, for stock market index change with regard to year-end.
6/ Based on IMF's Information Notice System.
7/ Spread on 15-20-year dollar-denominated bond relative to comparable U.S. treasury bond. End of period.
(In percent of GDP, unless otherwise specified)

- 40-
2003 2004 2005Dec. Dec. Dec. Dec. March
Capital adequacy:
Regulatory capital to risk-weighted assets 11.4 12.6 12.2 13.3 12.9
Regulatory tier 1 capital to risk-weighted assets 7.8 7.9 7.9 9.3 9.2
Asset quality:
Nonperforming loans to total gross loans 3.1 2.8 2.4 1.8 1.8
Nonperforming loans net of provisions to capital 16.3 11.9 8.5 6.2 6.1
Large exposures (utilized) to capital 218.8 163.8 157.1 113.0 126.5
Share of mortgage advances in domestic private credit 38.5 40.7 39.6 43.3 44.0
Earnings and profitability:
Return on assets (average) 0.8 0.4 0.8 1.2 1.3
Return on equity (average) 8.9 5.2 11.6 16.2 16.9
Interest margin to gross income 37.7 52.3 38.3 42.3 39.5
Non-interest expenses to gross income 50.7 60.4 74.8 68.6 66.5
Interest spread (annualized yield minus cost) 3.1 3.8 1.9 2.8 2.3
Liquidity:
Liquid assets to total assets 4.2 4.7 4.7 4.7 4.7
Share of short-term deposits in total deposits 47.9 46.0 43.8 41.8 41.6
Exposure to FX risk:
Maximum effective net open FX position to capital 2.5 2.6 0.9 0.9 1.0
Share of foreign currency loans in total lending 13.4 13.1 11.4 10.5 10.4
Share of foreign currency deposits in total deposits 6.2 4.4 2.7 2.7 2.5
Share of foreign liabilities in total liabilities 9.1 5.3 2.8 3.1 3.2
Source: South African Reserve Bank.
Table 7: South Africa: Financial Soundness Indicators, 2001-2005
(In percent, unless otherwise indicated)
2001 2002
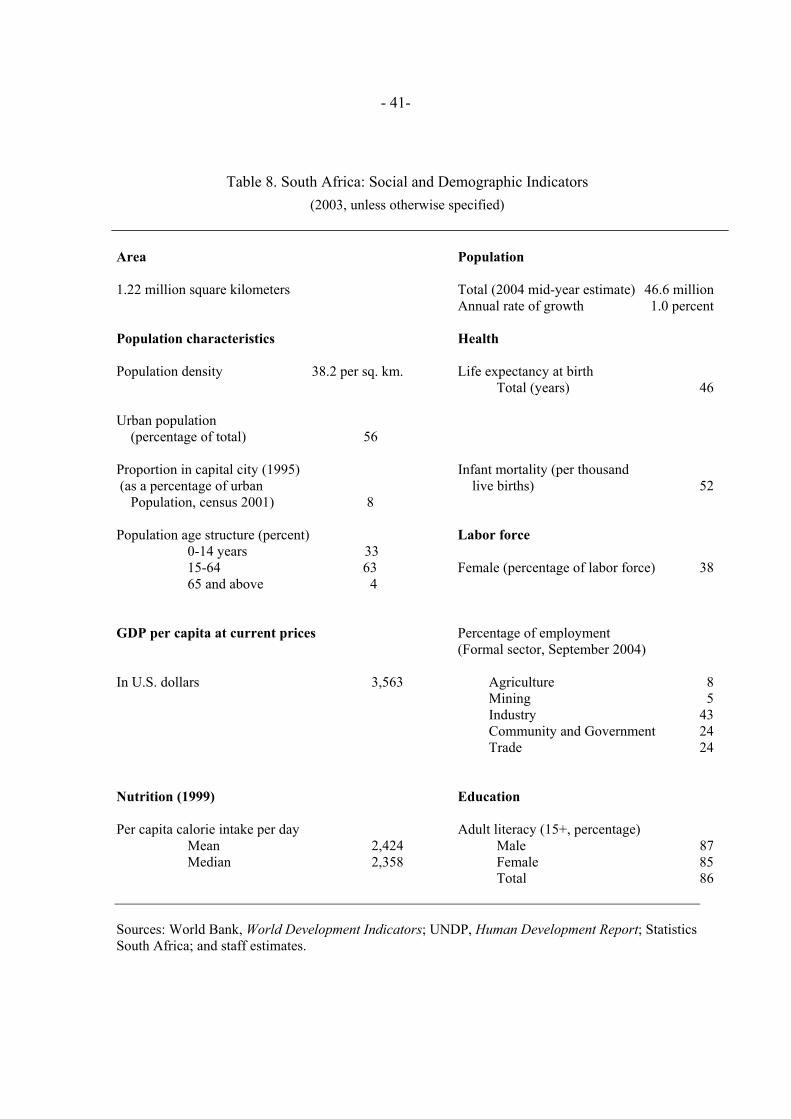
- 41-
Table 8. South Africa: Social and Demographic Indicators
(2003, unless otherwise specified)
Area Population
1.22 million square kilometers Total (2004 mid-year estimate) 46.6 million Annual rate of growth 1.0 percent
Population characteristics Health
Population density 38.2 per sq. km. Life expectancy at birth Total (years) 46 Urban population (percentage of total) 56
Proportion in capital city (1995) Infant mortality (per thousand (as a percentage of urban live births) 52 Population, census 2001) 8
Population age structure (percent) Labor force 0-14 years 33 15-64 63 Female (percentage of labor force) 38 65 and above 4
GDP per capita at current prices Percentage of employment (Formal sector, September 2004)
In U.S. dollars 3,563 Agriculture 8 Mining 5 Industry 43 Community and Government 24 Trade 24
Nutrition (1999) Education
Per capita calorie intake per day Adult literacy (15+, percentage) Mean 2,424 Male 87 Median 2,358 Female 85 Total 86
Sources: World Bank, World Development Indicators; UNDP, Human Development Report; Statistics South Africa; and staff estimates.

- 42-
1990 1994 1997 2000 2003
1. Eradicate extreme poverty and hunger Population below $1 a day (%) 2/ .. .. .. 10.7 ..Poverty gap at $1 a day (%) .. 0.6 .. 1.7 ..Percentage share of income or consumption held by poorest 20% .. ... .. 3.5 ..Population below minimum level of dietary energy consumption (%) .. .. .. .. ..
2. Achieve universal primary education Net primary enrollment ratio (% of relevant age group) 87.9 ... 91.3 89.6 89.0Youth literacy rate (% ages 15-24) 88.5 89.7 90.5 91.3 91.8
3. Promote gender equality Ratio of girls to boys in primary and secondary education (%) 103.2 ... 102.2 100 100.4Ratio of young literate females to males (% ages 15-24) 99.7 99.8 99.9 99.9 100Share of women employed in the nonagricultural sector (%) ... 39.5 .. .. ...Proportion of seats held by women in national parliament (%) 3 ... 25.0 30.0 30.0
4. Reduce child mortality Under 5 mortality rate (per 1,000) 60.0 59.0 ... 63.0 66.0Infant mortality rate (per 1,000 live births) 45.0 45.0 ... 50.0 53.0Immunization, measles (% of children under 12 months) 79.0 76.0 82.0 77.0 83.0
5. Improve maternal health Maternal mortality ratio (modeled estimate, per 100,000 live births) .. ... ... 230.0Births attended by skilled health staff (% of total) .. 82.0 84.4 .. ...
6. Combat HIV/AIDS, malaria and other diseases Prevalence of HIV (% ages 15-49) 3/ .. .. .. ... 15.6Contraceptive prevalence rate (% of women ages 15-49) 57.0 .. 62.0 ..Number of children orphaned by HIV/AIDS (in thousands) .. .. 660.0 1100.0Incidence of tuberculosis (per 100,000 people) 186.2 306.4 391.7 465.0 536.4Tuberculosis cases detected under DOTS (%) .. ... 6.2 75.0 118.4
7. Ensure environmental sustainability Forest area (% of total land area) 7.4 .. ... 7.3Nationally protected areas (% of total land area) ... ... ... ... 5.5GDP per unit of energy use (2000 PPP $ per kg oil equivalent) 3.9 3.5 3.6 3.8 3.9CO2 emissions (metric tons per capita) 8.3 8.2 8.1 7.4 ...Access to an improved water source (% of population) 83.0 .. ... .. 87.0Access to improved sanitation (% of population) 63.0 .. ... .. 67.0Access to secure tenure (% of population) .. .. .. .. ..
8. Develop a Global Partnership for Development Youth unemployment rate (% of total labor force ages 15-24) .. .. 45.0 44.2 ..Fixed line and mobile telephones (per 1,000 people) 93.6 106.5 157.2 304.5 410.5Personal computers (per 1,000 people) 7.0 22.7 43.7 66.4 72.6General indicators Adult literacy rate (% of people ages 15 and over) 81.2 82.9 84.1 85.2 86.0Total fertility rate (births per woman) 3.3 ... 3.0 ... 2.8Life expectancy at birth (years) 61.9 ... 54.7 48.5 45.7
Source: World Bank.
Note: In some cases the data are for earlier or later years than those stated. 1/ See for definitions: World Bank at http://ddp-ext.worldbank.org/ext/MDG/home.do.2/ Expenditure base. Information provided for 1994 (6.3 percent) is not strictly comparable as it refers to income base. 3/ According to recent Department of Health estimates, the HIV-prevalence rate among pregnant women was 29.4 percent in 2004.
2015 target = various (see notes)
Table 9. South Africa: Millennium Development Goals, 1990 - 2003 1/
2015 target = halve 1990 $1 a day poverty and malnutrition rates
2015 target=net enrollment to 100
2005 target= education ratio to 100
2015 target=reduce 1990 under 5 mortality by two-thirds
2015 target = reduce 1990 maternal mortality by three-fourths
2015 target = halt, and begin to reverse, AIDS, etc
2015 target = various (see notes)
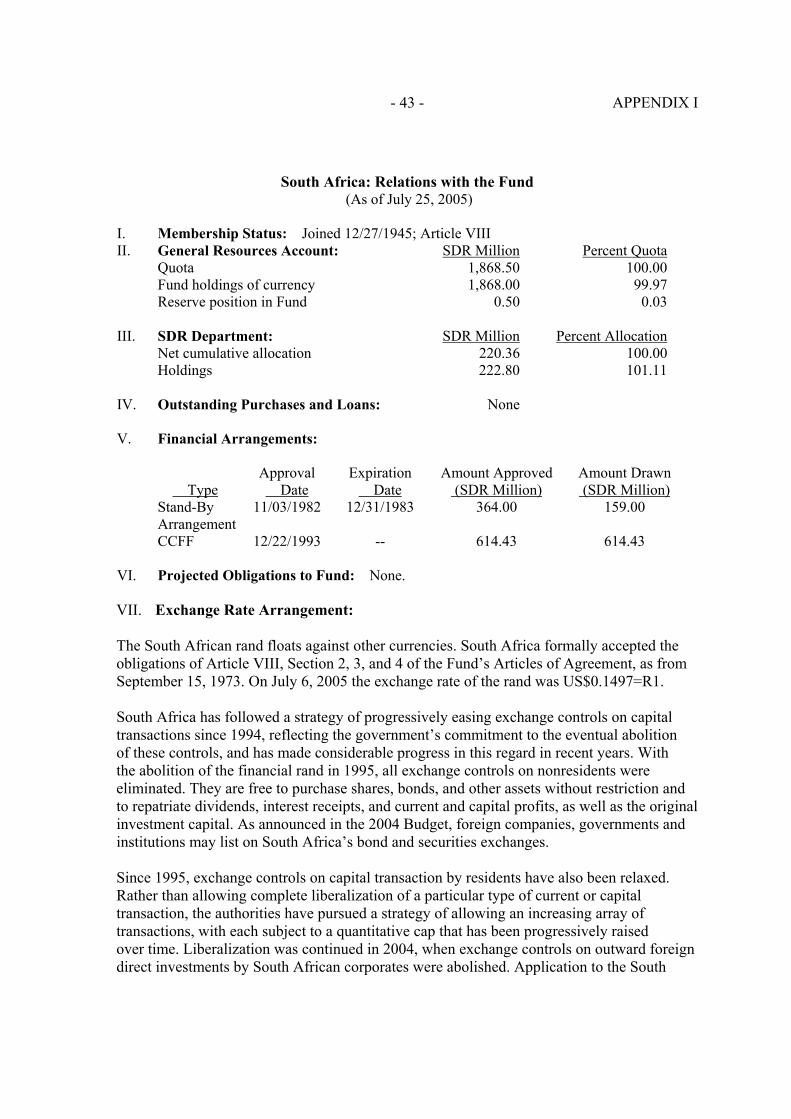
APPENDIX I - 43 -
South Africa: Relations with the Fund (As of July 25, 2005)
I. Membership Status: Joined 12/27/1945; Article VIII II. General Resources Account: SDR Million Percent Quota
Quota 1,868.50 100.00Fund holdings of currency 1,868.00 99.97Reserve position in Fund 0.50 0.03
III. SDR Department: SDR Million Percent AllocationNet cumulative allocation 220.36 100.00Holdings 222.80 101.11
IV. Outstanding Purchases and Loans: None
V. Financial Arrangements:
Approval Expiration Amount Approved Amount Drawn Type Date Date (SDR Million) (SDR Million)Stand-By Arrangement
11/03/1982 12/31/1983 364.00 159.00
CCFF 12/22/1993 -- 614.43 614.43
VI. Projected Obligations to Fund: None.
VII. Exchange Rate Arrangement:
The South African rand floats against other currencies. South Africa formally accepted the obligations of Article VIII, Section 2, 3, and 4 of the Fund’s Articles of Agreement, as from September 15, 1973. On July 6, 2005 the exchange rate of the rand was US$0.1497=R1.
South Africa has followed a strategy of progressively easing exchange controls on capital transactions since 1994, reflecting the government’s commitment to the eventual abolition of these controls, and has made considerable progress in this regard in recent years. With the abolition of the financial rand in 1995, all exchange controls on nonresidents were eliminated. They are free to purchase shares, bonds, and other assets without restriction and to repatriate dividends, interest receipts, and current and capital profits, as well as the original investment capital. As announced in the 2004 Budget, foreign companies, governments and institutions may list on South Africa’s bond and securities exchanges.
Since 1995, exchange controls on capital transaction by residents have also been relaxed. Rather than allowing complete liberalization of a particular type of current or capital transaction, the authorities have pursued a strategy of allowing an increasing array of transactions, with each subject to a quantitative cap that has been progressively raised over time. Liberalization was continued in 2004, when exchange controls on outward foreign direct investments by South African corporates were abolished. Application to the South

APPENDIX I - 44 -
African Reserve Bank’s Exchange Control Department is still required for monitoring purposes and approval in terms of existing foreign direct investment criteria, including demonstrated benefit to South Africa. The South African Reserve Bank reserves the right to stagger capital outflows relating to very large foreign investments so as to manage any potential impact on the foreign exchange market.
Most of the remaining restrictions are on portfolio outflows. In particular, institutional investors are permitted to invest in foreign securities, subject to an overall limit of 15 percent of their total retail assets for retirement funds, long term insurers and investment managers registered as institutional investors and 20 percent for collective investment scheme management companies. Corporates may, upon application, be permitted to establish primary listings offshore under certain conditions. Private individuals are allowed to invest up to R750,000 offshore. In addition to the above, there are restrictions on, inter alia, the travel allowances (R160,000 for private individuals), the transfer of funds abroad by emigrants (“blocked funds), and the investment of currency proceeds from exports (which must be repatriated within 180 days from accrual). The transfer of blocked funds in excess of R750,000 for individuals and R1.5 million for families is allowed, provided a 10 percent exit levy is paid. Larger amounts may be staggered to manage any impact on the foreign exchange market. Dividends and interest payments on the blocked funds are freely transferable abroad and travel allowances can be augmented if bona fide need is documented.
VIII. Article IV Consultations
The 2004 Article IV consultation was concluded by the Executive Board on September 3, 2004 (SM/04/284). South Africa is on the standard 12-month Article IV consultation cycle.
IX. Technical Assistance
A FAD mission took place in 2003 to discuss with the National Treasury their draft royalty bill (published in March 2003).
A monetary and financial statistics mission in 2003 (i) reviewed the SARB collection and compilation procedures of monetary statistics, (ii) helped develop a work program to implement the methodology recommended in the Monetary and Financial Statistics Manual (MFSM), (iii) introduced standardized report forms for reporting central bank data to STA, and (iv) initiated work on an integrated database for monetary statistics that will meet the Fund’s publication requirements. A follow-up mission took place during May–June 2004.
A STA mission, supported by a labor statistics consultant funded by the World Bank, undertook a review of South Africa Labor Force Statistics in March 2005. The mission recommended steps to produce statistics that are more reliable, better quality, and more closely aligned with International Labor Organization (ILO) standards.
- 45 - APPENDIX II
South Africa: Relations with the World Bank Group
Between 1951 and 1966, the Bank made 11 loans to South Africa, totaling US$241.8 million. Lending operations ceased in 1966 with all loans from that earlier period fully repaid. Between 1990 and 1994, the Bank resumed activities in South Africa through economic analysis and capacity building resulting in papers and reports on the macroeconomy, education, health, agriculture, fiscal decentralization, labor markets, trade policy, and microfinance. During 1994-2004, the emphasis has shifted towards policy advice and dialogue on municipal and welfare services, macroeconomic strategy, poverty, job-creation, medium-term expenditure framework, HIV/AIDS, and business environment. Lending has been limited to the Industrial Competitiveness and Job Creation Project (approved for US$46 million and subsequently reduced to US$24.5 million at the government’s request), which closed in September 2004; and a Technical Assistance Loan for the Municipal Financial Management Technical Assistance Project (MFMTAP) approved in 2002 for an amount of US$15 million. There is a large GEF-funded program for nature conservation and development: the C.A.P.E. Biodiversity Conservation and Sustainable Development Project (US$9 million); the Cape Peninsula Biodiversity Conservation Project (US$12.3 million); the Maloti-Drakensberg Transfrontier Conservation and Development Project (US$7.9 million), the Greater Addo Elephant National Park Project (US$5.5 million); and four medium-size projects for a total of US$2.4 million. Most recently, since 2004, the emphasis in the evolving policy dialogue and knowledge work has been on growth and jobs, investment climate and SME development, municipal monitoring and financial management, land reform, and service delivery and impact evaluation.
The International Finance Corporation’ s (IFC) committed portfolio has grown steadily from US$114 million in 2000 to US$221 million in 2004, IFC’s second largest country portfolio in Africa after Nigeria. The IFC strategy for South Africa has three key objectives: i) supporting black economic empowerment, through leading acquisition transactions and support for SME/entrepreneurship; ii) developing the financial markets and institutions; and iii) helping South African companies expand into Africa and globally. IFC has built up a strong field presence. Recent transactions include the Hernic Ferrochrome mining project with Mitsubishi ($30 million loan and equity); the bond issue guarantee with the City of Johannesburg ($30 million); and the DBSA credit default swap to support securitization of their municipal bond portfolio ($18 million) as well as a loan to FirstRand Empowerment Trust (US$30 million) to finance the acquisition of FirstRand Limited’s common shares.
South Africa has been a member of the Multilateral Investment Guarantee Agency (MIGA) since 1994. South African investors are the most active users of MIGA guarantees among Category Two countries, and currently have US$212.5 million of gross MIGA coverage (and US$161.1 million of net coverage) outstanding across 10 contracts of guarantee. Since inception, MIGA has issued 12 contracts, worth US$298.3 million of gross coverage, to South African investors for investments in Lesotho, Mozambique, Nigeria, Swaziland and Zambia. In December 2003, MIGA issued a US$11.4 million guarantee to IP Direct of South Africa for its investment in IP Satellite Services of Nigeria.

- 46 - APPENDIX III
South Africa: Statistical Issues
South Africa publishes a wide array of economic and financial data that are adequate for surveillance purposes. It subscribes to the Special Data Dissemination Standard (SDDS) and its metadata are posted on the IMF’s Dissemination Standards Bulletin Board (DSBB).
Real sector statistics
In June 1999, Statistics South Africa released a major revision of the national income accounts based on the 1993 System of National Accounts (1993 SNA). The revision raised nominal GDP by some 13 percent for the 1993-98 period and raised the average annual rate of growth of real GDP from 2.2 percent to 2.7 percent for the 1994-98 period. In November 2004, the base year of the national accounts aggregates was changed from 1995 to 2000. At the same time, benchmarking was undertaken to accurately reflect the structure of the economy, by incorporating new areas of the economy previously not covered, introducing new and improved source data, and incorporating methodological changes in the compilation process. These changes resulted in an upward revision of the average annual change in GDP at constant prices for the period 1998 to 2003 from 2.4 percent to 2.7 percent.
Reporting of real sector data for International Financial Statistics (IFS) is timely. Data reported for Direction of Trade Statistics (DOTS), however, show substantial inconsistencies with external trade data reported for IFS, particularly exports.
Labor market statistics based on household survey data are published with lags of about six months, and unemployment data are available only at a six month frequency. In addition, a Quarterly Employment Survey has been introduced that covers the formal non-agricultural sector. It is published with a lag of one quarter with information on employment and remuneration. A STA mission in March 2005 undertook a review of South Africa’s Labor Force Statistics and made recommendations designed to improve quality and reliability and align them with standards set by the International Labor Organization.
Beginning with the April 2003 index, Statistics South Africa issued revisions to the Consumer Price Index for the period January 2002 to March 2003, reflecting the incorporation of more reliable data on residential rents.
Government finance statistics
South Africa currently reports data for the consolidated central government and for regional and local governments for publication in the Government Finance Statistics Yearbook. It also reports monthly data covering the operations of the budgetary central government for publication in IFS. GFS data, although still on a cash basis, are compiled and disseminated domestically and internationally according to the GFSM 2001 framework.
- 47 - APPENDIX III
Monetary and financial statistics
South Africa regularly reports monetary statistics for publication in IFS, although there is room for improving the timeliness of the data on nonbank financial institutions. The SARB is working on the implementation of the recommendations of the 2003 and 2004 monetary and financial statistics missions towards full implementation of the methodology recommended in the Monetary and Financial Statistics Manual.
External sector statistics
South Africa is a regular reporter of balance of payments data, which are compiled according to the guidelines prescribed by the fifth edition of the Balance of Payments Manual (BPM5).However, there are deficiencies in the coverage of trade with Southern African Customs Union (SACU) countries; the capturing and processing of underlying data in this area are currently receiving attention. Currently, the services transactions distinguish between transportation and travel services while the other services transactions are, for the time being, aggregated. Data collected on reinvested earnings on direct investment are currently not incorporated into the balance of payments statement.
Also, the presentation of international reserve accumulation in the balance of payments includes both the central bank’s reserves as well as the commercial banks’ foreign exchange reserves resulting from exchange control regulations. This causes inconsistencies betweenthe balance of payments and the international investment position, in which commercial banks’ foreign exchange holdings are excluded from reserves (following recommendation of the 2001 ROSC mission). Net errors and omissions in the balance of payments are large and vary significantly from quarter to quarter. Work is ongoing to reduce the large errors and omissions, which reached 2.3 percent of GDP during 2004.
South Africa disseminates its international reserve position in line with the requirements of the IMF's template on international reserves and foreign currency liquidity. From 6 March 2005 South Africa values its gold reserves at market price taken at 2:30 p.m. on each valuation date, whereas previously they were valued at less than the full market price.

- 48 - APPENDIX III
South Africa: Table of Common Indicators Required for Surveillance as of July 17, 2005
Memo Items: Date of latest
observation
Datereceived
Frequency of
Data7
Frequency of
Reporting7
Frequency of
publication7 Data Quality –
Methodological soundness8
Data Quality – Accuracy and
reliability9
Exchange Rates 6/30/05 6/30/05 D D D
International Reserve Assets and Reserve Liabilities of the Monetary
Authorities1
6/05 7/7/05 M M M
Reserve/Base Money 5/05 6/30/05 M M M
Broad Money 5/05 6/30/05 M M M
Central Bank Balance Sheet 5/05 6/30//05 M M M
Consolidated Balance Sheet of the Banking System
4/05 6/30/05 M M M
O, O, LO, O LO, O, O, O
Interest Rates2 6/30/05 6/30/05 D D D
Consumer Price Index 5/05 6/25/05 M M M O, LO, O, O LO, LO, O, O
Revenue, Expenditure, Balance and
Composition of Financing3 –
General Government4
2H 2004 2/23/05 A S S
Revenue, Expenditure, Balance and
Composition of Financing3– Central
Government
3/ 05 6/30/05 M Q Q
O, O, O, O O, O, O, O
Stocks of Central Government and Central Government-Guaranteed
Debt5
Q1 2005 6/30/05 Q Q Q
External Current Account Balance Q1 2005 6/23/05 Q Q Q
Exports and Imports of Goods and Services 6
4/05 6/30/05 M M M LO, LO, LO, LO LO, LO, LO, LO
GDP/GNP Q4 2004 6/23/05 Q Q Q O, LO, LO, LO LO, O, O, O
Gross External Debt Q1 2005 6/30/05 Q Q Q
1Includes reserve assets pledged or otherwise encumbered as well as net derivative positions. 2 Both market-based and officially-determined, including discount rates, money market rates, rates on treasury bills, notes and bonds. 3 Foreign, domestic bank, and domestic nonbank financing. 4 The general government consists of the central government (budgetary funds, extra budgetary funds, and social security funds) and state and
local governments. 5 Including currency and maturity composition. 6 Monthly data for goods. Goods and services are published quarterly on the same schedule as the rest of the balance of payments.7 Daily (D), Weekly (W), Monthly (M), Quarterly (Q), Annually (A), Irregular (I); Not Available (NA). 8 Reflects the assessment provided in the data ROSC (published in October 2001, and based on the findings of the mission that took place during
May 7–18, 2001) for the dataset corresponding to the variable in each row. The assessment indicates whether international standards concerning concepts and definitions, scope, classification/sectorization, and basis for recording are fully observed (O), largely observed (LO), largely not observed (LNO), or not observed (NO).
9 Same as footnote 9, except referring to international standards concerning source data, statistical techniques, assessment and validation, and revision studies.
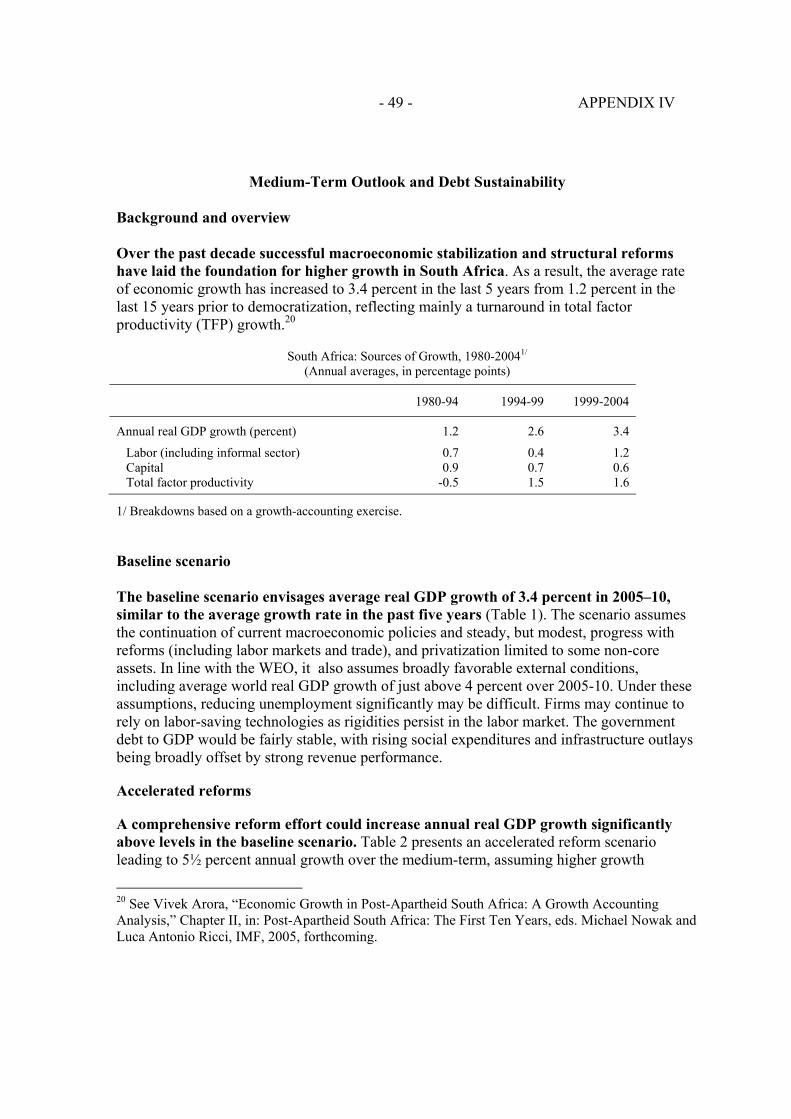
- 49 - APPENDIX IV
Medium-Term Outlook and Debt Sustainability
Background and overview
Over the past decade successful macroeconomic stabilization and structural reforms have laid the foundation for higher growth in South Africa. As a result, the average rate of economic growth has increased to 3.4 percent in the last 5 years from 1.2 percent in the last 15 years prior to democratization, reflecting mainly a turnaround in total factor productivity (TFP) growth.20
South Africa: Sources of Growth, 1980-20041/
(Annual averages, in percentage points)
1980-94 1994-99 1999-2004
Annual real GDP growth (percent) 1.2 2.6 3.4
Labor (including informal sector) 0.7 0.4 1.2 Capital 0.9 0.7 0.6 Total factor productivity -0.5 1.5 1.6
1/ Breakdowns based on a growth-accounting exercise.
Baseline scenario
The baseline scenario envisages average real GDP growth of 3.4 percent in 2005–10, similar to the average growth rate in the past five years (Table 1). The scenario assumes the continuation of current macroeconomic policies and steady, but modest, progress with reforms (including labor markets and trade), and privatization limited to some non-core assets. In line with the WEO, it also assumes broadly favorable external conditions, including average world real GDP growth of just above 4 percent over 2005-10. Under these assumptions, reducing unemployment significantly may be difficult. Firms may continue to rely on labor-saving technologies as rigidities persist in the labor market. The government debt to GDP would be fairly stable, with rising social expenditures and infrastructure outlays being broadly offset by strong revenue performance.
Accelerated reforms
A comprehensive reform effort could increase annual real GDP growth significantly above levels in the baseline scenario. Table 2 presents an accelerated reform scenario leading to 5½ percent annual growth over the medium-term, assuming higher growth
20 See Vivek Arora, “Economic Growth in Post-Apartheid South Africa: A Growth Accounting Analysis,” Chapter II, in: Post-Apartheid South Africa: The First Ten Years, eds. Michael Nowak and Luca Antonio Ricci, IMF, 2005, forthcoming.

- 50 - APPENDIX IV
contributions from all three growth components, employment, capital, and total factor productivity. It is difficult to estimate the potential effects of reforms, but, in generating this scenario the following factors were taken into account:
A rapid easing of labor market legislation along the lines suggested in this report, that helps increase employment growth by 1 percentage point to just over 3 percent per year, could raise real GDP growth by some 0.5 percent per year.
Labor market reform, along with further trade liberalization, simplification of the tariff regime, and public enterprise reform, including privatization, will help improve efficiency and stimulate innovation. Together, these reforms could be expected to increase average total factor productivity growth by around 1 percentage point.21
Structural reforms that improve the investment climate will stimulate capital accumulation and could add another 0.5 percent of GDP growth, if the average growth rate of the capital stock increased by some 1 percentage point per year.
21 Cross-country evidence shows that bold structural reforms can have a significant positive impact on growth. For instance, in a cross-country study Wacziarg and Horn Welch (2003) “Trade Liberalization and Growth: New Evidence,” NBER Working Paper 10152, show that significant trade liberalization has raised growth by around 1.5 percentage points.
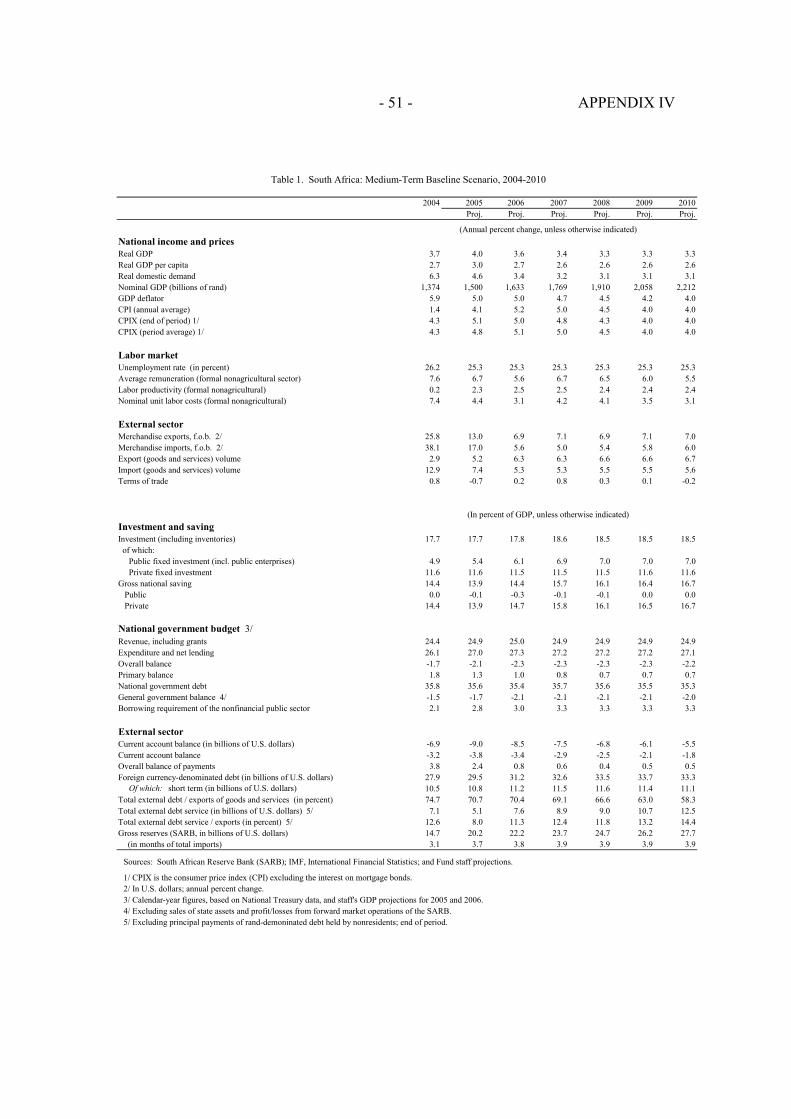
- 51 - APPENDIX IV
2004 2005 2006 2007 2008 2009 2010
Proj. Proj. Proj. Proj. Proj. Proj.
National income and pricesReal GDP 3.7 4.0 3.6 3.4 3.3 3.3 3.3
Real GDP per capita 2.7 3.0 2.7 2.6 2.6 2.6 2.6
Real domestic demand 6.3 4.6 3.4 3.2 3.1 3.1 3.1
Nominal GDP (billions of rand) 1,374 1,500 1,633 1,769 1,910 2,058 2,212
GDP deflator 5.9 5.0 5.0 4.7 4.5 4.2 4.0
CPI (annual average) 1.4 4.1 5.2 5.0 4.5 4.0 4.0
CPIX (end of period) 1/ 4.3 5.1 5.0 4.8 4.3 4.0 4.0
CPIX (period average) 1/ 4.3 4.8 5.1 5.0 4.5 4.0 4.0
Labor marketUnemployment rate (in percent) 26.2 25.3 25.3 25.3 25.3 25.3 25.3
Average remuneration (formal nonagricultural sector) 7.6 6.7 5.6 6.7 6.5 6.0 5.5
Labor productivity (formal nonagricultural) 0.2 2.3 2.5 2.5 2.4 2.4 2.4
Nominal unit labor costs (formal nonagricultural) 7.4 4.4 3.1 4.2 4.1 3.5 3.1
External sectorMerchandise exports, f.o.b. 2/ 25.8 13.0 6.9 7.1 6.9 7.1 7.0
Merchandise imports, f.o.b. 2/ 38.1 17.0 5.6 5.0 5.4 5.8 6.0
Export (goods and services) volume 2.9 5.2 6.3 6.3 6.6 6.6 6.7
Import (goods and services) volume 12.9 7.4 5.3 5.3 5.5 5.5 5.6
Terms of trade 0.8 -0.7 0.2 0.8 0.3 0.1 -0.2
Investment and savingInvestment (including inventories) 17.7 17.7 17.8 18.6 18.5 18.5 18.5
of which:
Public fixed investment (incl. public enterprises) 4.9 5.4 6.1 6.9 7.0 7.0 7.0
Private fixed investment 11.6 11.6 11.5 11.5 11.5 11.6 11.6
Gross national saving 14.4 13.9 14.4 15.7 16.1 16.4 16.7
Public 0.0 -0.1 -0.3 -0.1 -0.1 0.0 0.0
Private 14.4 13.9 14.7 15.8 16.1 16.5 16.7
National government budget 3/Revenue, including grants 24.4 24.9 25.0 24.9 24.9 24.9 24.9
Expenditure and net lending 26.1 27.0 27.3 27.2 27.2 27.2 27.1
Overall balance -1.7 -2.1 -2.3 -2.3 -2.3 -2.3 -2.2
Primary balance 1.8 1.3 1.0 0.8 0.7 0.7 0.7
National government debt 35.8 35.6 35.4 35.7 35.6 35.5 35.3
General government balance 4/ -1.5 -1.7 -2.1 -2.1 -2.1 -2.1 -2.0
Borrowing requirement of the nonfinancial public sector 2.1 2.8 3.0 3.3 3.3 3.3 3.3
External sectorCurrent account balance (in billions of U.S. dollars) -6.9 -9.0 -8.5 -7.5 -6.8 -6.1 -5.5
Current account balance -3.2 -3.8 -3.4 -2.9 -2.5 -2.1 -1.8
Overall balance of payments 3.8 2.4 0.8 0.6 0.4 0.5 0.5
Foreign currency-denominated debt (in billions of U.S. dollars) 27.9 29.5 31.2 32.6 33.5 33.7 33.3 Of which: short term (in billions of U.S. dollars) 10.5 10.8 11.2 11.5 11.6 11.4 11.1
Total external debt / exports of goods and services (in percent) 74.7 70.7 70.4 69.1 66.6 63.0 58.3
Total external debt service (in billions of U.S. dollars) 5/ 7.1 5.1 7.6 8.9 9.0 10.7 12.5
Total external debt service / exports (in percent) 5/ 12.6 8.0 11.3 12.4 11.8 13.2 14.4
Gross reserves (SARB, in billions of U.S. dollars) 14.7 20.2 22.2 23.7 24.7 26.2 27.7
(in months of total imports) 3.1 3.7 3.8 3.9 3.9 3.9 3.9
Sources: South African Reserve Bank (SARB); IMF, International Financial Statistics; and Fund staff projections.
1/ CPIX is the consumer price index (CPI) excluding the interest on mortgage bonds.
2/ In U.S. dollars; annual percent change.
3/ Calendar-year figures, based on National Treasury data, and staff's GDP projections for 2005 and 2006.
4/ Excluding sales of state assets and profit/losses from forward market operations of the SARB.
5/ Excluding principal payments of rand-demoninated debt held by nonresidents; end of period.
Table 1. South Africa: Medium-Term Baseline Scenario, 2004-2010
(In percent of GDP, unless otherwise indicated)
(Annual percent change, unless otherwise indicated)

- 52 - APPENDIX IV
2004 2005 2006 2007 2008 2009 2010
National income and prices
Real GDP 3.7 4.0 4.1 4.6 5.0 5.3 5.5
Real GDP per capita 2.7 3.0 3.2 3.8 4.3 4.6 4.8
CPI (annual average) 1.4 4.1 5.2 5.0 4.5 4.0 4.0
CPIX (period average) 1/ 4.3 4.8 5.1 5.0 4.5 4.0 4.0
Labor marketUnemployment rate (in percent) 26.2 25.3 24.3 23.0 20.8 20.3 18.3
Nominal unit labor costs (formal nonagricultural) 7.4 4.4 2.6 2.9 2.6 2.5 2.4
National government budget
Overall balance (in percent of GDP) -1.7 -2.1 -2.1 -2.1 -2.0 -1.8 -1.7
National government debt (in percent of GDP) 35.8 35.6 35.1 34.8 34.3 33.6 32.9
External sectorExport (goods and services) volume 2.9 5.2 6.3 8.1 9.6 9.4 9.3
Import (goods and services) volume 12.9 7.4 5.8 6.8 7.4 7.5 7.4
Current account balance (in percent of GDP) -3.2 -3.8 -3.6 -3.0 -2.4 -1.9 -1.6
Investment and savingInvestment (including inventories; in percent of GDP) 17.7 17.7 18.6 19.7 19.9 20.0 20.2
Gross national saving (in percent of GDP) 14.4 13.9 15.0 16.7 17.6 18.1 18.6
Sources: South African Reserve Bank (SARB); IMF, International Financial Statistics; and Fund staff projections.
1/ CPIX is the consumer price index (CPI) excluding the interest on mortgage bonds.
Table 2. South Africa: Selected Economic and Financial Indicators, 2004-2010 (Accelerated Reforms)
(Annual percent change, unless otherwise indicated)
Proj.

- 53 - APPENDIX IV
Debt sustainability: Medium-term scenarios
South Africa’s fiscal policies imply a sustainable path for government debt. Under the policies in the 2005 budget and the medium-term expenditure framework, and assuming continued strength in revenue, government debt would remain moderate and stabilize at about 35 percent of GDP (Table 3). Gross financing needs would stay close to 5 percent of GDP over the medium-term, slightly below the average of the past five years (Table 4).
Government debt dynamics remain stable under a variety of shocks, including weaker GDP growth, a lower primary balance, a 30 percent real depreciation of the exchange rate, and a 10 percent increase in the debt stock (Figure 1). Under each of these scenarios (and assuming unchanged fiscal stance), the government debt ratio increases slightly over the projection period, exceeding 40 percent of GDP only with the 10 percent debt shock. The detailed risk analysis in Chapter II of the Selected Issues Paper confirms this relatively benign outlook.
South Africa’s external debt ratio is projected to stabilize at around its current level of about 20 percent of GDP, before falling gradually to around 16 percent of GDP by 2010. In 2005, the current account deficit is expected to widen to 3.8 percent of GDP in response to higher oil prices, the continued strength of domestic demand, and the lagged impact of recent currency strength. This deficit, however, is envisaged to be largely financed by non-debt creating capital inflows (with FDI boosted by the purchase of ABSA by Barclays Bank). Over the medium term, the current account deficit should narrow gradually as the pace of domestic demand begins to slow and the terms of trade improves moderately following a peak in oil prices in 2006, which would be accompanied by a gradual decline in the external debt ratio.
South Africa’s external debt position and gross external financing needs are robust to a range of shocks (Tables 5, 6 and Figure 2). In part this reflects a relatively low level of debt and a favorable debt structure. One third of the debt is denominated in rands, which limits to some extent South Africa’s exposure to currency risk. Exposure to rollover risk has been reduced as the share of short-term debt in total foreign currency debt has fallen from over 50 percent in 1996-2000 to 38 percent in 2004. Of the stress tests presented in Figure 2, in the short term, the largest impact would arise from a shock involving a 30 percent depreciation in the real exchange rate, as a result of which external debt would peak at 24 percent of GDP in 2006 before falling back to 18 percent of GDP in 2010. Over the longer term, the largest impact would arise from a permanent one-half standard deviation increase in the current account deficit. This would raise the annual current account deficit by about 0.7 percent of GDP, as a result of which debt would stabilize at about 20 percent of GDP. Permanent shocks to growth and interest rates would have only a minor impact on the debt stock. Under the historical average scenario, external debt would fall to 2 percent of GDP by 2010, suggesting that the baseline projection of 16 percent of GDP is not unduly optimistic.

- 54 - APPENDIX IV
Pro
ject
ion
s20
0020
0120
0220
0320
0420
0520
0620
0720
0820
0920
10D
ebt-
stab
iliz
ing
pri
mar
yb
alan
ce 9
/1
Bas
elin
e: P
ub
lic
sect
or d
ebt
1/42
.941
.437
.135
.735
.835
.635
.435
.735
.635
.535
.30.
6o/
w f
orei
gn-c
urre
ncy
deno
min
ated
3.3
6.7
6.6
5.4
5.0
4.7
4.8
5.0
4.9
4.7
4.6
2C
hang
e in
pub
lic
sect
or d
ebt
-3.3
-1.5
-4.3
-1.4
0.1
-0.2
-0.1
0.3
-0.1
-0.2
-0.2
3Id
enti
fied
deb
t-cr
eati
ng f
low
s (4
+7+
12)
-3.7
-1.4
-6.4
-2.4
-2.6
-1.4
-0.8
-0.6
-0.5
-0.4
-0.4
4P
rim
ary
defi
cit
-3.4
-3.5
-3.0
-1.8
-2.0
-1.7
-1.1
-0.9
-0.9
-0.9
-0.9
5R
even
ue a
nd g
rant
s24
.324
.724
.925
.026
.026
.526
.626
.526
.526
.526
.46
Pri
mar
y (n
onin
tere
st)
expe
ndit
ure
20.9
21.2
21.9
23.3
24.1
24.8
25.5
25.6
25.5
25.5
25.5
7A
utom
atic
deb
t dy
nam
ics
2/0.
22.
5-2
.9-0
.4-0
.50.
40.
40.
40.
40.
50.
58
Con
trib
utio
n fr
om i
nter
est
rate
/gro
wth
dif
fere
ntia
l 3/
-0.5
0.5
-1.1
1.1
0.3
0.4
0.4
0.4
0.4
0.5
0.5
9O
f w
hich
con
trib
utio
n fr
om r
eal
inte
rest
rat
e 1.
21.
60.
22.
11.
51.
71.
61.
51.
51.
61.
610
Of
whi
ch c
ontr
ibut
ion
from
rea
l G
DP
gro
wth
-1.7
-1.1
-1.3
-1.0
-1.2
-1.3
-1.2
-1.1
-1.1
-1.1
-1.1
11C
ontr
ibut
ion
from
exc
hang
e ra
te d
epre
ciat
ion
4/0.
62.
0-1
.8-1
.5-0
.8...
......
......
...12
Oth
er i
dent
ifie
d de
bt-c
reat
ing
flow
s-0
.4-0
.4-0
.6-0
.3-0
.1-0
.10.
00.
00.
00.
00.
013
Pri
vati
zati
on r
ecei
pts
(neg
ativ
e)-0
.4-0
.4-0
.6-0
.3-0
.1-0
.10.
00.
00.
00.
00.
014
Rec
ogni
tion
of
impl
icit
or
cont
inge
nt l
iabi
liti
es0.
00.
00.
00.
00.
00.
00.
00.
00.
00.
00.
015
Oth
er (
spec
ify,
e.g
. ban
k re
capi
tali
zati
on)
0.0
0.0
0.0
0.0
0.0
0.0
0.0
0.0
0.0
0.0
0.0
16R
esid
ual,
inc
ludi
ng a
sset
cha
nges
(2-
3) 5
/0.
4-0
.12.
21.
02.
71.
10.
70.
90.
50.
30.
3
Pub
lic
sect
or d
ebt-
to-r
even
ue r
atio
1/
176.
516
7.6
149.
414
2.7
137.
413
4.2
133.
213
4.6
134.
713
4.1
133.
6
Gro
ss f
inan
cin
gn
eed
6/
5.9
3.6
6.7
5.5
6.3
5.0
5.4
5.5
5.1
5.3
4.7
in b
illi
ons
of U
.S. d
olla
rs7.
94.
37.
59.
113
.412
.013
.714
.714
.415
.914
.7
Sce
nar
io w
ith
key
var
iab
les
at t
hei
r h
isto
rica
l av
erag
es 7
/35
.634
.533
.632
.330
.929
.40.
4S
cen
ario
wit
h n
o p
olic
y ch
ange
(co
nst
ant
pri
mar
y b
alan
ce)
in 2
005-
2010
35.6
34.9
34.4
33.6
32.6
31.7
0.5
Key
Mac
roec
onom
ic a
nd
Fis
cal
Ass
um
pti
ons
Un
der
lyin
g B
asel
ine
Rea
l G
DP
gro
wth
(in
per
cent
)4.
22.
73.
62.
83.
74.
03.
63.
43.
33.
33.
3A
vera
ge n
omin
al i
nter
est
rate
on
publ
ic d
ebt
(in
perc
ent)
8/
12.2
11.9
11.2
10.7
10.8
10.4
10.0
9.4
9.3
9.2
9.0
Ave
rage
rea
l in
tere
st r
ate
(nom
inal
rat
e m
inus
cha
nge
in G
DP
def
lato
r, i
n pe
rcen
t)3.
44.
21.
06.
24.
95.
44.
94.
74.
84.
94.
9N
omin
al a
ppre
ciat
ion
(inc
reas
e in
US
dol
lar
valu
e of
loc
al c
urre
ncy,
in
perc
ent)
-18.
7-3
7.6
40.4
30.1
17.9
......
......
......
Infl
atio
n ra
te (
GD
P d
efla
tor,
in
perc
ent)
8.8
7.7
10.3
4.5
5.9
5.0
5.0
4.7
4.5
4.2
4.0
Gro
wth
of
real
pri
mar
y sp
endi
ng (
defl
ated
by
GD
P d
efla
tor,
in
perc
ent)
0.8
4.5
6.8
9.2
7.3
7.2
6.4
3.8
3.2
3.3
3.3
Pri
mar
y de
fici
t-3
.4-3
.5-3
.0-1
.8-2
.0-1
.7-1
.1-0
.9-0
.9-0
.9-0
.9
Sou
rces
: S
outh
Afr
ican
Nat
iona
l T
reas
ury
and
Fun
d st
aff
esti
mat
es.
1/ P
ubli
c se
ctor
inc
lude
s th
e ce
ntra
l go
vern
men
t, a
nd p
rovi
ncia
l an
d lo
cal
gove
rnm
ent
acti
viti
es f
inan
ced
wit
h tr
ansf
ers
from
the
cent
ral
gove
rnm
ent.
2/ D
eriv
ed a
s [(
r -
g -
g +
r
]/(1
+g+
+g
)) t
imes
pre
viou
s pe
riod
deb
t ra
tio,
wit
h r
= i
nter
est
rate
; =
gro
wth
rat
e of
GD
P d
efla
tor;
g =
rea
l G
DP
gro
wth
rat
e;
= s
hare
of
fore
ign-
curr
ency
de
nom
inat
ed d
ebt;
and
=
nom
inal
exc
hang
e ra
te d
epre
ciat
ion
(mea
sure
d by
inc
reas
e in
loc
al c
urre
ncy
valu
e of
U.S
. dol
lar)
.3/
The
rea
l in
tere
st r
ate
cont
ribu
tion
is
deri
ved
from
the
den
omin
ator
in
foot
note
2/
as r
-
(1+
g) a
nd t
he r
eal
grow
th c
ontr
ibut
ion
as -
g.4/
The
exc
hang
e ra
te c
ontr
ibut
ion
is d
eriv
ed f
rom
the
num
erat
or i
n fo
otno
te 2
/ as
(1
+r)
.
5/ F
or p
roje
ctio
ns, t
his
line
inc
lude
s ex
chan
ge r
ate
chan
ges.
6/ D
efin
ed a
s pu
blic
sec
tor
defi
cit,
plu
s am
orti
zati
on o
f m
ediu
m a
nd l
ong-
term
pub
lic
sect
or d
ebt,
plu
s sh
ort-
term
deb
t at
end
of
prev
ious
per
iod.
7/
The
key
var
iabl
es i
nclu
de r
eal
GD
P g
row
th;
real
int
eres
t ra
te;
and
prim
ary
bala
nce
in p
erce
nt o
f G
DP
.8/
Der
ived
as
nom
inal
int
eres
t ex
pend
itur
e di
vide
d by
pre
viou
s pe
riod
deb
t st
ock.
9/ A
ssum
es t
hat
key
vari
able
s (r
eal
GD
P g
row
th, r
eal
inte
rest
rat
e, a
nd o
ther
ide
ntif
ied
debt
-cre
atin
g fl
ows)
rem
ain
at t
he l
evel
of
the
last
pro
ject
ion
year
.
Act
ual
Tab
le 3
. Sou
th A
fric
a: P
ubli
c S
ecto
r D
ebt
Sus
tain
abil
ity
Fra
mew
ork,
200
0-20
10
(In
perc
ent
of G
DP
, unl
ess
othe
rwis
e in
dica
ted)
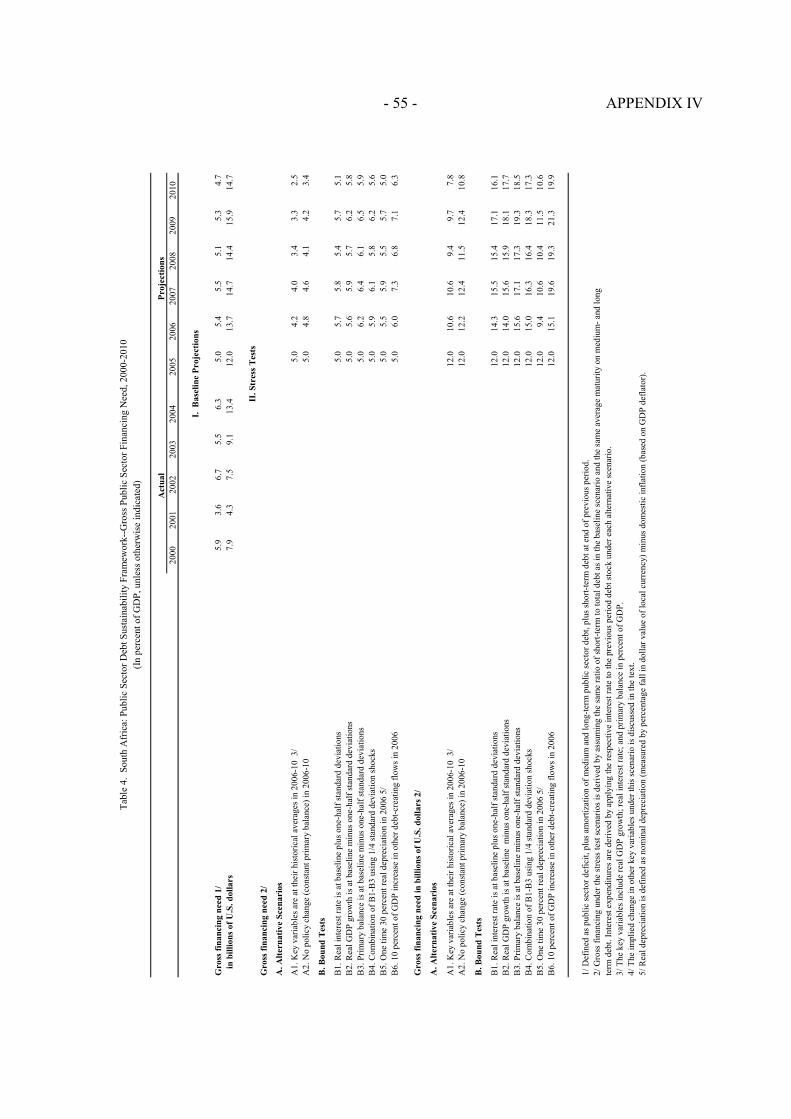
- 55 - APPENDIX IV
Pro
ject
ion
s20
0020
0120
0220
0320
0420
0520
0620
0720
0820
0920
10
Gro
ss f
inan
cin
g n
eed
1/
5.9
3.6
6.7
5.5
6.3
5.0
5.4
5.5
5.1
5.3
4.7
in b
illi
ons
of U
.S. d
olla
rs7.
94.
37.
59.
113
.412
.013
.714
.714
.415
.914
.7
Gro
ss f
inan
cin
g n
eed
2/
A. A
lter
nat
ive
Sce
nar
ios
A1.
Key
var
iabl
es a
re a
t th
eir
hist
oric
al a
vera
ges
in 2
006-
10 3
/5.
04.
24.
03.
43.
32.
5A
2. N
o po
licy
cha
nge
(con
stan
t pr
imar
y ba
lanc
e) i
n 20
06-1
0
5.0
4.8
4.6
4.1
4.2
3.4
B. B
oun
d T
ests
B1.
Rea
l in
tere
st r
ate
is a
t ba
seli
ne p
lus
one-
half
sta
ndar
d de
viat
ions
5.0
5.7
5.8
5.4
5.7
5.1
B2.
Rea
l G
DP
gro
wth
is
at b
asel
ine
min
us o
ne-h
alf
stan
dard
dev
iati
ons
5.0
5.6
5.9
5.7
6.2
5.8
B3.
Pri
mar
y ba
lanc
e is
at
base
line
min
us o
ne-h
alf
stan
dard
dev
iati
ons
5.0
6.2
6.4
6.1
6.5
5.9
B4.
Com
bina
tion
of
B1-
B3
usin
g 1/
4 st
anda
rd d
evia
tion
sho
cks
5.0
5.9
6.1
5.8
6.2
5.6
B5.
One
tim
e 30
per
cent
rea
l de
prec
iati
on i
n 20
06 5
/5.
05.
55.
95.
55.
75.
0B
6. 1
0 pe
rcen
t of
GD
P i
ncre
ase
in o
ther
deb
t-cr
eati
ng f
low
s in
200
65.
06.
07.
36.
87.
16.
3
Gro
ss f
inan
cin
g n
eed
in
bil
lion
s of
U.S
. dol
lars
2/
A. A
lter
nat
ive
Sce
nar
ios
A1.
Key
var
iabl
es a
re a
t th
eir
hist
oric
al a
vera
ges
in 2
006-
10 3
/12
.010
.610
.69.
49.
77.
8A
2. N
o po
licy
cha
nge
(con
stan
t pr
imar
y ba
lanc
e) i
n 20
06-1
0
12.0
12.2
12.4
11.5
12.4
10.8
B. B
oun
d T
ests
B1.
Rea
l in
tere
st r
ate
is a
t ba
seli
ne p
lus
one-
half
sta
ndar
d de
viat
ions
12.0
14.3
15.5
15.4
17.1
16.1
B2.
Rea
l G
DP
gro
wth
is
at b
asel
ine
min
us o
ne-h
alf
stan
dard
dev
iati
ons
12.0
14.0
15.6
15.9
18.1
17.7
B3.
Pri
mar
y ba
lanc
e is
at
base
line
min
us o
ne-h
alf
stan
dard
dev
iati
ons
12.0
15.6
17.1
17.3
19.3
18.5
B4.
Com
bina
tion
of
B1-
B3
usin
g 1/
4 st
anda
rd d
evia
tion
sho
cks
12.0
15.0
16.3
16.4
18.3
17.3
B5.
One
tim
e 30
per
cent
rea
l de
prec
iati
on i
n 20
06 5
/12
.09.
410
.610
.411
.510
.6B
6. 1
0 pe
rcen
t of
GD
P i
ncre
ase
in o
ther
deb
t-cr
eati
ng f
low
s in
200
612
.015
.119
.619
.321
.319
.9
1/ D
efin
ed a
s pu
blic
sec
tor
defi
cit,
plu
s am
orti
zati
on o
f m
ediu
m a
nd l
ong-
term
pub
lic
sect
or d
ebt,
plu
s sh
ort-
term
deb
t at
end
of
prev
ious
per
iod.
2/
Gro
ss f
inan
cing
und
er t
he s
tres
s te
st s
cena
rios
is
deri
ved
by a
ssum
ing
the
sam
e ra
tio
of s
hort
-ter
m t
o to
tal
debt
as
in t
he b
asel
ine
scen
ario
and
the
sam
e av
erag
e m
atur
ity
on m
ediu
m-
and
long
term
deb
t. I
nter
est
expe
ndit
ures
are
der
ived
by
appl
ying
the
res
pect
ive
inte
rest
rat
e to
the
pre
viou
s pe
riod
deb
t st
ock
unde
r ea
ch a
lter
nati
ve s
cena
rio.
3/ T
he k
ey v
aria
bles
inc
lude
rea
l G
DP
gro
wth
; re
al i
nter
est
rate
; an
d pr
imar
y ba
lanc
e in
per
cent
of
GD
P.
4/ T
he i
mpl
ied
chan
ge i
n ot
her
key
vari
able
s un
der
this
sce
nari
o is
dis
cuss
ed i
n th
e te
xt.
5/ R
eal
depr
ecia
tion
is
defi
ned
as n
omin
al d
epre
ciat
ion
(mea
sure
d by
per
cent
age
fall
in
doll
ar v
alue
of
loca
l cu
rren
cy)
min
us d
omes
tic
infl
atio
n (b
ased
on
GD
P d
efla
tor)
.
II. S
tres
s T
ests
Tab
le 4
. S
outh
Afr
ica:
Pub
lic
Sec
tor
Deb
t S
usta
inab
ilit
y F
ram
ewor
k--G
ross
Pub
lic
Sec
tor
Fin
anci
ng N
eed,
200
0-20
10
(In
perc
ent
of G
DP
, unl
ess
othe
rwis
e in
dica
ted)
Act
ual
I. B
asel
ine
Pro
ject
ion
s

- 56 - APPENDIX IV
Pro
ject
ion
s20
0020
0120
0220
0320
0420
0520
0620
0720
0820
0920
10D
ebt-
stab
iliz
ing
non
-in
tere
st
curr
ent
acco
un
t 6/
1B
asel
ine:
Ext
ern
al d
ebt
27.7
26.0
29.5
22.4
19.8
19.2
19.2
19.0
18.4
17.5
16.4
-2.3
2C
hang
e in
ext
erna
l de
bt-1
.5-1
.73.
5-7
.1-2
.6-0
.70.
0-0
.2-0
.6-0
.8-1
.13
Iden
tifi
ed e
xter
nal
debt
-cre
atin
g fl
ows
(4+
8+9)
-4.8
-6.2
-0.5
-6.7
-3.3
-0.2
0.1
-0.1
-0.5
-0.9
-1.1
4C
urre
nt a
ccou
nt d
efic
it, e
xclu
ding
int
eres
t pa
ymen
ts-1
.7-1
.8-2
.30.
22.
22.
82.
31.
81.
31.
00.
75
Def
icit
in
bala
nce
of g
oods
and
ser
vice
s-3
.0-3
.9-3
.7-1
.80.
51.
31.
00.
50.
1-0
.2-0
.46
Exp
orts
27.9
30.0
32.8
27.7
26.6
27.1
27.2
27.5
27.6
27.9
28.1
7Im
port
s 24
.926
.129
.126
.027
.128
.428
.228
.027
.727
.727
.78
Net
non
-deb
t cr
eati
ng c
apit
al i
nflo
ws
(neg
ativ
e)-3
.6-7
.4-0
.4-0
.4-2
.3-3
.3-2
.7-2
.3-2
.4-2
.4-2
.49
Aut
omat
ic d
ebt
dyna
mic
s 1/
0.4
3.0
2.3
-6.5
-3.1
0.4
0.4
0.5
0.5
0.6
0.6
10C
ontr
ibut
ion
from
nom
inal
int
eres
t ra
te1.
81.
71.
61.
31.
01.
11.
11.
11.
11.
11.
111
Con
trib
utio
n fr
om r
eal
GD
P g
row
th
-1.2
-0.9
-1.0
-0.6
-0.6
-0.7
-0.7
-0.6
-0.6
-0.6
-0.6
12C
ontr
ibut
ion
from
pri
ce a
nd e
xcha
nge
rate
cha
nges
2/
-0.2
2.2
1.6
-7.3
-3.5
......
......
......
13R
esid
ual,
inc
l. c
hang
e in
gro
ss f
orei
gn a
sset
s (2
-3)
3/3.
34.
54.
0-0
.40.
6-0
.5-0
.1-0
.1-0
.10.
00.
0
Ext
erna
l de
bt-t
o-ex
port
s ra
tio
(in
perc
ent)
99.5
86.8
90.0
81.0
74.7
70.7
70.4
69.1
66.6
63.0
58.3
Gro
ss e
xter
nal
fin
anci
ng
nee
d (
in b
illi
ons
of U
S d
olla
rs)
4/13
.413
.410
.014
.619
.317
.121
.619
.818
.219
.218
.6in
per
cent
of
GD
P10
.111
.39.
08.
89.
17.
38.
87.
66.
66.
66.
1
Sce
nar
io w
ith
key
var
iab
les
at t
hei
r h
isto
rica
l av
erag
es 5
/19
.215
.712
.18.
75.
21.
7-3
.3
Key
Mac
roec
onom
ic A
ssu
mp
tion
s U
nd
erly
ing
Bas
elin
e
Rea
l G
DP
gro
wth
(in
per
cent
)4.
22.
73.
62.
83.
74.
03.
63.
43.
33.
33.
3G
DP
def
lato
r in
US
dol
lars
(ch
ange
in
perc
ent)
-4.1
-13.
2-9
.845
.324
.25.
32.
02.
02.
82.
02.
0N
omin
al e
xter
nal
inte
rest
rat
e (i
n pe
rcen
t)6.
25.
35.
96.
65.
95.
96.
16.
26.
46.
56.
7G
row
th o
f ex
port
s (U
S d
olla
r te
rms,
in
perc
ent)
9.9
-4.2
2.3
26.2
23.4
11.6
6.3
6.6
6.4
6.6
6.5
Gro
wth
of
impo
rts
(U
S d
olla
r te
rms,
in
perc
ent)
9.4
-6.7
4.3
33.2
34.3
14.7
5.2
4.7
5.0
5.4
5.6
Cur
rent
acc
ount
bal
ance
, exc
ludi
ng i
nter
est
paym
ents
1.
71.
82.
3-0
.2-2
.2-2
.8-2
.3-1
.8-1
.3-1
.0-0
.7N
et n
on-d
ebt
crea
ting
cap
ital
inf
low
s 3.
67.
40.
40.
42.
33.
32.
72.
32.
42.
42.
4
1/ D
eriv
ed a
s [r
- g
-
g) +
(1
+r)
]/(1
+g+
+g
) ti
mes
pre
viou
s pe
riod
deb
t st
ock,
wit
h r
= n
omin
al e
ffec
tive
int
eres
t ra
te o
n ex
tern
al d
ebt;
=
cha
nge
in d
omes
tic
GD
P d
efla
tor
in U
S d
olla
r te
rms,
g =
rea
l G
DP
gro
wth
rat
e,
= n
omin
al a
ppre
ciat
ion
(inc
reas
e in
dol
lar
valu
e of
dom
esti
c cu
rren
cy),
and
=
sha
re o
f do
mes
tic-
curr
ency
den
omin
ated
deb
t in
tot
al e
xter
nal
debt
.
2/ T
he c
ontr
ibut
ion
from
pri
ce a
nd e
xcha
nge
rate
cha
nges
is
defi
ned
as [
-g
r1+
g++
g)
tim
es p
revi
ous
peri
od d
ebt
stoc
k.
incr
ease
s w
ith
an a
ppre
ciat
ing
dom
esti
c cu
rren
cy (
> 0
) an
d ri
sing
inf
lati
on (
base
d on
GD
P d
efla
tor)
.
3/ F
or p
roje
ctio
n, l
ine
incl
udes
the
im
pact
of
pric
e an
d ex
chan
ge r
ate
chan
ges.
4/ D
efin
ed a
s cu
rren
t ac
coun
t de
fici
t, p
lus
amor
tiza
tion
on
med
ium
- an
d lo
ng-t
erm
deb
t, p
lus
shor
t-te
rm d
ebt
at e
nd o
f pr
evio
us p
erio
d.
5/ T
he k
ey v
aria
bles
inc
lude
rea
l G
DP
gro
wth
; no
min
al i
nter
est
rate
; do
llar
def
lato
r gr
owth
; an
d bo
th n
on-i
nter
est
curr
ent
acco
unt
and
non-
debt
inf
low
s in
per
cent
of
GD
P.
6/ L
ong-
run,
con
stan
t ba
lanc
e th
at s
tabi
lize
s th
e de
bt r
atio
ass
umin
g th
at k
ey v
aria
bles
(re
al G
DP
gro
wth
, nom
inal
int
eres
t ra
te, d
olla
r de
flat
or g
row
th,
and
non-
debt
inf
low
s in
per
cent
of
GD
P)
rem
ain
at t
heir
lev
els
of t
he l
ast
proj
ecti
on y
ear.
Act
ual
Tab
le 5
. Sou
th A
fric
a: E
xter
nal
Deb
t S
usta
inab
ilit
y F
ram
ewor
k, 2
000-
2010
(In
perc
ent
of G
DP
, unl
ess
othe
rwis
e in
dica
ted)

- 57 - APPENDIX IV
Pro
ject
ion
s20
0020
0120
0220
0320
0420
0520
0620
0720
0820
0920
10
Gro
ss e
xter
nal
fin
anci
ng
nee
d i
n b
illi
ons
of U
.S. d
olla
rs 1
/13
.413
.410
.014
.619
.317
.121
.619
.818
.219
.218
.6
in p
erce
nt
of G
DP
10.1
11.3
9.0
8.8
9.1
7.3
8.8
7.6
6.6
6.6
6.1
Gro
ss e
xter
nal
fin
anci
ng
nee
d i
n b
illi
ons
of U
.S. d
olla
rs 2
/
A. A
lter
nat
ive
Sce
nar
ios
A1.
Key
var
iabl
es a
re a
t th
eir
hist
oric
al a
vera
ges
in 2
006-
10 3
/17
.113
.710
.06.
74.
61.
1
B. B
oun
d T
ests
B1.
Nom
inal
int
eres
t ra
te i
s at
bas
elin
e pl
us o
ne-h
alf
stan
dard
dev
iati
ons
17.1
22.0
20.2
18.7
19.9
19.4
B2.
Rea
l G
DP
gro
wth
is
at b
asel
ine
min
us o
ne-h
alf
stan
dard
dev
iati
ons
17.1
21.6
19.7
18.1
19.1
18.5
B3.
Non
-int
eres
t cu
rren
t ac
coun
t is
at
base
line
min
us o
ne-h
alf
stan
dard
dev
iati
ons
17.1
23.4
22.2
21.2
23.2
23.5
B4.
Com
bina
tion
of
B1-
B3
usin
g 1/
4 st
anda
rd d
evia
tion
sho
cks
17.1
22.7
21.2
19.9
21.5
21.4
B5.
One
tim
e 30
per
cent
nom
inal
dep
reci
atio
n in
200
617
.119
.015
.814
.214
.613
.7
Gro
ss e
xter
nal
fin
anci
ng
nee
d i
n p
erce
nt
of G
DP
2/
A. A
lter
nat
ive
Sce
nar
ios
A1.
Key
var
iabl
es a
re a
t th
eir
hist
oric
al a
vera
ges
in 2
006-
10 3
/7.
35.
63.
82.
41.
60.
4
B. B
oun
d T
ests
B1.
Nom
inal
int
eres
t ra
te i
s at
bas
elin
e pl
us o
ne-h
alf
stan
dard
dev
iati
ons
7.3
8.9
7.8
6.8
6.8
6.3
B2.
Rea
l G
DP
gro
wth
is
at b
asel
ine
min
us o
ne-h
alf
stan
dard
dev
iati
ons
7.3
8.8
7.7
6.7
6.7
6.2
B3.
Non
-int
eres
t cu
rren
t ac
coun
t is
at
base
line
min
us o
ne-h
alf
stan
dard
dev
iati
ons
7.3
9.5
8.5
7.7
8.0
7.7
B4.
Com
bina
tion
of
B1-
B4
usin
g 1/
4 st
anda
rd d
evia
tion
sho
cks
7.3
9.2
8.2
7.3
7.5
7.1
B5.
One
tim
e 30
per
cent
nom
inal
dep
reci
atio
n in
200
67.
311
.59.
17.
77.
56.
7
1/ D
efin
ed a
s no
n-in
tere
st c
urre
nt a
ccou
nt d
efic
it, p
lus
inte
rest
and
am
orti
zati
on o
n m
ediu
m-
and
long
-ter
m d
ebt,
plu
s sh
ort-
term
deb
t at
end
of
prev
ious
per
iod.
2/
Gro
ss e
xter
nal
fina
ncin
g un
der
the
stre
ss-t
est
scen
ario
s is
der
ived
by
assu
min
g th
e sa
me
rati
o of
sho
rt-t
erm
to
tota
l de
bt a
s in
the
bas
elin
e sc
enar
io a
nd t
he s
ame
aver
age
mat
urit
y on
med
ium
- an
d lo
ng t
erm
debt
. Int
eres
t ex
pend
itur
es a
re d
eriv
ed b
y ap
plyi
ng t
he r
espe
ctiv
e in
tere
st r
ate
to t
he p
revi
ous
peri
od d
ebt
stoc
k un
der
each
alt
erna
tive
sce
nari
o.3/
The
key
var
iabl
es i
nclu
de r
eal
GD
P g
row
th;
nom
inal
int
eres
t ra
te;
doll
ar d
efla
tor
grow
th;
and
both
non
-int
eres
t cu
rren
t ac
coun
t an
d no
n-de
bt i
nflo
ws
in p
erce
nt o
f G
DP
.4/
The
im
plie
d ch
ange
in
othe
r ke
y va
riab
les
unde
r th
is s
cena
rio
is d
iscu
ssed
in
the
text
.
II. S
tres
s T
ests
Tab
le 6
. Sou
th A
fric
a: E
xter
nal
Sus
tain
abil
ity
Fra
mew
ork-
-Gro
ss E
xter
nal
Fin
anci
ng N
eed,
200
0-20
10
Act
ual
I. B
asel
ine
Pro
ject
ion
s

- 58 - APPENDIX IV
Growth shock (in percent per year)
38
Growth
shock
35Baseline
20
25
30
35
40
45
50
2000 2001 2002 2003 2004 2005 2006 2007 2008 2009 2010
39PB shock
35
Baseline 32
20
25
30
35
40
45
50
2000 2001 2002 2003 2004 2005 2006 2007 2008 2009 2010
Interest rate shock (in percent)
37
i-rate shock
35
Baseline
20
25
30
35
40
45
50
2000 2001 2002 2003 2004 2005 2006 2007 2008 2009 2010
Figure 1. South Africa: Public Debt Sustainability: Bound Tests 1/
(Public debt in percent of GDP)
Sources: International Monetary Fund, Country desk data, and staff estimates.1/ Shaded areas represent actual data.Individual shocks are permanent one-half standard deviation shocks. Figures in the boxes represent average projections for the respective variables in the baseline and scenario being presented. Ten-year historical average for the variable is also shown.2/ Permanent 1/4 standard deviation shocks applied to real interest rate, growth rate, and primary balance.3/ One-time real depreciation of 30 percent and 10 percent of GDP shock to contingent liabilities occur in 2006, with real depreciation defined as nominal depreciation (measured by percentage fall in dollar value of local currency) minus domestic inflation (based on GDP deflator).
Baseline and historical scenarios
29
Historical 35Baseline
20
25
30
35
40
45
50
2000 2001 2002 2003 2004 2005 2006 2007 2008 2009 2010
3.0
3.5
4.0
4.5
5.0
5.5
6.0
6.5
7.0
Combined shock 2/
38
Combined
shock
35Baseline
20
25
30
35
40
45
50
2000 2001 2002 2003 2004 2005 2006 2007 2008 2009 2010
30 % depreciation
38
Baseline
35
contingent
liabilities shock46
20
25
30
35
40
45
50
2000 2001 2002 2003 2004 2005 2006 2007 2008 2009 2010
Real depreciation and contingent liabilities shocks 3/
Gross financing need under
baseline (right scale)
Primary balance shock (in percent of GDP) andno policy change scenario (constant primary balance)
No policy change
Baseline: 4.9Scenario: 5.6
Historical: 4.5
Baseline: 1.0
Scenario: 0.3
Historical: 2.1
Baseline: 3.4
Scenario: 2.9
Historical: 3.0
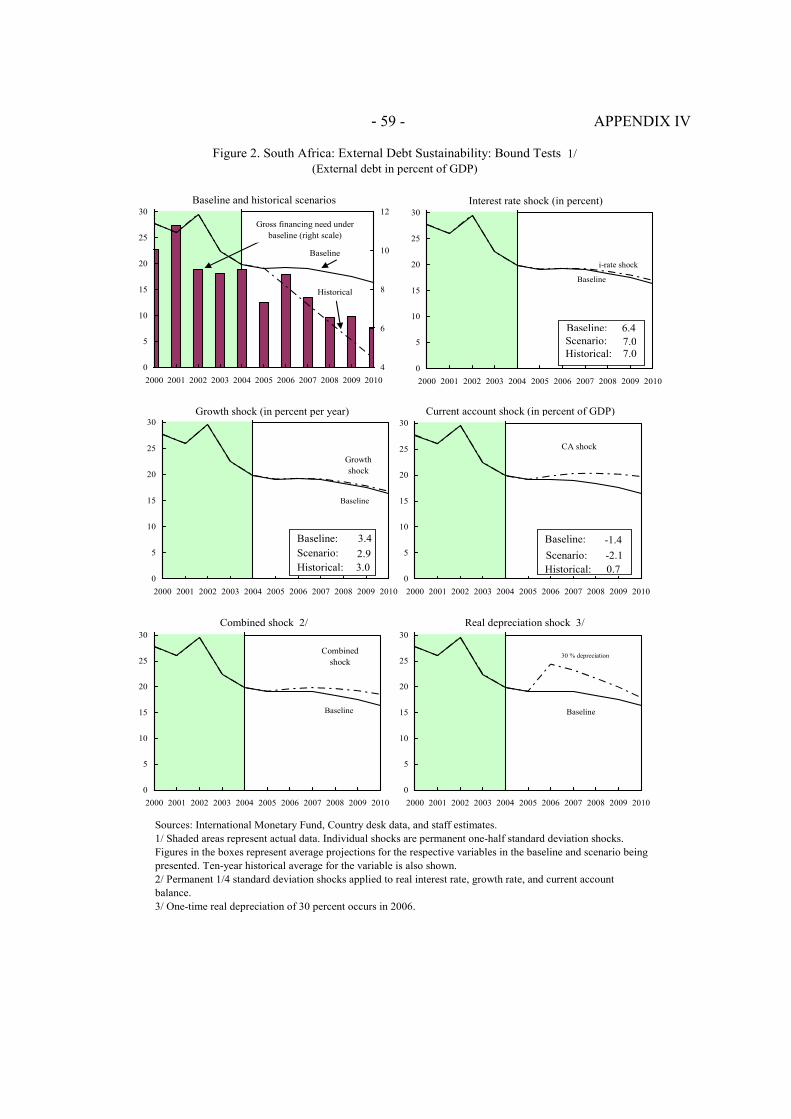
- 59 - APPENDIX IV
Interest rate shock (in percent)
i-rate shock
Baseline
0
5
10
15
20
25
30
2000 2001 2002 2003 2004 2005 2006 2007 2008 2009 2010
Figure 2. South Africa: External Debt Sustainability: Bound Tests 1/(External debt in percent of GDP)
Sources: International Monetary Fund, Country desk data, and staff estimates.1/ Shaded areas represent actual data. Individual shocks are permanent one-half standard deviation shocks. Figures in the boxes represent average projections for the respective variables in the baseline and scenario being presented. Ten-year historical average for the variable is also shown. 2/ Permanent 1/4 standard deviation shocks applied to real interest rate, growth rate, and current account balance.3/ One-time real depreciation of 30 percent occurs in 2006.
Baseline and historical scenarios
Historical
Baseline
0
5
10
15
20
25
30
2000 2001 2002 2003 2004 2005 2006 2007 2008 2009 2010
4
6
8
10
12
Gross financing need under
baseline (right scale)
CA shock
0
5
10
15
20
25
30
2000 2001 2002 2003 2004 2005 2006 2007 2008 2009 2010
Combined shock 2/
Combined
shock
Baseline
0
5
10
15
20
25
30
2000 2001 2002 2003 2004 2005 2006 2007 2008 2009 2010
Real depreciation shock 3/
30 % depreciation
Baseline
0
5
10
15
20
25
30
2000 2001 2002 2003 2004 2005 2006 2007 2008 2009 2010
Gross financing need under
baseline (right scale)
Current account shock (in percent of GDP)Growth shock (in percent per year)
Growth
shock
Baseline
0
5
10
15
20
25
30
2000 2001 2002 2003 2004 2005 2006 2007 2008 2009 2010
Baseline: 3.4
Scenario: 2.9Historical: 3.0
Baseline:Scenario:Historical:
6.47.07.0
Baseline: -1.4
Scenario: -2.1
Historical: 0.7
Statement by the Staff Representative on South Africa September 2, 2005
This statement provides information that has become available since the staff report (SM/05/309) was issued. The thrust of the staff appraisal remains unchanged.
1. Data released last week reveal continued robust growth of economic activity.Supply-side GDP data published by Statistics South Africa on August 23 show real GDP growth of 4.8 percent in the second quarter of 2005, stronger than anticipated and up from 3.5 percent in the first quarter. The rebound in growth partly reflects strong performance of the manufacturing sector, which grew by 7.3 percent in the second quarter after contracting in the first quarter. Demand-side GDP data for the first half of 2005 published by the South African Reserve Bank (SARB) on August 24 show continued strong final domestic demand—including both consumption and fixed capital formation—but subdued inventory investment. In the first half of 2005 import growth slowed markedly while export growth remained steady, and as a result the current account deficit declined to 3.3 percent of GDP, from 3.6 percent of GDP in the second half of 2004. Twelve-month CPIX inflation rose to 4.2 percent in July, from 3.5 percent in June, mainly reflecting higher fuel and food prices.
2. This information points to strengthened near-term economic prospects. Staff has raised moderately its projection for real GDP growth, to 4.3 percent in 2005 and 3.9 percent in 2006. Projected fiscal deficits have been lowered slightly, to 1.9 percent of GDP in 2005 (calendar year) and 2.1 percent of GDP in 2006, reflecting stronger expected fiscal revenues. The forecast for the external current account deficit remains essentially unchanged, as the effect of a lower than anticipated deficit in the first half of 2005 is broadly offset by a weaker outlook for the country’s terms of trade, owing to higher world oil prices.
3. At its Monetary Policy Committee (MPC) meeting on August 10-11, the SARB decided to keep the repo rate unchanged at 7 percent. The MPC saw the inflation outlook as generally favorable, but mentioned several risks, including higher oil prices and continued strong domestic expenditure. The MPC will also watch closely the trends of wage settlements and unit labor costs. The SARB’s central forecast envisages CPIX inflation rising moderately in the period ahead, and peaking at about 5.5 percent in the first quarter of 2006.
4. Last week Fitch upgraded South Africa's sovereign credit rating one notch to BBB+. The move brings Fitch rating in line with those of Moody’s and S&P. Fitch cited an improvement in the country’s growth performance and further strengthening of its international reserves.
Public Information Notice (PIN) No. 05/126 FOR IMMEDIATE RELEASE
IMF Concludes Article IV Consultation with South Africa
On September 2, 2005 the Executive Board of the International Monetary Fund (IMF) concluded the Article IV consultation with South Africa.1
Background
South Africa’s macroeconomic performance was strong in 2004 and early 2005. Growth was supported by a continuation of sound policies and a favorable external environment. Real GDP grew by 3.7 percent in 2004, and 3.5 percent in the first quarter of 2005. The fairly broad-based expansion was mainly driven by strong final domestic demand, fueled by growing disposable income, a large reduction in interest rates, and wealth effects arising from rising housing and stock prices. The rapid expansion in economic activity led to some increase in employment, contributing to reduce the unemployment rate to 26.2 percent in September 2004, some 4 percentage points lower than two years earlier. Subsequently, employment continued to grow but not sufficiently to offset the impact of a growing labor force, and the unemployment rate rose marginally to 26.5 percent by March 2005.
1 Under Article IV of the IMF's Articles of Agreement, the IMF holds bilateral discussions with members, usually every year. A staff team visits the country, collects economic and financial information, and discusses with officials the country's economic developments and policies. On return to headquarters, the staff prepares a report, which forms the basis for discussion by the Executive Board. At the conclusion of the discussion, the Managing Director, as Chairman of the Board, summarizes the views of Executive Directors, and this summary is transmitted to the country's authorities.
International Monetary Fund 700 19th Street, NW Washington, D. C. 20431 USA

- 2 -
CPIX inflation has remained within the official 3–6 percent target band since September 2003; it fell to the lower end of the target in February 2005, before edging up to 3.5 percent in June 2005.2 During 2004, the continued strengthening of the rand helped contain inflationary pressures and softened the impact of higher oil prices. Expected CPIX inflation for 2005 and 2006 has been within the target band since late 2004. Growth in broad money and bank credit to the private sector has remained robust.
The South African Reserve Bank (SARB) has maintained its flexible exchange rate policy while building up international reserves. Gross international reserves increased from the equivalent of 70 percent of short-term external debt at end-2003 to an estimated 178 percent as of end-June 2005. The higher level of reserves and sound macroeconomic policies have contributed to a further decline in sovereign risk spreads.
The rand continued to strengthen in 2004, a process that started in 2002. This appreciation—as that of other commodity-currencies, such as the Australian dollar—was associated with a rise in commodity prices. Also, large capital inflows resulting from strong global appetite for emerging assets, helped support the rand. This pattern was reversed during 2005, however, with the rand depreciating moderately.
The external current account deficit widened to 3.2 percent of GDP in 2004, from 1.5 percent of GDP in 2003, owing to the rapid growth in domestic demand and the strength of the rand. Import volumes grew strongly, exceeding the growth in export volumes, while the terms of trade remained broadly unchanged. The current account deficit was easily financed by capital inflows.
The fiscal deficit fell to 1.5 percent of GDP in FY2004/05, from 2.3 percent of GDP a year earlier, reflecting strong tax revenue performance. Tax revenue rose significantly owing to buoyant domestic demand and greater efficiency in tax collection. An increase in social spending, mainly in the form of targeted grants, was partially offset by the impact of lower domestic interest rates on debt-service payments.
Asset prices rose strongly in 2004 and early 2005. Low domestic interest rates, favorable growth prospects, and improved business confidence pushed the JSE all-share index up by 18 percent in real terms during 2004, and a further 10 percent in the first half of 2005. Also, boosted by falling interest rates and new demand by an emerging black middle class, residential property prices rose by 28 percent in real terms in 2004, and at a lower rate in recent months.
2 The CPIX—the measure targeted by the SARB under its inflation-targeting framework—is equal to the CPI excluding interest payments on mortgage bonds.

- 3 -
Executive Board Assessment
Executive Directors commended the South African authorities for the remarkable economic progress achieved since democratization through sound macroeconomic policies and structural reforms. The economy is now growing strongly, inflation has been lowered and has become more predictable, public finances have been strengthened, and the external position has improved markedly. The expansion in economic activity has created additional jobs. Given South Africa’s position in the region, the country’s strong economic performance has benefited the rest of Africa.
Directors saw South Africa’s near-term economic outlook as favorable. Growth was expected to remain robust owing to low interest rates, a moderately expansionary fiscal policy, and healthy growth in the world economy.
Directors noted that serious economic challenges remain, including persistent high unemployment, widespread poverty, large wealth disparities, and a high incidence of HIV/AIDS. They supported the authorities’ approach to deal with these problems through policies aimed at raising economic growth within a stable macroeconomic environment, combined with targeted initiatives to reduce unemployment and improve social conditions. Directors felt that this strategy could be bolstered by including substantial labor market reforms and further trade liberalization.
Directors agreed that sound fiscal management over the past years had created space for a moderate increase in government expenditure in the period ahead. They supported well-targeted additional spending in the social areas and on infrastructure to help address pressing social needs and enhance the productive capacity of the economy. At the same time, they felt it was important to keep the fiscal deficit at levels that would prevent an undesirable increase in the debt to GDP ratio that would put upward pressure on interest rates. Directors considered that budget documents could usefully expand the coverage of fiscal indicators to include public enterprises that carry potentially significant fiscal risk.
Directors welcomed the authorities’ skillful implementation of monetary policy, which had kept inflation within the target band for about two years. They noted that the inflation targeting regime had gained credibility, as evidenced by the decline in inflation expectations, and thought that continued clear communication with the public, emphasizing inflation as the overriding objective of monetary policy, would further enhance credibility. Directors also considered that targeting inflation at the mid-point of the band over the medium-term would help anchor inflation expectations and increase monetary policy effectiveness. They noted some risks to the inflation outlook, including higher oil prices, a weakening of the rand and a pickup in unit labor costs, and encouraged the authorities to stand ready to adjust interest rates, if needed, to keep inflation within the target band.
- 4 -
Directors noted that the flexible exchange rate system had benefited the country, being an integral element of its inflation targeting regime and facilitating the adjustment of the economy to external shocks. They shared the authorities’ view of seeking competitiveness gains through measures that raise productivity and reduce costs. Directors also supported additional accumulation of international reserves, but noted that reserves could be approaching levels that would make the case for further accumulation less compelling. Looking forward, they observed that further analysis of this issue would be useful. Directors agreed with the gradual relaxation of capital controls, welcomed the advances made in this area in the past year, and felt that further progress in this direction would be beneficial.
Directors regarded the banking system as fundamentally sound. They noted that most of the FSAP’s recommendations were being implemented, which together with other initiatives to enhance the regulatory and supervisory framework would further strengthen the financial sector’s resilience to adverse shocks. They commended the authorities on progress so far in facilitating access of previously disadvantaged groups to banking services. Further advances in implementing the Financial Services Charter and the introduction of a regulatory framework for institutions specialized in basic banking services should help accelerate this process.
Directors stressed that success in reducing unemployment was critical for bolstering support for ongoing reform initiatives. They supported the government’s approach that includes programs to enhance skills and to provide temporary jobs in infrastructure and other projects, as well as measures to foster small business development. They noted, however, that this approach could benefit substantially from a relaxation of restrictive labor market regulations, and encouraged the authorities to consider reducing the scope of centralized collective bargaining, simplifying the minimum-wage structure and moderating minimum-wage adjustments, and further streamlining dismissal procedures.
Directors considered that further trade liberalization and a simplification of the tariff regime would increase productivity and support growth. Efforts could focus on lowering the overall level of protection, harmonizing protection across sectors, reducing the number of tariff bands, and applying ad valorem duties for most items. It would also be important that preferential trade agreements being negotiated be broad-based and non-discriminatory so as to complement multilateral liberalization and limit the potential for trade diversion.
Directors supported the government’s objective of enhancing the efficiency of state-owned enterprises, as this would increase productivity, support infrastructure investment, and reduce the cost of doing business in South Africa. They also consider it useful to keep open the possibility of future privatization under an effective regulatory framework.
Directors agreed that further reducing social and wealth disparities was key for improving the living standards of the entire population, and ensuring a favorable environment for further social and economic progress. They welcomed the advances made with the Broad Based Black Economic Empowerment program. Directors noted that progress with land
- 5 -
reform had been more limited, and felt is was important to address the obstacles to faster progress, while keeping the program grounded on well-defined legal principles. They also noted that continued and firm action against the HIV/AIDS epidemic will help contain the serious social impact of the disease.
Public Information Notices (PINs) form part of the IMF's efforts to promote transparency of the IMF's views and analysis of economic developments and policies. With the consent of the country (or countries) concerned, PINs are issued after Executive Board discussions of Article IV consultations with member countries, of its surveillance of developments at the regional level, of post-program monitoring, and of ex post assessments of member countries with longer-term program engagements. PINs are also issued after Executive Board discussions of general policy matters, unless otherwise decided by the Executive Board in a particular case.

- 6 -
South Africa: Selected Economic Indicators, 2001-05
(Annual change in percent, unless otherwise indicated)
2001 2002 2003 2004 2005
Proj.
Real GDP 2.7 3.6 2.8 3.7 4.3
CPI (metropolitan areas, annual average) 5.7 9.2 5.8 1.4 3.9
CPIX (annual average) 1/ 6.6 9.3 6.8 4.3 4.3
Broad money 2/ 16.5 18.1 12.9 13.1 13.5
Unemployment rate (in percent) 29.5 30.5 28.2 26.2 25.3
National government budget balance (in percent of GDP) 3/ -1.5 -1.2 -2.0 -1.7 -1.9
National government debt (in percent of GDP) 41.4 37.1 35.7 35.8 35.1
External current account balance (in percent of GDP) 0.1 0.7 -1.5 -3.2 -3.7
External debt (in percent of GDP) 26.0 29.5 22.4 19.8 19.1
Gross reserves (SARB, in months of total imports) 2.9 2.8 2.2 3.1 3.7
International liquidity position of SARB (in billions of U.S. dollars) 2/ -4.8 -1.6 4.8 11.4 19.8
U.S. dollar exchange rate (rand per U.S. dollar) 2/ 12.13 8.64 6.64 5.64 ...
Sources: South African Reserve Bank; IMF, International Financial Statistics; and staff estimates and projections.
1/ The CPIX is equal to the CPI excluding interest payments on mortgage bonds.
2/ End of period.
3/ Calendar year.