International Measurement Evaluation Programme: IMEP9, trace elements in water
78
IRMM GE/R/SIM/11/1998 Isotope Measurements Unit December 1998 The International Measurement Evaluation Programme IMEP-10 : Trace elements in polyethylene GRAPHICAL PRESENTATION OF RESULTS REPORT TO PARTICIPANTS L. Van Nevel, E. Poulsen, I. Papadakis and P. Taylor Institute for Reference Materials and Measurements (IRMM) European Commission – JRC Retieseweg, B-2440 GEEL (Belgium)
-
Upload
independent -
Category
Documents
-
view
3 -
download
0
Transcript of International Measurement Evaluation Programme: IMEP9, trace elements in water

IRMM GE/R/SIM/11/1998Isotope Measurements Unit December1998
The International Measurement Evaluation Programme
IMEP-10 : Trace elements in polyethylene
GRAPHICAL PRESENTATION OF RESULTS
REPORT TO PARTICIPANTS
L. Van Nevel, E. Poulsen, I. Papadakis and P. Taylor
Institute for Reference Materials and Measurements (IRMM)
European Commission – JRC
Retieseweg, B-2440 GEEL (Belgium)


IRMM GE/R/SIM/11/1998Isotope Measurements Unit December1998
The International Measurement EvaluationProgramme
IMEP-10 : Trace elements in polyethylene
GRAPHICAL PRESENTATION OF RESULTS
REPORT TO PARTICIPANTS
L. Van Nevel, E. Poulsen, I. Papadakis and P. Taylor
Institute for Reference Materials and Measurements (IRMM)
European Commission – JRC

Retieseweg, B-2440 GEEL (Belgium)

1. Introduction
The International Measurement Evaluation Programme (IMEP) is the tool with which field
laboratories can compare their results against SI traceable values. Unknown samples are sent to
interested laboratories. These laboratories are asked to return a value together with a statement of
uncertainty claiming to contain the "true value". The SI traceable values, expressed as reference
ranges, are established by measurement procedures based on isotope dilution mass spectrometry
(IDMS) applied as a primary method of measurement (CCQM definition [1]). The underlying
philosophy is that the best values, which will serve as reference ranges, are obtained from well
understood measurement processes rather than via a mere consensus approach. Further
characteristics of the IMEP programme are: participating laboratories work under normal conditions
with their choice of techniques, procedures and instrumentation and are requested to report their
results with a realistic combined uncertainty. IMEP is open to all laboratories with full confidentiality
with respect to the results. IMEP is focused on toxic and essential elements in "real life" samples.
IMEP graphically displays reference values and results from participating laboratories but
conclusions are to be drawn by the laboratories themselves. Support can be offered after the
measurement round.
IMEP is co-ordinated from IRMM. The establishment of reference values (a time-consuming and
expensive exercise) is done in collaboration with several laboratories worldwide, which can
demontrate a record of successful applications of IDMS as a primary method of measurement.
IMEP is complementary to collaborative studies and proficiency testing schemes, the latter having a
weaker metrological basis but higher frequency.
This report presents all participants’ results (in graphical form) obtained in IMEP-round 10 : trace
elements in polyethylene. Participants could measure the content of As, Br, Cd, Cl, Cr, Hg, Pb and
S.
This round was organized because of the general interest in the polymer producing and processing
industry. Moreover, there was a specific need in view of the EC-directive 94/62/EC on packaging
and packaging waste which regulates the amounts of heavy metals, more specifically Cd, Cr, Hg and
Pb in packaging material.

2. IMEP-10 : “Trace elements in polyethylene”
2.1 Material
The material used in this round was a polyethylene material, type HDPE Lupolen K 1800 S (BASF
AG) which was doped by BASF following the instructions of IRMM/DSM with several elements
e.g. As (oxide), Cd (oxide), Cr(IV-oxide), Hg(I-sulphate) and Pb(chromate), halogens (Br,Cl-
phtalocyanine green) and S (sulphate). No UV and thermal stabilizers were added but it contained
significant amounts of Ti (as optical withener). The additives were first mixed with the PE into a
‘master batch’ (a highly concentrated batch) and this batch was diluted with PE. The material was
extruded and cut to a granulate. It consisted of small mm-large grains, each with a weight of about
10 mg. It was mixed at IRMM using tubula-mixing and was stored in a large plastic container at –
20ºC until it was packed in sealed glass amber bottles containing 50 g sample.
The homogeneity was studied using ICP-MS. From these ICP-MS results, at a 100 mg level the
relative uncertainty due to homogeneity was found to be : for Cd 4.9 % and for Pb 1.4% [2].
2.2. Participation in IMEP-10.
Each IMEP-10 participant received one bottle of sample together with a questionnaire (addendum
1) and a report form (addendum 2).
Results were returned by 34 participants from 15 countries. A distribution of the participants as a
function of the country is given in Table 1. Close collaboration with the Swiss regional co-ordinator
resulted in the participation of 10 Swiss laboratories.

Table 1 Country of origin of the reporting IMEP-10 participants
COUNTRY NUMBER OFPARTICIPANTS
AUSTRIA 3BELGIUM 2CYPRUS 1FINLAND 2GERMANY 3ISRAEL 1ITALY 1LUXEMBOURG 1POLAND 1SLOVAK REPUBLIC 1SLOVAKIA 2SWEDEN 2SWITZERLAND 10THE NETHERLANDS 3UNITED KINGDOM 1
TOTAL 34
2.3. Establishment of the certified and the assigned values
In IMEP, the aim is to establish SI-traceable reference values. As mentioned in the introduction, this
is done using a primary method of measurement. In such cases, and when the work is supported by
a thorough estimate of the combined uncertainty, the values are denoted as “certified”. When the
reference value has been established with another method or combination of methods, the term
“assigned value” is used.
Short description of the methods used
Isotope Dilution Mass Spectrometry (IDMS)IDMS has the potential to be a primary method of measurement if well applied. The technique is
based on the measurement of isotope amount ratios for the element concerned. A known amount of
sample with known isotopic composition for the element is mixed with a material (spike) where the
element of interest is present in a different isotopic composition. Once isotopic homogeneity has
been established for the mix (blend), minor losses in the subsequent sample preparation do not affect

the result. For a spike with known amount content and known isotopic composition, the amount
content (cx) of the element in the sample is determined from a measurement of the blend ratio, RB
and calculated from the IDMS equation (below) where m denotes mass (kg), c is the amount
content of the element (mol·kg-1), RB is the isotope amount ratio n(iM)/n(jM) where n denotes
chemical amount (in mol). Index x refers to the sample and index y to the spike.
As can be seen, this equation does not contain factors for instrument sensitivity, which makes it very
robust. Mass discrimination effects can be corrected for by measurements on reference materials
with known isotopic composition, preferably close to that of RB.
The isotope amount ratios are measured with a mass spectrometer. The most commonly applied
techniques to generate ions in inorganic mass spectrometry are thermal ionisation mass spectrometry
(TIMS) and inductively coupled plasma mass spectrometry (ICP-MS). In TIMS, the sample is
loaded onto a metal filament. Heating the filament in the ion source induces ion formation from the
solid or molten sample. In ICP-MS, the sample is normally introduced as a solution. After removal
of solvent, ions are formed from the atomised salt particles in a plasma, typically at temperatures
around 8000 K.
Neutron Activation Analysis (NAA)NAA is an analytical method based on gamma spectrometric measurements of samples irradiated
with neutrons in a nuclear reactor. The capture of a neutron in a stable isotope may lead to the
immediate emission of a γ-ray and the formation of a γ−emitter isotope and the corresponding
γ−emission is measured.
Classical NAA is based on comparison of activities of the unknown sample and a known standard
co-irradiated under similar conditions. This approach eliminates the need for accurate determination
of neutron fluxes and detector calibration. The required measurements are the relative specific γ-
emission of the activity products in the sample and in the standard, measured in the same counting
position. The major drawback is the need of one standard per element concentration to be
determined.
iy
ix
x
yy
xB
Byx R
Rm
mc
RR
RRc
∑∑
⋅⋅
⋅−
−=

The k0-standardisation NAA method was developed in the 1970:s and allows the determination of
elemental concentrations in the sample without the use of mono- or multi-element calibrants.[3] The
method is more flexible but subtle to implement and requires accurate knowledge of,
• the neutron flux parameters - the thermal to epithermal flux ratio and the deviation from
the ideal epithermal neutron flux distribution,
• the characteristics of the gamma spectrometry detector (cf. detection efficiency, peak-to-
total ratio, gamma coincidence corrections, detailed information of the geometry and
composition of the detector),
• tabulated fundamental physical constants, known as k0-factors, proportional to molar
mass, natural abundance, gamma ray intensities and cross sections.
Depending on the half-live of the isotope of interest, different irradiation-cooling (or decay) and
measurement schemes can be used.
Certified and assigned values
In IMEP-10, 8 elements (As, Br, Cd, Cl, Cr, Hg, Pb and S) were under investigation.
Certified values were established for lead, cadmium, chromium and mercury by IDMS while k0-
NAA was used to obtain assigned values for arsenic, chlorine and bromine. To establish the
assigned value for sulfur, data obtained by various methods were combined (k0-NAA, IC and ICP)
[4]. The certified and assigned values are summarized in table 2. The stated uncertainties are
expanded uncertainties, U, with a coverage factor, k, equal to 2. The uncertainties were evaluated
according to recently published international documents.[5,6].

Table 2. Certified and assigned values, amount content, for the elements in IMEP-10. The respective uncertainty isan expanded uncertainty, ±U, with a coverage factor, k, equal to 2.
ElementReference value
Amount content ± U
in mmol·kg-1
Method applied Referencevalue is
As 0.128 3 ± 0.007 6 k0-NAA Assigned
Br 3.50 ± 0.30 k0-NAA Assigned
Cd 1.065 ± 0.056 IDMS Certified
Cl 8.01 ± 0.86 k0-NAA Assigned
Cr 1.94 ± 0.11 IDMS Certified
Hg 0.044 ± 0.013 IDMS Certified
Pb 0.470 ± 0.021 IDMS Certified
S 6.4 ± 1.3 k0-NAA,IC,ICP Assigned
2.4 Data collection and evaluation
All results were reported in the same unit (µmol·kg-1). From the questionnaire, it could be concluded
that the majority of participants analysed the sample under routine conditions. . About 70 % of the
participants analyse less than 25 samples of this type a year. From the 8 elements under investigation
in this IMEP-10 round, the participants were free to measure the content of those elements only
which were of interest to their laboratory Twenty one participants are measuring routinely less than
5 elements in this matrix and 11 participants are normally measuring up to 10 elements. In IMEP-10
toxic elements as cadmium, chromium and lead have been measured by almost all participants.
Some participants reported values for the same element obtained by different methods and these
values were inserted in the database as different results. For graphical presentation, the methods
have been grouped as shown in table 3. The number of participants for each element and method is
given in table 4.

Table 3 Grouping of the analytical methods used by participants in IMEP-10
Method Acronym Methodgroup
Cold Vapour-atomic absorption spectrometry CV-AAS CV-AASElectrothermal atomic absorption spectrometry ETAASGraphite furnace atomic absorption spectrometry GF-AAS
ET-AAS
Flame atomic absorption spectrometry FAAS F-AASFlame atomic absorption spectrometry-Mercury/HydrideSystem
FAAS-MHS
Flow injection analysis system-atomic absorption spectrometry FIAS-AASHydride-atomic absorption spectrometry H-AAS
F-AAS-Hydride
Ion chromatography IC ICInductively coupled plasma-atomic emission spectrometry ICP-AESInductively coupled plasma-optical emission spectrometry ICP-OES
ICP-ES
High resolution - inductively coupled plasma - massspectrometry
HR-ICP-MS
Inductively coupled plasma-mass spectrometry ICP-MSICP-MS
Isotope dilution-inductively coupled plasma-mass spectrometry ID-ICP-MS ID-ICP-MS
Infrared spectrometry IRInfrared / Leco furnace IR/Leco
IR
Coulometric analysis COUDifferential pulse polarography DPPFlame atomic fluorescence spectrometry FAFSGold amalgamator / UV-detection GAUVIon selective electrode ISENeutron-activation analysis NAAX-ray fluorescence XRFOther OTHER
OTHER

Table 4. Number of participants for the various methods and elements
ElementsMethod As Br Cd Cl Cr Hg Pb SCV-AAS 4ET-AAS 5 4 5 1 9F-AAS 11 7 1 8
F-AAS-Hydride 5 5IC 5 6 3
ICP-ES 3 9 10 1 7 1ICP-MS 10 3 10 1 11 7 10
ID-ICP-MS 1 1IR 2
OTHER 2 3 3 2 2 5 1 4Number of
results25 11 38 9 35 24 36 10
Based on the answers given in the questionnaire, the results obtained for each element are grouped
according to the following criteria e.g. degree of the laboratories’ self-declared experience,
accreditation -authorisation -certification status of the laboratory for the element under
investigation and the use of a quality assurance system. For each set of data, the results are
plotted together with the reference range and all results are included in the graphs. The scale of the
graphs, ± 50 % deviation from the middle of the reference range is chosen for convenience. All
results outside this range are presented in textboxes on the graph. Only for the element lead, the
scale was slightly modified to +20%/-100% deviation from the middle of the reference range. Table
5 gives a summary of the graphs which can be found in annex. In annex the graphs are presented
per element. The regional Swiss graphs are presented as a separate selection.
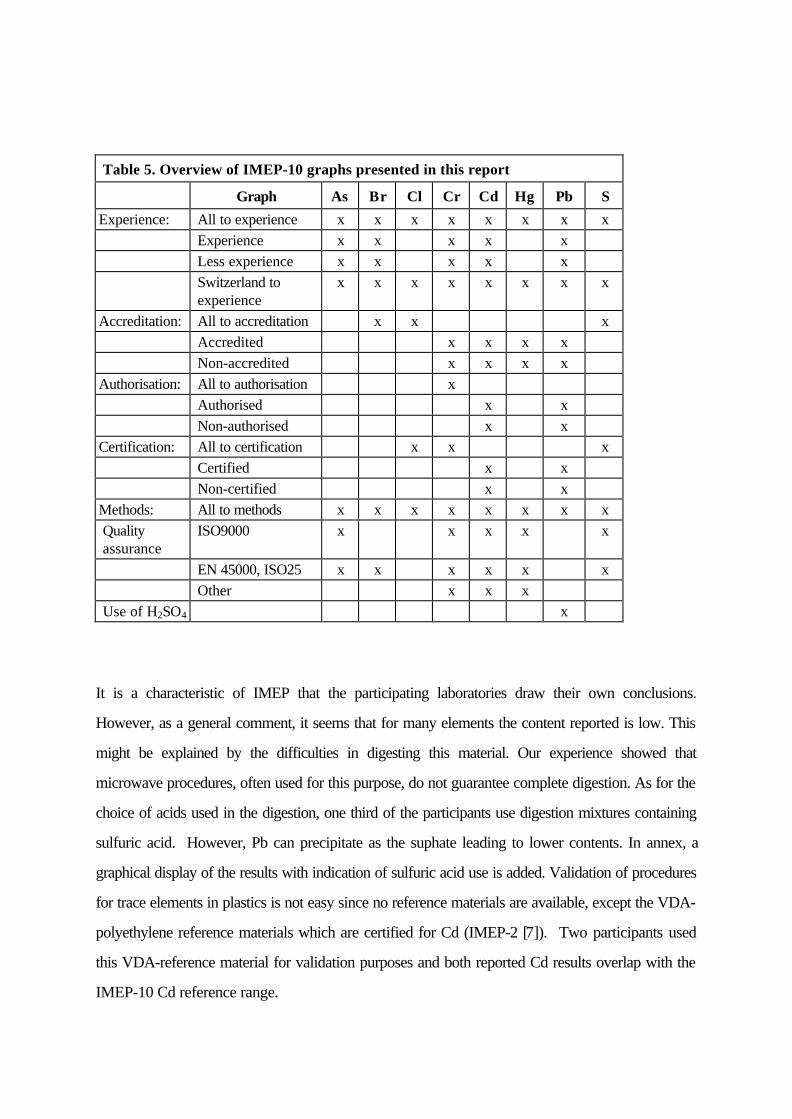
Table 5. Overview of IMEP-10 graphs presented in this report
Graph As Br Cl Cr Cd Hg Pb S
Experience: All to experience x x x x x x x xExperience x x x x xLess experience x x x x xSwitzerland toexperience
x x x x x x x x
Accreditation: All to accreditation x x xAccredited x x x xNon-accredited x x x x
Authorisation: All to authorisation xAuthorised x xNon-authorised x x
Certification: All to certification x x xCertified x xNon-certified x x
Methods: All to methods x x x x x x x xQualityassurance
ISO9000 x x x x x
EN 45000, ISO25 x x x x x xOther x x x
Use of H2SO4 x
It is a characteristic of IMEP that the participating laboratories draw their own conclusions.
However, as a general comment, it seems that for many elements the content reported is low. This
might be explained by the difficulties in digesting this material. Our experience showed that
microwave procedures, often used for this purpose, do not guarantee complete digestion. As for the
choice of acids used in the digestion, one third of the participants use digestion mixtures containing
sulfuric acid. However, Pb can precipitate as the suphate leading to lower contents. In annex, a
graphical display of the results with indication of sulfuric acid use is added. Validation of procedures
for trace elements in plastics is not easy since no reference materials are available, except the VDA-
polyethylene reference materials which are certified for Cd (IMEP-2 [7]). Two participants used
this VDA-reference material for validation purposes and both reported Cd results overlap with the
IMEP-10 Cd reference range.
Acknowledgements
IMEP runs under the support and auspices of IUPAC, EURACHEM, EUROMET and CITAC.
For this IMEP-10 round, the authors would like to express their gratitude to Dr. A. Lamberty, Dr.
G. Kramer, Dr. W. Van Borm (DSM-The Netherlands), Dr. A. Dobney., Mrs. B. Dijckmans, Dr.
H. Felber (EMPA-Switzerland), Dr. K.H.Grobecker, Dr. P. Robouch, Dr. G. Arana, Mrs. I. Dams
and Prof. P. De Bièvre for all the advise, help and assistance they offered throughout this project.
References
1. Comité Consultatif pour la Quantité de Matière (CCQM), Report of the 1st Meeting, ed. By BIPM, Sèvres, Cedex, France 1995.2. Project SMT4-CT95-2034, PERM, Progress report 1, Part A, by Dr. W. Van Borm, DSM Research, Geleen, The Netherlands.3. F. De Corte, L. Moens, S. Jovanovic, A. Simonits and A. De Wispelaere, J. Radioanal. Nucl. Chem., 1986, 102, 37.4. A. Dobney, Internal report, GE/R/SIM/50/975. Guide to the Expression of Uncertainty in Measurement, ISO, Geneva, 1993.6. Quantifying Uncertainty in Analytical Measurement, EURACHEM Secretariat, Queens Road, Teddington, Middlesex, TW11 0LY, England, 1995.7. A. Lamberty, P. De Bièvre and A. Götz, Fresenius J. Anal. Chem (1993)345 : 310-313

As• All reported results arranged in ascending order (self-declared
experience indicated)
• Results from experienced laboratories (self-declaration)
• Results from less-experienced laboratories (self-declaration)
• All reported results arranged according to the analytical methodused
• Results from participants in compliance with EN4500 and/orISO 25 (self-declaration)
• Results from participants in compliance with ISO 9000 (self-declaration)


0.064
0.079
0.094
0.109
0.124
0.139
0.154
0.169
0.184
c
m
mol
·kg-1
-50
-40
-30
-20
-10
0
10
20
30
40
50
Dev
iatio
n fr
om m
iddl
e of
ass
igne
d ra
nge
in %
Experienced laboratory (self-declaration)Less experienced laboratory (self-declaration)Non experienced laboratory (self-declaration)No statement by laboratory
As
Results from all participants.
IMEP- 10 : Trace Elements in Polyethylene Assigned range [U =k ·u c (k =2)]: 0.1207 - 0.1359 mmol·kg-1
Less experiencedAmount content Uncertainty Deviation
(in %)0.0136 0.0009 -89
0.064
0.079
0.094
0.109
0.124
0.139
0.154
0.169
0.184
c
m
mol
·kg-1
-50
-40
-30
-20
-10
0
10
20
30
40
50
Dev
iatio
n fr
om m
iddl
e of
ass
igne
d ra
nge
in %
As
Results from experienced (self-declaration) participants.
IMEP- 10 : Trace Elements in Polyethylene Assigned range [U =k ·u c (k =2)]: 0.1207 - 0.1359 mmol·kg-1

0.064
0.079
0.094
0.109
0.124
0.139
0.154
0.169
0.184
c
m
mol
·kg-1
-50
-40
-30
-20
-10
0
10
20
30
40
50
Dev
iatio
n fr
om m
iddl
e of
ass
igne
d ra
nge
in %
As
Results from less experienced (self-declaration, including no statement and non-experienced) participants.
IMEP- 10 : Trace Elements in Polyethylene Assigned range [U =k ·u c (k =2)]: 0.1207 - 0.1359 mmol·kg-1
Amount content Uncertainty Deviation
(in %)0.0136 0.0009 -89
0.064
0.079
0.094
0.109
0.124
0.139
0.154
0.169
0.184
c
m
mol
·kg-1
-50
-40
-30
-20
-10
0
10
20
30
40
50
Dev
iatio
n fr
om m
iddl
e of
ass
igne
d ra
nge
in %
ET-AAS F-AAS-HYDRIDE ICP-MS ICP-ES OTHERAs
Results from all participants, arranged by methods.
IMEP- 10 : Trace Elements in Polyethylene Assigned range [U =k ·u c (k =2)]: 0.1207 - 0.1359 mmol·kg-1
Method Amount content Uncertainty Deviation
(in %)F-AAS-Hydride 0.0136 0.0009 -89

0.064
0.079
0.094
0.109
0.124
0.139
0.154
0.169
0.184
c
m
mol
·kg-1
-50
-40
-30
-20
-10
0
10
20
30
40
50
Dev
iatio
n fr
om m
iddl
e of
ass
igne
d ra
nge
in %
As
Results from participants in compliance with EN45000 and/or ISO25 (self-declaration).
IMEP- 10 : Trace Elements in Polyethylene Assigned range [U =k ·u c (k =2)]: 0.1207 - 0.1359 mmol·kg-1
Amount content Uncertainty Deviation
(in %)0.0136 0.0009 -89
0.064
0.079
0.094
0.109
0.124
0.139
0.154
0.169
0.184
c
m
mol
·kg-1
-50
-40
-30
-20
-10
0
10
20
30
40
50
Dev
iatio
n fr
om m
iddl
e of
ass
igne
d ra
nge
in %
As
Results from participants in compliance with ISO9000 (self-declaration).
IMEP- 10 : Trace Elements in Polyethylene Assigned range [U =k ·u c (k =2)]: 0.1207 - 0.1359 mmol·kg-1

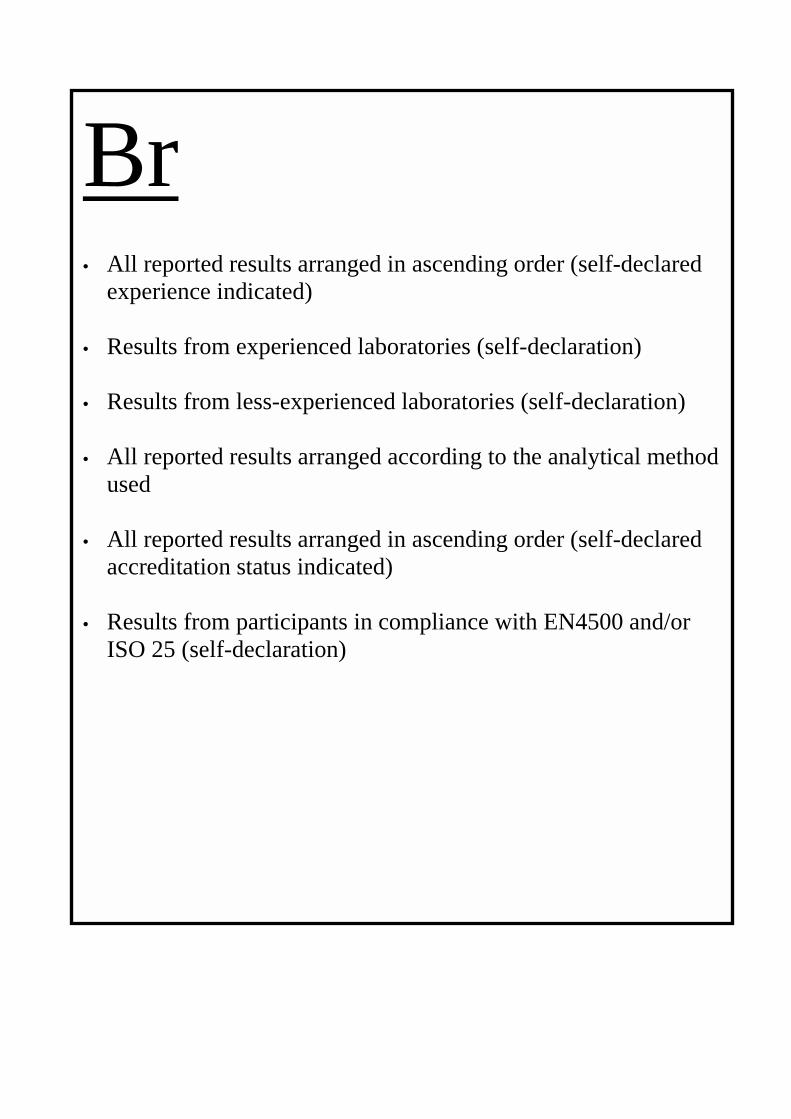
Br• All reported results arranged in ascending order (self-declared
experience indicated)
• Results from experienced laboratories (self-declaration)
• Results from less-experienced laboratories (self-declaration)
• All reported results arranged according to the analytical methodused
• All reported results arranged in ascending order (self-declaredaccreditation status indicated)
• Results from participants in compliance with EN4500 and/orISO 25 (self-declaration)


1.75
2.00
2.25
2.50
2.75
3.00
3.25
3.50
3.75
4.00
4.25
4.50
4.75
5.00
5.25
c
m
mol
·kg-1
-50
-40
-30
-20
-10
0
10
20
30
40
50
Dev
iatio
n fr
om m
iddl
e of
ass
igne
d ra
nge
in %
Experienced laboratory (self-declaration)
Less experienced laboratory (self-declaration)Br
Results from all participants.
IMEP- 10 : Trace Elements in Polyethylene Assigned range [U =k ·u c (k =2)]: 3.20 - 3.80 mmol·kg-1
Less experiencedAmount content
< 0.25
1.75
2.00
2.25
2.50
2.75
3.00
3.25
3.50
3.75
4.00
4.25
4.50
4.75
5.00
5.25
c
m
mol
·kg-1
-50
-40
-30
-20
-10
0
10
20
30
40
50
Dev
iatio
n fr
om m
iddl
e of
ass
igne
d ra
nge
in %Br
Results from experienced (self-declaration) participants.
IMEP- 10 : Trace Elements in Polyethylene Assigned range [U =k ·u c (k =2)]: 3.20 - 3.80 mmol·kg-1

1.75
2.00
2.25
2.50
2.75
3.00
3.25
3.50
3.75
4.00
4.25
4.50
4.75
5.00
5.25
c
m
mol
·kg-1
-50
-40
-30
-20
-10
0
10
20
30
40
50
Dev
iatio
n fr
om m
iddl
e of
ass
igne
d ra
nge
in %Br
Results from less experienced (self-declaration) participants.
IMEP- 10 : Trace Elements in Polyethylene Assigned range [U =k ·u c (k =2)]: 3.20 - 3.80 mmol·kg-1
Amount content< 0.25
1.75
2.00
2.25
2.50
2.75
3.00
3.25
3.50
3.75
4.00
4.25
4.50
4.75
5.00
5.25
c
m
mol
·kg-1
-50
-40
-30
-20
-10
0
10
20
30
40
50
Dev
iatio
n fr
om m
iddl
e of
ass
igne
d ra
nge
in %
ICP-MS IC OTHERBr
Results from all participants, arranged by methods.
IMEP- 10 : Trace Elements in Polyethylene Assigned range [U =k ·u c (k =2)]: 3.20 - 3.80 mmol·kg-1
Method Amount content
IC < 0.25

1.75
2.00
2.25
2.50
2.75
3.00
3.25
3.50
3.75
4.00
4.25
4.50
4.75
5.00
5.25
c
m
mol
·kg-1
-50
-40
-30
-20
-10
0
10
20
30
40
50
Dev
iatio
n fr
om m
iddl
e of
ass
igne
d ra
nge
in %Br
Results from participants in compliance with EN45000 and/or ISO25 (self-declaration).
IMEP- 10 : Trace Elements in Polyethylene Assigned range [U =k ·u c (k =2)]: 3.20 - 3.80 mmol·kg-1
Amount content< 0.25
1.75
2.00
2.25
2.50
2.75
3.00
3.25
3.50
3.75
4.00
4.25
4.50
4.75
5.00
5.25
c
m
mol
·kg-1
-50
-40
-30
-20
-10
0
10
20
30
40
50
Dev
iatio
n fr
om m
iddl
e of
ass
igne
d ra
nge
in %
Accredited laboratory (self-declaration)
Non accredited (self-declaration) or no statementBr
Results from all participants.
IMEP- 10 : Trace Elements in Polyethylene Assigned range [U =k ·u c (k =2)]: 3.20 - 3.80 mmol·kg-1
AccreditedAmount content
< 0.25


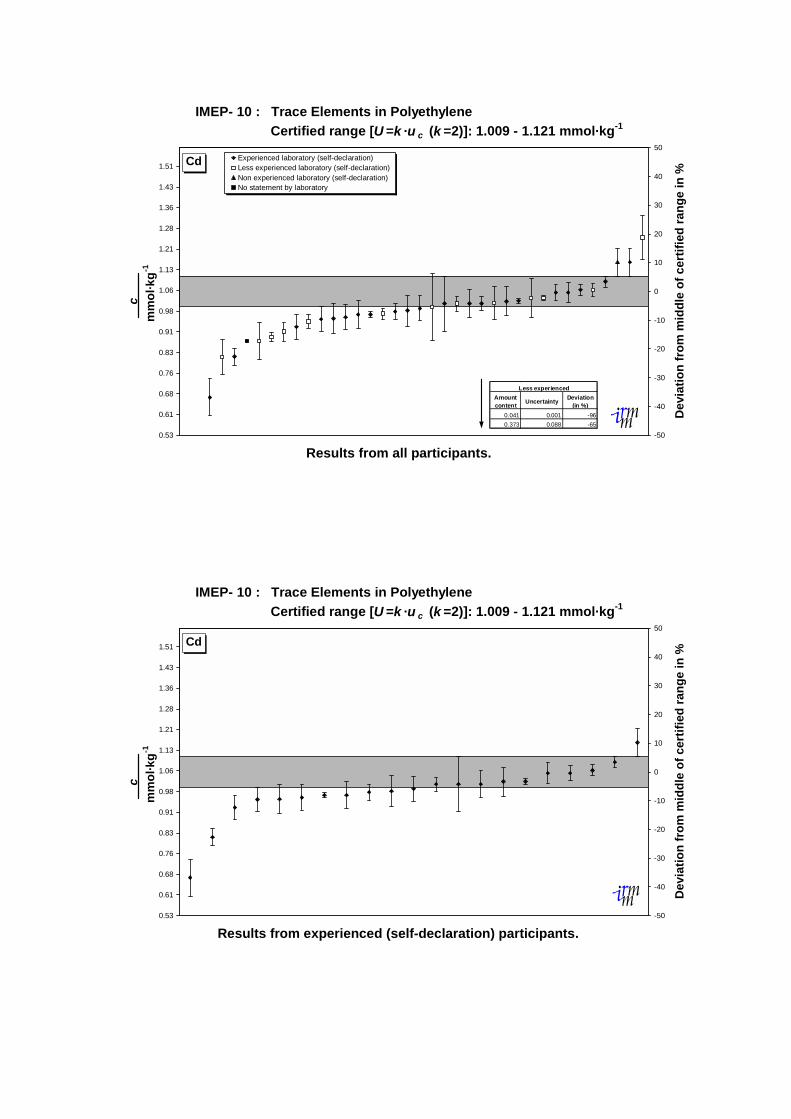
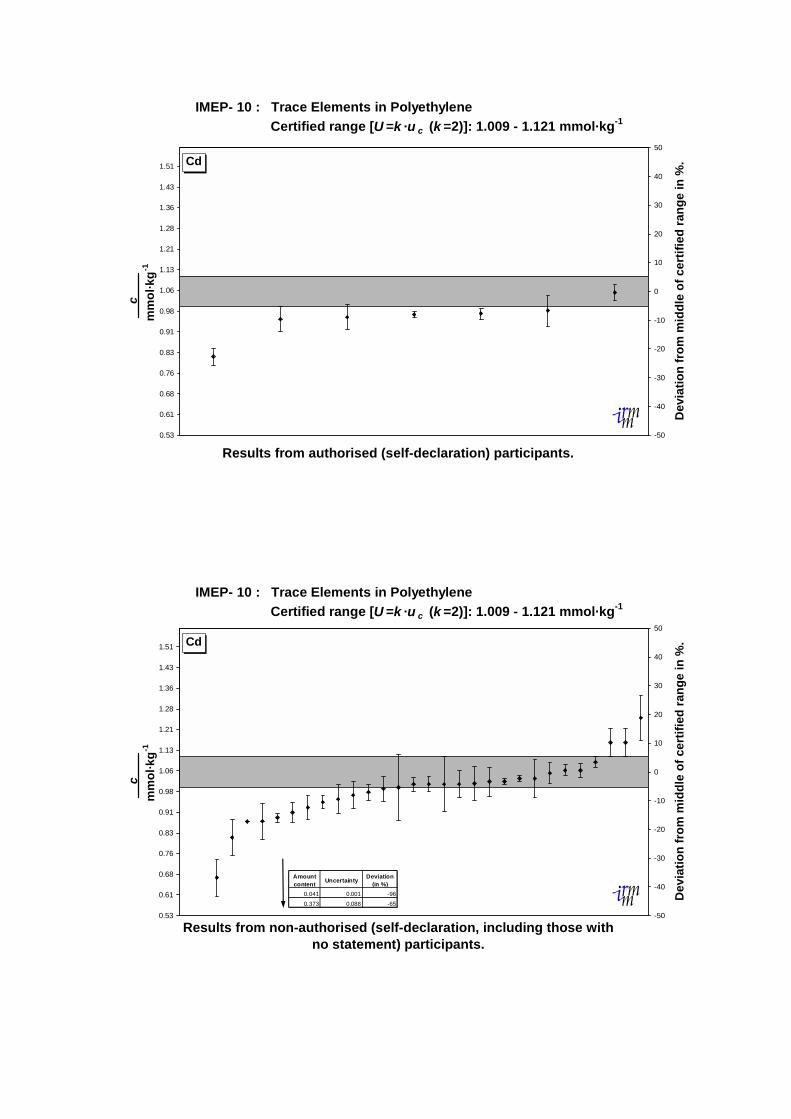
Cd• All reported results arranged in ascending order (self-declared
experience indicated)
• Results from experienced laboratories (self-declaration)
• Results from less-experienced laboratories (self-declaration)
• All reported results arranged according to the analytical methodused
• Results from accredited laboratories (self-declaration)
• Results from non-accredited laboratories (self-declaration)
• Results from authorised laboratories (self-declaration)
• Results from non-authorised laboratories (self-declaration)
• Results from certified laboratories (self-declaration)
• Results from non-certified laboratories (self-declaration)
• Results from participants in compliance with EN4500 and/orISO 25 (self-declaration)
• Results from participants in compliance with ISO 9000 (self-declaration)
• Results from participants operating quality systems other thanEN4500, ISO 25 and/or ISO9000(self-declaration)

0.53
0.61
0.68
0.76
0.83
0.91
0.98
1.06
1.13
1.21
1.28
1.36
1.43
1.51
c
m
mol
·kg-1
-50
-40
-30
-20
-10
0
10
20
30
40
50
Dev
iatio
n fr
om m
iddl
e of
cer
tifie
d ra
nge
in %
Experienced laboratory (self-declaration)Less experienced laboratory (self-declaration)Non experienced laboratory (self-declaration)No statement by laboratory
Cd
Results from all participants.
IMEP- 10 : Trace Elements in Polyethylene Certified range [U =k ·u c (k =2)]: 1.009 - 1.121 mmol·kg-1
Less experiencedAmount content Uncertainty Deviation
(in %)0.041 0.001 -960.373 0.088 -65
0.53
0.61
0.68
0.76
0.83
0.91
0.98
1.06
1.13
1.21
1.28
1.36
1.43
1.51
c
m
mol
·kg-1
-50
-40
-30
-20
-10
0
10
20
30
40
50
Dev
iatio
n fr
om m
iddl
e of
cer
tifie
d ra
nge
in %
Cd
Results from experienced (self-declaration) participants.
IMEP- 10 : Trace Elements in Polyethylene Certified range [U =k ·u c (k =2)]: 1.009 - 1.121 mmol·kg-1

0.53
0.61
0.68
0.76
0.83
0.91
0.98
1.06
1.13
1.21
1.28
1.36
1.43
1.51
c
m
mol
·kg-1
-50
-40
-30
-20
-10
0
10
20
30
40
50
Dev
iatio
n fr
om m
iddl
e of
cer
tifie
d ra
nge
in %
Cd
Results from less experienced (self-declaration, including no statement and non-experienced) participants.
IMEP- 10 : Trace Elements in Polyethylene Certified range [U =k ·u c (k =2)]: 1.009 - 1.121 mmol·kg-1
Amount content Uncertainty Deviation
(in %)0.041 0.001 -960.373 0.088 -65
0.53
0.61
0.68
0.76
0.83
0.91
0.98
1.06
1.13
1.21
1.28
1.36
1.43
1.51
c
m
mol
·kg-1
-50
-40
-30
-20
-10
0
10
20
30
40
50
Dev
iatio
n fr
om m
iddl
e of
cer
tifie
d ra
nge
in %
.ET-AAS F-AAS ICP-MS ID-ICP-MS ICP-ES OTHERCd
Results from all participants, arranged by methods.
IMEP- 10 : Trace Elements in Polyethylene Certified range [U =k ·u c (k =2)]: 1.009 - 1.121 mmol·kg-1
Method Amount content Uncertainty Deviation
(in %)F-AAS 0.373 0.088 -65
ICP-MS 0.041 0.001 -96

0.53
0.61
0.68
0.76
0.83
0.91
0.98
1.06
1.13
1.21
1.28
1.36
1.43
1.51
c
m
mol
·kg-1
-50
-40
-30
-20
-10
0
10
20
30
40
50
Dev
iatio
n fr
om m
iddl
e of
cer
tifie
d ra
nge
in %
.Cd
Results from accredited (self-declaration) participants.
IMEP- 10 : Trace Elements in Polyethylene Certified range [U =k ·u c (k =2)]: 1.009 - 1.121 mmol·kg-1
Amount content Uncertainty Deviation
(in %)0.041 0.001 -960.373 0.088 -65
0.53
0.61
0.68
0.76
0.83
0.91
0.98
1.06
1.13
1.21
1.28
1.36
1.43
1.51
c
m
mol
·kg-1
-50
-40
-30
-20
-10
0
10
20
30
40
50
Dev
iatio
n fr
om m
iddl
e of
cer
tifie
d ra
nge
in %
.Cd
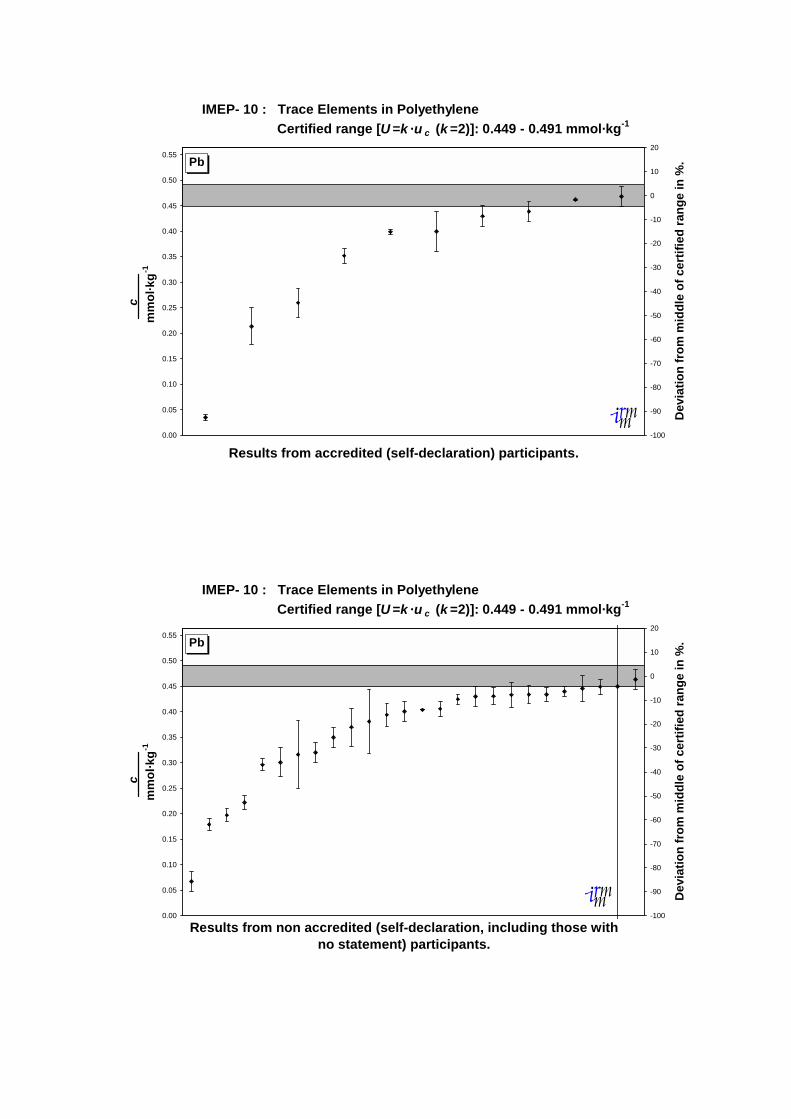
Results from non accredited (self-declaration, including those with no statement) participants.
IMEP- 10 : Trace Elements in Polyethylene Certified range [U =k ·u c (k =2)]: 1.009 - 1.121 mmol·kg-1
0.53
0.61
0.68
0.76
0.83
0.91
0.98
1.06
1.13
1.21
1.28
1.36
1.43
1.51
c
m
mol
·kg-1
-50
-40
-30
-20
-10
0
10
20
30
40
50
Dev
iatio
n fr
om m
iddl
e of
cer
tifie
d ra
nge
in %
.Cd
Results from non-authorised (self-declaration, including those with no statement) participants.
IMEP- 10 : Trace Elements in Polyethylene Certified range [U =k ·u c (k =2)]: 1.009 - 1.121 mmol·kg-1
Amount content Uncertainty Deviation
(in %)0.041 0.001 -960.373 0.088 -65
0.53
0.61
0.68
0.76
0.83
0.91
0.98
1.06
1.13
1.21
1.28
1.36
1.43
1.51
c
m
mol
·kg-1
-50
-40
-30
-20
-10
0
10
20
30
40
50
Dev
iatio
n fr
om m
iddl
e of
cer
tifie
d ra
nge
in %
.Cd
Results from authorised (self-declaration) participants.
IMEP- 10 : Trace Elements in Polyethylene Certified range [U =k ·u c (k =2)]: 1.009 - 1.121 mmol·kg-1

0.53
0.61
0.68
0.76
0.83
0.91
0.98
1.06
1.13
1.21
1.28
1.36
1.43
1.51
c
m
mol
·kg-1
-50
-40
-30
-20
-10
0
10
20
30
40
50
Dev
iatio
n fr
om m
iddl
e of
cer
tifie
d ra
nge
in %
.Cd
Results from certified (self-declaration) participants.
IMEP- 10 : Trace Elements in Polyethylene Certified range [U =k ·u c (k =2)]: 1.009 - 1.121 mmol·kg-1
Amount content Uncertainty Deviation
(in %)0.041 0.001 -960.373 0.088 -65
0.53
0.61
0.68
0.76
0.83
0.91
0.98
1.06
1.13
1.21
1.28
1.36
1.43
1.51
c
m
mol
·kg-1
-50
-40
-30
-20
-10
0
10
20
30
40
50
Dev
iatio
n fr
om m
iddl
e of
cer
tifie
d ra
nge
in %
.Cd
Results from non-certified (self-declaration, including those with no statement) participants.
IMEP- 10 : Trace Elements in Polyethylene Certified range [U =k ·u c (k =2)]: 1.009 - 1.121 mmol·kg-1

0.53
0.61
0.68
0.76
0.83
0.91
0.98
1.06
1.13
1.21
1.28
1.36
1.43
1.51
c
m
mol
·kg-1
-50
-40
-30
-20
-10
0
10
20
30
40
50
Dev
iatio
n fr
om m
iddl
e of
cer
tifie
d ra
nge
in %
Cd
Results from participants in compliance with EN45000 and/or ISO25 (self-declaration).
IMEP- 10 : Trace Elements in Polyethylene Certified range [U =k ·u c (k =2)]: 1.009 - 1.121 mmol·kg-1
Amount content Uncerta inty Deviation
(in %)0.041 0.001 -960.373 0.088 -65
0.53
0.61
0.68
0.76
0.83
0.91
0.98
1.06
1.13
1.21
1.28
1.36
1.43
1.51
c
m
mol
·kg-1
-50
-40
-30
-20
-10
0
10
20
30
40
50
Dev
iatio
n fr
om m
iddl
e of
cer
tifie
d ra
nge
in %
Cd
Results from participants in compliance with ISO9000 (self-declaration).
IMEP- 10 : Trace Elements in Polyethylene Certified range [U =k ·u c (k =2)]: 1.009 - 1.121 mmol·kg-1
Amount content Uncertainty Deviation
(in %)0.041 0.001 -960.373 0.088 -65

0.53
0.61
0.68
0.76
0.83
0.91
0.98
1.06
1.13
1.21
1.28
1.36
1.43
1.51
c
m
mol
·kg-1
-50
-40
-30
-20
-10
0
10
20
30
40
50
Dev
iatio
n fr
om m
iddl
e of
cer
tifie
d ra
nge
in %
Cd
Results from participants operating quality systems other than EN45000, ISO25 and/or ISO9000 (self-declaration).
IMEP- 10 : Trace Elements in Polyethylene Certified range [U =k ·u c (k =2)]: 1.009 - 1.121 mmol·kg-1


Cl• All reported results arranged in ascending order (self-declared
experience indicated)
• All reported results arranged according to the analytical methodused
• All reported results arranged in ascending order (self-declaredaccreditation status indicated)
• All reported results arranged in ascending order (self-declaredcertification status indicated)


4.01
4.76
5.51
6.26
7.01
7.76
8.51
9.26
10.01
10.76
11.51
c
m
mol
·kg-1
-50
-40
-30
-20
-10
0
10
20
30
40
50
Dev
iatio
n fr
om m
iddl
e of
ass
igne
d ra
nge
in %
Experienced laboratory (self-declaration)Less experienced laboratory (self-declaration)
Cl
Results from all participants.
IMEP- 10 : Trace Elements in Polyethylene Assigned range [U =k ·u c (k =2)]: 7.15 - 8.87 mmol·kg-1
4.01
4.76
5.51
6.26
7.01
7.76
8.51
9.26
10.01
10.76
11.51
c
m
mol
·kg-1
-50
-40
-30
-20
-10
0
10
20
30
40
50
Dev
iatio
n fr
om m
iddl
e of
ass
igne
d ra
nge
in %
ICP-MS IC OTHERCl
Results from all participants, arranged by methods.
IMEP- 10 : Trace Elements in Polyethylene Assigned range [U =k ·u c (k =2)]: 7.15 - 8.87 mmol·kg-1

4.01
4.76
5.51
6.26
7.01
7.76
8.51
9.26
10.01
10.76
11.51
c
m
mol
·kg-1
-50
-40
-30
-20
-10
0
10
20
30
40
50
Dev
iatio
n fr
om m
iddl
e of
ass
igne
d ra
nge
in %
Accredited laboratory (self-declaration)Non accredited (self-declaration) or no statement
Cl
Results from all participants.
IMEP- 10 : Trace Elements in Polyethylene Assigned range [U =k ·u c (k =2)]: 7.15 - 8.87 mmol·kg-1
4.01
4.76
5.51
6.26
7.01
7.76
8.51
9.26
10.01
10.76
11.51
c
m
mol
·kg-1
-50
-40
-30
-20
-10
0
10
20
30
40
50
Dev
iatio
n fr
om m
iddl
e of
ass
igne
d ra
nge
in %
Certified laboratory (self-declaration)Non certified (self-declaration) or no statement
Cl
Results from all participants.
IMEP- 10 : Trace Elements in Polyethylene Assigned range [U =k ·u c (k =2)]: 7.15 - 8.87 mmol·kg-1

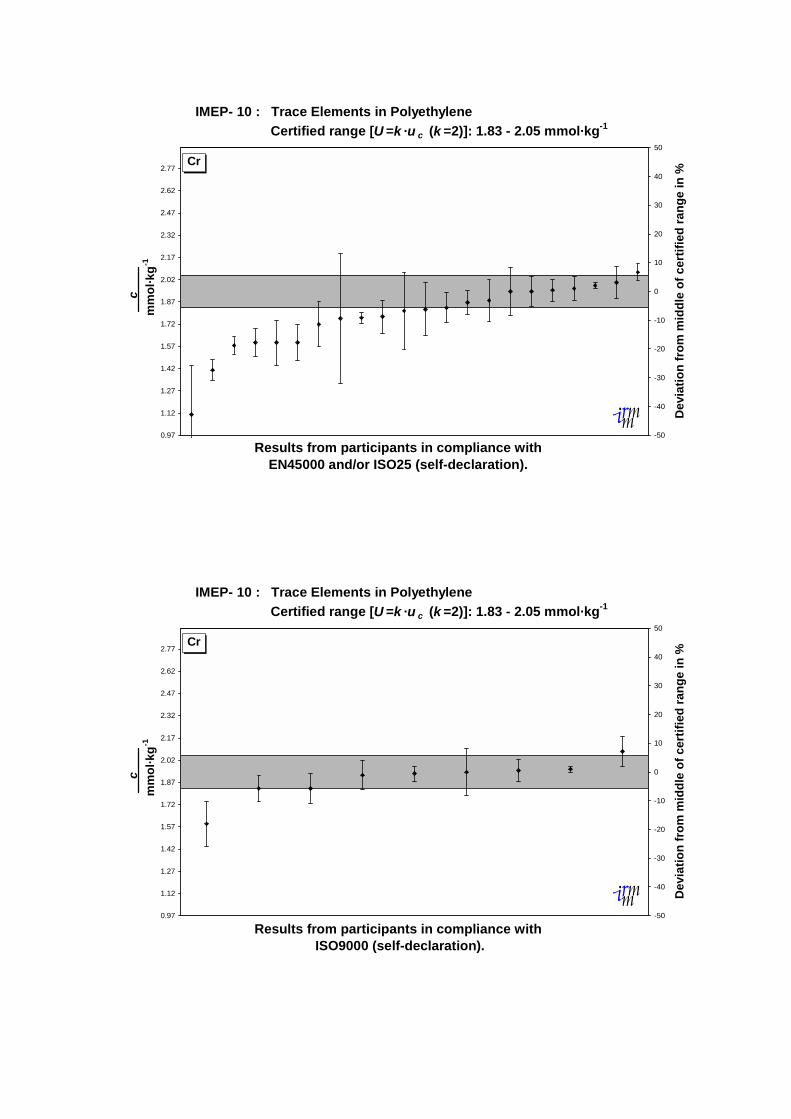
Cr• All reported results arranged in ascending order (self-declared
experience indicated)
• Results from experienced laboratories (self-declaration)
• Results from less-experienced laboratories (self-declaration)
• All reported results arranged according to the analytical methodused
• Results from accredited laboratories (self-declaration)
• Results from non-accredited laboratories (self-declaration)
• All reported results arranged in ascending order (self-declaredauthorisation status indicated)
• All reported results arranged in ascending order (self-declaredcertification status indicated)
• Results from participants in compliance with EN4500 and/orISO 25 (self-declaration)
• Results from participants in compliance with ISO 9000 (self-declaration)
• Results from participants operating quality systems other thanEN4500, ISO 25 and/or ISO9000(self-declaration)


0.97
1.12
1.27
1.42
1.57
1.72
1.87
2.02
2.17
2.32
2.47
2.62
2.77
c
m
mol
·kg-1
-50
-40
-30
-20
-10
0
10
20
30
40
50
Dev
iatio
n fr
om m
iddl
e of
cer
tifie
d ra
nge
in %
Experienced laboratory (self-declaration)Less experienced laboratory (self-declaration)Non experienced laboratory (self-declaration)No statement by laboratory
Cr
Results from all participants.
IMEP- 10 : Trace Elements in Polyethylene Certified range [U =k ·u c (k =2)]: 1.83 - 2.05 mmol·kg-1
0.97
1.12
1.27
1.42
1.57
1.72
1.87
2.02
2.17
2.32
2.47
2.62
2.77
c
m
mol
·kg-1
-50
-40
-30
-20
-10
0
10
20
30
40
50
Dev
iatio
n fr
om m
iddl
e of
cer
tifie
d ra
nge
in %
Cr
Results from experienced (self-declaration) participants.
IMEP- 10 : Trace Elements in Polyethylene Certified range [U =k ·u c (k =2)]: 1.83 - 2.05 mmol·kg-1

0.97
1.12
1.27
1.42
1.57
1.72
1.87
2.02
2.17
2.32
2.47
2.62
2.77
c
m
mol
·kg-1
-50
-40
-30
-20
-10
0
10
20
30
40
50
Dev
iatio
n fr
om m
iddl
e of
cer
tifie
d ra
nge
in %
Cr
Results from less experienced (self-declaration, including no statement and non-experienced) participants.
IMEP- 10 : Trace Elements in Polyethylene Certified range [U =k ·u c (k =2)]: 1.83 - 2.05 mmol·kg-1
0.97
1.12
1.27
1.42
1.57
1.72
1.87
2.02
2.17
2.32
2.47
2.62
2.77
c
m
mol
·kg-1
-50
-40
-30
-20
-10
0
10
20
30
40
50
Dev
iatio
n fr
om m
iddl
e of
cer
tifie
d ra
nge
in %
ET-AAS F-AAS ICP-MS ICP-ES OTHERCr
Results from all participants, arranged by methods.
IMEP- 10 : Trace Elements in Polyethylene Certified range [U =k ·u c (k =2)]: 1.83 - 2.05 mmol·kg-1

0.97
1.12
1.27
1.42
1.57
1.72
1.87
2.02
2.17
2.32
2.47
2.62
2.77
c
m
mol
·kg-1
-50
-40
-30
-20
-10
0
10
20
30
40
50
Dev
iatio
n fr
om m
iddl
e of
cer
tifie
d ra
nge
in %
Cr
Results from accredited (self-declaration) participants.
IMEP- 10 : Trace Elements in Polyethylene Certified range [U =k ·u c (k =2)]: 1.83 - 2.05 mmol·kg-1
0.97
1.12
1.27
1.42
1.57
1.72
1.87
2.02
2.17
2.32
2.47
2.62
2.77
c
m
mol
·kg-1
-50
-40
-30
-20
-10
0
10
20
30
40
50
Dev
iatio
n fr
om m
iddl
e of
cer
tifie
d ra
nge
in %
Cr
Results from non-accredited (self-declaration, including those with no statement) participants.
IMEP- 10 : Trace Elements in Polyethylene Certified range [U =k ·u c (k =2)]: 1.83 - 2.05 mmol·kg-1

0.97
1.12
1.27
1.42
1.57
1.72
1.87
2.02
2.17
2.32
2.47
2.62
2.77
c
m
mol
·kg-1
-50
-40
-30
-20
-10
0
10
20
30
40
50
Dev
iatio
n fr
om m
iddl
e of
cer
tifie
d ra
nge
in %
Authorised laboratory (self-declaration)
Non authorised (self-declaration) or no statementCr
Results from all participants.
IMEP- 10 : Trace Elements in Polyethylene Certified range [U =k ·u c (k =2)]: 1.83 - 2.05 mmol·kg-1
0.97
1.12
1.27
1.42
1.57
1.72
1.87
2.02
2.17
2.32
2.47
2.62
2.77
c
m
mol
·kg-1
-50
-40
-30
-20
-10
0
10
20
30
40
50
Dev
iatio
n fr
om m
iddl
e of
cer
tifie
d ra
nge
in %
Certified laboratory (self-declaration)
Non certified (self-declaration) or no statementCr
Results from all participants.
IMEP- 10 : Trace Elements in Polyethylene Certified range [U =k ·u c (k =2)]: 1.83 - 2.05 mmol·kg-1
0.97
1.12
1.27
1.42
1.57
1.72
1.87
2.02
2.17
2.32
2.47
2.62
2.77
c
m
mol
·kg-1
-50
-40
-30
-20
-10
0
10
20
30
40
50
Dev
iatio
n fr
om m
iddl
e of
cer
tifie
d ra
nge
in %
Cr
Results from participants in compliance with EN45000 and/or ISO25 (self-declaration).
IMEP- 10 : Trace Elements in Polyethylene Certified range [U =k ·u c (k =2)]: 1.83 - 2.05 mmol·kg-1
0.97
1.12
1.27
1.42
1.57
1.72
1.87
2.02
2.17
2.32
2.47
2.62
2.77
c
m
mol
·kg-1
-50
-40
-30
-20
-10
0
10
20
30
40
50
Dev
iatio
n fr
om m
iddl
e of
cer
tifie
d ra
nge
in %
Cr
Results from participants in compliance with ISO9000 (self-declaration).
IMEP- 10 : Trace Elements in Polyethylene Certified range [U =k ·u c (k =2)]: 1.83 - 2.05 mmol·kg-1

0.97
1.12
1.27
1.42
1.57
1.72
1.87
2.02
2.17
2.32
2.47
2.62
2.77
c
m
mol
·kg-1
-50
-40
-30
-20
-10
0
10
20
30
40
50
Dev
iatio
n fr
om m
iddl
e of
cer
tifie
d ra
nge
in %
Cr
Results from participants operating quality systems other than EN45000, ISO25 and/or ISO9000 (self-declaration).
IMEP- 10 : Trace Elements in Polyethylene Certified range [U =k ·u c (k =2)]: 1.83 - 2.05 mmol·kg-1

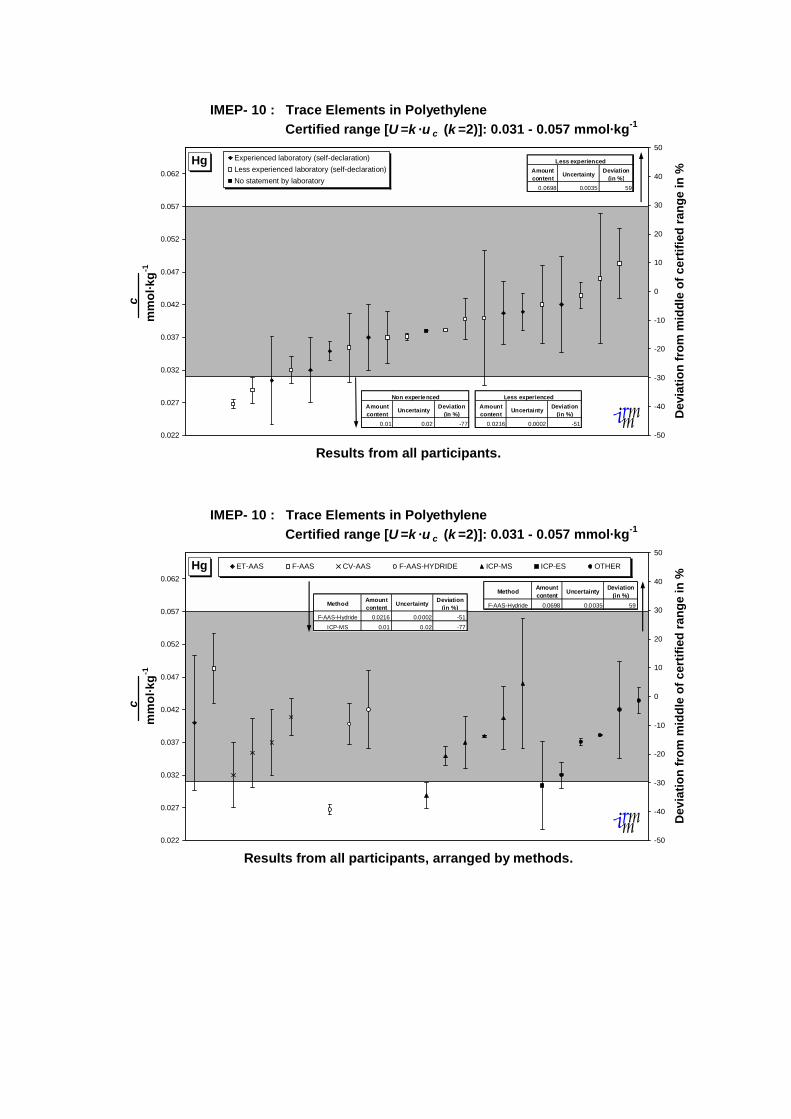
Hg• All reported results arranged in ascending order (self-declared
experience indicated)
• All reported results arranged according to the analytical methodused
• Results from accredited laboratories (self-declaration)
• Results from non-accredited laboratories (self-declaration)
• Results from participants in compliance with EN4500 and/orISO 25 (self-declaration)
• Results from participants in compliance with ISO 9000 (self-declaration)
• Results from participants operating quality systems other thanEN4500, ISO 25 and/or ISO9000(self-declaration)

0.022
0.027
0.032
0.037
0.042
0.047
0.052
0.057
0.062
c
m
mol
·kg-1
-50
-40
-30
-20
-10
0
10
20
30
40
50
Dev
iatio
n fr
om m
iddl
e of
cer
tifie
d ra
nge
in %
Experienced laboratory (self-declaration)Less experienced laboratory (self-declaration)No statement by laboratory
Hg
Results from all participants.
IMEP- 10 : Trace Elements in Polyethylene Certified range [U =k ·u c (k =2)]: 0.031 - 0.057 mmol·kg-1
Less experiencedAmount content Uncertainty Deviation
(in %)0.0698 0.0035 59
Non experiencedAmount content Uncertainty Deviation
(in %)0.01 0.02 -77
Less experiencedAmount content Uncertainty Deviation
(in %)0.0216 0.0002 -51
0.022
0.027
0.032
0.037
0.042
0.047
0.052
0.057
0.062
c
m
mol
·kg-1
-50
-40
-30
-20
-10
0
10
20
30
40
50
Dev
iatio
n fr
om m
iddl
e of
cer
tifie
d ra
nge
in %
ET-AAS F-AAS CV-AAS F-AAS-HYDRIDE ICP-MS ICP-ES OTHERHg
Results from all participants, arranged by methods.
IMEP- 10 : Trace Elements in Polyethylene Certified range [U =k ·u c (k =2)]: 0.031 - 0.057 mmol·kg-1
Method Amount content Uncertainty Deviation
(in %)F-AAS-Hydride 0.0216 0.0002 -51
ICP-MS 0.01 0.02 -77
Method Amount content Uncertainty Deviation
(in %)F-AAS-Hydride 0.0698 0.0035 59

0.022
0.027
0.032
0.037
0.042
0.047
0.052
0.057
0.062
c
m
mol
·kg-1
-50
-40
-30
-20
-10
0
10
20
30
40
50
Dev
iatio
n fr
om m
iddl
e of
cer
tifie
d ra
nge
in %
Hg
Results from accredited (self-declaration) participants.
IMEP- 10 : Trace Elements in Polyethylene Certified range [U =k ·u c (k =2)]: 0.031 - 0.057 mmol·kg-1
0.022
0.027
0.032
0.037
0.042
0.047
0.052
0.057
0.062
c
m
mol
·kg-1
-50
-40
-30
-20
-10
0
10
20
30
40
50
Dev
iatio
n fr
om m
iddl
e of
cer
tifie
d ra
nge
in %
Hg
Results from non-accredited (self-declaration) participants.
IMEP- 10 : Trace Elements in Polyethylene Certified range [U =k ·u c (k =2)]: 0.031 - 0.057 mmol·kg-1
Amount content Uncertainty Deviation
(in %)0.0698 0.0035 59
Amount content Uncertainty Deviation
(in %)0.01 0.02 -77
0.0216 0.0002 -51

0.022
0.027
0.032
0.037
0.042
0.047
0.052
0.057
0.062
c
m
mol
·kg-1
-50
-40
-30
-20
-10
0
10
20
30
40
50
Dev
iatio
n fr
om m
iddl
e of
cer
tifie
d ra
nge
in %
Hg
Results from participants in compliance with EN45000 and/or ISO25 (self-declaration).
IMEP- 10 : Trace Elements in Polyethylene Certified range [U =k ·u c (k =2)]: 0.031 - 0.057 mmol·kg-1
Amount content Uncertainty Deviation
(in %)0.0698 0.0035 59
Amount content Uncertainty Deviation
(in %)0.0216 0.0002 -51
0.022
0.027
0.032
0.037
0.042
0.047
0.052
0.057
0.062
c
m
mol
·kg-1
-50
-40
-30
-20
-10
0
10
20
30
40
50
Dev
iatio
n fr
om m
iddl
e of
cer
tifie
d ra
nge
in %
Hg
Results from participants in compliance with ISO9000 (self-declaration).
IMEP- 10 : Trace Elements in Polyethylene Certified range [U =k ·u c (k =2)]: 0.031 - 0.057 mmol·kg-1
Amount content Uncertainty Deviation
(in %)0.01 0.02 -77

0.022
0.027
0.032
0.037
0.042
0.047
0.052
0.057
0.062
c
m
mol
·kg-1
-50
-40
-30
-20
-10
0
10
20
30
40
50
Dev
iatio
n fr
om m
iddl
e of
cer
tifie
d ra
nge
in %
Hg
Results from participants operating quality systems other than EN45000, ISO25 and/or ISO9000 (self-declaration).
IMEP- 10 : Trace Elements in Polyethylene Certified range [U =k ·u c (k =2)]: 0.031 - 0.057 mmol·kg-1

Pb• All reported results arranged in ascending order (self-declared
experience indicated) (Y-axis = ± 50 % deviation from middleof certified range)
• All reported results arranged in ascending order (self-declaredexperience indicated) (Y-axis = +20/-100 % deviation frommiddle of certified range)
• Results from experienced laboratories (self-declaration)(Y-axis = ± 50 % deviation from middle of certified range)
• Results from experienced laboratories (self-declaration)(Y-axis = +20/-100 % deviation from middle of certified range)
• Results from less-experienced laboratories (self-declaration)(Y-axis = ± 50 % deviation from middle of certified range)
• Results from less-experienced laboratories (self-declaration)(Y-axis = +20/-100 % deviation from middle of certified range)

(Y-axis of graphs = +20/-100 % deviation from middle ofcertified range.)
• All reported results arranged in ascending order (use of sulfuricacid during the destruction procedure indicated)
• All reported results arranged according to the analytical methodused
• Results from accredited laboratories (self-declaration)
• Results from non-accredited laboratories (self-declaration)
• Results from authorised laboratories (self-declaration)
• Results from non-authorised laboratories (self-declaration)
• Results from certified laboratories (self-declaration)
• Results from non-certified laboratories (self-declaration)

0.24
0.29
0.34
0.39
0.44
0.49
0.54
0.59
0.64
0.69
c
m
mol
·kg-1
-50
-40
-30
-20
-10
0
10
20
30
40
50
Dev
iatio
n fr
om m
iddl
e of
cer
tifie
d ra
nge
in %
Experienced laboratory (self-declaration)Less experienced laboratory (self-declaration)Non experienced laboratory (self-declaration)No statement by laboratory
Pb
Results from all participants.
IMEP- 10 : Trace Elements in Polyethylene Certified range [U =k ·u c (k =2)]: 0.449 - 0.491 mmol·kg-1
ExperiencedAmount content Uncertainty Deviation
(in %)0.0676 0.0203 -86
0.179 0.012 -62
Less experiencedAmount content Uncertainty Deviation
(in %)0.035 0.005 -93
0.1972 0.0125 -580.214 0.036 -540.222 0.0133 -53
0.00
0.05
0.10
0.15
0.20
0.25
0.30
0.35
0.40
0.45
0.50
0.55
c
m
mol
·kg-1
-100
-90
-80
-70
-60
-50
-40
-30
-20
-10
0
10
20
Dev
iatio
n fr
om m
iddl
e of
cer
tifie
d ra
nge
in %
Experienced laboratory (self-declaration)Less experienced laboratory (self-declaration)Non experienced laboratory (self-declaration)No statement by laboratory
Pb
Results from all participants.
IMEP- 10 : Trace Elements in Polyethylene Certified range [U =k ·u c (k =2)]: 0.449 - 0.491 mmol·kg-1

0.24
0.29
0.34
0.39
0.44
0.49
0.54
0.59
0.64
0.69
c
m
mol
·kg-1
-50
-40
-30
-20
-10
0
10
20
30
40
50
Dev
iatio
n fr
om m
iddl
e of
cer
tifie
d ra
nge
in %
Pb
Results from experienced (self-declaration) participants.
IMEP- 10 : Trace Elements in Polyethylene Certified range [U =k ·u c (k =2)]: 0.449 - 0.491 mmol·kg-1
Amount content Uncertainty Deviation
(in %)0.0676 0.0203 -86
0.179 0.012 -62
0.00
0.05
0.10
0.15
0.20
0.25
0.30
0.35
0.40
0.45
0.50
0.55
c
m
mol
·kg-1
-100
-90
-80
-70
-60
-50
-40
-30
-20
-10
0
10
20
Dev
iatio
n fr
om m
iddl
e of
cer
tifie
d ra
nge
in %
Pb
Results from experienced (self-declaration) participants.
IMEP- 10 : Trace Elements in Polyethylene Certified range [U =k ·u c (k =2)]: 0.449 - 0.491 mmol·kg-1

0.24
0.29
0.34
0.39
0.44
0.49
0.54
0.59
0.64
0.69
c
m
mol
·kg-1
-50
-40
-30
-20
-10
0
10
20
30
40
50
Dev
iatio
n fr
om m
iddl
e of
cer
tifie
d ra
nge
in %
Pb
Results from less experienced (self-declaration, including non-experienced and no statement) participants.
IMEP- 10 : Trace Elements in Polyethylene Certified range [U =k ·u c (k =2)]: 0.449 - 0.491 mmol·kg-1
Amount content Uncertainty Deviation
(in %)0.035 0.005 -93
0.1972 0.0125 -580.214 0.036 -540.222 0.0133 -53
0.00
0.05
0.10
0.15
0.20
0.25
0.30
0.35
0.40
0.45
0.50
0.55
c
m
mol
·kg-1
-100
-90
-80
-70
-60
-50
-40
-30
-20
-10
0
10
20
Dev
iatio
n fr
om m
iddl
e of
cer
tifie
d ra
nge
in %
Pb
Results from less experienced (self-declaration, including non-experienced and no statement) participants.
IMEP- 10 : Trace Elements in Polyethylene Certified range [U =k ·u c (k =2)]: 0.449 - 0.491 mmol·kg-1

0.00
0.05
0.10
0.15
0.20
0.25
0.30
0.35
0.40
0.45
0.50
0.55
c
m
mol
·kg-1
-100
-90
-80
-70
-60
-50
-40
-30
-20
-10
0
10
20
Dev
iatio
n fr
om m
iddl
e of
cer
tifie
d ra
nge
in %
ET-AAS F-AAS ICP-MS ID-ICP-MS ICP-ES OTHERPb
Results from all participants, arranged by methods.
IMEP- 10 : Trace Elements in Polyethylene Certified range [U =k ·u c (k =2)]: 0.449 - 0.491 mmol·kg-1
0.00
0.05
0.10
0.15
0.20
0.25
0.30
0.35
0.40
0.45
0.50
0.55
c
m
mol
·kg-1
-100
-90
-80
-70
-60
-50
-40
-30
-20
-10
0
10
20
Dev
iatio
n fr
om m
iddl
e of
cer
tifie
d ra
nge
in %
Use of Sulfuric acid for matrix destruction
No use of sulfuric acid for matrix destruction
Pb
Results from all participants.
IMEP- 10 : Trace Elements in Polyethylene Certified range [U =k ·u c (k =2)]: 0.449 - 0.491 mmol·kg-1
0.00
0.05
0.10
0.15
0.20
0.25
0.30
0.35
0.40
0.45
0.50
0.55
c
m
mol
·kg-1
-100
-90
-80
-70
-60
-50
-40
-30
-20
-10
0
10
20
Dev
iatio
n fr
om m
iddl
e of
cer
tifie
d ra
nge
in %
.Pb
Results from accredited (self-declaration) participants.
IMEP- 10 : Trace Elements in Polyethylene Certified range [U =k ·u c (k =2)]: 0.449 - 0.491 mmol·kg-1
0.00
0.05
0.10
0.15
0.20
0.25
0.30
0.35
0.40
0.45
0.50
0.55
c
m
mol
·kg-1
-100
-90
-80
-70
-60
-50
-40
-30
-20
-10
0
10
20
Dev
iatio
n fr
om m
iddl
e of
cer
tifie
d ra
nge
in %
.Pb
Results from non accredited (self-declaration, including those with no statement) participants.
IMEP- 10 : Trace Elements in Polyethylene Certified range [U =k ·u c (k =2)]: 0.449 - 0.491 mmol·kg-1

0.00
0.05
0.10
0.15
0.20
0.25
0.30
0.35
0.40
0.45
0.50
0.55
c
m
mol
·kg-1
-100
-90
-80
-70
-60
-50
-40
-30
-20
-10
0
10
20
Dev
iatio
n fr
om m
iddl
e of
cer
tifie
d ra
nge
in %
.Pb
Results from authorised (self-declaration) participants.
IMEP- 10 : Trace Elements in Polyethylene Certified range [U =k ·u c (k =2)]: 0.449 - 0.491 mmol·kg-1
0.00
0.05
0.10
0.15
0.20
0.25
0.30
0.35
0.40
0.45
0.50
0.55
c
m
mol
·kg-1
-100
-90
-80
-70
-60
-50
-40
-30
-20
-10
0
10
20
Dev
iatio
n fr
om m
iddl
e of
cer
tifie
d ra
nge
in %
.Pb
Results from non authorised (self-declaration, including those with no statement) participants.
IMEP- 10 : Trace Elements in Polyethylene Certified range [U =k ·u c (k =2)]: 0.449 - 0.491 mmol·kg-1

0.00
0.05
0.10
0.15
0.20
0.25
0.30
0.35
0.40
0.45
0.50
0.55
c
m
mol
·kg-1
-100
-90
-80
-70
-60
-50
-40
-30
-20
-10
0
10
20
Dev
iatio
n fr
om m
iddl
e of
cer
tifie
d ra
nge
in %
.Pb
Results from certified (self-declaration) participants.
IMEP- 10 : Trace Elements in Polyethylene Certified range [U =k ·u c (k =2)]: 0.449 - 0.491 mmol·kg-1
0.00
0.05
0.10
0.15
0.20
0.25
0.30
0.35
0.40
0.45
0.50
0.55
c
m
mol
·kg-1
-100
-90
-80
-70
-60
-50
-40
-30
-20
-10
0
10
20
Dev
iatio
n fr
om m
iddl
e of
cer
tifie
d ra
nge
in %
.Pb
Results from non certified (self-declaration, including those with no statement) participants.
IMEP- 10 : Trace Elements in Polyethylene Certified range [U =k ·u c (k =2)]: 0.449 - 0.491 mmol·kg-1


S• All reported results arranged in ascending order (self-declared
experience indicated)
• All reported results arranged according to the analytical methodused
• All reported results arranged in ascending order (self-declaredaccreditation status indicated)
• All reported results arranged in ascending order (self-declaredcertification status indicated)
• Results from participants in compliance with EN4500 and/orISO 25 (self-declaration)
• Results from participants in compliance with ISO 9000 (self-declaration)


3.2
4.0
4.7
5.5
6.2
7.0
7.7
8.5
9.2
c
m
mol
·kg-1
-50
-40
-30
-20
-10
0
10
20
30
40
50
Dev
iatio
n fr
om m
iddl
e of
ass
igne
d ra
nge
in %
Experienced laboratory (self-declaration)Less experienced laboratory (self-declaration)
S
Results from all participants.
IMEP- 10 : Trace Elements in Polyethylene Assigned range [U =k ·u c (k =2)]: 5.1 - 7.7 mmol·kg-1
Less ExperiencedAmount content
< 15.6
ExperiencedAmount content Uncertainty Deviation
(in %)1.329 7.89 -79
3.2
4.0
4.7
5.5
6.2
7.0
7.7
8.5
9.2
c
m
mol
·kg-1
-50
-40
-30
-20
-10
0
10
20
30
40
50
Dev
iatio
n fr
om m
iddl
e of
ass
igne
d ra
nge
in %
ICP-ES IC OTHERS
Results from all participants, arranged by methods.
IMEP- 10 : Trace Elements in Polyethylene Assigned range [U =k ·u c (k =2)]: 5.1 - 7.7 mmol·kg-1
Method Amount content Uncertainty Deviation
(in %)IR 1.329 7.89 -79
Method Amount content
IR <15.6

3.2
4.0
4.7
5.5
6.2
7.0
7.7
8.5
9.2
c
m
mol
·kg-1
-50
-40
-30
-20
-10
0
10
20
30
40
50
Dev
iatio
n fr
om m
iddl
e of
ass
igne
d ra
nge
in %
Accredited laboratory (self-declaration)Non accredited (self-declaration) or no statement
S
Results from all participants.
IMEP- 10 : Trace Elements in Polyethylene Assigned range [U =k ·u c (k =2)]: 5.1 - 7.7 mmol·kg-1
Non accreditedAmount content
< 15.6
AccreditedAmount content Uncertainty Deviation
(in %)1.329 7.89 -79
3.2
4.0
4.7
5.5
6.2
7.0
7.7
8.5
9.2
c
m
mol
·kg-1
-50
-40
-30
-20
-10
0
10
20
30
40
50
Dev
iatio
n fr
om m
iddl
e of
ass
igne
d ra
nge
in %
Certified laboratory (self-declaration)
Non certified (self-declaration) or no statement
S
Results from all participants.
IMEP- 10 : Trace Elements in Polyethylene Assigned range [U =k ·u c (k =2)]: 5.1 - 7.7 mmol·kg-1
CertifiedAmount content Uncertainty Deviation
(in %)1.329 7.89 -79
Non certifiedAmount content
< 15.6

3.2
4.0
4.7
5.5
6.2
7.0
7.7
8.5
9.2
c
m
mol
·kg-1
-50
-40
-30
-20
-10
0
10
20
30
40
50
Dev
iatio
n fr
om m
iddl
e of
ass
igne
d ra
nge
in %S
Results from participants in compliance with EN45000 and/or ISO25 (self-declaration).
IMEP- 10 : Trace Elements in Polyethylene Assigned range [U =k ·u c (k =2)]: 5.1 - 7.7 mmol·kg-1
Amount content Uncertainty Deviation
(in %)1.329 7.89 -79
3.2
4.0
4.7
5.5
6.2
7.0
7.7
8.5
9.2
c
m
mol
·kg-1
-50
-40
-30
-20
-10
0
10
20
30
40
50
Dev
iatio
n fr
om m
iddl
e of
ass
igne
d ra
nge
in %S
Results from participants in compliance with ISO9000 (self-declaration).
IMEP- 10 : Trace Elements in Polyethylene Assigned range [U =k ·u c (k =2)]: 5.1 - 7.7 mmol·kg-1


Regional : Switzerland• As : all reported results arranged in ascending order (self-
declared experience indicated)
• Br : all reported results arranged in ascending order (self-declared experience indicated)
• Cd : all reported results arranged in ascending order (self-declared experience indicated)
• Cl : all reported results arranged in ascending order (self-declared experience indicated)
• Cr : all reported results arranged in ascending order (self-declared experience indicated)
• Hg : all reported results arranged in ascending order (self-declared experience indicated)
• Pb : all reported results arranged in ascending order (self-declared experience indicated)
• S : all reported results arranged in ascending order (self-declared experience indicated)


0.064
0.079
0.094
0.109
0.124
0.139
0.154
0.169
0.184
c
m
mol
·kg-1
-50
-40
-30
-20
-10
0
10
20
30
40
50
Dev
iatio
n fr
om m
iddl
e of
ass
igne
d ra
nge
in %
Experienced laboratory (self-declaration)Less experienced laboratory (self-declaration)
As
Results from Swiss participants.
IMEP- 10 : Trace Elements in Polyethylene Assigned range [U =k ·u c (k =2)]: 0.1207 - 0.1359 mmol·kg-1
1.75
2.00
2.25
2.50
2.75
3.00
3.25
3.50
3.75
4.00
4.25
4.50
4.75
5.00
5.25
c
m
mol
·kg-1
-50
-40
-30
-20
-10
0
10
20
30
40
50
Dev
iatio
n fr
om m
iddl
e of
ass
igne
d ra
nge
in %
Experienced laboratory (self-declaration)
Less experienced laboratory (self-declaration)Br
Results from Swiss participants.
IMEP- 10 : Trace Elements in Polyethylene Assigned range [U =k ·u c (k =2)]: 3.20 - 3.80 mmol·kg-1

0.53
0.61
0.68
0.76
0.83
0.91
0.98
1.06
1.13
1.21
1.28
1.36
1.43
1.51
c
m
mol
·kg-1
-50
-40
-30
-20
-10
0
10
20
30
40
50
Dev
iatio
n fr
om m
iddl
e of
cer
tifie
d ra
nge
in %
Experienced laboratory (self-declaration)
Less experienced laboratory (self-declaration)
Cd
Results from Swiss participants.
IMEP- 10 : Trace Elements in Polyethylene Certified range [U =k ·u c (k =2)]: 1.009 - 1.121 mmol·kg-1
4.01
4.76
5.51
6.26
7.01
7.76
8.51
9.26
10.01
10.76
11.51
c
m
mol
·kg-1
-50
-40
-30
-20
-10
0
10
20
30
40
50
Dev
iatio
n fr
om m
iddl
e of
ass
igne
d ra
nge
in %
Experienced laboratory (self-declaration)
Less experienced laboratory (self-declaration)
Cl
Results from Swiss participants.
IMEP- 10 : Trace Elements in Polyethylene Assigned range [U =k ·u c (k =2)]: 7.15 - 8.87 mmol·kg-1

0.97
1.12
1.27
1.42
1.57
1.72
1.87
2.02
2.17
2.32
2.47
2.62
2.77
c
m
mol
·kg-1
-50
-40
-30
-20
-10
0
10
20
30
40
50
Dev
iatio
n fr
om m
iddl
e of
cer
tifie
d ra
nge
in %
Experienced laboratory (self-declaration)Less experienced laboratory (self-declaration)
Cr
Results from Swiss participants.
IMEP- 10 : Trace Elements in Polyethylene Certified range [U =k ·u c (k =2)]: 1.83 - 2.05 mmol·kg-1
0.022
0.027
0.032
0.037
0.042
0.047
0.052
0.057
0.062
c
m
mol
·kg-1
-50
-40
-30
-20
-10
0
10
20
30
40
50
Dev
iatio
n fr
om m
iddl
e of
cer
tifie
d ra
nge
in %
Experienced laboratory (self-declaration)Less experienced laboratory (self-declaration)
Hg
Results from Swiss participants.
IMEP- 10 : Trace Elements in Polyethylene Certified range [U =k ·u c (k =2)]: 0.031 - 0.057 mmol·kg-1

0.24
0.29
0.34
0.39
0.44
0.49
0.54
0.59
0.64
0.69
c
m
mol
·kg-1
-50
-40
-30
-20
-10
0
10
20
30
40
50
Dev
iatio
n fr
om m
iddl
e of
cer
tifie
d ra
nge
in %
Experienced laboratory (self-declaration)Less experienced laboratory (self-declaration)
Pb
Results from Swiss participants.
IMEP- 10 : Trace Elements in Polyethylene Certified range [U =k ·u c (k =2)]: 0.449 - 0.491 mmol·kg-1
Less experiencedAmount content
Uncertainty Deviation (in %)
0.1972 0.0125 -58
3.2
4.0
4.7
5.5
6.2
7.0
7.7
8.5
9.2
c
m
mol
·kg-1
-50
-40
-30
-20
-10
0
10
20
30
40
50
Dev
iatio
n fr
om m
iddl
e of
ass
igne
d ra
nge
in %
Experienced laboratory (self-declaration)
Less experienced laboratory (self-declaration)S
Results from Swiss participants.
IMEP- 10 : Trace Elements in Polyethylene Assigned range [U =k ·u c (k =2)]: 5.1 - 7.7 mmol·kg-1
ExperiencedAmount content Uncertainty Deviation
(in %)1.329 7.89 -79
Less experiencedAmount content
< 15.6

Appendix• REPORT FORM
• QUESTIONNAIRE