Investigation of Nicotine Levels and Some Trace Elements in ...
130
Sudan Academy of Sciences Atomic Energy Council Investigation of Nicotine Levels and Some Trace Elements in Toombak and their Possible Association with Oral Cancer A thesis submitted in fulfillment of the requirements for the degree of PhD in analytical chemistry By Ghada Mohamed Elamin Elfaki Taha B.Sc. Honors in Chemistry, Faculty of Science, University of Khartoum (2005) M.Sc. in Radiation Chemistry Sudan Academy of Science (2011) Supervisor: Prof. Mohamed Ahmed Hassan El-Tayeb May 2019
-
Upload
khangminh22 -
Category
Documents
-
view
0 -
download
0
Transcript of Investigation of Nicotine Levels and Some Trace Elements in ...

Sudan Academy of Sciences Atomic Energy Council
Investigation of Nicotine Levels and Some Trace Elements in Toombak and their Possible Association with Oral Cancer
A thesis submitted in fulfillment of the requirements for the degree of PhD in analytical chemistry
By
Ghada Mohamed Elamin Elfaki Taha
B.Sc. Honors in Chemistry, Faculty of Science, University of Khartoum (2005)
M.Sc. in Radiation Chemistry Sudan Academy of Science (2011)
Supervisor: Prof. Mohamed Ahmed Hassan El-Tayeb
May 2019

Investigation of Nicotine Levels and Some Trace Elements in Toombak and their Possible Association with Oral Cancer
By
Ghada Mohamed Elamin Elfaki Taha
Examination
Committee Title
Name Signature
External examiner Prof. Ali Hamod Ali
Internal examiner Prof. Mustafa Mohamed Osman
Supervisor Prof. Mohamed Ahmed Hassan
Date of Examination: 28/05/2019
i

Dedication
To my lovely mum and
my beloved family,
Waleed,
Khalid,
Retaj
And
Mohamed
ii

I Would like to express my deep gratitude to my respectable supervisor
Prof. Mohammed A. H. El-Tayeb whose assistance helpful and support
Many thanks to persons participated in this study in sample collection effort
namely Dr. Ahmed salih, Dr. Mohamed siddeeg, Waleed, Mergani, and
Khalda. The tireless effort of the laboratory staff is particularly
appreciated to Monzer and Rasha served as the backbone of the study from
central lab University of Khartoum also thanks due to Ashwag and Manal
from central lab Sudanese Standard Metrology Organization. Mr.
Waleed Dawi devotedly assisted in the statistical analysis of the data.
Thanks may also due to my friends Malaz and Amna. The cooperation of
the Sudan Atomic Energy Commission special chemistry and nuclear
physics institute where the work was carried out and gratefully
acknowledged.
iii

AbstractThis research work aims firstly to quantify the concentration of nicotine and the toxic elements
identified after different toombak fermentation procedures and secondly to evaluate their
possible association with oral cancer. High Performance Liquid Chromatography was used to
measure nicotine content; while Inductive Coupled Plasma-Emission Spectroscopy was used to
measure the concentration of the elements in off-the-shelf toombak samples, which were
collected from different regions of Sudan, also raw Toombak samples fermented in the laboratory
using different concentrations of natron were detected.
The results showed that there is a strong correlation between the concentration of natron used
in the fermentation process and the concentration of nicotine and the toxic elements. Higher
natron concentration decreases the levels of nicotine and Cd, Pb, Cr, Ni, Cu, Zn, Co nevertheless;
the levels still exceed the recommended limits. The results can be used to control the toxicity level
by standardizing the fermentation method. When the prepared natron concentration was 50
ml\gram the total nicotine content was 6 ppm compared with the lowest concentration of
prepared natron 10 ml\gram the total nicotine content was 46 ppm; while the total nicotine
content was 206 ppm measured for toombak before added natron.
The results of the study showed that nicotine content and toxic elements measured in toombak
ready to use in Sudanese markets lead to hazard diseases which occurred due to addiction of this
habit especially oral cancer, data were collected and analyzed using statistical method.
To minimize the rich of this habit to words oral cancer and other adverse effect, it is recommended
from this study to use a mixture of natron and tobacco 3:1 respectively, and this can be regarded
as standard ratio for the Sudanese standard metrology
iv

jjaAsJI Ol^lj^l Axj /aaj-^j ^iJl Aa/uJ1 j‘ *'*l1j UjJj^J'll Ua JS 3jS1jj -ja^j ^Jj ^jl l*̂41 1Sa l e-laVl AjJ/o Jj/uJl /jalj^jJ/AjjS ^laASkl .^1 q/^juj Ja*̂ a!11 g 1^1 1 fjjasJ /jj/jj 6 U/jaSJ1 O/* jo jJ4qI*A a!1
^a j^/AxI1 3jS1jj ^^/jaJ 4*̂*111^11 Aja^^jJI oU/xj^J ^i^LJl JjJ^sll ^.l.-Aiml Uj^ ^a .UjJj^j'Jl ^j*̂A ^j^/jaJ
j^/A*J1j ujJj^jUl uo l 0 1*̂11 /aS 6 jlajuJl qa 4U*< a 0^!* a qa !&»*̂J1j 6 S^a/^JI UUaSJI o/'jq
.jjj^xll qa 4 U*< a 3jS1jj ju<aI1 SjaAaII ^1a!1 U/jaSJ1 o/* jo ^a Aa/uJ1
UjJj^j'Jl 3jS1jJj U/jasJ1 jjaAJ AjIao ^..-<*11^11 jjj^xll 3jS1jj Ujj AjiXo AS^o aj^.j ^jIsjJI Ojg^l
j Cr j Pb j Cd j ujJj^j'Ji 3jS1jj o/jj3ua ua JJaj jjj^xJl 3jSjj ^/iJ^l .3a/^J1 UUaSJI ^bAa/uJI j^/wl/j ^a ^x^*n ^jlSjJl ^l.-ASinl u^a ./gj ^j^Ji aja^Jl 'jji^sJ o/jjSuaJI JI3J V ^Ja Co j Zn j Cu j Ni
J/a^.1 j/S ^1jA \ Ja 50 j^^aII Jjj^*J1 3jSjJ j/S 1 a.Vx .jja<*11 Asjj^ aj^jj J^A ua 4jauJ1 ^j*ua
^Ji^A ^J/a^I qISj ^1j> \ Ja 10 j^^aII QjjKxSI ua jjSjJ JaL AjjIja QjjIaJI j ^3^ 6 UJJj^J*J1 ^j*̂ a
Jjs ^/aa*U Ak/jS QjjIaJI j ^3^ 206 j/S UjJj£jiJ1 ^jS^a J/a^I jl Uj^ J • JjjJaJI j ^3^ 46 UJJj^J*J1QjjKx!1 Aa/^^l
^ij^^l ^3 ^l.-Aiki^l 3aI^J1 ^/ja*J1 ^3 a^UaH AaO1 j^^/* xJ1j QjJj^jUl ^j*̂A j| A^l^aJl oSa ^j/Sj jg
Igljl^Jj O/jUJ1 ^a^ -Sj 6 ^/ja*J1 Salo J/a^1 CM fill q/^juj Aj/^^/j ^/jJj^l ^Jl ^ajj AjjlajuJl4ii1, ^-^.1 4 a ij^ ^1.-< iki!i
C ^1-<*k!i 4j^j*l1 jJ1 Aklj-Jl oSa 6fiJ1 j/^jk ^Jl ^ajj j*J1 Sa/xJl oSgJ 0j/^aJ1 OljJj/jJl JjIssJ
.AjjlajuJl 4jik!jU1 ^^jj/^aU Ajkljs Ajuj ^Ja j/j*o1 U^aJj 6 jJljiJl ^lo 1 :3 £J*J1j Jjj^*l1 ^J3A Ua S.y.^a
v

List of ContentsPage No.
Dedication Ii
Acknowledgment Iii
Abstract Iv
V
List of Contents Vi
List of Tables X
List of Figure Xii
Chapter OnePageNo.
Introduction 1
1.1 Tobacco 1
1.1.1 Tobacco additives 2
1.1.2 Tobacco toxicity 2
1.2 Nicotine 3
1.3 Trace element 7
1.3.1 Biological role of trace elements and health concern for human 7
1.3.2 Trace and toxic elements in tobacco 8
1.3.2.1 Cadmium 8
vi

1.3.2.2 Cobalt 9
1.3.2.3 Chromium 9
1.3.2.4 Copper 10
1.3.2.5 Manganese 10
1.3.2.6 Nickel 10
1.3.2.7 Zinc 11
1.3.2.8 Lead 11
1.4 Instrumentation 12
1.4.1 High performance liquid chromatography 12
1.4.1.1 Mobile phase reservoirs and solvent treatment systems 12
1.4.1.2 Pumping system 14
1.4.1.3 Sample injection system 14
1.4.1.4 Liquid chromatographic columns 15
1.4.1.5 Types of column packing 15
1.4.1.6 Detectors 16
1.4.2 ICP-AES 16
1.5 Problem statement 19
1.6 Objectives 20
Chapter TwoLiterature review 21
2.1 Nicotine and nitrosamines compounds preview 21
vii

2.2 Global prospective 25
2.3 Tobacco in Sudan 29
2.3.1 Toombak use statistical data analysis 31
2.3.2 Oral cancer in Sudan and possible association with toombak use 31
2.3.3 Oral cancer preview 33
Chapter Three
Materials and methods 36
3.1 Collection of data about uses of snuff tobacco by questionnaire and
interview with snuff users
36
3.2 Sampling and samples preparation 36
3.3 Nicotine determination 38
3.3.1 Preparation of mobile phase 38
3.3.2 Standard curve for HPLC 38
3.3.3 Sample preparation for HPLC 40
3.4 Trace elements determination 40
Chapter Four
4. Results and discussion 41
4.1 Nicotine content determined by HPLC 41
4.2 Analysis of data using excel program 50
4.3 Trace element concentration determined by ICP-AES 61
Chapter Five
viii

Conclusion and Recommendations
5.1 Conclusion 90
5.2 Recommendations 91
References 92
Appendix 1
Appendix 2
ix

List of TablesTable
No.Title Page
No.3.2.1 The natron concentration used to prepare samples in the laboratory
and their weight.
36
3.2.2 Samples location different regions in Sudan. 37
3.3.1 Nicotine standard stock solution retention time and peak area and
height of the peak.
39
4.1.1 Nicotine concentration values of the toombak samples prepared with
different natron concentration in ml\g
42
4.1.2 Nicotine concentration values of the toombak samples collected from
the market in different region in Sudan.
45
4.1.3 Nicotine concentration values of the toombak samples collected from
the market exclude minimum and maximum values.
46
4.1.4 Nicotine retention time, peak area and height in lowest concentration
sample one
48
4.1.5 Nicotine retention time, peak area and height in highest concentration
sample six
49
4.2.1 Percentage of toombak users in Khartoum state 50
4.2.2 Percentage values of toombak users age in Khartoum state 51
4.2.3 Percentage values of toombak users according to gender 52
4.2.4 Percentage values of toombak user's educational level 53
4.2.5 Percentage of users starting history 54
4.2.6 Percentage of intake frequency per day 55
4.2.7 Percentage of toombak user's health hazards 56
4.2.8 Percentage of types of health hazard 57
x

4.2.9 Percentage of users trying to quit 58
4.2.10 Percentage of attempts for quit 59
4.2.11 Statistical data of oral cancer users during 1975 to 2016 60
4.3.1 ICP-EAS Accuracy results using standard reference material hay
powder (IAEA-V-10) elements concentration in ppm.
62
4.3.2 The concentration of eight trace element in toombak collected from
the market.
64
4.3.3 Comparison of elements concentration 65
4.3.4 Summary of significance (P. value<0.05) level in toombak samples in
elements measured, means, and concentration ranges.
66
4.3.5 The concentrations of the elements in toombak prepared in the lab
and the natron concentrations used.
82
4.3.6 Comparison between concentrations of trace elements in toombak and
reported concentration in the literature in (ppm)
88
4.3.7 Permissible intake level as per WHO and FAO recommendation. 89
xi

List of FiguresFigure
No.Title Page
No.1.2.1 Nicotine and Tobacco-Specific Nitrosamines (TSNA) 6
1.4.1 HPLC schematic apparatus 13
1.4.2 ICP-AES schematic apparatus 18
3.3.1 Nicotine standard calibration curve 39
4.1.1 The inverse correlation between nicotine content and natron
concentration.
43
4.1.2 Nicotine concentration in toombak before procession and natron
concentration
44
4.1.3 Nicotine concentration in toombak samples collected from the
market.
47
4.1.4 Nicotine retention time, peak area and height in lowest concentration
sample one
48
4.1.5 Nicotine retention time, peak area and height in highest
concentration sample six
49
4.2.1 Age of questioner volunteers 50
4.2.2 Gender survey of questioner volunteers 51
4.2.3 Education levels of questioner volunteers 52
4.2.4 Toombak users of questioner volunteers 53
4.2.5 Toombak users starting history 54
4.2.6 Toombak user's intake frequency per day 55
4.2.7 Toombak user's health hazards 56
xii

4.2.8 Toombak user's types of health hazard 57
4.2.9 Toombak users trying to quit 58
4.2.10 Toombak users starting to quit 59
4.3.1 Cadmium concentration in ppm in the toombak market's samples. 67
4.3.2 Cobalt concentration in ppm in the toombak market's samples. 68
4.3.3 Chromium concentration in ppm in the toombak market's samples. 69
4.3.4 Cupper concentration in ppm in the toombak market's samples. 70
4.3.5 Nickel concentration in ppm in the toombak market's samples. 71
4.3.6 Zinc concentration in ppm in the toombak market's samples. 72
4.3.7 Lead concentration in ppm in the toombak market's samples. 73
4.3.8 Manganese concentration in ppm in the toombak market's samples. 74
4.3.9 An inverse correlation between Cd and Pb also the correlation
between Co and Cr concentration in ppm in the toombak market's
samples.
76
4.3.10 Correlation between Cu and Zn concentration in ppm in the toombak
market's samples.
77
4.3.11 Correlation between Co and Zn concentration in ppm in the toombak
market's samples.
78
4.3.12 Correlation between Cu and Mn concentration in ppm in the
toombak market's samples.
79
4.3.13 Correlation between Co, Pb and Cu concentration in ppm in the
toombak market's samples.
80
4.3.14 Elements concentration in ppm in the toombak samples prepared
with different natron concertation.
83
xiii

4.3.15 Elements concentration in ppm except manganese in the toombak
samples prepared with different natron concertation.
84
4.3.16 Maximum and minimum values for elements concentration in ppm
in the toombak samples prepared with different natron concertation.
85
4.3.17 Maximum and minimum values for manganese concentration in ppm
in the toombak samples prepared with different natron concertation.
86
xiv

Chapter One

Introduction1.1TobaccoThe word "tobacco" is an Anglicization of the Spanish word "Tabaco", whose root was
unclear, it is thought to derive from the native American word "Tobago" for a Y-shaped
pipe used in sniffing tobacco powder. "Timbuktu" is a name used in Mali and Morocco
also known as "Niswar" in Pakistan or "snus" in Swedish.
The habit of tobacco use is pursued by people of all ranks and ages in all societies of the
world. Therefore, the tobacco plant seems to occur in every geographical region of the
world. Tobacco is abroad-leafed plant of the nightshade Solanaceae family indigenous to
north and south America, Mexico and west India 1. Much of the tobacco grown in the united
states is common tobacco which dried and cured leaves are often smoked in the form of a
cigar or cigarette in a smoking pipe. Tobacco also chewed"dipped" placed between the
cheek and gum and consumed as finely powdered snuff tobacco.
These indicate that tobacco holds a leading position as an article of human consumption
and is one of the most frequently used plants in the study of mineral composition and
nutrition. Tobacco may be used in different forms such as smoking, chewing and sniffing
etc...
There are many different botanical classifications for tobacco plant. The genus Nicotiana
is classified into three main subgenera, N. rustica, N. tabacum and N. petuniodes.
Smokeless tobacco products use N. tabacum, and sometimes N. rustica. N. rustica species
is cultivated in some parts of Eastern Europe, Asia Minor and Africa, and the cured leaves
may contain up to 9% nicotine whereas N. tabacum (common tobacco) leaves contain about 1 to 3% 2.
The high concentration of nicotine in tobacco leaves differ due to some factors include: the
species of the plants, growing conditions (particularly soil and climate) and the methods of
culture and curing and from where the leaves are picked. In American study greenhouse-
grown plants, N. tabacum can accumulate up to 5.3 mg nicotine/g tobacco (98.2% of total
alkaloids) and in field-grown plants up to 24.8 mg nicotine/g tobacco (97.1% of total alkaloids) 3.
1

N. rustica tobacco was reported that contain the highest levels of nicotine (up to 102.4 mg/g
dry wt.) and nicotine derived Tobacco Specific N-nitros-Amines (TSNA) ever measured
in consumer products 4. The chemical composition of tobacco undergoes substantial
changes during growing, curing, processing and storing 5.
1.1.1 Tobacco additives
Tobacco additives are applied to control nicotine delivery by raising pH and subsequently
the level of un-protonated nicotine which is the form of nicotine that is most readily
absorbed through the mouth into the bloodstream. It may include ammonia, ammonium
carbonate and sodium carbonate and sodium bicarbonate (natron) 6.
Other additives, such as methyl or ethyl salicylate, P-citronellal, 1,8-cineole, menthol,
benzyl benzoate and eugenol whish used among creamy snuff sold in India called Denobac
7. Also menthol is added to numb the throat and facilitate tobacco use. Ascorbic acid is
added to tobacco as an antimicrobial agent whereas the addition of sodium propionate
serves as a fungicide. Native Americans in both north and south America chewed the leaves
of the plants frequently mixed with lime 8.
1.1.2 Tobacco toxicity
Several scientific studies have been published confirmed that tobacco has serious harmful effects on human health 9, 10 and 11. It is believed that tobacco health risks associated with
smokeless tobacco use were lower than those with cigarette smoking. But the long-term
use of smokeless tobacco had led to severe health consequences in developing countries
like India, Pakistan and Sudan. Chewing Betel quid, a type of tobacco used in India and
tobacco was associated with a substantial risk of oral or oropharyngeal cancers in India.
Although the products used in Scandinavia and USA were less hazardous. Most recent
studies from USA and Scandinavia were not statistically significant, but moderate positive
association with cardiovascular disease. All tobacco products contain carcinogenic substance and substantial quantities of nicotine and toxic element 12, 13 and 14.
Twenty-eight carcinogens have been identified in tobacco include polycyclic aromatic
hydrocarbons, lactones, ethyl carbonate and some volatile N-nitosamines. The major and
most abundant groups of carcinogens are the non-volatile alkaloid-derived tobacco specific
N-nitrosamines and N-nitrosamines acids which form during preparation and procession
2

of tobacco. During the curing process starch content of leaves declines the amounts of
reducing sugars increase, while polyphenols and carbohydrates in the leaves diminish
during procession. Chemicals in smokeless tobacco include alkaloids such as nicotine, nor
nicotine, cotinine, anabasine, anatabine, aliphatic hydrocarbons and hundreds of
isopernoids produce typical aroma of tobacco leaves. A number of phytosterols such as
cholesterol, campesterols and alcohols, phenolics, chlorogenic acid, rutin, carboxylic acids,
turpenes, polyphenols, aromatic hydrocarbons, aldehydes, ketones, amines, nitrates, N-an
d O-heterocyclic hydrocarbons, pesticides and alkali nitrates have been detected 9.
Other carcinogens reportedly present in smokeless tobacco include certain lactones and
volatile aldehydes like formaldehyde, acetaldehyde and acryl aldehyde (acrolein). The
international agency for research on cancer regards formaldehyde as an animal carcinogen
and probably also carcinogenic to humans.
The levels of Poly nuclear Aromatic Hydrocarbons (PAH) appear to be too low to make
significant contribution to snuff carcinogenicity in the oral cavity but benzo[a]pyrene detect mostly in tobacco 15.
Trace and toxic elements like cadmium, nickel, chromium and arsenic are highly
concentrated in tobacco leaves, stem and roots and these are known to inhibit enzyme action and as animal carcinogens 16.
Metals exercise to control over the configuration of nucleic acid by stabilizing the
secondary helical structure in manner similar to disulfide bridges, then they could play a
role in the protein synthesis and hence in the transmission of genetic information 17 and 18.
The radioactive polonium- 210, originated in U. S. tobacco from soil fertilized with
phosphates rich in radium-226 absorbed to the tobacco leaves 19.
Of special concern in the human carcinogenic polonium -210 had no information on the
possibility to increased oral cancer risk of chewers and snuff dippers. also lead -210,
uranium-235 and uranium-238 where reported in tobacco 20.
1.2NicotineNicotine ((s)-3-(1- methyl -2 pyrrolidinyl) pyridine) is achiral amine with a tobacco-like
odor, it is most abundant of the volatile alkaloids in the tobacco leaf. Nicotine has chemical
formula C10H14N2 Figure (1.3.1), its molar mass 162.23 kg /mol., density 1.01g/cm3, the
3

melting point and boiling point are -79°C and 247°C respectively, and the half life time is 2 Hours 21 and 22.
Nicotine occurs in a wide variety of plants, especially in tobacco (Nicotiana tabacum L.,
Solanaceae) leaves where it constitutes the principal alkaloid found in the nightshade
Solanaceae family of plants, predominantly in the leaves of tobacco, and in lower
concentration in tomato, eggplant, and in green pepper; They are also found in the leaves of the coca plant 23.
Most of the medicinal higher plants extractable organic compounds in sufficient quantities
to be economically useful as chemical feed stocks or raw materials for various scientific,
technological and commercial applications. However, the primary commercial source of
nicotine is by extraction from the plant Nicotinia tabacum and Nicotinia rustica; It is a
color less, low to pale yellow and hygroscopic oily liquid. Nicotine normally makes up
about 5 percent of a tobacco plant, by weight. Cigarettes contain 8 to 20 milligrams (mg)of nicotine (depending on the brand) 24.
Nicotine plays an important role in growth and other biological mechanism for example,
increase heart rate, blood pressure, and stimulate memory and alertness. It is one of the
most highly toxic compounds belonging to the tobacco alkaloids.Which has been suspected
to contribute to various human diseases such as stroke, reproductive disorder and renal disease 25.
Due to its toxicity, total nicotine content has to be precisely determined in tobacco extracts.
Many analytical methods (GC, HPLC, UV ...) have reported nicotine quantification in
biological samples (blood, urine, plasma or serum) and formulated products or smoke and
air sample. There were described HPLC methods for the determination of nicotine from
pharmaceutical formulations and HPLC tandem mass spectrometry methods for determination from biological samples 23.
A most useful technique described for the determination of nicotine and cotinine in plasma
after a single extraction procedure using gas chromatography-nitrogen selective detection.
The electron capture detector used for the determination of nicotine using
heptafluorobutyric anhydride and N-methylnicotinium ion at the pictogram level using electrochemical detection by very useful and selective LC method 26 and 27.
4
The effects of nicotine are known to be gender-dependent, it is appearing to be less
reinforce in women than in men for maintaining cigarette smoking and this may be due to
sex differences in the sensitivity to nicotine's interceptive cues. Hormones are the most
important factors for understanding many drug effects in women. As for example, cocaine
and amphetamine are responsible to be influenced by varying the level of estrogen and progesterone associated with the follicular and luteal phases 28. and 29.
Cigarette smoking has a relatively short duration of action of nicotine administration. The
levels of nicotine peak for blood are achieved typically within the time it takes to consume
the cigarette (5 to 10 minutes) and decline quickly. However, alcohol via the oral route has
a slower onset and longer duration of action. There is a general consensus that nicotine modifies the acute effects of alcohol 22.
5
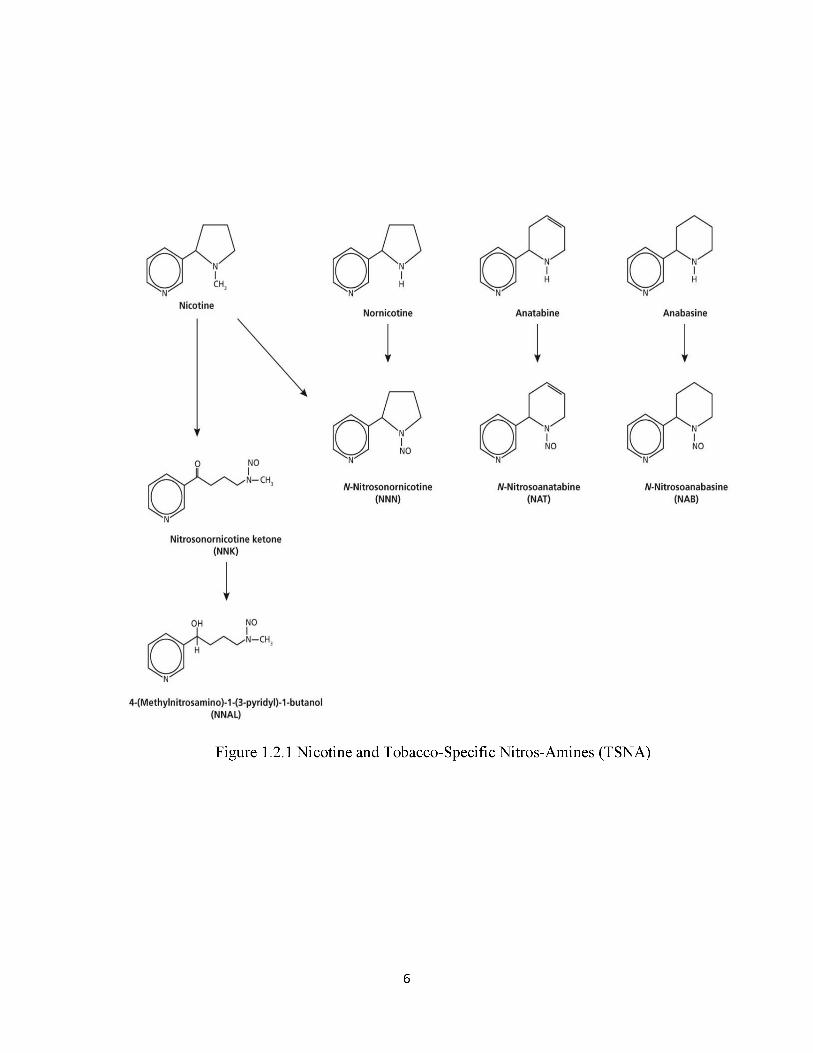
Figure 1.2.1 Nicotine and Tobacco-Specific Nitros-Amines (TSNA)
6

1.3 Trace elements
The human body needs about 72 trace elements for normal functioning. Most of the time
people will acquire trace elements from their environments and from foods without
realizing it. These elements are needed in only small quantities, they are as important as
other vitamins and minerals to our health. While getting a sufficient amount of trace
elements will contribute to overall health and wellness, deficiency of any single trace
element can cause a host of problems for a person's health. Toxic element classification
has a limited value because all trace elements are toxic if ingested or inhaled at sufficiently
high levels and for long enough periods. Heavy metals include antimony, cadmium,
chromium, lead, mercury, and nickel. Many other metals are toxic to plants or animals if
absorbed in excessive amount and these include the essential nutrients copper, cobalt and
to some extent manganese and zinc. Traces of these toxic heavy metals are present in the
environment as cations or inorganic chelates. They are present in most soils and they enter
the environment mostly as an industrial waste product but there is also some concern about
their amounts in agricultural slurry as overuse of chemical fertilizers and sewage sludge systems and septic systems 30.
The trace mineral composition of plants is a modified reflection of trace minerals present
in geochemical environment in which the plants are grown. It is possible to have essential
elements present in a soil without any assurance that plants are absorbing them in sufficient
quantities. Many factors influence the uptake of these elements by the plants e.g. The pH,
organic matter, moisture, pore space, proportion of clay and silt, size and type of soil
microbial life. All these factors will have some effect on the availability of the trace elements to be taken up by plants 31.
1.3.1 Biological role of trace elements and health concern for human
Trace elements play an important role in keeping up the biological balance of the human
body. Most of them are present as primer coenzymes in cells where they perform a wide
range of biochemical processes. By the interaction between metals and proteins these
elements do not only assure the catalytic activity of numerous enzymes, but may also
increase the metabolic stability of protein. There are many examples indicating clearly that
metals are able to exercise control over catalytic reaction both on a quantitative and a
7

qualitative basis. It has been noticed that metals can influence the activity of the enzyme;
when a metal is attached to an enzyme at a distance far from its active center, the
configurational alterations that arise many effect the activity of enzyme 32.
The great majority of trace elements serve chiefly as key components of systems (protein
with vital functions). If the metal atom is removed, the protein usually losses its capacity
to function as an enzyme. Trace elements play a significant role in keeping the immune
system properly working also control of hormones and vitamins balance 33.
Wacker and Vallee were the first to show convincingly, the presence of metals in nucleic
acid macromolecules. They found chromium (Cr), nickel (Ni), and manganese (Mn) in
Ribo-Nucleic Acid (RNA). If these metals exercise control over the configuration of
nucleic acid by stabilizing the secondary helical structure in manner similar to disulfide
bridges, then they must be considering to play a role in the protein synthesis and hence in
the transmission of genetic information 34.
1.3.2 Trace and toxic elements in tobaccoTo some extent the toxicological character of tobacco snuff has significant correlation to
trace element as an on-going subject of debate. The toxicity of some metals found in
tobacco has also been reported. Cd in smokeless tobacco has been shown to be associated
with arterial disease both Ni and Co cause dermatitis and oral allergic sensitizations; Cu
may cause free radical-induced lung injury, while Pb levels have been associated with
elevated blood pressure and Mn was shown to cause pulmonary inflammation in rats. oral
allergic contact dermatitis is known to be caused by Cr (VI) 35.
1.3.2.1 Cadmium
Cadmium and cadmium compound are toxic substances by all means administration,
producing acute or chronic symptoms varying in intensity from irritation to death.
Inhalation of cadmium fumes, oxides and salts produce emphysema, which may be
followed by bronchitis. Acute and chronic exposure to cadmium in animals and human
results in kidney desalination, hypertension, anemia, and liver damage 36.
USEPA (1996) has set the drinking water standard at 0.005 mg/l for cadmium and it has
been classified in EPA's Group B 1 (probable human carcinogen) 37. Humans receive
cadmium through air, food and tobacco. The amount of cadmium retained in the body can
8

be increased to 3 to 4 mg per day if person is heavy a smoker or if the person lives in
contaminated environment 38.
1.3.2.2 CobaltCobalt is unique among trace element and essential to all animals. It is a key constituent of
cobalamin, also known as vitamin B12, which is the primary biological reservoir of cobalt as one of
the cobalamin derivatives and ultra-trace element. Bacteria in the guts of ruminant animals convert
cobalt salts into vitamin B12, a compound which can only be produced by bacteria or archaea. The
minimum presence of cobalt in soils therefore markedly improves the health of grazing animals,
and an uptake of 0.20 mg/kg a day is recommended for them, as they can obtain vitamin B12 in no
other way. Numerous plants and microorganisms use vitamin B12 as their primary source of cobalt.
In freshwater, the dominant species Co2+, CoCO3, Co(OH)3, CoS although lesser amounts
of CoSO4 and CoCl+ may also be detected, chloride complexes dominate in seawater.
Cyanocobalmin, or vitamin B12 is a cobalt coordination compound found in surface waters. 46
1.3.2.3 ChromiumTrivalent chromium (Cr (III) or Cr3+) occurs in trace amounts in foods and waters, and
appears to be benign. Because of the specific transport mechanisms, only limited amounts
of chromium (III) enter the cells. Several in vitro studies indicated that high concentrations
of chromium (III) in the cell can lead to DNA damage. Acute oral toxicity ranges between
1.5 and 3.3 mg/kg. In contrast, hexavalent chromium (Cr(VI) or Cr6+) is very toxic and
mutagenic when inhaled. Cr (VI) has not been established as a carcinogen when in solution,
although it may cause allergic contact dermatitis (ACD). The acute oral toxicity for
chromium(VI) ranges between 50 and 150 |ig/kg. In the body, chromium (VI) is reduced
by several mechanisms to chromium (III) already in the blood before it enters the cells.
The acute toxicity of chromium (VI) is due to its strong oxidation properties. After it
reaches the blood stream, it damages the kidneys, the liver and blood cells through
oxidation reactions. Chronic exposure to high hexavalent chromates level has been
correlated with lung cancer and observed to produce irritation of the skin. Chromium of
the human plasma is bound to transferrin component of the B - globulin fraction of the
plasma proteins and it is essential for maintaining normal glucose tolerance and is a
cofactor with insulin. Chromium deficiency is characterized by disturbances in glucose, lipid and protein metabolism 39.
9

1.3.2.4 CopperThe biological role for copper commenced with the appearance of oxygen in earth's
atmosphere. Copper proteins have diverse roles in biological electron transport and oxygen
transportation processes, that exploit the easy interconversion of Cu (I) and Cu(II). In
cytochrome oxidase, copper is required for aerobic respiration, copper and iron cooperate
in the reduction of oxygen. It is also found in many superoxide dismutase, proteins that
catalyze the decomposition of superoxide, by converting it (by disproportionation) to oxygen and hydrogen peroxide 40.
Copper effect is performed through the activation of enzymes. It is essential for blood
synthesis and the functioning of the nervous system. Lack of copper provides malfunction
in the blood synthesis, and the immune reaction declines. the flexibility of the bones and
the veins declines as well. Inflammation can easily occur in the organism in case of copper deficiency 41.
1.3.2.5 Manganese
It is present in all plant tissues, particularly concentrated in green leaves, shoots and seeds.
It acts as catalyst in several important enzymatic and physiological reactions in plants. In
excess amounts it can be toxic and may also reduce the viability of iron. It is generally
involved in the respiratory process such as oxidation of carbohydrate to carbon dioxide and
water. Another function is activating of enzymes involved in synthesis of chlorophyll.
1.3.2.6 Nickel
Nickel is an essential trace element widely distributed in very low concentrations in both
plant and animal tissues. The occurrence of a nickel containing metalloid-protein in human
serum suggests that nickel supports the absorption of iron, and it can also replace some
trace elements in some enzymes insuring their proper activity. Nickel is consistently
present in RNA from diverse sources in concentration many times higher than in the
material from which RNA isolated 34.
Nickel has a relatively low toxicity. Nickel carbonyl is a very toxic, flammable liquid
which decomposes into metallic Ni and carbon monoxide. Exposure to air borne nickel
dust and vapors may cause cancers of the lung and sinus, disorder of the respiratory system and dermatitis 42.
10
1.3.2.7 ZincZinc is an essential trace element necessary for plants, animals, and microorganisms. It is
serves as structural ions in transcription factors and is stored and transferred in
metallothioneins. It is typically the second most abundant transition metal in organisms
after iron and it is the only metal which appears in all enzyme classes. There are 2-4 grams
of zinc distributed throughout the human body. Most zinc is in the brain, muscle, bones,
kidney, and liver, with the highest concentrations in the prostate and parts of the eye 43.
The free zinc ion in solution is highly toxic to plants, invertebrates, and even vertebrate
fish. The most common of zinc poisoning in human being is a non-fatal metal fume fever
caused by inhalation of zinc oxide fumes. When inhaling contaminated air with Zn vapors
animals can develop some kind of illnesses, e.g. damage of lung and liver. The
concentrations of 1 pg/m3 zinc chloride and 5 mg/m3zinc oxide, in smoke are safe 44
1.3.2.8 LeadLead is a highly poisonous metal (regardless if inhaled or swallowed), it is rapidly absorbed
into the blood stream affecting almost every organ and system in the body. The main target
for lead toxicity is the nervous system, and is believed to have adverse effects on the
cardiovascular system, kidneys, and the immune system 45. In adults and children long
term exposure to lead or its salts (especially soluble salts or the strong oxidant PbO2) can
cause nephropathy, and colic-like abdominal pains. It may also cause weakness in fingers,
wrists, or ankles. Lead exposure also causes small increases in blood pressure, particularly
in middle-aged and older people and can cause anemia. The component limit of lead (1.0
pg/g) is a test benchmark for pharmaceuticals, representing the maximum daily intake an
individual should have. However, even at this low level, a prolonged intake can be
hazardous to human beings 46. The toxicity of lead has been studied with special reference
to the poisoning with organic lead, such as tetraethyl lead compounds are absorbed from
the respiratory tract, gastrointestinal tract, and skin. The major portion of volatile organic
lead accumulates in the brain due to a special affinity between organic lead and the lipids
of nerve tissues. Tetraethyl lead is a hundred or more times as toxic as inorganic lead 47.
11

1.4 Instrumentation
1.4.1 High performance liquid chromatographyHigh performance liquid chromatography (HPLC) is a quantitative and qualitative method
developed in recent years from traditional column chromatography. It becomes as
important as gas chromatography for separation of mixtures of organic components. The
main advantage compared with gas chromatography is that it is not necessary first to
prepare volatile derivatives.
In HPLC, the liquid mobile phase (solvent) is pumped through the column individual
components being separated on the basis of their relative affinities between the mobile and
stationary phases. The time for a particular component to reach the detector is used in
identification.
Figure (3.1.1) is a schematic showing the important components of a typical high
performance liquid chromatograph; each discussed in the paragraphs that follow
1.4.1.1 Mobile phase reservoirs and solvent treatment systemsa modern HPLC apparatus is equipped with one or more glass or stainless steel reservoirs,
each of which contains 200 to 1000 ml. of solvent. The reservoirs are often equipped with
a means of removing dissolved gases usually oxygen and nitrogen that interfere by forming
bubbles in the column and detector systems. Degassers may consist of a vacuum pumping
system, a distillation system, devices for heating and stirring the solvents or systems for
sparging in which the dissolved gases are swept out of the solution by fine bubbles of an
inert gas of low solubility. Often the systems also contain a means of filtering dust and
particulate matter from the solvents to prevent these particles from damaging the pumping
or injection systems or clogging the column. A convenient way of treating solvents before
introduction in to the reservoir is to filter them through a Millipore filter under vacuum.
This treatment removes gases as well as suspended matter.
A separation that employs a single solvent of constant composition is termed an isocratic
elution. Frequently, separation efficiency is greatly enhanced by gradient elution. Here two
or three solvent systems that differ significantly in polarity are employed. After elution is
begun, the ratio of the solvents is varied in a programmed way, sometimes continuously
12

Schematic of HPLC apparatus
Pulse damper waste
Column
ColumnPressure
transducer
Figure 1.4.1 HPLC schematic apparatus 48
Regulated helium sourcen
13

and sometimes in a series of steps. Modern HPLC equipment is often equipped with
devices that introduce solvents from two or more reservoirs into a mixing chamber at rate
that vary continuously; the volume ratio of the solvents may then be altered linearly or
exponentially with time.
1.4.1.2 Pumping systemthe requirements for an HPLC pumping system are severe and include; the generation of
pressure or up to 6000 psi(Ibs/in2), pulse free output, flow rates ranging from 0.1 to 10
ml/min, flow control and flow reproducibility of 0.5 % relative or better and corrosion
resistant components (seals of stainless steel or Teflon). It should be noted that the high
pressure generated by HPLC pumps do not vary compressible. Thus rupture of component
of the system results only in solvent leakage and may constitute a fire hazard.
Three types of pumps each with its own set of advantage and disadvantages; are
encountered namely reciprocating pumps which are currently used in 90% of the
commercially available HPLC systems. It consists of a small chamber in which the solvent
is pumped by the pack and forth motion of a motor driven piston two ball check valves,
which open and close alternately, control the flow of solvent into and out of a cylinder. The
other two pumps types are syringe or displacement-type pumps, and pneumatic or constant
pressure pumps.
1.4.1.3 Sample injection systemoften the limiting factor in the precision of liquid chromatographic measurement lies in the
reproducibility with which samples can be introduced on to the column packing. The
problem is exacerbated by band broadening which accompanies overloading columns.
Thus the volumes used must be minuscule a few tenths of a microliter to perhaps 500^L.
The earliest and simplest means of sample introduction was syringe injection through a
self-sealing elastomeric septum. For this purpose, micro syringes designed to with stand
pressures up to 1500 psi are used. In stop-flow injections, a fitting at the column head is
removed. And the sample is injected directly onto the head of the column packing. After
replacing the fitting, the system is again pressurized.
The most widely used method of sample introduction in liquid chromatography is based
upon sampling loops. Sampling loops of this type permit the introduction of samples at
14

pressures up to 7000 psi with precision of a few tenth present relative. Micro sample
injection valves, with sampling loops having volumes of 0.5 to 5^L. are also available.
1.4.1.4 Liquid chromatographic columnsliquid chromatographic columns are ordinarily constructed from smooth-bore stainless
steel tubing, although heavy walled glass tubing is occasionally encountered. The latter is
restricted to pressures that are lower than about 600psi. The majority of liquid
chromatographic columns range in length from 10 to 30 cm normally the columns are
straight with added length, where needed being gained by coupling two or more columns
together. The inside diameter of liquid columns is often 4 to 10mm; the most common
particle size of packing is 5 or 10^m. perhaps the most common column currently in use is
one that is 25cm length 4.6mm inside diameter and packed with 5^m particles. Column of
this type contain 40,000 to 60,000 plates/meter. Recently, manufacturers have been
producing high speed, high performance columns, such columns may have inside diameters
that range from 1 to 4.6mm and may be packed with 3 or 5 Lim particles. Often their length
as short as 3 to 7.5 cm. such columns contain as many as 100,000 plates/meter and have
advantage of speed and minimal solvent consumption.
1.4.1.5 Types of column packingtwo basic types of packing have been used in liquid chromatography, pellicular and porous
particle. The former consist of spherical, non-porous, glass or polymer beads with typical
diameter or 30 to 40 |im. A thin, porous layer of silica, silica, alumina, a poly styrene
divinyl benzene synthetic resin is deposited on the surface of these beads. For some
applications, an additional coating is applied, which consists of a liquid stationary phase
that is held in place by adsorption. Alternatively, the beads may be treated chemically to
give an organic surface layer. currently, pellicle packing is used largely for guard columns
and not for analytical columns. The typical porous micro particles having diameters
ranging from 3 to 10 |im. for a given size particle size. The particles are of silica, alumina,
the synthetic resin polystyrene-divinyl benzene or an ion-exchange resin. Silica particles
are prepared by agglomerating submicron silica particles under conditions that lead to
larger particles having highly uniform diameters. The resulting particles are often coated
with thin organic films, which are chemically or physically bonded to the surface.
15

1.4.1.6 DetectorsLiquid chromatographic detector are two basic types. Bulk property detectors respond to a
mobile-phase bulk property, such as refractive index, dielectric constant, or density, which
is modulated by the presence of solutes. In contrast, solute property of solutes, such as UV
absorbance, fluorescence, or diffusion current, that is not possessed by the mobile phase 48.
1.4.2 ICP-AES
The ICP-AES is composed of two parts: the ICP and the optical spectrometer. The ICP
torch consists of 3 concentric quartz glass tubes. The output or "work" coil of the radio
frequency (RF) generator surrounds part of this quartz torch. Argon gas is typically used
to create the plasma.
When the torch is turned on, an intense electromagnetic field is created within the coil by
the high power radio frequency signal flowing in the coil. This RF signal is created by the
RF generator which is, effectively, a high power radio transmitter driving the "work coil"
the same way a typical radio transmitter drives a transmitting antenna. Typical instruments
run at either 27 or 40 MHz. The argon gas flowing through the torch is ignited with
a Tesla unit that creates a brief discharge arc through the argon flow to initiate the
ionization process. Once the plasma is "ignited", the Tesla unit is turned off.
The argon gas is ionized in the intense electromagnetic field and flows in a particular
rotationally symmetrical pattern towards the magnetic field of the RF coil. A stable, high
temperature plasma of about 7000 K is then generated as the result of the inelastic collisions
created between the neutral argon atoms and the charged particles.
A peristaltic pump delivers an aqueous or organic sample into an analytical
nebulizer where it is changed into mist and introduced directly inside the plasma flame.
The sample immediately collides with the electrons and charged ions in the plasma and is
itself broken down into charged ions. The various molecules break up into their respective
atoms which then lose electrons and recombine repeatedly in the plasma, giving off
radiation at the characteristic wavelengths of the elements involved.
In some designs, a shear gas, typically nitrogen or dry compressed air is used to 'cut' the
plasma at a specific spot. One or two transfer lenses are then used to focus the emitted light
on a diffraction grating where it is separated into its component wavelengths in the optical
16

spectrometer. In other designs, the plasma impinges directly upon an optical interface
which consists of an orifice from which a constant flow of argon emerges, deflecting the
plasma and providing cooling while allowing the emitted light from the plasma to enter the
optical chamber. Still other designs use optical fibers to convey some of the light to separate
optical chambers.
Within the optical chamber(s), after the light is separated into its different wavelengths
(colors), the light intensity is measured with a photomultiplier tube or tubes physically
positioned to "view" the specific wavelength(s) for each element line involved, or, in more
modern units, the separated colors fall upon an array of semiconductor photodetectors such
as charge coupled devices (CCDs). In units using these detector arrays, the intensities of
all wavelengths (within the system's range) can be measured simultaneously, allowing the
instrument to analyze for every element to which the unit is sensitive all at once. Thus,
samples can be analyzed very quickly.
The intensity of each line is then compared to previously measured intensities of
known concentrations of the elements, and their concentrations are then computed by
interpolation along the calibration lines. In addition, special software generally corrects for
interferences caused by the presence of different elements within a given sample matrix.
17

Spectrometer
^7Gas-liquid separator
Nebnllser
Computer
Coolant
Auxiliary ” ’ '
Germane
17 an
Waste
GaiControl
NaBH< ->
Sample+ — Acid
Peristaltic pimp
RFSupply
Figure 1.4.2 ICP-AES schematic apparatus
18

1.5 Problem statementAccording to literature carcinogens seep through the membrane of the oral intervention to
the circulatory system and then pass to the brain and other tissues in the human body,
including the oral membrane. The monitor in the scientific study of some of the facts which
confirm that toombak causes oral cancer because it contains carcinogens is nitrosamines
and hydrocarbons, which affect the body's cells, and these facts:
• Increase cancer probability five times in people who use toombak compared to
other people or twenty times abuse If the period of thirty years.
• Gender: women using toombak more prone to injury than men who use toombak.
• Age: we find the average oral cancer who were injured were 57 -year-old any
more than the emergence of cancer susceptibility with age it is only a matter of
time for those who used toombak especially after the appearance of white paint
mouth.
• Ways to use toombak duration and times of use and periods spent in the mouth
the more of these factors the greater the odds of cancer.
• Toombak Quality as containing carcinogens compared with toombak used in
other countries.
• Diseases that affect the mouth, such as syphilis increase the carcinogenic effect of
toombak.
National Center for Nuclear Medicine and Radiotherapy Created specialized clinics to help
addicts as a promising toombak research center and smoking Sudanese draft law to combat
smoking and toombak NPC include increasing public awareness of the dangers as well as
laws to prevent its use in public places.
Lack of information on levels of mineral toxicology of toombak should elicit a concern.
Due to increasing consumption of snuff in Sudan, a study of the mineral contents especially
those of the toxic fraternity in the snuffs is desirable. Therefore, it is necessary to measure
these elements in assessing the possible role they may play in causing diseases.
Furthermore, information in respect of the toxicological nature of the pharmacy-based
snuff would bring about public knowledge as to whether the health needs of toombak users
are being served better.
19

1.6 Objectives
As part of deliver research that serve the community and to human health and the
environment this work seeks to fill the gap. In this study, Special attention was given to
elements that play a significant toxicological role after entering the human body through
tobacco snuff assimilation. On the other hand, this work aims to study the influence of
toombak procession methods on trace elements concentrations and the toxicological
strengths of the different snuff types with series of sample prepared with different natron
concentration which was used in procession of tobacco leaves. Also to quantifying the
concentration of the identified toxic element. This study has been issued to determine the
concentrations of some trace elements and nicotine in toombak and their relationship to
oral cancer. This is represented in the following:
•Determine the nicotine content in toombak samples and find out the natron
concentration impact on procession process.
•Determine the proportions of toxic trace elements (lead, cadmium, cobalt, cupper,
chromium, nickel, zinc and manganese) in toombak samples using inductive coupled
plasma atomic emission spectroscopy.
•Collection of data in toombak use and its relationship to oral cancer in Sudan.
20

Chapter Two

Literature Review
2.1 Nicotine and Nitrosamines compounds previewOral tobacco products from five WHO regions were analyzed for total nicotine and TSNAs,
including 4-(methyl-nitrosamino)-1-(3-pyridyl)-1-butanol (NNAL), using gas
chromatography or liquid chromatography with mass spectrometric detection. Un ionized
nicotine concentration (the most readily absorbed form) were calculated using product pH
and total nicotine concentrations. Total nicotine content varied from 0.16 to 34.1 mg/g
product, whereas, the calculated unionized nicotine ranged from 0.05 to 31.0 mg/g product;
a 620-fold range of variation. Products pH ranged from 5.2 to 10.1, which translates to
0.2% to 99.1% of nicotine being in the unionized form. Some products have very high pH
and correspondingly high unionized nicotine (gel powder, chimo, Toombak) and/or high
TSNA (Toombak, zarda, khaini) concentrations. The concentrations of TSNAs spanned
five orders of magnitude with concentrations of 4-(methyl nitrosamino)-1-(3-pyridyl)-1-
butanone (NNK) ranging from 4.5 to 516,000 ng/g product. These data have important
implications for risk assessment because they show that very different exposure risks may
be posed through the use of these chemically diverse oral tobacco products 24.
In the United States, pH, moisture, nicotine (total and un protonated) were measured, and
tobacco-specific N-nitrosamines (TSNAs) for other established (twist, loose leaf, plug, and
dry snuff without pouch) and emerging oral tobacco products (dry snuff pouch, US-made
snus, and dissolvable tobacco). Among the seven product categories, product pH ranged
from 4.7 to 7.9, and total nicotine concentration spanned from 3.9 to 40.1 mg/g. The most
readily absorbable form of nicotine (un protonated nicotine) varied more than 350-fold,
ranging from 0.01 to 3.7 mg/g. While the highest total nicotine concentrations were
observed in twist products, snus and dissolvable tobacco had the highest un protonated
nicotine levels. Among all products, total TSNA concentrations ranged from 313 to 76,500
ng/g with dry snuff having the highest total TSNA concentrations. But it can be difficult
differentiating the effects of nicotine from the many other toxic substances these products
also contain. Characterizing the chemical content of these products may be helpful in
further understanding the risk of marketing these products to oral tobacco users and
smokers as an alternative and discrete form of tobacco 21.

Nicotine is the most abundant organic compound; it reacts to form tobacco-specific
nitrosamines (TSNAs). TSNAs are amongst the most abundant carcinogenic compounds
identified in tobacco smoke and they have been related to acute leukoplakia and lung
cancer. Idris et.al. have analyzed the TSNA levels in 20 samples of Sudanese toombak, of
four different quality levels, collected from five different vendors. Using GC coupled with
thermal energy analysis, four TSNA were quantified in snuff extracts: N'-
nitrosonornicotine (NNN), N'-nitrosoanatabine (NAT), N'-nitrosoanabasine (NAB) and 4-
(methyl-nitrosamino)-1-(3-pyridyl)-1-butanone (NNK). In addition to the four TSNA a
two new nitrosamines were detected in snuff, namely 4-(N-nitrosomethylamino)-1-(3-
pyridyl)-1-butanol (NNAl) and 4-(N-nitrosomethylamino)-4-(3-pyridyl)-1-butanol (Iso-
NNAl). Unusually high levels of these TSNA were detected; NNN and NNK are formed
from nicotine during curing, aging, and especially during procession of tobacco 4.
Of all TSNAs identified, N-nitrosonornicotine (NNN) and 4-(methylnitrosoamino)-1-(3-
pyridyl)-1-butanone (NNK) are the most prevalent carcinogens in tobacco products and are
classified as carcinogenic for humans (Group 1 IARC) 49.
Another interesting TSNA is 4-(methylnitrosoamino)-1-(3-pyridyl)-1-butanol (NNAL),
which is the main metabolite of NNK and has the same dangers. Moreover, more volatile
N-nitrosamines, with genotoxic and carcinogenic properties can be formed in the
atmosphere because of the presence of nitrogen-containing species originating during
combustion processes. Some studies have also detected the presence of volatile N-
nitrosamines, such as N-nitrosodimethylamine and N-nitrosopyrrolidyne, in environmental
tobacco smoke.
The TSNAs are by far the most powerful and most abundant carcinogens in snuff.
However; Grasso and Mann declared in 1998 no carcinogenic activity was observed when
snuff was inserted into the cheek pouch of the hamster or spread over the oral mucosa. This
negative result was obtained in a number of experiments whether snuff was applied once
only and left in place for several months or inserted repeatedly for up to 2 years. In the rat,
a few tumors were observed when snuff was inserted into the artificial lip canal. An extract
of snuff applied to the oral mucosa of the rat did not produce any tumors, but an extract
enriched by the addition of 10 times the naturally-occurring amounts of NNN and NNK
produced a few benign tumors at the site of application 50. A higher incidence of tumors
22

was produced when an equivalent amount of an aqueous solution of these two nitrosamines
was applied directly to the oral mucosa, suggesting, according to the authors, that snuff
inhibits the carcinogenic activity of TSNAs. The result of this study does not provide valid
evidence of carcinogenicity. These results give some degree of reassurance that snuff is
not likely to be carcinogenic to the human oral mucosa and requires further investigation 51
Exposure to tobacco-specific nitrosamines (TSNA) has been measured in the saliva of 12
users of Sudanese oral snuff (Toombak). Using GC coupled to thermal energy analysis,
levels of N'-nitrosonornicotine (NNN), N'-nitrosoanatabine (NAT), N'-nitrosoanabasine
(NAB) and 4-(methylnitrosamino)-1-(3-pyridyl)-1-butanone (NNK) were measured
before, during and after snuff taking. In addition, two TSNA, 4-(methylnitrosamino)-1-(3-
pyridyl)-1-butanol (NNAL) and 4-(methylnitrosamino)-4-(3-pyridyl)-1-butanol (iso-
NNAL), were detected in the saliva of tobacco chewers for the first time and were
confirmed by GC-MS. Nine out of 10 subjects had detectable saliva levels of total TSNA
before chewing (0.01-1.0 micrograms/ml) and immediately following chewing (0.1-2.6
micrograms/ml). During dipping, TSNA concentrations reached microgram/ml levels;
(range; number of subjects positive) NNN: (0.6-2.1; 12/12), NAT (0.06-0.5; 2/12), NAB
(0.05-1.9; 12/12), NNK (0.06-6.7; 11/12), NNAL (0.05-3.3; 11/12) and Iso-NNAL (0.07
0.4; 8/12). These saliva TSNA levels, which are 10-100 times the levels previously
reported, are consistent with recent observations of unusually high TSNA levels in Sudanese toombak 52.
To estimate the internal dose of 4-(methylnitrosamino)-1-(3-pyridyl)-1-butanone (NNK)
received by individuals who use this type of tobacco, urine from a group of users was
analyzed by gas chromatography with a nitrosamine selective detector for 2 metabolites of
NNK, 4-(methylnitrosamino)-1-(3-pyridyl)-1-butanol (NNAL) and its O-glucuronide,
NNAL-Gluc. The average levels detected were 0.39 +/- 0.14 (SD) nmol/ml urine (n = 7)
and 0.88 +/- 0.50 nmol/ml urine (n = 7) respectively. In a 24-h period, these individuals
would excrete from 0.12 to 0.44 mg of these two metabolites (expressed per mg NNAL).
Therefore, assuming chronic Toombak use, the minimum daily dose of NNK to which
these users were exposed was 0.12-0.44 mg. This is the highest documented uptake of a
23

non-occupational carcinogen. Two diastereomers of NNAL-Gluc were present in all urine samples analyzed 53.
The level of the 4-hydroxy-1-(3-pyridyl)-1-butanone releasing hemoglobin adduct was
also quantified in these individuals. This adduct is believed to be a measure of NNK
activation. The levels ranged from 68 to 323 fmol/g hemoglobin [mean, 148 +/- 104 (SD)].
The wide range of adduct levels which were observed suggests that despite similar levels
of NNK exposure, there are significant differences in the ability of individuals in this
population to activate NNK, as well as potential differences in their cancer risk.
Considerable evidence exists that TSNA may cause cancer in humans. Strong evidence
suggests that the NNN and NNK in snuff are at least partially responsible for the excess of
oral cancer among snuff dippers. Tobacco smoke, because it is a combustion product, is a
far more complex matrix than is smokeless tobacco. Nonetheless, NNK is well established
as a lung carcinogen in laboratory animals at levels similar to those experienced by heavy
smokers.
Exploratory work is in progress with various biological markers that may prove useful in
quantifying the levels of TSNA exposure in humans. Epidemiologic evidence indicates that
in addition to tobacco use other factors are causally related to the development of cancers
of the oral cavity, lung and esophagus and that these factors (e.g., radon exposure in
uranium miners who smoke) can act synergistically. Experimental investigation of some
of these synergistic effects may prove to be a step in the direction of determining the
proportion of various cancers that are likely to be attributable to various causes and
ultimately to the various constituents of tobacco exposure 54.
Significant decrease in cell number, occurrence of DNA double-strain breaks,
morphological and biochemical signs of programmed cell death were detected in all oral
cell types exposed to clinically relevant dilutions of Toombak extract, although to a lesser
extent in normal oral fibroblasts and dysplastic keratinocytes. G2/M-block was also
detected in normal oral keratinocytes and fibroblasts exposed to clinically relevant
dilutions of Toombak extract. formation of globin and DNA adducts of NNK and NNN in
experimental animals. Sensitive methods for the detection and quantitation of these adducts
24

in humans would provide an approach to assessing individual risk for tobacco-related54cancers 54.
2.2Global prospectiveOver all prevalence of smokeless tobacco use in 145 of the 194 WHO member states at
national and subnational levels, for youth and adult's smokeless tobacco use data were
reported. This WHO reports the prevalence of smokeless tobacco use among youth in 75
countries and adults in 70 countries. Of the 75 countries for which youth smokeless tobacco
use prevalence was reported, national level estimates were available for 57 countries and a
total of 18 subnational countries estimates were reported. The 11 countries were in African
region not include Sudan, 9 the Eastern Mediterranean Region, 11 in the European Region,
14 in the Americas Region, 8 in the south East Asia Region and 4 in the Western Pacific
Region. The prevalence of current use of smokeless tobacco among countries assessed in
the African Region ranged from 16.4% in Congo to 5.4% in Swaziland. Among countries
assessed in the Eastern Mediterranean Region, over all prevalence ranged from 12.6% in
Djibouti to 1.6% in Oman. In the European Region the highest prevalence was reported in
Estonia 6.9 % and the lowest in Montenegro 1.1%. In the Americas Region, the highest
prevalence was in Barbados 9.8% and the lowest in Canada 1.8%. In the South East Asia
Region, prevalence was highest in Bhutan 9.4% and the lowest in Indonesia 2.8%. In
Western Pacific Region, Cook Island had the highest prevalence 8.7% and Macau the
lowest 2.1%. Of the 70 countries for which adult's smokeless tobacco use prevalence was
reported, national level estimates were available for 64 countries and subnational estimates
for 7 countries were reported for various age groups and in most cases by gender. Countries
were grouped by WHO region, and surveys span the years 2002 through 2012. Countries
in the South East Asia Region generally appear to have higher rates than those in other
region. The 20 countries were in African region not include Sudan, 5 the Eastern
Mediterranean Region, 16 in the European Region, 8 in the Americas Region, 8 in the south
East Asia Region and 7 in the Western Pacific Region. In the 49 countries had a total
estimate current use of smokeless tobacco among adults ranged from 29.6% in Myanmar
to 0.0% in Uruguay. Among men, prevalence ranged from 51.4% in Myanmar to 0.0% in
Uruguay and Barbados, whereas among women the prevalence ranged from 28.3% in
Mauritania to 0.0% in six countries (Armenia, China, Moldova, Switzerland, Ukraine, and
25

Uruguay). Over all prevalence among adults was high 10% or greater in 11 countries
(Bangladesh, Bhutan, India, Micronesia, Myanmar, Nepal, Norway, Priyanka, Sweden,
Yemen, and Uzbekistan). Six of these countries were located in the South East Asia
Region. A review of the prevalence of current use of smokeless tobacco among adults
assessed in the African Region ranged from 9.2% in Benin to 1.1% in Gambia. Among
countries assessed in the Eastern Mediterranean Region, over all prevalence ranged from
10.7% in Yemen to 1.2% in Libya. In the European Region the highest prevalence was
reported in Sweden 17 % and the lowest in Latvia and Switzerland (both 0.1%). In the
Americas Region, the highest prevalence among adult was in United State 3.2% and the
lowest in Uruguay 0.0%. In the South East Asia Region, prevalence was highest in
Myanmar 29.6% and the lowest in Thailand 3.9 %. In Western Pacific Region, Micronesia
had the highest prevalence 11.4% and China the lowest 0.4% 39.
For both genders, cancer of the mouth and pharynx ranks sixth overall in the world; it is
also the third most common site among males in developing countries. In industrialized
countries, men are affected two to three times as often as women, largely due to higher use
of alcohol and tobacco. Ethnicity strongly influences prevalence due to social and cultural
practices, as well as socioeconomic differences. In population terms, survival rates around
the world show little improvement. In terms of etiology, the effects of tobacco use, heavy
alcohol consumption, and poor diet together explain over 90 percent of cases of head and
neck cancer. All forms of tobacco represent risk factors for oral cancer, but on present
evidence, snuff habits as they exist in Scandinavia and probably in the United States carry
lower risks of serious health hazards, including oral cancer. Alcohol synergizes with
tobacco as a risk factor for all upper aero digestive tract SCC: this is super-multiplicative
for the mouth, additive for the larynx, and between additive and multiplicative for the
esophagus. The increase in oral cancer in the Western world has been related to rising alcohol use 55.
Oral snuff, used by 20% of all Swedish males in 1996, causes blood nicotine levels similar
to those in smokers. In a report by the National Board of Health and Welfare in 1997, it is
concluded that scientific evidence of oral snuff as a cause of oral cancer is weak.
Epidemiological studies of more than 100,000 construction workers showed hypertension
(blood pressure > 160/90) to be more common among oral snuff users than among non
26

users. Twelve-year follow-up showed the relative risk of death due to cardiovascular
disease to be 2-fold greater among snuff users, but 3-fold greater among smokers, as
compared to never-users of tobacco (p < 0.001). The risk of death due to cancer was similar
among snuff users and among never-users. In a clinical study of 151 healthy middle-aged
men, 24-hour monitoring showed daytime heart rates and blood pressure to be significantly
higher in snuff users > or = 45 years of age than in age-matched non-users (p < 0.05). The
estimated 10-year future risk of cardiovascular events was 13.2% for smokers (p < 0.001)
and 4.6% for oral snuff users (p = 0.3) as compared with 3.4% for never-users 56. As
compared with non-users, oral snuff users manifested neither significant signs of
accelerated atherosclerosis nor significantly reduced maximum physical capacity.
However, oral snuff usage does not seem to be associated with the same risk of accelerated atherosclerosis as is smoking 57.
A total of 186 cases of oral carcinoma were treated at the Institute of Radiotherapy and
Nuclear Medicine (IRNUM), Peshawar, and at the District Headquarter Teaching Hospital,
Abbottabad, during a two-year period. These patients were investigated for their personal
habits and environmental factors. Use of nasswar was the most significant habit. We found
that 91% of patients had the habit of nasswar dipping for more than 10 years. A significant
correlation of the oral lesions was found with the site of the nasswar (snuff) dipping 58.
Like many other countries in South East Asia, oral cancer is one of the common cancers in
Bangladesh. 103 cases of biopsy proven squamous Cell Carcinoma of the oral cavity
collected from different Medical Institutions in Dhaka; to find out relationship between
chewing and smoking habit and anatomic site of the cancer in oral cavity. It has been
observed that oral cancers are common in older age groups and the proportion is higher in
males as compared to females. Buccal mucosa has been the commonest site, the next being
the anterior two-thirds of tongue. A high percentage of patients revealed tobacco habits in
the form of chewing with betel quid and or smoking. Duration of betel quid chewing and smoking seem important 59.
Until recently, the use of smokeless tobacco had been restricted to a relatively small
percentage of the United States population. Although information for the US is sparse,
extensive epidemiologic data are available from India, where the use of tobacco is
prevalent and the incidence of oral cancer very high. The Indian data suggest that oral
27

cancer and precancerous lesions occur almost solely among those with tobacco habits, the
rate of malignant transformation of precancerous lesions are not greater than in the West,
the relative risk of developing oral cancer is similar in India and in the US, and this risk
rises with duration of use. Thus, it seems likely that increased usage of smokeless tobacco
in the US will eventually lead to an increased incidence of precancerous and cancerous oral
lesions in Americans 60.
Using snuff and chewing tobacco was popular in the United States during the 18th and 19th
centuries, but current data on their use are limited. Pharmacologic and physiologic effects
of snuff and chewing tobacco include the gamut of cardiovascular, endo-cardiologic,
neurologic, and psychological effects that are associated with nicotine. A review of studies
appearing in the scientific literature involving various populations and approaches
indicates that the use of snuff or chewing tobacco is associated with a variety of serious
adverse effects and especially with oral cancer. The studies suggest that snuff and chewing
tobacco also may affect reproduction, longevity, the cardiovascular system, and oral health.
One group estimated that the relative risk of oral cancer in longtime users of snuff varied
from 1.8 to 48 times that of its occurrence in nonusers. But few of the studies have fully
utilized accepted scientific and epidemiologic methods. The Council on Scientific Affairs
concludes there is evidence demonstrating that the use of snuff or chewing tobacco is
associated with adverse health effects such as oral cancer, urges the implementation of
well-planned and long-term studies that will further define the risks of using snuff and
chewing tobacco, and recommends that the restrictions applying to the advertising of
cigarettes also be applied to the advertising of snuff and chewing tobacco 61.
Articles from magazines and newspapers were retrieved from the Magazine Index (1987
to April 1998), Newspaper Abstract (1989 to April 1998) and the Health & Wellness (1987
to April 1998) databases. The articles were analyzed both for adequacy of content and
information. A total of 50 articles and news items including oral cancer were identified and
analyzed, 18 from newspapers and 32 from magazines. Ninety-four percent of the articles
mentioned at least one risk factor for oral cancer. More than half of the articles (56%)
identified spit tobacco (chewing tobacco or snuff) as the major risk factor for oral cancer,
while far fewer mentioned either cigarettes (32%) or cigars (12%). Over 50 percent of the
articles did not mention warning signs for oral cancers. Fourteen percent suggested clinical
28

oral cancer examinations by a health professional; only 8 percent advised the use of self
examination. A total of 417 tobacco advertisements (482 pages) were found among 22
magazines for the one-year period. They included 410 cigarette ads, seven cigar ads, and
no spit tobacco ads. This study demonstrates the lack of coverage about oral cancer in the
popular press in the past decade and provides a partial explanation of the public's lack of
knowledge and misinformation about oral cancers 62.
2.3Tobacco in SudanThe popular name for processed tobacco leaves in Sudan is "toombak" a name which means
snuffing of the product in the local Sudanese language. It has also been suggested that
toombak was introduced to the Sudan from Turkey.
Toombak is a type of chewing tobacco used in Sudan. Its use dates back approximately
four hundred years ago, it contains the Nicotina rustica tobacco species. It is always
processed into a loose moist form, and its use widespread in the country. The leaves of the
toombak plant are dried and grinded into powder, then it is manually processed by mixing
with an aqueous solution of sodium bicarbonate (natron). This process is usually carried
out in the shop by toombak venders. The product after procession is moist with a strong
aroma, which together with the taste decide the quality rank of the product. The ready-to-
use product is sold in small plastic bags each taking is about 100g and its use is widespread
particularly among males.
After procession toombak ready to use has a pH range of (8-11), moisture content ranges
6-60% and nicotine content is from 8 to 102 mg/g dry weight and TSNA contents in
microgram N'-nitrosonornicotine (NNN 420-1 550); 4-(methyl-nitrosamino)-l-(3-pyridyl)-
l- butanone (NNK 620-7 870); N'-nitrosoanatabine (NAT 20-290) 63. Chemical analytical
studies revealed that toombak contains at least hundred fold higher concentrations of the
TSNA than US and Swedish commercial snuff brands 64.
However, the studies on elemental analysis of toombak are limited compared to the
analysis of the organic compounds. Toombak in Sudan contains high concentrations of Cu,
Co, Cd, Cr, Fe, Mn, Pb and Zn. The soil to plant transfer factor determined less than unity.
The authors concluded that there is a strong correlation between the concentrations of Cu-
Zn, Pb-Zn, Co-Fe and Pb-Cd in the soil and their concentrations in the plant. The
29

correlation coefficient between concentration of trace element in soil, and their soil-to toombak transfer factors showed strong correlation 65 and 66.
The habit of toombak dipping is practiced by putting it in the mouth between the gum and
lower lip or upper lip, and some place it in the cavitation lateral mouth or under the tongue.
A regular user consumer an average of 10 to 20 dip (small portion of toombak put in the
mouth) per day.
The dipping continues for a period of time ranging from a few minutes to several hours,
and removed usually by rinsed the mouth with water but sometimes the toombak retained
in the mouth during throw out the insoluble debris that is free from bullous and the saliva
that secreted during toombak use.
During dipping, saliva TSNAs levels in Sudanese toombak, which are 10-100 times the
levels previously reported in any snuff type 67. It plays a significant role in etiology of Oral
Squamous Cell Carcinomas (OSCCs) and is suspected to be associated with neoplasm of
salivary glands and esophagus; also cancer of the cheek, gum, and pharynx.
In animal's laboratory Toombak induce cancer in mice. The TSNAs concentrations in the
saliva of Toombak dippers are about the same as those in a solution that had been assayed
in rats by twice daily swabbing of the oral cavity and had induced tumors of the cheek and palate 53 and 68.
Although oral swabbing with a mixture of NNN and NNK, rats developed tumors of the
oral cavity and lung, showing that these TSNA are not only organ-specific carcinogens but
can also induce local tumors; the swabbing of an extract of toombak containing the same
concentrations of NNN and NNK, significantly fewer tumors were induced in the oral
cavity and lung, indicating inhibition of the tumorigenic activity of the TSNA by other
toombak constituents 69. Epidemiological studies have associated human toombak use with
tumors of the oral cavity. As well as injury to users of cancer, toombak cause many types
of red spots and white sores offices in the lining of the mouth, and bearing the risk of
becoming malignant ones. Receding gums from the teeth, yellowing teeth. These findings draw attention to a significant potential public health hazard 70, 71, 72, 73, 74, 75, 76, and 77.
30

2.3.1 Toombak use statistical data analysisExperts have warned the fight against cancer in Sudan that toombak users representing 80
% of people with oral cancer in Sudan, said the director of nuclear medicine and
radiotherapy Prof. Hussein Mohamed Ahmed that six million of the total population of
thirty million people.
According to statistics studies of toombak Research Center conducted in Khartoum State
and Northern state, River Nile state, Red Sea, Kassala, and Gedaref; there are (6-7) millions
of citizen use toombak rate ranging between (29-35) % for men and ranging between (5
15) % for the abuse of women and a significant proportion of school students primarily and
secondary ratio (9) %.
A cross-sectional survey on the use of toombak in a random population sample in the Nile
State in northern Sudan was conducted. Toombak was particularly prevalent (> 45%)
among men aged 40 years or older. Among women, Toombak use was popular only in the
older age groups; up to 10% of women aged 60 years and older. The prevalence of toombak
use was low (1.7%) among children and adolescents (4-17 years) and was highest in the
oldest age group (70 years and older). Among the adult population aged 18 years and older,
the prevalence of toombak use was significantly higher among men (34.1%) than among
women (2.5 %), and was significantly higher in rural than in urban areas 35.4% and 23.5%
in men respectively 73.
2.3.2 Oral cancer in Sudan and possible association with toombak useSmokeless tobacco has been associated with oral cancer for many decades, including
epidemiologic studies, studies of putative carcinogens such as TSNAs and other
contaminants, and possible cancer inhibitors. A published joint study between Sudanese
researchers and Norwegian and Swedish revealed that Sudanese Toombak contains
carcinogens increase by a hundred times than Sweden Tobacco. Most notable differences
between the two types of tobacco were tobacco species, procession and ageing, nicotine
and tobacco specific N-nitrosamines content, pH, expression of the p53 tumor suppressor
gene, and keratin types 13, 14 and 19. It was, therefore highlighted the oral health hazards
and carcinogenic of toombak compared with the Swedish snus. The study pointed to the
possibility that also lead to cancer of the esophagus where the break with a saliva parts of
toombak also a cancer of the bladder to collect carcinogens with the urine 64.
31

The association between toombak dipping and oral cancer has been investigated thoroughly
during the last three decades. In Sudan oral cancer is the fifth most common cancer type
with incident rate (920/year), comprising 9% of the case reported annually in Africa. Data
from 1,916 cases of oral neoplasms occurring in the Sudan in a 16-year period, from
January 1970 to December 1985, were retrieved and analyzed. The study revealed a
relatively high frequency of oral neoplasms in comparison with neighboring countries.
Squamous-cell carcinoma was the most common oral malignancy (66.5%), followed by
tumors of the salivary gland (14.7%), neoplasms of non-odontogenic and non-epithelial
origin (9.6%) and odontogenic neoplasms (8.6%). Men had a higher frequency than
women. The use of toombak has been stated to play a major role in the etiology of oral
squamous-cell carcinoma in the Sudan, and is suspected to be associated with neoplasms of the salivary glands 70.
A cross-sectional survey using the hospital records 261 cancer cases attending a referral
oral and maxillofacial hospital in Sudan during the period 2006-2007. In this two-years
period study, 261 cases of head and neck cancer were found to be registered at the hospital.
Of these, 152 patients (58.2%) were diagnosed in the year 2006 and 109 patients (41.8%)
in 2007. The male to female ratio was approximately 3:2. The most common pattern was
found to be an intraoral squamous cell carcinoma 192 patients (73.6%) and it is prevalence
among subjects more than 50 year sold 134 patients (85.9%) was significantly greater than
that observed in younger people (p=0.000); and that toombak dippers attributed to 66
patients (34.4%) of all oral SCC cases. Moreover, SCC was found to be more common in
subjects with history of toombak dipping (88%) than in the rest of the study group(P value = 0.001) 78.
Second research was conducted by Mariam et. al.in 360 eligible patients were enrolled
from January 2013 to December 2015. An 84.2% of those with gum cancer and 70% of
patients with floor of mouth cancer were toombak dippers. Toombak is usually placed
between the gingiva and the lower labial sulcus (89.6%). Indeed, most of patients who
present with tumors in these sites were male and 80% used toombak. The involvement of
mandibular gum in Sudan is heavily linked to direct contact with carcinogens in toombak
and by pooling of carcinogens in the floor of mouth due to gravity 79.
32

Recently in 2016 Ahmed and Idris were conclude that toombak use is a significant risk for
the development of high proportion of OSCC among the Sudanese people. Side of dipping
was significantly correlated with the site of lesion, suggesting chronic contact with the
carcinogens was important in the evaluation of OSCC. The risk among exclusive toombak
users was higher among females than males. That is explained by the fact that females dip
toombak at the buccal mucosa and tend to keep the smokeless tobacco at the site of dipping
for longer periods compared to males. This allows exposure of the tissues for longer periods
to carcinogens found in toombak. Furthermore, females indulge in the habit at an older age
than males, usually after menopause. At that age, the female Sudanese probably may also
have micronutrients deficiencies. Sleeping with toombak was a significant risk factor,
which suggests keeping the quid in contact with the mucosa for longer periods increases
the risk. The attribute of risk for toombak use was 66.9% for males and 93.4% for females
and 70.1% overall. The site of quid placement that was in contact with oral mucosa and
development of the carcinoma showed a clinical association 80.
2.3.3 Oral cancer previewAbsorption of toxic and carcinogenic chemicals in tobacco and other ingredients added to
various products were causally associated with several non-communicable diseases
including cancer, especially oral cancer 9. Smoking and smokeless tobacco induce cancer
in humans in 8organ sites; smoking associated genotoxic effect have been found in all eight
sites that have been examined thus far: oral/nasal, esophagus, pharynx/larynx, lung,
pancreas, myeloid organs, bladder/ureter, uterine cervix. It was also produce mutagenic
cervical mucus, micronuclei in cervical epithelial cells and genotoxic amniotic fluid. These
suggest that tobacco may be human germ cell mutagen, producing HPRT mutations and
DNA damage in a variety of tissues. Lung tumors of smokers contain high frequency and
unique spectrum of TP53 and HRAS mutation reflective of the PAH compounds. it was
the most extreme example of a systematic human mutagen 10.
In the Sudan, natives use local Nicotiana rustica, a tobacco species with high levels of
nicotine and nor-nicotine, to prepare their own snuff which called toombak which cause cancer of the oral cavity and pharynx 63.
Epidemiologic studies, show that the use of chewing tobacco and moist snuff is associated
with very low risks for cancers of the oral cavity and upper respiratory site, with relative
33

risks [RR] ranging from 0.6 to 1.7. The use of dry snuff is associated with higher RRs,
ranging from 4 to 13, while the RRs from smokeless tobacco, unspecified as to type, are
intermediate ranging from 1.5 to 2.8. TSNA levels in chewing tobacco have always been
low, but levels in dry snuff have been higher, including some very high levels in current
products 81. Compared with Swedish Snus and Toombak dippers develop a clinically and
histologically characteristic lesion at the site of dipping. Probably due to control of the
TSNAs in snus, this type of snuff is associated with a lower risk of cancer of the oral cavity
(relative risk: RR 5-6-fold), whereas the risk for cancer of the oral cavity among Toombak users was high (RR 7.3-73.0-fold) 64.
Risk increases with increasing length of exposure, with risks greatest for anatomic sites
where the product has been held in contact the longest time. In some studies, other organs,
such as the esophagus, larynx, and stomach, have been shown to be at increased risk for
cancer from the use of smokeless tobacco 82. The documented early reports before thirty
years shown that linking between chewing tobacco use with leukoplakia with less evidence
at that time. In 1989 in Sudan Idries et al. were conducted 78 cases of oral carcinoma to
investigate their association with the habit of taking snuff orally. It was found that 50 (81%)
of the 62 questioned patients that carcinomatous changes usually developed in the area of
the mouth where the snuff was habitually placed. In addition, synergistic interactions with
other oral cancer risk factors, e.g., smoking and alcohol, and a high rate for second
primaries observed for these cancers add to the concern 74.
Investigation of possible causal association between squamous-cell carcinomas of the oral
cavity and use of toombak, a history of use in 375 patients with squamous-cell carcinomas
of the lip, buccal cavity and floor of mouth, and 271 patients with squamous carcinomas
of the tongue, palate and maxillary sinus, with 204 patients exhibiting non-squamous oral
and non-oral malignant neoplasms and 2,820 individuals who had no malignancy, selected
from the general population in Sudan was compared. The first case group, cancer of the
lip, buccal cavity and floor of mouth in comparison with the hospital and population control
groups, were 7.3 and 3.9 (95% confidence limits, 4.3-12.4 and 2.9-5.3) respectively and
among long-term users were 11.0 and 4.3 (95% confidence limits, 4.8-25.1 and 2.9-6.3)
respectively. This revealed that the high prevalence of oral cancer in the Sudan is largely
34

due to chronic use of toombak. The increased risk associated with the hypothesis that direct
contact with tissue is an important factor in tobacco carcinogenesis in the mouth 69.
As part of the development of a screening procedure for oral cancer and pre-cancer in
Sudan. Exfoliate cytology (EFC) was applied to a retrospective cohort to assess the
presence and severity of oral epithelial atypia (ET) in 300 subjects (100 toombak dippers;
100 cigarette smokers; 100 non-tobacco users) without prior knowledge of the subjects'
tobacco exposure. Five patients with oral squamous cell carcinoma (OSCC) were included
as internal controls. ET was ascertained in 29 subjects and could not be ascertained in the
remaining 271. Among the 29 subjects with ET, there were 11 (38%) toombak dippers, 14
(48%) cigarette smokers and 4 (14%) non-tobacco users. ET was found in all the 5 control
cases with OSCC. For the ET among toombak dippers and cigarette smokers, adjusted OR
and the 95% CI were found to be 3 (0.91-9.7) and 4 (1.2-12.3), respectively 68.
Ahmed HG 2013 review 33 publications devoted to an etiology of oral cancer in Sudan,
found that several studies examining risk factors for oral cancer include smoked and
smokeless tobacco, alcohol consumption, occupational risk, familial risk, immune deficits,
virus infection and genetic factors. Toombak use and infection with high risk Human
Papilloma Virus (HPV) were extensively investigated and linked to the etiology of oral cancer in Sudan 82.
35

Chapter Three

Materials and Methods
3.1Collection of data about toombak users by questionnaire and
interviewNumber of samples were two hundred located in Khartoum state -Sudan. The volunteers
were asked in front of the shops where the users buy toombak for fifteen days' period of
collection. The questionnaire has 10 questions showed in appendix (1); the answers were
analyzed using excel program.
3.2 Sampling and samples preparationAs the toombak quality, judged by the consumers, depends on the taste; toombak treatment
methods vary considerably from a vender to another depending on what their customers
demand.
Two groups of toombak samples were analyzed; the first group is composed of six snuff
samples processed in the laboratory using different natron concentration according to the
weight of tobacco leaves (Table 3.2.1).
Table3.2.1 The natron concentration used to prepare toombak samples in the laboratory
and their weight in gram.
Sample
No.
Natron Volume added in (ml)
200g(Na2HCO3.2H2O)/500ml
Water Volume
added in (ml)
Natron
weight (g)
Toombak Sample
weight (g)
1 50 0 20 30.56
2 40 10 16 30.04
3 30 20 12 30.24
4 20 30 8 30.21
5 10 40 4 30.15
Blank 0 0 0 10.00

The second group is composed of twenty-two Sudanese snuff samples collected from
local markets of different regions of Sudan table (3.2.2).
Table 3.2.2 Samples location from different regions in sudan.
Sample No. Sample location name Shop name
1 Alobied Alobied Amari
2 Senar Donia Alkaif
3 Senar Aljamhoria Amari
4 Baleela west kordofan Al Amari Kordofan
5 East darfour Super Asli-1
6 East darfour Super Asli -2
7 Eastdarfur Super Aljauda-1
8 Eastdarfour Super Aljauda-2
9 Portsudan Abo jammaa-1
10 Portsudan Abo jammaa-2
11 Portsudan Al asli
12 Portsudan Al Amari Alasli-1
13 Portsudan Al Amari Alasli-2
14 Portsudan Alsilik Al Amari Alasli
15 Khartoum Alseka hadeed Algema
16 Bahri Mubark Amari
17 Umdrman Alshejra Sandal Elkaif
18 Halfaia Albanjaded
19 Halfaia Wad Badwi
20 Shambat Almarkazi Lino Amari
21 Althoura Super Amari
22 Alhaj Yousif Sandal Elkaif
37

3.3Nicotine determinationBefore determination of the nicotine concentration for all the unknown sample solutions,
it was needed to have linear equation from nicotine standard curve to determine the nicotine
amount. The standard curve plotted by HPLC instrument using the peak area of each
nicotine standard solution concentration of 10, 20 and 35 ppm.
3.3.1 Preparation of mobile solvent phaseMobile phase was prepared by adding 40% (v/v) methanol containing 0.2% (v/v)
phosphoric acid buffered to pH 7.25 with triethylamine at a flow rate of 0.5 ml/min. solvent
then filtered through 0.45^m Millipore filter prior.
3.3.2 Standard curve for HPLCNicotine standard was purchased from Sigma (N-5260 Lot 126F0099), Nicotine di-tartrate
Hydrogen tartrate salt 65-31-6 C10H14N2.2C4H6O6 FW 462.4 stored at room temperature
H2O content 1.5 mol/mol (for laboratory use only).
Accurately 0.1g of nicotine was weighted and dissolved then transferred quantitatively to
a 100ml volumetric flask and diluted to the mark with HPLC grade methanol to make an
accurately known 100ppm solution.
Stock solution of nicotine (20 mg/ml) was obtained in acetonitrile. Three standard
solutions (0.044 Lig/nil) were obtained by diluting appropriate volumes of stock solution
with acetonitrile 0.2% formic acid 80/20 (v/v). Three stock prepared by diluting each in
100 ml volumetric flask of concentration 10, 20 and 35 ppm injected and recorded the
chromatogram, taking special note of the retention time, peak area and height of the
nicotine peak. This procedure repeated with each of the other standard solutions as well
as the blank.
Linear equation was made from the standard curve and used to calculate the nicotine
concentration in all samples by changing ‘x' variable with the total chromatogram peak
area table (3.3.1). The linear equation Y=6976.44x+(-12233.6) and R2= 0.999., obtained
chromatograms of the unknown sample solutions using the same procedure as it was used
for the preparation of the calibration curve figure (3.3.1).
38

Table 3. 3.1 Nicotine standard stock solution retention time, peak area and height of the peak.
Name Retention
Time
Area Height ESTD
concentration
Units
nicotine 5.365 59277 4091 10.000 CAL PPmnicotine 5.387 124385 8747 20.000 CAL PPmnicotine 5.365 233106 11247 35.000 CAL PPm
Peak: nicotine -- ESTD
Figure 3.3.1 Nicotine standard calibration curve
39

3.3.3 Sample preparation for HPLCThe dried toombak samples were ground and sieved with 180L m. mesh. Accurately 0.2
mg toombak were weighted and introduced in a 15 ml centrifuge tube. 2 ml of H2SO4
(0.1M) solution were added and the mixture kept in ultrasonic bath for 10 minute. Then,
the centrifuge tube was introduced in a water bath at 70 C for 10 minutes. In a 2 ml
Eppendorf tube the extracted solution were diluted to 1 ml with acetonitrile. The tube was
centrifuged for 6 minutes at 5000 rpm (5000 Rpm = 17 Rcf =1667.7). The supernatant
was diluted to 1 ml with mobile phase (40% methanol contain 0.2% phosphoric acid
buffered to pH 7.25). 5ml from final solution were injected in chromatograph system. The
result of the analysis showed nicotine levels in ppm in chapter four.
3.4 Trace element determination
All toombak samples were digested; approximately 0.5g weighed from each sample was
mixed with 4ml of 69% nitric acid (HNO3) (Sigma-Aldrich). The mixture was digested for
40 mins using a microwave digester at a total pressure of 20 bars and a maximum
temperature of 1250C (Anton-Paar Multi wave 3000 microwave sample preparation
system. Graz-Austria). The digested solution was diluted to 10 ml volumetric flask with
deionized water prior to analysis.
The prepared toombak samples were analyzed using Shimadzu ICPE-9000 spectrometer,
which uses the inductively coupled plasma to produce excited atoms and ions that emit
electromagnetic radiation at wavelengths characteristic of a particular element. It was a
flame technique with a flame temperature in a range from 6000 to 10000 K. The intensity
of this emission is indicative of the concentration of the element within the sample in ppm
(mg/kg).
40

Chapter Four

Results and Discussion4.1 Nicotine content determined by HPLCHPLC technique has been used to evaluate the amount of total nicotine in toombak. Table
3.4.1 showed the nicotine three standard solutions prepared for calibration curve illustrated
in Figure3. 4.1 the retention time was 5.365, 5.387 and 5.365 minute almost the same, also
peak area and height values were increased gradually due to the concentration of nicotine
as showed before.
Table 4.1.1 showed that the concentration of total nicotine in ppm measured using HPLC
technique was decrease when the natron concentration used for prepared toombak samples
was high concentrated. The minimum concentration of nicotine was 6 ppm appeared in
toombak sample that processed with 50 ml natron in 30 g toombak. However, the
maximum concentration of nicotine was 46 ppm appeared in toombak sample that
processed with 10 ml natron and 40 ml distilled water in 30 g toombak. This practical
method which done in laboratory estimate that nicotine content occurred in toombak
samples ready to use has an inverse correlation to natron concentration. An extrapolation
for the result was done using Excel program to predict the nicotine concentration verses
natron concentration as showed in table 4.1.1. Figure 4.1.1 illustrated the inverse
correlation between nicotine content and natron concentration used to prepare toombak
samples.

Table 4.1.1 Nicotine concentration values in ppm of the toombak samples prepared with different natron concentration in ml\g.
Natron
concentration
Nicotine
Values
Forecast Lower Confidence
Bound
Upper Confidence
Bound
10 46
20 29
30 22
40 12
50 6 12.5 12 12
60 -4.03 -12 4
70 -13.6 -22 -5
42

^—Values
60
^—Forecast
----- Lower Confidence Bound
----- Upper Confidence Bound
Nic
otin
e con
tent
ppm
50
40
30
20
10
0
-10
-20
-3010 20 30 40 50 60 70
Natron concentration ml.
Figure 4.1.1 The inverse correlation between nicotine content and natron concentration.
43

UD O CXI
Figure 4.1.2 The nicotine concentration in toombak before procession and natron concentration
Figure 4.1.2 illustrated the nicotine concentration and the concentration of natron used for
procession compared with toombak sample before treatment (zero natron). The total
nicotine concentration in dried toombak leaves was 206 ppm much higher than nicotine
concentration in moist toombak samples. Because The nicotine content in toombak
samples was extracted by natron during treatment process and evaporated because it is a
volatile liquid alkaloid substance. In addition, the nicotine site of formation in nicotina
plant has showed in the root and transferred to leaves. That is the reason of uses dry tobacco
had a high risk 84. So nicotine content already diminished more than half when it was
compared with dried leaves of toombak samples. Other liquid volatile alkaloids nor
nicotine and anabasine are secondary amines and will form nitroso derivatives in nitrus
acid; this nitroso compound will float on the surface as an oily liquid. Compared with
nicotine is a tertiary amine does not give nitroso derivatives in hydrochloric acid and
saturated sodium nitrate.
44

Nicotine was detected by HPLC in toombak samples collected from the market in different
region in Sudan. Nicotine concentration were listed in Table 4.1.3 ranged from 16 ppm to
89 ppm with an average 46 ppm. These different nicotine content due to the treatment
process that done by the toombak vendors with no unified or even consistent procedure.
The average concentration 46 ppm were same to highest nicotine concentration 46 ppm in
the samples prepared in the lab. One-sample SPSS statistics T-Test was t 12 = 0.389 and P
value 0.704.
Idris A. M. et. al. 1994 were found that nicotine content range from 8 to 102 mg\g dry
weight in toombak ready to use samples and Tobacco Specific N-nitrosamines (TSNAs) ever measured in consumer products 63.
WHO analyzed oral tobacco product from five region included Sudanese toombak using
gas chromatography with mass spectrometric. They found that total nicotine varied from
0.16 to 34.1 mg\g product 24. In the United States seven oral tobacco product categories
found the total nicotine concentration spanned from 3.9 to 40.1 mg\g 21.
Table 4.1.2 Nicotine concentration values of the toombak samples collected from the market in different regions.
Sample No.
Sample location
Nicotine ppm
1 Elobied 162 Senar1 183 PortsudanA 304 Baleela 445 Eastdarfur1 676 Eastdarfour2 897 Halfaia 398 Bahri 4410 Umdrman 4411 Khartoum 6412 Shambat 5513 Althoura 4514 Alhaj yousif 40
Min Elobied 16Max Eastdarfour2 89
Average 46
45

Table 4.1.3 showed nicotine concentration values of the toombak samples collected from
the market excluded the minimum and the maximum values. The values found in a narrow
range and the average was close to the previous average. One-sample SPSS statistics T-
Test was t 10 = 1.177 and P value 0.267. This statistic's values supported what running
after to exclude the random treatment process. The significant P value was below 0.05 that
means 5% of the treatment was not exist.
Figure 4.1.3 illustrated the nicotine concentration in toombak samples collected from the
market. Most of these values were below 50ppm nicotine content in the toombak samples.
Table 4.1.3 Nicotine concentration values of the toombak samples collected from the market excluded the minimum and the maximum values.
Sample No.
Sample location
Nicotine ppm
1 Senar1 182 PortsudanA 303 Baleela 444 Eastdarfur1 675 Halfaia 396 Bahri 447 Umdrman 448 Khartoum 649 Shambat 5510 Althoura 4511 Alhaj yousif 40
Average 45
46

Nicotine concetration
Nic
otin
e con
cent
ratio
n pp
m
Figure 4.1.3 The nicotine concentration in toombak samples collected from the market.
47
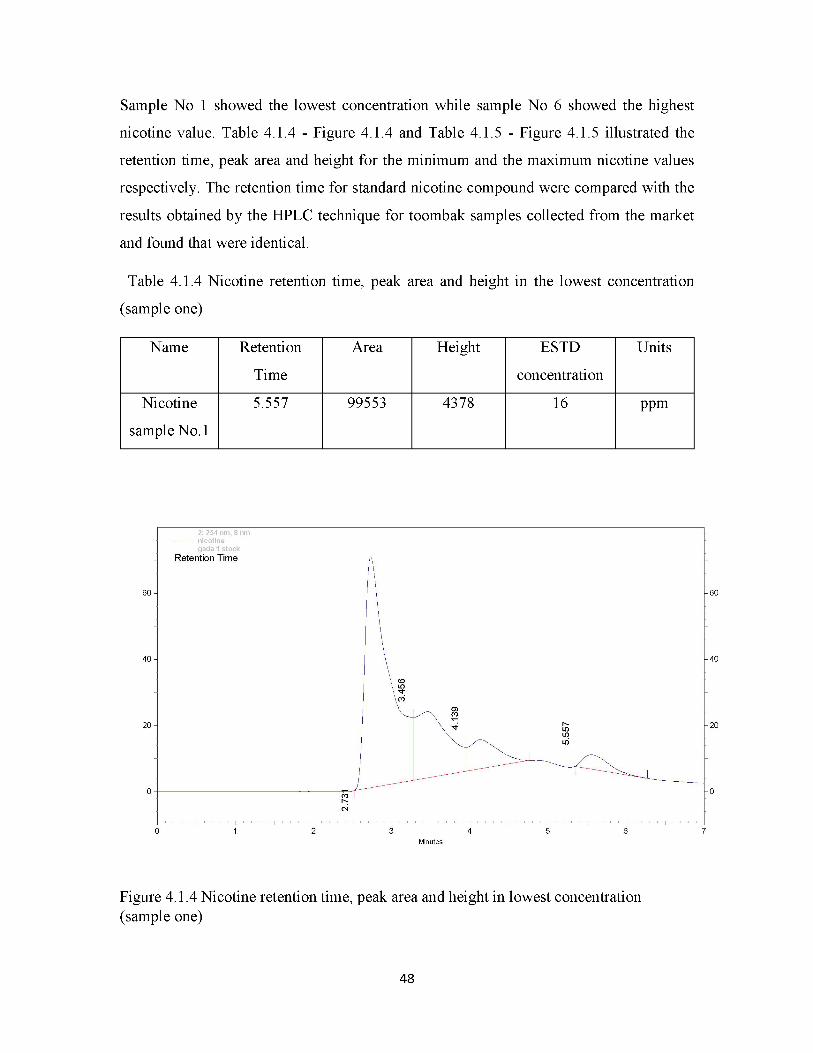
Sample No 1 showed the lowest concentration while sample No 6 showed the highest
nicotine value. Table 4.1.4 - Figure 4.1.4 and Table 4.1.5 - Figure 4.1.5 illustrated the
retention time, peak area and height for the minimum and the maximum nicotine values
respectively. The retention time for standard nicotine compound were compared with the
results obtained by the HPLC technique for toombak samples collected from the market
and found that were identical.
Table 4.1.4 Nicotine retention time, peak area and height in the lowest concentration
(sample one)
Name Retention
Time
Area Height ESTD
concentration
Units
Nicotine
sample No.1
5.557 99553 4378 16 PPm
Figure 4.1.4 Nicotine retention time, peak area and height in lowest concentration (sample one)
48

Table 4.1.5 Nicotine retention time, peak area and height in the highest concentration (sample six).
Name Retention
Time
Area Height ESTD
concentration
Units
Nicotine
sample No.6
5.664 611372 24185 89 PPm
Minutes
80
60
40
20
0
Figure 4.1.5 Nicotine retention time, peak area and height in highest concentration (sample six).
49

4.2 Analysis of data using excel programTable 4.2.1 Percentage of toombak users in Khartoum state
Frequency percent
Toombak user 180 89 %
Toombak non user 21 11 %
Total 201 100%
Toombak Users
■ Snuff user ■ Non Snuff User
Figure 4.2.1 Toombak users of questioner volunteers
Figure 4.2.1 showed that 89 % of those asked to fill the questionnaire said yes that they
still used Toombak.
50

Table 4.2.2 Percentage values of toombak users age in Khartoum state
Frequency percent
Age below 20 16 9%
Age from 20 to 29 99 55%
Age from 30 to 39 34 19%
Age from 40 to 49 22 12%
Age above 50 9 5%
Total 180 100%
Age
■ Age below 20 ■ Age from 20 to 29 ■ Age from 30 to 39■ Age from 40 to 49 ■ Age above 50
Figure 4.2.2 Age of questioner volunteers
Figure 4.2.2 showed that 55% of users were found to be age between 20 to 29 years old
and this is due to their availability to answer this questioner. These result indicated that the
majority of toombak users were young.
51

Table 4.2.3 Percentage values of toombak users according to gender
Frequency percent
Male 178 99%
Female 2 1%
Total 180 100%
Gender Survey
Figure 4.2.3 Gender survey of questioner volunteers
Figure 4.2.3 showed that the highest users percentage was 99 % for male because toombak
use was known among males traditionally.
52

Table 4.2.4 Percentage values of toombak user's educational level
Frequency percent
Non educated 11 6%
Pasic level 7 4 %
Secondary level 31 17 %
University level 115 64 %
Post graduate level 16 9 %
Total 180 100%
Educational Level
■ Non Eduecate ■ Primaray level ■ High Seconderay■ unuversity level ■ Post gurduate level
Figure 4.2.4 Educational levels of toombak users
Figure 4.2.4 showed that 64% for those that complete their educational level to the
university. These result indicate that lake of a warless about toombak health problems.
53

Table 4.2.5 Percentage of toombak users starting history
Frequency percent
One year 14 8 %
Two years 24 13 %
More than two years 142 79 %
Total 180 100%
Users starting History
■ One Year ■ Two Years ■ More than Two Years
Figure 4.2.5 Toombak users starting history
Figure 4.2.5 showed that 79 % of Toombak users starting use it for more than two years. These result consider that users taking toombak for long term of using as addiction of this habit.
54

Table 4.2.6 Percentage of toombak intake frequency per day
Frequency percent
One to three times per day 12 7 %
One to six times per day 34 19 %
More than six times per day 134 74 %
Total 180 100%
Intake fequency Per Day
■ One to Three Times Per Day ■ One to Six Times Per Day■ More than Six Times Per Day
Figure 4.2.6 Toombak user's intake frequency per day
Figure 4.2.6 showed the highest toombak users present 74 % was found to be for those that
used toombak more than six times per day.
55

Table 4.2.7 Percentage of toombak user's health hazards
Frequency percent
Yes there is health hazard 44 24.44%
No health hazard 136 75.56%
Total 180 100%
Figure 4.2.7 Toombak user's health hazards
Figure 4.2.7 shows that 75.56% of toombak users said there is no any health problems
occurred from the toombak use until now and this is due to the slowly appearance or the
adverse effects of toombak.
56

Table 4.2.8 Percentage of types of health hazard associated with toombak uses
Frequency percent
Gum infection 5 11.36%
Teeth yellowish 7 15.91%
Gum infection and teeth yellowish 32 72.73%
Total 44 100%
Types of Health Hazard
■ Gum Infection ■ Teeth Yallowish ■ Gum Infection and Teeth Yallowish
Figure 4.2.8 Toombak user's types of health hazard
Figure 4.2.8 showed that 72.73% of toombak users said yes that toombak caused both gum
infection and teeth yellowish.
57

Table 4.2.9 Percentage of toombak users trying to quit
Frequency percent
Try to quit 120 66.67%
Non quitted 60 33.33%
Total 180 100%
Users trying to quite
■ Try to Quite "Non Quited
Figure 4.2.9 Toombak users trying to quite
Figure 4.2.9 showed that 66.67% of toombak users trying to quite because they
knowing about the hazards of toombak.
are
58

Table 4.2.10 Percentage of toombak users attempts for quit
Frequency percent
Failed to quit 60 50.0%
By reducing the intake 31 25.8%
By using cigarette 14 11.7%
By using more tea and coffee 15 12.5%
Total 120 100%
Attempts for Quit
■ Faild to Quit■ By Using Cigarite
■ By Reduceing the intake■ By Using More Tea and coffe
Figure 4.2.10 Toombak users starting to quit
Figure 4.2.10 showed that 50% of toombak users that trying to quit using toombak were
failed and the residue trying to quit by reducing their intake or use cigarette.
59

In River Nile State in Sudan Idris et. al.73. conducted across-sectional survey on the use of
toombak and found that the prevalence of toombak use was around >45% among men aged
40 years and older, 10% among women aged 60 years and older and 1.7% among children
and adolescents aged below 17 years old. These rates are similar to previous Sudanese
studies reported rates of 45-47%. Sudanese rates however are at least three times higher
than reported rates of smokeless tobacco use in Yemen (15%), Sweden (12.3%), Norway
(9%) and ten times higher than the rates in US (3.4%), Spain (2.5%) and England (1.1%) 39
The data was collected using a questionnaire containing questions on general and oral
health. 55% of male snuff dippers randomly select from population were found to be age
between 20-29 years old and 64% of those complete their education level to the university.
78.9% of users starting history more than two years and daily intake more than six times
dip per day. Daily oral hygiene and tobacco habits caused health problems including oral
cancer occurred in the site of dipping (labial, buccal or both) due to toombak use. Although
75.5% of users said there was no any health problems from toombak use until now but this
was due to the slowly appearance or the adverse effects of toombak. Review were
conducted from literature show that the oral cancer cases in Sudan has p-value 0.000 with
site of dipping, frequency of dipping and age of dippers. Table 4.2.11 show the statistical
data of oral cancer users during 1975 to 2016
Period of time Number of cases Cases per year References
1970 - 1985 1916 120 Idris et. al. 199570
2006 - 2007 261 152 in 2006
109 in 2007
Osman et. al. 2010 78
2013 - 2015 360 120 Mariam et. al. 2018 79
60

4.3 Trace element concentration determined by ICP-AES
Elemental analysis of Toombak samples yield very useful information to the best of our
knowledge. Analysis of metal levels in Toombak is an important first step in raising
awareness about adverse health effects caused by Toombak and in assessing the risk related
to oral absorption of metals from Toombak. Toombak is known to cause gum cancer,
osteoporosis and rheumatism. Studies have reported effects such as oral cancer,
leukoplakia, immune dysfunction, periodontal diseases, decreased sperm viability and perinatal mortality 36, 42, 44 and 55.
The prepared samples were analyzed using Shimadzu ICPE-9000 spectrometer, which uses
the inductively coupled plasma to produce excited atoms and ions that emit
electromagnetic radiation at wavelengths characteristic of a particular element. It was a
flame technique with a flame temperature in a range from 6000 to 10000 K. The intensity
of this emission is indicative of the concentration of the element within the sample in ppm
(mg/kg).
In order to evaluate the quality of the analytical results obtained, the IAEA Standard
Reference Material (IAEA-V-10) was analyzed. The mass fractions of elements in the
standard reference material were determined and the certified values were compared with
the measured values. SRM was used for the evaluation of procedures. Percentage
recoveries ranged between 96.2% and 105.8% with % RSDs for the mean recoveries below
12.5%. The results of the relative error as a measure for accuracy are given in Table 4.3.1
61

Table 4.3.1 ICP-EAS Accuracy results using standard reference material hay powder
(IAEA-V-10) elements concentration in ppm.
Element Certified
Values
Measured
values
95% Confidence
Interval mg/kg
Accuracy
Cd 0.03 0.03 0.02-0.05 9.09%
Pb 1.6 1.9 0.80 - 1.90 17.60%
Cr 6.5 5.6 5.60 - 7.10 14.30%
Co 0.13 0.11 0.11 - 0.14 15.38%
Cu 9.4 8.6 8.80 - 9.70 7.98%
Ni 4.2 3.7 3.80 - 4.90 10.90%
Zn 24 25.1 23.00- 25.00 4.58%
Mn 47 44.4 44.00 - 51.00 5.53%
62

Table 4.3.2 shows the blank sample, which is a toombak powder before procession and the
twenty-two samples of toombak collected from the local market in different region in
Sudan. The twenty-two toombak samples have been processed by the toombak vendors
with no unified or even consistent procedure. For example, sample six is collected from
Darfour state western Sudan, where toombak consumers prefer alkali toombak with much
added natron. The inconsistency was evident in the analysis results. The analysis showed
that samples collected from two containers of the same vendor showed different trace
elements concentrations specially, Ni and Mn concentration. Furthermore, sample nine and
sample ten were collected from the same shop in different times showed slight different
elemental concentrations. Toombak samples have been analyzed by ICP-AES trace
elements concentration were listed in Table 4.3.2 Cadmium concentration ranged from
1.94 to 4.15 ppm with an average 2.93 ppm, sample No 6 showed the lowest concentration
while sample No 21 showed the highest value. Chromium concentration ranged from 6.24
to 10.6 ppm with an average 8.20 ppm, sample No 6 showed the lowest concentration while
sample No 21 showed the highest value. Cobalt concentration ranged from 6.23 to 10.9
ppm with an average 8.89 ppm, sample No 15 showed the lowest concentration while
sample No 10 showed the highest value. Cupper concentration ranged from 8.14 to 16 ppm
with an average 12.38 ppm, sample No 15 showed the lowest concentration while sample
No 10 showed the highest value. Nickel concentration ranged from 3.62 to 51.62 ppm with
an average 18.89 ppm, sample No 15 showed the lowest concentration while sample No 3
showed the highest value. Zinc concentration ranged from 20.34 to 40.34 ppm with an
average 28.36 ppm, sample No 3 showed the lowest concentration while sample No 10
showed the highest value. Lead concentration ranged from 1.47 to 4.25ppm with an
average 2.68 ppm, sample No 19 showed the lowest concentration while sample No 9
showed the highest value. manganese concentration ranged from 67.09 to 116.17ppm with
an average 98.54 ppm, sample No 15 showed the lowest concentration while sample No 1
showed the highest value. Generally, the lowest and highest concentration values appear
in the same samples for more than element. For example, sample No. 15 showed the lowest
concentration value for cobalt, copper, nickel and manganese; while sample No. 10 showed
the highest concentration value for cobalt, copper and zinc.
63
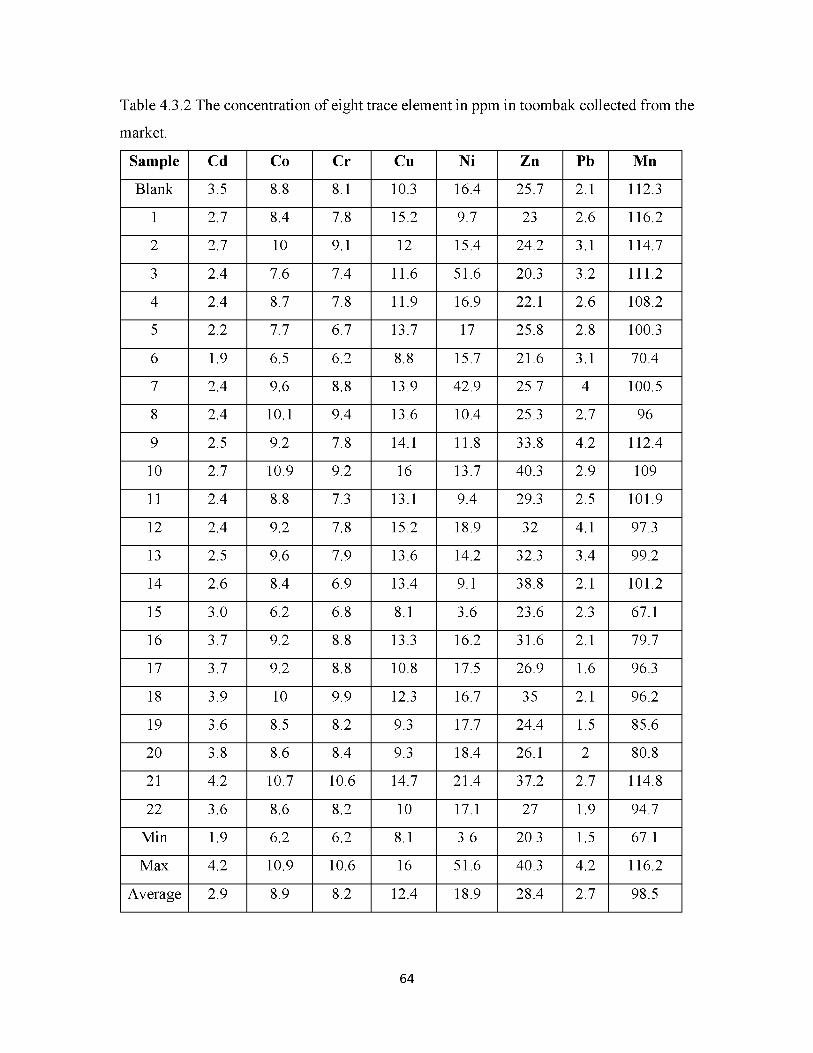
Table 4.3.2 The concentration of eight trace element in ppm in toombak collected from the
market.
Sample Cd Co Cr Cu Ni Zn Pb Mn
Blank 3.5 8.8 8.1 10.3 16.4 25.7 2.1 112.3
1 2.7 8.4 7.8 15.2 9.7 23 2.6 116.2
2 2.7 10 9.1 12 15.4 24.2 3.1 114.7
3 2.4 7.6 7.4 11.6 51.6 20.3 3.2 111.2
4 2.4 8.7 7.8 11.9 16.9 22.1 2.6 108.2
5 2.2 7.7 6.7 13.7 17 25.8 2.8 100.3
6 1.9 6.5 6.2 8.8 15.7 21.6 3.1 70.4
7 2.4 9.6 8.8 13.9 42.9 25.7 4 100.5
8 2.4 10.1 9.4 13.6 10.4 25.3 2.7 96
9 2.5 9.2 7.8 14.1 11.8 33.8 4.2 112.4
10 2.7 10.9 9.2 16 13.7 40.3 2.9 109
11 2.4 8.8 7.3 13.1 9.4 29.3 2.5 101.9
12 2.4 9.2 7.8 15.2 18.9 32 4.1 97.3
13 2.5 9.6 7.9 13.6 14.2 32.3 3.4 99.2
14 2.6 8.4 6.9 13.4 9.1 38.8 2.1 101.2
15 3.0 6.2 6.8 8.1 3.6 23.6 2.3 67.1
16 3.7 9.2 8.8 13.3 16.2 31.6 2.1 79.7
17 3.7 9.2 8.8 10.8 17.5 26.9 1.6 96.3
18 3.9 10 9.9 12.3 16.7 35 2.1 96.2
19 3.6 8.5 8.2 9.3 17.7 24.4 1.5 85.6
20 3.8 8.6 8.4 9.3 18.4 26.1 2 80.8
21 4.2 10.7 10.6 14.7 21.4 37.2 2.7 114.8
22 3.6 8.6 8.2 10 17.1 27 1.9 94.7
Min 1.9 6.2 6.2 8.1 3.6 20.3 1.5 67.1
Max 4.2 10.9 10.6 16 51.6 40.3 4.2 116.2
Average 2.9 8.9 8.2 12.4 18.9 28.4 2.7 98.5
64

In all toombak market's samples the highest concentration followed the order Mn > Zn
>Ni, while the lowest concentration followed the order Cr < Cd < Pb. The other elements
followed the order Co < Cu with some exception as shown in the result section. These
finding are in agreement with previous study reported by rehab (2002) 66.
The average concentration of each element was compared to the blank sample
concentration. The concentrations of cobalt, chromium, copper, nickel, zinc and lead in the
blank sample were slightly higher than toombak average concentrations, while the
concentrations of cadmium, and manganese were slightly lower. This variation can be
attributed to natron element concentrations used for toombak treatment. Table 4.3.3 shows
comparison of elements concentration in toombak before procession and average
concentration of the samples collected from the markets and natron element concentration.
Table 4.3.3 Comparison of elements concentration in ppm
Element Blank (Toombak before
procession)
Average of these
results
Natron
Cd 3.5 2.9 0.6
Co 8.8 8.9 2.8
Cr 8.1 8.2 2.7
Cu 10.3 12.4 5.6
Ni 16.4 18.9 1.7
Zn 25.7 28.4 18.5
Pb 2.1 2.7 0.4
Mn 112.3 98.5 76.5
Although there was a slight variation in the distribution of metals among the toombak
samples collected from the market most element concentration followed common
tendency.
65

Element concentration levels did not differ significantly between Toombak type as show
in Table4.3.4. The concentration of all measured element in 22 samples collected from the
markets followed similar order all concentration was lowest in all type.
Table 4.3.4 Summary of significance (P. value<0.05) level in toombak samples in elements
measured, means, and concentration ranges.
Element P - Values Mean Stander
deviation
Stander
deviation
error mean
Range
Cd ppm 0.00 2.9 0.64 0.13 1.94 - 4.15
Co ppm 0.002 8.89 1.18 0.25 6.23 - 10.9
Cr ppm 0.436 8.18 1.08 0.23 6.24 - 10.6
Cu ppm 0.335 12.47 2.25 0.47 8.14 - 16
Ni ppm 0.817 17.52 10.54 2.24 3.62 - 51.63
Zn ppm 0.701 28.48 5.8 1.24 20.34 - 40.34
Pb ppm 0.00 2.7 0.76 0.16 1.47 - 4.25
Mn ppm 0.762 97.9 13.9 2.9 67.09 - 116.18
The distributions of the elements concentrations in ppm in the toombak market's samples
are depicted in Figures 4.3.1 to 4.3.8 for the cadmium, cobalt, chromium, copper, nickel,
zinc, lead and manganese, respectively.
66

Cd concentration ppm
1.000.500.00
— C l 'r ■t T C 1^ OC O O — C l 'r ■t T C 1^ M 0- 0'
-SSample No.
21 22
----- Cd
Figure 4.3.1 Cadmium concentration in ppm in the toombak market's samples.
67

Co concentration in ppm12.00
10.00
8.00
6.00
4.00
2.00
0.00-Z — Cl ’t i/'i C OC o- o — Cl ’t i/'i C <Z> O C'
S3
3
21 22
Sample No.
----- Co
Figure 4.3.2 Cobalt concentration in ppm in the toombak market's samples.
68

Cr concentration in ppm12.00
4.00
2.00
0.00ZZ — Cl <C -j- ir, \O t~~ OO O' O — Cl <C -j- ir, \O t~~
S3
Sample No.
----- Cr
Figure 4.3.3 Chromium concentration in ppm in the toombak market's
18 19 20 21 22
samples
69

Cu concentration in ppm18.00
6.00
4.00
2.00
0.00— Cl ’t i/'i C OC o- o — Cl ■t T- O 1^ M O C'
S3
3
21 22
Sample No.
----- Cu
Figure 4.3.4 Cupper concentration in ppm in the toombak market's samples.
70

Ni concentration in ppm60.00
— Cl -r O <Z> o- o — Cl -f T O 1^ <Z> O C'
S3
Sample No
21 22
----- Ni
Figure 4.3.5 Nickel concentration in ppm in the toombak market's samples.
71
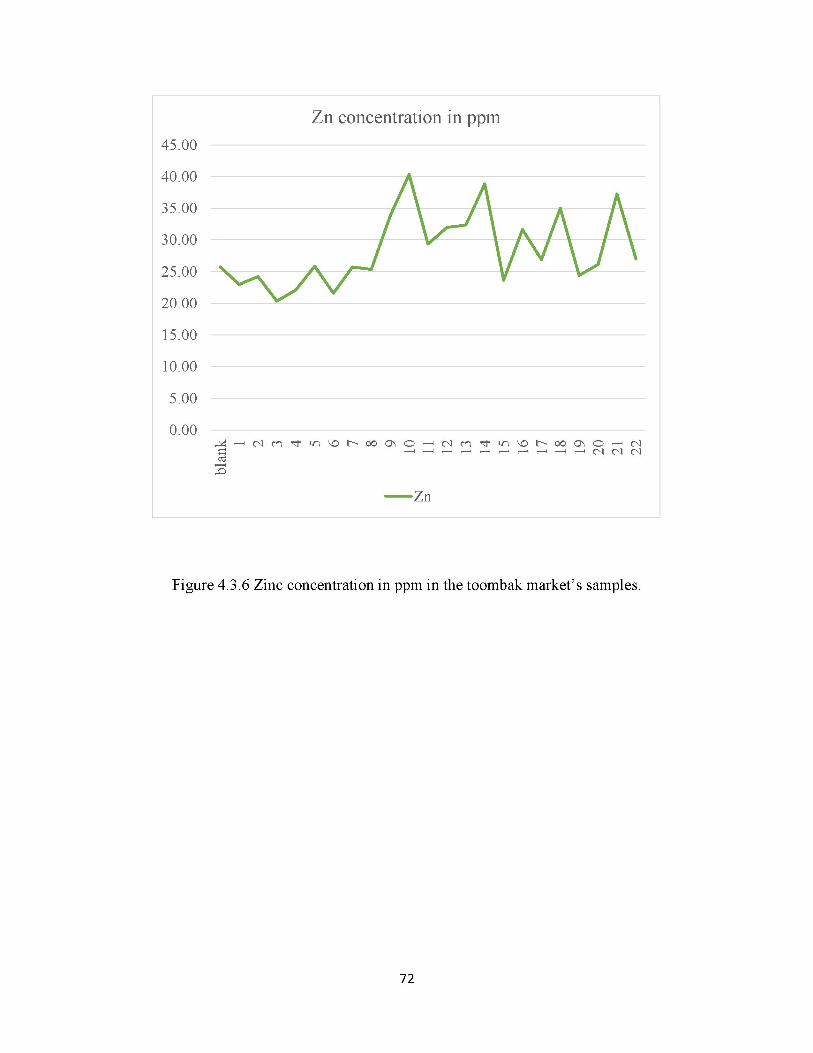
Zn concentration in ppm45.00
21 22
15.00
10.00
5.00
0.00_z — ci -r c m o- o — ci 'r ■t o <z> G C'
S3
Zn
Figure 4.3.6 Zinc concentration in ppm in the toombak market's samples.
72

Pb concentration in ppm4.50
1.00
0.50
0.00-Z — rl O M O' — CJ O M O'
S3
----- Pb
21 22
Figure 4.3.7 Lead concentration in ppm in the toombak market's samples.
73

Mn concentration in ppm140.00
40.00
20.00
0.00-Z — Cl 'r ■t ir- O <Z> O' O — Cl C 1^ M O'
§
----- Mn
Figure 4.3.8 Manganese concentration in ppm in the toombak market's21 22
samples
74

The differing quantitative pattern of elements among the samples were expected to the
level of metal contaminants in soil also metal absorption from the soil of tobacco
agricultural plants which depend on geographical origin. Other possible source of these
heavy metals in toombak may be due to pollution in the water used in tobacco fields or
additives for enticing users.
Rehab 2002, reported that the soil to plant transfer factor determined close to unity. and
concluded that there is a strong correlation between the concentrations of Cu-Zn, Pb-Zn, Co-Fe and Pb-Cd in the soil and their concentrations in the plant 65 and 66.
The minor variation in elements concentration order may be attributable to the toombak
treatment process. This may imply that the only difference between toombak market's
samples is the source of additives due to procession specification during production
processes and treatment methods. because the toombak row material which are the same
source in western Sudan on which tobacco were harvested.
75

o fl o Q
Figure 4.3.9 illustrates the proportional Pearson correlation between cobalt and chromium
has a positive value equal 0.856 P-value 0.000and the inverse Pearson correlation between
cadmium and lead concentration has a negative value equal 0.652 P-value 0.001. The
overall variation in the samples was very low; about 4 ppm between cobalt and chromium
values and 2 ppm between cadmium and lead value.
_z — ci 'r ’t o oc o o ~ ci -r t c r' m a o - ci fl __________ c. | c. | c. |0.00
S3
Sample No.
----- Cd ----- Co ----- Cr ----- Pb
Figure 4.3.9 An inverse correlation between Cd and Pb also the correlation between Co
and Cr concentration in ppm in the toombak market's samples.
76

Although, Zinc concentrations were high and distributed over a wide range (about 20 ppm)
compared to copper low concentrations and narrow range (about 8ppm), there was a
proportional Pearson correlation between zinc and copper concentration has a positive
value equal 0.566 P-value 0.006 illustrated in Figure 4.3.10.
I 0.00-----------------------------------------------------------------------------— Cl 1^ M O O — Cl -r ir, O OC 0- 0 — Clfl __________ c. | c. | c. |
S3
3Sample No.
— Cu — Zn
Figure 4.3.10 Correlation between Cu and Zn concentration in ppm in the toombak
market's samples.
77

Cobalt concentration values were comparable to Zn concentration values, which showed
proportional Pearson correlation has a positive value equal 0.594 P-value 0.004 as depicted
in Figure 4.3.11.
45.00
40.00
35.00
30.00
25.00
20.00
15.00
5.00
0.00- ci 'r ■t t c oc g> o — ri -r i/-, o r' m O' C' ~ cifl __________C.|C.|C.|S3
Co (ppm) ----- Zn (ppm)
Figure 4.3.11 Correlation between Co and Zn concentration in ppm in the toombak
market's samples.
78

The concentration measured for manganese showed proportional Pearson correlations with
copper has a positive value equal 0.701 P-value 0.000 depicted in Figure 4.3.12.
125.00120.00
65.0060.0055.0050.0045.0040.0035.0030.0025.0020.0015.00 ~10.005.000.00
ZZ — Cl <C -j- ir, \O t~~ OO O' O — Cl <C -j- ir, \O t~~
S3
Cu (ppm) Mn (ppm)
18 19 20 21 22
Figure 4.3.12 Correlation between Cu and Mn concentration in ppm in the
market's samples.
toombak
79

Copper concentration has positive Pearson correlation with cobalt and lead and has vales
equal 0.644 P-value 0.001and 0.511 P-value 0.015 respectively as depicted in Figure
4.3.13.
20.00
15.00
0.00ZZ — Cl <C -j- ir, \O t~~ OO O' O — Cl <C -j- ir, \O t~~
S3
Co (ppm) Cu (ppm) Pb (ppm)
Figure 4.3.13 Correlation between Co, Pb and Cu concentration in ppm in the toombak
market's samples.
18 19 20 21 22
80

Focusing on these facts a sample set of laboratory prepared toombak have been analyzed
by ICP-AES trace elements concentration were showed in Table 4.3.5; the blank sample is
the toombak powder before processed of tobacco and the five samples were prepared using
different natron concentration. There was an inverse correlation between cadmium and
lead, proportional correlation was noticed clearly between cobalt and chromium also
proportional correlation between zinc and nickel figure4.3.14 and 4.3.15
Natron concentration has been used to prepared five toombak samples was showed in Table
3.3.1; which 50 ml of concentrated natron was adding to 30 gram toombak. Other samples
prepared using diluted natron 40,30,20 and 10 ml of natron.
the result revealed that elements concentration decrease when the natron concentration was
high 50 ml and 10 ml represent the low natron concentration; as depicted in figure 3.3.16
and 3.3.17.
81

Table 4.3.5 The concentrations of the elements in ppm in toombak prepared in the lab
and the natron concentrations used.
SampleNo. Cd Co Cr Cu Ni Zn Pb Mn
blank 3.5 8.8 8.4 10.3 16.4 25.7 2.1 112.310 4.2 10.9 10.3 12.1 23.4 29.2 1.6 122.820 4 9.4 8.8 13.6 17.9 29.7 2.4 10530 3.1 9.7 9.1 13.5 11.6 26.8 1.5 138.340 2.6 7.3 7.5 11.4 9.1 18 1.7 105.950 2.3 6.4 6.7 10.4 10.8 18.6 0.7 84.2
82

Trace Elment concentration in ppm and natron concentration %
250
200
150
100
50
Cd Co Cr Cu Ni Zn Pb Mn
0
Figure 4.3.14 Elements concentration in ppm in the toombak samples prepared withdifferent natron concertation.
83

Trace Elment concentration in ppm and natron concentration %35.0
30.0
25.0
20.0
15.0
10.0
5.0
0.030 natron 40 natron10 natron 20 natron 50 natron
----- Cd ----- Co ----- Cr ----- Cu ----- Ni ----- Zn ----- Pb
Figure 4.3.15 Elements concentration in ppm except manganese in the toombak samplesprepared with different natron concertation.
84

Trace Elment concentration in ppm and natron concentration %35.0
30.0
25.0
20.0
15.0
10.0
5.0
0.010 natron 50 natron
— Cd — Co — Cr — Cu — Ni — Zn — Pb
Figure 4.3.16 Maximum and minimum values for elements concentration in ppm in thetoombak samples prepared with different natron concertation.
85

Manganese concentration in ppm and natron concentration %140.0
120.0
100.0
80.0
60.0
40.0
20.0
0.0 i---------------------------------------------------- 110 natron
----- Mn
50 natron
Figure 4.3.17 Maximum and minimum values for manganese concentration in ppm in thetoombak samples prepared with different natron concertation.
86

Levels of Cadmium in this study were similar to those in previous study from Pakistan 85,
Ethiopia 43 and Oman 86; where concentration measured in smokeless tobacco samples
were 2ppm, 1.7ppm and 1.8ppm respectively.
For cupper our findings were similar to those reported by Stephen et. al. 35 who found
ranged from11.7 to 16.2ppm in cultivated tobacco leaves from United Kingdom. Also
similar to those reported by Regessa (2016) 43 smokeless tobacco where concentration was
ranged from 8.9 to 12.8 ppm. The Ghanaian local snuff was measured the copper
concentration ranged from10.4 to 17.9 ppm similar to this study results 87.
Manganese and nickel levels in our study were similar to those reported by Brima 88 which
raged from 51to 80.6 and 23.2 to 53.3 ppm respectively.
For chromium our finding were similar to those reported by Almukhanini (2014) 86 in
Oman smokeless tobacco where concentration was 15.7 ppm. Also similar to those
reported by Brima 88 where concentration in Saudi Arabia smokeless tobacco (shamma)
was ranged from 2.1 to 5.4 ppm.
87

Table 4.3.6 Comparison between concentrations of trace elements in toombak and reported concentration in the literature in (ppm)
Element Cd Co Cr Cu Mn Ni Pb Zn Ref.
This study 2- 4 6.2310.9
6-11 8-16 67-116 3.6 -52 1.5- 4 20- 40 -
KSA 0-0.03 2.9-6.0 2.1-5.4 1.8-3.92 50.9-80.6 23.1853.29
1.6-6.2 1.41-3.03 88
USA ND 0.01-0.9 0.1-3.4 ND 155-400 2-400 ND 16.8-30.5 44
USA 1.0-1.7 0.4-1.1 1.3-3.2 ND 131-245 2.2-3.9 0.6-1.2 ND 42
UK 0.5-0.8 ND 1.3-3.1 11.716.2
151-172 1.1-2.7 0.4-0.9 26.0-40.0 35
Pakistan 0.1-2.0 0.4-2.9 2.1-78.8 11.337.9
36.6-189.9 1.2-14.2 0.5-4.9 15.4-66.9 85
India 0.4-1.4 ND ND 0.0228.9
ND ND 1.5-5.1 9.8-29.2 89
Ghana 0.0290.048
0.9961.488
2.9545.669
10.4417.88
109.23202.16
0.4020.745
ND 18.56-23 87
Ethiopia 1.7 ND 1.7 8.9-12.8 ND 2.3 ND 92.7 43
Oman 1.8 ND 15.7 ND ND 1.6 1.6 ND 86
ND means not detected
88
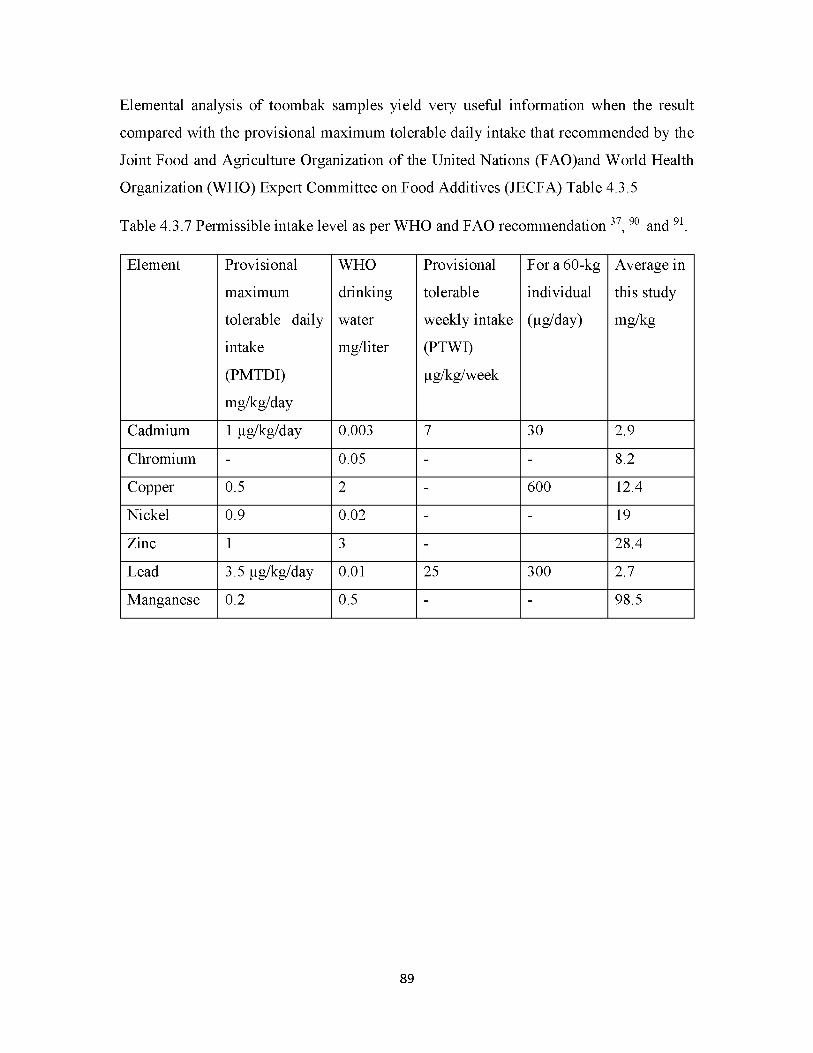
Elemental analysis of toombak samples yield very useful information when the result
compared with the provisional maximum tolerable daily intake that recommended by the
Joint Food and Agriculture Organization of the United Nations (FAO)and World Health
Organization (WHO) Expert Committee on Food Additives (JECFA) Table 4.3.5
Table 4.3.7 Permissible intake level as per WHO and FAO recommendation 37, 90 and 91.
Element Provisional
maximum
tolerable daily
intake
(PMTDI)
mg/kg/day
WHO
drinking
water
mg/liter
Provisional
tolerable
weeklv intake
(PTWI)
Lg/kg/week
For a 60-kg
individual
(Lg/dav)
Average in
this studv
mg/kg
Cadmium 1 Lig/kg/dav 0.003 7 30 2.9
Chromium - 0.05 - - 8.2
Copper 0.5 2 - 600 12.4
Nickel 0.9 0.02 - - 19
Zinc 1 3 - 28.4
Lead 3.5 Lig/kg/dav 0.01 25 300 2.7
Manganese 0.2 0.5 - - 98.5
89

Chapter Five

Conclusion and Recommendations
5.1 Conclusion
Total nicotine was detected by HPLC in Toombak samples collected from the markets in
certain regions in Sudan. These different nicotine contents due to the treatment process that
done by the Toombak vendors with no unified or even consistent procedure. The average
concentration 46 ppm was close to the highest nicotine concentration 47 ppm in the
samples prepared in the laboratory by adding 10 ml of natron and 40 ml distilled water.
The concentration of toxic elements Cd, Pb, Co, Cr, Cu, Mn, Ni and Zn were measured in
Sudanese toombak samples collected from local markets and snuff samples prepared in the
laboratory with different concentration of natron.
The results indicated that concentrations of Cd, Pb, Co, Cr, Cu, Mn, Ni and Zn in toombak
showed an inverse correlation with natron.
The recommended quantity of natron added to 30 gram toombak raw material was found
to be 50 ml of natron prepared by dissolving 200-gram natron in 500 ml distilled water.
This matched the low risk and low concentration for both nicotine and trace element
determined in this study.
The only difference between toombak market's samples is the source of additives due to
procession specification during production processes and treatment methods.
There was strong proportional correlation between cobalt, chromium, copper, zinc, nickel
and manganese. Also an inverse correlation between cadmium and lead concentration.
It is strongly found that there is direct correlation between the toxic elements found in this
study and oral cancer. However, this study emphasizes the fact that toombak samples have
heavy metals above permissible limits prescribed by the WHO. This could be instrumental
for the policy makers in order to issue regulations to control the elements concentrations.
5.2 Recommendations5.2.1 Toombak users for more than twenty years have to consider seriously
quit taking toombak because it's health effects and oral cancer likely to
appear after long term of using.
5.2.2 For users who observed changes in the depth and color of the site of
dipping tissues in the oral cavity, medical investigation should be done
immediately for early detection of any health problems.
5.2.3 The concentration of elements in toombak, obtained in this research
should be included in Sudanese Standard Metrology organized for
toombak appendex (2).
5.2.4 Most literature on trace and toxic elements in toombak has focused on
the identification of elements before procession of tobacco. More
research is needed to study the effect of procession on toxic elements
and their concentration.
5.2.5 It is strongly recommended to quit from this habit yesterday and not this
day because of it is strong correlation with oral cancer.
5.2.6 If the recommended is impossible it is recommended to minimize the
users which can be considered as stander ratio for Sudanese standard
metrology organization.
91

References
1. McKenna T. (1993): Food of the gods, The search for the original tree of knowledge a radical
history of plants, drugs, and human evolution. Reprint edition. New York: Bantam; 311 p.
2. Tso TC. (1991): Production, Physiology and Biochemistry of Tobacco Plant. First Edition First
Printing edition. Beltsville, MD.: Ideals; 32 p.
3. Sisson VA, Severson RF. (1990 Jun): Alkaloid composition of the nicotiana species. Beitrage
zur Tabakforschung International/Contributions to Tobacco Research. 1;14(6):327-39.
4. Idris AM, Nair J, Ohshima H, Friesen M, Brouet I, Faustman EM, et al. (1991 Jun): Unusually
high levels of carcinogenic tobacco-specific nitrosamines in Sudan snuff (toombak).
Carcinogenesis.;12(6):1115-8.
5. Bhisey RA. (2012 Oct): Chemistry and toxicology of smokeless tobacco. Indian Journal of
Cancer. 1;49(4):364.
6. International Agency for Research on Cancer (IARC), monographs on evaluation of
carcinogenic risk to humans, (2007): Smokeless Tobacco and Some Tobacco-specific N-
nitrosamines. Lyon, France, Volume 89 P 57.
7. Gupta, P. (2004): laboratory testing of smokeless tobacco and public health in india. Final
report to the India office of WHO (Allotment No.: SE IND TOB 001.RB 02), New Delhi.
8. Henningfield JE, Radzius A, Cone EJ. (1995 Mar): Estimation of available nicotine content of
six smokeless tobacco products.; Tob Control. 4(1):57-61.
9. Bhisey RA. (2012 Oct): Chemistry and toxicology of smokeless tobacco. Indian Journal of
Cancer. 1;49(4):364.
10. DeMarini DM. (2004 Nov): Genotoxicity of tobacco smoke and tobacco smoke condensate:
a review. Mutat Res.;567(2-3):447-74.
11. Scientific Committee on Emerging and Newly Identified Health Risk (SCNIHR), (2007): Health
Effects of Smokeless Tobacco Products. European Commission Health and Consumer
Protection Directorate General: P. 71-99.
12. Critchley JA. and Unal B. (2003): Health effects associated with smokeless tobacco:
asystematic review, Thorax. 58 (5): 435-443.
13. Goolsby MJ. (1992): Smokeless tobacco the health consequences of snuff and chewing
tobacco. Nurse Pract. 17 (1): 24-28.
14. Iskander, F. Y., (1985): Egyptian and foreign cigarettes determination of trace elements in
cigarette filter before and after smoking. J. Radiation. Nucl. Chem., 91:191-196.
15. Hecht SS, Carmella SG, Villalta PW, Hochalter JB. (2010 May): Analysis of Phenanthrene and
Benzo[a]pyrene Tetraol Enantiomers in Human Urine: Relevance to the Bay Region Diol
92

Epoxide Hypothesis of Benzo[a]pyrene Carcinogenesis and to Biomarker Studies. Chem Res
Toxicol. 17;23(5):900-8.
16. Kosanovic M., Jokanovic M. (2007): The association of exposure to cadmium through
cigarette smoke with pregnancy-induced hypertension in a selenium deficient population.
Environmental toxicology and pharmacology. 24, P. 72-78.
17. Jacobson KB, Turner JE. (1980): The interaction of cadmium and certain other metal ions
with proteins and nucleic acids. Toxicology.;16(1):1-37.
18. Pechlaner M, Sigel RKO. (2012): Characterization of metal ion-nucleic acid interactions in
solution. Met Ions Life Sci.; 10:1-42.
19. Rego B. (2009 Sep): The Polonium Brief: A Hidden History of Cancer, Radiation, and the
Tobacco Industry. Isis. 1;100(3):453-84.
20. Papastefanou C. (2009 Feb): Radioactivity of Tobacco Leaves and Radiation Dose Induced
from Smoking. Int J Environ Res Public Health.;6(2):558-67.
21. Idris AM, Prokopczyk B, Hoffmann D. (1994 Nov): Toombak: a major risk factor for cancer of
the oral cavity in Sudan. Prev Med.;23(6):832-9.
22. Idris AM, Ibrahim SO, Vasstrand EN, Johannessen AC, Lillehaug JR, Magnusson B, et al. (1998
Nov): The Swedish snus and the Sudanese toombak: are they different? Oral
Oncol.;34(6):558-66.
23. Eltayb RE. (2002 Nov): Investigation of some trace elements in Sudanese snuff (toombak).
1, RN:35026321
24. Hassan RE, Eltayeb M A. H. (2003 Oct): Trace Elements Content of Sudanese Local Snuff and
Its Agricultural Soil. 1, RN:35106263
25. Idris AM, Nair J, Friesen M, Ohshima H, Brouet I, Faustman EM, et al. (1992 Jun):
Carcinogenic tobacco-specific nitrosamines are present at unusually high levels in the saliva
of oral snuff users in Sudan. Carcinogenesis.;13(6):1001-5.
26. Ahmed HG-E, Idris AM, Ibrahim SO. (2003 Apr): Study of oral epithelial atypia among
Sudanese tobacco users by exfoliative cytology. Anticancer Res.;23(2C):1943-9.
27. Murphy SE, Carmella SG, Idris AM, Hoffmann D. (1994 Aug): Uptake and metabolism of
carcinogenic levels of tobacco-specific nitrosamines by Sudanese snuff dippers. Cancer
Epidemiol Biomarkers Prev.;3(5):423-8.
28. Idris AM, Ahmed HM, Malik MO. (1995 Nov): Toombak dipping and cancer of the oral cavity
in the Sudan: a case-control study. Int J Cancer. 15;63(4):477-80.
29. Idris AM, Ahmed HM, Mukhtar BI, Gadir AF, El-Beshir EI. (1995 Apr): Descriptive
epidemiology of oral neoplasms in sudan 1970-1985 and the role of toombak. International
Journal of Cancer. 10;61(2):155-8.
93

30. Ibrahim SO, Johannessen AC, Idris AM, Hirsch JM, Vasstrand EN, Magnusson B, et al. (1996
Dec): Immunohistochemical detection of p53 in non-malignant and malignant oral lesions
associated with snuff dipping in the Sudan and Sweden. International Journal of Cancer.
11;68(6):749-53.
31. Idris AM, Warnakulasuriya K a. a. S, Ibrahim YE, Nielsen R, Cooper D, Johnson NW. (1996
May): Toombak-associated oral mucosal lesions in Sudanese show a low prevalence of
epithelial dysplasia. Journal of Oral Pathology & Medicine. 1;25(5):239-44.
32. Idris AM, Ibrahim YE, Warnakulasuriya KA, Cooper DJ, Johnson NW, Nilsen R. (1998 Aug):
Toombak use and cigarette smoking in the Sudan: estimates of prevalence in the Nile state.
Prev Med.;27(4):597-603.
33. Elbeshir EI, Abeen HA, Idris AM, Abbas K. (1989 Jun): Snuff dipping and oral cancer in Sudan:
a retrospective study. Br J Oral Maxillofac Surg.;27(3):243-8.
34. Hoffmann D, Djordjevic MV. (1997 Sep): Chemical composition and carcinogenicity of
smokeless tobacco. Adv Dent Res.;11(3):322-9.
35. Ahmed H, M Mahgoob R. (2007 Apr): Impact of Toombak dipping in the etiology of oral
cancer: Gender-exclusive hazard in the Sudan. Journal of cancer research and therapeutics.
1;3: 127-30.
36. Ahmed HG. (2013): Survey on knowledge and attitudes related to the relation between
tobacco, alcohol abuse and cancer in the northern state of Sudan. Asian Pac J Cancer
Prev.;14(4):2483-6.
37. SmokelessTobaccoAndPublicHealth_AGlobalPerspective.pdf
38. Osman TA, Satti AA, Boe OE, Yang Y-H, Ibrahim SO, Suleiman AM. (2010 Dec): Pattern of
malignant tumors registered at a referral oral and maxillofacial hospital in Sudan during
2006 and 2007. J Cancer Res Ther.;6(4):473-7.
39. El Sheikh M. (2018): Survival and quality of life for Sudanese oral cancer patients. P HD
thesis.
40. Hassanin AA, Idris AM. (2017 Jan): Attribution of oral cancer in the Sudan to Toombak
dipping. Translational Research in Oral Oncology. 1;2: 2057178X16685729.
41. Lawler TS, Stanfill SB, Zhang L, Ashley DL, Watson CH. (2013 Jul): Chemical characterization
of domestic oral tobacco products: Total nicotine, pH, unprotonated nicotine and tobacco
specific N-nitrosamines. Food Chem Toxicol.;57: 380-6.
42. Benowitz NL. (2010 Jun): Nicotine addiction. N Engl J Med. 17;362(24):2295-303.
43. Hossain AM, Salehuddin SM. (2013): Analytical determination of nicotine in tobacco leaves
by gas chromatography-mass spectrometry. Arabian Journal of Chemistry.;3(6):275-8.
94

44. Stanfill SB, Connolly GN, Zhang L, Jia LT, Henningfield JE, Richter P, et al. (2011 May): Global
surveillance of oral tobacco products: total nicotine, unionised nicotine and tobacco-specific
N-nitrosamines. Tob Control.;20(3): e2.
45. Wang H, Sun X. (2005 Jun): Desensitized nicotinic receptors in brain. Brain Res Brain Res
Rev.;48(3):420-37.
46. Baumann F, Regenthal R, Burgos-Guerrero IL, Hegerl U, Preiss R. (2010 Jan): Determination
of nicotine and cotinine in human serum by means of LC/MS. J Chromatogr B Analyt Technol
Biomed Life Sci. 1;878(1):107-11.
47. Wiergowski M, Nowak-Banasik L, Morkowska A, Galer-Tatarowicz K, Szpiech B, Korolkiewicz
R, et al. (2006): Determination of nicotine and cotinine in human biological materials and
their significance in toxicological studies. Prz Lek.;63(10):892-6.
48. Pang RD, Zvolensky MJ, Schmidt NB, Leventhal AM. (2015 Jun): Gender differences in
negative reinforcement smoking expectancies. Nicotine & Tobacco Research.;17(6):750.
49. Vogel RI, Hertsgaard LA, Dermody SS, Luo X, Moua L, Allen S, et al. (2014 Jul): Sex differences
in response to reduced nicotine content cigarettes. Addictive behaviors.;39(7):1197.
50. Walter Mertz (2012): Trace Elements in Human and Animal Nutrition - 5th Edition. Academic
Press, Maryland, USA. P 499.
51. Karl R. Schneider (1996): Soil Testing and Plant Analysis for Fertilizer Recommendations.
Agricola Database. ISSN: 1052-5378. QB 96-12.
52. Kostial K, Kello D, Jugo S, Rabar I, Maljkovic T. (1978 Aug): Influence of age on metal
metabolism and toxicity. Environ Health Perspect.;25: 81-6.
53. Jugo S. (1977 Feb): Metabolism of toxic heavy metals in growing organisms: a review.
Environ Res.;13(1):36-46.
54. Eichhorn GL, Berger NA, Butzow JJ, Clark P, Rifkind JM, Shin YA, et al. (1971): The effect of
metal ions on the structure of nucleic acids. In: Bioinorganic Chemistry. American Chemical
Society; p. 135-54. (Advances in Chemistry; vol. 100).
55. Stephens WE, Calder A, Newton J. (2005 Jan 1): Source and health implications of high toxic
metal concentrations in illicit tobacco products. Environ Sci Technol.;39(2):479-88.
56. Flick DF, Kraybill HF, Dlmitroff JM. (1971 Apr 1): Toxic effects of cadmium: A review.
Environmental Research.;4(2):71-85.
57. Kumar M, Puri A. (2012): A review of permissible limits of drinking water. Indian J Occup
Environ Med.;16(1):40-4.
58. Fox MRS. (1979): Nutritional Influences on Metal Toxicity: Cadmium as a Model Toxic
Element.;10.
95

59. Lamb DT, Ming H, Megharaj M, Naidu R. (2009 Nov 15): Heavy metal (Cu, Zn, Cd and Pb)
partitioning and bioaccessibility in uncontaminated and long-term contaminated soils. J
Hazard Mater.;171(1-3):1150-8.
60. Jalali M, Khanlari ZV. (2007 Nov): Redistribution of fractions of zinc, cadmium, nickel, copper,
and lead in contaminated calcareous soils treated with EDTA. Arch Environ Contam
Toxicol.;53(4):519-32.
61. Fresquez MR, Pappas RS, Watson CH. (2013 Jun): Establishment of toxic metal reference
range in tobacco from US cigarettes. J Anal Toxicol.;37(5):298-304.
62. Regassa G, Chandravanshi BS. (2016 Feb): Levels of heavy metals in the raw and processed
Ethiopian tobacco leaves. Springerplus. 29;5.
63. Chiba M, Masironi R. (1992): Toxic and trace elements in tobacco and tobacco smoke. Bull
World Health Organ.;70(2):269-75.
64. Masironi R. (1969): Trace elements and cardiovascular diseases. Bull World Health
Organ.;40(2):305-12.
65. Allard WF, DeVol EB, Te OB. (1999 Dec): Smokeless tobacco (shamma) and oral cancer in
Saudi Arabia. Community Dent Oral Epidemiol.;27(6):398-405.
66. Tso TC, Harley N, Alexander LT. (1966 Aug 19): Source of lead-210 and polonium-210 in
tobacco. Science.;153(3738):880-2.
67. Brunnemann KD, Rivenson A, Adams JD, Hecht SS, Hoffmann D. (1987): A study of snuff
carcinogenesis. IARC Sci Publ.;(84):456-9.
68. Grasso P, Mann AH. (1998 Nov): Smokeless tobacco and oral cancer: an assessment of
evidence derived from laboratory animals. Food Chem Toxicol.;36(11):1015-29.
69. Preston-Martin S. (1991): Evaluation of the evidence that tobacco-specific nitrosamines
(TSNA) cause cancer in humans. Crit Rev Toxicol.;21(4):295-8.
70. Idris AM, Nair J, Friesen M, Ohshima H, Brouet I, Faustman EM, et al. (1992 Jun):
Carcinogenic tobacco-specific nitrosamines are present at unusually high levels in the saliva
of oral snuff users in Sudan. Carcinogenesis.;13(6):1001-5.
71. Costea DE, Lukandu O, Bui L, Ibrahim MJM, Lygre R, Neppelberg E, et al. (2010 Feb): Adverse
effects of Sudanese toombak vs. Swedish snuff on human oral cells. J Oral Pathol
Med.;39(2):128-40.
72. Rodu B, Jansson C. (2004 Sep): Smokeless tobacco and oral cancer: a review of the risks and
determinants. Crit Rev Oral Biol Med. 1;15(5):252-63.
73. Ahmed HG. (2013 Jul): Aetiology of Oral Cancer in the Sudan. J Oral Maxillofac Res. 1;4(2).
96
74. Critchley JA, Unal B. (2003 May): Health effects associated with smokeless tobacco: a
systematic review. Thorax.;58(5):435-443.
75. Bolinder G, Gilljam H. (2015): Smokeless tobacco - health hazards or less harm? The tobacco
epidemic.;42: 243-51.
76. Bolinder G. (1997 Oct 15): Overview of knowledge of health effects of smokeless tobacco.
Increased risk of cardiovascular diseases and mortality because of snuff.
Lakartidningen.;94(42): 3725-31.
77. Shah SH, Khan SM. (1992 Oct;): Association of oral carcinoma with nasswar (snuff dipping).
J Environ Pathol Toxicol Oncol. 11(5-6):323-5.
78. Ahmed F, Islam KM. (1990 Jun): Site predilection of oral cancer and its correlation with
chewing and smoking habit--a study of 103 cases. Bangladesh Med Res Counc
Bull.;16(1):17-25.
79. Squier CA. (1984 Oct): Smokeless tobacco and oral cancer: a cause for concern? CA Cancer
J Clin.;34(5):242-7.
80. JAMA. (1986 Feb): Health effects of smokeless tobacco. Council on scientific
affairs.28;255(8):1038-44.
81. Canto MT, Kawaguchi Y, Horowitz AM. (): Coverage and quality of oral cancer information
in the popular press: 1987-98. J Public Health Dent. 1998;58(3):241-7.
82. Skoog DA, Holler FJ, Nieman TA. (1998): Principles of instrumental analysis [Internet]. 5th
ed. Philadelphia: Saunders College Pub.; Orlando, Fla.: Harcourt Brace College Publishers.
83. Fathi RM, Fauzantoro A, Rahman SF, Gozan M. (2018): Column chromatography isolation of
nicotine from tobacco leaf extract (Nicotiana tabaccum L.). I. p. 030011.
84. Osterdahl B-G, Jansson C, Paccou A. (2004 Aug 11): Decreased levels of tobacco-specific N-
nitrosamines in moist snuff on the Swedish market. J Agric Food Chem.;52(16):5085-8.
85. Musharraf SG., Shoaib M., Siddiqui AJ., Najam-ul-Haq M. and Ahmed A. (2012): Quantitative
analysis of some important metals and metalloids in tobacco products by inductively
coupled plasma-mass spectrometry (ICP-MS). Chem. Cent J. 6 (1):56.
86. Al-Mukhaini N, Ba-Omar T, Eltayeb E, Al-Shehi A. (2014 Aug): Determination of heavy metals
in the common smokeless tobacco afzal in oman. Sultan Qaboos Univ Med J.;14(3): e349-
355.
87. Addo, M. A., Duodu O. G., Affum H. A., Gbadago J. K., Darko E. O. and Coleman A. (2011):
Determination of minerals profile in Ghanaian local snuffs and an imported snuff using
instrumental neutron activation analysis. British Journal of Pharmacology and Toxicology.
ISSN: 2044-2467. 2(6): 293-301.
97

88. Brima EI. (2016): Determination of metal levels in shamma (Smokeless Tobacco) with
inductively coupled plasma mass spectrometry (ICP-MS) in Najran, Saudi Arabia. Asian Pac J
Cancer Prev.;17(10):4761-7.
89. Prabhakar V, Jayakrishnan G, Nair SV, Ranganathan B. (2013 May): Determination of trace
metals, moisture, pH and assessment of potential toxicity of selected smokeless tobacco
products. Indian J Pharm Sci.;75(3):262-9.
90. WHO | JECFA. (2007): Joint Expert Committee on food additives. Evaluation of certain food
additives and contaminant. WHO Technical Report Series; 940. World Health Organization.
Geneva.
91. WHO | Joint FAO/WHO (2010): Expert Committee on Food Additives (JECFA) publications.
Summary report of the seventy-second meeting of JECFA. World Health Organization.
Geneva.
98

Appendix (1)Subject Questionnaire with Toombak
Prepared by: Ghada Mohamed and Prof Mohamed A.H. El-tayeb*^a"a.a!/ ^3 5jMilia oJlx£ ,.| Ja Jjj/Jj,j/ ^3ja <3j*aJ <jUl^/ SdA uaa^
dljAjJl *h4M jp <ajUJ/ j^LxaJIj ,.*!/ ^LajA/ <jAa <3j*aj.^03 ^aJ*!/ ‘^//
1- Name....................................
2- Age......................................
3- Sex........................................
4- Educational Level
None educated | | Pasic Level
Secondary level | | University level
Post graduate Level
5- Do you use Toombak
| | Yes | No
- If the answer is yes
6- When did you start using it?
| Year | | 2Year | | More than 2 Year
7- How many times do you use Toombak per day?
| | One to Three times per day
| | One to six times per day
| | More than six times per day
8- Does Toombak using caused any Health hazards for you?
| | Yes | | No
- If the answer yes
□ □□

9- What type of health hazards?
nGum infection Teeth yellowish
Gum infection and teeth yellowish
10- Did you try to quit toombak using?
| | Yes | | No
11- If yes, how did you quit?
| | Failed to quit
| | By reducing the intake
| | By using cigarette
n By using more tea and coffee

Appendix (2)

4 h$ tt
4aj|j»ui 4-uujLa <iua)»a
2016:1926 J gh (J

2016:1926 4 <j <Ujh»ui AauiljS 4Xua)»a
AJaxiiljj Axilajll Ol»tziljxll jIa&I Lgxlgx (jx 4_ul5j 4 Jxl& 4_±JA 4 (jxulixllj OlL-aljxJ] <ubjuJN
-4k^»U djlj Cxl^aJI £x (jjl*21tj 4_i_£uxukSx A_uIJjjj 4_u3
^311 4 4 ITiHI (JxC. £xljjJ (jxjJa (jjJjliaJlj OU>ziljxll AjjLjJI 4jj$JI (Ju5 (jx <i*̂ ljxJI o^A jljcJ
• •11
\

2016:1926 ■> cm <J m 4|ml)4
(JI •> .all .1<_jjjUu]| .2
.34,‘>,i*7ill .4
AaaAjajyi ObLull .5Jalil .6
Otuxll j&l .7(_£>!» .8
AajiJI CjLxlIax^fill .9£?J>aJI .10
1

2016:1926 J £ f.
HJLuuJI«
Snus
JL~]| .1
«
.AjijJsjJI t j jlalU Ula^g u^xaMj l&Luijj UjjjSjj £jj Qx /-1.JI ^IIxcjIL 4-UaUjiJI oife l__^a2Sj
uLjIaHI .2
^UmII 1.2
ojfiiJ j»iJ| I—4juJa_jJ .Isuoj (jj-s.fdl 3x-all jjo_j i—ilaj-iJlj QjTh ViaV £jj]l CjIaSia ^uxo J*
.Vajjti, ,lr>alj aJJi-o jjc- 4_uxj
41UuJI jj 2.2
oj£p>J Ajjiajj Ali^Jbua ^uj K'.-jj IjjjjSLj <Lu^a3 (_j-« OuLu A-Jc- Jj^xaJI <ajj £-L> _jA.Aj^alk (2>a.Uax> ^3 <2113 3*J 4ja3a_j pl_^JIj
3.2.?jj Jjj-oll CuU^jjSLuj djUjjji (j-a Jadik j»Li. (jd SjLc. ^xj.ila _jA
MjJull 4.2
^jLoll (Jjl?kx C^j0'i/'i <2H..baill AJJ Inly.l till3j 12&1 <2JUa11I jj$-y"' 4 jlaC.
. (Jjl~k.allj (—J^iuj ^La. {(jjjLxJI)
.3
A_abd) oUa^lui'jfl 1.3
IAjIHII <2jUaljii\/l ji_j-L> J '-Tiaj
^Jj£)iJlj 4_UajjjiJI OLL-ay l_j CjULilall i21lxaall jjtaa.>“i ^-\j>"i.,ax.ll £_ull (j $£j 1.1.3
. A_ujkll jljxJlj U-ljj.a-xllj OLjJaallj
. jJlj j-jJJ Uaajll ^3 2.1.3<J Aj^alsbJI OLl—tal^di GLLLxxj^ L.J^JuU LaJiL-a ^Lq " u-JJjjj ^A'xlkM^aV $.LaJl QjSj jl 3 • 1 • 3
.044:2007 3 <_jj41I oL^ Aa.^aljx
.<_£_)& Hall (jaxll (3-° ^jl^jll (Jjxjl j'j(jl 4-1.3
2

2016=1226 •> xa-J e
oUal^Vi 2.3
. (j j jlnxll ^aL-aS-oLj l^jbu-o ^-AuuiJ £-jJJ ^ViAxll <olL-o ^3 (jl i J>J 1.2.3
4 (JSJ frLfl 8 <■, i'.IXU QjJanJI (2>« a-la-lj 3-l=kj J ,'j; jl~»* V i_iLjaJ (jl i—lau 2.2.3.£xi]l dlljjaj
.L-uljJill (jx LilLi. gjaxall QjJaxll a tj(jl SlX>j 3.2-3
.% 5 jje- jL^jll ^cSiall J (jjJj^flV <Jxaj Jjjj L/ jjl i. 1>J 4.2-3
.% 60 — % 40 J <xuj (j\ \yi 5.2.3
.% 40 — % 35 J JJLJI jLJI qjSj jl sx>j 6.2.3
.% 5 qC. (jjjJb (jXa.^.11 J jjc. jLJI <x^j Jujp 'yi <■..i>j 7.2.3
. 11 - 8 J (pH) j_A? jl 8.2.3
1 J SJjlJlj (jjalall <> «j?-) (jc- cJ-IjjJI JjIo Jjjj ^1 9.2.3OLhiaJI (JxLa — 1
u^i\ ^aJI
0.1 ppm UiP51
0.5 ppm3,0 ppm
AludJI .4
a ,~j .> iXjUUJI .5 •• *• • .»•
: cjl^aJI J& <*Ulj CuljUJI Qji
. (tdLxau) ^CiixJI 1-5
(jc- -Loll (Jsj Vl Jc- SJjia Irv j ajJxll Jc- AjLSJLi Aj-S. rtll ^-rtj l~r 2.5
. 3^-lxil . j *̂L> (14 li 'j)
(jLuUlj Aulil (jUaju. <. l.l.aij 4Li ~jLja t^Jlrajjl) 3j_njl <£jxlj <5-^c' 4_Au£ 3-5
•(ej*y'j .(□ I jT l v-J 4 5) (JlSuiSn J LaS (jLuJJIj AalJI jUa^J )$.-rt.il ^A^.1 A—^J S 4-5
3

2016:1926 J cp f^lualfra
JSlHI .6
OlL*^ IjJ .7
jljjiyij Jjjh .8
ISO 15152:2003 <i*-al_>2l t.,,u».^ jjjjjSajJI 1.8
ISO 6488:2004 2.8
. CORESTA Recommended Method No. 69 - pH 3.8
•ISO 2817:1999 >^1 □LJ 4.8
ISO 3489:2000 ol^xdl 5.8
4

20164926 jf
NatroonSnusMould
<^1 CuUJkuxdl .9

2016:1926 J <j f
aeM .10
10.1 Draft Indian Standard Tobacco and Tobacco product-portion packed Snus- specification . FAD 04 (2724:2015).10.2 Idris AM, Ibrahim so et al (1998). The Swedish Snus and the Sudanese Toombak: are they different oral oncology. 34.558-566.
044:2007 3.10
6

2016:1926 J o Ji ? Aua^LI <Xuai^a
j*j uuujj JSJ «jIUuJl
<^■4*^ ijUaj*h Jill illlxuJi
Sul! I qILjmi Jjti
7