Retracing and Redrawing the Boundaries of Events: Postmodern Interferences with International Theory
Upload
khangminh22Category
view
1download
0
Ž .Spectrochimica Acta Part B 54 1999 1099]1122
Spectrochimica Acta Electronica
Spectral interferences in the determination of traceelements in environmental materials by inductively
coupled plasma atomic emission spectrometry q
N. DaskalovaU, Iv. BoevskiInstitute of General and Inorganic Chemistry, Bulgarian Academy of Sciences, BG 1113 Sofia, Bulgaria
Received 13 August 1998; accepted 1 March 1999
Abstract
Ž .This paper deals with spectral interferences in inductively coupled plasma atomic emission spectrometry ICP-AESencountered with environmental materials. These samples normally contain high concentrations of aluminium,
Ž .calcium, magnesium, iron, titanium, potassium and sodium. The investigations cover: a spectral data for Al, Ca, Mg,Ž .Fe, Ti, K and Na as interferents for 200 pm wide windows centred "100 pm around the prominent lines of As, B,
Ž .Ba, Be, Cd, Cr, Cu, Hg, Mn, P, Pb, Sb, Se, Sn, Tl, U and Zn; b a data base of Q-values for line interferencew Ž .x w Ž .xQ l and Q-values for wing background interference Q Dl for two values of the excitation temperatureI j a W j a6200 K and 7200 K. The lines free or negligibly influenced by line interference were selected for analytedetermination. Q-values were used for calculation of correction factors under a spectral line without the measure-ment of a reference blank at the wavelength of the prominent analysis lines. The accuracy of ICP-AES with theQ-concept as a basic methodology is checked by the analysis of a certified reference material IAEArSedimentSD-N-1r2r. The precision of the method is characterised by an RSD of 0.6]1.7%. Extraction of trace elementssoluble in aqua regia was used as a decomposition method. This article is an electronic publication in Spectrochimica
Ž . Ž .Acta Electronica SAE , a section of Spectrochimica Acta, Part B SAB . The hardcopy text is accompanied by anelectronic archive, stored on the SAE homepage at http:rrwww.elsevier.nlrlocatersabe. The archive contains thetabular material of this article in electronic form. Q 1999 Elsevier Science B.V. All rights reserved.
Keywords: ICP-AES; Environmental materials; Spectral interferences; Line selection; Trace elements; Correction procedure; Truedetection limits; Q-concept
q Ž . Ž .This article is an electronic publication in Spectrochimica Acta Electronica SAE , a section of Spectrochimica Acta Part B SAB .ŽThis printed text is accompanied by one or more electronic files archived on the SAE homepage http:rr
. w xwww.elsevier.nlrlocatersabe under the name ‘.... spectral interferences in trace analysis by ICP-AES ....’ and identified by54r1099r99, where 54 is the issue number, 1099 is the number of the first page of the printed text, and 99 is the two digit year.Readers of this journal are permitted to copy the contents of the electronic archive for their personal use under the conditionsstated in under the ‘Copyright’ and ‘Disclaimer’ at the end of this article, and generally in the notes for contributors publishedelsewhere in this issue.U Corresponding author. Fax: q359-2-70-50-24.
Ž .E-mail address: [email protected] Iv. Boevski
0584-8547r99r$ - see front matter Q 1999 Elsevier Science B.V. All rights reserved.Ž .PII: S 0 5 8 4 - 8 5 4 7 9 9 0 0 0 4 3 - 9
( )N. Daskalo¨a, I . Boe¨ski r Spectrochimica Acta Part B: Atomic Spectroscopy 54 1999 1099]11221100
1. Introduction
Modern environmental science maintains agreat interest in techniques for the multielementanalysis of different materials: natural and wastewaters, soils, sediments and air particulates. Thetrace elements interact and collectively influencebiological activities and knowledge about the con-centrations of as many elements as possible whichis very desirable. Therefore, trace analyticalmethodologies with multielement capability areneeded. Among the modern analytical methodsfor the determination of trace elements, induc-tively coupled plasma atomic emission spectrome-
Ž . w xtry ICP-AES is very powerful 1,2 .Environmental scientists require analytical re-
sults with reliable precision and accuracy for alarge number of analytes. Analysis of a variety ofcomplex environmental materials is a difficult taskfrom this point of view.
Systematic errors in ICP-AES may result fromdifferent steps in the analytical procedure. Atpresent, accurate ICP-AES analysis of environ-mental materials other than natural or wastewaters requires dissolution of the samples. Themethod is influenced by blank contributions fromall steps during sampling and sample preparation.The blank might be considerable and must becontrolled when working at trace concentrationsw x3 .
Considerable systematic errors in ICP-AES mayarise from spectral interferences. There is a bodyof continuously growing literature describing the
w xnature of spectral interferences 2 . Boumans dis-cussed various aspects of spectral interferences in
w xatomic emission spectrometry 4,5 . Analysis of avariety of complex environmental materials en-sures that all the possible types will be encoun-tered sooner or later. The most difficult samples,from this point of view, are the different sedi-
w xments and soils 6,7 . These materials normallycontain high concentrations of Al, Ca and Mg,which cause significant background enhancementin many regions of the spectrum, high concentra-tions of Fe and to a lesser extent, Ti which cangive rise to serious line overlap interferences inthe determination of trace elements.
Therefore, the fundamental problem in the de-
termination of traces of elements in environmen-tal materials is to study the spectral interferences.These data are indispensable for both optimumline selection for trace analysis and developmentof a correction procedure for spectral interfer-
w xences 8]10 . Efficient and accurate correctionfor these interferences normally requires a mea-surement of the background intensity adjacent to
Ž .the analyte wavelength l .aŽThe continuous background even if slightly
.sloping can be accurately determined by one-or-two point measurements. However, this is impos-sible with the interfering line signal, since anaccurate measurement would make demands onthe accuracy of the wavelength positioning deviceof the spectrometer. Hence, an interfering linesignal in the presence of a given matrix has to beconsidered as a contribution to the backgroundthat can be measured only with a far larger un-certainly than continuous background. It was thisinsight that prompted the introduction of the
Ž .concept of ‘true detection limit’ C to beL,truedistinguished from the ‘conventional detection
Ž .limit’ C and the ‘common detection limit’L,conv.Ž . w xC for pure solvent 11 .L
In the case of a multicomponent system, CL,trueŽ .is represented by Eq. 1 :
2 Ž .C s =Q l =C qCÝL ,true I j a I j L,conv.5j
2 Ž .s BEC qC 1Ý I j L,conv.5j
The conventional detection limit C can beL,conv.written as:
C s262=0.01=RSDBL= BECqÝL,conv.j
Ž . Ž .=Q l C q Q Dl CÝI j a I j W j a I jj
s262=0.01=RSDBL
Ž .= BECq BEC q BEC 2Ý ÝI j W jj j
( )N. Daskalo¨a, I . Boe¨ski r Spectrochimica Acta Part B: Atomic Spectroscopy 54 1999 1099]1122 1101
The detection limits of the analytes in the pureŽ . Ž .solvent or dilute acid are defined by Eq. 3
w x12,13 , which is written in terms of the back-Ž .ground equivalent concentration BEC relevant
to background signal X and the relative stan-BŽ .dard deviation of the background RSDBs1% :
Ž .C s262=0.01=RSDB=BEC 3L
The concept of ‘true detection limit’ as pro-w xposed by Boumans and Vrakking 12,14 was used
in the determination of rare earth elements inw x‘pure’ rare earth matrices 12,13,15]17 and in
the determination of dopants and impurities inw xsingle crystal materials 18]20 .
The purposes of the present paper are to showthe possibilities of the Q concept to the determi-nation of traces of As, B, Ba, Be, Cd, Cr, Cu, Hg,Mn, P, Pb, Sb, Se, Sn, Tl, U and Zn in complexenvironmental materials, related to water and airquality monitoring, sediments and soils.
To this purpose the following data have beencompiled:
Ž y1 . Ž1. spectral data for Al 2 mg ml , Ca 2 mgy1 . Ž y1 . Ž y1 . Žml , Mg 2 mg ml , Fe 2 mg ml , Ti 2
y1 . Ž y1 . Žmg ml , K 2 mg ml , and Na 2 mgy1 .ml as interferents separately covering 200
pm wide spectral windows centred over aŽ .spectral region of "100 pm around the la
wavelength of all investigated analytes;2. a data base of Q-values for line interference
Ž .Q l and Q-values for wing backgroundI j aŽ .interference Q Dl for each of the aboveW j a
mentioned interferents;3. ‘the best’ analysis lines for determination of
analytes in a complex matrix; and4. detection limits obtained using the ‘true
detection limit criterion’ in presence of amulticomponent matrix.
2. Experimental
2.1. Instrumentation
The experiments were performed with the JobinŽ .Yvon France equipment specified in Table 1.
The qualitative information about the type ofspectral interferences was derived from wave-
Žlength scans centred around the candidate prom-.inent analysis lines in the presence of Al, Ca,
Mg, Fe, Ti, K and Na as interferents, separately.The scans were made in a scanning mode of thespectrometer with an XrY recorder, type T 5CŽ . w xYobin Yvon 13,16]19 .
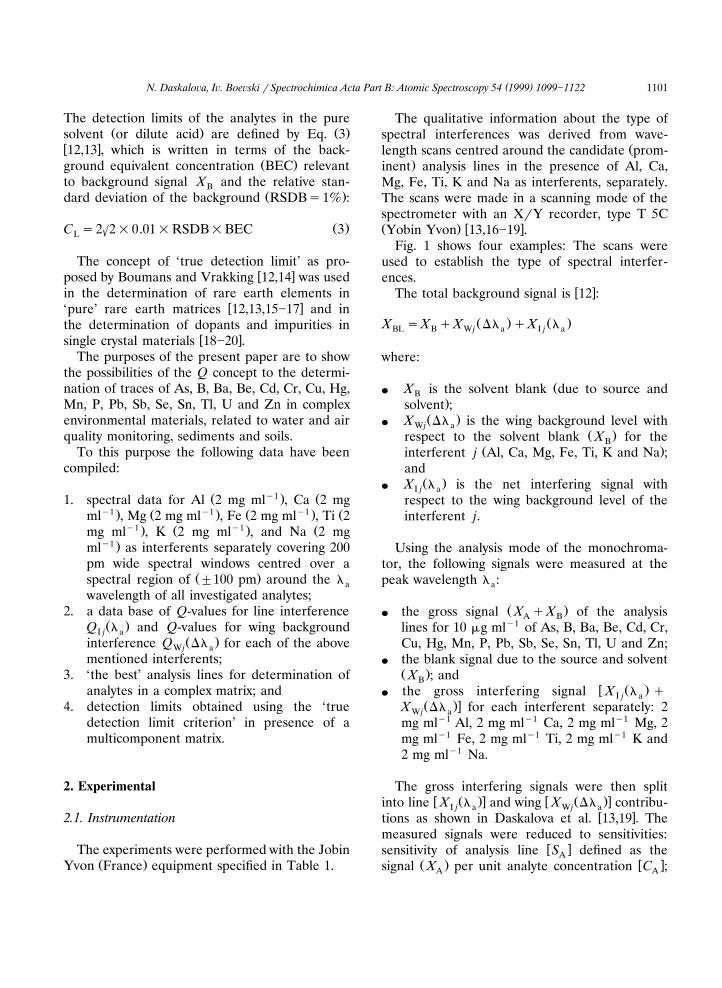
Fig. 1 shows four examples: The scans wereused to establish the type of spectral interfer-ences.
w xThe total background signal is 12 :
Ž . Ž .X sX qX Dl qX lBL B W j a I j a
where:
Žv X is the solvent blank due to source andB.solvent ;
Ž .v X Dl is the wing background level withW j aŽ .respect to the solvent blank X for theB
Ž .interferent j Al, Ca, Mg, Fe, Ti, K and Na ;and
Ž .v X l is the net interfering signal withI j arespect to the wing background level of theinterferent j.
Using the analysis mode of the monochroma-tor, the following signals were measured at thepeak wavelength l :a
Ž .v the gross signal X qX of the analysisA Blines for 10 mg mly1 of As, B, Ba, Be, Cd, Cr,Cu, Hg, Mn, P, Pb, Sb, Se, Sn, Tl, U and Zn;
v the blank signal due to the source and solventŽ .X ; andB
w Ž .v the gross interfering signal X l qI j aŽ .xX Dl for each interferent separately: 2W j a
mg mly1 Al, 2 mg mly1 Ca, 2 mg mly1 Mg, 2mg mly1 Fe, 2 mg mly1 Ti, 2 mg mly1 K and2 mg mly1 Na.
The gross interfering signals were then splitw Ž .x w Ž .xinto line X l and wing X Dl contribu-I j a W j a
w xtions as shown in Daskalova et al. 13,19 . Themeasured signals were reduced to sensitivities:
w xsensitivity of analysis line S defined as theAŽ . w xsignal X per unit analyte concentration C ;A A

( )N. Daskalo¨a, I . Boe¨ski r Spectrochimica Acta Part B: Atomic Spectroscopy 54 1999 1099]11221102
Table 1Specification of the spectrometer, ICP source and operating conditions
Ž .Monochromator JY 38 Jobin Yvon, FranceMounting Czerny-Turner, focal length, 1 m
y1Grating Holographic, 2400 grooves mmŽ .Wavelength range 170]700 nm first order
y1Dispersion 0.38 nm mmEntrance slit 0.02 mmExit slit 0.04 mmResultant spectral slit 15.2 pmPractical spectral band width 15.6 pmPhotomultiplier Hamamatsu TV, R 446 HA
RF generator Plasma Therm, model HFP 1500 DŽ .Frequency 27.12 MHz "0.05%
Oscillator Crystal controlled at 13.56 MHzPower output 0.5]1.5 kW
Nebulizer Meinhard, concentric glassŽ .Pump Peristaltic, ten-roller, Gilson Minipuls II Gilson Medical Electronics, France
Operating conditionsŽ .Set 1 Incident power kW 1.0
y1Ž .Outer Ar flow rate l min 15y1Ž .Carrier flow rate l min 0.5
y1Ž .Liquid uptake rate ml min 1.3y1Ž . Ž .Nebulizer pressure flow lbf in 30 2.08 bar
Ž .Transport efficiency of ICP system % 3Ž .Excitation temperature of ICP plasma K 6200
Ž .Set 2 Incident power kW 1.0y1Ž .Outer Ar flow rate l min 15
y1Ž .Carrier flow rate l min 0.4y1Ž .Liquid uptake rate ml min 1.3
y2Ž . Ž .Nebulizer pressure flow lbf in 20 1.38 barŽ .Transport efficiency of ICP system % 3
Ž .Excitation temperature of ICP plasma K 7200
w Ž .x w Ž .xinterferent sensitivities S l and S Dl ,I j a W j aw Ž .xdefined as interferent signals X l andI a
w Ž .xX Dl , respectively, per unit interferent con-W aw x Ž .centration C . By using S , S Dl andI j A W j a
Ž .S l , the values of Q s S rS , Q sI j a W j W j A I jS rS , BEC sQ =C and BEC sQ =I j A I j I j I j W j W jC were obtained.W j
2.2. Reagents and test solutions
Reagents of highest purity grade were used:Ž .30% HCl Suprapur, Merck , 65% HNO3
Ž .Suprapur, Merck , and tri-distilled water from aquartz apparatus.
Ž y1 .Stock solutions of the analyte 1 mg ml wereprepared from Merck Titrisols. The stock solu-
Ž y1 .tions of the matrix components 10 mg ml
were prepared by dissolving the corresponding,chlorides in hydrochloric acid. Q-values weremeasured by using the following test solutions: 10mg mly1 of each of the analytes: As, B, Ba, Be,Cd, Cr, Cu, Hg, Mn, P, Pb, Sb, Se, Sn, Tl, U andZn; 2 mg mly1 for each of interferents: Al, Ca,Fe, Mg and Ti. Plastic or PTFE ware was usedthroughout.
2.3. Dissolution procedure
For experimental demonstration of the ICP-AES and Q-concept in the analysis of environ-mental materials certified reference materialIAEArSediment SD-N-1r2 was used. Extractionof trace elements soluble in aqua regia was usedas a decomposition method in accordance with
( )N. Daskalo¨a, I . Boe¨ski r Spectrochimica Acta Part B: Atomic Spectroscopy 54 1999 1099]1122 1103
Fig. 1. Example of spectral scans over a spectral region aroundŽ . Žthe analysis line of Pb: a Central wavelength: 220 353 pm Pb
. Ž . y1line : interferents: Ca and Fe: 1 10 mg ml Pb in pureŽ . y1 Ž . y1 Ž .solvent; 2 2 mg ml Fe; 3 2 mg ml Ca. b Central
Ž . Ž .wavelength: 220 353 pm Pb line : interferent: Al: 1 10 mgy1 Ž . y1 Ž .ml Pb in pure solvent; 2 interferent: 2 mg ml Al. c
Ž . Ž . y1Central wavelength: 283 306 pm Pb line : 1 10 mg ml PbŽ . y1 Ž .in pure solvent; 2 interferent: 2 mg ml Mg. d Central
Ž . Ž . y1wavelength: 261 418 pm Pb line : 1 10 mg ml Pb in pureŽ . y1solvent; 2 interferent: 2 mg ml Fe.

( )N. Daskalo¨a, I . Boe¨ski r Spectrochimica Acta Part B: Atomic Spectroscopy 54 1999 1099]11221104
Ž .ISO 11466: 1995 E : 1 g sample was weightedaccurately in a reaction vessel; 0.5 ml of tri-dis-tilled water was added to obtain a slurry, followed
Ž y1 .by 9 ml of HCl 12 mol l and 3 ml nitric acidŽ y1 . y115.8 mol l . Then 10 ml of 0.5 mol l wasadded to the absorption vessel which was con-nected to the reflux condensor. Both apparatuswere placed on the top of the reaction vessel. Thesamples were allowed to stand for 16 h at roomtemperature in order to reduce the producedduring the subsequent heating cycle. They wereheated under reflux until boiling for 2 h andallowed to cool slowly at room temperature. Thecontents and the following rinses of the absorp-tion vessel were passed through the condenserinto the reaction vessel. The content of the reac-tion vessel was transferred quantitatively to a 50ml graduated flask and filled up to the mark with
Ž y1 .nitric acid 0.5 mol l . After the undissolvedmaterial has settled, the supernatant solution wassubjected to analysis by ICP-AES.
A blank sample containing the acids used fordigestion was prepared in the same way.
2.4. Calibration procedure
The reference solutions for the determinationof the analytes were prepared on the basis of ablank containing the acids used for digestion andcomplex matrix. A blank sample was prepared asdescribed in Section 2.3. The number of referencesolutions for any particular analyte ranged from 5to 20 depending on the necessary concentrationrange. It was not necessary to run all 20 referencesolutions for each calibration. The matrix blankcontained both the acid blank and complex ma-trix.
The reference solutions in the determination ofmatrix elements were prepared on the basis of anacid blank. The absence of any spectroscopicinterferences between the various elements ineach reference solution is very desirable.
3. Results and discussion
3.1. Spectral interferences
The present article studies the spectral inter-
ferences in the presence of 2 mg mly1 Al, Ca, Mg,Fe and Ti, respectively, as interferents on theprominent analysis lines of As, B, Ba, Be, Cd, Cr,Cu, Hg, Mn, P, Pb, Sb, Se, Sn, Tl, U and Zn asanalytes. Information on the interfering matrixlines in the 200 pm spectral window for each ofthe matrix components was derived separatelyfrom the wavelength scans centred around theanalysis lines. The interfering lines were identi-fied by measuring their position with respect tothat of the relevant analysis line in a separatescan of the analyte. Table 2 lists the wavelengthsof the prominent analysis lines, the interfering Al,Ca, Mg, Fe, Ti, Na, K and Ar lines, as well as the
Žwavelength distance Dlsl yl l is centralk a kwavelength of the interfering line, l is the cen-a
.tral wavelength of the analysis line . If the inter-w xfering lines are known from classical tables 21,22
w xthe M.I.T. Tables 21 were quoted. In cases wherethe corresponding interfering matrix line is listed
w xin the Boumans’ Line Coincidence Tables 23 ,this table also is quoted. If an interfering line isgiven without a reference, this means that the
w xline is not listed in the existing tables 21]23 .In this work 294 matrix spectral lines were
registered around 56 investigated analysis lines:The results from Table 2 show the following:
1. 47% of the total number of identified inter-fering Ti lines are not listed in the existing
w xtables 21]23 . This percentage is 5.8% in thecase of Fe;
2. 37% of the total number of identified inter-fering Ti lines are listed in the classical tablesw x w x21,22 , but not listed in ICP tables 23 . Thispercentage is 76% in the case of Fe as inter-ferent and 8.7% for Al.
3. In case of Ca and Mg six spectral lines wereregistered, which are noted only in the classi-
w xcal spectral tables 21,22 .4. No Na or K interfering lines were registered
in the spectral regions investigated.
3.2. Q-values
The Q-concept of Boumans and Vrakking

()
N.D
askalo¨a,I.B
oe¨skirSpectrochim
icaA
ctaP
artB:A
tomic
Spectroscopy54
19991099
]11221105
Table 2Interfering lines affecting the prominent analysis lines of As, B, Ba, Be, Cd, Cr, Cu, Hg, Mn, P, Pb, Sb, Se, Sn, Tl, U and Zn
Ž . Ž . Ž .Analysis lines Interfering matrix Dl Analysis lines Interfering matrix Dl Analysis lines Interfering matrix Dla a aŽ . Ž . Ž . Ž . Ž . Ž . Ž . Ž . Ž .pm lines pm pm pm lines pm pm pm lines pm pm
w x w xAs I 228 812 Ti 228 904 q92 Fe I 324 821 21 q67 Sb I 252 852 Fe II 252 955 21,23 q103w x w x w xFe I 228 903 21 q91 Fe II 324 739 21 y15 Fe 252 931 21 q79
w x w x w xFe 228 868 21 q56 Fe I 324 728 21 y26 Fe II 252 922 21 q70w x w x w xFe I 228 763 21 y49 Fe 324 721 21 y33 Fe I 252 913 21,23 q61
w x w xTi 228 747 y65 Fe II 324 717 21 y37 Fe 252 908 21 q56w x w xFe I 228 725 21 y87 Ti 324 712 y42 Fe 252 888 21 q36
w x w xTi 228 720 y92 Fe I 324 696 21 y58 Fe 252 817 21 y35w x w xAs I 200 334 Fe 200 434 q100 Fe 324 648 21 y106 Ti I 252 798 21,23 y54
w x w xFe 200 374 q40 Cu II 224 700 Fe II 224 769 21 q69 Fe 252 793 21 y59w x w x w xAs I 234 984 Ti II 235 066 21 q82 Fe 224 746 21 q46 Fe II 252 769 21 y83w x w x w xFe I 235 040 21 q56 Fe II 224 691 21 y9 Al II 252 747 21 y105
w x w xFe 235 017 q33 Cu I 327 396 Ca I 327 466 21 q70 Fe I 252 743 21,23 y109w x w xTi 234 994 21 q10 Fe 327 445 21 q49 Se I 203 985 Fe 204 068 q83
w x w xB I 249 773 Ti II 249 895 21 q122 Ti 327 405 21 q9 Ti 204 064 q79w x w x w xFe I 249 889 21 q116 Ca 327 396 21 0 Al II 203 993 21 q8w x w xFe II 249 782 21 q9 Fe II 327 350 21 y46 Se I 206 279 Fe 206 362 q83
w x w xFe 249 699 21 y74 Cu I 219 958 Fe I 220 072 21 q114 Ti 206 295 q16w x w xFe 249 653 21,23 y120 Ca I 220 072 21 q114 Ti 206 254 y25
w x w xB I 249 678 Fe II 249 782 21 q104 Fe I 220 039 21 q81 Fe 206 212 y67w x w x w xFe 249 699 21 q21 Fe 219 975 21 q17 Sn I 235 484 Fe II 235 522 21 q38w x w x w xFe 249 653 21,23 y25 Fe 219 957 21 y1 Ti II 235 514 21 q30
w x w x w xFe I 249 586 21 y92 Al 219 957 21 y1 Fe II 235 489 21 q5a a w x w xB I 208 959 ] ] Ti 219 927 21 y31 Ti II 235 462 21 y22a a w xB I 208 893 ] ] Al 219 916 y42 Fe II 235 447 21 y37a a w xBa II 455 404 ] ] Fe 219 864 y94 Ti 235 407 21 y77
w x w x w xBa II 493 409 Fe I 493 402 21 y7 Hg I 253 652 Fe 253 746 21 q94 Sn I 242 949 Fe II 243 019 21 q70w x w x w xFe 493 363 21 y46 Fe I 253 717 21,23 q65 Fe II 243 007 21,23 q58w x w x w xFe 493 335 21 y74 Fe II 253 714 21 q62 Fe I 242 981 21 q32w x w x w xBa II 233 527 Fe 233 453 21 y74 Fe II 253 682 21,23 q30 Fe II 242 949 21 0w x w x w xTi 233 453 21 y74 Fe II 253 667 21 q15 Fe II 242 938 21 y11w x w x w xTi 233 433 21 y94 Fe 253 622 21 y30 Fe II 242 904 21 y45w x w x w xCa 233 413 21 y114 Ti II 253 587 21,23 y65 Fe II 242 879 21 y70w x w x w xBa II 230 424 Al 230 495 21 q71 Fe I 253 560 21,23 y92 Sn I 283 999 Fe 284 093 21 q94
w x w x w xFe I 230 473 21 q49 Fe II 253 548 21 y104 Fe II 284 076 21 q77w x w x w xFe 230 382 21 y42 Mn II 257 610 Fe II 257 792 21 q182 Fe II 284 065 21 q66
w x w x w xFe I 230 358 21 y66 Fe II 257 686 21 q76 Fe I 284 042 21,23 q43w x w xFe 230 342 21 y82 Fe I 257 669 21,23 q59 Ti 284 040 q41
w x w x w xFe II 230 335 21 y89 Fe I 257 574 21,23 y36 Fe II 284 034 21 q35

()
N.D
askalo¨a,I.B
oe¨skirSpectrochim
icaA
ctaP
artB:A
tomic
Spectroscopy54
19991099
]11221106
Ž .Table 2 Continued
Ž . Ž . Ž .Analysis lines Interfering matrix Dl Analysis lines Interfering matrix Dl Analysis lines Interfering matrix Dla a aŽ . Ž . Ž . Ž . Ž . Ž . Ž . Ž . Ž .pm lines pm pm pm lines pm pm pm lines pm pm
w x w x w xBe II 313 042 Ti II 313 080 21,23 q38 Al 257 541 21 y69 Al 284 005 21 q6w x w x w xFe II 313 057 21 q15 Al I 257 510 21,23 y100 Fe II 283 953 21 y46
w x w x w xTi I 313 038 21 y4 Mn II 259 373 Fe 259 404 21 q31 Sn I 226 891 Al I 226 916 21,23 q25w x w x w xFe 313 028 21 y14 Fe II 259 373 21 0 Ti II 226 913 21 q22w x w x w xTi I 313 017 21 y25 Ti I 259 364 21,23 y9 Fe I 226 910 21 q19w x w x w xTi I 312 962 21 y80 Fe 259 352 21 y21 Al I 226 909 21 q18w x w x w xFe I 312 933 21 y109 Fe II 259 278 21,23 y95 Fe II 226 885 21 y6
w xBe I 234 861 Ti 234 836 y25 Ti 259 256 y117 Ti I 226 875 21 y16w x w xFe II 234 830 21 y31 P I 213 618 Ti 213 772 q154 Fe II 226 856 21 y35
w x w xTi 234 820 y41 Ti II 213 572 21 y46 Fe II 226 814 21 y77w x w x w xFe II 234 810 21,23 y51 Ti II 213 484 21 y134 Ti I 226 791 21 y100w x w x w xTi II 234 799 21 y62 Al I 213 470 21 y148 Tl I 276 787 Fe II 276 893 21 q106w x w xAl II 234 754 21 y107 P I 214 914 Al I 215 059 21 q145 Ti 276 854 q67w x w x w xTi II 234 744 21 y117 P I 253 565 Fe 253 717 21,23 q152 Mg I 276 846 21 q59w x w xBe II 313 107 Fe II 313 172 21 q65 Fe II 253 682 21,23 q117 Fe 276 845 q58w x w x w xTi II 313 080 21,23 y27 Ti II 253 587 21,23 q22 Fe II 276 834 21 q47w x w x w xFe II 313 057 21 y50 Fe I 253 560 21,23 y5 Fe 276 812 21 q25
w x w xTi I 313 038 21 y69 Ti II 253 462 21,23 y103 Ti 276 804 q17w x w x w xFe 313 028 21 y79 Fe II 253 442 21,23 y123 Fe I 276 752 21,23 y35w x w x w xTi I 313 017 21 y90 Fe II 253 363 21,23 y202 Fe II 276 750 21 y37w x w xCd II 214 438 Al I 214 539 21 q101 Pb II 220 353 Al 220 463 21 q110 Ti 276 745 y42w x w x w xFe I 214 519 21 q81 Fe 220 408 21 q55 Fe I 276 691 21 y96
w x w xFe 214 445 21 q7 Ti 220 361 q8 Tl I 351 924 Ti II 352 025 21 q101w x w xTi 214 390 y48 Fe 220 346 21 y7 Ti I 351 994 21 q70
w x w xFe 214 390 21 y48 Mg II 220 268 21 y85 Ti 351 916 y8w x w xTi 214 361 21 y77 Pb I 216 999 Fe 217 054 21 q55 Ti 351 892 y32w x w x w xCd I 228 802 Fe 228 868 21 q66 Fe 216 995 21 y4 Fe I 351 888 21 y36
w x w xFe I 228 763 21 y39 Al 216 950 y49 Ca 351 871 21 y53w x w x w xFe I 228 725 21 y77 Al I 216 880 21 y119 Fe 351 868 21 y56w x w x w xCd II 226 502 Fe II 226 599 21 q97 Pb I 261 418 Fe II 261 487 21 q69 Ca 351 837 21 y87
w x w x w xFe I 226 559 21 q57 Mg I 261 467 21 q49 Tl I 377 572 Fe I 377 646 21,23 q74w x w xTi 226 514 q12 Fe I 261 449 21 q31 Ti II 377 606 21,23 q34
w x w x w xFe II 226 459 21 y43 Fe II 261 418 21 0 Fe I 377 587 21 q15w x w x w xFe I 226 439 21 y63 Fe II 261 382 21,23 y36 Fe I 377 483 21 y89
w x w xTi 226 402 y100 Fe II 261 358 21 y60 Ti 377 465 21 y107w x w xCr II 205 552 Ti 205 652 q100 Fe 261 324 21 y94 Tl I 237 969 Fe II 238 076 21,23 q107w xFe 205 523 y29 Fe 261 319 21 y99 Ti 237 993 q24
w x w x w xTi II 205 453 21 y99 Pb I 283 306 Ca 283 414 21 q108 Fe II 237 927 21,23 y42

()
N.D
askalo¨a,I.B
oe¨skirSpectrochim
icaA
ctaP
artB:A
tomic
Spectroscopy54
19991099
]11221107
Ž .Table 2 Continued
Ž . Ž . Ž .Analysis lines Interfering matrix Dl Analysis lines Interfering matrix Dl Analysis lines Interfering matrix Dla a aŽ . Ž . Ž . Ž . Ž . Ž . Ž . Ž . Ž .pm lines pm pm pm lines pm pm pm lines pm pm
w x w xCr II 206 149 Ti 206 240 q91 Fe 283 340 21 q34 Fe II 237 898 21 y71w x w xTi 206 166 q17 Fe II 283 310 21 q4 U II 385 958 Ti 386 174 21 q216
w x w xTi 206 053 y96 Fe I 283 244 21,23 y62 Fe I 385 991 21,23 q33w x w xCr II 267 716 Ti 267 816 q100 Ti II 283 216 21,23 y90 Fe I 385 922 21,23 y36
w x w xFe 267 805 21 q89 Sb I 206 833 Ti 206 846 q13 Ti I 385 814 21,23 y144w x w xFe 267 688 21 y28 Fe 206 796 y37 Ti I 385 790 21 y168
w xTi 267 674 y42 Ti 206 742 y91 U II 367 007 Ti I 367 167 21,23 q160w x w x w xFe 267 611 21 y105 Sb I 217 581 Fe I 217 684 21 q103 Ar I 367 064 21 q57
w x w x w xCr II 283 563 Fe II 283 672 21 q109 Fe 217 652 21 q71 Fe 367 007 21 0w xb w x w xTi II 283 664 21 q101 Fe 217 640 21 q59 Fe I 366 952 21,23 y55
bw x w xTi I 283 661 21 q98 Ti 217 618 q37 Fe I 366 916 21 y91bw x w x w xFe II 283 651 21 q88 Fe 217 603 21 q22 Ti I 366 897 21,23 y110
w x w x w xTi I 283 641 21 q78 Fe I 217 548 21 y36 U II 263 553 Fe I 263 648 21 q95w x w x w xFe 283 632 21 q69 Fe II 217 486 21 y95 Fe I 263 581 21,23 q28
w x w x w xFe II 283 619 21 q56 Sb I 231 147 Al I 231 247 21 q100 Fe II 263 539 21 y14w xTi I 283 610 21 q47 Ti 231 226 q79 Ti 263 536 y17
a aw x w xFe I 283 595 21 q32 Al II 231 222 21 q75 U II 409 014 ] ]w x w xTi I 283 564 21 q1 Fe II 231 204 21 q57 Zn I 213 856 Ti 213 948 q92
w xOH 283 551 y12 Ti 231 168 q21 Ti II 213 925 21 q69w xFe I 283 546 21,23 y17 Ti 231 143 y4 Ti 213 831 y25w x w xTi I 283 476 21 y87 Fe 231 129 21 y18 Ti 213 777 y79
w x w x w xFe 283 476 21 y87 Fe II 231 122 21 y25 Zn II 202 548 Mg I 202 582 21 q34w xCu I 324 754 Ti II 324 860 21,23 q106 Al 231 102 y45 Ti 202 515 y33
w xCa 324 828 21 q74 Ti 231 043 y104 Zn II 206 200 Ti 206 299 q99Ti 206 175 y25
Ž y1 . Ž y1 . Ž y1 . Ž y1 . Ž y1 .Notes. T s7200 K, interferents: Al 2 mg ml , Ca 2 mg ml , Fe 2 mg ml , Mg 2 mg ml and Ti 2 mg ml .exc.a No interfering lines from matrix components are registered.bAt a 15.6-pm bandwidth these lines appear as a single unresolved structure.
( )N. Daskalo¨a, I . Boe¨ski r Spectrochimica Acta Part B: Atomic Spectroscopy 54 1999 1099]11221108
Table 3Values of S for the atomic and ionic prominent lines of elements with different ionization potentials for T s6200 K and 7200 KA exc.
2 1Analysis Ionization S rST s6200 K T s7200 K A Aexc. exc.w xlines potential 25 1 6 2 6S =10 S =10A AŽ .pm
Zn I 213 856 9.39 342 990 2.9Sb I 206 833 8.6 58 100 1.7Pb I 216 999 7.42 39 64 1.6Tl I 276 787 6.1 34 57 1.7Zn II 206 200 9.39 31 130 4.3Pb II 220 353 7.42 81 195 2.4Cr II 267 716 6.76 438 1313 3.0
w x12,14 was taken as a basis in the present investi-gation. A distinction was made between Q-values
w Ž .xfor line interference Q l and Q-values forI j aw Ž .xwing background interference Q Dl for aW j a
relevant set of analysis lines and interferents.w xBoumans et al. 12 have emphasized that
Q-values depend on the excitation conditions inthe ICP. This problem was discussed in our previ-ous papers: in the determination of rare earth
w xelements in Eu O 17 and in the determination2 3of dopants and impurities in single crystals of
w xpotassium titanylphosphate 19 as well. The Q-values were calculated for two values of the exci-
Ž . Ž1.tation temperature T : 6200 K and 7200exc.Ž2 .K . The change in T was affected by varyingexc.
Žthe carrier flow rate Table 1, Operating condi-.tions set 1 and set 2 . T was measured by theexc.
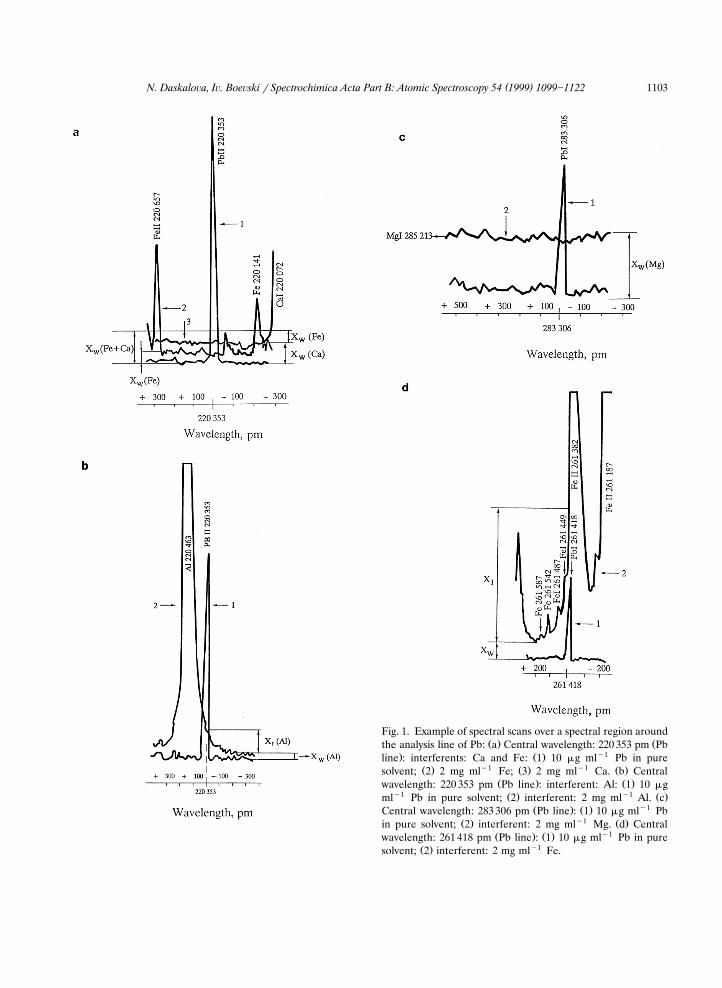
w xBoltzmann plot method with Ti lines 24 .Table 3 lists S values for the atomic and ionicA
prominent lines of elements with different ioniza-
tion potentials for T s6200 K and 7200 K.exc.Ž . Ž . Ž .Tables 4]11 show S l , S Dl , Q l andI j a W j a I j a
Ž . y1Q Dl in the presence of 2 mg ml AlW j aŽ . y1 y1Tables 4 and 5 , 2 mg ml Ca and 2 mg ml
Ž . y1Mg, separately Tables 6 and 7 , 2 mg ml FeŽ . y1 ŽTables 8 and 9 , and 2 mg ml Ti Tables 10
. Ž1. Ž2 .and 11 for T s6200 K and 7200 K . Ana-exc.lytes with different ionization potentials were se-
Ž .lected Table 3 . The ionization potentials of ma-Ž . Ž .trix elements are: Al 5.99 eV , Ca 6.11 eV , Mg
Ž . Ž . Ž .7.65 eV , Fe 7.86 eV and Ti 6.84 eV . Theanalysis lines presented in Tables 4]11 illustratethe different cases of variation of Q-values as afunction of T in the presence of above men-exc.tioned matrix element. The following conclusionsmay be drown:Ž . Ž . Ž .1 The S l and S Dl values decreaseI j a W j a
or increase with increasing T depending on theexc.Ž .ionization states of the interfering lines Table 3 .
Ž . Ž . Ž .2 The magnitude of Q l and Q DlI j a W j a
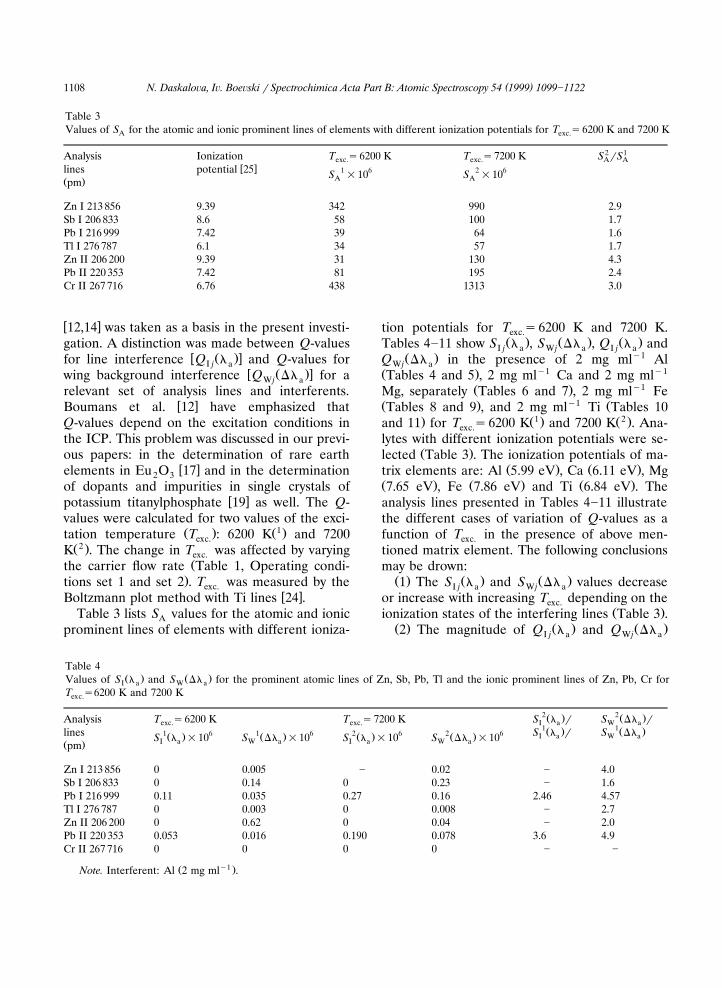
Table 4Ž . Ž .Values of S l and S Dl for the prominent atomic lines of Zn, Sb, Pb, Tl and the ionic prominent lines of Zn, Pb, Cr forI a W a
T s6200 K and 7200 Kexc.
2 2Ž . Ž .Analysis S l r S Dl rT s6200 K T s7200 K I a W aexc. exc.1 1Ž . Ž .lines S l r S Dl1 6 1 6 2 6 2 6 I a W aŽ . Ž . Ž . Ž .S l =10 S Dl =10 S l =10 S Dl =10I a W a I a W aŽ .pm
Zn I 213 856 0 0.005 ] 0.02 ] 4.0Sb I 206 833 0 0.14 0 0.23 ] 1.6Pb I 216 999 0.11 0.035 0.27 0.16 2.46 4.57Tl I 276 787 0 0.003 0 0.008 ] 2.7Zn II 206 200 0 0.62 0 0.04 ] 2.0Pb II 220 353 0.053 0.016 0.190 0.078 3.6 4.9Cr II 267 716 0 0 0 0 ] ]
Ž y1 .Note. Interferent: Al 2 mg ml .
( )N. Daskalo¨a, I . Boe¨ski r Spectrochimica Acta Part B: Atomic Spectroscopy 54 1999 1099]1122 1109
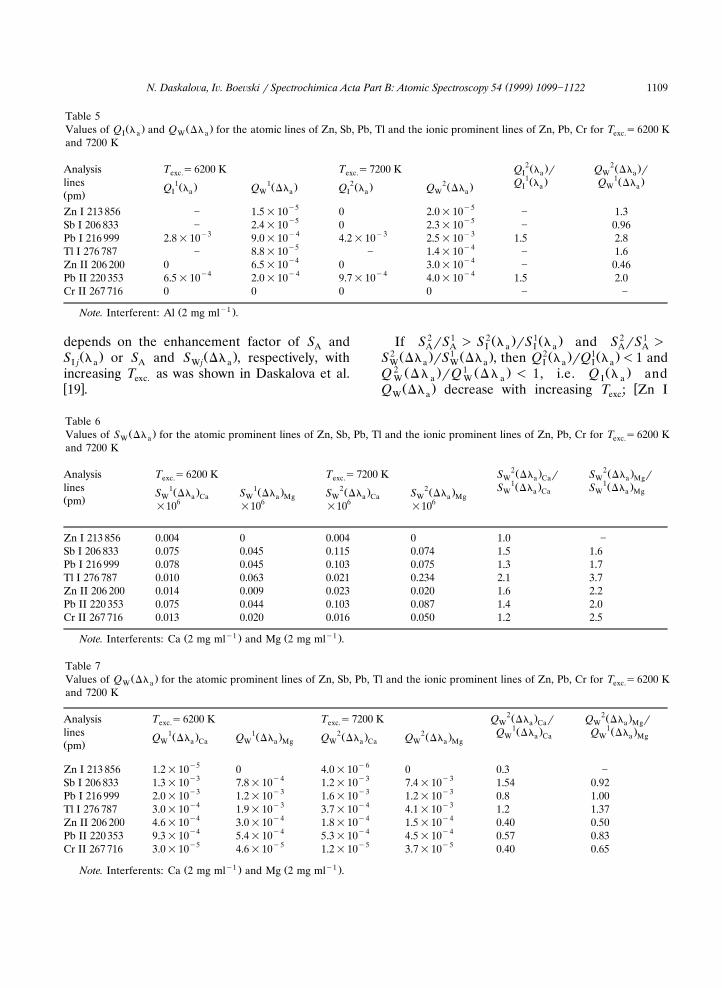
Table 5Ž . Ž .Values of Q l and Q Dl for the atomic lines of Zn, Sb, Pb, Tl and the ionic prominent lines of Zn, Pb, Cr for T s6200 KI a W a exc.
and 7200 K
2 2Ž . Ž .Analysis Q l r Q Dl rT s6200 K T s7200 K I a W aexc. exc.1 1Ž . Ž .lines Q l Q Dl1 1 2 2 I a W aŽ . Ž . Ž . Ž .Q l Q Dl Q l Q DlI a W a I a W aŽ .pm
y5 y5Zn I 213 856 ] 1.5=10 0 2.0=10 ] 1.3y5 y5Sb I 206 833 ] 2.4=10 0 2.3=10 ] 0.96
y3 y4 y3 y3Pb I 216 999 2.8=10 9.0=10 4.2=10 2.5=10 1.5 2.8y5 y4Tl I 276 787 ] 8.8=10 ] 1.4=10 ] 1.6y4 y4Zn II 206 200 0 6.5=10 0 3.0=10 ] 0.46
y4 y4 y4 y4Pb II 220 353 6.5=10 2.0=10 9.7=10 4.0=10 1.5 2.0Cr II 267 716 0 0 0 0 ] ]
Ž y1 .Note. Interferent: Al 2 mg ml .
depends on the enhancement factor of S andAŽ . Ž .S l or S and S Dl , respectively, withI j a A W j a
increasing T as was shown in Daskalova et al.exc.w x19 .
2 1 2 Ž . 1Ž . 2 1If S rS ) S l rS l and S rS )A A I a I a A A2 Ž . 1 Ž . 2Ž . 1Ž .S Dl rS Dl , then Q l rQ l -1 andW a W a I a I a2 Ž . 1 Ž . Ž .Q D l rQ D l - 1, i.e. Q l andW a W a I aŽ . wQ Dl decrease with increasing T ; Zn IW a exc.
Table 6Ž .Values of S Dl for the atomic prominent lines of Zn, Sb, Pb, Tl and the ionic prominent lines of Zn, Pb, Cr for T s6200 KW a exc.
and 7200 K
2 2Ž . Ž .Analysis S Dl r S Dl rT s6200 K T s7200 K W a Ca W a Mgexc. exc.1 1Ž . Ž .lines S Dl S Dl1 1 2 2 W a Ca W a MgŽ . Ž . Ž . Ž .S Dl S Dl S Dl S DlW a Ca W a Mg W a Ca W a MgŽ .pm 6 6 6 6=10 =10 =10 =10
Zn I 213 856 0.004 0 0.004 0 1.0 ]
Sb I 206 833 0.075 0.045 0.115 0.074 1.5 1.6Pb I 216 999 0.078 0.045 0.103 0.075 1.3 1.7Tl I 276 787 0.010 0.063 0.021 0.234 2.1 3.7Zn II 206 200 0.014 0.009 0.023 0.020 1.6 2.2Pb II 220 353 0.075 0.044 0.103 0.087 1.4 2.0Cr II 267 716 0.013 0.020 0.016 0.050 1.2 2.5
Ž y1 . Ž y1 .Note. Interferents: Ca 2 mg ml and Mg 2 mg ml .
Table 7Ž .Values of Q Dl for the atomic prominent lines of Zn, Sb, Pb, Tl and the ionic prominent lines of Zn, Pb, Cr for T s6200 KW a exc.
and 7200 K
2 2Ž . Ž .Analysis Q Dl r Q Dl rT s6200 K T s7200 K W a Ca W a Mgexc. exc.1 1Ž . Ž .lines Q Dl Q Dl1 1 2 2 W a Ca W a MgŽ . Ž . Ž . Ž .Q Dl Q Dl Q Dl Q DlW a Ca W a Mg W a Ca W a MgŽ .pm
y5 y6Zn I 213 856 1.2=10 0 4.0=10 0 0.3 ]y3 y4 y3 y3Sb I 206 833 1.3=10 7.8=10 1.2=10 7.4=10 1.54 0.92y3 y3 y3 y3Pb I 216 999 2.0=10 1.2=10 1.6=10 1.2=10 0.8 1.00y4 y3 y4 y3Tl I 276 787 3.0=10 1.9=10 3.7=10 4.1=10 1.2 1.37y4 y4 y4 y4Zn II 206 200 4.6=10 3.0=10 1.8=10 1.5=10 0.40 0.50y4 y4 y4 y4Pb II 220 353 9.3=10 5.4=10 5.3=10 4.5=10 0.57 0.83y5 y5 y5 y5Cr II 267 716 3.0=10 4.6=10 1.2=10 3.7=10 0.40 0.65
Ž y1 . Ž y1 .Note. Interferents: Ca 2 mg ml and Mg 2 mg ml .
( )N. Daskalo¨a, I . Boe¨ski r Spectrochimica Acta Part B: Atomic Spectroscopy 54 1999 1099]11221110
Table 8Ž . Ž .Values of S l and S Dl for the atomic prominent lines of Zn, Sb, Pb, Tl and the ionic prominent lines of Zn, Pb, Cr forI a W a
T s6200 K and 7200 Kexc.
2 2Ž . Ž .Analysis S l r S Dl rT s6200 K T s7200 K I a W aexc. exc.1 1Ž . Ž .lines S l S Dl1 6 1 6 2 6 2 6 I a W aŽ . Ž . Ž . Ž .S l =10 S Dl =10 S l =10 S Dl =10I a W a I a W aŽ .pm
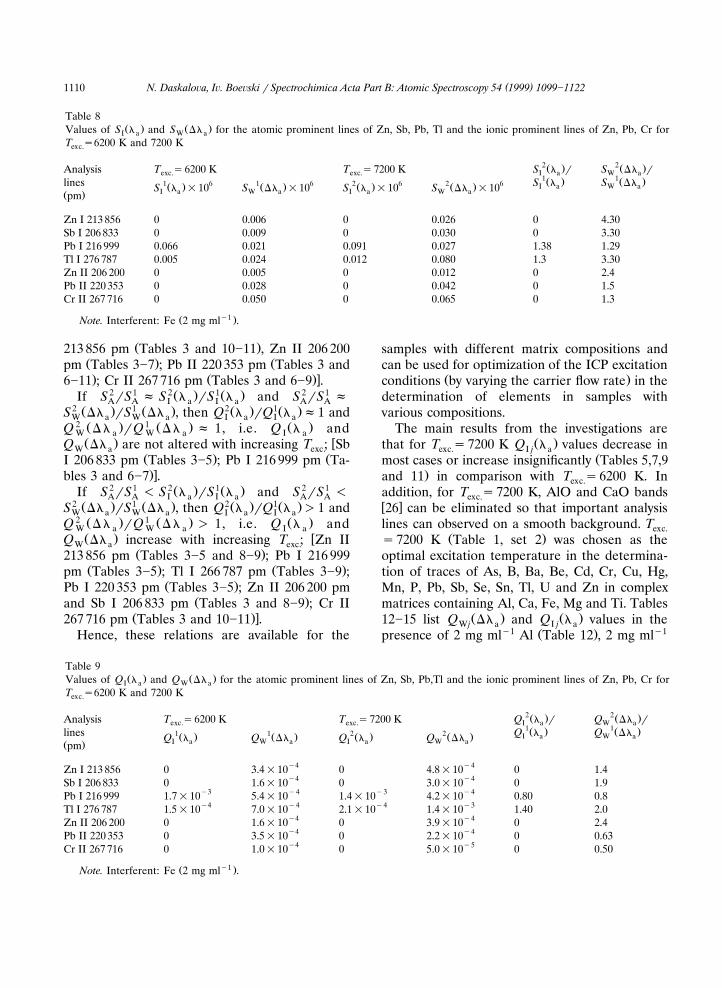
Zn I 213 856 0 0.006 0 0.026 0 4.30Sb I 206 833 0 0.009 0 0.030 0 3.30Pb I 216 999 0.066 0.021 0.091 0.027 1.38 1.29Tl I 276 787 0.005 0.024 0.012 0.080 1.3 3.30Zn II 206 200 0 0.005 0 0.012 0 2.4Pb II 220 353 0 0.028 0 0.042 0 1.5Cr II 267 716 0 0.050 0 0.065 0 1.3
Ž y1 .Note. Interferent: Fe 2 mg ml .
Ž .213 856 pm Tables 3 and 10]11 , Zn II 206 200Ž . Žpm Tables 3]7 ; Pb II 220 353 pm Tables 3 and. Ž .x6]11 ; Cr II 267 716 pm Tables 3 and 6]9 .
2 1 2 Ž . 1Ž . 2 1If S rS f S l rS l and S rS fA A I a I a A A2 Ž . 1 Ž . 2Ž . 1Ž .S Dl rS Dl , then Q l rQ l f1 andW a W a I a I a2 Ž . 1 Ž . Ž .Q D l rQ D l f 1, i.e. Q l andW a W a I aŽ . wQ Dl are not altered with increasing T ; SbW a exc.
Ž . ŽI 206 833 pm Tables 3]5 ; Pb I 216 999 pm Ta-.xbles 3 and 6]7 .
2 1 2 Ž . 1Ž . 2 1If S rS - S l rS l and S rS -A A I a I a A A2 Ž . 1 Ž . 2Ž . 1Ž .S Dl rS Dl , then Q l rQ l )1 andW a W a I a I a2 Ž . 1 Ž . Ž .Q D l rQ D l ) 1, i.e. Q l andW a W a I aŽ . wQ Dl increase with increasing T ; Zn IIW a exc.
Ž .213 856 pm Tables 3]5 and 8]9 ; Pb I 216 999Ž . Ž .pm Tables 3]5 ; Tl I 266 787 pm Tables 3]9 ;
Ž .Pb I 220 353 pm Tables 3]5 ; Zn II 206 200 pmŽ .and Sb I 206 833 pm Tables 3 and 8]9 ; Cr II
Ž .x267 716 pm Tables 3 and 10]11 .Hence, these relations are available for the
samples with different matrix compositions andcan be used for optimization of the ICP excitation
Ž .conditions by varying the carrier flow rate in thedetermination of elements in samples withvarious compositions.
The main results from the investigations areŽ .that for T s7200 K Q l values decrease inexc. I j a
Žmost cases or increase insignificantly Tables 5,7,9.and 11 in comparison with T s6200 K. Inexc.
addition, for T s7200 K, AlO and CaO bandsexc.w x26 can be eliminated so that important analysislines can observed on a smooth background. Texc.
Ž .s7200 K Table 1, set 2 was chosen as theoptimal excitation temperature in the determina-tion of traces of As, B, Ba, Be, Cd, Cr, Cu, Hg,Mn, P, Pb, Sb, Se, Sn, Tl, U and Zn in complexmatrices containing Al, Ca, Fe, Mg and Ti. Tables
Ž . Ž .12]15 list Q Dl and Q l values in theW j a I j ay1 Ž . y1presence of 2 mg ml Al Table 12 , 2 mg ml
Table 9Ž . Ž .Values of Q l and Q Dl for the atomic prominent lines of Zn, Sb, Pb,Tl and the ionic prominent lines of Zn, Pb, Cr forI a W a
T s6200 K and 7200 Kexc.
2 2Ž . Ž .Analysis Q l r Q Dl rT s6200 K T s7200 K I a W aexc. exc.1 1Ž . Ž .lines Q l Q Dl1 1 2 2 I a W aŽ . Ž . Ž . Ž .Q l Q Dl Q l Q DlI a W a I a W aŽ .pm
y4 y4Zn I 213 856 0 3.4=10 0 4.8=10 0 1.4y4 y4Sb I 206 833 0 1.6=10 0 3.0=10 0 1.9
y3 y4 y3 y4Pb I 216 999 1.7=10 5.4=10 1.4=10 4.2=10 0.80 0.8y4 y4 y4 y3Tl I 276 787 1.5=10 7.0=10 2.1=10 1.4=10 1.40 2.0
y4 y4Zn II 206 200 0 1.6=10 0 3.9=10 0 2.4y4 y4Pb II 220 353 0 3.5=10 0 2.2=10 0 0.63y4 y5Cr II 267 716 0 1.0=10 0 5.0=10 0 0.50
Ž y1 .Note. Interferent: Fe 2 mg ml .

( )N. Daskalo¨a, I . Boe¨ski r Spectrochimica Acta Part B: Atomic Spectroscopy 54 1999 1099]1122 1111
Table 10Ž . Ž .Values of Q l and Q Dl for the atomic prominent lines of Zn, Sb, Pb, Tl and the ionic prominent lines of Zn, Pb, Cr forI a W a
T s6200 K and 7200 Kexc.
2 2Ž . Ž .Analysis Q l r Q Dl rT s6200 K T s7200 K I a W aexc. exc.1 1Ž . Ž .lines Q l Q Dl1 1 2 2 I a W aŽ . Ž . Ž . Ž .Q l Q Dl Q l Q DlI a W a I a W aŽ .pm
y5 y5 y5 y5Zn I 213 856 4.1=10 4.7=10 3.0=10 2.8=10 0.73 0.60y4 y3 y4 y3Sb I 206 833 7.4=10 1.9=10 5.4=10 1.2=10 0.73 0.63y3 y3 y4 y3Pb I 216 999 1.0=10 2.7=10 8.4=10 1.9=10 0.84 0.70y4 y3 y4 y4Tl I 276 787 3.8=10 1.0=10 4.0=10 6.7=10 1.05 0.67
Zn II 206 200 0 0 0 0 ] ]y4 y4 y4 y4Pb II 220 353 3.2=10 8.3=10 1.9=10 4.9=10 0.6 0.6y5 y5 y4 y4Cr II 267 716 3.2=10 8.2=10 1.1=10 1.6=10 3.43 1.95
Ž y1 .Note. Interferent: Ti 2 mg ml .
y1 Ž . y1Ca and 2 mg ml Mg Table 13 , 2 mg ml FeŽ . y1 Ž .Table 14 and 2 mg ml Ti Table 15 as inter-ferents, respectively for T s7200 K.exc.
Ž .In conclusion it should be noted that the Q lI avalues were measured by using Al, Ca, Fe, Mgand Ti as matrices with a purity of 99.9999%. Thepossible presence of impurities causes an uncer-tainty when the matrix concentration is of the
Žabove mentioned magnitude interferent concen-y1 .trations: 2 mg ml .
3.3. Line selection
Ž .Q Dl values do not enter the selectivityW j aterm in Eq. 1 and affect the true detection limit
Ž .only via the conventional detection limit Eq. 2 .Ž .This implies that influence of Q Dl values isW j a
minor or negligible as long as C is dictatedL,true
by line interference, i.e. by the magnitude ofŽ .Q l values in the presence of a complexI j a
matrix.Hence, the optimum line selection for trace
analysis of a variety of multicomponent environ-mental materials without information regarding
Žthe concentration of the matrix constituents Al,.Ca, Fe, Mg, and Ti requires the choice of the
prominent lines free or negligibly influenced byline interference. The ‘best’ analysis lines in thepresence of complex matrix are printed in boldŽ .Tables 12]15 .
The investigations show the following:
1. In the case of a multicomponent environ-mental matrix, it is possible to choose analysis
Ž .lines free of line interferences S Q s0I jŽwith the exceptions of Cr II 267 716 pm QITi
Table 11Ž . Ž .Values of S l and S Dl for the atomic prominent lines of Zn, Sb, Pb, Tl and the ionic prominent lines of Zn, Pb, Cr forI a W a
T s6200 K and 7200 Kexc.
2 2Ž . Ž .Analysis S l r S Dl rT s6200 K T s7200 K I a W aexc. exc.1 1Ž . Ž .lines S l S Dl1 6 1 6 2 6 2 6 I a W aŽ . Ž . Ž . Ž .S l =10 S Dl =10 S l =10 S Dl =10I a W a I a W aŽ .pm
Zn I 213 856 0.014 0.016 0.032 0.028 2.20 1.75Sb I 206 833 0.043 0.107 0.054 0.120 1.26 1.12Pb I 216 999 0.043 0.107 0.054 0.119 1.26 1.10Tl I 276 787 0.013 0.035 0.023 0.038 1.77 1.10Zn II 206 200 0 0 0 0 ] ]
Pb II 220 353 0.026 0.067 0.037 0.095 1.42 1.42Cr II 267 716 0.014 0.036 0.14 0.21 10.0 5.8
Ž y1 .Note. Interferent: Ti 2 mg ml .

( )N. Daskalo¨a, I . Boe¨ski r Spectrochimica Acta Part B: Atomic Spectroscopy 54 1999 1099]11221112
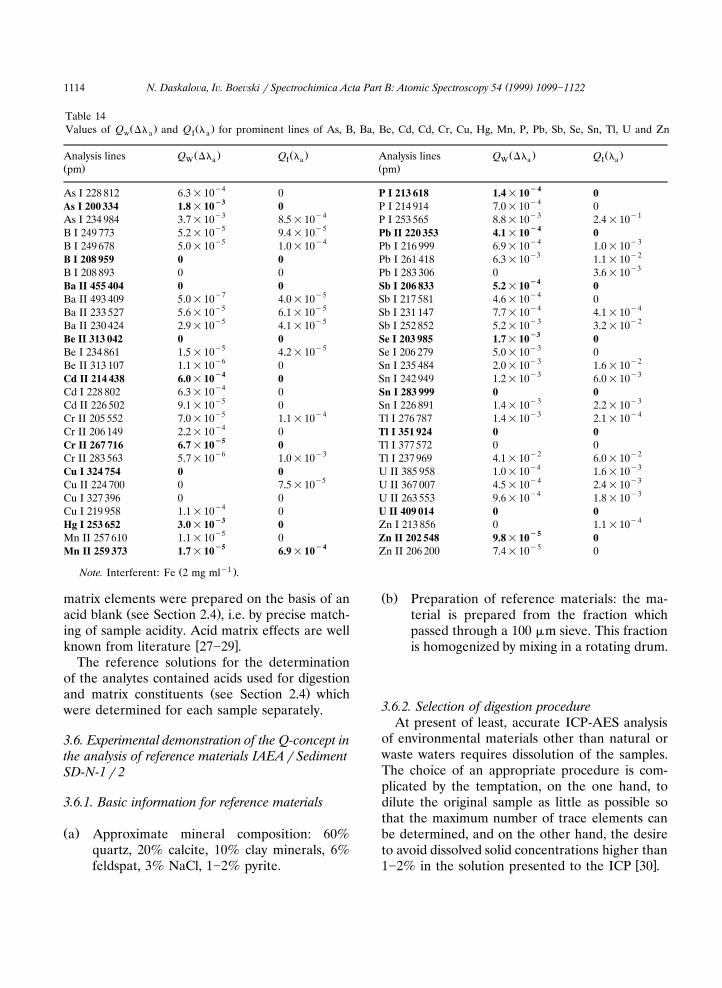
Table 12Ž . Ž .Values of Q Dl and Q l for prominent lines of As, B, Ba, Be, Cd, Cr, Cu, Hg, Mn, P, Pb, Sb, Se, Sn, Tl, U and ZnW a I a
Ž . Ž . Ž . Ž . Ž . Ž .Analysis lines pm Q Dl Q l Analysis lines pm Q Dl Q lW a I a W a I a
y5 I3As I 228 812 6.6=10 0 P I 213 618 1.2=10 0I3 y3 y3As I 200 334 5.0=10 0 P I 214 914 1.9=10 2.6=10y4 y4As I 234 984 2.2=10 0 P I 253 565 1.1=10 0
I4 I4B I 249 773 0 0 Pb II 220 353 9.7=10 4.0=10y3 y3B I 249 678 0 0 Pb I 216 999 2.8=10 4.0=10
I4 y5B I 208 959 1.9=10 0 Pb I 261 418 9.1=10 0y4B I 208 893 3.8=10 0 Pb I 283 306 0 0
I3Ba II 455 404 0 0 Sb I 206 833 2.3=10 0y6 y4 y3Ba II 493 409 2.0=10 0 Sb I 217 581 8.5=10 2.2=10y6Ba II 233 527 2.6=10 0 Sb I 231 147 0 0
y4Ba II 230 424 0 0 Sb I 252 852 2.4=10 0I3Be II 313 042 0 0 Se I 203 985 5.3=10 0y2Be I 234 861 0 0 Se I 206 279 2.5=10 0
Be II 313 107 0 0 Sn I 235 484 0 0Cd II 214 438 0 0 Sn I 242 949 0 0
y5Cd I 228 802 6.6=10 0 Sn I 283 999 0 0y6 y5 y3 y1Cd II 226 502 6.0=10 5.7=10 Sn I 226 891 6.4=10 3.1=10y4 y5Cr II 205 552 3.4=10 0 Tl I 276 787 5.0=10 0
Cr II 206 149 0 0 Tl I 351 924 0 0Cr II 267 716 0 0 Tl I 377 572 0 0
y3Cr II 283 563 0 0 Tl I 237 969 7.1=10 0Cu I 324 754 0 0 U II 385 958 0 0
y5 y4Cu II 224 700 2.3=10 0 U II 367 007 1.5=10 0y4Cu I 327 396 0 0 U II 263 553 2.1=10 0
y5 I4Cu I 219 958 9.0=10 0 U II 409 014 6.5=10 0I5 y5Hg I 253 652 8.6=10 0 Zn I 213 856 4.1=10 0y6 I4Mn II 257 610 4.7=10 0 Zn II 202 548 1.4=10 0
y4Mn II 259 373 0 0 Zn II 206 200 3.0=10 0
Ž y1 .Note. Interferent: Al 2 mg ml .
y5 . Žs2.7=10 , Hg I 253 652 pm Q s1.2=ITiy4 . Ž y510 , Pb II 220 353 pm Q s5.5=10 ,ITi
y4 . ŽQ s4.0=10 , Sb I 206 833 pm Q sIAl ITiy4 . Ž6.3=10 , Sn I 283 999 pm Q s4.2=ITi
y4 . Ž y3 .10 and Tl I 351 924 pm Q s2.7=10 .ITiThe line interference level for the abovementioned the ‘best’ analysis lines is mainlydetermined by Ti. In line selection was takeninto consideration that these materials con-tain high concentrations of Al, Ca, Fe andMg, and to a lesser extent, Ti.
2. The ‘best’ analysis lines are influenced byw Ž .xwing background interferences Q Dl /W j a
0.3. Owing to the overlap of the prominent lines
w xAs I 228 812 pm with Cd II 228 802 pm 23� Ž . Ž . 4S Cd rS As s4.5 and Sb I 252 852 pmA A
w x � Ž . Ž . 4with Si I 252 851 pm 23 S Si rS Sb s6 ,A Athe above mentioned prominent lines of As,
Cd and Sb should not be used in traceanalysis.
The interferent concentration C for whichI jŽ .Q l s0 was determined by using the equationI j aŽ . w x Ž .Q l =C s C 14,15,19 Table 16 . Table 17I a I L
lists the wavelengths of all investigated prominentlines in this work, the background equivalent con-
Ž y1 .centration BEC, mg ml and the detectionŽ y1 .limits in the pure solvent C , ng ml .L
3.4. Interelement interferences for matrix compounds
The interelement interferences for Al, Ca, Mg,Fe and Ti were investigated. Table 18 shows
Ž . Ž .Q Dl and Q l values for two selectedW j a I j aanalysis lines of each element which were freefrom line interferences.
The reliability of major component determina-

( )N. Daskalo¨a, I . Boe¨ski r Spectrochimica Acta Part B: Atomic Spectroscopy 54 1999 1099]1122 1113
Table 13Ž .Value of Q Dl for prominent lines of As, B, Ba, Be, Cd, Cr, Cu, Hg, Mn, P, Pb, Sb, Se, Sn, Tl, U and ZnW a
Analysis lines Analysis linesInterferents InterferentsŽ . Ž .pm pmy1 y1 y1 y1Ž . Ž . Ž . Ž .Ca 2 mg ml Mg 2 mg ml Ca 2 mg ml Mg 2 mg ml
y4 y4 I4 I4As I 228 812 7.0=10 4.8=10 P I 213 618 8.8=10 8.8=10I2 I3 y3 y3As I 200 334 1.0=10 6.4=10 P I 214 914 1.4=10 1.4=10y4 y4 y4 y3As I 234 984 6.1=10 5.5=10 P I 253 565 9.8=10 2.7=10
y5 I4 I4B I 249 773 0 3.5=10 Pb II 220 353 5.3=10 4.5=105 y3 y3B I 249 678 0 5.0=10 Pb I 216 999 2.1=10 1.7=10
y4 y4B I 208 959 0 0 Pb I 261 418 4.1=10 3.2=10y4 y3B I 208 893 0 0 Pb I 283 306 3.5=10 3.8=10
I6 I5 I3 I4Ba II 455 404 9.0=10 4.5=10 Sb I 206 833 1.2=10 7.4=10y6 y7 y4 y4Ba II 493 409 7.4=10 4.0=10 Sb I 217 581 8.1=10 6.7=10y5 y5 y4 y4Ba II 233 527 5.2=10 1.7=10 Sb I 231 147 6.3=10 4.9=10y5 y5 y4 y4Ba II 230 424 7.2=10 2.3=10 Sb I 252 852 7.2=10 1.9=10
I3 I3Be II 313 042 0 0 Se I 203 985 6.8=10 4.0=10y2 y2Be I 234 861 0 0 Se I 206 279 3.1=10 1.8=10
Be II 313 107 0 0 Sn I 235 484 9.4=10y4 7.8=10y4
I4 y4 y4Cd II 214 438 1.3=10 0 Sn I 242 949 7.0=10 7.0=10y4 y4 I5 I3Cd I 228 802 7.0=10 4.8=10 Sn I 283 999 8.3=10 1.9=10y4 y4 y3 y3Cd II 226 502 4.0=10 4.7=10 Sn I 226 891 2.9=10 2.1=10y4 y4 y4 y3Cr II 205 552 3.6=10 2.5=10 Tl I 276 787 3.0=10 4.1=10y4 y4Cr II 206 149 4.2=10 3.2=10 Tl I 351 924 0 0I5 I5 y4 y5Cr II 267 716 1.2=10 3.7=10 Tl I 377 572 8.2=10 5.0=10y6 y4 y3 y3Cr II 283 563 2.8=10 1.3=10 Tl I 237 969 8.7=10 7.8=10
y4 y4Cu I 324 754 0 0 U II 385 958 2.0=10 3.4=10y5 y5 y4Cu II 224 700 9.0=10 5.5=10 U II 367 007 2.9=10 0
y4Cu I 327 396 0 0 U II 263 553 0 3.6=10y4 y4 I4 I4Cu I 219 958 4.3=10 2.4=10 U II 409 014 6.5=10 2.7=10I4 I4 y5Hg I 253 652 2.0=10 2.0=10 Zn I 213 856 2.7=10 0y6 y6 I4 I4Mn II 257 610 5.5=10 9.5=10 Zn II 202 548 2.2=10 3.1=10I6 I6 y4 y4Mn II 259 373 4.7=10 8.8=10 Zn II 206 200 1.8=10 1.5=10
Ž y1 . Ž y1 .Note. Interferents: Ca 2 mg ml and Mg 2 mg ml .
tion is mainly related to the accuracy and preci-sion of the ICP-AES. For improving accuracy andprecision it was used at more than two analysislines, which characterized with different sensitivi-
w xties in ICP 23 in order to estimate the differ-ences of acidity and solid sample concentrationbetween the samples and calibration solutions. Inthis case analytical results cannot depend on theselected analysis lines.
3.5. The effect of matrix concentration on the(analyte’s net line intensities multiplicati e
)interferences
Multiplicative interferences are related to sen-sitivity changes in the analyte signals so that thesingle-to-background ratio is modified, i.e. the
slope of calibration graph is affected and theaccuracy may be reduced. The sensitivity changedepends on the type and concentration of thematrix concentration in solutions and the multi-plicative interferences in the presence of 2500 mg
y1 Žml as complex matrix concentration Alq. y1CaqFeqMgqTi , 5000 mg ml and 10 000 mg
mly1. The net analyte signals do not change inthe presence of 2500 mg mly1 of matrix. Theconcentration between major elements were
Žwithin due limits for real samples sediments and.soils . In the determination of major elements
Ž .Al, Ca, Fe, Mg and Ti the basic sample solutionsŽ .were diluted dilution factors4 in order to
eliminate the multiplicative interferences due tothe matrix concentration.
The reference solutions in the determination of
( )N. Daskalo¨a, I . Boe¨ski r Spectrochimica Acta Part B: Atomic Spectroscopy 54 1999 1099]11221114
Table 14Ž . Ž .Values of Q Dl and Q l for prominent lines of As, B, Ba, Be, Cd, Cd, Cr, Cu, Hg, Mn, P, Pb, Sb, Se, Sn, Tl, U and Znw a I a
Ž . Ž . Ž . Ž .Analysis lines Q Dl Q l Analysis lines Q Dl Q lW a I a W a I aŽ . Ž .pm pm
y4 I4As I 228 812 6.3=10 0 P I 213 618 1.4=10 0I3 y4As I 200 334 1.8=10 0 P I 214 914 7.0=10 0y3 y4 y3 y1As I 234 984 3.7=10 8.5=10 P I 253 565 8.8=10 2.4=10y5 y5 I4B I 249 773 5.2=10 9.4=10 Pb II 220 353 4.1=10 0y5 y4 y4 y3B I 249 678 5.0=10 1.0=10 Pb I 216 999 6.9=10 1.0=10
y3 y2B I 208 959 0 0 Pb I 261 418 6.3=10 1.1=10y3B I 208 893 0 0 Pb I 283 306 0 3.6=10
I4Ba II 455 404 0 0 Sb I 206 833 5.2=10 0y7 y5 y4Ba II 493 409 5.0=10 4.0=10 Sb I 217 581 4.6=10 0y5 y5 y4 y4Ba II 233 527 5.6=10 6.1=10 Sb I 231 147 7.7=10 4.1=10y5 y5 y3 y2Ba II 230 424 2.9=10 4.1=10 Sb I 252 852 5.2=10 3.2=10
I3Be II 313 042 0 0 Se I 203 985 1.7=10 0y5 y5 y3Be I 234 861 1.5=10 4.2=10 Se I 206 279 5.0=10 0y6 y3 y2Be II 313 107 1.1=10 0 Sn I 235 484 2.0=10 1.6=10I4 y3 y3Cd II 214 438 6.0=10 0 Sn I 242 949 1.2=10 6.0=10
Cd I 228 802 6.3=10y4 0 Sn I 283 999 0 0y5 y3 y3Cd II 226 502 9.1=10 0 Sn I 226 891 1.4=10 2.2=10y5 y4 y3 y4Cr II 205 552 7.0=10 1.1=10 Tl I 276 787 1.4=10 2.1=10y4Cr II 206 149 2.2=10 0 Tl I 351 924 0 0I5Cr II 267 716 6.7=10 0 Tl I 377 572 0 0y6 y3 y2 y2Cr II 283 563 5.7=10 1.0=10 Tl I 237 969 4.1=10 6.0=10
y4 y3Cu I 324 754 0 0 U II 385 958 1.0=10 1.6=10y5 y4 y3Cu II 224 700 0 7.5=10 U II 367 007 4.5=10 2.4=10
y4 y3Cu I 327 396 0 0 U II 263 553 9.6=10 1.8=10y4Cu I 219 958 1.1=10 0 U II 409 014 0 0I3 y4Hg I 253 652 3.0=10 0 Zn I 213 856 0 1.1=10y5 I5Mn II 257 610 1.1=10 0 Zn II 202 548 9.8=10 0I5 I4 y5Mn II 259 373 1.7=10 6.9=10 Zn II 206 200 7.4=10 0
Ž y1 .Note. Interferent: Fe 2 mg ml .
matrix elements were prepared on the basis of anŽ .acid blank see Section 2.4 , i.e. by precise match-
ing of sample acidity. Acid matrix effects are wellw xknown from literature 27]29 .
The reference solutions for the determinationof the analytes contained acids used for digestion
Ž .and matrix constituents see Section 2.4 whichwere determined for each sample separately.
3.6. Experimental demonstration of the Q-concept inthe analysis of reference materials IAEArSedimentSD-N-1r2
3.6.1. Basic information for reference materials
Ž .a Approximate mineral composition: 60%quartz, 20% calcite, 10% clay minerals, 6%feldspat, 3% NaCl, 1]2% pyrite.
Ž .b Preparation of reference materials: the ma-terial is prepared from the fraction whichpassed through a 100 mm sieve. This fractionis homogenized by mixing in a rotating drum.
3.6.2. Selection of digestion procedureAt present of least, accurate ICP-AES analysis
of environmental materials other than natural orwaste waters requires dissolution of the samples.The choice of an appropriate procedure is com-plicated by the temptation, on the one hand, todilute the original sample as little as possible sothat the maximum number of trace elements canbe determined, and on the other hand, the desireto avoid dissolved solid concentrations higher than
w x1]2% in the solution presented to the ICP 30 .

( )N. Daskalo¨a, I . Boe¨ski r Spectrochimica Acta Part B: Atomic Spectroscopy 54 1999 1099]1122 1115
Table 15Ž . Ž .Values of Q Dl and Q l for prominent lines of As, B, Ba, Be, Cd, Cr, Cu, Hg, Mn, P, Pb, Sb, Se, Sn, Tl, U and ZnW a I a
Ž . Ž . Ž . Ž .Analysis lines Q Dl Q l Analysis lines Q Dl Q lW a I a W a I aŽ . Ž .pm pm
y4 I4As I 228 812 4.7=10 0 P I 213 618 5.1=10 0I3 y3As I 200 334 5.3=10 0 P I 214 914 1.2=10 0y4 y2 y3 y2As I 234 984 6.3=10 1.3=10 P I 253 565 4.6=10 1.7=10y5 I4 I5B I 249 773 8.5=10 0 Pb II 220 353 5.2=10 5.5=10y5 y3B I 249 678 1.3=10 0 Pb I 216 999 1.3=10 0
y4 y4B I 208 959 0 0 Pb I 261 418 2.8=10 1.4=10y4 y4 y4B I 208 893 2.9=10 0 Pb I 283 306 3.3=10 5.3=10I6 I3 I4Ba II 455 404 2.6=10 0 Sb I 206 833 1.2=10 6.3=10y6 y4Ba II 493 409 3.3=10 0 Sb I 217 581 8.3=10 0y5 y4Ba II 233 527 4.4=10 0 Sb I 231 147 3.3=10 0y5 y4 y3Ba II 230 424 5.0=10 0 Sb I 252 852 7.1=10 6.5=10I5 I3Be II 313 042 1.5=10 0 Se I 203 985 3.2=10 0y6 y7 y2 y2Be I 234 861 2.6=10 6.0=10 Se I 206 279 1.7=10 2.5=10y5 y4 y4Be II 313 107 5.5=10 0 Sn I 235 484 7.1=10 2.5=10I4 y4 y4Cd II 214 438 8.5=10 0 Sn I 242 949 4.3=10 1.6=10
Cd I 228 802 4.7=10y4 0 Sn I 283 999 1.5=10I4 4.2=10I4
y4 y3 y3Cd II 226 502 7.0=10 0 Sn I 226 891 1.7=10 7.3=10y4 y4 y5Cr II 205 552 2.0=10 0 Tl I 276 787 1.5=10 9.5=10y4 y4 I4 I3Cr II 206 149 1.9=10 1.8=10 Tl I 351 924 2.1=10 2.7=10I5 I5 y4 y4Cr II 267 716 1.2=10 2.7=10 Tl I 377 572 5.3=10 3.3=10
y5 y3 y3Cr II 283 563 0 2.7=10 Tl I 237 969 2.0=10 4.0=10I5 I5 y4Cu I 324 754 4.1=10 4.3=10 U II 385 958 7.9=10 0y5 y4 y4Cu II 224 700 4.1=10 1.6=10 U II 367 007 2.4=10 0y5 y4 y4 y2Cu I 327 396 4.2=10 1.0=10 U II 263 553 5.4=10 1.8=10y4 y5Cu I 219 958 2.7=10 9.6=10 U II 409 014 0 0I4 I4 y5 y5Hg I 253 652 1.9=10 1.2=10 Zn I 213 856 1.7=10 3.10=10y6 I4Mn II 257 610 4.7=10 0 Zn II 202 548 1.2=10 0I6 I5 y4Mn II 259 373 3.5=10 3.7=10 Zn II 206 200 1.1=10 0
Ž y1 .Note. Interferent: Ti 2 mg ml .
The dissolution of environmental materials canbe accomplished by a variety of techniques thatfall into two major categories: acid digestion and
w xfusion 31 . The acid digestion procedures havedefinite advantages over the fusion methodsbecause the fluxes cannot be readily obtained aspure as the acids, and also because excess acidscan often be easily removed from the samples by
w xevaporation 2 .The conventional wet digestion procedures
involve heating the sample with several mixturesof acids and oxidizing agents such as HNO r3
w xH O 32 , HNO rH SO or HNO r2 2 3 2 4 3w xHClO 33 , HNO rHF or HNO rHCl or just4 3 3
w xHNO 34 .3Aqua regia is not totally dissolved in samples as
sediments, soils and similar materials. The effi-
ciency of extraction for particular elements differfrom element to element. Such efficiency mightalso differ from the same element in different
w xmatrices 37 . Hence, the solubility of differentelements cannot be predicted in general terms.Only detailed experimental data can reveal thesituation for each element and sample type sepa-rately.
Extraction of trace elements soluble in aquaw Ž .xregia ISO 11466:1995 E was used as a decom-
Ž .position method see Section 2.3 by the reason offollowing:
v A digestion using aqua regia usually providesenough information about the hazardous waste
w xcontribution such as a heavy metals 35,36 .v In general wet digestions excluding hydroflu-
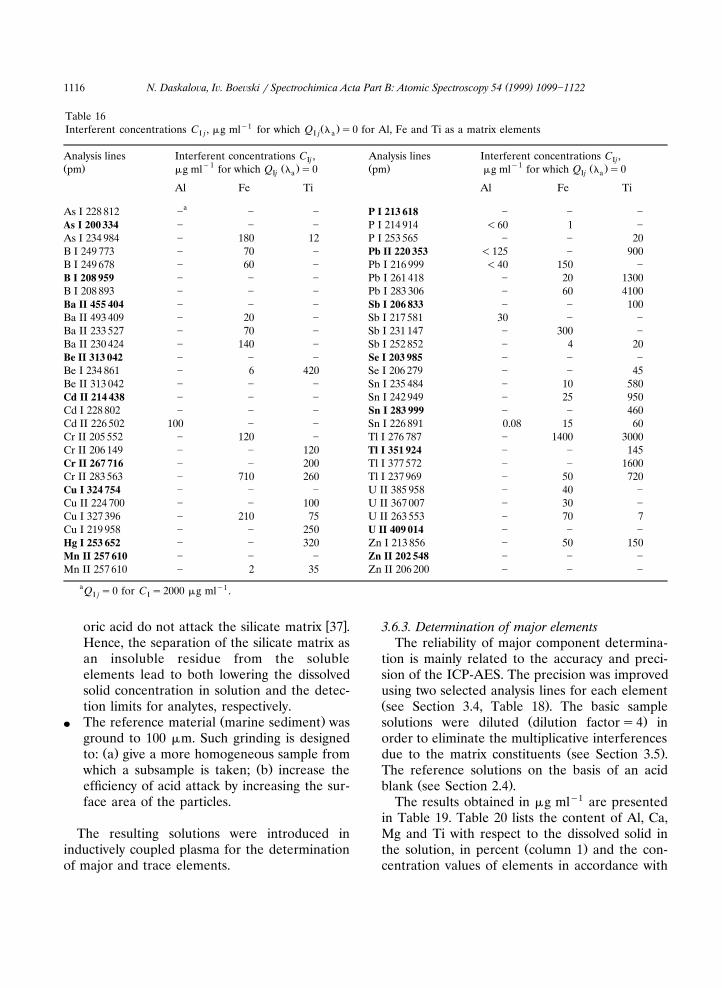
( )N. Daskalo¨a, I . Boe¨ski r Spectrochimica Acta Part B: Atomic Spectroscopy 54 1999 1099]11221116
Table 16y1 Ž .Interferent concentrations C , mg ml for which Q l s0 for Al, Fe and Ti as a matrix elementsI j I j a
Analysis lines Interferent concentrations C , Analysis lines Interferent concentrations C ,Ij Ijy1 y1Ž . Ž . Ž . Ž .pm mg ml for which Q l s0 pm mg ml for which Q l s0Ij a Ij a
Al Fe Ti Al Fe Ti
aAs I 228 812 ] ] ] P I 213 618 ] ] ]
As I 200 334 ] ] ] P I 214 914 -60 1 ]
As I 234 984 ] 180 12 P I 253 565 ] ] 20B I 249 773 ] 70 ] Pb II 220 353 -125 ] 900B I 249 678 ] 60 ] Pb I 216 999 -40 150 ]
B I 208 959 ] ] ] Pb I 261 418 ] 20 1300B I 208 893 ] ] ] Pb I 283 306 ] 60 4100Ba II 455 404 ] ] ] Sb I 206 833 ] ] 100Ba II 493 409 ] 20 ] Sb I 217 581 30 ] ]
Ba II 233 527 ] 70 ] Sb I 231 147 ] 300 ]
Ba II 230 424 ] 140 ] Sb I 252 852 ] 4 20Be II 313 042 ] ] ] Se I 203 985 ] ] ]
Be I 234 861 ] 6 420 Se I 206 279 ] ] 45Be II 313 042 ] ] ] Sn I 235 484 ] 10 580Cd II 214 438 ] ] ] Sn I 242 949 ] 25 950Cd I 228 802 ] ] ] Sn I 283 999 ] ] 460Cd II 226 502 100 ] ] Sn I 226 891 0.08 15 60Cr II 205 552 ] 120 ] Tl I 276 787 ] 1400 3000Cr II 206 149 ] ] 120 Tl I 351 924 ] ] 145Cr II 267 716 ] ] 200 Tl I 377 572 ] ] 1600Cr II 283 563 ] 710 260 Tl I 237 969 ] 50 720Cu I 324 754 ] ] ] U II 385 958 ] 40 ]
Cu II 224 700 ] ] 100 U II 367 007 ] 30 ]
Cu I 327 396 ] 210 75 U II 263 553 ] 70 7Cu I 219 958 ] ] 250 U II 409 014 ] ] ]
Hg I 253 652 ] ] 320 Zn I 213 856 ] 50 150Mn II 257 610 ] ] ] Zn II 202 548 ] ] ]
Mn II 257 610 ] 2 35 Zn II 206 200 ] ] ]
a Q s0 for C s2000 mg mly1.I j I
w xoric acid do not attack the silicate matrix 37 .Hence, the separation of the silicate matrix asan insoluble residue from the solubleelements lead to both lowering the dissolvedsolid concentration in solution and the detec-tion limits for analytes, respectively.
Ž .v The reference material marine sediment wasground to 100 mm. Such grinding is designed
Ž .to: a give a more homogeneous sample fromŽ .which a subsample is taken; b increase the
efficiency of acid attack by increasing the sur-face area of the particles.
The resulting solutions were introduced ininductively coupled plasma for the determinationof major and trace elements.
3.6.3. Determination of major elementsThe reliability of major component determina-
tion is mainly related to the accuracy and preci-sion of the ICP-AES. The precision was improvedusing two selected analysis lines for each elementŽ .see Section 3.4, Table 18 . The basic sample
Ž .solutions were diluted dilution factors4 inorder to eliminate the multiplicative interferences
Ž .due to the matrix constituents see Section 3.5 .The reference solutions on the basis of an acid
Ž .blank see Section 2.4 .The results obtained in mg mly1 are presented
in Table 19. Table 20 lists the content of Al, Ca,Mg and Ti with respect to the dissolved solid in
Ž .the solution, in percent column 1 and the con-centration values of elements in accordance with

( )N. Daskalo¨a, I . Boe¨ski r Spectrochimica Acta Part B: Atomic Spectroscopy 54 1999 1099]1122 1117
Table 17y1Ž .The wavelengths of all investigated prominent lines in this work, the background equivalent concentration BEC, mg ml , and the
y1Ž .detection limits in the pure solvent C , ng mlL
Analysis lines BEC C Analysis lines BEC CL Ly1 y1 y1 y1Ž . Ž . Ž . Ž . Ž . Ž .pm mg ml ng ml pm mg ml ng ml
As I 228 812 2.8 80 P I 213 618 3.50 98As I 200 334 9.2 260 P I 214 914 5.20 148As I 234 984 5.3 150 P I 253 565 9.40 267B I 249 773 0.23 6.5 Pb II 220 353 1.30 37B I 249 678 0.18 5.1 Pb I 216 999 5.00 140B I 208 959 0.57 16 Pb I 261 418 6.30 180B I 208 893 1.27 36 Pb I 283 306 7.60 216Ba II 455 404 0.023 0.65 Sb I 206 833 2.3 65Ba II 493 409 0.028 0.79 Sb I 217 581 2.3 65Ba II 233 527 0.14 4 Sb I 231 147 4.4 125Ba II 230 424 0.2 5.7 Sb I 252 852 4.6 130Be II 313 042 0.006 0.18 Se I 203 985 8.0 226Be I 234 861 0.009 0.25 Se I 206 279 34.0 956Be II 313 107 0.01 0.28 Sn I 235 484 5.20 145Cd II 214 438 0.30 8.3 Sn I 242 949 5.40 152Cd I 228 802 0.20 5.7 Sn I 283 999 6.80 193Cd II 226 502 0.20 5.7 Sn I 226 891 8.20 232Cr II 205 552 0.40 12 Tl I 276 787 10 282Cr II 206 149 0.70 21 Tl I 351 924 14 392Cr II 267 716 0.20 5.7 Tl I 377 572 19 526Cr II 283 563 0.25 7.1 Tl I 237 969 100 2866Cu I 324 754 0.17 4.8 U II 385 958 2.2 62Cu II 224 700 0.55 16 U II 367 007 2.2 62Cu I 327 396 0.26 7.4 U II 263 553 4.3 120Cu I 219 958 0.85 24 U II 409 014 3.0 85Hg I 253 652 1.40 38 Zn I 213 856 0.16 4.5Mn II 257 610 0.04 1.2 Zn II 202 548 0.30 8.5Mn II 259 373 0.04 1.2 Zn II 206 200 0.40 12
Table 18Ž . Ž .Q Dl and Q l values for analysis prominent lines of Al, Ca, Fe, Mg and TiW a I a
Analyte, InterferentsWavelength, Al Ca Fe Mg TiŽ .pm
Ž . Ž . Ž . Ž . Ž . Ž . Ž . Ž . Ž . Ž .Q Dl Q l Q Dl Q l Q Dl Q l Q Dl Q l Q Dl Q lW a I a W a I a W a I a W a I a W a I a
y4Al I 237 324 Analyte 0 0 5.3=10 0 0 0 0 0y4 y5Al I 394 401 Analyte 6.0=10 0 0 0 0 0 5.7=10 0
y5Ca I 422 673 0 0 Analyte 0 0 0 0 1.6=10 0y4Ca II 315 887 0 0 Analyte 0 0 0 0 6.5=10 0y5Fe II 238 204 0 0 0 0 Analyte 0 0 6.3=10 0y5Fe II 239 562 0 0 0 0 Analyte 0 0 5.0=10 0y6Mg II 279 806 0 0 0 0 0 0 Analyte 2.6=10 0y6Mg II 285 213 0 0 0 0 0 0 Analyte 3.8=10 0
Ti II 334 941 0 0 0 0 0 0 0 0 AnalyteTi II 336 121 0 0 0 0 0 0 0 0 Analyte
y1 Ž y1 . Ž y1 . Ž y1 . ŽNotes. Analyte concentration: 10 mg ml , interferent concentrations: Al 2 mg ml , Ca 2 mg ml , Fe 2 mg ml , Mg 2y1 . Ž y1 .mg ml and Ti 2 mg ml .

( )N. Daskalo¨a, I . Boe¨ski r Spectrochimica Acta Part B: Atomic Spectroscopy 54 1999 1099]11221118
Table 19y1Ž .Content of Al, Ca, Mg, Fe and Ti in solutions mg ml
derived after dissolution of the standard reference materialsediment SD-N-1r2
y1Ž .Analysis lines Concentrations mg mlŽ .pm x x1
Al II 237 324 192191
Al II 394 401 190
Ca I 422 673 10601063
Ca II 315 887 1065
Mg II 279 806 104 100
Mg II 285 213 96
Fe II 238 204 576583
Fe II 239 562 580
Ti II 334 941 3.653.64
Ti II 336 121 3.63
Notes. x is the mean of three replicates by using a given1analysis lines; x is the mean values of two concentrations,
Žobtained by using two analysis lines of each analyte mean of.three replicates .
Ž .certificate column 2 . It should be noted that theŽconcentration values of the major elements col-
.umn 2 have passed all test criteria for certifiedvalues with the exception of one: their confidenceintervals are larger than those normally allowedfor major component of reference materials,therefore these values could not be certified.
Column 2 in Table 20 presents non-certified con-centration values.
The results from Table 20 show that with highsolute matrix concentrations in extract solutions,spectral interferences in the determination oftraces of hazardous waste elements by ICP-AESshould be taken into consideration.
It should be noted, that Si was separate fromŽ .solution as an insoluble residue see Section 3.6.2
and because of it the interferences due to Si wasnot investigated. The experience has shown that ahigh solubility for Al and Ti in aqua regia cannot
w xbe expected 37,38 .
3.6.4. Determination of traces of Ba, Cr, Pb and ZnThe certified reference material marine sedi-
Ž .ment IAEA SD-N-1r2 was analysed for Ba, Cr,Pb and Zn after dissolution according to the
Ž .procedure see Section 2.3 . The reference solu-Ž .tions were prepared see Section 2.4 .
In the determination of traces of elements inthe most difficult samples such as sediment, thebackground under a prominent line cannot bedirectly measured and in addition, varies with thesample composition. An elementary calculationillustrated the importance of correct backgroundsubtraction and showed the magnitude of theerrors in net signals resulting from erroneous
w xbackground determination 39 .Ž . Ž .By using the Q l and Q Dl valuesI j a W j a
Ž .Tables 12]15 for the ‘best’ analysis lines, theinterferent concentrations in sample solutionsŽ . Ž .C Table 19 and the background equivalentI
Table 20Ž . Ž . ŽContent of Al, Ca, Mg, Fe and Ti with respect to the dissolved solid in % obtained by ICP-AES column 1 mean of three
.replicates
Element ICP-AES x, Non-certified concentration valuesin % x, Confidence interval
Ž .in % as0.05 , in %
Al 0.95"0.02 3.75 3.58]3.85Ca 5.31"0.06 5.32 5.12]5.60Mg 0.50"0.03 0.76 0.74]0.79Fe 2.92"0.02 3.64 3.53]3.78Ti 0.02"0.02 0.27 0.24]0.31
Ž . Ž .Notes. Non-certified concentration values and confidence interval, are shown in column 2 and column 3 , respectively.

( )N. Daskalo¨a, I . Boe¨ski r Spectrochimica Acta Part B: Atomic Spectroscopy 54 1999 1099]1122 1119
Fig. 2. Example of spectral scans over a spectral region aroundŽ .the analysis line of lead: 1 Central wavelength: 220 353 pm
Ž . y1 Ž .Pb line y10 mg ml Pb in pure solvent. 2 Complex matrixblanks190 mg mly1 Alq1060 mg mly1 Caq580 mg mly1
Feq3.6 mg mly1 Ti.
Ž .concentrations in pure solvent Table 17 thewtotal background interfering signal BECq Ý j
xBEC q BEC at the peak wavelength lÝI j W j ajof the analysis lines were measured.
The following should be noted:Ž .1 The interferent Ti concentration for the
‘best’ analysis lines of Cr and Pb for which Q sITiŽ .0 are significantly higher Table 16, column 3 in
comparison with the corresponding values inŽ y1 .sample solutions Table 19, C s3.64 mg ml .ITi
Hence, in both cases Q s0.ITiŽ .2 The interferent Al concentration for which
Ž . Ž .Q l s0 Table 16 column 1 is lower inIAl acomparison with the interferent concentration in
Ž .sample solution Table 19 . The magnitude of Ý jBEC values was estimated. The result showsW jthat BEC s 0.076 mg mly1 < BEC q ÝIAl j
BEC s1.3q1.02q2.32 mg mly1, i.e. BECW j IAlcannot influence both the total backgroundcorrection factor and the true detection limitŽ .C sC . Fig. 2 presents examples ofL,true L,conv.spectral scans over a spectral region around the
Ž . y1analysis line Pb II 220 353 pm: 1 10 mg mlŽ .lead in pure solvent and 2 a matrix blank s190
mg mly1 Alq1060 mg mly1 Caq100 mg mly1
Mgq580 mg mly1 Feq3.6 mg mly1 Ti. This is areal situation in the determination of lead inmarine sediment. Fig. 2 shows the following:Ž . Ž . Ž .1 Q l s0; Q l s0.ITi a IAl aŽ . Ž .2 BEC value derived by measuringÝ W jj
the wing background signal under the ‘best’ anal-ysis line with a real complex matrix blank is equalto the corresponding value calculated by using
Ž . Ž .Q Dl values Tables 12]15 .W j aHence, by using Q-values, the total interfering
background signal under the analysis lines can beobtained without a separate matrix blank as fol-lows:
1. Ba II 455 403 pm: BEC s0; BECqÝ ÝI j jj
BEC s0.075 mg mly1.W j
2. Cr II 267 716 pm: BEC s0; BECqÝ ÝI jj j
BEC s0.3 mg mly1.W j
3. Pb II 220 353 pm: BEC s0; BECqÝ ÝI jj j
BEC s2.32 mg mly1.W j
4. Zn II 206 200 pm: BEC s0; BECqÝ ÝI jj j
BEC s1.9 mg mly1.W j
The results obtained for Ba, Cr, Pb and Zn bythe present ICP-AES method agree well with thecertified values of the standard reference materialŽ .Table 21 . It follows from the results that bothBa, Cr, Pb and Zn are in aqua regia and Q-valuesprovides a realistic estimation of the interferenceeffects and can use for calculation of the totalinterfering background signals under the promi-nent analysis lines.
3.6.5. Detection limitsŽ . Ž .By using Eqs. 1 and 2 in combination with
Ž .Q-values Tables 12]15 and interferent concen-Žtrations for Al, Ca, Fe, Mg and Ti Table 19,
. Žcolumn 1 the true detection limits in solution in

( )N. Daskalo¨a, I . Boe¨ski r Spectrochimica Acta Part B: Atomic Spectroscopy 54 1999 1099]11221120
Table 21Content of Ba, Cr, Pb and Zn in the standard reference material, sediment SD-N-1r2 obtained by ICP-AES
y1‘Best’ analysis lines CertifiedConcentration, mg gŽ .pm ICP-AES
x x"si
295Ba II 455 403 285 290"5 289
290
153Cr II 267 716 148 151"2.6 149
151
115Pb II 220 353 125 119"5 120
117
440Zn II 206 200 434 437"3 439
436
Notes. Column 1, concentration for three replicates; Column 2, average trace concentrations; Column 3, certified values.
y1 .ng ml were calculated. It was shown in Section3.6.4 that for the ‘best’ analysis line of Ba, Cr, Pb
Ž .and Zn Q l s0, i.e. C sC . InÝ I j a L,true L, conv.jcolumn 3 the same detection limits are shown,
Ž y1 .with respect to the dissolved solid in mg g .Comparison of the detection limits in solution
Ž .for pure solvents Table 17, column 2 with thedetection limits in the presence of a given com-
Ž .plex matrix Table 22, column 1 demonstrateunambiguously that by using the extraction oftrace elements soluble in aqua regia as a dissolu-tion method and optimum line selection with theQ-concept the real detection limits do not sig-nificantly rise. When the ‘best’ analysis lines inthe presence of a given complex matrix are free
w Ž . xfrom line interference Q l s0 , C sÝ I j a L,truej
Table 22y1Ž .C ng ml and the same detection limits with respectL,conv.
y1Ž .to the dissolved solid in mg g
‘Best’ analysis lines C C CL,conv. L,true L,conv.y1 y1 y1Ž . Ž . Ž . Ž .pm ng ml ng ml in mg g
Ba II 455 403 1.0 ] 0.05Cr II 267 716 8.7 ] 0.45Pb II 220 353 64.0 ] 3.2Zn II 206 200 23.0 ] 1.2
C and the background enhancement can beL, conv.corrected for by a simple off-peak backgroundmeasurement, i.e. without a matrix blank.
4. Conclusions
Analysis of a variety of complex environmentalmaterials require essential information on thespectral interferences. The results in Table 2 showthat the large number of identified interfering Feand Ti spectral lines, respectively, around theinvestigated analysis lines are listed in the classic-
w xal tables 21,22 , but not listed in Boumans’ ICPw xcoincidence tables 23 . The line interference level
is mainly determined by Fe and at a lesser extentfrom Ti in the analysis of sediments, soils andsimilar materials. The relative intensities of thespectral lines emitted by the classical source andthe ICP are different. These are the reasons whyvarious groups of workers have embarked upon
w xthe compilation of new data relevant to ICP 2 .These data provide a possibility for the correctevaluation of the type of spectral interferences.
The Q-concept, as proposed by Boumans andw xVrakking 14 , was used for quantification of the
spectral interferences in the presence of Al, Ca,

( )N. Daskalo¨a, I . Boe¨ski r Spectrochimica Acta Part B: Atomic Spectroscopy 54 1999 1099]1122 1121
Ž .Fe, Mg and Ti as interferents Tables 12]15 .These data provide a possibility for optimum lineselection for trace analysis and can be used forbackground correction procedure at the wave-
Ž . w Ž . xlength l of the analysis lines when Q l )0a I j awithout a separate matrix blank.
The results in Table 21 illustrate the correctbackground substraction in the determination ofBa, Cr, Pb and Zn in the standard referencematerial SD-N-1r2. Extraction of trace elementsin aqua regia was used as a dissolution methodŽ .see Section 2.3 .
It should be noted that by using the best analy-Ž .sis lines of Ba, Cr, Pb and Zn Tables 12]15 for
a given interferent concentration of matrix con-Ž . Ž .stituents in solution C for which Q l s0I j I j a
Ž . Ž .Table 18 , BEC l s0 and C sÝ I j a L,conv.j
C can be obtained. For the interferent con-L,truecentrations higher than the corresponding values
Ž . Ž .shown in Table 16, Q l )0, BEC lÝI j a I j aj
)0 and C )C . By using the differentL,true L,conv.Ž . Žprominent lines Tables 12]15 for example ICP
.instrumentation with polychromators the variousC )C values can be obtained depen-L,true L,conv.
Ž .dent on the magnitude of Q l values. Back-I j aground correction is possible in all cases.
Progress in the field of trace analysis of theelements concerns the capability of reliable andeconomical determination of extremely low ele-ment contents in samples of very complex compo-sition as they occur in all environmental materi-als. ICP-AES as a multielement plasma techniqueand the Q-concept as a basic methodology can beapplied to the successful elemental analysis ofenvironmental samples.
Copyright
Ž .‘‘The data files are copyrighted by the author s .Readers of Spectrochimica Acta Electronica arepermitted by the publisher Elsevier Science B.V.,to copy the material for their own private, non-commercial use, and to run the programs accord-ing to the instructions provided by the authors.No charge for any copies may be requested, nei-ther may the program or any modified version ofit be sold or used for commercial purposes.’’
‘‘Those who wish to use the data files in acommercial environment should contact the cor-responding author at the address given on thehardcopy paper.’’
Disclaimer
‘‘Neither the authors nor the publisher warrantthat the data files are free from defects, or thatthe documentation is accurate.’’
‘‘Neither the authors nor the publisher areliable for any damage of whatever kind sustainedthrough downloading andror using the data files.’’
‘‘By downloading andror using the data filesthe reader of Spectrochimica Acta Electronica,acting as a user of an electronic publicationtherein, agrees to the above terms andconditions.’’
Acknowledgements
Thanks are due to the National Fond ‘ScientificResearch’ of the Ministry of Education, Scienceand Technology of Bulgaria for financial supportof this work under registration NX-544.
References
w x1 J.A.C. Broekaert, G. Tolg, Fresenius Z. Anal. Chem. 326¨Ž .1987 405.
w x2 J.W. McLaren, Applications: environmental, in:Ž .P.W.J.M. Boumans Ed. , Inductively Coupled Plasma,
Emission Spectroscopy, Part 2, Applications and Funda-mentals, Wiley, New York, 1987, Ch. 3, p. 48.
w x3 P. Tschopel, G. Tolg, J. Trace Mickroprobe Tech. 1¨ ¨Ž .1982 1.
w x Ž .4 P.W.J.M. Boumans, Fresenius Z. Anal. Chem. 324 1986397.
w x5 P.W.J.M. Boumans, Line selection and spectral interfer-Ž .ences, in: P.W.J.M. Boumans Ed. , Inductively Coupled
Plasma Atomic Emission Spectroscopy, Wiley, NewYork, 1987, Ch. 7, p. 358.
w x6 S.S. Berman, J.W. McLaren, D.S. Russell, in: R.M.Ž .Barnes Ed. , Developments in Atomic Plasma Spec-
trochemical Analysis, Heyden, Philadelphia, 1981, p. 586.w x7 J.W. McLaren, S.S. Berman, Y.J. Boyko, D.S. Russell,
Ž .Anal. Chem. 53 1981 1802.w x Ž .8 P.W.J.M. Boumans, A. Sheeline Eds. , Needs for funda-
mental reference data in analytical atomic spectroscopy,ŽProc. Workshop, Scarborough, Ontario, Canada, 19 21
Ž . .June 1987, in Spectrochim. Acta Part B 43 1988 5 .w x Ž .9 P.W.J.M. Boumans, Spectrochim. Acta Part B 43 1988
103.

( )N. Daskalo¨a, I . Boe¨ski r Spectrochimica Acta Part B: Atomic Spectroscopy 54 1999 1099]11221122
w x10 N. Daskalova, Iv. Boevski, S. Velichkov, Anal. Lab. 1Ž .1992 70.
w x Ž .11 P. Boumans, J. Anal. At. Spectrom. 8 1993 767.w x12 P.W.J.M. Boumans, J.A. Tielrooy, F.J.M.J. Maessen,
Ž .Spectrochim. Acta Part B 43 1988 173.w x13 N. Daskalova, S. Velichkov, N. Krasnobaeva, P. Slavova,
Ž .Spectrochim. Acta Part B 47 1992 E1595.w x14 P.W.J.M. Boumans, J.J.A.M. Vrakking, Spectrochim.
Ž . Ž .Acta Part B 42 1987 819; 43 1988 69.w x15 P.W.J.M. Boumans, He. ZhiZhuang, J.J.A.M. Vrakking,
J.A. Tielrooy, F.J.M.J. Maessen, Spectrochim. Acta PartŽ .B 44 1989 31.
w x16 S. Velichkov, N. Daskalova, P. Slavova, Spectrochim.Ž .Acta Part B 48 1993 E1743.
w x17 N. Daskalova, S. Velichkov, P. Slavova, Spectrochim.Ž .Acta Part B 51 1996 733.
w x18 E. Ivanova, N. Daskalova, S. Velichkov, P. Slavova, G.Ž .Gentscheva, J. Anal. At. Spectrom. 11 1996 567.
w x19 N. Daskalova, S. Velichkov, P. Slavova, E. Ivanova, L.Ž .Aleksieva, Spectrochim. Acta Part B 52 1997 257.
w x20 E. Ivanova, N. Daskalova, Annuaire de L’Universite deŽ .Sofia ‘St. Kliment Ohridski’. Fac. Chem. 89 1997 295.
w x21 G.R. Harrison, M.I.T. Wavelength Tables, M.I.T. Press,Cambridge, M.A. 1939, 1969.
w x22 W.F. Meggers, C.H. Corliss, B.F. Scribner, Tables ofSpectral Line Intensities, N.B.S. Monograph 145, USGovernment Printing Office, Washington, DC, 1975.
w x23 P.W.J.M. Boumans, Line Coincidence Table for Induc-tively Coupled Plasma Atomic Emission Spectrometry,Pergamon, Oxford, 1980, 1984.
w x24 J.M. Mermet, Spectroscopic diagnostics: basic concepts,Ž .in: P.W.J.M. Boumans Ed. , Inductively Coupled Plasma
Atomic Emission Spectroscopy, Part 1, Methodology,Instrumentation and Performance, Wiley, New York,1987, Ch. 10, p. 353.
w x25 A.N. Zaidel, V.K. Prokov’ev, S.M. Rajskij, Ju. Schreider,Tablicy Spectral’nykh Linii, Nauka, Moskow, 1962.
w x26 R.W.B. Pearse, A.G. Gaydon, The Identification ofMolecular Spectra, 4th ed., Chapman et Hall, London,1976.
w x27 E.G. Chudinov, I.I. Ostroukhova, G.V. Varvarina,Ž .Fresenius’s Z. Anal. Chem. 335 1989 25.
w x28 I. Brenner, J.M. Mermet, I. Segal, G.L. Long, Spec-Ž .trochim. Acta Part B 50 1995 323.
w x29 I. Brenner, I. Segal, M. Mermet, J.M. Mermet, Spec-Ž .trochim. Acta Part B 50 1995 333.
w x30 P.W.J.M. Boumans, F.J. de Boer, Spectrochim. ActaŽ .Part B 32 1977 365.
w x31 W.M. Johnson, J.A. Maxwell, Rock and Mineral Analy-sis, Chemical Analysis Series, Vol. 27, Ch. 4, Inter-science, New York, 1981.
w x32 Z. Sulcek, P. Povondra, Methods of Decomposition inInorganic Analysis, CRC Press, New York, 1989.
w x Ž .33 S. Kempton, R.M. Sterrit, J.N. Lester, Talanta 29 1982675.
w x Ž .34 K.C. Thompson, K. Wagstaff, Analyst 105 1980 883.w x35 B. Griepink, H. Muntan, E. Colinet, Fresenius Z. Anal.
Ž .Chem. 318 1984 490.w x36 N.S. Thomaidis, E.A. Piperaki, P.A. Siskos, Mikrochim.
Ž .Acta 119 1995 233.w x Ž37 Test Methods for Evaluating Solid Wasters EPA SW
.846 Volume 1A , Office of Solid Waste and EmergencyResponse, US Environmental Protection Agency, USGovernment Printing Office, Washington, DC, 3rd Ed.,November 1986.
w x38 R. Bock, A Handbook of Decomposition Methods inŽ Ž .Analytical Chemistry, Moskow Chimia Russ. , 1984.
w x39 P.W.J.M. Boumans, Basic concepts and characteristicsŽ .of ICP-AES, in: P.W.J.M. Boumans Ed. , Inductively
Coupled Plasma Emission Spectroscopy, Part 1, Metho-dology, Instrumentation and Performance, Wiley, NewYork, 1987, Ch. 4, p. 100.
Copyright © 2022 FDOKUMEN