The role of analytical methods for the determination of trace elements in environmental biomonitors
22
Microchemical Journal 73 (2002) 131–152 0026-265X/02/$ - see front matter 2002 Elsevier Science B.V. All rights reserved. PII: S0026-265X Ž 02 . 00059-0 The role of analytical methods for the determination of trace elements in environmental biomonitors Maurizio Bettinelli *, Maurizio Perotti , Sandro Spezia , Claudio Baffi , a, a a b Gian Maria Beone , Federico Alberici , Sara Bergonzi , Claudio Bettinelli , b c c c Paola Cantarini , Laura Mascetti c c a National Energy Board, Analytical Chemistry Laboratory via N. Bixio n 39, 29100 Piacenza, Italy b Institute of Agricultural and Environmental Chemistry, Agricultural Faculty, Catholic University, via Emilia Parmense n 84, 29100 Piacenza, Italy c Liceo Scientifico Tecnologico ‘Colombini’ via Beverora, 29100 Piacenza, Italy Received 27 February 2002; accepted 8 March 2002 Abstract Lichens are currently used as bioindicators to monitor air pollution and to follow changes in pollution patterns. In order to perform reliable biomonitoring, the analysis should be accurate, which implies that a good quality control system should be applied. One way to achieve accuracy is to use analytical procedures validated with certified reference materials (CRM) and tested on real samples by comparing different instrumental techniques. In this paper, a microwave digestion procedure developed for determining several elements in lichen samples by ICP-OES, GFAAS and ICP-MS is described. Among other usual mixtures of attack (HNO and H O ) it also includes the use of HF in 3 2 2 order to assure the complete solubilization of atmospheric particulate or soil dust present on the surface of biomonitors. The method was tested on CRM 482 Pseudovernia furfurea, with good recoveries for approximately 20 elements, and by analyzing real samples in different laboratories with different analytical techniques. The aim of the present work was to demonstrate that the enrichment factor (EF) used in biomonitor programs can be estimated in a correct way only adopting a complete solubilization of the lichen samples, which assures accurate results independently from the presence of atmospheric particulate of different origin and morphology. 2002 Elsevier Science B.V. All rights reserved. Keywords: Lichens; Bioindicators; Air pollution *Corresponding author. E-mail address: [email protected] (C. Baffi). [email protected] (M. Bettinelli), [email protected] (C. Baffi).
-
Upload
independent -
Category
Documents
-
view
5 -
download
0
Transcript of The role of analytical methods for the determination of trace elements in environmental biomonitors
Microchemical Journal 73(2002) 131–152
0026-265X/02/$ - see front matter� 2002 Elsevier Science B.V. All rights reserved.PII: S0026-265XŽ02.00059-0
The role of analytical methods for the determination of traceelements in environmental biomonitors
Maurizio Bettinelli *, Maurizio Perotti , Sandro Spezia , Claudio Baffi ,a, a a b
Gian Maria Beone , Federico Alberici , Sara Bergonzi , Claudio Bettinelli ,b c c c
Paola Cantarini , Laura Mascettic c
aNational Energy Board, Analytical Chemistry Laboratory via N. Bixio n 39, 29100 Piacenza, ItalybInstitute of Agricultural and Environmental Chemistry, Agricultural Faculty, Catholic University, via Emilia Parmense n 84,
29100 Piacenza, ItalycLiceo Scientifico Tecnologico ‘Colombini’ via Beverora, 29100 Piacenza, Italy
Received 27 February 2002; accepted 8 March 2002
Abstract
Lichens are currently used as bioindicators to monitor air pollution and to follow changes in pollution patterns. Inorder to perform reliable biomonitoring, the analysis should be accurate, which implies that a good quality controlsystem should be applied. One way to achieve accuracy is to use analytical procedures validated with certifiedreference materials(CRM) and tested on real samples by comparing different instrumental techniques. In this paper,a microwave digestion procedure developed for determining several elements in lichen samples by ICP-OES, GFAASand ICP-MS is described. Among other usual mixtures of attack(HNO and H O) it also includes the use of HF in3 2 2
order to assure the complete solubilization of atmospheric particulate or soil dust present on the surface of biomonitors.The method was tested on CRM 482Pseudovernia furfurea, with good recoveries for approximately 20 elements,and by analyzing real samples in different laboratories with different analytical techniques. The aim of the presentwork was to demonstrate that the enrichment factor(EF) used in biomonitor programs can be estimated in a correctway only adopting a complete solubilization of the lichen samples, which assures accurate results independently fromthe presence of atmospheric particulate of different origin and morphology.� 2002 Elsevier Science B.V. All rights reserved.
Keywords: Lichens; Bioindicators; Air pollution
*Corresponding author.E-mail address: [email protected](C. Baffi).
[email protected](M. Bettinelli), [email protected](C. Baffi).

132 M. Bettinelli et al. / Microchemical Journal 73 (2002) 131–152
1. Introduction
Bioaccumulation of trace metals from atmos-pheric deposition is currently evaluated by someenvironmental biomonitors such as mosses, plantleaves and lichensw1x.The selection of a suitable sampling strategy, in
terms of species, number of sites, timing of fre-quency of the collection of representative samplesdepends on the scope of the biomonitoring project.However, in order to control or eliminate the
effects of environmental parameters that can influ-ence the final results, some recommended ruleshave to be kept in mind for a correct sampling inview of an analysis of trace elementsw2x:
● The samples have to be biosensors or part ofthem presenting an acceptable uniformity ofbotanic characteristics, degrees of exposure toatmospheric particulate, heights above theground and must have sufficient size to allowfor replicate analyses.
● The collection cannot be done during specificmeteorological events and weather conditionsduring the sampling period should be relativelyconstant for several days beforehand.
● Sample contamination, e.g. from the containersor from the sampling devices must be avoidedor reduced.
● The samples, after their collection, should beanalyzed as soon as possible after their collec-tion or stored and preserved so that biologicalactivities and volatilization of elements areminimized.
Finally, in order to evaluate the presence ofheavy metals associated to atmospheric particulateof antropogenic origin, particular attention shouldbe kept to minimize the effect of soil contamina-tion w3,4x.One of the most serious problems in trace
element biomonitoring, especially in dry environ-ments, is the contamination of samples with soildust. In Mediterranean countries, levels of airbornesoil dust must be so high in summer that precau-tions must be taken in order to gather comparabledata for biosensors collected in the same areas,but at different times.
Unfortunately, in the past, the possible contri-bution of soil particles to the total concentrationof elements in botanic samples has barely beenconsidered, so that several values appearing in theliterature as regional background concentrationshave to be regarded with attentionw5x.In order to reduce this, many cleaning proce-
dures have been investigatedw6,7x: cleaning bydry or wet brushing, wiping, blowing out orwashing in different media. The use of ultrasonicwashing has also been suggested, but it maydamage botanic tissues releasing elements into thewashing medium.For these reasons the cleaning of biomonitors is
an indispensable step only in the case of physio-logical and toxicological investigations when thefraction of elements adsorbed onto the surfacemust be distinguished from that present within thetissues. In all the other studies washing proceduresare rarely adopted, for several reasons, but mainlybecause the elements of antropogenic nature areoften associated to the atmospheric particulateadsorbed onto the surface of biosensors and there-fore they are very easily removed.Finally, each adaptable washing procedure,
potentially presents the following problems:
● The efficiency of washing is difficult to assessbecause it depends from the nature of washingagent, the experimental conditions used andfrom the type of sample analyzed. No standard-ized washing procedure has been successfullydefined up to now, thus washing introducesfurther variability and reduces the possibility ofdata comparisons.
● The biosensor tissue can be damaged, so ele-ments can be released into the washing mediumwith consequent alteration of the concentrationprofile of the analyte (washing cannot beapplied to lichens and mosses because it causessignificant element loss from thesebiomonitors).
● The efficiency of washing procedure is stronglydependent on the morphology of the particulatepresents onto the surface of biosensors. Forexample, a gypsum or a calcium carbonatecrystal can be easily solubilized with soft wash-ing treatments, while fly ash particles emitted
133M. Bettinelli et al. / Microchemical Journal 73 (2002) 131–152
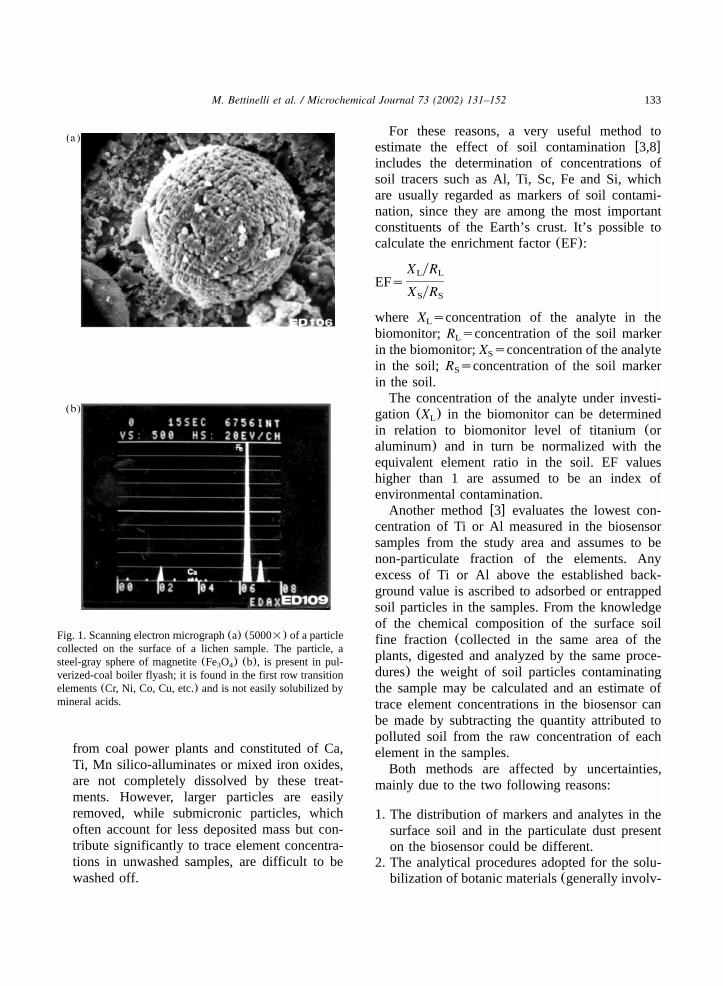
Fig. 1. Scanning electron micrograph(a) (5000=) of a particlecollected on the surface of a lichen sample. The particle, asteel-gray sphere of magnetite(Fe O ) (b), is present in pul-3 4
verized-coal boiler flyash; it is found in the first row transitionelements(Cr, Ni, Co, Cu, etc.) and is not easily solubilized bymineral acids.
from coal power plants and constituted of Ca,Ti, Mn silico-alluminates or mixed iron oxides,are not completely dissolved by these treat-ments. However, larger particles are easilyremoved, while submicronic particles, whichoften account for less deposited mass but con-tribute significantly to trace element concentra-tions in unwashed samples, are difficult to bewashed off.
For these reasons, a very useful method toestimate the effect of soil contaminationw3,8xincludes the determination of concentrations ofsoil tracers such as Al, Ti, Sc, Fe and Si, whichare usually regarded as markers of soil contami-nation, since they are among the most importantconstituents of the Earth’s crust. It’s possible tocalculate the enrichment factor(EF):
X yRL LEFs
X yRS S
where X sconcentration of the analyte in theL
biomonitor; R sconcentration of the soil markerL
in the biomonitor;X sconcentration of the analyteS
in the soil; R sconcentration of the soil markerS
in the soil.The concentration of the analyte under investi-
gation (X ) in the biomonitor can be determinedL
in relation to biomonitor level of titanium(oraluminum) and in turn be normalized with theequivalent element ratio in the soil. EF valueshigher than 1 are assumed to be an index ofenvironmental contamination.Another methodw3x evaluates the lowest con-
centration of Ti or Al measured in the biosensorsamples from the study area and assumes to benon-particulate fraction of the elements. Anyexcess of Ti or Al above the established back-ground value is ascribed to adsorbed or entrappedsoil particles in the samples. From the knowledgeof the chemical composition of the surface soilfine fraction (collected in the same area of theplants, digested and analyzed by the same proce-dures) the weight of soil particles contaminatingthe sample may be calculated and an estimate oftrace element concentrations in the biosensor canbe made by subtracting the quantity attributed topolluted soil from the raw concentration of eachelement in the samples.Both methods are affected by uncertainties,
mainly due to the two following reasons:
1. The distribution of markers and analytes in thesurface soil and in the particulate dust presenton the biosensor could be different.
2. The analytical procedures adopted for the solu-bilization of botanic materials(generally involv-
134 M. Bettinelli et al. / Microchemical Journal 73 (2002) 131–152
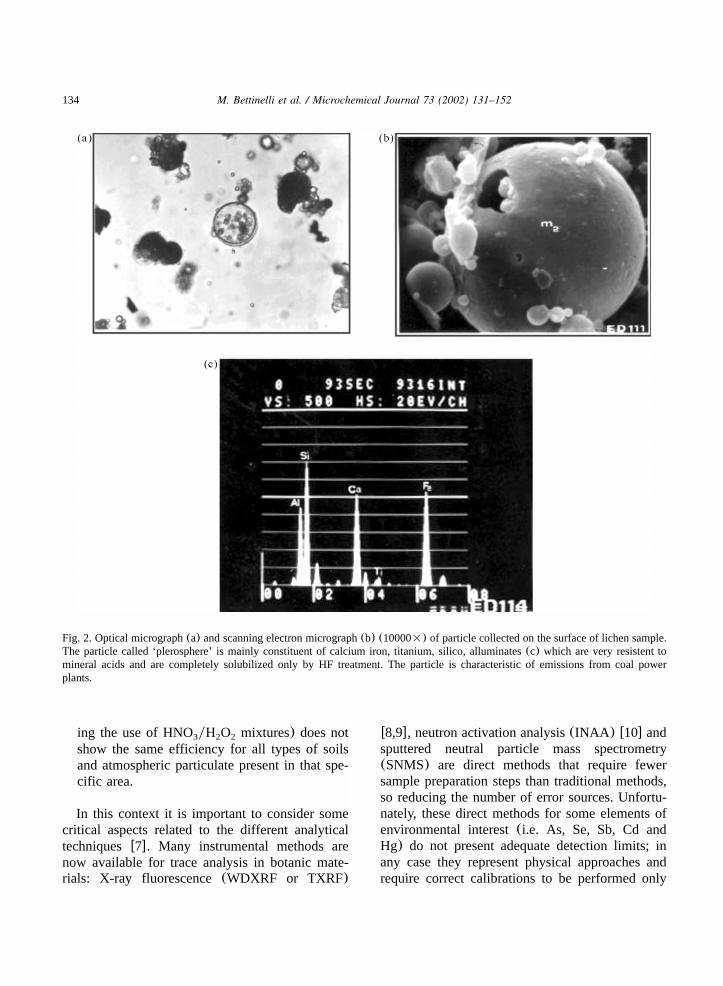
Fig. 2. Optical micrograph(a) and scanning electron micrograph(b) (10000=) of particle collected on the surface of lichen sample.The particle called ‘plerosphere’ is mainly constituent of calcium iron, titanium, silico, alluminates(c) which are very resistent tomineral acids and are completely solubilized only by HF treatment. The particle is characteristic of emissions from coal powerplants.
ing the use of HNOyH O mixtures) does not3 2 2
show the same efficiency for all types of soilsand atmospheric particulate present in that spe-cific area.
In this context it is important to consider somecritical aspects related to the different analyticaltechniquesw7x. Many instrumental methods arenow available for trace analysis in botanic mate-rials: X-ray fluorescence(WDXRF or TXRF)
w8,9x, neutron activation analysis(INAA ) w10x andsputtered neutral particle mass spectrometry(SNMS) are direct methods that require fewersample preparation steps than traditional methods,so reducing the number of error sources. Unfortu-nately, these direct methods for some elements ofenvironmental interest(i.e. As, Se, Sb, Cd andHg) do not present adequate detection limits; inany case they represent physical approaches andrequire correct calibrations to be performed only
135M. Bettinelli et al. / Microchemical Journal 73 (2002) 131–152
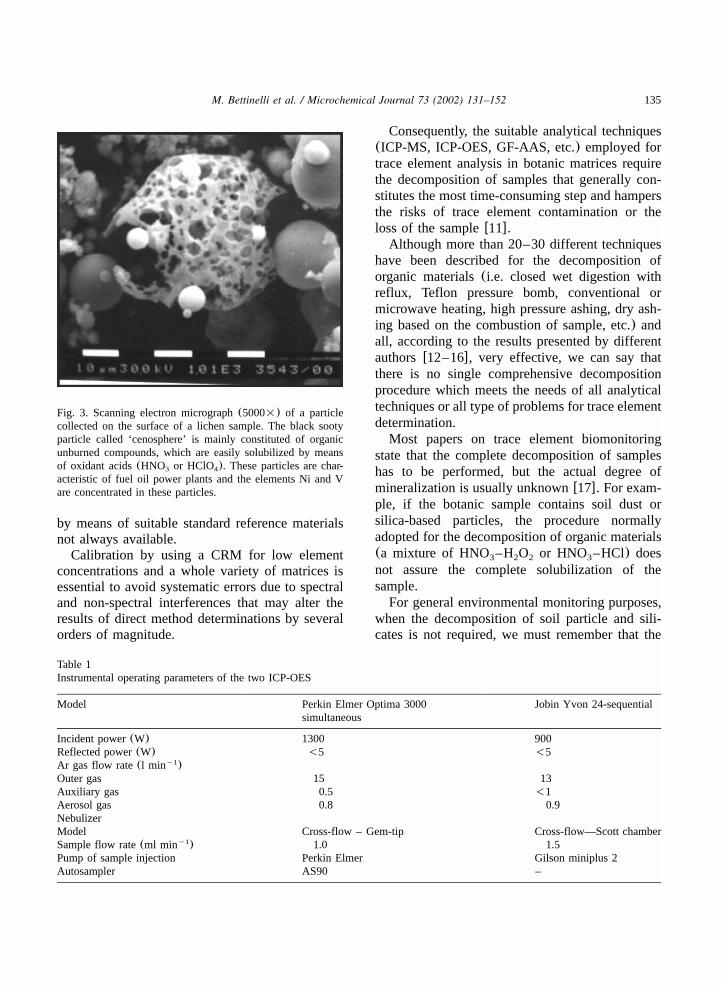
Fig. 3. Scanning electron micrograph(5000=) of a particlecollected on the surface of a lichen sample. The black sootyparticle called ‘cenosphere’ is mainly constituted of organicunburned compounds, which are easily solubilized by meansof oxidant acids(HNO or HClO ). These particles are char-3 4
acteristic of fuel oil power plants and the elements Ni and Vare concentrated in these particles.
Table 1Instrumental operating parameters of the two ICP-OES
Model Perkin Elmer Optima 3000 Jobin Yvon 24-sequentialsimultaneous
Incident power(W) 1300 900Reflected power(W) -5 -5Ar gas flow rate(l min )y1
Outer gas 15 13Auxiliary gas 0.5 -1Aerosol gas 0.8 0.9NebulizerModel Cross-flow – Gem-tip Cross-flow—Scott chamberSample flow rate(ml min )y1 1.0 1.5Pump of sample injection Perkin Elmer Gilson miniplus 2Autosampler AS90 –
by means of suitable standard reference materialsnot always available.Calibration by using a CRM for low element
concentrations and a whole variety of matrices isessential to avoid systematic errors due to spectraland non-spectral interferences that may alter theresults of direct method determinations by severalorders of magnitude.
Consequently, the suitable analytical techniques(ICP-MS, ICP-OES, GF-AAS, etc.) employed fortrace element analysis in botanic matrices requirethe decomposition of samples that generally con-stitutes the most time-consuming step and hampersthe risks of trace element contamination or theloss of the samplew11x.Although more than 20–30 different techniques
have been described for the decomposition oforganic materials(i.e. closed wet digestion withreflux, Teflon pressure bomb, conventional ormicrowave heating, high pressure ashing, dry ash-ing based on the combustion of sample, etc.) andall, according to the results presented by differentauthorsw12–16x, very effective, we can say thatthere is no single comprehensive decompositionprocedure which meets the needs of all analyticaltechniques or all type of problems for trace elementdetermination.Most papers on trace element biomonitoring
state that the complete decomposition of sampleshas to be performed, but the actual degree ofmineralization is usually unknownw17x. For exam-ple, if the botanic sample contains soil dust orsilica-based particles, the procedure normallyadopted for the decomposition of organic materials(a mixture of HNO –H O or HNO –HCl) does3 2 2 3
not assure the complete solubilization of thesample.For general environmental monitoring purposes,
when the decomposition of soil particle and sili-cates is not required, we must remember that the
136 M. Bettinelli et al. / Microchemical Journal 73 (2002) 131–152
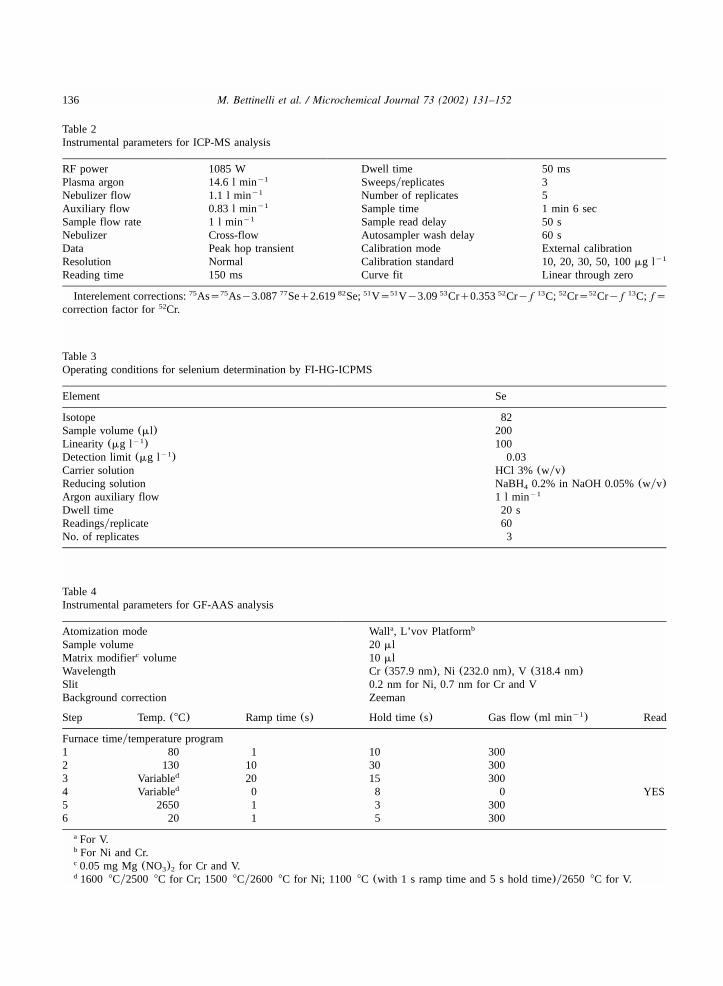
Table 2Instrumental parameters for ICP-MS analysis
RF power 1085 W Dwell time 50 msPlasma argon 14.6 l miny1 Sweepsyreplicates 3Nebulizer flow 1.1 l miny1 Number of replicates 5Auxiliary flow 0.83 l miny1 Sample time 1 min 6 secSample flow rate 1 l miny1 Sample read delay 50 sNebulizer Cross-flow Autosampler wash delay 60 sData Peak hop transient Calibration mode External calibrationResolution Normal Calibration standard 10, 20, 30, 50, 100mg ly1
Reading time 150 ms Curve fit Linear through zero
Interelement corrections: Ass Asy3.087 Seq2.619 Se; Vs Vy3.09 Crq0.353 Cry f C; Crs Cry f C; fs75 75 77 82 51 51 53 52 13 52 52 13
correction factor for Cr.52
Table 3Operating conditions for selenium determination by FI-HG-ICPMS
Element Se
Isotope 82Sample volume(ml) 200Linearity (mg l )y1 100Detection limit(mg l )y1 0.03Carrier solution HCl 3% (wyv)Reducing solution NaBH 0.2% in NaOH 0.05%(wyv)4
Argon auxiliary flow 1 l miny1
Dwell time 20 sReadingsyreplicate 60No. of replicates 3
Table 4Instrumental parameters for GF-AAS analysis
Atomization mode Wall , L’vov Platforma b
Sample volume 20mlMatrix modifier volumec 10 mlWavelength Cr(357.9 nm), Ni (232.0 nm), V (318.4 nm)Slit 0.2 nm for Ni, 0.7 nm for Cr and VBackground correction Zeeman
Step Temp.(8C) Ramp time(s) Hold time (s) Gas flow(ml min )y1 Read
Furnace timeytemperature program1 80 1 10 3002 130 10 30 3003 Variabled 20 15 3004 Variabled 0 8 0 YES5 2650 1 3 3006 20 1 5 300
For V.a
For Ni and Cr.b
0.05 mg Mg(NO ) for Cr and V.c3 2
1600 8Cy2500 8C for Cr; 1500 8Cy2600 8C for Ni; 1100 8C (with 1 s ramp time and 5 s hold time)y2650 8C for V.d

137M. Bettinelli et al. / Microchemical Journal 73 (2002) 131–152
Table 5Operating conditions for microwave systems for lichens(digA and B)
Step 1 2 3
Power(W) 240 360 480Hold time (min) 2 2 15
Fig. 4. Thalli of lichen samples before(a) and after(b) cleaning by hand.
Table 6Wavelengths(nm) and concentration values(mg g ) of elements in CRM 482Pseudovernia furfurea; recovery(%), repeatabilityy1
(r%) and reproducibility(R%) determined by two labs with ICP-OES after HNOyH O microwave-oven procedure(dig A)3 2 2
Element l (nm) Observed values Mean obs Certified Recovery R R
Lab A-Aa Lab B-A Lab A-B Lab B-B values values (%) (%) (%)
Al 396.152 572"32 575"40 616"49 626"58 592"43 1103"24 54 20 20Cr 267.716 2.43"0.31 1.83"0.40 2.64"0.40 1.87"0.42 2.20"0.51 4.12"0.15 53 49 65Cu 324.754 6.53"0.06 7.45"0.07 6.22"0.08 5.74"0.04 6.49"0.69 7.03"0.19 92 2.7 29Fe 238.204 706"29 667"57 733"27 647"58 688"54 (804"160)b 86 18 22Mn 257.610 27.7"0.5 28.0"0.4 26.4"0.6 26.4"0.7 27.1"1.0 (33"0.5)b 82 5.6 10Ti 334.941 17.6"0.8 15.2"3.6 18.0"0.8 15.1"3.2 16.3"2.6 34.2"1.1 48 45 44V 292.402 3.00"0.01 2.97"0.15 3.32"0.16 3.14"0.07 3.11" 0.19 (3.74"0.61)b 83 11 17Zn 213.856 94.2"2.3 98.3"2.3 89.5"2.6 91.9"0.7 93.5"4.1 100.6"2.2 93 6.3 12
LAB X-Y: laboratory of treatment with MW(X); laboratory of analysis(Y).a
In brackets indicates values for certificate sample.b
data coming from an incomplete sample decom-position may not be suitable for a reliable appraisalof the accuracy through the analysis of standardreference materials, which usually certifies the totalelement content.Also, data in the literature on average elemental
composition of the Earth’s crust usually refer tothe total element content, and they can hardly be

138M
.B
ettinelliet
al./
Microchem
icalJournal
73(2002)
131–152
Table 7Wavelengths(nm) and concentration values(mg g ) of elements in CRM 482Pseudovernia furfurea; recovery(%), repeatability(r%) and reproducibility(R%)y1
determined by two labs with ICP-OES after HFyHNO yH O microwave-oven procedure(dig B)3 2 2
Elem l (nm) Observed values Mean obs Certified values Recovery r R
Lab A-Aa Lab B-A Lab A-B Lab B-B values (%) (%) (%)
Al 396.152 OUTb 1038.00"90 1447.00"103 1067.00"29 1084.00"87 1103.00"24 98 20 22Cr 267.716 3.20"0.30 3.20"0.56 3.32"0.18 3.44"0.41 3.29"0.34 4.12"0.15 80 32 28Cu 324.754 7.03"0.25 6.17"0.32 6.65"0.11 OUT* 6.62"0.48 7.03"0.19 94 10 20Fe 238.204 796.00"3 782.00"13 747.00"7 757.00"28 768.00"26 (804.00"160)c 96 6.1 9.2Mn 257.610 30.50"0.8 29.90"0.3 28.50"0.2 29.50"1.1 29.60"1.0 (33.00"0.5)c 90 6.4 9.5Ti 334.941 76.60"4.8 67.80"7.6 71.20"3.7 70.00"7.0 70.40"5.3 34.20"1.1 206 24 21V 292.402 3.73"0.12 3.67"0.06 4.05"0.08 4.00"0.24 3.86"0.22 (3.74"0.61)c 103 10 16Zn 213.856 99.50"3.5 95.90"3.7 93.90"2.6 92.10"3.6 95.30"5.2 100.60"2.2 95 9.8 12
LAB X-Y: laboratory of treatment with MW(X); laboratory of analysis(Y).a
OUT, outlier value not considered in the mean calculation.b
In brackets indicates values for certificate sample.c

139M. Bettinelli et al. / Microchemical Journal 73 (2002) 131–152
Table 8Values of the concentrations(mg g ) of elements in CRM 482Pseudovernia furfurea obtained with ICP-OES, ICP-MS, and GFy1
AAS after digestion procedures(dig A and dig B)
Elem Cert values Digestion with HNOyH O3 2 2 Digestion with HFyHNO yH O3 2 2
ICP-OESa ICP-MSb GF-AASb ICP-OESa ICP-MSb GF-AASb
Al 1103.00"24 592"43 n.a. n.a. 1084.00"87 n.a. n.a.As 0.85"0.07 n.d. 0.880"0.04 n.a. n.d. 0.960"0.19 n.a.Ba (14.90"2.4)c n.d. 8.510"0.23 n.a. n.d. 14.400"1.69 n.a.Be n.d. 0.002"0.001 n.a. n.d. 0.008" 0.003 n.a.Cd 0.56"0.02 0.54"0.01 0.560"0.02 n.a. 0.54"0.01 0.520"0.02 n.a.Co (0.32"0.03)c n.d. 0.250"0.01 n.a. n.d. 0.360"0.01 n.a.Cr 4.12"0.15 2.20"0.51 2.220"0.30 2.86"0.82 3.29"0.34 3.040"0.13 4.08"0.18Cu 7.03"0.19 6.49"0.69 7.080"0.31 n.a. 6.62"0.48 6.990"0.59 n.a.Fe (804.00"160)c 688"54 n.a. n.a. 768.00"26 n.a. n.a.Mn (33.00"0.5)c 27.1"0.98 22.800"0.1 n.a. 29.60"1.0 28.000"0.7 n.a.Mo n.d. 0.320"0.01 n.a. n.d. 0.560"0.06 n.a.Ni 2.47"0.07 2.27"0.05 2.120"0.07 2.17"0.08 2.60"0.53 2.430"0.38 2.69"0.06Pb 40.90"1.4 34.8"1.1 37.20"0.4 n.a. 35.90"1.3 33.800" 1.1 n.a.Rb (7.12"0.39)c n.d. 6.730"0.09 n.a. n.d. 7.880"0.40 n.a.Sb (0.35"0.09)c n.d. 0.170"0.02 n.a. n.d. 0.340"0.01 n.a.Se (0.60"0.2)c n.a 0.570"0.03 n.a. n.a. 0.540"0.01 n.a.Sr (10.40"0.24)c n.d. 7.800"0.17 n.a. n.d. 9.430"0.42 n.a.Ti (34.20"1.1)c 16.3"2.6 17.700"0.4 n.a. 70.40"5.3 70.600" 5.0 n.a.Tl (0.06"0.03)c n.d. 0.035" 0.005 n.a. n.d. 0.058" 0.005 n.a.V (3.74"0.61)c 3.11"0.19 2.580"0.26 3.05"0.13 3.86"0.22 3.570"0.16 3.76"0.14Zn 100.60"2.2 93.5"4.11 91.700"5.3 n.a. 95.30"5.2 92.000"5.7 n.a.
General mean values of the two labs except for Cd, Ni and Pb determined by lab A alone.a
Mean values of lab A.b
In brackets indicates values for certificate sample; n.a, not analyzed; n.d., not detectable.c
used to calculate the enrichment factor. Finally,the CRM is generally characterized by a lowcontent of soil particulate and therefore does notgive correct information about the degree of min-eralization obtained on real samples.For a better estimate of soil mass loading in
plant samples it is advisable to analyze a represen-tative sample of surface soil from the study area,using the same decomposition and analytical pro-cedures adopted for the plant samplesw3x. How-ever, which is the most advisable decompositionprocedure taking in account that, except sampling,this step may introduce the largest systematicerrors for an estimation of the element concentra-tions of trace elements?Recently, on the occasion of the Workshop
‘Biomonitoraggio della qualita dell’aria sul terri-`torio nazionale’ promoted by the National Agencyfor Environmental Protection(ANPA) held in
Rome on 26–27 November 1998, Bettinelli et al.w18x described a solubilization method for lichensbased on the use of HNO –H O –HF mixtures in3 2 2
microwave ovens, while Cenci et al.w19x suggest-ed the decomposition of mosses and the top soilwith the mixture of HNO –H O , always in micro-3 2 2
wave ovens.Nimis and Bargagliw20x, in order to evaluate
the naturalityyalteration levels expressed by themetal concentrations present in epiphytic lichensproposed the use of a specific scale elaborated onthe basis of experimental studies done in threedifferent Italian areas. The scale is derived fromthe distribution of measurements, at least somehundreds of concentration values for a specificelement, which were obtained by different analyt-ical procedures. Which is the validity of this scale?It’s well known that biological samples are

140 M. Bettinelli et al. / Microchemical Journal 73 (2002) 131–152
Table 9Concentration values(mg g ) of elements in lichens sp.Pseudovernia furfurea from Sardinia by two labs with ICP-OES, ICP-MSy1
and GF-AAS after digestion procedures(dig A and dig B)
Element Digestion with HNOyH O3 2 2 Digestion with HFyHNO yH O3 2 2
ICP-OESa ICP-MSb GF-AASb ICP-OESa ICP-MSb GF-AASb
Al 4532"505 n.a. n.a. 7378"682 n.a. n.a.As n.d. 3.22"0.06 n.a. n.d. 3.59"0.19 n.a.Ba n.d. 31.50"0.31 n.a. n.d. 61.20"6.37 n.a.Be n.d. 0.020"0.01 n.a. n.d. 0.31"0.02 n.a.Cd 4.49"0.02 4.12"0.15 n.a. 4.55"0.26 4.03"0.17 n.a.Co n.d. 0.25"0.01 n.a. n.d. 1.31"0.02 n.a.Cr 6.35"1.20 5.19"0.13 6.51"0.26 9.15"0.82 8.10"0.37 9.32"0.44Cu 7.37"1.25 6.15"0.34 n.a. 7.62"1.94 8.12"0.35 n.a.Fe 3821"131 n.a. n.a. 4313"131 n.a. n.a.Mn 54.2"2.6 47.00"1.3 n.a. 58.2"3.3 50.70"0.7 n.a.Ni n.d. 4.59"0.26 4.18"0.28 n.d. 5.25"0.23 4.98"0.26Pb n.d. 43.90"1.0 n.a. n.d. 43.30"0.7 n.a.Rb n.d. 7.34"0.09 n.a. n.d. 3.97"0.36 n.a.Sb n.d. 0.10"0.02 n.a. n.d. 0.61"0.02 n.a.Se n.a. 0.23"0.02 n.a. n.a. 0.22"0.03 n.a.Sr n.d. 18.40"0.6 n.a. n.d. 23.70"0.4 n.a.Ti 68.7"13.7 53.50"4.4 n.a. 412"19 390.00"17 n.a.Tl n.d. 0.08"0.01 n.a. n.d. 0.14"0.01 n.a.V 10.4"0.7 6.40"0.1 11.4"0.1 14.1"0.5 9.60"0.3 15.3"0.3Zn 158"7 147.00"3 n.a. 160"8 157.00"9 n.a.
General mean values of the two labs except for Cd determined by lab A alone.a
Mean values of lab A; n.a., not analyzed; n.d., not detectable.b
relatively easy to decompose using strong acid(generally nitric, sometimes sulfuric) and oxidants(generally hydrogen peroxide) if compared togeological and industrial samples.However, expressed on dry matter, the inorganic
part of plant samples ranges from 0.1% to 30%,depending mainly on the type and age of sample,the composition of the soil which ensures the plantnutrition but also on the organ considered(forexample, leaves show a significantly higher inor-ganic content than other plant organs). For thesereasons in many papersw16,21,22x, it is evidentthat plant samples require a more efficient decom-position procedure to ensure a complete recoveryfor all analytes.Interlaboratory studies involving analysis of
plant samples, show significant discrepanciesbetween laboratories which use simple minerali-zation procedures and those which employ proce-dures including an attack with HF. The valuesobtained for Pb, Ni, Cr, Sn, V, Ti, Al and Feobtained without HF are systematically lowerbecause a complete digestion is not achieved.
These elements are strongly correlated to the Sicontent and therefore to the dust particulate pres-ent; these differences can be more or less evident,depending on of the mass and nature of soil present(calcareous or siliceous).Finally, if real samples have been collected, the
atmospheric particulate coming from industrialplants and partially insoluble in nitric acid(i.e.coal fly ash instead of cenospheres from oil burn-ing power plants, see Figs. 1–3), the analyticaldata obtained by these solubilization procedureswill be used with difficulty to calculate the enrich-ment factors or in order to compare biomonitoringcampaigns done in different timesyareas.An inherent problem when lichens are used as
biomonitors is that the quality of analysis is affect-ed by specific matrix effects so the accuracy of ananalytical methodology can only really be provenby analyzing lichen reference materialsw23,24x orby comparing the results obtained for real samplesby independent analytical techniquesw25x.The aim of the present study was to assess the
importance of analytical procedures in order to
141M. Bettinelli et al. / Microchemical Journal 73 (2002) 131–152
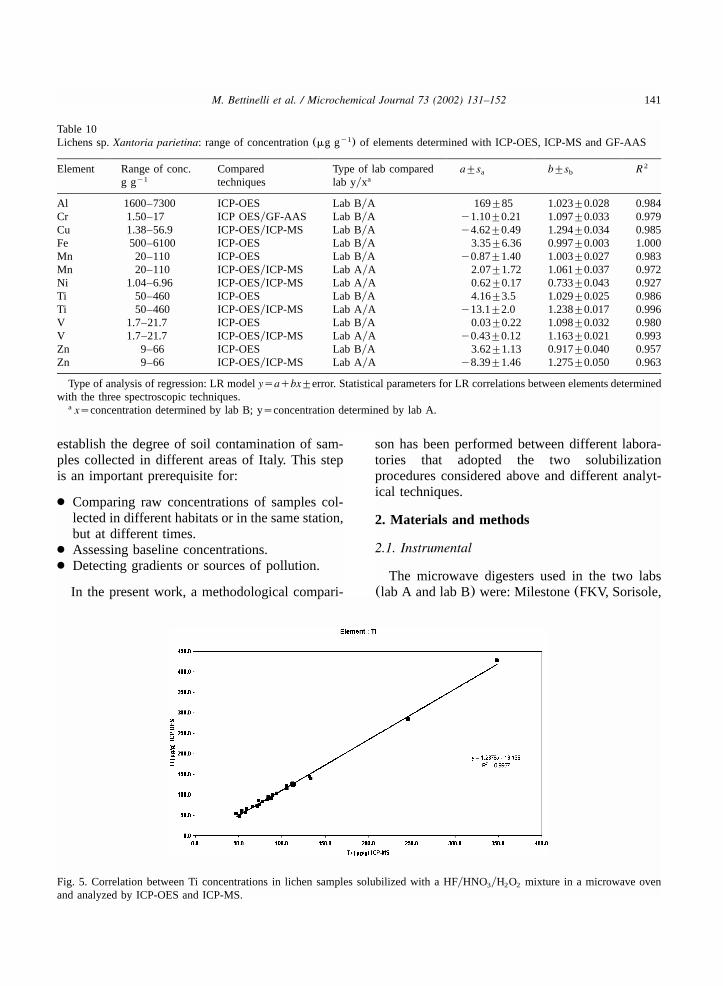
Table 10Lichens sp.Xantoria parietina: range of concentration(mg g ) of elements determined with ICP-OES, ICP-MS and GF-AASy1
Element Range of conc. Compared Type of lab compared a"sa b"sb R2
g gy1 techniques lab yyxa
Al 1600–7300 ICP-OES Lab ByA 169"85 1.023"0.028 0.984Cr 1.50–17 ICP OESyGF-AAS Lab ByA y1.10"0.21 1.097"0.033 0.979Cu 1.38–56.9 ICP-OESyICP-MS Lab ByA y4.62"0.49 1.294"0.034 0.985Fe 500–6100 ICP-OES Lab ByA 3.35"6.36 0.997"0.003 1.000Mn 20–110 ICP-OES Lab ByA y0.87"1.40 1.003"0.027 0.983Mn 20–110 ICP-OESyICP-MS Lab AyA 2.07"1.72 1.061"0.037 0.972Ni 1.04–6.96 ICP-OESyICP-MS Lab AyA 0.62"0.17 0.733"0.043 0.927Ti 50–460 ICP-OES Lab ByA 4.16"3.5 1.029"0.025 0.986Ti 50–460 ICP-OESyICP-MS Lab AyA y13.1"2.0 1.238"0.017 0.996V 1.7–21.7 ICP-OES Lab ByA 0.03"0.22 1.098"0.032 0.980V 1.7–21.7 ICP-OESyICP-MS Lab AyA y0.43"0.12 1.163"0.021 0.993Zn 9–66 ICP-OES Lab ByA 3.62"1.13 0.917"0.040 0.957Zn 9–66 ICP-OESyICP-MS Lab AyA y8.39"1.46 1.275"0.050 0.963
Type of analysis of regression: LR modelysaqbx"error. Statistical parameters for LR correlations between elements determinedwith the three spectroscopic techniques.
xsconcentration determined by lab B; ysconcentration determined by lab A.a
Fig. 5. Correlation between Ti concentrations in lichen samples solubilized with a HFyHNO yH O mixture in a microwave oven3 2 2
and analyzed by ICP-OES and ICP-MS.
establish the degree of soil contamination of sam-ples collected in different areas of Italy. This stepis an important prerequisite for:
● Comparing raw concentrations of samples col-lected in different habitats or in the same station,but at different times.
● Assessing baseline concentrations.● Detecting gradients or sources of pollution.
In the present work, a methodological compari-
son has been performed between different labora-tories that adopted the two solubilizationprocedures considered above and different analyt-ical techniques.
2. Materials and methods
2.1. Instrumental
The microwave digesters used in the two labs(lab A and lab B) were: Milestone(FKV, Sorisole,

142 M. Bettinelli et al. / Microchemical Journal 73 (2002) 131–152
Bergamo, Italy) MLS 2100 model in lab A andCEM (Mattews, NC, USA) MDS-2000 model inlab B. The operating conditions for digestionprocedures adopted for lichen samples are succes-sively described.A PerkinElmer Optima 3000� inductively cou-
pled plasma emission spectrometer, equipped withan AS-90 autosampler, a cross-flow nebulizer, anda Scott-type spray chamber in Ryton , was used�
by lab A, while a Jobin Yvon 24 spectrometerwith a cross-flow nebulizer was used by lab B.The instrumental operating parameters for the twoICP-OES are listed in Table 1. The elementsdetermined by two labs using ICP-OES were Al,Cr, Cu, Fe, Mn, Ti, V and Zn.The ICP-MS used by lab A was a PerkinElmer
SCIEX ELAN 5000(PerkinElmer SCIEX Instru-�
ments, Concord, Ontario, Canada) equipped witha Perkin-Elmer Gem-Tip� cross-flow nebulizerand a corrosion-resistant Scott-type spray chamber.As, Ba, Be, Cd, Co, Cr, Cu, Mo, Mn, Ni, Pb, Rb,Sb, Sr, Ti, Tl, and V Zn were determined withICP-MS.The instrumental parameters adopted for ICP-
MS are shown in Table 2. Equations for interele-mental correction were proposed automaticallyfrom the instrumental software while from theoperator corrections were introduced for interfer-ence of Ar Cl on As, Ar C on Cr and40 35 75 40 12 52
Cl O on V. The equations were: Ass Asy35 16 51 75 75
3.087 Seq2.619 Se; Crs Cry f C; Vs77 82 52 52 13 51
Vy3.09 Crq0.353 Cry f C where f rep-51 33 52 13
resents a correction factor introduced for Cr. It52
is known from the literaturew26x that Cr meas-52
urements in environmental samples by ICP-MSinclude a contribution of inorganic C, present inthe samples, and responsible for the interferenceattributed to the polyatomic species Ar C; this40 12
interference can be corrected with the use of asuitable factor ( f ), experimentally determined,which subtracts the contribution of inorganic C.Finally, the determination of Se was performed
by means of a pneumatic nebulizer(PN-ICPMS)and the flow injection hydride generation systemcoupled with ICP-MS (FI-HG-ICPMS). Theinstrumental parameters are summarized in Table3.
A Zeeman 5100 atomic absorption spectrometer,equipped with a HGA -600 graphite furnace and�
an AS-60 autosampler(Perkin-Elmer Instruments,Norwalk, CT USA), was used by lab A. Theoperating conditions are shown in Table 4. OnlyCr, Ni and V were determined by GFAAS.
2.2. Samples
Sample(a) was from the Bureau Communau-taire de Reference(BCR), trace elements in lichen´CRM 482. A certified lichen reference sampleCRM 482Pseudovernia furfurea, prepared by theCommunity Bureau of Reference(BCR); (b)lichens of sp.Pseudovernia furfurea and top soilnearby, from a marine coastal area of Sardinia Isle(Italy); (c) lichens of sp.Xantoria parietina froman industrial area of Latium(central Italy); and(d) lichens of sp.Parmelia sulcata and top soilnearby, from an area of Piacenza province(north-ern Italy).
2.3. Reagents and calibration
HNO (65% myv), HCl (37% myv), HF (40%3
myv), and H O (30% myv) were Suprapur rea-2 2
gents(E. Merck, Darmstadt, Germany); boric acidwas analytical-reagent grade(BDH). Multielemen-tal standard solutions were prepared from 10 mgl multielemental atomic absorption standards;y1
ICP-MS calibration standard no. 1, 2, 3, 4(Perkin-Elmer), by dilution with water containing the sameamount of acids as the samples. High purity waterwas produced starting from distilled water using aMilli-Q TM deionizing system (Millipore, Bed-ford, MA, USA). Glassware was cleaned by soak-ing with the contact overnight in a 10%(wyv)nitric acid solution and then rinsed with deionizedwater.
2.4. Sample preparation and analytical procedures
Certified lichen sample was handled accordingto BCR specifications; two digestion procedures(dig A and dig B) were performed. In dig A 250mg of sample was added to 7 ml of HNO , 1 ml3
of H O in vessels of two ovens where blanks2 2
were also run with the operating conditions shown
143M. Bettinelli et al. / Microchemical Journal 73 (2002) 131–152
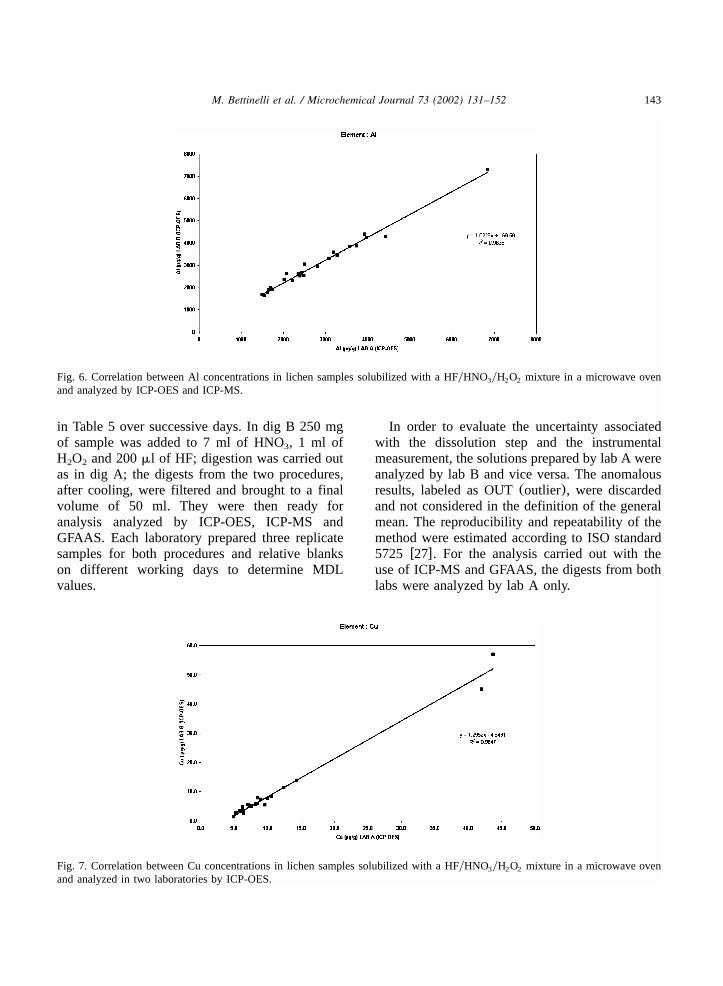
Fig. 6. Correlation between Al concentrations in lichen samples solubilized with a HFyHNO yH O mixture in a microwave oven3 2 2
and analyzed by ICP-OES and ICP-MS.
Fig. 7. Correlation between Cu concentrations in lichen samples solubilized with a HFyHNO yH O mixture in a microwave oven3 2 2
and analyzed in two laboratories by ICP-OES.
in Table 5 over successive days. In dig B 250 mgof sample was added to 7 ml of HNO , 1 ml of3
H O and 200ml of HF; digestion was carried out2 2
as in dig A; the digests from the two procedures,after cooling, were filtered and brought to a finalvolume of 50 ml. They were then ready foranalysis analyzed by ICP-OES, ICP-MS andGFAAS. Each laboratory prepared three replicatesamples for both procedures and relative blankson different working days to determine MDLvalues.
In order to evaluate the uncertainty associatedwith the dissolution step and the instrumentalmeasurement, the solutions prepared by lab A wereanalyzed by lab B and vice versa. The anomalousresults, labeled as OUT(outlier), were discardedand not considered in the definition of the generalmean. The reproducibility and repeatability of themethod were estimated according to ISO standard5725 w27x. For the analysis carried out with theuse of ICP-MS and GFAAS, the digests from bothlabs were analyzed by lab A only.

144 M. Bettinelli et al. / Microchemical Journal 73 (2002) 131–152
Fig. 8. Correlation between Fe concentrations in lichen samples solubilized with HFyHNO yH O mixtures in a microwave oven3 2 2
and analyzed in two laboratories by ICP-OES.
Fig. 9. Correlation between Cr concentrations in lichen samples solubilized with HFyHNO yH O mixture in a microwave oven and3 2 2
analyzed in two laboratories by ICP-OES and GFAAS.
Real lichens were carefully sampled and cleanedby hand using all precautions in order to preventcontamination(e.g. medical gloves, polyethylenebags), to remove foreign materials(e.g. adheringwood, soil particles) (Fig. 4). Then, the unwashedlichens were dried overnight at 408C, extraneousmaterial was removed and they were powderedand homogenized by grinding in a mill with agateballs and an aliquot of 100–250 mg was mineral-ized; lichens sp.Pseudovernia furfurea were sub-
mitted to the same digestion procedures adoptedfor CRM 482; lichens of sp.Xantoria parietina todig B alone. The digests, after cooling, werefiltered and brought to a final volume of 50 ml.Then, they were analyzed with ICP-OES by twolabs and with ICP-MS and GFAAS by lab A alone.Some 0.25 g of soil sample was analyzed with
the same digestion procedure(dig. A) describedfor lichens analysis and according to procedurepreviously reported by Bettinelliw28,29x.
145M. Bettinelli et al. / Microchemical Journal 73 (2002) 131–152
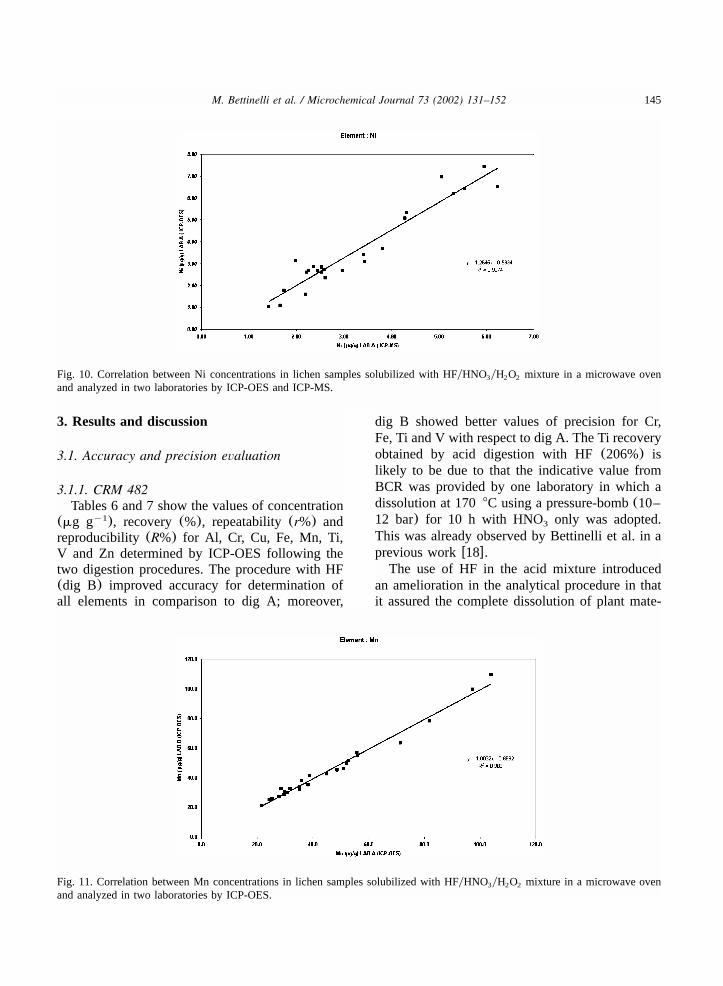
Fig. 10. Correlation between Ni concentrations in lichen samples solubilized with HFyHNO yH O mixture in a microwave oven3 2 2
and analyzed in two laboratories by ICP-OES and ICP-MS.
Fig. 11. Correlation between Mn concentrations in lichen samples solubilized with HFyHNO yH O mixture in a microwave oven3 2 2
and analyzed in two laboratories by ICP-OES.
3. Results and discussion
3.1. Accuracy and precision evaluation
3.1.1. CRM 482Tables 6 and 7 show the values of concentration
(mg g ), recovery (%), repeatability(r%) andy1
reproducibility (R%) for Al, Cr, Cu, Fe, Mn, Ti,V and Zn determined by ICP-OES following thetwo digestion procedures. The procedure with HF(dig B) improved accuracy for determination ofall elements in comparison to dig A; moreover,
dig B showed better values of precision for Cr,Fe, Ti and V with respect to dig A. The Ti recoveryobtained by acid digestion with HF(206%) islikely to be due to that the indicative value fromBCR was provided by one laboratory in which adissolution at 1708C using a pressure-bomb(10–12 bar) for 10 h with HNO only was adopted.3
This was already observed by Bettinelli et al. in aprevious workw18x.The use of HF in the acid mixture introduced
an amelioration in the analytical procedure in thatit assured the complete dissolution of plant mate-
146 M. Bettinelli et al. / Microchemical Journal 73 (2002) 131–152
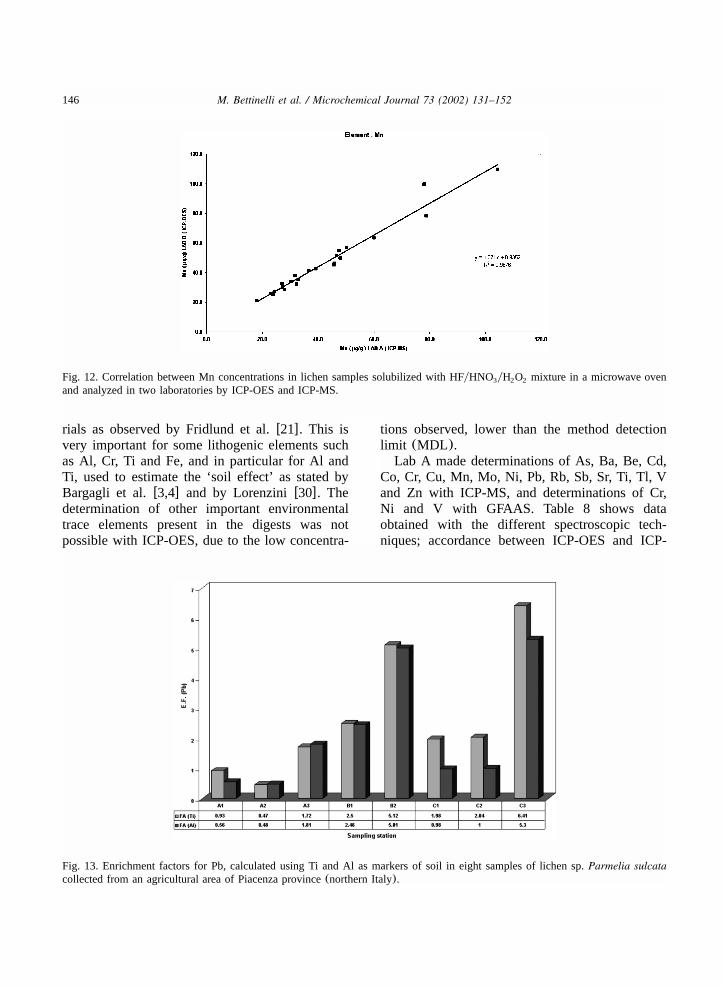
Fig. 12. Correlation between Mn concentrations in lichen samples solubilized with HFyHNO yH O mixture in a microwave oven3 2 2
and analyzed in two laboratories by ICP-OES and ICP-MS.
Fig. 13. Enrichment factors for Pb, calculated using Ti and Al as markers of soil in eight samples of lichen sp.Parmelia sulcatacollected from an agricultural area of Piacenza province(northern Italy).
rials as observed by Fridlund et al.w21x. This isvery important for some lithogenic elements suchas Al, Cr, Ti and Fe, and in particular for Al andTi, used to estimate the ‘soil effect’ as stated byBargagli et al.w3,4x and by Lorenziniw30x. Thedetermination of other important environmentaltrace elements present in the digests was notpossible with ICP-OES, due to the low concentra-
tions observed, lower than the method detectionlimit (MDL).Lab A made determinations of As, Ba, Be, Cd,
Co, Cr, Cu, Mn, Mo, Ni, Pb, Rb, Sb, Sr, Ti, Tl, Vand Zn with ICP-MS, and determinations of Cr,Ni and V with GFAAS. Table 8 shows dataobtained with the different spectroscopic tech-niques; accordance between ICP-OES and ICP-
147M. Bettinelli et al. / Microchemical Journal 73 (2002) 131–152
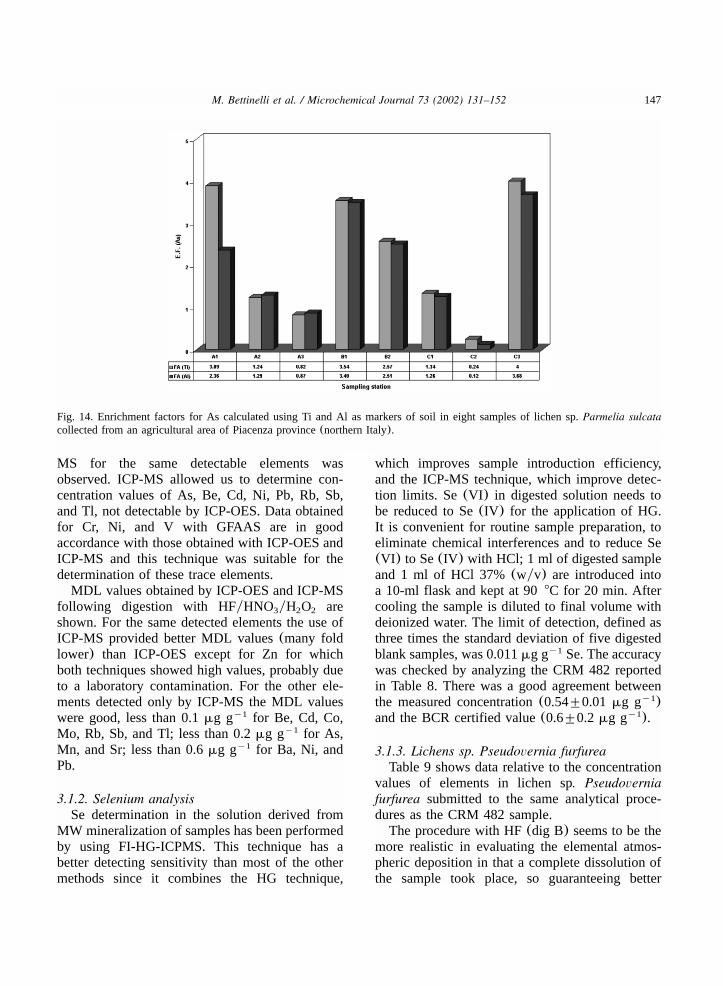
Fig. 14. Enrichment factors for As calculated using Ti and Al as markers of soil in eight samples of lichen sp.Parmelia sulcatacollected from an agricultural area of Piacenza province(northern Italy).
MS for the same detectable elements wasobserved. ICP-MS allowed us to determine con-centration values of As, Be, Cd, Ni, Pb, Rb, Sb,and Tl, not detectable by ICP-OES. Data obtainedfor Cr, Ni, and V with GFAAS are in goodaccordance with those obtained with ICP-OES andICP-MS and this technique was suitable for thedetermination of these trace elements.MDL values obtained by ICP-OES and ICP-MS
following digestion with HFyHNO yH O are3 2 2
shown. For the same detected elements the use ofICP-MS provided better MDL values(many foldlower) than ICP-OES except for Zn for whichboth techniques showed high values, probably dueto a laboratory contamination. For the other ele-ments detected only by ICP-MS the MDL valueswere good, less than 0.1mg g for Be, Cd, Co,y1
Mo, Rb, Sb, and Tl; less than 0.2mg g for As,y1
Mn, and Sr; less than 0.6mg g for Ba, Ni, andy1
Pb.
3.1.2. Selenium analysisSe determination in the solution derived from
MW mineralization of samples has been performedby using FI-HG-ICPMS. This technique has abetter detecting sensitivity than most of the othermethods since it combines the HG technique,
which improves sample introduction efficiency,and the ICP-MS technique, which improve detec-tion limits. Se(VI) in digested solution needs tobe reduced to Se(IV) for the application of HG.It is convenient for routine sample preparation, toeliminate chemical interferences and to reduce Se(VI) to Se(IV) with HCl; 1 ml of digested sampleand 1 ml of HCl 37%(wyv) are introduced intoa 10-ml flask and kept at 908C for 20 min. Aftercooling the sample is diluted to final volume withdeionized water. The limit of detection, defined asthree times the standard deviation of five digestedblank samples, was 0.011mg g Se. The accuracyy1
was checked by analyzing the CRM 482 reportedin Table 8. There was a good agreement betweenthe measured concentration(0.54"0.01 mg g )y1
and the BCR certified value(0.6"0.2mg g ).y1
3.1.3. Lichens sp. Pseudovernia furfureaTable 9 shows data relative to the concentration
values of elements in lichen sp. Pseudoverniafurfurea submitted to the same analytical proce-dures as the CRM 482 sample.The procedure with HF(dig B) seems to be the
more realistic in evaluating the elemental atmos-pheric deposition in that a complete dissolution ofthe sample took place, so guaranteeing better
148 M. Bettinelli et al. / Microchemical Journal 73 (2002) 131–152
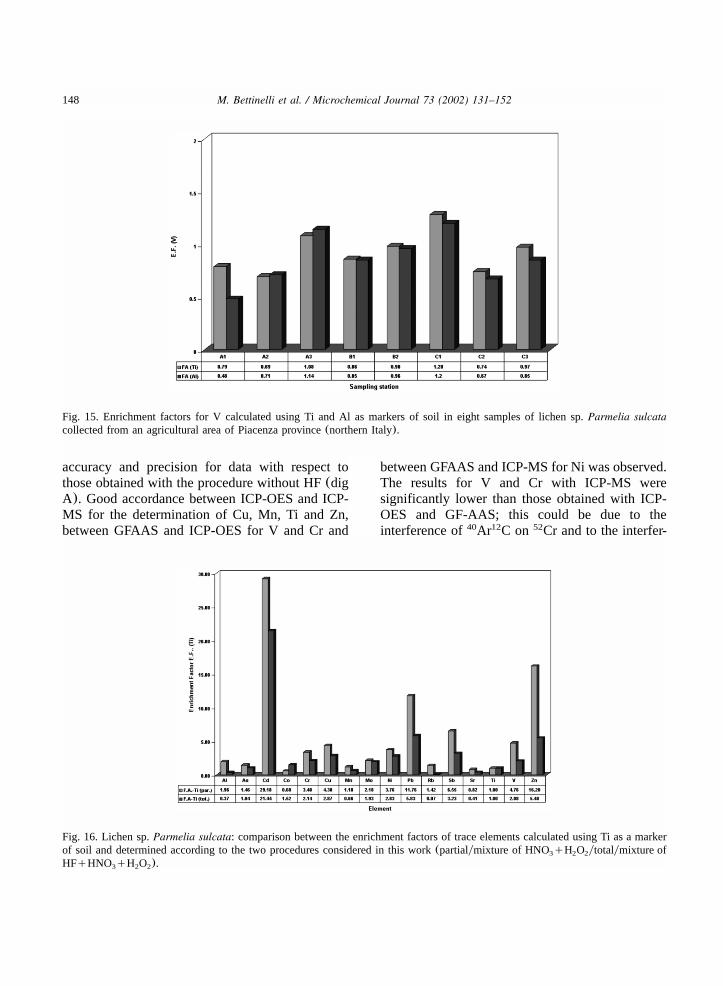
Fig. 15. Enrichment factors for V calculated using Ti and Al as markers of soil in eight samples of lichen sp.Parmelia sulcatacollected from an agricultural area of Piacenza province(northern Italy).
Fig. 16. Lichen sp.Parmelia sulcata: comparison between the enrichment factors of trace elements calculated using Ti as a markerof soil and determined according to the two procedures considered in this work(partialymixture of HNOqH O ytotalymixture of3 2 2
HFqHNO qH O ).3 2 2
accuracy and precision for data with respect tothose obtained with the procedure without HF(digA). Good accordance between ICP-OES and ICP-MS for the determination of Cu, Mn, Ti and Zn,between GFAAS and ICP-OES for V and Cr and
between GFAAS and ICP-MS for Ni was observed.The results for V and Cr with ICP-MS weresignificantly lower than those obtained with ICP-OES and GF-AAS; this could be due to theinterference of Ar C on Cr and to the interfer-40 12 52
149M. Bettinelli et al. / Microchemical Journal 73 (2002) 131–152
Table 11Elemental concentration of lichen and soil(mg g ) with two different solubilization proceduresy1
Element Mineralization Matrix EF
Lichen (mg g )y1 Soil (mg g )y1
Ti Without HF 69 412 –With HF 180 699 –
Cd Without HF 4.12 0.37 29.2With HF 4.55 0.36 21.4
Pb Without HF 43.9 9.78 11.8With HF 43.3 12.6 5.8
Zn Without HF 158 25.5 16.2With HF 168 49.5 5.5
ence Cl O on Vw26,31x that are only partially35 16 51
solved by using a correction factor into the ELANsoftware.
3.2. Lichens sp. Xantoria parietina
In order to evaluate the accuracy of the proposedMW solubilization procedure on real samples, aninterlaboratory comparison among two differentlaboratories using the same procedure(with HF)but different analytical techniques has beenperformed.Samples of lichens sp.Xantoria parietina (ns
25) collected in an industrial area of Latium(central Italy) were submitted by lab A to thedigestion procedure with use of HF(dig B) andAl, Cr, Cu, Fe, Mn, Ti, V and Zn were determinedwith ICP-OES by two labs and with ICP-MS andGFAAS by lab A only. In order to compare theperformances of the various analytical techniques,correlation analysis with a LR method was carriedout on data(Table 10). For the comparison weevaluatedR , slope (b) and intercept(a), which2
in a theoretical model assume the values:R s12
(maximum accordance); bs1 (absence of additiveand multiplicative effects); as0 (absence of bias).Good values of statistical parameters wereobserved for the comparison of the two ICP-OESfor Al, Fe, Mn, Ti, and V; for the comparisonbetween ICP-OES and ICP-MS for Cu, Mn, Ti, Vand Zn and between ICP-OES and GFAAS for Cr.
Fig. 5 shows data for Cr relative to comparisonsbetween ICP-OES vs. ICP-MS and GF-AAS tech-niques. The determination of Cr by ICP-MS52
suffers from spectral interference so measurementsmade by this technique gave less accurate resultsthan those obtained by ICP-OES and GF-AAS(Figs. 6–12).
3.3. Enrichment factors
According to the suggestions given by severalauthors we also analyzed the surface soil close tothe lichens collected in order to evaluate thecontribution of ‘soil effect’. In particular, eightsamples of lichens sp.Parmelia sulcataysoil col-lected from an agricultural area of Piacenza prov-ince (northern Italy), one lichen sp.Pseudoverniafurfureaysoil collected from a marine coastal areaof Sardinia and one lichen sp.Xantoria parietinaysoil collected in an industrial area of Latium(central Italy) were submitted to analytical proce-dures with and without use of HF.The enrichment factors for Pb, As and V in the
agricultural area of Piacenza, calculated on theelemental concentrations were determined accord-ing to the HF procedure, and considering Al andTi as soil markers are shown respectively in Figs.13–15. The good correlation obtained for the eightEF values indicates that if the solubilization iscorrectly performed, both the elements can be usedas normalizing factors.
150 M. Bettinelli et al. / Microchemical Journal 73 (2002) 131–152
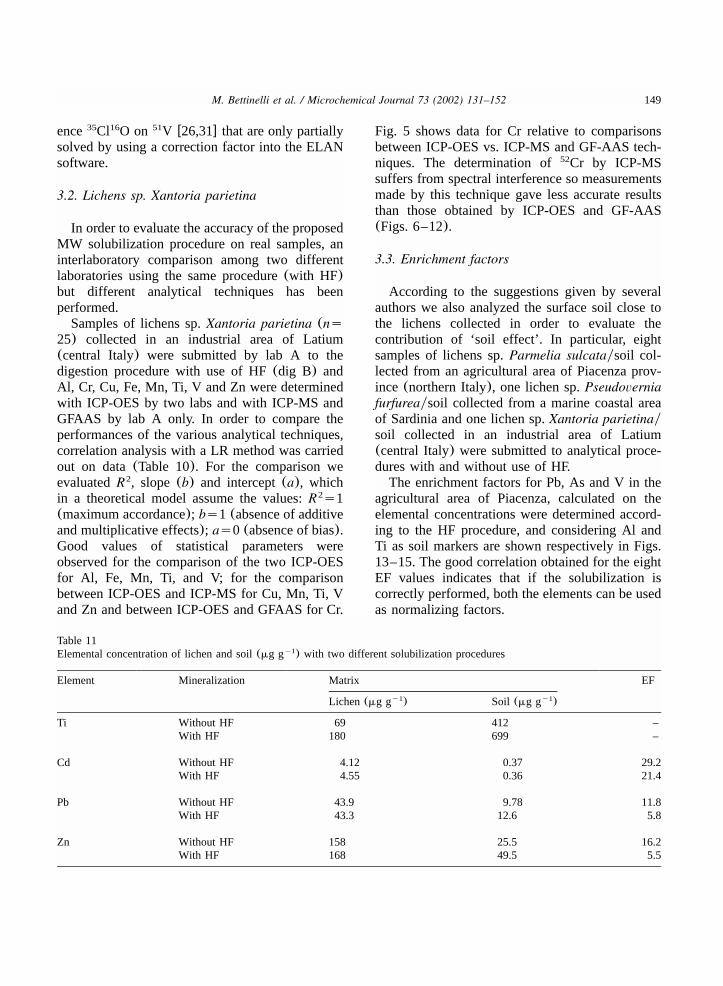
Fig. 17. Lichen sp.Xantoria parietina: comparison between the enrichment factors of trace elements calculated using Ti as markerof soil and determined according the two procedures considered in this work(partialymixture of HNOqH O ytotalymixture of3 2 2
HFqHNO qH O ).3 2 2
Samples collected in different areas character-ized with higher elemental concentrations canshow quite different values with EF values signif-icantly lower when a HF solubilization(i.e. Cd,Pb, Zn) was used.The differences shown in Fig. 16 for the lichen
collected from a marine coastal area of Sardinianot far from a mining area, could be attributableto a significant degree of solubilization of mineralcomponents present in the soil with and withoutHF.The results in Tables 10 and 11 confirm this
hypothesis according to which the use of HFmixture allows us to solubilize higher concentra-tions of marker present in the soil than in lichen;as a consequence, the relative EF will be altered.The situation appears completely different for
samples collected in an industrial region character-ized by higher concentrations of soilyatmosphericparticulate(Fig. 17). In this case, depending onthe natureymorphology of the particulate present,the use of a HF mixture shows that values of EFfor some elements(Cr, Ni, Pb and V) were alwayslower than those obtained by a procedure withHNO only.3
As many elements detected at EF)1 are con-
sidered by Bargagliw2x as markers for someantropogenic sources(i.e. Cr for smelting or pro-duction of ferrous metals, Ni and V for combustionof fuel oils, Pb for the emissions of mobilecombustion engines), it is evident that the simpleuse of a different solubilization procedure canaffect the analytical data and their finalinterpretation.
4. Conclusions
The aim of the present work was to demonstratethat the efficient mineralization of lichen sampleshas to include an unavoidable hydrofluoric attackperformed in a microwave oven. The proposedmethod ensures the decomposition of possibleanalytes associated with an insoluble residue inthe usually applied routine decomposition meth-ods, which use HNO and H O . The final solution3 2 2
is suitable for the analysis of trace elements byusing different spectroscopic techniques(ICP-MS,ICP-OES, GFAAS). In the analysis of real samplescharacterized by different masses of dust particu-late, the use of different solubilization proceduresstrongly affects the accuracy of the final results.Depending on the nature and morphology of the
151M. Bettinelli et al. / Microchemical Journal 73 (2002) 131–152
particulate present, the use of a HF mixture allowsus to obtain EF values for many elements lowerthan those obtained by a procedure with HNO3
only.
References
w1x A. Wyttenbach, S. Baio, L. Tobler, Major and traceelements in spruce needles by NNA, in: G.N. Schrauzer(Ed.), Biological Trace Element Research, HumanaPress, Clifton, UK, 1990, pp. 213–221.
w2x R. Bargagli, Chapter 8—Lichens as biomonitors andairborne trace elements, in: R. Bargagli(Ed.), TraceElements in Terrestrial Plants, Springer, Georgetown,TX, USA, 1998.
w3x R. Bargagli, The elemental composition of vegetationand the possible incidence of soil contamination sam-ples, Sci. Total Environ. 176(1995) 121–128.
w4x R. Bargagli, D.H. Brown, L. Nelli, Metal biomonitoringwith mosses: procedures for correcting for soil contam-ination, Environ. Pollut. 89(1995) 169–175.
w5x G. Wagner, Basic approaches and methods for qualityassurance and quality control in sample collection andstorage for environmental monitoring, Sci. Total Envi-ron. 176(1995) 63–71.
w6x B. Markert, Sample preparation(cleaning, drying,homogenization) for trace element analysis in plantmatrices, Sci. Total Environ. 176(1995) 45–61.
w7x J.M. Alcue, Comparison of different cleaning proceduresof root material for analysis of trace elements, Int. J.Environ. Anal. Chem. 62(1996) 137–145.
w8x M. Hoenig, Critical discussion of trace analysis of plantmatrices, Sci. Total Environ. 176(1995) 85–91.
w9x D.H.S. Richardson, M. Shore, R. Hartree, R.M. Rich-ardson, The use of X-ray fluorescence spectrometry forthe analysis of plants, especially lichens, employed inbiological monitoring, Sci. Total Environ. 176(1995)97–105.
w10x A. Vilsna, E.S. Lindgren, P. Standzenieks, Analysis ofpine needles by XRF scanning techniques, X-ray Spec-trom. 30(2001) 260–266.
w11x E. Damsgaard, K. Heydorn, Matrix problem in thecertification analysis of botanical materials by neutronactivation analysis, Sci. Total Environ. 176(1995)93–96.
w12x E.J. Gawalko, T.W. Nowicki, J. Babb, R. Tkachur,Comparison of closed-vessel and focused open-vesselmicrowave dissolution of cadmium, copper, lead, andselenium in wheat, wheat products, corn bran, and riceflour by transverse-heated graphite furnace atomicabsorption spectrometry, J. AOAC Int. 80(1997)379–387.
w13x C.B. Rhoades, Clean laboratory chemistry for the micro-wave-assisted digestion of botanical samples, JAAS 11(1996) 751–757.
w14x A. Krushevska, R.M. Barnes, C. Amarasiriwaradena,Decomposition of biological samples for inductivelycoupled plasma atomic emission spectrometry using anopen focused microwave digestion system, Analyst 118(1993) 1175–1181.
w15x D.H. Sun, J.K. Waters, T.P. Mawhinney, Microwavedigestion for determination of aluminum, boron and 13other elements in plants by inductively coupled plasmaatomic emission spectrometry, J. AOAC Int. 80(1997)647–650.
w16x J.S. Alvarado, T.J. Neal, L.L. Smith, M.D. Erickson,Microwave dissolution of plant tissue and the subse-quent determination of trace lanthanide and actinideelements by inductively coupled plasma-mass spectrom-etry, Anal. Chim. Acta 322(1996) 10–11.
w17x M. Hoenig, H. Baeten, S. Vanhentenrijk, E. Vassileva,Ph. Quevauviller, Critical discussion on the need for anefficient mineralization procedure for the analysis ofplant material by atomic spectrometric methods, Anal.Chim. Acta 358(1998) 85–94.
w18x H.J. Reid, S. Greenfield, T.E. Edmonds, Investigationof decomposition products of microwave digestion offood samples, Analyst 120(1995) 1543–1548.
w19x M. Bettinelli, S. Spezia, G. Bizzarri, Trace elementsdetermination in lichens by ICP-MS, Atom. Spectrosc.17 (1996) 133–141.
w20x R.M. Cenci, 1999, L’utilizzo di muschi indigeni etrapiantati per valutare in micro e macro aree le ricaduteal suolo di elementi in tracce: proposte metodologiche,in ANPA-Atti del Workshop ‘Biomonitoraggio dellaqualita dell’aria sul territorio nazionale’ Roma 26-27`novembre 1998, pp. 241–263.
w21x P.L. Nimis, R. Bargagli, 1999, Linee-guida per l’utilizzodi licheni epifiti come bioaccumulatori di metalli intraccia, in ANPA-Atti del Workshop ‘Biomonitoraggiodella qualita dell’aria sul territorio nazionale’ Roma 26–`27 novembre 1998, pp. 279–287.
w22x S. Fridlund, S. Littlefield, J. Rivers, The use of modifiedmicrowave digestionydissolution for the quantitativedetermination of aluminium, silicon and iron in biolog-ical materials by inductively coupled plasma spectrom-etry, Commun. Soil Sci. Plant Anal. 25(1994) 933–941.
w23x I. Novozamsky, R. van Eck, V.J.G. Houba, J.J.van der Lee, Solubilization of plant tissue with nitricacid-hydrofluoric acid-hydrogen peroxide in a closed-system microwave digestor, Commun. Soil Sci. PlantAnal. 27 (1996) 867–875.
w24x Ph. Quevauviller, D. Van Renterghem, H. Muntau, B.Griepink, Intercomparison to improve the quality oftrace element determination in lichens, Int. J. Environ.Anal. Chem. 53(1993) 233–242.
w25x Ph. Quevauviller, R. Herzig, H. Muntau, Certified ref-erence material of lichen(CRM 482) for the qualitycontrol of trace element biomonitoring, Sci. Total Envi-ron. 187(1996) 143–152.
w26x M. Bettinelli, U. Baroni, G. Bizzarri, Analisi di elementiin traccia in licheni e materiali vegetali mediante ICP-
152 M. Bettinelli et al. / Microchemical Journal 73 (2002) 131–152
MS, in: C. Minoia, M. Bettinelli, A. Ronchi, S. Spezia(Eds.), Applicazioni dell’ICP-MS nel laboratorio chim-ico e tossicologico, Morgan Edizioni Tecniche, Milano,2000, pp. 317–339.
w27x D. Ashley, Polyatomic interferences due to the presenceof inorganic carbon in environmental samples in thedetermination of chromium at the mass 52 by ICP-MS,Atom. Spectrosc. 13(1992) 169–173.
w28x ISO (International Organization for Standardization)5725, Precision of Test Methods—Determination ofRepeatability and Reproducibility for a Standard TestMethod by Interlaboratory Tests. In ISO Standard Hand-book 3, Statistical Methods, Geneve, Switzerland., 3rd`ed., 1989.
w29x M. Bettinelli, C. Baffi, G.M. Beone, S. Spezia, Soil andsediment analysis by spectroscopic techniques Part I:determination of Cd, Co, Cr, Cu, Mn, Ni, Pb and Zn,Atom. Spectrosc. 21(2000) 50–59.
w30x M. Bettinelli, C. Baffi, G.M. Beone, S. Spezia, Soil andsediment analysis by spectroscopic techniques Part II:determination of trace elements by ICP-MS, Atom.Spectrosc. 21(2000) 60–70.
w31x G. Lorenzini, 1999, I vegetali quali indicatori biologicidell’inquinamento atmosferico In: Le piante el’inquinamento dell’aria. Edagricole, Bologna, Italy. pp.247–279.