
International Journal of Innovation Engineering and Science ...
73
International Journal of Innovation Engineering and Science Research Editorial Board Dr. Mohammad I. Malkawi Associate Professor, Department of Software Engineering Dr. Kaveh Ostad-Ali-Askari Assistant Professor, Department of Civil Engineering, Isfahan (Khorasgan) Branch, Dr. Mohammed A. Akour Associate Professor in the Department of Software Engineering, Dr. Mohammad mehdi hassani Faculty of Computer Engineering Prof.Ratnakaram Venkata Nadh (Ph.D) Professor & Head - Chemistry Department, Dy. Director - Admissions Dr. SIDDIKOV ILKHOMJON KHAKIMOVICH Head of the Department of “Power Supply Systems”, Dr.S.DHANASEKARAN Associate Professor in the Department of Computer Science and Engineering, Younes El Kacimi, Ph. D. Science Faculty, Depatment of Chemistry Kénitra Denis Chemezov Lecturer, Vladimir Industrial College, Vladimir Jordan Iran Jordan Iran India Uzbekistan India Morocco Russia RICHARD O. AFOLABI, Ph.D. Department of Petroleum Engineering, Nigeria
-
Upload
khangminh22 -
Category
Documents
-
view
6 -
download
0
Transcript of International Journal of Innovation Engineering and Science ...

International Journal of Innovation
Engineering and Science Research
Editorial Board
Dr. Mohammad I. Malkawi
Associate Professor, Department of Software Engineering
Dr. Kaveh Ostad-Ali-Askari
Assistant Professor, Department of Civil Engineering, Isfahan (Khorasgan) Branch,
Dr. Mohammed A. Akour
Associate Professor in the Department of Software Engineering,
Dr. Mohammad mehdi hassani
Faculty of Computer Engineering
Prof.Ratnakaram Venkata Nadh (Ph.D)
Professor & Head - Chemistry Department, Dy. Director - Admissions
Dr. SIDDIKOV ILKHOMJON KHAKIMOVICH
Head of the Department of “Power Supply Systems”,
Dr.S.DHANASEKARAN
Associate Professor in the Department of Computer Science and Engineering,
Younes El Kacimi, Ph. D.
Science Faculty, Depatment of Chemistry Kénitra
Denis Chemezov
Lecturer, Vladimir Industrial College, Vladimir
Jordan
Iran
Jordan
Iran
India
Uzbekistan
India
Morocco
Russia
RICHARD O. AFOLABI, Ph.D.
Department of Petroleum Engineering, Nigeria

International Journal of Innovation
Engineering and Science Research
Volume 2 ISSUE 4 July-August 2018
A Back Propagation Neural Network Intrusion Detection System Based on KVMJiazuo Wang || Yan Wu
Effects of Kingcure K-11 Hardener and Epoxidized Sunflower Oil on The Properties of Polymer Composite Material Based on Epoxy Resin Gelr 128Bach TrongPhuc || Vu Huu Hung || Nguyen ThanhLiem || Nguyen TienPhong || Dao Van Chuong
Prediction of Poultry Yield Using Data Mining TechniquesAkanmode, E.R || Dr. N.D. Oye, || Celestine,H.R
Measuring the facility of use of a website designed with a methodology based on concepts of design of ontologiesJosé Antonio Zárate M. || Angélica Rosales L || Ma. Guadalupe Guerrero N. || BeatrizOralia Ríos V. Patricia Rivera A.
Usability study of a methodology based on concepts of ontology design to define website structuresJosé Antonio Zárate M. || Angélica Rosales L || Ma. Guadalupe Guerrero N. || Beatriz Oralia Ríos V. Francisco Javier Segura M.
Control of Direct Current Machine by the Change of Resistance in Armature CircuitBIYA MOTTO Frederic || TCHUIDJAN Roger || NDZANA Beno?t || TATSA TCHINDA COLINCE
The effect of using solar chimney on reduced heating load in cold climate of USMohammadmehdi Danesh
Numerical analysis of the density distribution within scored tabletsMoulay Saddik Kadiri || Hanafi Moussaoui

International Journal of Innovation Engineering and Science Research
Open Access
Volume 2 Issue 4 July-August 2018
1|P a g e
ABSTRACT
A Back Propagation Neural Network Intrusion
Detection System Based on KVM
Jiazuo Wang
Computer Science Department, Bowling Green State University
Bowling Green, OH, United States
Yan Wu
Computer Science Department, Bowling Green State University
Bowling Green, OH, United States
A Network Intrusion Detection System (NIDS) monitors a network for malicious activities or policy violations [1].
The Kernel-based Virtual Machine (KVM) is a full virtualization solution for Linux on x86 hardware virtualization
extensions [2]. We design and implement a back-propagation network intrusion detection system in KVM.
Compared to traditional Back Propagation (BP) NIDS, the Particle Swarm Optimization (PSO) algorithm is
applied to improve efficiency. The results show an improved system in terms of recall and precision along with
missing detection rates.
Keywords—NIDS, KVM, back-propagation, PSO algorithm
I. INTRODUCTION
The rapid development of cloud computing provides a new computing model for users with powerful
and cheap customized services including networks, servers, storage, and applications [2].
A. Background
The continuous improvement of cloud computing technology and competition among cloud providers
help users spend less in exchange for enhanced cloud resources. This enables legitimate users to
experience greater benefits by using cloud services with better quality. On the other hand, it
simultaneously enables malicious users to pay less to contract a substantial configuration of cloud
resources for launching an attack, which threatens other legitimate users on the same cloud platform.
The existing security technology in cloud computing environments is facing various problems, such as
large amounts of data, concurrent access, hardware resource sharing, and network compatibility.
Compared with traditional computer systems, cloud computing is more prone to large-scale, dangerous
attacks. Users store important information in the cloud platform from which malicious users may launch
attacks or steal information. The intruder may also use the powerful computing capabilities of the cloud
platform for malicious attacks on its own virtual machine. Typical attacks include the Resident attack,
Trojan, and Distributed Denial-of-Service (DDoS) attacks. In other words, with the rapid development of
cloud services, cloud computing applications are facing enhanced security threats.
B. Virtual Network Environment Security
The critical structural differences between cloud computing and traditional systems result in traditional
intrusion detection techniques not fitting in the cloud computing virtualization environment. All services
are provided by the server virtual machine where the security mechanism is deployed. To ensure the
safe operation of the virtual machine, the intrusion detection system must be installed on all virtual
machines on the same server in the cloud detection system. There are usually many virtual machines
on each cloud server, so the above scheme will require a significant amount of the cloud service
provider's computer resources, which greatly reduces the overall performance of the platform. To solve
this problem, the intrusion detection system is deployed on a privileged virtual machine, which is
responsible for the intrusion detection of all other virtual machines on the same server.
Today, mainstream network security technologies include encryption, firewall, and intrusion detection
systems. As a common intrusion detection technology, the artificial neural network (ANN) includes

Wu.et al. “International Journal of Innovation Engineering and Science Research”
Volume 2 Issue 4 July-August 2018
2|P a g e
capabilities such as nonlinear elastic modeling, strong generalization, learning, and large-scale parallel
computing [3]. The forward neural network is one of the most widely used neural networks, and the BP
neural network is one of the most commonly used feedforward neural networks. The BP network, also
known as the error back propagation network, is a multi-layer mapping network that transmits
information forward with the minimum error propagating backward. A single hidden layer BP neural
network can approximate any nonlinear function with arbitrary precision. This characteristic makes the
BP neural network a common nonlinear detection system.
II. LITERATURE REVIEW
A significant amount of literature exists on cloud computing virtualization security research. Ficco et al.
[4] introduce cloud computing in virtual environments and a variety of safety-related research results
from different aspects, such as IDS and honeypot. Patel et al. [5] and Su et al. [6] list and analyze a
variety of cloud computing environment intrusion detection technologies and the detection strategies.
Lee and Yu [7] summarize the detection and defense model in a cloud environment. To ensure the
security of a cloud computing network, an intrusion detection system (IDS) acts as the second line of
defense in the computer network. It is responsible for processing and analyzing key information from
internal and external computer networks to collect and then raise alarms for any violations of the
security policy. A new virtual self-checking system is proposed in [8] to protect Kernel-based Virtual
Machines (KVM) from a malicious attack on the virtual machine. However, the study needs to establish
a complete set of rules in advance. Nantes et al. proposed a way for IDS to establish an efficient model
to gain the optimal number of features with reduced usage of computer resources including memory
and CPU time [9]. To deal with a large number of network access streams, control data, and
applications in the cloud, Dhage and Meshram proposed a new multi-thread distributed intrusion
detection model, which effectively integrates knowledge and behavior analysis into intrusion detection
while processing, analyzing, and generating a large number of data streams [10]. However, this model
is more complex and offers low efficiency.
Also, Rocha and Correia [11] show how malicious insiders can steal confidential data, indicating that
the current cloud computing application environment contains many security vulnerabilities. Greamo
and Gosh [12] cited the impact of malware on the cloud computing environment, and Hegazy et al. [13]
use agent-based technology to describe the framework of intrusion detection in cloud computing.
HishamA.Kholidy et al. [1] presents a computational framework for an intrusion detection system (IDS)
deployed in all nodes including databases in the cloud, which may cause central server overload,
communication, and excessive computation cost of each node.
III. KEY TECHNOLOGY OF KVM AND IDS
A. KVM
Virtualization is the abstraction of computing resources, such as servers, networks, memory, and
storage, to enhance functionalities [14]. According to the definition of virtualization, a variety of
computer resources are virtual objects, such as software, hardware, and the network. The functions
available in the non-virtual environments can nearly all be realized in a virtual environment. Also, the
virtual computer resources are merely logical resources for users. KVM is a fully virtualized technology
based on the Linux environment and is responsible for the completion of the Linux kernel virtualization
features running on x86 and x64 architectures. It is a kernel module in the Linux kernel, which is a
virtual machine monitor in the Linux environment.
B. IDS
Two types of intrusion detection methods are common: misuse detection and anomaly detection [15].
Misuse detection first analyzes various possible intrusion behaviors and means, then summarizes the
special collection of rules. In the process of detection, the matching rule is used to process the
behavior of the detected object and then match the feature set and rule base. If the match is
successful, the behavior is considered an intrusion. Anomaly detection records the past normal

Wu.et al. “International Journal of Innovation Engineering and Science Research”
Volume 2 Issue 4 July-August 2018
3|P a g e
behavior to establish a normal behavior model. When the behavior of the system is significantly
different from the expected normal behavior, it is regarded as an intrusion behavior. Two common
techniques used for anomaly detection are neural networks and swarm intelligence algorithms.
Intrusion detection processes usually involve the following: the system first obtains the required
sample, then processes and analyzes the sample. Finally, the system proceeds according to the test
results.
C. Back-propagation Neural Network
A BP neural network contains an input layer, a hidden layer, and an output layer [16]. The signal
propagates forward by passing from the input layer to the output layer. The error is considered back
propagating as it modifies the weights and thresholds according to the gradient descent algorithm [16].
The specific process is described as follows.
1) Signal forward propagation
1. Obtain BP network training samples.
2. According to the structure and weight of the network, the signal passes from the input layer
to the output layer.
a. Calculate the output of the hidden layer as
Ah = f(W1TXh – b1), h∈[1,hSize] (1)
b. Calculate the output layer as
Ao = f(W2TXo – b2), o∈[1,oSize] (2)
In equations (1) and (2), hSize is the number of nodes in the hidden layer, oSize is the number of
nodes in the output layer, W1 and b1 represent the weights and thresholds of the input and hidden
layers, respectively, W2 and b2 represent the weights and thresholds of the hidden and output layers,
respectively, Ah is the output of the hidden layer, and Ao is the output of the output layer [17].
2) Error back propagation
1. Calculate the mean square error (MSE) value based on the real output and the desired
output of the network [17].
2. Adjust the weights and thresholds based on the method of minimizing errors.
The error signal passes from the output layer to the input layer. The weights are adjusted according to
the error feedback method, which gradually brings the actual output of the network close to the desired
output [17].
Δw(k +1)
= -η (∂Εk)/(∂ω
k ) + α∆w
k (3)
In equation (3), Δw(k +1)
is the modified vector of the first k+1 modification, ηis the learning rate, and Ek
is the error function of the neural network [17].
D. PSO algorithm
A BP network is very sensitive to the initial weights and thresholds. If the values and parameters are
not set properly, it may cause shock effect and slow the convergence speed [18]. In this paper, PSO is
used to search the optimal initial weights and thresholds of a BP neural network. PSO offers simple
calculation and good robustness as well as good performance in multi-dimension continuous space,
neural network training, combinatorial optimization, and other optimization problems. The primary
particle swarm optimization algorithm for position and velocity update [19] is expressed as: vi(t+1) =
ω(t)vi(t)+c1r1(pBesti(t) - xi(t))+ c2r2(gBest(t) - xi(t))
In this section, v represents speed, x represents the location, i is the current particle number, t is the
current number of iterations, c1 and c2 are learning factors, r1 and r2 are random values in [0,1], PBest
is the individual extremum for a single particle, and GBest is the global extremum found for the whole
particle swarm [19].
Because of an increasing number of users in cloud computing and the cloud expansion of application
environments, a malicious intrusion or attack on a cloud environment can interfere with the availability,
confidentiality, and integrity of the resources and services of cloud computing service providers. An

Wu.et al. “International Journal of Innovation Engineering and Science Research”
Volume 2 Issue 4 July-August 2018
4|P a g e
IDS, as a kind of active monitoring technology and protection mechanism, can prevent the destruction
of critical IT infrastructure. Intruders can destroy sensitive data and critical applications through network
attacks.
IDS can be divided into the two categories of misuse detection and anomaly detection [15]. Previously,
IDS could protect the cloud system from various types of attacks, but could not identify suspicious
activities in a cloud environment. IDS can also be classified based on the source of the data. Host-
based IDS intrusion detection sensors are focused on a single host, while IDS based on the network
will put all the sensors on a sensor network segment. The anomaly detection mechanism can improve
the ability of the system to detect unknown intrusion attacks, which is especially important in the virtual
network model.
IV. METHODOLOGY
Based on the analysis of the KVM network structure, this paper proposes an intrusion detection model
based on an improved BP neural network and a KVM NAT bridge structure. First, this model analyzes
the KVM network model and uses the NAT bridge pattern to design the data capture module to retrieve
the virtual machine’s communication information. Next, it analyzes and extracts the data packets in
turn, then sends the data to the neural network detection engine.
Several modules are included in this model. The data capture module sets the data capture mode
based on the network mode of the virtual environment and submits the captured data to the data
packet analysis module. The packet-parsing module analyzes the captured data packets based on the
network protocol and submits the analytical results to the feature extraction module. Based on the
characteristics of the intrusion detection system, the feature extraction module extracts the specific
features from the data [20]. Based on the improved BP neural network algorithm, the engine
determines whether the data is the invasion of the data, and the results are submitted to the intrusion
response module.
Because the performance of the BP algorithm is largely dependent on the initial weights and
thresholds, this research to improve the BP network is important to improve the convergence speed of
the network. In this report, the PSO algorithm is introduced to optimize the initial weights and
thresholds of the BP. The algorithm is based on momentum factor, adaptive learning rate, and PSO.
The design idea of the algorithm is as follows: The system combines the global search ability of the
PSO algorithm and the gradient descent local search of the BP algorithm. The PSO algorithm is
introduced into the optimization of the initial weights and thresholds of the BP. By using the momentum
factor and adaptive learning rate methods, the convergence speed of the BP neural network is
accelerated, and the local minimum is avoided. Finally, the algorithm is used to build an intrusion
detection system in a cloud environment.
The specific process of the algorithm includes the following steps:
Step 1: initialize the parameters of BP neural network, set the number of nodes in each layer.
Step 2: initialize the parameters of the particle swarm and calculate the particle dimension D. The
system initializes the cluster and generates parameters, such as the initial position and the velocity of
the particle.
Step 3: calculate the fitness value of each particle compared with the current best fitness value,
PBest. If the value is better, update PBest. Then, compare the PBest with the optimal global value of
GBest. If the value is better, then use PBest to update GBest.
Step 4: update the inertia weight and adjust the position and speed of the particle.
Step 5: if current iteration achieves the maximum or error is in the scope, the initial weights and
thresholds should be the current global extreme GBest, otherwise, return to Step 3.
Wu.et al. “International Journal of Innovation Engineering and Science Research”
Volume 2 Issue 4 July-August 2018
5|P a g e
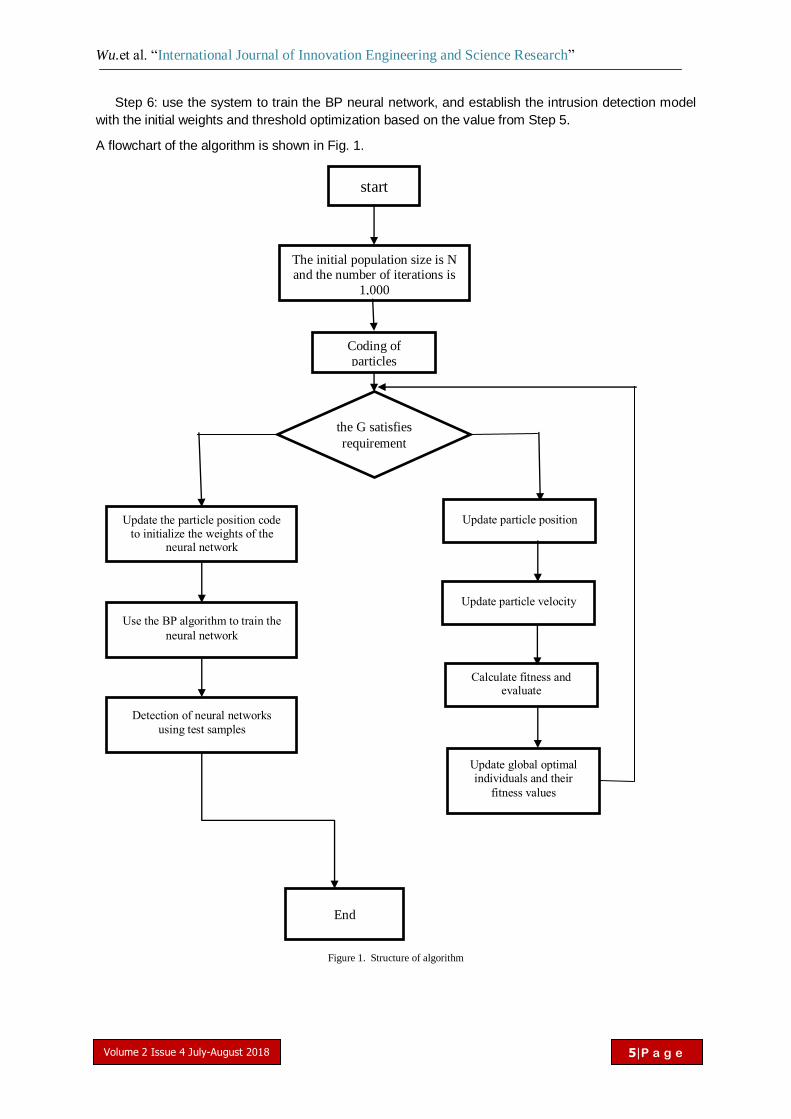
Step 6: use the system to train the BP neural network, and establish the intrusion detection model
with the initial weights and threshold optimization based on the value from Step 5.
A flowchart of the algorithm is shown in Fig. 1.
Figure 1. Structure of algorithm
start
The initial population size is N and the number of iterations is
1,000
Coding of
particles
the G satisfies
requirement
Update the particle position code to initialize the weights of the
neural network
Update particle position
Use the BP algorithm to train the
neural network
Detection of neural networks
using test samples
End
Update particle velocity
Calculate fitness and evaluate
Update global optimal individuals and their
fitness values

Wu.et al. “International Journal of Innovation Engineering and Science Research”
Volume 2 Issue 4 July-August 2018
6|P a g e
To illustrate the feasibility and effectiveness of this algorithm, its performance is analyzed with
experiments using the intrusion detection dataset KDD Cup 99 [21]. This is a commonly-used intrusion
detection algorithm training and testing data set, which includes the majority of the types of attacks
faced by cloud computing virtualization environments.
Each sample (connection record) in the KDD dataset contains 42 attributes, and their details and serial
numbers are presented in Table I.
TABLE I.PROPERTIES OF RECORDS [21].
SID property SID property SID property
1 Duration 15 Su_attempted 29 Sam_srv_rate
2 Protocol_type 16 Num_root 30 Diff_srv_rate
3 Service 17 Num_file_creations 31 Srv_diff_host_rate
4 Flag 18 Num_shells 32 Dst_host_count
5 Src_bytes 19 Num_access_file 33 Dst_host_srv_count
6 Dst_bytes 20 Num_outbound_cmds 34 Dst_host_same_srv_rate
7 Land 21 Is_hot_login 35 Dst_host_diff_srv_rate
8 Wrong_fragment 22 Is_guest_login 36 Dst_host_same_src_prot_rate
9 Urgent 23 Count 37 Dst_host_srv_diff_host_rate
10 Hot 24 Srv_cound 38 Dst_host_ serror_rate
11 Num_failed_logins 25 Serror_rate 39 Dst_host_srv_serror_rate
12 Logged_in 26 Srv_serror_rate 40 Dst_host_rerror_rate
13 Num_compromised 27 Rerror_rate 41 Dst_host_srv_rerror_rate
14 Root_shell 28 Srv_rerror_rate 42 Normal_or_attack
There is a significant difference between the values and data types of each attribute for each original
sample in the KDD dataset. In addition, the range of the BP neural network training data and test data
should be consistent with the range of the activation function of the neurons in each layer. Also, the
input attributes should be numeric values. Therefore, to apply the KDD data to the BP neural network
detection model, we need to preprocess the original KDD data samples.
The neural network is trained and tested using the test data, and the experimental results are
subsequently compared with the ordinary BP algorithm. The metrics include accuracy, precision, and
recall. Accuracy is defined as the ratio of the number of samples correctly classified to the total sample
size for a given test set. Precision shows the percentage of positive samples among all reported. The
recall rate is for the original sample indicating how many of the positive samples in the sample are
correctly predicted.
In this experiment, three layers of the BP neural network are selected, and the number of neuron in
each layer is all in the order of 1. The input layer and the hidden layer activation function use a tangent
S-type function. Since the number of samples is 42, the number of neurons in the input layer is also 42.
If the output results can be judged as intrusion behavior, the number of neurons in the output layer is 1,
thus obtaining o = 1. The number of neurons in the hidden layer settings has no normative theoretical
guidance. The usual method is based on many experiments to determine the appropriate number of
neurons. After the experiment, the hidden layer node is set to 22.
The particle size of the PSO algorithm is determined according to the particle coding and obtain the
dimension D = 969. In this paper, the population size N = 30, the maximum velocity of the particle is set
to 3, the minimum speed is -3, and the search space of the particle is set to [-1,1]. The velocity and
trajectory of the particles depend on the set of learning factors G, O and the inertia weight W, which
have great influence on the global search ability and convergence speed of the particle swarm. To
ensure better global search ability and local search performance, we set C1 = C2 = 2 and w = 0.7.

Wu.et al. “International Journal of Innovation Engineering and Science Research”
Volume 2 Issue 4 July-August 2018
7|P a g e
V. RESULTS
First, the performance of the PSO algorithm is analyzed by looking at the change tendency of the
fitness function of the PSO algorithm for the training data. We used the training data to carry out 50
experiments on the PSO, and the average values were calculated. The results show that the MSE
value reaches the minimum value of 0.015 when the PSO algorithm runs in about 150 iterations, which
is the optimal particle, and it can be decoded as the initial weight and threshold value of the artificial
neural network.
To analyze the performance of the system, ten experiments were carried out. The accuracy results of
these two algorithms are shown in Fig. 2, precision results are shown in Fig. 3, and recall results are
shown in Fig. 4.
Figure 2. The accuracy of the two algorithms.
Figure 3. The precision of the two algorithms. Figure 4. The recall of two algorithms.
As seen from the figures, the accuracy of the PSO-BP algorithm is slightly higher than the pure BP
algorithm. First, the momentum factor and the adaptive rate algorithm introduced by the PSO-BP
algorithm accelerated the convergence speed of the BP algorithm and avoided falling into a local
minimum. Second, the PSO algorithm has a significant advantage in global optimization to enable a
more stable precision compared to the traditional BP algorithm. Also, as seen in Figure 4, the recall of
the PSO-BP algorithm is slightly better than the traditional BP algorithm.
0.82
0.84
0.86
0.88
0.9
0.92
0.94
0.96
1 2 3 4 5 6 7 8 9 10
BP PSO-BP
0.85
0.9
0.95
1
1.05
1 2 3 4 5 6 7 8 9 10
BP PSO-BP
0.94
0.96
0.98
1
1 2 3 4 5 6 7 8 9 10
BP PSO-BP
Wu.et al. “International Journal of Innovation Engineering and Science Research”
Volume 2 Issue 4 July-August 2018
8|P a g e
In summary, the overall detection performance of the proposed PSO-BP detection algorithm is superior
to the traditional BP detection algorithm.
VI. CONCLUSION
This paper presents a virtual intrusion detection model based on different types of virtual network
structures in KVM. The model is implemented in the KVM network model of a NAT bridge, including the
data capture, packet parsing, feature extraction, and neural network detection modules. It is compatible
with different network modes in KVM virtualization environments and can capture, process, and
analyze the virtual machine communication data flow under different network modes. It provides
intrusion detection services for a cloud computing virtualization environment and responds to the
attacks of malicious virtual machines.
Aiming at the problem that a BP algorithm is easy to fall into a local minimum [22], this paper proposes
an improved BP detection algorithm based on the PSO algorithm, which combines the global search
ability of the PSO algorithm and the gradient descent local search of the BP algorithm. The PSO
algorithm is introduced to optimize the initial weights and threshold values of the BP algorithm [23]. By
using momentum factor and adaptive learning rate method [24], the convergence speed of BP neural
network is accelerated and prevented from falling into a local minimum, which improves the detection
performance of the algorithm. The experimental results show that the average detection rate of the
improved algorithm is higher. It has better detection performance, and can effectively and reliably
provide intrusion detection services for cloud computing environments.
REFERENCES
[1] H. A. Kholidy and F. Baiardi, “CIDS: A framework for intrusion detection in cloud systems,” 2012 Ninth International
Conference on Information Technology: New Generations (ITNG), IEEE Press, Las Vegas, Nevada, USA, April 16-
18,2012,pp.379-385.
[2] S. de Chaves, C. Westphall, and F. Lamin. "SLA Perspective in Security Management for Cloud Computing," 2010 Sixth
International Conference on Networking and Services, 2010.
[3] C. Modi, D. Patel, B. Borisaniya, H. Patel, A. Patel, and M. Rajarajan, "A survey of intrusion detection techniques in
Cloud," Journal of Network and Computer Applications, vol. 36, no. 1, pp. 42-57, 2013.
[4] M. Ficco, L. Tasquier, and R. Aversa, "Intrusion Detection in Cloud Computing," 2013 Eighth International Conference on
P2P, Parallel, Grid, Cloud and Internet Computing, 2013.
[5] A. Patel, M. Taghavi, K. Bakhtiyari, and J. Celestino Júnior, "An intrusion detection and prevention system in cloud
computing: A systematic review," Journal of Network and Computer Applications, vol. 36, no. 1, pp. 25-41, 2013.
[6] Chien-Chung Su, Ko-Ming Chang, Yau-Hwang Kuo, and Mong-Fong Horng, "The new intrusion prevention and detection
approaches for clustering-based sensor networks," IEEE Wireless Communications and Networking Conference, 2005.
[7] Sheng-Wei Lee and Fang Yu, "Securing KVM-Based Cloud Systems via Virtualization Introspection," 2014 47th Hawaii
International Conference on System Sciences, 2014.
[8] H. Wang, H. Zhou, and C. Wang, "Virtual Machine-based Intrusion Detection System Framework in Cloud Computing
Environment," Journal of Computers, vol. 7, no. 10, 2012.
[9] A. Nantes, R. Brown, and F. Maire, "Neural network-based detection of virtual environment anomalies," Neural Computing
and Applications, vol. 23, no. 6, pp. 1711-1728, 2012.
[10] S. Dhage and B. Meshram, "Intrusion detection system in cloud computing environment," International Journal of Cloud
Computing, vol. 1, no. 23, p. 261, 2012.
[11] F. Rocha and M. Correia, "Lucy in the sky without diamonds: Stealing confidential data in the cloud," 2011 IEEE/IFIP 41st
International Conference on Dependable Systems and Networks Workshops (DSN-W), 2011.
[12] C. Greamo and A. Ghosh, "Sandboxing and Virtualization: Modern Tools for Combating Malware," IEEE Security &
Privacy Magazine, vol. 9, no. 2, pp. 79-82, 2011.
[13] I. Hegazy, T. Al-Arif, Z. Fayed, and H. Faheem, "A multi-agent based system for intrusion detection," IEEE Potentials, vol.
22, no. 4, pp. 28-31, 2003.
[14] M. Laureano, C. Maziero, and E. Jamhour, "Intrusion detection in virtual machine environments," Proceedings of the 30th
Euromicro Conference, 2004.
[15] X. Zhang, Q. Li, S. Qing, and H. Zhang, "VNIDA: Building an IDS Architecture Using VMM-Based Non-Intrusive
Approach," First International Workshop on Knowledge Discovery and Data Mining (WKDD 2008), 2008.

Wu.et al. “International Journal of Innovation Engineering and Science Research”
Volume 2 Issue 4 July-August 2018
9|P a g e
[16] J. Ticknor, "A Bayesian regularized artificial neural network for stock market forecasting," Expert Systems with
Applications, vol. 40, no. 14, pp. 5501-5506, 2013.
[17] L. Wang, Y. Zeng, J. Zhang, W. Huang, and Y. Bao, "The Criticality of Spare Parts Evaluating Model Using Artificial Neural
Network Approach," Computational Science – ICCS 2006, pp. 728-735, 2006.
[18] A. Aslanargun, M. Mammadov, B. Yazici, and S. Yolacan, "Comparison of ARIMA, neural networks and hybrid models in
time series: tourist arrival forecasting," Journal of Statistical Computation and Simulation, vol. 77, no. 1, pp. 29-53, 2007.
[19] J. Zhang, J. Zhang, T. Lok, and M. Lyu, "A hybrid particle swarm optimization–back-propagation algorithm for feedforward
neural network training," Applied Mathematics and Computation, vol. 185, no. 2, pp. 1026-1037, 2007.
[20] J. Vesterstrom and R. Thomsen, "A comparative study of differential evolution, particle swarm optimization, and
evolutionary algorithms on numerical benchmark problems," Proceedings of the 2004 Congress on Evolutionary
Computation (IEEE Cat. No.04TH8753).
[21] R. Eberhart and J. Kennedy, "A new optimizer using particle swarm theory," MHS'95. Proceedings of the Sixth
International Symposium on Micro Machine and Human Science, 1995.
[22] S. Bharadwaja, W. Sun, M. Niamat, and F. Shen, "Collabra: A Xen Hypervisor Based Collaborative Intrusion Detection
System," 2011 Eighth International Conference on Information Technology: New Generations, 2011.
[23] P. Angin, B. Bhargava, R. Ranchal, N. Singh, M. Linderman, L. Othmane, and L. Lilien, "An Entity-Centric Approach for
Privacy and Identity Management in Cloud Computing," 29th IEEE Symposium on Reliable Distributed Systems, 2010.
[24] J. Arshad, P. Townend, and J. Xu, "An automatic intrusion diagnosis approach for clouds," International Journal of
Automation and Computing, vol. 8, no. 3, pp. 286-296, 2011.

International Journal of Innovation Engineering and Science Research
Open Access
Volume 2 Issue 4 July-August 2018
10|P a g e
ABSTRACT
Effects of Kingcure K-11 Hardener and Epoxidized Sunflower Oil on The Properties of Polymer
Composite Material Based on Epoxy Resin Gelr 128
Bach TrongPhuc
Polymer Centre, Hanoi University of Science and Technology.
Hanoi, Vietnam
Vu Huu Hung Ministry of Public Security,
Hanoi, Vietnam
Nguyen ThanhLiem Polymer Centre, Hanoi University of Science and Technology.
Hanoi, Vietnam
Nguyen TienPhong Ministry of Public Security,
Hanoi, Vietnam
Dao Van Chuong Ministry of Public Security,
Hanoi, Vietnam
Epoxidized sunflower oil (ESO) has been used to toughen epoxy resin GELR 128 cured with an accelerated
aliphatic amine curing agent (Kingcure K-11) at room temperature. There was difference in the properties of the
polymer composite materials based on epoxy resin GELR 128 cured by Kingcure K-11 between two processes:
one-stage process and two-stage process for mixing ESO with epoxy resin GELR 128 at various content of ESO.
The results showed that the two-stage process is considered to be more advantageous than the one-stage
process. It can be concluded that the impact strength, critical stress intensity factor Kic and decomposition
temperature of the polymer composite materials based on epoxy resin GELR 128 cured by Kingcure K-11 with
content of ESO 5 phr in two-stage process was greater ones in one-stage process (impact strength: 35.012
kJ/m2, Kic: 2.72 MPa and decomposition temperature: 385.81 0C respectively).
Keywords—accelerated aliphatic amine curing agent, epoxidized sunflower oil, epoxy resin GELR 128, toughness, two processes, polymer composite materials.
I. INTRODUCTION
Epoxy resin was used as a glue agent from the mid 20thcentury with special initial properties such
as high elasticity, mechanical properties, chemical inertia [1, 2]. However, when epoxy resins are used
extensively in other different fields, they are denatured for increased brilliance due to the increased
bonding of the polymer molecules [2-4]. This makes epoxy resin easy to peel as well as reduced
impact resistance [5]. Nowadays, many research projects is aiming to reduce the brittle strength of
epoxy resins, some of them was done by mixing carbon nanotube, oil, liquid rubber particles, or silica

Bach TrongPhucet al. “International Journal of Innovation Engineering and Science Research”
Volume 2 Issue 4 July-August 2018
11|P a g e
particles, .... [2, 6-11]. Furthermore, materials for these methods are non-renewable. Therefore,
methods of using renewable natural resources are one of the best choose that attract the attention of
many researchers [12-14]. We also used the vegetable epoxide oil as a blend of epoxy resins to
increase the durability and strength of epoxy resins without compromising the modulus and thermal
properties of the material.
This study investigated the effect of an accelerated aliphatic amine curing agent (Kingcure K-11) and
epoxidized sunflower oil (ESO) on the tensile strength, flexural strength, modulus of elasticity, critical
stress intensity factor and thermal property of the polymer composite materials based on epoxy resin
GELR 128 in two processes: one-stage process and two-stage process at room temperature.
II. EXPERIMENT
A. Material
- Epoxy resin used in this study was DGEBA supplied by Epoxy Base Electronic Material Corporation
Limited of China (GELR 128) which had an epoxide equivalent weight (EEW) of 184-190g eq-1 and a
viscosity at 250C: 11-15 Pa.s;
- Epoxidized sunflower oil (ESO) was synthesized by using ion exchange method. The content of
epoxy group is 16.45% with oxiran value 6.12.
- Kingcure K-11 (KK1) is an accelerated aliphatic amine curing agent in an amber-colored liquid form
was purchased from Sanho Chemical Co.,LTD (Taiwan) (density 1.04 g/cm3 at 250C, viscosity at
250C: 1000-2000 mPa.s, amine value: 430±20 mgKOH/g and Active Hydrogen Equivalent Weight
(AHEW): 93).
B. Modified epoxy resins
Modified epoxy resins were prepared by mixing DGEBA GELR 128 and epoxidized sunflower oil in two
processes:
One-stage process: the various amount of ESO (0 - 30 phr) was added into 100 g of epoxy resin GELR 128 in
250 ml glass beakers, stirring for 45 minutes. Then KK1 was added with a pre-calculated ratio and stirred for 5
minutes. The all components were poured into a mold for curing at room temperature.
Two-stage process: Mixing ESO and KK1 in a 3-necked 250-well flask were stirred for 15 hours, adding epoxy
resin GELR 128 and continued stirring for 5 minutes and then poured the mixture into the mold to cure at room
temperature.
C. Research methods
- The morphologies at the fracture surfaces of the epoxy samples were evaluated from Scanning Electron
Microscopy (SEM) on Hitachi (Japan) S4800 at the main laboratory, Institute of Materials Science - Vietnam
Academy of Science and Technology
- Thermal stability was studied by simultaneous thermos gravimetric analyzer (TGA) by SETARAM TG under
a heating rate of 100C/min. within a temperature range of ambient room temperature to 8000C at Hanoi
University of Sciences, Hanoi National University.
- The tensile strength was determined according to ISO 527-2012 on the INSTRON 5582-100kN (USA) with
the crosshead speed of 2mm/min at the Polymer Centre, Hanoi University of Science and Technology.
- The flexural strength was determined according to ISO 178 on the INSTRON 5528-100kN (USA) with the
crosshead speed of 2mm/min at the Polymer Centre, Hanoi University of Science and Technology.
- Izod impact strength was determined according to ISO 180 on the Tinius Olsen Model 92T (USA) at the
Polymer Centre, Hanoi University of Science and Technology.
- The critical stress intensity factor, KIC value was determined according to ASTM D5045-99 by three point
sidedon a Lloyd 500N (UK) with the crosshead speed of 10mm/min at the Polymer Centre, Hanoi University of
Science and Technology.

Bach TrongPhucet al. “International Journal of Innovation Engineering and Science Research”
Volume 2 Issue 4 July-August 2018
12|P a g e
III. RESULTS
A. Morphological structure
Scanning electron microscopy of modified epoxy resin GELR 128 without ESO and with 15, 20 phr ESO are
shown in Figure 1. From Figure 1 (a), the unmodified epoxy resin GELR 128 has smooth surface as a mirror
with cracks in different surfaces characterize which is the lower impact strengths of thermoplastic resins. The
fractured surface of the modified ESO epoxy resin GELR 128 consists of two distinct phases: spherical resins
dispersed in a continuous epoxy network. The seeds are about 1-2 μm in diameter. KK1 is a polyamine that
interacts with epoxy resin GELR-128 higher than ESO's epoxy group so that it forms a durable grid while epoxy
sunflower oil decomposes into second phase as small liquid droplets (Figure 1b). The surface of epoxy resin
GELR 128 with added ESO has an uneven roughness profile as unmolded epoxy resin GELR 128, which shows
the durability of the material. For the two-stage process the appearance of seeds which show an fluctuate surface
on the broken area (Fig 1c)
Figure 1SEM images of modified epoxy resin GELR 128 a) without ESO b) one- stage process with 15 phr ESO c) two-stage
process with 20 phr ESO
B. Mechanical properties
The results of tensile and flexural properties of epoxy resin GELR 128 were denominated in two processes with
and without epoxidized sunflower oil as shown in Table 1. The tensile strength of epoxy resin GELR-128
without ESO is 63.08 MPa with high flexural strength (103.4 MPa) and low modulus (2.94 GPa) which showed
the hardness and brilliance of epoxy resin. When ESO is added, tensile strength and flexural strength decrease in
proportion to the increase in the amount of ESO in the one-stage process. Phase separation also does not affect
the reduction of tensile strength and flexural strength in the two-stage process due to the presence of low
modulus phases in the epoxy network. This suggests that epoxy resin GELR 128 with ESO is more resilient than
epoxy resin GELR 128 without the addition of a modified substance. In both process, tensile strength decreases
gradually as increase the amount of ESO from 10-30 phr. This trend is similar to the flexural strength value, but
Bach TrongPhucet al. “International Journal of Innovation Engineering and Science Research”
Volume 2 Issue 4 July-August 2018
13|P a g e
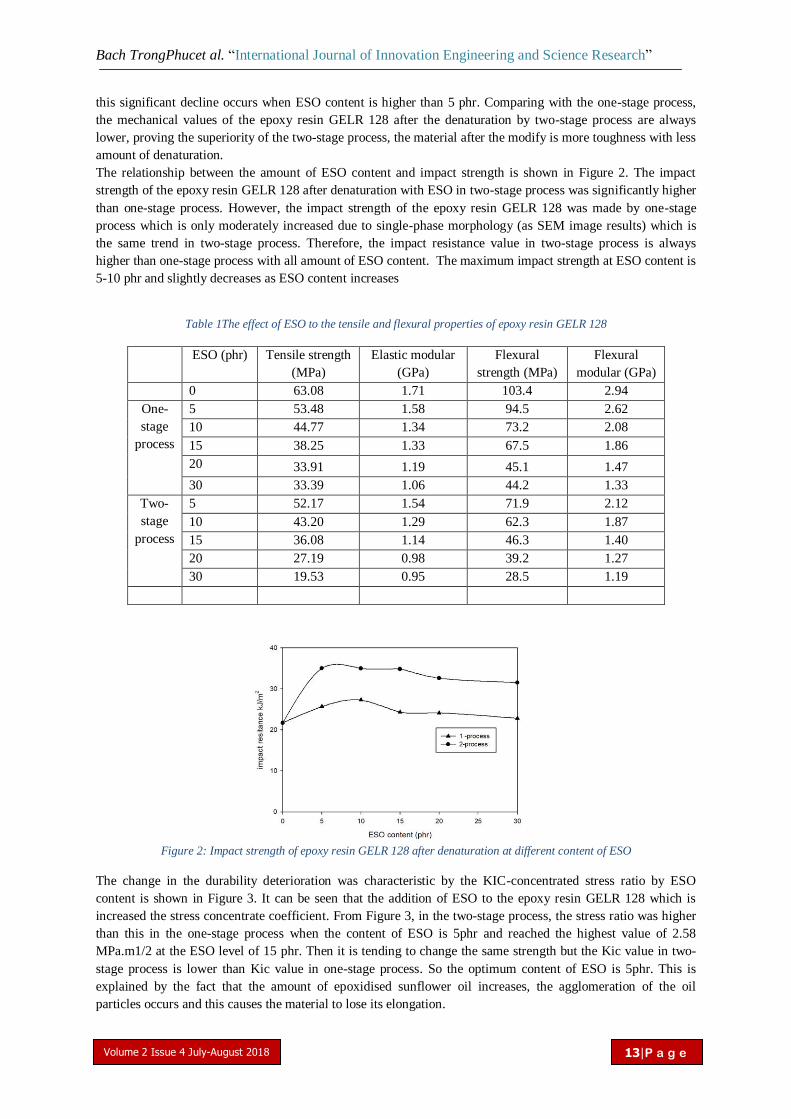
this significant decline occurs when ESO content is higher than 5 phr. Comparing with the one-stage process,
the mechanical values of the epoxy resin GELR 128 after the denaturation by two-stage process are always
lower, proving the superiority of the two-stage process, the material after the modify is more toughness with less
amount of denaturation.
The relationship between the amount of ESO content and impact strength is shown in Figure 2. The impact
strength of the epoxy resin GELR 128 after denaturation with ESO in two-stage process was significantly higher
than one-stage process. However, the impact strength of the epoxy resin GELR 128 was made by one-stage
process which is only moderately increased due to single-phase morphology (as SEM image results) which is
the same trend in two-stage process. Therefore, the impact resistance value in two-stage process is always
higher than one-stage process with all amount of ESO content. The maximum impact strength at ESO content is
5-10 phr and slightly decreases as ESO content increases
Table 1The effect of ESO to the tensile and flexural properties of epoxy resin GELR 128
ESO (phr) Tensile strength
(MPa)
Elastic modular
(GPa)
Flexural
strength (MPa)
Flexural
modular (GPa)
0 63.08 1.71 103.4 2.94
One-
stage
process
5 53.48 1.58 94.5 2.62
10 44.77 1.34 73.2 2.08
15 38.25 1.33 67.5 1.86
20 33.91 1.19 45.1 1.47
30 33.39 1.06 44.2 1.33
Two-
stage
process
5 52.17 1.54 71.9 2.12
10 43.20 1.29 62.3 1.87
15 36.08 1.14 46.3 1.40
20 27.19 0.98 39.2 1.27
30 19.53 0.95 28.5 1.19
Figure 2: Impact strength of epoxy resin GELR 128 after denaturation at different content of ESO
The change in the durability deterioration was characteristic by the KIC-concentrated stress ratio by ESO
content is shown in Figure 3. It can be seen that the addition of ESO to the epoxy resin GELR 128 which is
increased the stress concentrate coefficient. From Figure 3, in the two-stage process, the stress ratio was higher
than this in the one-stage process when the content of ESO is 5phr and reached the highest value of 2.58
MPa.m1/2 at the ESO level of 15 phr. Then it is tending to change the same strength but the Kic value in two-
stage process is lower than Kic value in one-stage process. So the optimum content of ESO is 5phr. This is
explained by the fact that the amount of epoxidised sunflower oil increases, the agglomeration of the oil
particles occurs and this causes the material to lose its elongation.

Bach TrongPhucet al. “International Journal of Innovation Engineering and Science Research”
Volume 2 Issue 4 July-August 2018
14|P a g e
Figure 3Stress concentrate coefficient KIC of epoxy resin GELR 128 after modification at various ESO content
From the previous survey results, epoxy resin GELR 128 with curing by polyamine show the promised
properties with the low content of nature oil. Our results show that the content of ESO 5phr was chosen as the
suitable ratio to improve the mechanical properties of epoxy resin GELR 128
C. The thermal properties
Figure 4The TGA of a) epoxy resin GELR 128, epoxy resin GELR 128 modified with ESO by b) one-stage process, c) two-
stage process.
From the results of TGA (table 2 and figure 4), the opposite strength shows which are decrease the maximum
decomposition temperature in one-stage process and increase in two-stage process compare with the neat epoxy
resin GELR 128 sample. It can conclude that in two-stage process the reaction reach higher yield than in one-
stage process In other way, compare with the SEM image (Fig 1), the content of the oil drop in one-stage
process made the decompose temperature lower.

Bach TrongPhucet al. “International Journal of Innovation Engineering and Science Research”
Volume 2 Issue 4 July-August 2018
15|P a g e
Table 2Effect of ESO content on the maximum decomposition (MDT) temperature of epoxy resin GELR 128
Number ESO content (phr) MDT, oC
1 0 382.6
2 10
(one-stage process)
381.01
3 5
(two-stage process)
385.81
.
IV. CONCLUSION
The results of the toughen epoxy resin GELR 128 with epoxidized sunflower oil (ESO) cured by an
accelerated aliphatic amine curing agent (Kingcure K-11) have shown some promised results. The two-
stage process is considered to be more better than one-stage process in tough epoxy resin GELR 128.
The impact strength, critical stress intensity factor Kic and decomposition temperature of the polymer
composite materials based on epoxy resin GELR 128 cured by Kingcure K-11 with content of ESO 5
phr in two-stage process was greater ones in one-stage process
ACKNOWLEDGMENT
The authors gratefully acknowledge National Key Laboratory of Polymer and Composite Materials,
Hanoi University of Science and technology, Polymer Centre (HUST) for financial and equipment
support.
REFERENCES
[1] SOO-JIN PARK, H.-C.K., Thermal Stability and Toughening of Epoxy Resin with Polysulfone Resin. Journal of Polymer
Science: Part B: Polymer Physics, vol.39. pp. 121-128, November 2000.
[2] Liu, S., X. Fan, and C. He, Improving the fracture toughness of epoxy with nanosilica-rubber core-shell nanoparticles.
Composites Science and Technology, vol 125, pp. 132-140,March 2016.
[3] Benaniba, M.T., N. Belhaneche-Bensemra, and G. Gelbard, Kinetics of tungsten-catalyzed sunflower oil epoxidation
studied by1H NMR. European Journal of Lipid Science and Technology, vol 109(2), pp. 1186-1193, December 2007.
[4] Ratna, D., Mechanical properties and morphology of epoxidized soyabean‐oil‐modified epoxy resin. Polymer international,
vol 50(2), pp. 179-184January 2001.
[5] Ratna, D., R. Varley, and G. Simon, Processing and chemorheology of epoxy resins and their blends with dendritic
hyperbranched polymers. Journal of applied polymer science, vol 92(3), pp 1604-1610 March 2004.
[6] Banthia2*, D.R.a.A.K., Toughened epoxy adhesive modified with acrylate based liquid rubber. Polymer International, vol.
49, pp. 281-287.February 2000.
[7] BROWN, S.C.K.H.R., Impact-modified epoxy resin with glassy second component. JOURNAL OF MATERIALSSCIENCE,
vol. 22, pp 2587-2594.November 1987.
[8] Chen, Y., Z. Xi, and L. Zhao, New bio-based polymeric thermosets synthesized by ring-opening polymerization of
epoxidized soybean oil with a green curing agent. European Polymer Journal, vol. 84, pp. 435-447, November 2016.
[9] G. Di Pasquale, O.M.o.t.t.a.a.A.R., J. T. Carter and P. T. McGrail, D. Acierno, New high-performance thermoplastic
toughened epoxy thermosets. Polymer, vol. 38(17), pp. 4345-4348. August 1997.
[10] KING-FU LIN, Y.-D.S., Core-Shell Particles Designed for Toughening the Epoxy Resins. II. Core-Shell-Particle-Toughened
Epoxy Resins. Journal of Applied Polymer Science, vol. 70, pp. 2313-2322. December 1998.
[11] 11. Yang, J.-P., et al., Superiority of nanosized over microsized hyperbranched polymer second phase in modifying brittle
epoxy resin. Journal of Applied Polymer Science, vol. 119(2), pp. 863-870. July 2011.
[12] Zhou, H. and S. Xu, A new method to prepare rubber toughened epoxy with high modulus and high impact strength.
Materials Letters, vol. 121, pp 238-240.April 2014.
[13] Zeng, R.-T., et al., Curing behavior of epoxidized soybean oil with biobased dicarboxylic acids. Polymer Testing, vol. 57,
pp. 281-287. February 2017.
[14] Tan, S. and W. Chow, Biobased epoxidized vegetable oils and its greener epoxy blends: A review. Polymer-Plastics
Technology and Engineering, vol. 49(15), pp 1581-1590. December 2010.
International Journal of Innovation Engineering and Science Research
Open Access
Volume 2 Issue 4 July-August 2018
16|P a g e
ABSTRACT
Prediction of Poultry Yield Using Data Mining
Techniques
1Akanmode, E.R,
School of IT & Computing, American University of Nigeria, Yola, Adamawa state, Nigeria
2Dr. N.D. Oye,
Department of Computer Science, ModibboAdama University, Yola, Adamawa state, Nigeria.
3Celestine,H.R,
Department of Computer Science, ModibboAdama University, Yola, Adamawa state, Nigeria.
Corresponding Author Email: [email protected]
A poultry yield prediction model have then designed using a data mining and machine learning
technique called Classification and Regression Tree (CART) algorithm. The developed model has
been optimized and pruned using the Reduced Error Pruning (REP) algorithm to improve prediction
accuracy. An algorithm to make the prediction model flexible and capable of making predictions
irrespective of poultry size or population has been proposed. The model can be used by poultry
farmers to predict yield even before a breeding season. The model can also be used to help farmers
take decisions to ensure desirable yield at the end of the breeding season.
Keywords:Datamining; Prediction; Poultry yield, Cart Algorithm
I. INTRODUCTION
Over the years, pattern extraction from data has evolved from manual to automated processing. Early
pattern extraction methods includes Bayes‘ theorem from the 1700s to regression analysis in the
1800s. The revolution of technology especially computer technology has brought about increase in
large data storage, collection and manipulation hence the need for methods and techniques to
efficiently discover patterns in these large data (Mucherinoet al., 2009). The need for data exploration
and extraction later brought about discoveries in Computer Science such as cluster analysis, neural
networks, genetic algorithms, decision rules, decision trees and support vector machines; all of which
constitute methods of data mining (Han et al., 2011). Data mining is therefore the process of exploring
large data sets so as to find purposeful patterns, relationships, correlations or associations within the
data sets (Klosgen and Zytkow 2002). It forms the intersection linking various disciplines such as
computer science, statistics, machine learning and database systems (Bozdogan, 2003). The main
objective of data mining is to convert meaningless data to meaning information which results to
knowledge discovery (Sumathi and Sivanandam, 2006). Data mining goes beyond just analyzing raw
data. It involves establishment of practices and policies that manage full data life cycle of an
organization or enterprise. Data mining also involves building of models and deduction of inference
(Han et al., 2011). This means that data mining goes beyond the mere extraction (mining) of data but
the extraction of patterns from data to produce knowledge. One attribute data mining and database
share is the storing, manipulation and extraction of data.

Akanmode, E.R et al. “International Journal of Innovation Engineering and Science Research”
Volume 2 Issue 4 July-August 2018
17|P a g e
Data is collected and stored (database). The data is then worked upon (data mining) which results in
knowledge discovery. The discovered knowledge can then be stored for further use (database).
Different terms have been used to reference data mining. Terms such as: data archaeology,
information harvesting, information discovery, knowledge extraction and so on. Gregory Piatetsky-
Shapiro invented the term "knowledge discovery in databases" (KDD) in 1989. However, because of
the popularity of the term ―data mining‖ in machine learning and artificial intelligence (AI) community,
the terms KDD and data mining have been used interchangeably (Piatetsky-Shapiro et al., 2011). In
general, data mining encompasses six common types of tasks. They are anomaly detection,
association rule learning, clustering, classification, regression and summarization (Thuraisingham,
1998). Data are basically mined to achieve one or more of these tasks. Data mining in agriculture is a
recent research field (Ramesh and Vardhan, 2013). It is also considered as the future of agriculture
(ElFangary, 2009). This forms the basic motivation behind this research. Thus far, some data mining
applications in agriculture include: detection of diseases from animal sounds, predicting crop yield,
weather and soil types forecasting, etc.
Poultry Farming in Nigeria
Poultry can simply be defined as domesticated birds reared for meat, egg and feather purposes. In
Nigeria, poultry is mainly reared for meat and egg purposes. For this reason, the two main poultry
breeds reared in Nigeria are broilers (for meat) and layers (for eggs). Other popular poultry breeds in
Nigeria include guinea fowls, cockerels, ducks and turkeys. Poultry farming in Nigeria has been on a
tremendous rise. This may be attributed to the high rate of unemployment in the country. For some
individuals and states, poultry farming has become a means of revenue generation. Nigerians depend
heavily on poultry husbandry to create self-employment in a bid to reduce poverty (Heise et al., 2015).
Agriculture is a dominant practice in Sub-Saharan Africa countries like Nigeria and is seen as a major
instrument for poverty alleviation in the Sub-Saharan region (Larsen et al., 2009). It is therefore
important to introduce ideas that will improve poultry husbandry in Nigeria. This research intends to
improve poultry farming by developing models that poultry farmers can use to forecast or predict yield
using data mining techniques.
Statement of the problem
Prediction of yield or harvest is most farmers‘ problem. Farmers have often depended on previous
experiences to forecast yield but this method most times turns out non-reliable and incorrect (Ramesh
and Vardhan, 2013). If farmers can have an idea of what yield will be during the harvest period the
farmers take adequate steps or decisions to ensure maximum yield. With data mining, patterns from
poultry data that can lead to predictions can be discovered to provide poultry prediction models. The
aim of this research work is to develop a prediction model using data mining techniques that can help
poultry farmers to predict yield. The objective of the research is to provide local farmers with a tool in
form of a model that they can apply to predict yield for upcoming breeding seasons. In the same vein,
the model can help poultry farmers navigate through various decision processes as they try to cut
costs (cost effective poultry farming).
Justification of Study
Poultry farming in Nigeria has been on a tremendous rise over the past decades. This may be
attributed to the high rate of unemployment in the country. For some individuals and states in Nigeria,
poultry farming has become a means of revenue generation. Nigerian as a sub-Sahara African
country rely on agricultural activities including poultry farming to create self-employment in a bid to
reduce poverty (Larsen et al., 2009; Heise et al., 2015). It is therefore important to introduce ideas that
will improve poultry farming in Nigeria. The researchers intend to improve poultry farming by
developing a model that poultry farmers can use to forecast or predict yield using data mining
techniques. Poultry farmers like every other business man (or woman), juggle between opportunity
costs, foregoing some needs in favour of others and at the same time, targeting maximum yield as
possible. This study is particularly useful as it can help poultry farmers through a number of
Akanmode, E.R et al. “International Journal of Innovation Engineering and Science Research”
Volume 2 Issue 4 July-August 2018
18|P a g e
permutations of certain factors that affect poultry production and the possible yields that can result
from such permutations.
Scope and Limitation
This research is restricted to Adamawa State in particular or the north-eastern region at large. This is
because weather factors of Adamawa state have been considered. It has been assumed that weather
conditions in other regions of the country differ from the weather conditions in Adamawa state, a
north-eastern regional state in Nigeria.
Majority of the data used for the research constitute breeds of broilers and layers with quite a few on
turkeys and guinea fowls. Therefore the yield prediction model is not expected to be applicable for
birds such as ostriches, pigeons, parrots and so on.
II. Literature Review
Data Mining Prediction Techniques in Agricultural Research
Clustering algorithm is the technique used to identify appropriate groups of instances in a given set of
data (Aggarwal and Reddy, 2014). This algorithm is used when no prior knowledge of the data is
available therefore the concept of training or learning data set is practically impossible (Mucherino et
al., 2009). A k-means variant (k-means clustering) of the clustering algorithm is among the most
popular of the clustering algorithm, ranked among the top 10 algorithm of all the data mining
algorithms (Wu et al., 2008). It is therefore no surprise that it has been applied in agricultural
research. For example, Urtubiaet al., (2007) predicted the problems associated with wine fermentation
using the k-means algorithm. The fermentation problem of wine is that the process can be too slow or
stagnant (Urtubiaet al., 2007; Muchirinoet al., 2009). It is therefore important to ensure that the
fermentation process concludes smoothly to produce the desired wine quality. To be able to achieve
this, metabolites such as organic acid, fructose, glucose, glycerol and ethanol were collected and
analysed to obtain data of the fermentation process. The data obtained from the first three days were
compared with the data for the whole fermentation process. The k-means algorithm proved that the
data for the first 3 days of fermentation was sufficient enough to determine the final outcome of
fermentation process. This means that theentire fermentation process can be determined after 3 days
and adequate measures can be taken early to improve the wine quality. The K-Nearest Neighbour (K-
NN) is another classifier algorithm that works by using the popular principle ―birds of a feather move
together‖ (Mucherinoet al., 2009). This algorithm tends to classify instances based on the class of its
nearest neighbour (Kotsiantiset al., 2007). Like the K-means clustering algorithm, the K-NN algorithm
is also ranked among the top 10 data mining algorithms (Wu et al., 2008).
The K-NN classifier was prescribed as an efficient method for estimating soil water parameter
(Mucherinoet al., 2009) using crop simulation systems such as CROPSYST (Stockleet al., 1994),
DSSAT (Jones et al., 1998) or any crop simulation system. Soil parameters such as the lower limit of
plant water availability (LL), the drained upper limit and plant extractable soil water (PESW) are most
likely to be unavailable. K-NN algorithm can be used on available information such as soil texture and
organic carbon to obtain the unavailable parameters (Mucherinoet al., 2009). This shows that K-NN
classifier can be used to predict unknown variables from known ones. ElFangary (2009) developed a
model for improving cow and buffalo production in Egypt. The research used Pearson‘s Coefficient to
analyse and find correlations between variables such as pregnancy, death, diseases, vaccines and
the various interval of the animals‘ production to develop the model. The Artificial Neural Network
(ANN) algorithm is another powerful classifier used for prediction. A typical example of its application
was demonstrated by (Kondo et al., 2000) to predict that certain categories of oranges are relatively
sweeter by measuring the sugar and acid content of oranges. A three-layer artificial neural network
was used to predict that oranges with attributes: reddish color, medium size, low height and glossy
appearance are relatively sweeter. Another application of ANN in agriculture was conducted on pigs
to detect the presence of diseases via their sounds (Moshouet al., 2001). Initially sound samples of

Akanmode, E.R et al. “International Journal of Innovation Engineering and Science Research”
Volume 2 Issue 4 July-August 2018
19|P a g e
354 sounds were trained. The sounds consist of coughs from different pigs, metal clanging, grunts,
and background noise. Sounds such as cough and metal clanging were difficult to distinguish
because they have similar frequency range (Mucherinoet al., 2009). The neural network was further
trained to distinguish the similar sound. Once that was done, result showed sound recognition
correctness greater than 90%.
Similarly, ANN was used to detect watercore in apples (Shahin et al., 2001). Watercore is an interior
apple disorder (Mucherinoet al., 2009; Herremans, 2014). An ANN was able to identify good apples
from bad ones based on their watercore severity. This study was necessary because watercore is an
internal disorder and consumers could only discover it after purchase of the apple (Mucherinoet al.,
2009). The Support Vector Machine (SVM) technique is normally restricted to discriminate between
two classes (Mucherinoet al.,2009; Campilho and Kamel, 2014). Gill et al., (2006) used
meteorological and soil moisture to develop SVM predictions for four and seven days forecast of soil
moisture. Just like Moshouet al., (2001) research on pigs, Fagerlund (2007) used SVM to distinguish
and recognize different bird species based on birds‘ sounds. Bird sound data were used to train a
SVM classifier in conjunction with a binary decision tree. N-fold cross validation was then used to
obtain the optimal classifier model that identifies birds.
Crop Yield has been predicted using Multiple Linear Regression (MLR) and Density-Based Clustering
Data Mining technique (Ramesh and Vardhan, 2015). Rajeshwari and Arunesh (2016) used three
Classification techniques: Naïve Bayes, JRip and J48 (also called C4.5 algorithm) to analyse and
predict soil types: red and black. JRip and J48 algorithms are decision tree algorithm proposed by
William Cohen and Ross Quinlan respectively. This researcher shows that both decision tree
algorithms produced higher prediction accuracy rate compared to the Naïve Bayes technique. JRip
and J48 produced 98.18% and 97.27% prediction accuracy while Naïve Bayes technique produced
86.36% prediction accuracy. Chowdhury and Ojha (2017) performed disease diagnosis on
mushrooms using Naïve Bayes, Sequential Minimal Optimization (SMO) and Ripple-Down Rule
Learner (RIDOR) Classification techniques. They concluded that the Naïve Bayes technique provides
better results for mushroom disease diagnosis.
Data Mining Techniques in Poultry Farming
Study shows that very few research have been carried out in poultry farming and production. Thus far,
no research has been done to predict poultry production or yield using CART. This constitutes a
setback because very little literature is available upon which this research can complement and vice
versa. Vale et al., (2008) used decision tree, a prediction tool to estimate mortality rate in broilers
when they are exposed to heat wave. The research further strengthens the claim that high
temperatures have a negative effect on broilers. Sadeghi et al., (2015) proposed a procedure to
distinguish healthy broilers from unhealthy ones based on the sounds they make. The researcher
used Fisher Discriminant Analysis (FDA) to classify the healthy broilers from the unhealthy ones. This
research is particularly efficient for the early detection of diseases among broilers to enable farmers
take appropriate measures.
Comparisons between Various Prediction Techniques
Clustering algorithms are generally easy to implement however, the algorithm require that output
classes be identified upfront (Tiwari et al., 2013, Jones, 2015). This is particularly a setback for this
research since no prior knowledge of the outcome (yield) of the proposed prediction model is known
since yield is as determined by factors such as vaccine, disease, feed and season. Like k-means
algorithm, the KNN is relatively easy to implement. It can also be used to classify qualitative and
quantitative data attributes (Banks et al., 2011). However, result of the algorithm does not always yield
a compact representation of the sample distribution; given room to errors as irrelevant samples will
also be equally classified (Elder, 2009). In addition to this setback, the choice of the number of
neighbours (K) can produce different results (Banks et al., 2011). Large computational time can also
be an issue because the algorithm requires that the distance to every training pattern to be calculated
Akanmode, E.R et al. “International Journal of Innovation Engineering and Science Research”
Volume 2 Issue 4 July-August 2018
20|P a g e
(de Albornoz and Terashima, 2005). The ANN classifier is a fast learning algorithm which can
automatically learn from training dataset. However, the algorithm is hard to interpret and apply to
solve real life problems (Braspenning and Thuijsman, 1995; Patan, 2008). We are compelled to feel
that this technique might be too complicated for an average farmer to understand and utilise.For SVM,
Abe (2005) suggested the following advantages and disadvantages of SVM. The advantages are:
strong generalization ability of the dataset provides global optimum solution and robust to outliers.
Disadvantages include restriction to two classes thereby making multi-classification problem difficult
and extended training time. Poultry yield is a continuous variable not a categorical variable. It
therefore doesn‘t make sense to apply the SVM since the research goal is not to classify yield into two
classes but to predict yield.
Decision tree is machine learning and data mining technique that produce models which are easy to
interpret and understand (Rokach and Maimon, 2014). This technique is also capable to model
variables that have a non-linear relationship with each other (Raut and Nichat, 2017). Decision trees
work well with all variable types irrespective of whether it is categorical or continuous or both (Siau,
2008). Decision trees make use of a greedy algorithm which makes it very sensitive to outliers in the
training set. In addition to this drawback, the greedy algorithm may result in error predictions at the
leaves if an error occurs at corresponding higher level nodes (Rokach and Maimon, 2008). However,
to handle the problem of error prediction, large amount of training data sets can be used to train the
model (Mitchell, 1977; Aggarwal, 2015). Multiple Linear Regression (MLR) technique is only suitable
when the dependent and independent variables share linear relationships (Wendler and Gröttrup,
2016). This implies that situations where no linear relationship exists between some or all of the
variables; linear regression techniques (SLR and MLR) are not suitable. The Fisher Discriminant
Analysis (FDA) is similar to MLR. It produces fast, direct and concise analytical model solutions which
can easily be programmed by IT personnel. It also requires few instances of a dataset to build
models. The FDA is however sensitive to outliers, can‘t handle discrete independent variables or
missing values as well as suitable only for linear phenomena (Tuffery, 2011).
After critically assessing these prediction data mining techniques that have been applied in
agricultural research, we discover that poultry data works well with decision tree algorithm. This is
because decision tree works well with all kinds of data (categorical and continuous data). Decision
tree models are also easy to understand and interpret (this is particularly necessary if the model is to
be used by local poultry farmers).Vale et al. (2008) has also used decision tree to predict broiler
mortality rate. This research was however restricted to the impact environmental attributes
(environmental temperature) have on broilers. This research did not use key attributes such as:
diseases, vaccination, feed type, etc. to predict overall poultry yield.Another similar research for
identifying poultry disease based on their sound has been done by Sadeghi et al. (2015). While this
research is useful for the early detection of diseases among the poultry birds, the research did not
provide procedures for predicting overall poultry yield.
III. Methodology
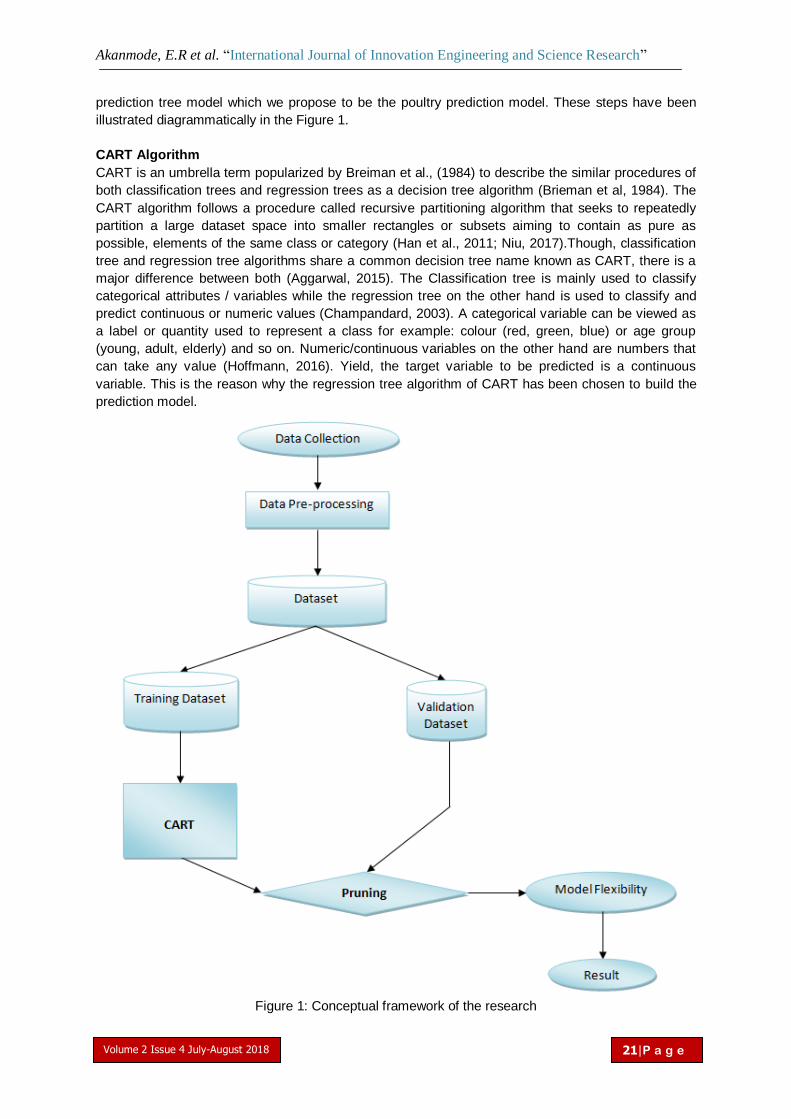
Research Framework
The first step of building any model is the collection of dataset. Most times, the data are inconsistent
and contain errors making the data unfit for implementing the model. To resolve this, the data mining
task of anomaly detection called data pre-processing is required (Tan, 2006). The data is then divided
into two sets: the training data set and the validation data set. The training data set is used to build the
model using the CART algorithm (regression tree) and the validation set is used to optimize the model
by pruning it. The post pruning technique known as Reduced Error Pruning (REP) will be applied on
the fully grown tree to reduce model overfitting and increase prediction accuracy (Mitchell, 1977). The
model is then tested with the validation data set, a process referred to as cross validation. REP and
cross validation form part of the pruning process. The pruned tree produces a smaller, précised
Akanmode, E.R et al. “International Journal of Innovation Engineering and Science Research”
Volume 2 Issue 4 July-August 2018
21|P a g e
prediction tree model which we propose to be the poultry prediction model. These steps have been
illustrated diagrammatically in the Figure 1.
CART Algorithm
CART is an umbrella term popularized by Breiman et al., (1984) to describe the similar procedures of
both classification trees and regression trees as a decision tree algorithm (Brieman et al, 1984). The
CART algorithm follows a procedure called recursive partitioning algorithm that seeks to repeatedly
partition a large dataset space into smaller rectangles or subsets aiming to contain as pure as
possible, elements of the same class or category (Han et al., 2011; Niu, 2017).Though, classification
tree and regression tree algorithms share a common decision tree name known as CART, there is a
major difference between both (Aggarwal, 2015). The Classification tree is mainly used to classify
categorical attributes / variables while the regression tree on the other hand is used to classify and
predict continuous or numeric values (Champandard, 2003). A categorical variable can be viewed as
a label or quantity used to represent a class for example: colour (red, green, blue) or age group
(young, adult, elderly) and so on. Numeric/continuous variables on the other hand are numbers that
can take any value (Hoffmann, 2016). Yield, the target variable to be predicted is a continuous
variable. This is the reason why the regression tree algorithm of CART has been chosen to build the
prediction model.
Figure 1: Conceptual framework of the research
Akanmode, E.R et al. “International Journal of Innovation Engineering and Science Research”
Volume 2 Issue 4 July-August 2018
22|P a g e
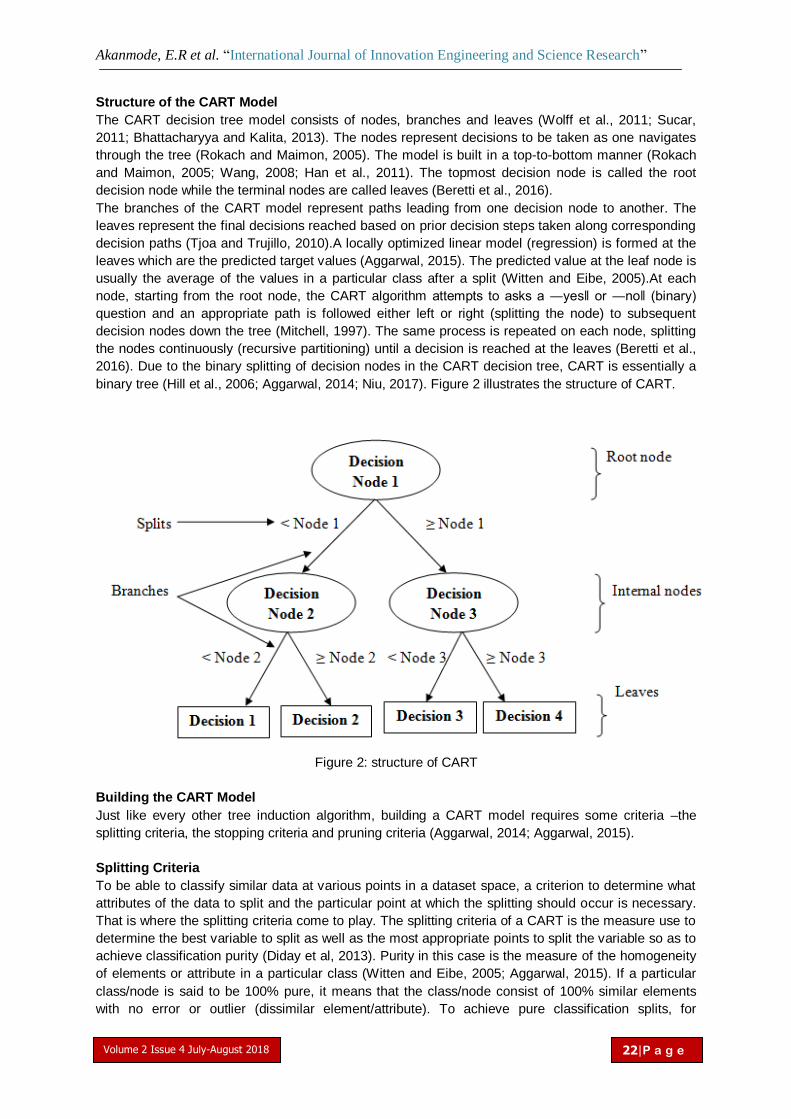
Structure of the CART Model
The CART decision tree model consists of nodes, branches and leaves (Wolff et al., 2011; Sucar,
2011; Bhattacharyya and Kalita, 2013). The nodes represent decisions to be taken as one navigates
through the tree (Rokach and Maimon, 2005). The model is built in a top-to-bottom manner (Rokach
and Maimon, 2005; Wang, 2008; Han et al., 2011). The topmost decision node is called the root
decision node while the terminal nodes are called leaves (Beretti et al., 2016).
The branches of the CART model represent paths leading from one decision node to another. The
leaves represent the final decisions reached based on prior decision steps taken along corresponding
decision paths (Tjoa and Trujillo, 2010).A locally optimized linear model (regression) is formed at the
leaves which are the predicted target values (Aggarwal, 2015). The predicted value at the leaf node is
usually the average of the values in a particular class after a split (Witten and Eibe, 2005).At each
node, starting from the root node, the CART algorithm attempts to asks a ―yes‖ or ―no‖ (binary)
question and an appropriate path is followed either left or right (splitting the node) to subsequent
decision nodes down the tree (Mitchell, 1997). The same process is repeated on each node, splitting
the nodes continuously (recursive partitioning) until a decision is reached at the leaves (Beretti et al.,
2016). Due to the binary splitting of decision nodes in the CART decision tree, CART is essentially a
binary tree (Hill et al., 2006; Aggarwal, 2014; Niu, 2017). Figure 2 illustrates the structure of CART.
Figure 2: structure of CART
Building the CART Model
Just like every other tree induction algorithm, building a CART model requires some criteria –the
splitting criteria, the stopping criteria and pruning criteria (Aggarwal, 2014; Aggarwal, 2015).
Splitting Criteria
To be able to classify similar data at various points in a dataset space, a criterion to determine what
attributes of the data to split and the particular point at which the splitting should occur is necessary.
That is where the splitting criteria come to play. The splitting criteria of a CART is the measure use to
determine the best variable to split as well as the most appropriate points to split the variable so as to
achieve classification purity (Diday et al, 2013). Purity in this case is the measure of the homogeneity
of elements or attribute in a particular class (Witten and Eibe, 2005; Aggarwal, 2015). If a particular
class/node is said to be 100% pure, it means that the class/node consist of 100% similar elements
with no error or outlier (dissimilar element/attribute). To achieve pure classification splits, for

Akanmode, E.R et al. “International Journal of Innovation Engineering and Science Research”
Volume 2 Issue 4 July-August 2018
23|P a g e
classification trees, some splitting criteria have been proposed such as Entropy, Gini index and
Twoing (Mitchell, 1997; Wu and Kumar, 2009; Issac and Israr, 2014). For a regression tree model
however, a splitting criteria that involves an error based measure or measure of variance is
considered more appropriate because of the continuous numerical implication of the attributes of the
target variable (Witten and Frank, 2005; Aggarwal, 2015). To classify variables or attributes with
respect to a target numeric continuous variable, a locally optimised linear model is obtained from each
hierarchical partitioning of the decision node at the leaves of the tree (Aggarwal, 2015). To obtain a
true representation of the value of every split, the average of all the values of the split is computed
and used (Witten and Frank, 2005; Moolayil, 2016). This is indicated at the leaves of the tree and
along decision paths along the tree. One common variant measurement splitting criteria for a
regression tree is the Standard Deviation Reduction (SDR) measure (Witten and Frank, 2005;
Moolayil, 2016).
Pruning Criteria
Pruning a tree requires cutting off branches from the tree so as to improve accuracy and reduce
overfitting (Mitchell, 1997; Witten and Eibe, 2005). Pruning is a way of making complex and large
trees simpler and precise. This is in accordance to Occam‘s razor theory which states that a simpler
and less complex a model is, the more accurate it is (Hall et al., 2011).Pruning techniques/criteria that
involves the use of a validation dataset are called post pruning techniques. Post pruning requires that
a tree model be fully grown from top to bottom and then pruned bottom to top (Aggarwal, 2015). This
pruning technique is quite different from the pre pruning technique which requires that the tree be
stopped early enough before it begins to over fit (Mitchell, 1997). The problem with pre pruning
however is that there is the uncertainty of the ‗early point‘ to stop the tree growth (Aggarwal, 2015).
Mitchell, (1997) also suggested that growing the tree fully is the most practical approach for tree
induction models. For this reason, we decided to use a post pruning technique. Some post-pruning
criteria include cost complexity pruning, reduced-error pruning and rule-based pruning (Mitchell,
1997).
Regression Tree Model for Poultry Prediction
For the poultry prediction model, the SDR measure as prescribed by Witten and Frank (2005) will be
used. The splitting process continues until no further splitting is feasible (when partitions are as pure
as possible). Though this stopping criterion will result to a large tree, it is however the most pragmatic
criterion for any tree induction model (Mitchell, 1997). The resulting tree will be pruned using the REP
criterion/technique to optimise a regression tree model that will predict the target variable yield using
the predictor variables vaccine, season, feed, and disease all of which will form decision nodes of the
regression tree model.
Training and Validation Dataset
For the purpose of developing algorithms and models for machine learning, a training dataset and
validation datasets are required (Hall et al., 2011).CART algorithms generally require a significantly
large amount of training dataset (Aggarwal, 2015). Though there isn‘t any specified percentage of
dataset to be set aside as training dataset, certain literatures suggest over 50% of the total dataset.
For the purpose of this research, we decide to utilize the first 11-breeding period (55% of the total
dataset) for our training dataset while the remaining 9 breeding periods will be used as the validation
dataset to prune the regression tree and validate the model as shown in Table 1 and 2.
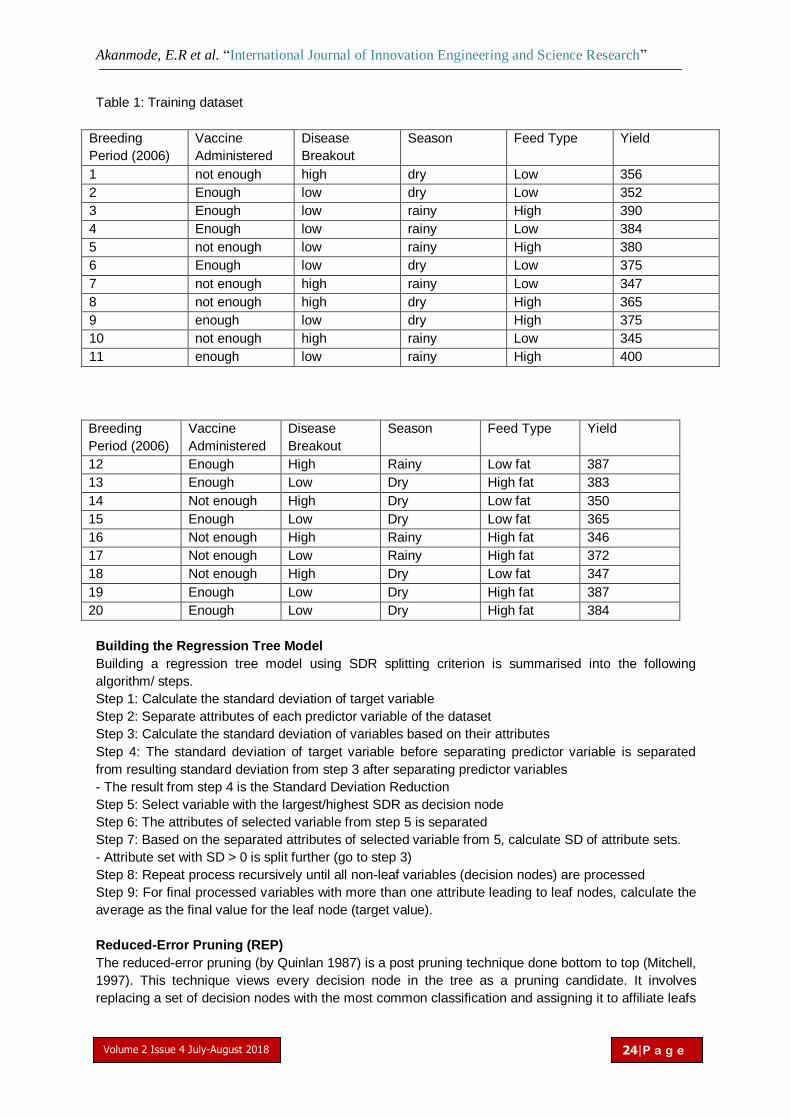
Akanmode, E.R et al. “International Journal of Innovation Engineering and Science Research”
Volume 2 Issue 4 July-August 2018
24|P a g e
Table 1: Training dataset
Breeding
Period (2006)
Vaccine
Administered
Disease
Breakout
Season Feed Type Yield
1 not enough high dry Low 356
2 Enough low dry Low 352
3 Enough low rainy High 390
4 Enough low rainy Low 384
5 not enough low rainy High 380
6 Enough low dry Low 375
7 not enough high rainy Low 347
8 not enough high dry High 365
9 enough low dry High 375
10 not enough high rainy Low 345
11 enough low rainy High 400
Breeding
Period (2006)
Vaccine
Administered
Disease
Breakout
Season Feed Type Yield
12 Enough High Rainy Low fat 387
13 Enough Low Dry High fat 383
14 Not enough High Dry Low fat 350
15 Enough Low Dry Low fat 365
16 Not enough High Rainy High fat 346
17 Not enough Low Rainy High fat 372
18 Not enough High Dry Low fat 347
19 Enough Low Dry High fat 387
20 Enough Low Dry High fat 384
Building the Regression Tree Model
Building a regression tree model using SDR splitting criterion is summarised into the following
algorithm/ steps.
Step 1: Calculate the standard deviation of target variable
Step 2: Separate attributes of each predictor variable of the dataset
Step 3: Calculate the standard deviation of variables based on their attributes
Step 4: The standard deviation of target variable before separating predictor variable is separated
from resulting standard deviation from step 3 after separating predictor variables
- The result from step 4 is the Standard Deviation Reduction
Step 5: Select variable with the largest/highest SDR as decision node
Step 6: The attributes of selected variable from step 5 is separated
Step 7: Based on the separated attributes of selected variable from 5, calculate SD of attribute sets.
- Attribute set with SD > 0 is split further (go to step 3)
Step 8: Repeat process recursively until all non-leaf variables (decision nodes) are processed
Step 9: For final processed variables with more than one attribute leading to leaf nodes, calculate the
average as the final value for the leaf node (target value).
Reduced-Error Pruning (REP)
The reduced-error pruning (by Quinlan 1987) is a post pruning technique done bottom to top (Mitchell,
1997). This technique views every decision node in the tree as a pruning candidate. It involves
replacing a set of decision nodes with the most common classification and assigning it to affiliate leafs
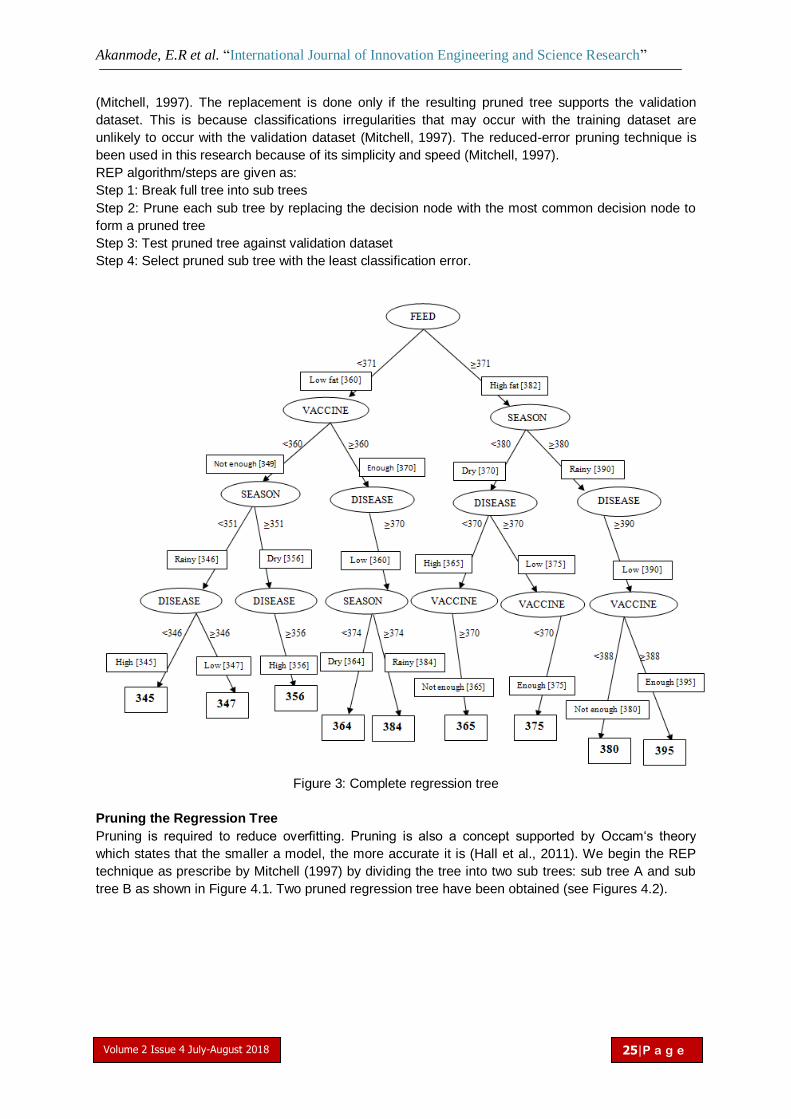
Akanmode, E.R et al. “International Journal of Innovation Engineering and Science Research”
Volume 2 Issue 4 July-August 2018
25|P a g e
(Mitchell, 1997). The replacement is done only if the resulting pruned tree supports the validation
dataset. This is because classifications irregularities that may occur with the training dataset are
unlikely to occur with the validation dataset (Mitchell, 1997). The reduced-error pruning technique is
been used in this research because of its simplicity and speed (Mitchell, 1997).
REP algorithm/steps are given as:
Step 1: Break full tree into sub trees
Step 2: Prune each sub tree by replacing the decision node with the most common decision node to
form a pruned tree
Step 3: Test pruned tree against validation dataset
Step 4: Select pruned sub tree with the least classification error.
Figure 3: Complete regression tree
Pruning the Regression Tree
Pruning is required to reduce overfitting. Pruning is also a concept supported by Occam‘s theory
which states that the smaller a model, the more accurate it is (Hall et al., 2011). We begin the REP
technique as prescribe by Mitchell (1997) by dividing the tree into two sub trees: sub tree A and sub
tree B as shown in Figure 4.1. Two pruned regression tree have been obtained (see Figures 4.2).

Akanmode, E.R et al. “International Journal of Innovation Engineering and Science Research”
Volume 2 Issue 4 July-August 2018
26|P a g e
Figure 4.1: Sub trees A and B
Figure 4.2: Pruned tree A and B
Cross Validation
The variables of the validation data set have been rearranged in the same pattern as the pruned tree.
Misclassified classes of pruned trees A and B have been indicated with bold italics as shown in Table
2 and Table 3 respectively.

Akanmode, E.R et al. “International Journal of Innovation Engineering and Science Research”
Volume 2 Issue 4 July-August 2018
27|P a g e
Table 2: Misclassification table of pruned tree A
Breeding
Period
(2006)
Feed Type Vaccine
Administere
d
Disease
Breakout
Season Yield
13 High fat Enough Low Dry 383
16 High fat Not enough High Rainy 346
17 High fat Not enough Low Rainy 372
19 High fat Enough Low Dry 387
20 High fat Enough Low Dry 384
12 Low fat Enough High Rainy 387
14 Low fat Not enough High Dry 350
15 Low fat Enough Low Dry 365
18 Low fat Not enough High Dry 347
Table 3: Misclassification table of pruned tree B
Breeding
Period
(2006)
Feed Type Vaccine
Administere
d
Disease
Breakout
Season Yield
13 High fat Enough Low Dry 383
16 High fat Not enough High Rainy 346
17 High fat Not enough Low Rainy 372
19 High fat Enough Low Dry 387
20 High fat Enough Low Dry 384
12 Low fat Enough High Rainy 387
14 Low fat Not enough High Dry 350
15 Low fat Enough Low Dry 365
18 Low fat Not enough High Dry 347
We propose that pruned tree B be our selected model for predicting poultry yield. Pruned tree B has
been selected because of it contains less classification errors (22%, indicated in bold italics)
compared to pruned tree A (33%, also indicated in bold italics).
Applying the Prediction Model to Predict Poultry Yield
The main objective of this research is to develop a model that poultry farmers can use to predict
poultry yield. A regression tree model has been developed in that respect. However, it is necessary to
present this model in such a way that the local poultry farmers irrespective of the population size of
their respective poultry farms can apply and utilize.
The CART algorithm has been applied on a sample size of 400 poultry birds to demonstrate how we
can develop a prediction model. As a result, the predicted yields have been with respect to a
population size of 400 poultry birds. The issue of a non-flexible model therefore arises. We present a
simple algorithm to modify the developed model such that the model makes percentile prediction. This
way, predictions can be achieved by simply multiplying the percentile prediction with whatever poultry
sample size. The algorithm has been presented below.

Akanmode, E.R et al. “International Journal of Innovation Engineering and Science Research”
Volume 2 Issue 4 July-August 2018
28|P a g e
Algorithm
Poultry percentile prediction model, regression tree, N
N = sample population
If Feed = Feed high fat then
Vaccine not enough = [370∗100
400]
100 * N
Vaccine enough = [388∗100
400]
100 * N
Else if
Feed = Feed low fat then
Disease low = [374∗100
400]
100 * N
Else if
Disease = Disease high then
Season dry = [346∗100
400]
100 * N
Season rainy = [356∗100
400]
100 * N
End if
End.
The output is shown in Figure 5.
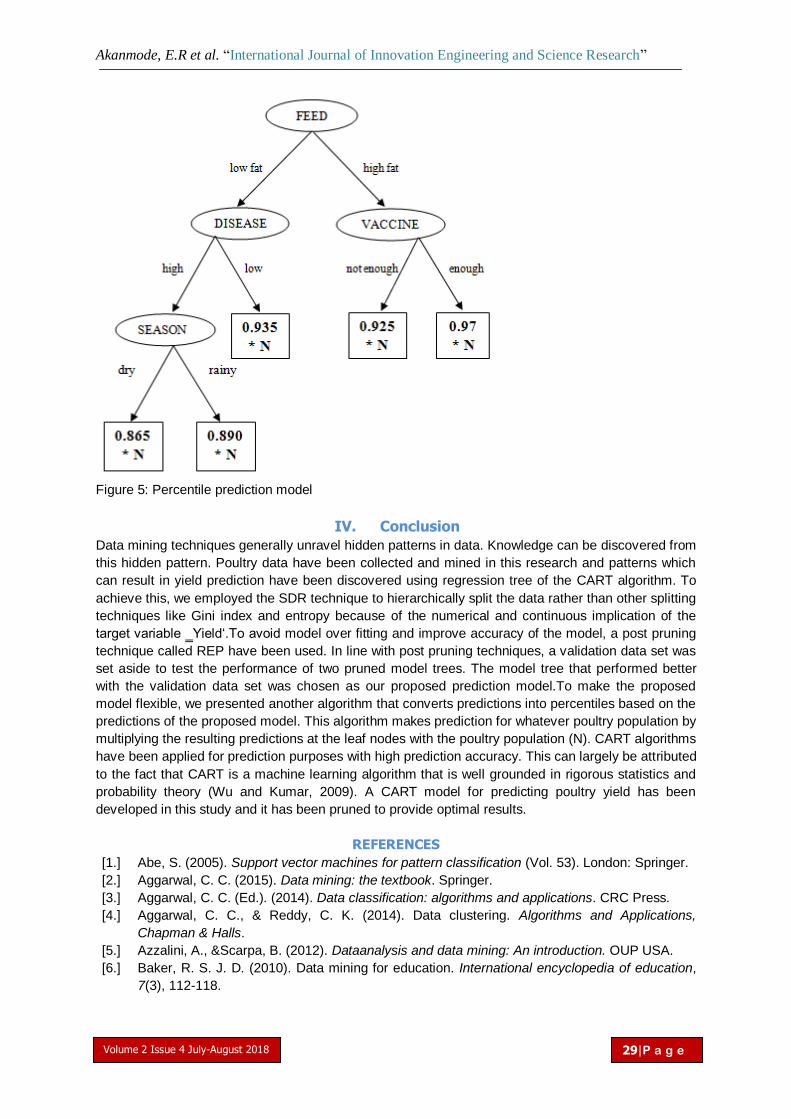
Akanmode, E.R et al. “International Journal of Innovation Engineering and Science Research”
Volume 2 Issue 4 July-August 2018
29|P a g e
Figure 5: Percentile prediction model
IV. Conclusion
Data mining techniques generally unravel hidden patterns in data. Knowledge can be discovered from
this hidden pattern. Poultry data have been collected and mined in this research and patterns which
can result in yield prediction have been discovered using regression tree of the CART algorithm. To
achieve this, we employed the SDR technique to hierarchically split the data rather than other splitting
techniques like Gini index and entropy because of the numerical and continuous implication of the
target variable ‗Yield‘.To avoid model over fitting and improve accuracy of the model, a post pruning
technique called REP have been used. In line with post pruning techniques, a validation data set was
set aside to test the performance of two pruned model trees. The model tree that performed better
with the validation data set was chosen as our proposed prediction model.To make the proposed
model flexible, we presented another algorithm that converts predictions into percentiles based on the
predictions of the proposed model. This algorithm makes prediction for whatever poultry population by
multiplying the resulting predictions at the leaf nodes with the poultry population (N). CART algorithms
have been applied for prediction purposes with high prediction accuracy. This can largely be attributed
to the fact that CART is a machine learning algorithm that is well grounded in rigorous statistics and
probability theory (Wu and Kumar, 2009). A CART model for predicting poultry yield has been
developed in this study and it has been pruned to provide optimal results.
REFERENCES
[1.] Abe, S. (2005). Support vector machines for pattern classification (Vol. 53). London: Springer.
[2.] Aggarwal, C. C. (2015). Data mining: the textbook. Springer.
[3.] Aggarwal, C. C. (Ed.). (2014). Data classification: algorithms and applications. CRC Press.
[4.] Aggarwal, C. C., & Reddy, C. K. (2014). Data clustering. Algorithms and Applications,
Chapman & Halls.
[5.] Azzalini, A., &Scarpa, B. (2012). Dataanalysis and data mining: An introduction. OUP USA.
[6.] Baker, R. S. J. D. (2010). Data mining for education. International encyclopedia of education,
7(3), 112-118.
Akanmode, E.R et al. “International Journal of Innovation Engineering and Science Research”
Volume 2 Issue 4 July-August 2018
30|P a g e
[7.] Banks, D., House, L., McMorris, F. R., Arabie, P., & Gaul, W. A. (Eds.). (2011). Classification,
Clustering, and Data Mining Applications: Proceedings of the Meeting of the International
Federation of Classification Societies (IFCS), Illinois Institute of Technology, Chicago, 15–
18 July 2004. Springer Science & Business Media.
[8.] Berretti, S., Thampi, S. M., &Dasgupta, S. (Eds.). (2016). Intelligent systems technologies and
applications. Springer International Publishing.
[9.] Bhattacharyya, D. K., &Kalita, J. K. (2013). Network anomaly detection: A machine learning
perspective. CRC Press.
[10.] Bozdogan, H. (Ed.). (2003). Statistical data mining and knowledge discovery. CRC Press.
[11.] Braspenning, P. J., &Thuijsman, F. (1995). Artificial neural networks: an introduction to ANN
theory and practice (Vol. 931). Springer Science & Business Media.
[12.] Breiman, L., Friedman, J., Stone, C. J., &Olshen, R. A. (1984). Classification and regression
trees. CRC press.
[13.] Campilho, A., &Kamel, M. (Eds.). (2014). Image Analysis and Recognition: 11th International
Conference, ICIAR 2014, Vilamoura, Portugal, October 22-24, 2014, Proceedings (Vol.
8814). Springer.
[14.] Champandard, A. J. (2003). AI game development: Synthetic creatures with learning and
reactive behaviors. New Riders.
[15.] Chandola, V., Banerjee, A., & Kumar, V. (2009). Anomaly detection: A survey. ACM computing
surveys (CSUR), 41(3), 15.
[16.] Cherkassky, V., &Mulier, F. M. (2007). Learning from data: concepts, theory, and methods.
John Wiley & Sons.
[17.] Chowdhury, D. R., &Ojha, S. (2017). ―An Empirical Study on Mushroom Disease Diagnosis:
A Data Mining Approach‖, International Research Journal of Engineering and Technology,
4(1), 529-534.
[18.] deAlbornoz, A. G. Á., &Terashima-Marín, H. MICAI 2005: Advances in Artificial Intelligence.
[19.] deSá, J. P. M., Silva, L. M., Santos, J. M., & Alexandre, L. A. (2013). Minimum error entropy
classification. Springer.
[20.] Diday, E., Lechevallier, Y., Schader, M., Bertrand, P., &Burtschy, B. (Eds.). (2013). New
approaches in classification and data analysis. Springer Science & Business Media.
[21.] Digby, B. (2001). It's a World Thing. Oxford University Press, USA.
[22.] El Fangary, L. M. (2009, December). Mining Data of Buffalo and Cow Production in Egypt. In
Frontier of Computer Science and Technology, 2009. FCST'09. Fourth International
Conference on (pp. 382-387). IEEE.
[23.] Elder, J. (2009). Handbook of statistical analysis and data mining applications. Academic
Press.
[24.] Ellen, S. (2012). Slovin's Formula Sampling Techniques.
[25.] Fagerlund, S. (2007). Bird Species Recognition Using Support Vector Machines, EURASIP
Journal on Advances in Signal Processing 2007, Article ID 38637, 1–8.
[26.] Fasina, F. O., Wai, M. D., Mohammed, S. N., &Onyekonwu, O. N. (2007). Contribution of
poultry production to household income: a case of Jos South Local Government in Nigeria.
Family Poultry, 17(1&2), 30-34.
[27.] Gill, M. K., Asefa, T., Kemblowski, M. W., & McKee, M. (2006). Soil moisture prediction using
support vector machines. JAWRA Journal of the American Water Resources Association,
42(4), 1033-1046.
[28.] Hall, M., Witten, I., & Frank, E. (2011). Data mining: Practical machine learning tools and
techniques. Kaufmann, Burlington.
[29.] Han, J., Jian, P., & Michelin, K. (2006). Data Mining, Southeast Asia Edition.
[30.] Han, J., Pei, J., &Kamber, M. (2011). Data mining: concepts and techniques. Elsevier.
[31.] Heise, H., Crisan, A., &Theuvsen, L. (2015). The poultry market in Nigeria: market structures
and potential for investment in the market. International Food and Agribusiness Management
Review, 18, 197-222.

Akanmode, E.R et al. “International Journal of Innovation Engineering and Science Research”
Volume 2 Issue 4 July-August 2018
31|P a g e
[32.] Herremans, E., Melado-Herreros, A., Defraeye, T., Verlinden, B., Hertog, M., Verboven, P.,
...&Wevers, M. (2014). Comparison of X-ray CT and MRI of watercore disorder of different
apple cultivars. Postharvest biology and technology, 87, 42-50.
[33.] Hill, T., Lewicki, P., &Lewicki, P. (2006). Statistics: methods and applications: a comprehensive
reference for science, industry, and data mining. StatSoft, Inc..
[34.] Hoffmann, J. P. (2016). Regression Models for Categorical, Count, and Related Variables: An
Applied Approach. Univ of California Press.
[35.] Issac, B., &Israr, N. (Eds.). (2014). Case Studies in Secure Computing: Achievements and
Trends. CRC Press.
[36.] Jones, J. W., Tsuji, G. Y., Hoogenboom, G., Hunt, L. A., Thornton, P. K., Wilkens, P. W., ... &
Singh, U. (1998). Decision support system for agrotechnology transfer: DSSAT v3. In
Understanding options for agricultural production (pp. 157-177). Springer Netherlands.
[37.] Jones, M. T. (2015). Artificial Intelligence: A Systems Approach: A Systems Approach. Jones
& Bartlett Learning.
[38.] Klösgen, W., &Zytkow, J. M. (2002). Handbook of data mining and knowledge discovery.
Oxford University Press, Inc.
[39.] Kondo, N., Ahmad, U., Monta, M., &Murase, H. (2000). Machine vision based quality
evaluation of Iyokan orange fruit using neural networks. Computers and electronics in
agriculture, 29(1), 135-147.
[40.] Kotsiantis, S. B., Zaharakis, I., &Pintelas, P. (2007). Supervised machine learning: A review of
classification techniques.
[41.] Larson, N. I., Story, M. T., & Nelson, M. C. (2009). Neighborhood environments: disparities in
access to healthy foods in the US. American journal of preventive medicine, 36(1), 74-
81.
[42.] Mitchell, T. M. (1997). Machine learning. 1997. Burr Ridge, IL: McGraw Hill, 45(37), 870-877.
[43.] Moolayil, J. (2016). Smarter Decisions–The Intersection of Internet of Things and Decision
Science. Packt Publishing Ltd.
[44.] Moshou, D., Chedad, A., Van Hirtum, A., De Baerdemaeker, J., Berckmans, D., & Ramon, H.
(2001). An intelligent alarm for early detection of swine epidemics based on neural
networks. Transactions of the ASAE, 44(1), 167.
[45.] Moshou, D., Chedad, A., Van Hirtum, A., De Baerdemaeker, J., Berckmans, D., & Ramon, H.
(2001). Neural recognition system for swine cough. Mathematics and Computers in
Simulation, 56(4), 475-487.
[46.] Mucherino, A., Papajorgji, P. J., &Pardalos, P. M. (2009). Data mining in agriculture (Vol. 34).
Springer Science & Business Media.
[47.] Niu, G. (2017). Data-Driven Technology for Engineering Systems Health Management.
Springer.
[48.] Patan, K. (2008). Artificial neural networks for the modelling and fault diagnosis of technical
processes. Springer.
[49.] Piatetsky-Shapiro, G., & Parker, G. (2011). Lesson: Data mining, and knowledge discovery: An
introduction. Introduction to Data Mining, KD Nuggets.
[50.] Quinlan, J. R. (1987). Simplifying decision trees. International journal of man-machine studies,
27(3), 221-234.
[51.] Rajeswari, V., &Arunesh, K. (2016). Analysing soil data using data mining classification
techniques. Indian Journal of Science and Technology, 9(19).
[52.] Ramesh, D., &Vardhan, B. V. (2013). Data mining techniques and applications to agricultural
yield data. International Journal of Advanced Research in Computer and Communication
Engineering, 2(9), 3477-80.
[53.] Ramesh, D., &Vardhan, B. V. (2015). Analysis of crop yield prediction using data mining
techniques. International Journal of Research in Engineering and Technology, 4(1), 47-473.
[54.] Raut, A. B., &Nichat, M. A. A. (2017). Students Performance Prediction Using Decision Tree.
International Journal of Computational Intelligence Research, 13(7), 1735-1741.
Akanmode, E.R et al. “International Journal of Innovation Engineering and Science Research”
Volume 2 Issue 4 July-August 2018
32|P a g e
[55.] Rokach, L., &Maimon, O. (2005). The Data Mining and Knowledge Discovery Handbook: A
Complete Guide for Researchers and Practitioners.
[56.] Rokach, L., &Maimon, O. (2008). Data mining with decision trees: theory and applications.
[57.] Rokach, L., &Maimon, O. (2014). Data mining with decision trees: theory and applications.
World scientific.
[58.] Ryan, T. P. (2013). Sample size determination and power. John Wiley & Sons.
[59.] Sadeghi, M., Banakar, A., Khazaee, M., &Soleimani, M. R. (2015). An Intelligent Procedure for
the Detection and Classification of Chickens Infected by Clostridium Perfringens Based
on their Vocalization. RevistaBrasileira de CiênciaAvícola, 17(4), 537-544.
[60.] Shahin, M. A., Tollner, E. W., & McClendon, R. W. (2001). AE—Automation and Emerging
Technologies: Artificial Intelligence Classifiers for sorting Apples based on Watercore.
Journal of agricultural engineering research, 79(3), 265-274.
[61.] Siau, K. (Ed.). (2008). Advanced Principles for Improving Database Design, Systems
Modeling, and Software Development. IGI Global.
[62.] Stockle, C. O., Martin, S. A., & Campbell, G. S. (1994). CropSyst, a cropping systems
simulation model: water/nitrogen budgets and crop yield. Agricultural Systems, 46(3),
335-359.
[63.] Sucar, L. E. (Ed.). (2011). Decision Theory Models for Applications in Artificial Intelligence:
Concepts and Solutions: Concepts and Solutions. IGI Global.
[64.] Sumathi, S., &Sivanandam, S. N. (2006). Introduction to data mining and its applications (Vol.
29). Springer.
[65.] Tan, P. N. (2006). Introduction to data mining. Pearson Education India.
[66.] Thuraisingham, B. (1998). Data mining: technologies, techniques, tools, and trends. CRC
press.
[67.] Tiwari, V., Tiwari, B., Thakur, R. S., & Gupta, S. (2013). Pattern and data analysis in
healthcare settings.
[68.] Tjoa, A. M., & Trujillo, J. (2010). Data Warehousing and Knowledge Discovery. Springer
Berlin/Heidelberg.
[69.] Tuffery, S. (2011). Data mining and statistics for decision making (Vol. 2). Chichester: Wiley.
[70.] Urtubia, A., Pérez-Correa, J. R., Soto, A., &Pszczolkowski, P. (2007). Using data mining
techniques to predict industrial wine problem fermentations. Food Control, 18(12), 1512-
1517.
[71.] Vale, M. M., Moura, D. J. D., Nääs, I. D. A., Oliveira, S. R. D. M., & Rodrigues, L. H. A. (2008).
Data mining to estimate broiler mortality when exposed to heat wave. Scientia Agricola,
65(3), 223-229.
[72.] Wang, J. (Ed.). (2008). Data warehousing and mining: Concepts, methodologies, tools, and
applications: Concepts, methodologies, tools, and applications (Vol. 3). IGI Global.
[73.] Wang, J. (Ed). (2014). Encyclopedia of Business Analytics and optimization. IGI Global.
[74.] Wendler, T., &Gröttrup, S. (2016). Data Mining with SPSS Modeler: Theory, Exercises and
Solutions. Springer.
[75.] Witten, I. H., Frank E. (2005). Data Mining: Practical machine learning tools and techniques, 2,
127-143.
[76.] Wolff, K. E., Palchunov, D. E., Zagoruiko, N. G., &Andelfinger, U. (Eds.). (2011). Knowledge
Processing and Data Analysis: First International Conference, KONT 2007, Novosibirsk,
Russia, September 14-16, 2007, and First International Conference, KPP 2007,
Darmstadt, Germany, September 28-30, 2007. Revised Selected Papers (Vol. 6581). Springer
Science & Business Media.
[77.] Wu, X., & Kumar, V. (2009). The top ten algorithm in data mining. International Standard Book,
13, 978-1.
[78.] Wu, X., Kumar, V., Quinlan, J. R., Ghosh, J., Yang, Q., Motoda, H., ...& Zhou, Z. H. (2008).
Top 10 algorithms in data mining. Knowledge and information systems, 14(1), 1-37

International Journal of Innovation Engineering and Science Research
Open Access
Volume 2 Issue 4 July-August 2018
33|P a g e
ABSTRACT
Measuring the facility of use of a website
designed with a methodology based on concepts
of design of ontologies
José Antonio Zárate M., Angélica Rosales L, Ma. Guadalupe Guerrero N., Beatriz
Oralia Ríos V. Patricia Rivera A.
Institute of Technology of San Luis Potosi, Tecnológico avenue s/n Col. UPA, Soledad de Graciano Sanchez
San Luis Potosí, México.
Acceptance of a website is determined by various factors, one of the most important is the organization that
allows users to access to functions, resources and information that it contains. This work consisted of a study of
comparative usability between a website designed using principles of linguistics and design of ontologies and
other using a strategy of a commercial product. A plan was designed and applied to evaluate the following
aspects of website: ease of use, efficiency to access its information, efficacy to perform tasks and user
satisfaction. Heuristic and user tests were used as diagnostic tools in usability evaluations, and an observation
guide was made by an external evaluator as a complement to previous tests. The results clearly shown that is
better use the proposed website design methodology. This allows to create site more structured, functional and
with greater ease of access to resources that it contain.
Keywords—Ontology, heuristic tests, usability, websites
I. INTRODUCTION
Design of website includes various stages that involve: technical development, information structure
and visual design [1]. As any artifact used by humans, the design requires an architecture that is well
structured, organized, functional and useful content; and that it involves from its conception usability.
This is an attribute of quality that measures ease of use in user interfaces (IU) [2].
This work describes a study of usability comparative; this is oriented at end users of a website
designed based on a methodology adapted based on design of ontologies [3] against a site designs
with a commercial product strategy [4].
II. DESCRIPTION OF PROBLEM
In a previous work [3], it was evaluated the usability of structure of a website planned with a
methodology adapted to be assimilates more easily by designers. The results obtained confirmed a
better understanding of the designers in their interaction with website structure, and improvements in
aspectsas efficacy, efficiency and subjective satisfaction. As next stage, it is necessary to contrast the
degree of usability from end users’point of viewof a website of the proposed methodology against the
design of commercial option, to identify advances in ease and simplicity of use, efficiency and
effectiveness in access to information, to obtain a satisfactory experience of users with website
designed with our proposed methodology.

José Antonio Zárate M et al. “International Journal of Innovation Engineering and Science Research”
Volume 2 Issue 4 July-August 2018
34|P a g e
III. SOLUTION PROPOSAL
A plan was designed and implemented to evaluate the usability of website design, using user test as
known as Test of Guerrilla [5]; and with this determines issues in usage and interaction of users with
the website interface. Evaluation instruments consisted of usability heuristics, [6], observation guide
and usability metrics supported by: [7], [8][9], [5], [10], [11], [12], [13][14],[15], [16].
Previously to this study, two websites were designed (figure 1), these design with different
methodologies [3] and [4]. To avoid certain slant with final results, both designs were implemented
using Adobe Dreamweaver CS5 and HTML.
Schoolwebsite
Adapted Methodology
Design web structure base on ontologies
Schoolwebsite
Alternative web design
Fig. 1. School websites used in tests
A. Evaluation of the usability of website design applying user test
Environment in which the test were made is described below, description of end users is shown in table
I, material used is shown in table II and photography of interference and distractions-free spaces that
were used are shown in figure 2:
TABLE I. GENERAL INFORMATION OF THE GROUP OF EVALUATION OF THE USABILITY OF WEBSITE
General data on participant group Description
Test date From 20 Aprilto 2 May 2017
Place where the test is performed Faculty of Engineering of the UASLP,
México
Type of participants Students
Age From19 to 21 yearsold
Gender 6 women, 4 men
Participants with experience in web
design
2 women, 3 men
TABLE II. MATERIAL AND THE EQUIPMENT USED IN THE USABILITY TEST OF WEBSITE
Equipment 3 laptops Hewlett Packard with operating system Windows 7
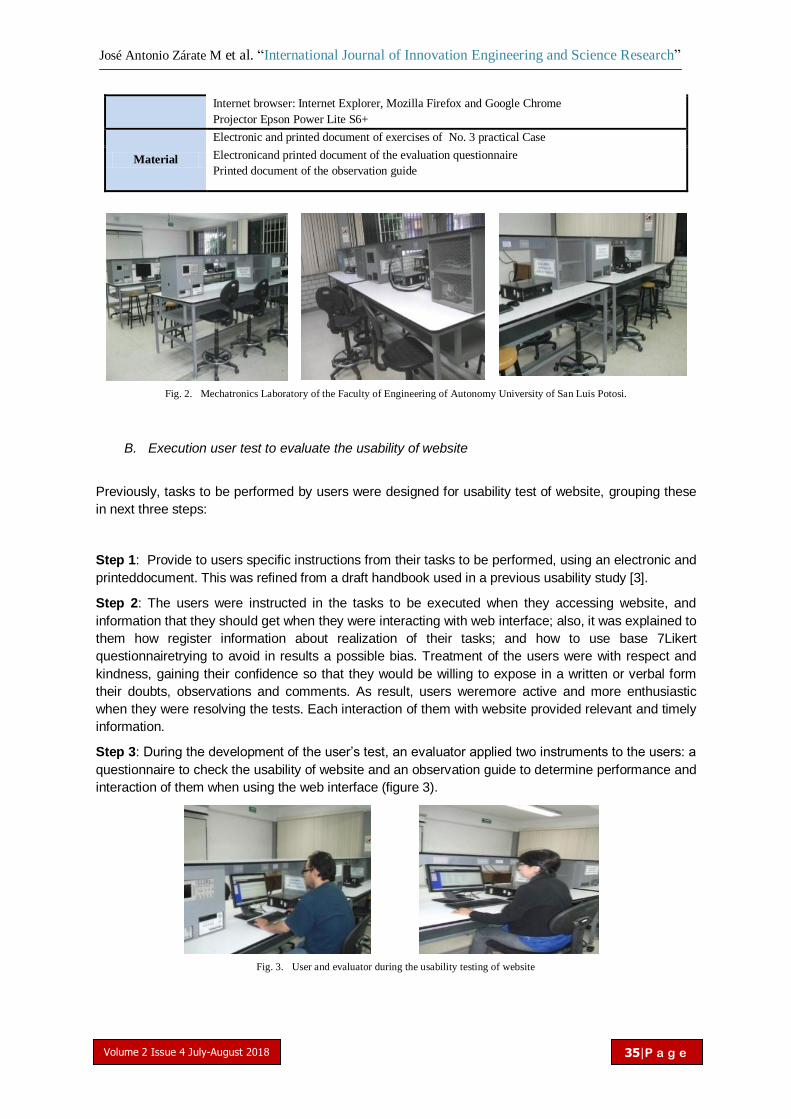
José Antonio Zárate M et al. “International Journal of Innovation Engineering and Science Research”
Volume 2 Issue 4 July-August 2018
35|P a g e
Internet browser: Internet Explorer, Mozilla Firefox and Google Chrome
Projector Epson Power Lite S6+
Material
Electronic and printed document of exercises of No. 3 practical Case
Electronicand printed document of the evaluation questionnaire
Printed document of the observation guide
Fig. 2. Mechatronics Laboratory of the Faculty of Engineering of Autonomy University of San Luis Potosi.
B. Execution user test to evaluate the usability of website
Previously, tasks to be performed by users were designed for usability test of website, grouping these
in next three steps:
Step 1: Provide to users specific instructions from their tasks to be performed, using an electronic and
printeddocument. This was refined from a draft handbook used in a previous usability study [3].
Step 2: The users were instructed in the tasks to be executed when they accessing website, and
information that they should get when they were interacting with web interface; also, it was explained to
them how register information about realization of their tasks; and how to use base 7Likert
questionnairetrying to avoid in results a possible bias. Treatment of the users were with respect and
kindness, gaining their confidence so that they would be willing to expose in a written or verbal form
their doubts, observations and comments. As result, users weremore active and more enthusiastic
when they were resolving the tests. Each interaction of them with website provided relevant and timely
information.
Step 3: During the development of the user’s test, an evaluator applied two instruments to the users: a
questionnaire to check the usability of website and an observation guide to determine performance and
interaction of them when using the web interface (figure 3).
Fig. 3. User and evaluator during the usability testing of website
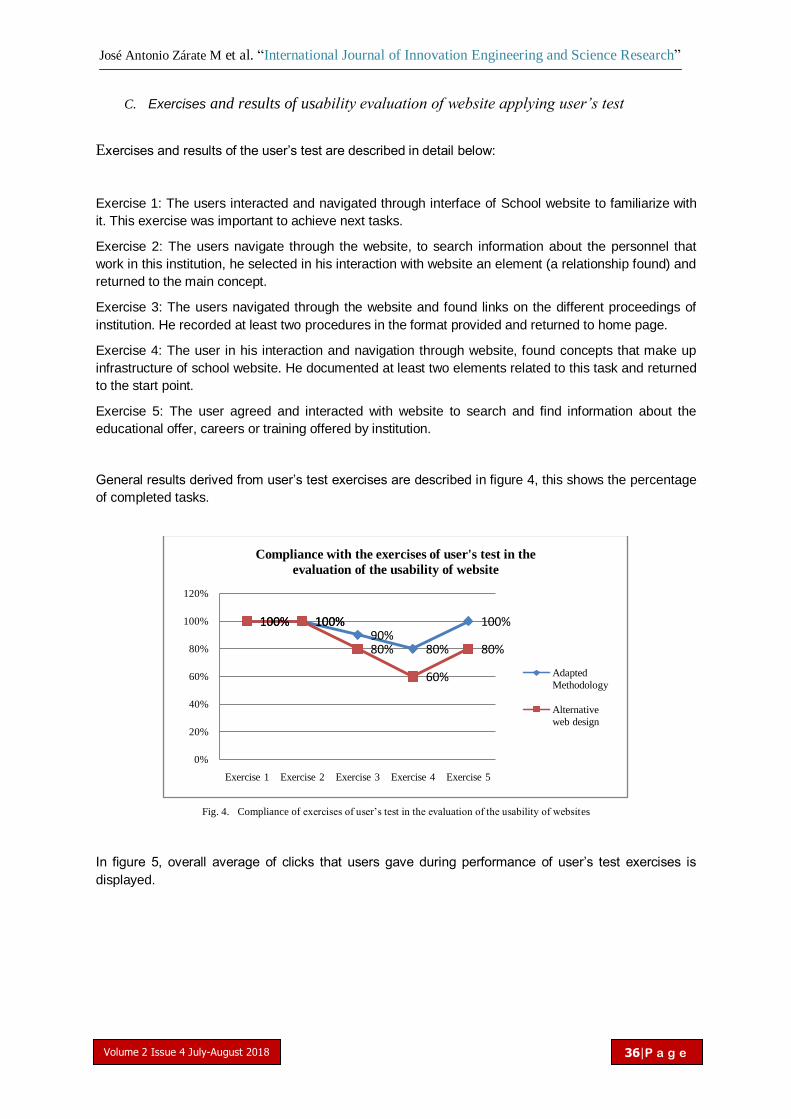
José Antonio Zárate M et al. “International Journal of Innovation Engineering and Science Research”
Volume 2 Issue 4 July-August 2018
36|P a g e
C. Exercises and results of usability evaluation of website applying user’s test
Exercises and results of the user’s test are described in detail below:
Exercise 1: The users interacted and navigated through interface of School website to familiarize with
it. This exercise was important to achieve next tasks.
Exercise 2: The users navigate through the website, to search information about the personnel that
work in this institution, he selected in his interaction with website an element (a relationship found) and
returned to the main concept.
Exercise 3: The users navigated through the website and found links on the different proceedings of
institution. He recorded at least two procedures in the format provided and returned to home page.
Exercise 4: The user in his interaction and navigation through website, found concepts that make up
infrastructure of school website. He documented at least two elements related to this task and returned
to the start point.
Exercise 5: The user agreed and interacted with website to search and find information about the
educational offer, careers or training offered by institution.
General results derived from user’s test exercises are described in figure 4, this shows the percentage
of completed tasks.
Fig. 4. Compliance of exercises of user’s test in the evaluation of the usability of websites
In figure 5, overall average of clicks that users gave during performance of user’s test exercises is
displayed.
100% 100%90%
80%
100%100% 100%
80%
60%
80%
0%
20%
40%
60%
80%
100%
120%
Exercise 1 Exercise 2 Exercise 3 Exercise 4 Exercise 5
Compliance with the exercises of user's test in the
evaluation of the usability of website
Adapted
Methodology
Alternative
web design
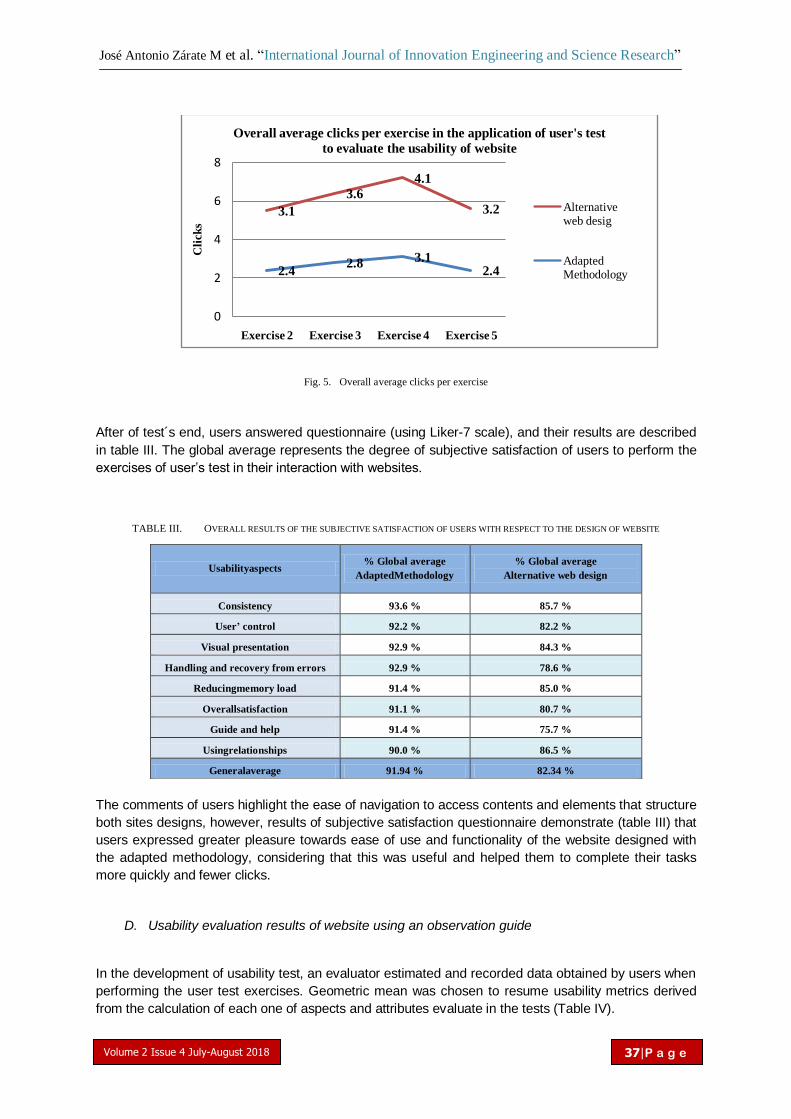
José Antonio Zárate M et al. “International Journal of Innovation Engineering and Science Research”
Volume 2 Issue 4 July-August 2018
37|P a g e
Fig. 5. Overall average clicks per exercise
After of test´s end, users answered questionnaire (using Liker-7 scale), and their results are described
in table III. The global average represents the degree of subjective satisfaction of users to perform the
exercises of user’s test in their interaction with websites.
TABLE III. OVERALL RESULTS OF THE SUBJECTIVE SATISFACTION OF USERS WITH RESPECT TO THE DESIGN OF WEBSITE
The comments of users highlight the ease of navigation to access contents and elements that structure
both sites designs, however, results of subjective satisfaction questionnaire demonstrate (table III) that
users expressed greater pleasure towards ease of use and functionality of the website designed with
the adapted methodology, considering that this was useful and helped them to complete their tasks
more quickly and fewer clicks.
D. Usability evaluation results of website using an observation guide
In the development of usability test, an evaluator estimated and recorded data obtained by users when
performing the user test exercises. Geometric mean was chosen to resume usability metrics derived
from the calculation of each one of aspects and attributes evaluate in the tests (Table IV).
2.42.8 3.1
2.4
3.1
3.6
4.1
3.2
0
2
4
6
8
Exercise 2 Exercise 3 Exercise 4 Exercise 5
Cli
cks
Overall average clicks per exercise in the application of user's test
to evaluate the usability of website
Alternative web desig
Adapted Methodology
Usabilityaspects % Global average
AdaptedMethodology
% Global average
Alternative web design
Consistency 93.6 % 85.7 %
User’ control 92.2 % 82.2 %
Visual presentation 92.9 % 84.3 %
Handling and recovery from errors 92.9 % 78.6 %
Reducingmemory load 91.4 % 85.0 %
Overallsatisfaction 91.1 % 80.7 %
Guide and help 91.4 % 75.7 %
Usingrelationships 90.0 % 86.5 %
Generalaverage 91.94 % 82.34 %

José Antonio Zárate M et al. “International Journal of Innovation Engineering and Science Research”
Volume 2 Issue 4 July-August 2018
38|P a g e
TABLE IV. GLOBAL RESULTS IN THE EVALUATION OF METRICS AND USABILITY ASPECTSOF WEBSITE,
UsabilityMetrics
Attributes
* Time measured in minutes
(min.)
Geometric mean per aspect Percentage
Adapted
methodology
base on
ontologies
Alternative
web design
Relative score
between two
web designs
Improvement
between two
web designs
Success Success 95.4 90.9 104.9 4.9
Content
Time taking the task, min. * 43.3 51.7 119.4 19.4
Errors 9.8 14.2 144.3 44.3
Knowledgememory 80.4 60.3 133.2 33.2
Memory of memory 85.6 79.5 107.6 7.6
Time toremember, seconds 1.9 3.7 192.2 92.2
Efficiency
Functioning in the tasks, min. 4.8 5.7 119.5 19.5
Time spent in errors, min. 8.7 17.1 195.8 95.8
Frequency to go for help 67.8 75.7 111.5 11.5
Efficacy
Taskscompleted at 100% 90.7 81.4 111.3 11.3
Partialtasks 9.2 18.5 200.1 100.1
Success 95.4 90.9 104.9 4.9
Time to complete the task, min. 4.8 5.7 119.5 19.5
Time spent on errors, min. 8.7 17.1 195.8 95.8
Frequency to go for help 67.8 75.7 111.5 11.5
Usersatisfaction
Utility-control, minutes 34.5 30.1 114.3 14.3
Likingforexercises 85.5 68.1 125.6 25.6
Frustration or displeasure for
exercises 14.4 31.9
220.7 120.7
Help in the completion of tasks 84.7 72.2 117.2 17.2
In figure 6, is observed the evaluation of efficiency of websites to access and to search information.
Fig. 6. 1 Geometric mean of efficiency in the usability evaluation of websites
In figure 7 is shown the evaluation of the efficacy of websites, with the adapted methodology is
obtained a success of 95.46% and in fulfillment of the tasks a 90.72%.
4.81
8.73
67.85
5.7517.1
75.71
0
10
20
30
40
50
60
70
80
Functioning in the tasks
Time spent in errors Frequency to go for help
Efficiency of websites
Alternative web design
Adapted methodology
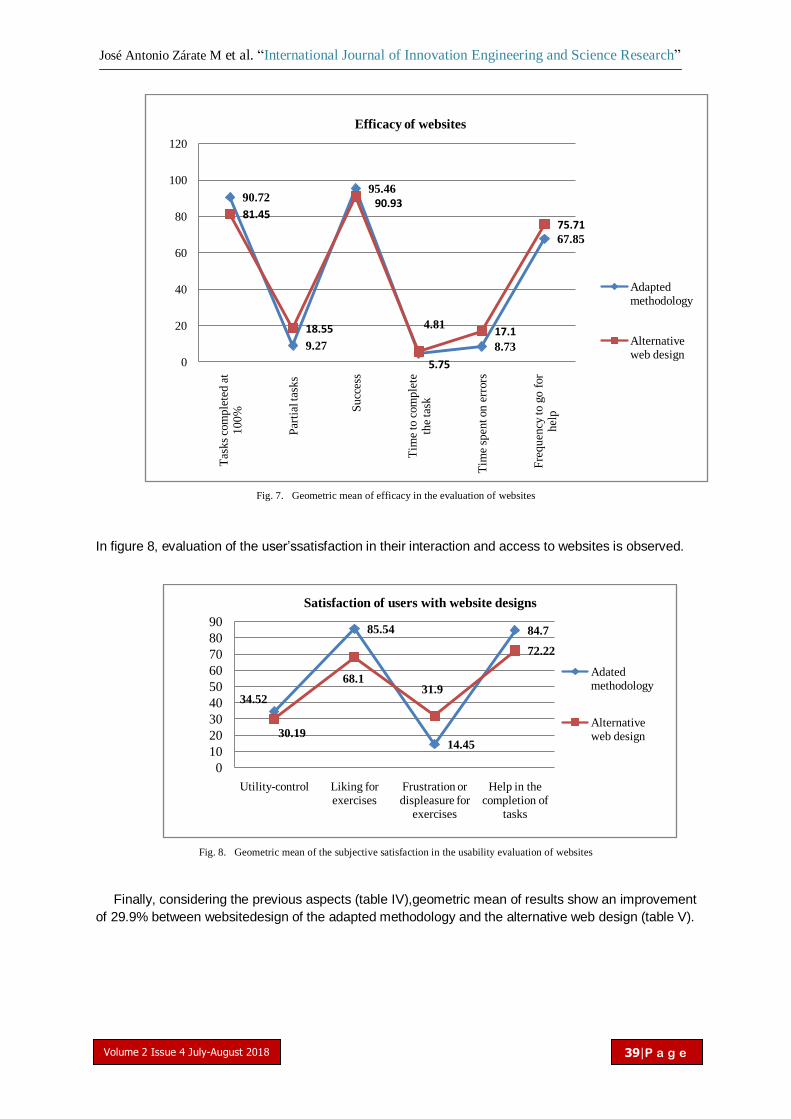
José Antonio Zárate M et al. “International Journal of Innovation Engineering and Science Research”
Volume 2 Issue 4 July-August 2018
39|P a g e
Fig. 7. Geometric mean of efficacy in the evaluation of websites
In figure 8, evaluation of the user’ssatisfaction in their interaction and access to websites is observed.
Fig. 8. Geometric mean of the subjective satisfaction in the usability evaluation of websites
Finally, considering the previous aspects (table IV),geometric mean of results show an improvement
of 29.9% between websitedesign of the adapted methodology and the alternative web design (table V).
90.72
9.27
95.46
4.81
8.73
67.85
81.45
18.55
90.93
5.75
17.1
75.71
0
20
40
60
80
100
120
Tas
ks
com
ple
ted a
t 100%
Par
tial
task
s
Succ
ess
Tim
e to
com
ple
te
the
task
Tim
e sp
ent on e
rrors
Fre
quen
cy t
o g
o f
or
hel
p
Efficacy of websites
Adapted methodology
Alternative web design
34.52
85.54
14.45
84.7
30.19
68.131.9
72.22
0
10
20
30
40
50
60
70
80
90
Utility-control Liking for exercises
Frustration or displeasure for
exercises
Help in the completion of
tasks
Satisfaction of users with website designs
Adated methodology
Alternative web design

José Antonio Zárate M et al. “International Journal of Innovation Engineering and Science Research”
Volume 2 Issue 4 July-August 2018
40|P a g e
TABLE V. GEOMETRIC MEAN RESULTS IN THE VALIDATION OF USABILITY OF WEBSITE
IV. CONCLUSIONS
Techniques applied in evaluating of the usability of websites were based on user-centric design
(UCD)[14], this required implementing valuation instruments and involving potential users to test their
interaction with website. Different evaluation methods used in usability test, such as heuristic test and
user test helped us to understand and know participants interests, their needs of information, their
subjective perception and observations. These methods favored to understand fulfillment heuristics
and usability metrics in websitedesign, and so that we need concrete information about facility of use,
efficiency, efficacy and subjective satisfaction; as well as main problems and limitations of the design,
and the proposal to optimize this toward a better experience for users.
The results obtained in the usability test of website with the heuristic test, the observation guide and
usability metrics give validity to the affirmation that using the methodology [3] in the design of web
structure, provides a more accessible, simple and intuitive interface to the final-user. This improves
efficiency in search of information because its structure is organized, coherent and consistent;
therefore, this ensures efficiency of website’s operation to facilitate navigation to the users, allow them
to access more quickly and less time to elements and content of pages; and it provides satisfaction to
the users during their interaction, adapting website to theirs real needs of search.
REFERENCES
[1] T. A. Powell, Web design. The complete reference, Mc Graw Hill/ Osborne, 2002.
[2] J. Nielsen, "Ten Usability Heuristics," 1994. [Online]. Available:
http://www.useit.com/papers/heuristic/heuristic_list.html. [Accessed 10 May 2015].
[3] A. Rosales, Adaptation of a methodology to define a website structure based on ontology design with a focus on
usability, Master Degree Thesis unpublished, San Luis Potosí, México: Technological National of Mexico, 2018.
[4] A. D. CS5, "Adobe Dreamweaver CS5," 2015. [Online]. Available:
https://www.adobe.com/mx/products/dreamweaver.html?
sdid=KQPSF&mv=search&s_kwcid=AL!3085!3!47835133542!e!!g!!
adobe%20dreamweaver%20cs5&ef_id=V9CkqgAABV9ir5bA:20160907233714:s#. [Accessed 10 February 2015].
[5] Y. Hassan and F. Martín, "Test method with users," 2003. [Online]. Available:
http://www.nosolousabilidad.com/articulos/test_usuarios.htm. [Accessed 10 February 2015].
Usability metrics
Evaluated in website design
Geometric mean
per usability
metrics of relative
score
Improvement between the
design of website of adapted
methodology and the
alternative web design
Success 104.98 4.98 %
Content 136.60 36.6 %
Efficacy 135.22 35.2 %
Efficiency 137.73 37.7 %
Satisfaction 138.86 38.8 %
Geometric mean of usability
metrics between website of the
adapted methodology and the
alternative web design
129.97 29.9 %

José Antonio Zárate M et al. “International Journal of Innovation Engineering and Science Research”
Volume 2 Issue 4 July-August 2018
41|P a g e
[6] J. Nielsen, "Usability 101: Introduction to Usability; Jakob Nielsen’s Alertbox," 2003. [Online]. Available:
http://www.useit.com/alertbox/20030825.html. [Accessed 24 April 2018].
[7] L. J. Cueva, "Usability metrics on the Web," 2008. [Online]. Available:
http://di002.edv.uniovi.es/~cueva/asignaturas/doctorado/2004/MetricasUsabilidad.pdf. [Accessed 10 February
2015].
[8] J. Nielsen, "Usability Engineering," 1993. [Online]. Available: http://www.gobookee.net/jakob-nielsen-usability-
engineering/. [Accessed 20 February 2015].
[9] T. Tullis and B. Albert, "Measuring the user experience: Collecting, Analyzing and Presenting Usability Metrics,"
2008. [Online]. Available:
http://books.google.com.mx/books?id=bPhLeMBLEkAC&pg=PT4&lpg=PT4&dq=Measuring+the+user+experience.
+Elsevier:+Morgan-
Kaufmann,+2008&source=bl&ots=R7QgcqT0sM&sig=nWaUX3xPR_CZAEPILSUdmXnMjPo&hl=es&sa=X&ei=Bi3n
UffxI4rK9gTqkYHwAQ&ved=0CGoQ6AEwBg. [Accessed 10 February 2015].
[10] Z. Pérez and M. Peris, "Usability metrics," 2011. [Online]. Available:
http://recuperacionyaccesoalainformacion.retrocables.es/metricas_usabilidad_calidad.html. [Accessed 10 February
2015].
[11] I. Marnet, "Usability metrics," 2008. [Online]. Available: http://www.deinterfaz.com/blog/medir-metricas-de-
usabilidad. [Accessed 15 January 2015].
[12] I. Claros, "Design guidelines for development of usable applications under web environments," 2006. [Online].
Available: http://artemisa.unicauca.edu.co/~iclaros/usabilidad/chapter3.htm. [Accessed 1 March 2015].
[13] Y. Jiménez and J. Regincós, "Interaction Person Computer," 1999. [Online]. Available:
http://www.jampress.org/JOM_V3N2.pdf. [Accessed 10 March 2015].
[14] D. J. Mayhew, Principles and Guidelines in Software User Interface Design, Prentice-Hall, 1992.
[15] J. Whiteside, J. Bennett and K. Holtzblatt, "Usability Engineering: Our Experience and Evolution, Handbook of
Human Computer Interaction," 1998. [Online]. Available:
http://books.google.com.mx/books?id=WuQbERgXR10C&pg=PA688&lpg=PA688&dq=Usability+Engineering:+Our
+Experience+and+Evolution,+Handbook+of+Human+Computer+Interaction,+1988&source=bl&ots=-
_BDfIQFjS&sig=5dmzWKSyKob8k6GOLuso_KbQOCk&hl=es&sa=X&ei=-YPoUejbFoju8AT. [Accessed 30 January
2015].
[16] M. Mascheroni, C. Greiner, R. Petris, G. Dapozo and M. Estayno, "Software Quality and Usability Engineering," in
XIV Workshop of researchers in computer science, Misiones; Argentina, 2012.

International Journal of Innovation Engineering and Science Research
Open Access
Volume 2 Issue 4 July-August 2018
42|P a g e
ABSTRACT
Usability study of a methodology based on
concepts of ontology design to define website
structures
José Antonio Zárate M., Angélica Rosales L, Ma. Guadalupe Guerrero N., Beatriz
Oralia Ríos V. Francisco Javier Segura M.
Institute of Technology of San Luis Potosi, Tecnológico avenue s/n Col. UPA, Soledad de Graciano Sanchez
San Luis Potosí, México.
Today, Web site design is used to make sites useful to users, with accessible functions, resources and
information. Therefore, that design involves use of methodologies that allow an adequate structuring of them
resources and organization, permitting users to access them quickly, easily and intuitively. This research
consisted of a usability study oriented to website structure designers using a methodology based on concepts of
ontology design. This study includes a planning to evaluate the design and the structure of website in aspects
such as: ease of use, efficient access to information and performance on the tasks focused to total satisfaction of
end user. Heuristic tests were used as diagnostic tools to evaluate usability of website design structures; these
were supported by a heuristic evaluation guide and in the Sirius methodology[3]. The results obtained from them,
allowed us to detect opportunities for improvement and optimization in website design, and in refining the Web
interface oriented to end users.
Keywords—Ontology, heuristic tests, usability, websites
I. INTRODUCTION
Web design includes: technical development, structure of information and visual design [11]. However,
design of an accessible website requires an architecture model that is well structured and organized,
functional, with useful content; and that involves usability since the beginning of its design. This is a
quality attribute that measures ease of use in user interfaces (IU) [8].
This work describes a usability study directed to designers of websites structures, where they will apply
an adapted methodology [13], with the objective to provide facility of understanding and use of the
website structure, efficiency and efficacy to find information, functionality and satisfaction of website
users.
II. DESCRIPTION OF PROBLEM
Evaluation of the usability is a process that establishes a reliable measure of the facility with which
users interact with a system [5]. Therefore, usability evaluation is an empirical study with real users of
the proposed system; this has the target of providing feedback on software development during
iterative development life cycle [12]. The most important purpose of process or product evaluation is
not to demonstrate its functionality but to improve it [4]. These concepts of usability are summarized in
figure 1:

José Antonio Zárate M et al. “International Journal of Innovation Engineering and Science Research”
Volume 2 Issue 4 July-August 2018
43|P a g e
Fig. 1. Diagram that defines five quality components of usability
In a previous work was defined a methodology of website design based on concepts of ontology [2]
oriented to obtain a more usable website design; experimental stage to determinate its possible
benefits was missing. This problem is present in mostly proposed methodologies.
Subsequently, in this research was realized an evaluation of the understanding of the users and the
acceptance of the mentioned methodology [2], making it some improvements based on ontology
design concepts [14] [10] and didactic techniques [6][8], this delivered as a result an adapted
methodology [13].
III. EVALUATION METHODOLOGY
Our proposal is to design and to apply an evaluation schedule to measure degree of usability of the
design of the structure of the website using the adapted methodology. Evaluation will help to identify
aspects that are part of the design of the site, determining its simplicity and ease of use, efficiency and
effectiveness in information access.
These assessments will help to identify opportunities for improvement and optimization in the adapted
methodology, and in completing the design of user-friendship Web interface. These tests was oriented
to measure aspects of usability of an accessible design, functionality to accomplish specific tasks of
search of information, and finally total satisfaction of the end users.
In this study, heuristic tests [7],[3] has been applied; contemplating in these strategies usability metrics
applied in Web design [9]. Two teams of designers were involve in define the structure of a school
website, first one using adopted methodology and the other group by means of alternative method [1].
To avoid any statical bias, both teams use Adobe Dreamweaver CS5 and HTML to design the Web
structure.

José Antonio Zárate M et al. “International Journal of Innovation Engineering and Science Research”
Volume 2 Issue 4 July-August 2018
44|P a g e
A. Evaluation of usability applying heuristic tests
The general description of the group of testers can be seen in table I, as well as description of material
and equipment used is shown in table II. Mechatronics Laboratory of the Faculty of Engineering of the
Autonomous University of San Luis Potosí was used to carry out the tests.
TABLE I. GENERAL INFORMATION OF THE GROUP OF EVALUATORS IN THE USABILITY OF THE WEBSITE DESIGN
Item Description
Education Level 6 graduate, 4 Master degree students
Age From 35 to 40 years old
Gender 6 women, 4 men
TABLE II. MATERIAL AND EQUIPMENT USED IN EVALUATIONS
Equipment and
software
3 Laptops Hewlett Packard, 2 Laptops Toshiba and 1 Laptop Acer
Epson Power Lite S6+ Projector.
Operating system: Windows XP and Windows 7.
Internet browser: Mozilla Firefox, Internet Explorer, Google Chrome.
Material Heuristic test documentation (Digital and printed)
Blank sheets, pencil.
Valuation instruments were delivered to evaluators for the adapted methodology and the alternative
website design; they carried out the following activities:
They opened Internet browser with each one of websites to be evaluated
They accessed and interacted with each one of websites
They applied the heuristics tests
They registered the data obtained of the evaluations through Likert scales.
Afterwards, the records obtained were normalized, using statistics for their presentation as
percentages. The meaning of the percentage scale of heuristic in evaluated pages was 0, for minimum
expression and 100 for maximum expression.
IV. RESULTS AND ANALYSIS OF THE EVALUATIONS
The results of the heuristics (see table III) shown that the structure of the website with the adapted
methodology has a more coherent, familiar and intuitive design (5); also, there is a better organization,
homogeneity and visualization of information on its pages (2). These outcomes confirm a web design
more oriented to the end-user (3).
TABLE III. AVERAGES OF HEURISTICS IN USABILITY EVALUATION OF THE WEBSITE STRUCTURE

José Antonio Zárate M et al. “International Journal of Innovation Engineering and Science Research”
Volume 2 Issue 4 July-August 2018
45|P a g e
No. Heuristics generals
% Global percentage
Adapted
methodology
Alternative
method of Web
design
1 Are the objectives of website specific and well defined? 92 92
2 Are the contents or services offer by website showed in a
accurate and complete way?
96 88
3 Is the general structure of website oriented to end user? 88 80
4 Are the look & feel of website oriented to the objectives,
characteristics, content and services?
84 80
5 Is coherent general design? 96 92
6 Is recognizable website general design? 88 88
7 Is website update periodically? 92 76
Heuristics of identity and information (see table IV) show that the web design using adapted
methodology obtained improvement in identification of site and its objective (8, 10, 11) with a visible
and informative logotype that supports this characteristic (9).
TABLE IV. AVERAGES OF HEURISTICS OF IDENTITY AND INFORMATION IN USABILITY EVALUATION OF WEBSITE STRUCTURE
No. Heuristics of identify and information
% Global percentage
Adapted
methodology
Alternative method
of Web design
8 Is website identity show clearly across all its pages? 96 72
9 Is identifiable and sufficiently visible the Logotype? 100 76
10 Is the slogan really expressing that is the company and that
services offer?
92 72
11 Is there a link with information about the company, website
and webmaster?
96 72
12 Are there in company options for contact? (Email, telephone,
postal address, fax...)
88 88
13
Is clearly showed information in articles, news, reports, etc.?
About the author, sources, date of creation and review of the
document.
88 84
In heuristics of labeled (see table V), design of the website using our methodology was more friendly
and familiar (14), because the information on its pages was transmitted with a clear and congruent
language (15, 16). This validates a website interface more accessible and user-oriented (17).
TABLE V. AVERAGES OF HEURISTICS OF LABELING IN USABILITY EVALUATION OF WEBSITE STRUCTURE

José Antonio Zárate M et al. “International Journal of Innovation Engineering and Science Research”
Volume 2 Issue 4 July-August 2018
46|P a g e
No. Heuristics of labeling
% Global percentage
Adapted
methodology
Alternative method
of Web design
14 Is language used in website similar to users’ language? 88 72
15 Is being used a clear and concise language in website? 92 80
16 Is there a friendly, familiar and intuitive language in
website?
92 76
17 One paragraph = one idea, it is equal to one informative
object.
96 88
In heuristics of structure and navigation (see table VI), the design applying first methodology shows a
progress in organization of hierarchic structure (18), this facilitates to identify elements that compose
them (19); and also give support to the experience of users in navigation through its pages (22), end-
users recognize more quickly path to reach required information (24).
TABLE VI. AVERAGES STRUCTURE AND NAVIGATION HEURISTICS IN USABILITY EVALUATION OF WEBSITE STRUCTURE
No. Heuristics of structure and navigation
% Global percentage
Adapted
Methodology
Alternative method
of Web design
18 Are you obtaining most appropriate organization and navigation
structure with this design?
96 92
19 Does hierarchical structure maintains a balanced between depth
and width?
96 88
20 Are all the clusters of nodes connected? 92 88
21 Are the links recognizable easily? Is state attributes indicated?
what was visited, what is active, etc.
92 88
22 Has been controlled number of terms by element in navigation
menus to avoid overload memory?
96 92
23 Is the answer of the system predictable before clicking on link? 88 84
24 Has been controlled in the design that there is not broken links? 100 88
25 Are there navigation elements that guide to user about where he
is and how to return?
92 84
26 Are images recognized as links? Do these images include a title
tag describing the target page?
88 84
27 Are not there redundant links? 96 88
28 Are there in design orphan pages? 96 88
The results heuristics of Lay-Out page indicate that web design of adapted methodology presents a
better distribution of its elements (29, 30), because it was possible to identify its organization of its
hierarchical structure and distribution of relations that comprise them (33); we obtain a web interface
more intuitive for end-users and easy access, with properly distributing elements and avoiding visual
and informative overload (31, 32); see table VII.
TABLE VII. AVERAGES OF HEURISTICS OF PAGE LAY-OUT IN USABILITY EVALUATION OF WEBSITE STRUCTURE

José Antonio Zárate M et al. “International Journal of Innovation Engineering and Science Research”
Volume 2 Issue 4 July-August 2018
47|P a g e
No. Heuristics of page Lay-Out
% Global percentage
Adapted
methodology
Alternative
method of Web
design
29 Does the design take advantage of areas of high informative
hierarchy of page to show most relevant contents?
88 80
30 Is information overload avoided in website? 92 88
31 Is clean and without visual noise the web interface? 96 84
32 Does right the use of visual space in web site? 92 88
33 Is used correctly the visual hierarchy to express “part of”
relationship between elements of the page?
96 88
34 Is controlled length of the page? 88 84
35 Are there any “empty areas” on page between informative
objects to rest your eyes?
92 88
In both designs, we used heuristics of search but we gave less importance to these, because it was not
possible to evaluate all the necessary attributes (see table VIII).
TABLE VIII. AVERAGES HEURISTICS OF SEARCH IN USABILITY EVALUATION OF WEBSITE STRUCTURE
No. Heuristics of search
% Global percentage
Adapted
Methodology
Alternative method
of Web design
36 Is the search element easily accessible in website? 88 72
37 Is the search element easily recognizable in website? 88 76
Through the evaluations heuristics of multimedia elements, were observablein both web designs that
image objects have a suitable distribution (44, 45), this reveals that web design of the adapted
methodology shows improvement in the size and identification of these (42); see table IX.
TABLE IX. AVERAGES HEURISTICS OF MULTIMEDIA IN USABILITY EVALUATION OF WEBSITE STRUCTURE
No. Heuristics of multimedia elements
% Global percentage
Adapted
Methodology
Alternative method
of Web design
42 Are the photographs well-trimmed? ¿Are these
understandable? Had they a proper resolution?
96 88
43 Are visual metaphors recognizable and understandable by
any user?
92 84
44 Do the images or animations provide some type of value
added?
88 88
45 Has website been avoided the use of cyclical animations? 96 92
Evaluating accessibility heuristics was observable in both website designs (see table X) use of legible
and visible fonts to easy-reading (46, 47), as well as compatibility of website with different browsers
(50); also in any website was not necessary to install additional software applications (51); however,
the web design with our methodology simplified this work of interaction to end-users with one improved
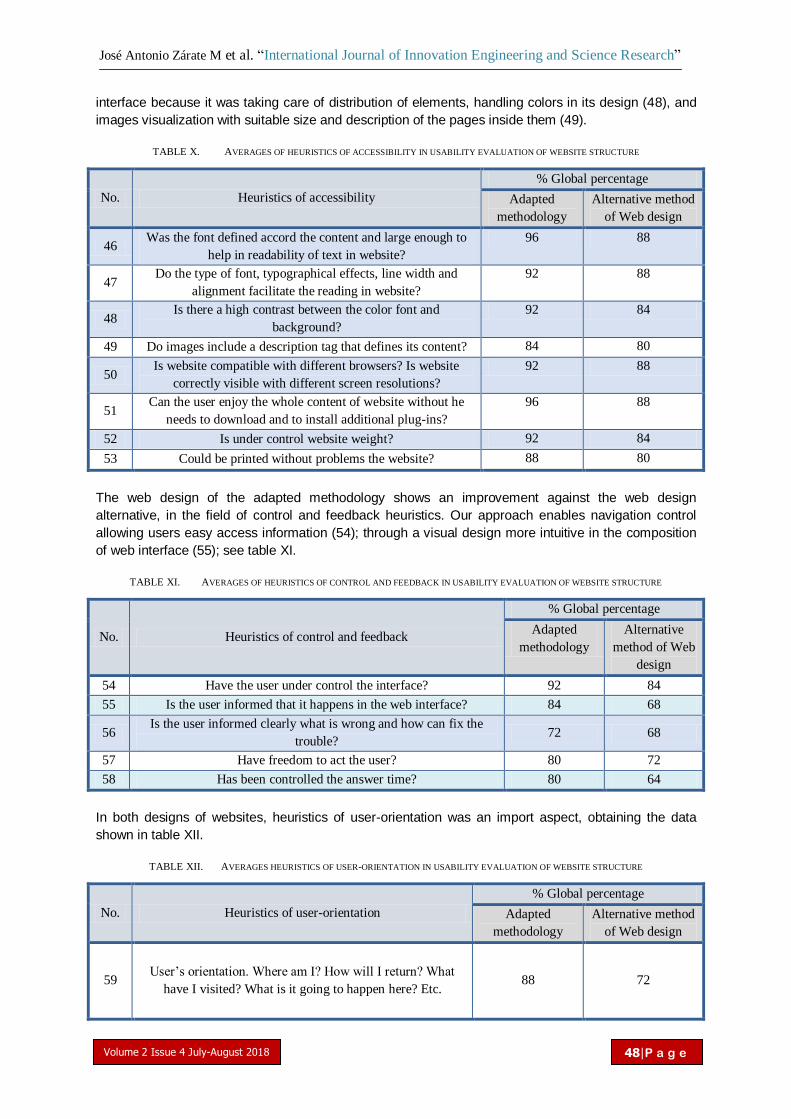
José Antonio Zárate M et al. “International Journal of Innovation Engineering and Science Research”
Volume 2 Issue 4 July-August 2018
48|P a g e
interface because it was taking care of distribution of elements, handling colors in its design (48), and
images visualization with suitable size and description of the pages inside them (49).
TABLE X. AVERAGES OF HEURISTICS OF ACCESSIBILITY IN USABILITY EVALUATION OF WEBSITE STRUCTURE
No. Heuristics of accessibility
% Global percentage
Adapted
methodology
Alternative method
of Web design
46 Was the font defined accord the content and large enough to
help in readability of text in website?
96 88
47 Do the type of font, typographical effects, line width and
alignment facilitate the reading in website?
92 88
48 Is there a high contrast between the color font and
background?
92 84
49 Do images include a description tag that defines its content? 84 80
50 Is website compatible with different browsers? Is website
correctly visible with different screen resolutions?
92 88
51 Can the user enjoy the whole content of website without he
needs to download and to install additional plug-ins?
96 88
52 Is under control website weight? 92 84
53 Could be printed without problems the website? 88 80
The web design of the adapted methodology shows an improvement against the web design
alternative, in the field of control and feedback heuristics. Our approach enables navigation control
allowing users easy access information (54); through a visual design more intuitive in the composition
of web interface (55); see table XI.
TABLE XI. AVERAGES OF HEURISTICS OF CONTROL AND FEEDBACK IN USABILITY EVALUATION OF WEBSITE STRUCTURE
No. Heuristics of control and feedback
% Global percentage
Adapted
methodology
Alternative
method of Web
design
54 Have the user under control the interface? 92 84
55 Is the user informed that it happens in the web interface? 84 68
56 Is the user informed clearly what is wrong and how can fix the
trouble? 72 68
57 Have freedom to act the user? 80 72
58 Has been controlled the answer time? 80 64
In both designs of websites, heuristics of user-orientation was an import aspect, obtaining the data
shown in table XII.
TABLE XII. AVERAGES HEURISTICS OF USER-ORIENTATION IN USABILITY EVALUATION OF WEBSITE STRUCTURE
No. Heuristics of user-orientation
% Global percentage
Adapted
methodology
Alternative method
of Web design
59 User’s orientation. Where am I? How will I return? What
have I visited? What is it going to happen here? Etc. 88 72

José Antonio Zárate M et al. “International Journal of Innovation Engineering and Science Research”
Volume 2 Issue 4 July-August 2018
49|P a g e
The design of the website with our approach presents an advantage against opposite, about several
evaluated usability heuristics. This means that our methodology has the benefit of maintaining a more
organized and simple structure, which facilities to users access to information in less time (efficiency)
and interaction with a design more intuitive and consistent for a browsing experience more satisfactory.
V. CONCLUSIONS
The results obtained from the heuristic tests in the usability evaluation of the design of the website
structure with the adapted methodology show a high score in the aspect of structure and navigation of
93.8% [13] against 87.6% of alternative method [1]; in accessibility was achieved 91.5% against 87%
and in control and feedback, 81.6% versus 71.2%. The general average of usability heuristics was
90.6% in our proposal in contrast to 79.9% in the alternate approach.
The results derived from the evaluations allow validate efficiency and usability of website structure
designed with our methodology. These results reveal that the structure designed had the following
gains:
A better organization, distribution and structuring of their pages and elements.
Major accessibility in its web interface for the hierarchy of the relations and its concepts, providing a
more intuitive and familiar browsing.
There is consistency in the visual design of its pages, because it unifies similar colors, legible and
visible fonts.
This design provides descriptive information in each element: images, logotype, buttons and
navigation options, among others.
It provides satisfaction to end-user; also offers control and feedback on their pages, because the
user is guided and helped, so that he knows where to have to move or where to navigate,
supplying required information.
A user-oriented design, with objects and content in consideration of real requirements and needs.
REFERENCES
[1] Adobe Dreamweaver CS5. [Online] [Accessed in February 2015]; Available in:
https://www.adobe.com/mx/products/dreamweaver.html?
Sdid=KQPSF&mv=search&s_kwcid=AL!3085!3!47835133542!e!!g!!
adobe%20dreamweaver%20cs5&ef_id=V9CkqgAABV9ir5bA:20160907233714:s#; 2015.
[2] Baños M.; “Methodology to define a Web site Architecture based in ontology design” (thesis), Morelos, México; National
Center of Research and technological Development, Computer Science Department; September 2008, 114 p.
[3] Carreras, O.; “Sirius: system for Web Usability evaluation oriented to user based in critical tasks determination”;
[Online]; [Accessed in February 2015]; Available in: “https://olgacarreras.blogspot.mx/2011/07/sirius-nueva-sistema-
para-la-evaluacion.html”; 2011.
[4] Castillo S.; “Educacional Evaluation commitments”, Madrid, Pearson Education S.A., ISBN: 84-205-3562-1, 2002.
[5] Claros I.; “Design guidelines to Usable applications design in a Web Environment”; Online]; [Accessed in December
2014]; Available in: “http://artemisa.unicauca.edu.co/~iclaros/usabilidad/ chapter3.htm”; 2006.
[6] Diaz B. F.; “Teaching Strategies for a significant Learning”; [Online]; [Accessed in July 2011 ]; castiAvailable in:
“http://redescolar.ilce.edu.mx/redescolar/biblioteca/articulos/pdf/ estrate.pdf”.
[7] Hassan Y., Martín F., “Tests with users Method”; [Online]; [Accessed in December 2014]; Available in:
“http://www.nosolousabilidad.com/articulos/test_usuarios.htm”; 2003.
[8] Mayer R.; “Teaching Strategies for a significant Learning: Constructivist approach”; [Online]; [Accessed in July 2014];
Available in: “http://redescolar.ilce.edu.mx/redescolar/biblioteca/articulos/pdf/estrate.pdf”; 1999.
[9] Nielsen J.; “Usability 101: Introduction to Usability. Jakob Nielsen’s Alertbox”; [Online]; [Accessed in December 2014];
Available in: “http://www.useit.com/alertbox/20030825.html”; 2003.

José Antonio Zárate M et al. “International Journal of Innovation Engineering and Science Research”
Volume 2 Issue 4 July-August 2018
50|P a g e
[10] Noy N. F., McGuinness D. L.; “Ontology Development 101: A Guide to Creating Your First Ontology”; Stanford
Knowledge Systems Laboratory Technical Report KSL-01-05 and Stanford Medical Informatics Technical Report SMI-
2001-0880.
[11] Powell T. A.; “Web design. The complete reference”; 2nd edition; Mc Graw Hill/ Osborne; 2002.
[12] Mayhew D.J.; “The Usability Engineering Lifecycle: A practitioner’s Handbook for User Interface Design”. 1999.
[Online]; [Accessed in November 2014]; Available in: “http://lsi.ugr.es/~mgea/workshops/coline02/Articulos/toni.pdf”;
1999.
[13] Rosales A. “Adaptation of a Methodology to define a Web site Structure based in ontology design with a usability
approach” (thesis), Institute of Technology of San Luis Potosí, waiting for grade defense date.

International Journal of Innovation Engineering and Science Research
Open Access
Volume 2 Issue 4 July-August 2018
51|P a g e
ABSTRACT
–
Control of Direct Current Machine by the Change
of Resistance in Armature Circuit
BIYA MOTTO Frederic1k
, TCHUIDJAN Roger2, NDZANA Benoît
2, TATSA
TCHINDA COLINCE3.
1- Faculty of Science, University of Yaounde I, PO.Box 812 Yaoundé, Cameroun;
2- National Advanced School of Engineering of Yaounde;
3- Mekin Hydroelectric Development Corporation, PO.Box 13155 Yaoundé, Cameroon;
The control of motor rotation speed by the change of resistor resistance value in armature circuit is
called ‘resistor control”. For the regulation of resistance value R0, included in armature winding circuit,
we can use various technical solutions. The most used solution is the discrete variation of armature
added resistance value by shunting its parts with contactors contacts.
Nowadays, the change of resistor resistance in armature circuit can be realized by shunting
with a given porosity γ of resistor R0 trough electronic keys. In this paper, we study the design of
control system represented on figure 1.
Keywords: Control of DC machine, change of resistance, armature circuit
I. INTRODUCTION
DC motors consist of rotor-mounted windings (armature) and stationary windings (field poles). In all
DC motors, except permanent magnet brushless motors, current must be conducted to the armature
windings by passing current through carbon brushes that slide over a set of copper surfaces called a
commutator, which is mounted on the rotor.[1][2]
The commutator bars are soldered to armature coils. The brush/commutator combination
makes a sliding switch that energizes particular portions of the armature, based on the position of the
rotor. This process creates north and south magnetic poles on the rotor that are attracted to or
repelled by south and north poles on the stator, magnetic attraction and repulsion that causes the
rotor to rotate.[3][4]
The dynamic behavior of DC machine is mainly determined by the type of the connection
between the excitation winding and the armature winding including the commutation and
compensation winding.
The greatest advantage of DC motors may be speed control. Since speed is directly
proportional to armature voltage and inversely proportional to the magnetic flux produced by the
poles, adjusting the armature voltage or the field current will change the rotor speed.[5]
Speed control means change of a speed to a value required for performing the specific work
process. This adjustment should not be taken to include the natural change in speed which occurs
due to the change in the load on the drive shaft. The electrical speed control has many economical as
well as engineering advantages over mechanical speed control. There are so many methods for
controlling the speed of a DC shunt motor but field rheostat control method is most reliable, economic
and independent of load on the motor. This method is only applicable when we want speed which is
higher than the normal speed of the motor. In this method, an increase in controlling resistance
reduces the field current with a consequent reduction in flux and an increase in speed. But if we want

BIYA MOTTO Frederic et al. “International Journal of Innovation Engineering and Science Research”
Volume 2 Issue 4 July-August 2018
52|P a g e
to obtain low speed to control the low speed mechanical drive, we use armature rheostat control
method. In this method, the speed at full load can be reduced to any desired value depending on the
amount of resistance. But if we use both techniques in same machine then we can control motor from
zero speed to maximum.[6]
In field control the adjustment can be obtained by means of a small
rheostat and relatively good speed regulation is obtained for all speed but with the armature control a
bulky resistance is required. So if we use both methods simultaneously, cost of the machine will
increase a little but we will get a large range of speed control. To neutralize the effect of power loss
heat sink can be used. So by this method we can control the speed of a DC shunt motor to perform
various tasks in effective and economic way.
II. EQUATIONS OF ELECTRIC DRIVE POWER CHANNEL WITH REGULATION OF
RESISTANCE IN ARMATURE CIRCUIT
The system of resistor control of electromotor M rotation speed with separate excitation is
composed of additive resistance R0 in armature circuit, transistor VT, transistor control system CS VT,
current captor CC1 with shunt RS1, speed captor BR and control installation (figure 1)
We shall assume that we supply in excitation winding and in armature winding direct current nominal
voltage UN. Additive resistor R0 and transistor VT with control system CS VT constitute electrical
transducer. The control of resistance value in armature circuit is done by the switch of transistor VT
with porosity γ є [0,1].
If the working period of transistor control pulses is much more higher than the time constant of
armature circuit, then we can prove that the equivalent resistance R included in armature circuit is
𝑅 = 𝛾𝑅0
Thus the input signal of electrical transducer is the porosity γ є [0,1], and the output is the
equivalent resistance R. By varying R, we change armature current 𝑖2 and the electromagnetic torque
(moment) M.
To the electric drive resistor circuit in figure 1, we can match an armature equivalent circuit
represented in figure 2.
Figure 2: Armature circuit equivalent circuit

BIYA MOTTO Frederic et al. “International Journal of Innovation Engineering and Science Research”
Volume 2 Issue 4 July-August 2018
53|P a g e
In that circuit, R2 – active resistance of armature;
L02 – armature inductance;
𝛾𝑅0- Additive resistance; γ є [0,1];
𝐸 = 𝛹 - armature e.m.f
𝛹 = 𝑈𝑁/𝐵 – constant expression;
𝐵 – Basic armature rotation speed.
The state variables control system that describes the DC machine dynamic properties will
look as follows:
𝑅2∗ . 𝑇2𝑝𝑖2
∗ + 𝑖2∗ = 1 − 𝜔∗ − 𝛾𝑅0
∗ . 𝑖2∗;
𝑇𝑀𝑒𝑐ℎ .𝑝𝜔∗ = 𝑖2∗ − 𝐼𝑟
∗ (1)
We have 𝑖2∗ = 𝑀∗, 𝐼𝑟
∗ = 𝑀𝑐∗
The equation (1) is nonlinear because of the presence of expression𝛾𝑅0∗ . 𝑖2
∗.
The equation (1) corresponds to the structural circuit shown on figure 3. That system has two
input signals: pulses porosity γ and current 𝐼𝑟∗.
γis the control signal while 𝐼𝑟∗is the perturbation.
III. DESIGN OF CONTROL INSTALLATION
The resistance control system is constructed according to subordinate principle. It is
composed of internal armature current loop and external speed loop. The current loop forms the
control signal γ.
According to equations (1), established armature current value is
𝑖2∗ =
1 −𝜔∗
𝑅2∗ + 𝛾𝑅0
∗
From the last expression, when the porosity value γ increases the armature current 𝑖2∗
decreases. Let us introduce new control variable𝑥, linked with γ. We consider𝑥 = 1𝛾 .
Therefore with the increase of𝑥, the armature current 𝑖2∗ will also increase.
The structural circuit of subordinate control system is shown on figure 3. The control system is
composed of internal current loop with integral regulator. The transfer coefficient of current captor 𝐾𝑐∗
is found from the condition 𝐾𝑐∗. 𝐼𝑚𝑎𝑥
∗ = 1, thus 𝐾𝑐∗ = 1/𝐼𝑚𝑎𝑥
∗
𝑝 At the entrance of current loop, we install a current limit element. The maximal current value
𝐼𝑚𝑎𝑥∗ should be limited to ensure given static and dynamic loads in electric drive mechanism and
reliable functioning of collector-mechanism. As a rule, the armature maximal current value 𝐼𝑚𝑎𝑥∗ is
equal to 1,2;….;2,0.
The current limitation at a given level 𝐼𝑚𝑎𝑥∗ can be achieved from the limitation of current loop
input signal 𝑥1∗ by the value𝑥1𝑚𝑎𝑥
∗ . If we are given the armature current loop maximal value 𝐼𝑚𝑎𝑥∗ , then
𝑥1 𝑚𝑎𝑥∗ = 𝐾𝑐
∗. 𝐼𝑚𝑎𝑥∗ = 1

BIYA MOTTO Frederic et al. “International Journal of Innovation Engineering and Science Research”
Volume 2 Issue 4 July-August 2018
54|P a g e
IV. DEFINITION OF CURRENT AND SPEED LOOPS PARAMETERS
The parameter of integral current regulator 𝑇𝑟2 should be such that the transient processes in
current control loop will have an etalon aspect. To the current loop corresponds the system of
differential equations:
𝑇𝑟2.𝑝𝑥∗ = 𝑥1
∗ − 𝐾𝑐∗. 𝑖2
∗;
𝑅2∗ . 𝑇2 .𝑝𝑖2
∗ + 𝑖2∗ + 𝑅0
∗ .𝑖2∗
𝑥∗= 1 − 𝜔∗
That system is nonlinear on control signal 𝑥∗. For the determination of time constant for
integral regulator Tr2, we linearize those equations in neighborhood of the working point [𝑥 ∞ ∗,
𝑖2 ∞ ∗]
We observe that the mechanical time constant 𝑇𝑀𝑒𝑐ℎ is sensitively higher than the armature
time constant 𝑇2and the speed 𝜔∗ practically does not change with current regulation, ie ∆𝜔∗ = 0.
Considering p=0, 𝑥∗ = 𝑥(∞)∗, 𝑖2∗ = 𝑖2(∞)∗,
We have equations of stationary working regime:
0 = 𝑥1(∞)∗ −𝐾𝑐∗. 𝑖2 ∞
∗;
𝑅2∗ . 𝑖2(∞)∗ +
𝑅0∗ . 𝑖2(∞)∗
𝑥(∞)∗= 1 −𝜔∗
The solution of that system defines the stationary values of variables
𝑥(∞)∗ =𝑅0∗ . 𝑖2(∞)∗
1 − 𝜔∗ −𝑅2∗ . 𝑖2(∞)∗
; 𝑖2(∞)∗ =𝑥1(∞)∗
𝐾𝑐∗
From linearization results we have the system of equations in variations:
𝑇𝑟2
.𝑝∆𝑥∗ = ∆𝑥1∗ −𝐾𝑐
∗.∆𝑖2∗;
𝑅2∗ . 𝑇2 .𝑝∆𝑖2
∗ + ∆𝑖2∗ +
𝑅0∗
𝑥(∞)∗.∆𝑖2
∗ −𝑅0∗ .𝑖2 ∞
∗
𝑥 ∞ ∗∆𝑥∗ = 0
(2)
From the linearized equations system, we find the transfer function of current loop:
𝑊𝑐𝑙 =∆𝑖2
∗
∆𝑥1∗ =
1 𝐾𝑐∗
𝑇𝜇2𝑝2 + 𝑑.𝑇𝜇𝑝 + 1
Where 𝑇𝜇 = 𝑑.𝑇2𝑅2∗ .𝑖2(∞)∗
1−𝜔 ∗ ;
𝑑 =1 −𝜔∗
1 −𝜔∗ −𝑅2∗ . 𝑖2(∞)∗
. 𝑅0∗ .𝑇𝑟2
𝑥1(∞)∗.𝑅2∗ .𝑇2
≈ 𝑅0∗ .𝑇𝑟2
𝑥1(∞)∗.𝑅2∗ .𝑇2
The damping factor d of transient function will have the minimal value for 𝑥1(∞)∗ = 𝐾𝑐∗. 𝐼𝑚𝑎𝑥
∗ = 1:
𝑑𝑚𝑖𝑛 = 𝑅0∗ .𝑇𝑟2
𝑅2∗ .𝑇2
If we consider 𝑑𝑚𝑖𝑛 = 2, then the current regulator time constant

BIYA MOTTO Frederic et al. “International Journal of Innovation Engineering and Science Research”
Volume 2 Issue 4 July-August 2018
55|P a g e
𝑇𝑟2 = 2.𝑇2 .𝑅2∗/𝑅0
∗.
The current loop time constant 𝑇𝜇will considerably depend on the drive working regime. For
𝜔∗ = 1 −𝑅2∗ . 𝑖2(∞)∗, the time constant will have the highest value 𝑇𝜇 = 2.𝑇2 .
If we assume that the current loop has transfer function
𝑊𝑐𝑙 =𝑖2∗
𝑥1∗ =
1 𝐾𝑐∗
2.𝑇2𝑝2+1
,
then the speed regulator transfer function is on technical optimum
𝑊𝑠𝑟 = 2.𝑇2𝑝 + 1 𝐾𝑐
∗.𝑇𝑀𝑒𝑐ℎ .𝑃
2𝑇𝜇2𝑃. 𝑇𝜇2𝑃 + 1 =𝐾𝑐∗.𝑇𝑀𝑒𝑐ℎ2𝑇𝑟2
= 𝐾𝑠𝑟∗ ,
where 𝑇𝜇2 = 2.𝑇2.
The set of electromechanical (mechanical) characteristics of closed loop control system with
speed regulator will look as shown on figure 5.
Figure 5: The set of electromechanical (mechanical) characteristics with closed loop control system
V. CONCLUSIONS
The dynamic model of Direct Current electrical drive with control by the means of armature
circuit resistance change is nonlinear on control signal. For the construction of current control loop,
the design of regulators is done with linearization of equations (2). It is recommended to use integral
regulator in current loop. At the input of current control loop, we install an armature current limitator.
The speed control loop is external compared to current control loop and it should have a proportional
regulator.
The region of speed regulation by commutation of resistor in armature circuit for the electric
drive is limited by the value of resistor resistance R0 (figure 5). The domain enlargement of speed
regulation by reduction of expression R0 will lead to high commutation survoltages in the transistor
and its destruction.
The enlargement of speed regulation domain can be reached by in series switching of
resistors, with transistor shunts. The reduction of porosity on transistor functioning should be done in
opposite manner.
A deep resistor speed regulation is not energically efficient, because of energy losses.
REFERENCES
[1] www.google.com/speedcontrolofshuntmotor
[2] www.wikipedia.com/shuntmotor
[3] Theory and performance of electrical machine by J.B.Gubta
[4] Electrical machine by I.J Nagrath and D.P. Kothari
[5] Electrical machine by P.S. Bhimra
[6] www.electrical4u.com

International Journal of Innovation Engineering and Science Research
Open Access
Volume 2 Issue 4 July-August 2018
56|P a g e
ABSTRACT
The effect of using solar chimney on reduced
heating load in cold climate of US
Mohammadmehdi Danesh,
PhD student in Architecture, Texas A&M University
In a plethora of countries, buildings are adapted to the local climate condition using sustainable
architecture techniques and materials, thereby the highest level of climatic comfort is provided. For
example, the walls and roofs reflecting sunlight have been used for centuries in the warm regions of
the world, while in the cold regions, the maximum use of solar energy has been tended.
The process of modernization has created a high density, thereby demand for fast and affordable
constructions in cities has subsequently increased, resulting in reduced attention to environmentally
sustainable architecture techniques that, in turn, has led to the financial loss and scarcity of non-
renewable energy resources over long periods of time.
Regarding the energy crisis and the necessity of saving non-renewable energy, the reduced need to
use heating/cooling systems is assumed to be one of the key goals in advanced building design.
The present study was conducted based on causal research and simulation. Design Builder thermal
simulation software was used as the tool to this end. Therefore, a building with/out solar chimney was
modeled and analyzed to identify the effect of solar chimney on the amount of energy used for
heating.
The interior temperature of the building equipped with solar chimney and without mechanical heating
systems was measured to be 22 °C. Given the ambient humidity of 40-60 percent (according to the
field measurements), the measured temperature is within the comfort range. In comfort condition,
regarding the ambient humidity of 40-60 percent, the comfort temperature is between 70-80 °F (22-26
°C)
Keywords: solar chimney, cold climate, reduced heating load
I. Introduction
In a plethora of countries, buildings are adapted to the local climate condition using sustainable
architecture techniques and materials, thereby the highest level of climatic comfort is provided.
Increasing demand for housing has created a high density, therefore the need for fast and affordable
constructions in cities has subsequently increased as well, resulting in reduced attention to issues like
shortage of skilled worker (Escamilla et al., 2018), environmental sustainability, and energy efficiency.
This, in turn, has led to the financial loss and scarcity of non-renewable energy resources over long
periods of time (IEA, 2013).
The first study on solar chimneys was conducted by Bansal and colleagues in 1993. Using a
mathematical model, they proved that solar chimney and correct design of the respective system may
increase ventilation (Bansal et al., 2011). Comparing solar chimney and its conventional counterpart,
Afonso and Oliveira (2010) confirmed the impact of sun's energy on the increased ventilation. As they
suggested, solar chimney may effectively improve ventilation. They have also proved that increased
thermal mass may reduce ventilation throughout the day and increase it during the night. Buchair
(2011) investigated the optimum cavity width in a solar chimney and observed that in Algeria the
optimal width is H /10 (H is the height of the chimney). Charvat et al. (2013) showed that high thermal
mass may increase air velocity and consequently ventilation power at night. They also demonstrated

Mohammadmehdi Danesh. “International Journal of Innovation Engineering and Science Research”
Volume 2 Issue 4 July-August 2018
57|P a g e
that using solar chimney during day may increase air velocity by 25 percent. Punyasompun and
colleagues (2009) experimentally and numerically examined the performance of solar chimney in a
multi-storey building in Bangkok.They presented two small-scale models of a three-storey building
and compared two possible states, i.e. one where each floor has a separate SC channel and one
where three floors are connected to a common SC channel. They finally concluded that the latter, i.e.
a common SC channel for the whole building, may have a better performance.
Khedari and colleagues considered different types of solar chimneys and concluded that they have
effective role in producing airflow. The performance of solar chimney in office buildings equipped with
air conditioning were also studied in this research. It was conclusively found that daily electricity
consumption of ventilation devices may decrease due to using solar chimney (Khedari et al., 2010).
Sudaporn and Bundit have experimentally investigated the impact of solar chimney with and without a
wetted roof on enhanced indoor ventilation. They reported that depending on the ambient temperature
and the amount of solar radiation, the outdoor chimney can reduce the indoor temperature by 1–3.5
degrees (Sudaporn&Bundit, 2014).
Today, considering the increasing importance of energy in the world, many studies have been
focused on energy-efficient buildings design and construction (Rabah, 2011). Using solar energy to
heat homes in the winter has been traditionally known as a solution in all parts of the world (Bodach et
al., 2014). Today also using inactive solar systems can play an important role in reducing energy
consumption in the world and preserving the environment (Tahersimaet all, 2017). These systems
include using, whether directly or indirectly, solar radiation such as greenhouse system, double-
glazed system, or solar chimney having been taken into account in this study (Chandel et al., 2015)
This technique has been used in building construction in many countries. For example, more than 100
buildings have been constructed in the western parts of India in Himalayan mountain ranges(Chandel
et al., 2012).
In the following, the way of using solar chimney system is presented. Firstly, a building, here a
school, was chosen as a sample in the cold region to be simulated by Design Builder energy analysis
software and then results were subsequently analyzed.
Just like other strategy used in education, the division of labor has much importance in the industry
with respect to productivity (Escamilla et al., 2018), Building industry also needs new strategy to
reduce energy consumption in this sector.
II. Research method
The present study was conducted based on causal research and simulation. The best and also the
most convincing way to create a causal relationship is a precise experiment where the impact of latent
variables is controlled as well. Accordingly, a simulation was conducted using thermal software to
identify the temperature effect of solar chimney system embedded in the southern part of an
educational building in addition to observe other climatic principles in the project.
The validity of the Design Builder software has been proved in previous research.By using Virtual
Simulation Game, energy consumption could be simulated. By visiting the main page of the software
web page, it can be seen that the results presented by the software simulations have been validated
and totally recognized by the United Kingdom's decision-making bodies through entering the climate
characteristics of different areas (Design Builder 2015)
To achieve the research purpose and asses the effect of solar chimney on increased efficiency of
modern buildings, the plan of a school in the cold city of Bojnourd was considered as the
sample.However, this mean has some flaw such as technical difficulty like low speed and limit
options.
III. New methods of increasing energy efficiency in the world
In addition to the all requirements of indigenous architecture, today there are other new techniques to
better adapt buildings to the climate conditions, decrease non-renewable energy consumption, and
reduce environmental pollutants production (Tahersima et all, 2017). In cold climates, these

Mohammadmehdi Danesh. “International Journal of Innovation Engineering and Science Research”
Volume 2 Issue 4 July-August 2018
58|P a g e
techniques called inactive heating systems may emphasize the storage of solar radiation in different
ways. Some of these methods include: (1) absorption of direct sunlight, as illustrated in Fig. 4; (2)
absorption of indirect sunlight, as illustrated in Fig. 5; (3) greenhouse, as illustrated in Fig. 6; and (4)
solar chimney system, as illustrated in Fig. 7 (Holloway, 2011).
This study was focused on solar chimney and its effects.
Fig. 1: Internal gain of solar radiation
Fig. 2: Using of indirect solar radiation
The greenhouse method is in fact the same traditional solution of covering south-facing balconies with
glass or nylon (Fateh, 2010). In this technique, the greenhouse environment absorbs heat during the
day, while during the night, absorbed waves with longer wavelength as the result of sequential
reflections fail to exit due to the existing glass walls. In other words, the greenhouse acts like a heat-
saving source at night (Tahersimaet all, 2018).
Greenhouse can be either freestanding or attached to another structure to grow plants (Holloway,
2011).
In the sample plan, in addition to being used for plant cultivation and maintenance, the greenhouse
added to the space flexibility with an appropriate attachment.

Mohammadmehdi Danesh. “International Journal of Innovation Engineering and Science Research”
Volume 2 Issue 4 July-August 2018
59|P a g e
Fig. 3: Greenhouse strategy to warm the user space
Solar chimney is a system contributing to the air ventilation owing to chimney function. A simple solar
chimney can be made out of a black tube (to absorb more solar energy) with suitable diameter a few
meters above roof level(Tahersima, 2017). A thermal mass helping to retain heat for some time after
sunset is used within these chimneys. Apart from being installed on the roof, this chimney can be
installed on either the wall facing the Equatoror a separate surface higher than the roof level.
The solar chimney has a dual cooling-heating function. That is to say, when the vent in the upper level
of the building is open, natural ventilation can be created by allowing warm air to escape to the
outside, conversely, when the vent is closed, warm air captured in the chimney can be drawn into the
building (Holloway,2011).
Fig. 4. solar chimney strategy to warm the user space
IV. Utilization of solar chimney system in cold climate
A residential complex plan in a cold climate has been considered to achieve the research purpose
and investigate the effect of solar chimney on enhanced energy efficiency of buildings. The chosen
sample is located in Shiraz, Fars province. It should be noted that in this research only a part of the
complex facing southern has been modeled and studied. Fig. 8 shows the position of the solar
chimney in the sample building.
4.1. Plan features in energy productivity
As shown in Fig. 8, East-West elongation of the building may result in the maximum use of southern
sunlight in the winter (MozafariTorshizi&TaghizadehKurdi, 2005).

Mohammadmehdi Danesh. “International Journal of Innovation Engineering and Science Research”
Volume 2 Issue 4 July-August 2018
60|P a g e
Fig. 5: The building, which use solar chimney to warm user space, is used for simulation (Mathur et al,
2006)
In the Southwest-facing wall of the building, a solar chimney system is used to save solar energy.
Closed wooden shutters in summer may keep out sunlight. Installing solar panel on the sloped roof of
the building may provide electrical energy required for the building by saving solar energy.Storing
fragile material like glasses, Glass has been used in construction since approximately 2000 years
ago.
The solar chimney is heated up in the winter with solar radiation, and transmits heat through the lower
and upper vents to the interior. Vertical wooden shutters will also help the reflection of radiation and
its entry into the building. In the winter nights, the absorbed heat will be trapped if shutters are
closedhence the space acts as a source of heat. The interior materials of this space are mainly
chosen fromhigh thermal capacity materialslikemud mortar with cement hardness that is mainly used
for the inner liner of the solar chimney,
V. Modeling and analyzing the research sample using Design Builder's Energy
Analysis Software
In this section, the results yielded from sample modeling with the features described in Design Builder
software are presented.
As demonstrated in Figs 9 and 10, the indoor temperature is estimated to be 22 °Cwithout using
mechanical heating systems.
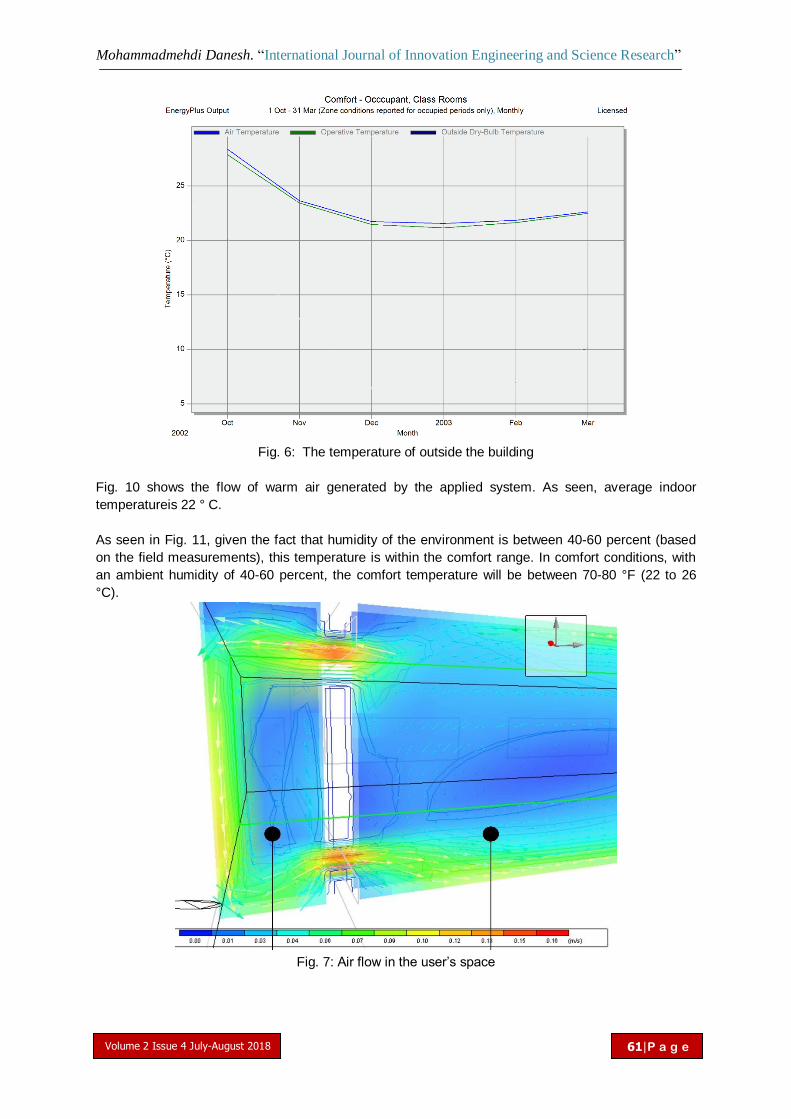
Mohammadmehdi Danesh. “International Journal of Innovation Engineering and Science Research”
Volume 2 Issue 4 July-August 2018
61|P a g e
Fig. 6: The temperature of outside the building
Fig. 10 shows the flow of warm air generated by the applied system. As seen, average indoor
temperatureis 22 ° C.
As seen in Fig. 11, given the fact that humidity of the environment is between 40-60 percent (based
on the field measurements), this temperature is within the comfort range. In comfort conditions, with
an ambient humidity of 40-60 percent, the comfort temperature will be between 70-80 °F (22 to 26
°C).
Fig. 7: Air flow in the user’s space

Mohammadmehdi Danesh. “International Journal of Innovation Engineering and Science Research”
Volume 2 Issue 4 July-August 2018
62|P a g e
Fig. 8: Thermal comfort graph
VI. Discussion and conclusions
By using climate-friendly design techniques in the cold climate zones and also using solar chimney as
one of the inactive solar systems, average indoor temperatureof the chosen sample substantially
increased. Applying this technique has raised the indoor temperature of classes without using
mechanical heating system. As seen in simulation of the sample, indoor temperaturereached 22 °C in
winter. Regarding the humidity of the region estimated to be 40-60 percent, the mentioned
temperature is in comfort range. However, according to field studies conducted on a winter day, when
the ambient temperature ranged from 8-15 °C, the indoor temperature of the classes in the respective
sample was measured to be 8-11 °C (Fateh, 2010). Accordingly, carful design and considerable
attention to environmental sustainability in small- and large-scale architectural projects can be a major
step towards saving non-renewable sources of energy and reducing environmental damages and air
pollutants production without spending a lot of money. This issue is currently a matter of great
importance in the design of architectural projects in the world.
References
[1] IEA, international energy agency: Energy efficient building envelopes,2013
[2] Bansal, NK & Mathur, R& Bhandari, MS (2011), A study of solar chimney assisted wind tower
system for natural ventilation in buildings, Building and Environment, Vol 28, No 3, 373- 377.
[3] Tahersima, M., Ley, T., & Tikalsky, P. (2017). Hydration Heat in a mass concrete and a thin
slab with limestone blended cement. Int. J. Mater. Sci. Eng., 5(2), 79-86.
[4] Afonso.C , Oliveira.A (2010), Solar chimneys: simulation and experiment, Energy and Buildings,
Vol 32, pp 71_79. ASHRAE Handbook_Fundamentals )SI( )2009(, chapter 16, 16.28 [3] Chopra
AK.
[5] Bouchair A. (2011), Solar chimney for promoting cooling ventilation in southern Algeria, Build
ServEng Res Technol, 15:81_93.
[6] Charvat P, Jicah M, Stetina J. (2013), Solar chimneys for ventilation and passive cooling,
Denver ,USA: World Renewable Energy Congress
[7] Tahersima, M., & Tikalsky, P. (2017). Finite element modeling of hydration heat in a concrete
slab-on-grade floor with limestone blended cement. Construction and Building Materials, 154,
44-50.
[8] Punyasompun.S, Hirunlabh.J, Khedari.J, Zeghmat.B (2009), Investigation on the application of
solar chimney for multi-storey buildings،Renewable Energy, Vol 34, pp 2545_2561.

Mohammadmehdi Danesh. “International Journal of Innovation Engineering and Science Research”
Volume 2 Issue 4 July-August 2018
63|P a g e
[9] Tahersima, M., Tikalsky, P., & Revankar, R. (2018). An experimental study on using a mass
radiant floor with geothermal system as thermal battery of the building. Building and
Environment.
[10] Escamilla, E. F., Ostadalimakhmalbaf, M., Pariafsai, F., Ranka, N., Danesh, M., & Naderi
Alizadeh, M. (2018). Impact of Using iPad Tablets in a Construction Communication Graphics
Class: Evaluation Based on System Usability Scale. Journal of Educational Technology
Systems, 47(1), 32-49. doi:10.1177/0047239518773744
[11] Khedari, Joseph& Boonsri, Boonlert & Hirunlabh, Jongjit (2010), Ventilation impact of a solar
chimney on indoor temperature fluctuation and air change in a school building, Energy and
Building, Vol 32, pp 89_93.
[12] Sudaporn, Chungloo, Bundit, Limmeechokchai (2014), Utilization of cool ceiling with roof solar
chimney in Thailand: The experimental and numerical analysis, Renowable Energy, 34, pp
623_633.
[13] Tahersima, M. (2017). Modeling Heat Transfer in Mass Concrete Floors with Radiant Heat from
Ground Source Systems (Doctoral dissertation, Oklahoma State University).
[14] Rabah.K, (2011): Development of energy-efficient passive solar building design in Nicosia
Cyprus,Renewable Energy,907-937,
[15] Bodach.S ,Lang.W, (2014), Climate responsive building design strategies of vernacular
architecture in Nepal, Energy and Buildings 81,227-242,
[16] Escamilla, E. F., Ostadalimakhmalbaf, M., Pariafsai, F., Gragera, C., & Naderi Alizadeh, M.
(2018). Enrollment, Retention, and Graduation patterns of Higher-Education Construction
Science Students at Texas A&M University: A Comparative Study. The Professional
Constructor Journal of the American Institute of Constructors, 43(1), 48-61.
[17] Chandel.SS ,Sarkar.A, (2015) Performance assessment of a passive solar building for thermal
comfort and energy saving in a hilly terrain of India, Energy and Buildings 86 ,873–885
[18] Chandel.SS, Aggarwal.RK, (2012), Performance evaluation of a passive solar building in
Western Himalayas, Renewable Energy 33 ,2166–2173,
[20] Design Builder, Design Builder SBEM Approval, Available in: WWW.DesignBuilder.CO.UK ,
access date:2015
[21] Holloway.D.R, (2011), SUN TEMPERED ARCHITECTURE A Simple Design Methodology For
Passive Solar Houses with a Brief History of Solar Energy Utilization in the Built Environment,
[22] SKAT, (2007), Climate Responsive Building - Appropriate Building Construction in Tropical and
Subtropical Regions ,
[23] SDEG,Sempra Energy Company, design brief,Design for your Climate,2013
[24] Mathur, J., & Mathur, S. (2006). Summer-performance of inclined roof solar chimney for natural
ventilation. Energy and Buildings, 38(10), 1156-1163.

International Journal of Innovation Engineering and Science Research
Open Access
Volume 2 Issue 4 July-August 2018
64|P a g e
ABSTRACT
Numerical analysis of the density distribution
within scored tablets
Moulay Saddik Kadiri1, and Hanafi Moussaoui
1
1Process engineering and optimization of industrial systems laboratory (LIPOSI)
National school of applied sciences, Khouribga, Morocco
Scored tablets provide dose flexibility, ease of swallowing and cost savings. However, some problems with
scored tablets can be confronted like difficulty of breaking, unequally breaking and loss of mass upon breaking.
This paper investigates the effect of score lines on the density distribution using continuum modelling. In
keeping with previous work in the pharmaceutical field, a modified Drucker Prager Cap model is described
briefly and used in the simulations. Coulomb friction is included between powder and tools. The
microcrystalline cellulose (MCC) Vivapur® 102 was used to identify the model parameters using experimental
tests with instrumented die, shear cell and diametrical crushing. The obtained results indicate that simulations
may be useful not only to determine density distributions within tablets, but also may provide indications about
performance of score lines.
Keywords— scored tablets; density distribution; Drucker Prager Cap; finite element modelling; die compaction.
I. Introduction
Tablets that can be broken in half or quarters will be scored by the manufacturer to make the process
easier. The scored tablets present some advantages. The most important advantage is the dose
flexibility. Ease of swallowing is another important advantage of scored tablets especially for big sized
tablets [1,2,3]. Moreover, the scored tablets may reduce the costs of medication. Scored tablets
reduce the number of tablets needed. Thus, we can reduce costs for both the producing industry as
well as the pharmacy and the patient. When a tablet is broken in half, there is no guarantee that the
drug dosage contained in each half. Scoring a tablet improves the chances that the drug dosage may
be divided equally if the tablet has been cut exactly in the scored indentation. If this does not occur
the tablet will fragment, and a proportion of the tablet will be lost. For more details about advantages,
problems and performance indicators of score lines, see the review published by E. van Santen et al.
[1].
In this work, numerical simulation was used to analyze the effect of score lines on the density
distributions. The compaction behavior of pharmaceutical powders can be studied using the principles
of continuum mechanics at a macroscopic level, i.e. phenomenological models. In continuum
mechanical modelling, the powder is considered macroscopically as continuous and porous medium.
The media is characterized by overall parameters such as cohesion, interparticle friction and
mechanical properties such as Young’s modulus and Poisson ratio which are depending on density
during the compaction. In addition, as the applied load increases, the admissible stress in the tablet
must be bounded in a domain which is bounded by one or a set of surfaces in the pressure and
deviatoric space. This domain defines the yield surface. However, to describe mechanisms such as
hardening and softening resulting from the loading and unloading of the powder, the domain expands

Moulay Saddik Kadiri et al. “International Journal of Innovation Engineering and Science Research”
Volume 2 Issue 4 July-August 2018
65|P a g e
or contracts as the volumetric strain decreases or increases. This evolution is defined a flow function
or flow potential.
A variety of continuum models from the soil mechanics literature have been developed from
experiments on different geo-materials as described by Drucker et al. [4], Schofield and Wroth [5], Di-
Maggio and Sandler [6], Gurson [7] and Green [8].
In this paper, the response of the powder behavior using the Drucker-Prager Cap model during die
compaction with scored punches was studied. DPC model have been used for pharmaceutical
powders by A. Michrafy et al. [9], S. Kadiri et al. [10, 11], J.C. Cunningham [12], and recently by L.H.
Han et al. [13], T. Sinha et al. [14, 15].
The main objective in this work is to analyze the effect of the score lines on the pharmaceutical
powder compaction using continuum modelling. This paper is organized as follows: Section 2
presents the materials and methods; parameters identifications are introduced in section 3. Results
and discussions are in section 4. Finally, section 5 summarizes the conclusions.
II. Materials and methods
A. The used powder
The microcrystalline cellulose (MCC) Vivapur® 102 is often used as a pharmaceutical excipient.
Characteristics of the powder MCC 102 provided by JRS (J. Rettenmaier and Sohne) is shown in
Table 1. This powder having good flowability, compressibility and compactability, was used to identify
the model parameters.
TABLE I. PROPERTIES OF MCC VIVAPUR® FROM J. RETTENMAIER AND SOHN
Powder Mean Particle Size True density Bulk density
MCC Vivapur 102 90 m 1.59 +/-0.002g/cm3 0.31 +/-0.02g/cm
3
B. Drucker Prager Cap model
The template The Drucker Prager Cap (DPC) model was described in several papers [9, 10, 11, 12,
13, 14, 15]. This model is implemented in the Abaqus Software. The yield function is defined with
three surfaces represented in Fig. 1: the shear failure surface Fs defining the correlation between the
cohesion d and the internal friction angle , the elliptical surface (or Cap surface) Fc which can expand
or contract according to the volumetric strain and the transition surface Ft between Fs and Fc. The
evolution of the Cap surface is described with the hardening function pb which is the position of the
Cap on hydrostatic pressure axis for each density state.
Fig. 1. Drucker-Prager Cap model presented in the (p,q) plane.
p = -1/3 tr(σ) is the hydrostatic pressure, and q = (3/2 (S:S))1/2 is the Mises equivalent stress in which S
is the stress deviator, defined as:
S = σ +pI
Where σ is the stress tensor, and I is the identity matrix.
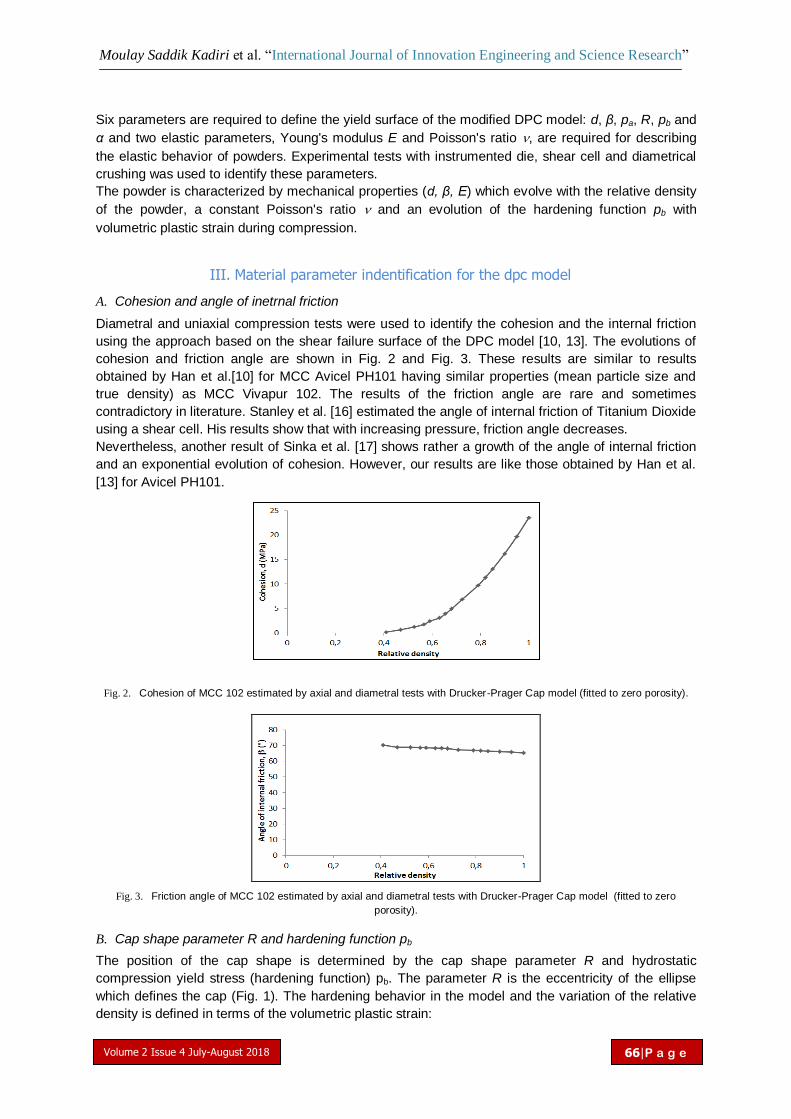
Moulay Saddik Kadiri et al. “International Journal of Innovation Engineering and Science Research”
Volume 2 Issue 4 July-August 2018
66|P a g e
Six parameters are required to define the yield surface of the modified DPC model: d, β, pa, R, pb and
α and two elastic parameters, Young's modulus E and Poisson's ratio , are required for describing
the elastic behavior of powders. Experimental tests with instrumented die, shear cell and diametrical
crushing was used to identify these parameters.
The powder is characterized by mechanical properties (d, β, E) which evolve with the relative density
of the powder, a constant Poisson's ratio and an evolution of the hardening function pb with
volumetric plastic strain during compression.
III. Material parameter indentification for the dpc model
A. Cohesion and angle of inetrnal friction
Diametral and uniaxial compression tests were used to identify the cohesion and the internal friction
using the approach based on the shear failure surface of the DPC model [10, 13]. The evolutions of
cohesion and friction angle are shown in Fig. 2 and Fig. 3. These results are similar to results
obtained by Han et al.[10] for MCC Avicel PH101 having similar properties (mean particle size and
true density) as MCC Vivapur 102. The results of the friction angle are rare and sometimes
contradictory in literature. Stanley et al. [16] estimated the angle of internal friction of Titanium Dioxide
using a shear cell. His results show that with increasing pressure, friction angle decreases.
Nevertheless, another result of Sinka et al. [17] shows rather a growth of the angle of internal friction
and an exponential evolution of cohesion. However, our results are like those obtained by Han et al.
[13] for Avicel PH101.
Fig. 2. Cohesion of MCC 102 estimated by axial and diametral tests with Drucker-Prager Cap model (fitted to zero porosity).
Fig. 3. Friction angle of MCC 102 estimated by axial and diametral tests with Drucker-Prager Cap model (fitted to zero
porosity).
B. Cap shape parameter R and hardening function pb
The position of the cap shape is determined by the cap shape parameter R and hydrostatic
compression yield stress (hardening function) pb. The parameter R is the eccentricity of the ellipse
which defines the cap (Fig. 1). The hardening behavior in the model and the variation of the relative
density is defined in terms of the volumetric plastic strain:
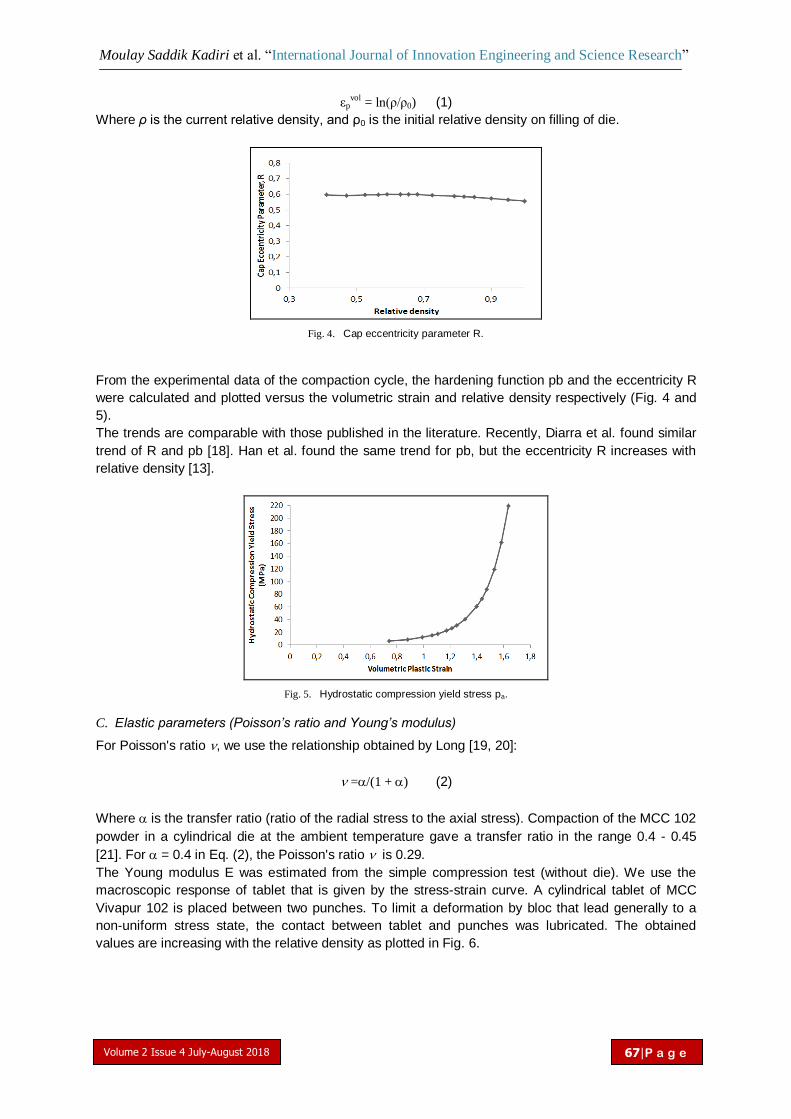
Moulay Saddik Kadiri et al. “International Journal of Innovation Engineering and Science Research”
Volume 2 Issue 4 July-August 2018
67|P a g e
εpvol = ln(ρ/ρ0) (1)
Where ρ is the current relative density, and ρ0 is the initial relative density on filling of die.
Fig. 4. Cap eccentricity parameter R.
From the experimental data of the compaction cycle, the hardening function pb and the eccentricity R
were calculated and plotted versus the volumetric strain and relative density respectively (Fig. 4 and
5).
The trends are comparable with those published in the literature. Recently, Diarra et al. found similar
trend of R and pb [18]. Han et al. found the same trend for pb, but the eccentricity R increases with
relative density [13].
Fig. 5. Hydrostatic compression yield stress pa.
C. Elastic parameters (Poisson’s ratio and Young’s modulus)
For Poisson's ratio , we use the relationship obtained by Long [19, 20]:
=/(1 +) (2)
Where is the transfer ratio (ratio of the radial stress to the axial stress). Compaction of the MCC 102
powder in a cylindrical die at the ambient temperature gave a transfer ratio in the range 0.4 - 0.45
[21]. For = 0.4 in Eq. (2), the Poisson's ratio is 0.29.
The Young modulus E was estimated from the simple compression test (without die). We use the
macroscopic response of tablet that is given by the stress-strain curve. A cylindrical tablet of MCC
Vivapur 102 is placed between two punches. To limit a deformation by bloc that lead generally to a
non-uniform stress state, the contact between tablet and punches was lubricated. The obtained
values are increasing with the relative density as plotted in Fig. 6.

Moulay Saddik Kadiri et al. “International Journal of Innovation Engineering and Science Research”
Volume 2 Issue 4 July-August 2018
68|P a g e
Fig. 6. Young’s modulus E plotted as function of relative density.
D. Powder-die wall friction
To complete the boundary problem of the compaction, the die wall friction coefficient is needed.
During compaction, the powder friction at the die wall induces non-uniform axial stress and produces
density gradients within the compact. The friction effect could be quantified by the wall friction
coefficient. The friction coefficient can be determined by an indirect method based on Janssen-Walker
theory [22]. This approach was applied by Michrafy et al. [23] to three pharmaceutical powders MCC
101, 102 and 105. We use the result obtained for MCC 102 that shows a decreasing of the friction
coefficient in the first stage of densification (relative density < 0.55) and tends towards an asymptotic
value approximately equal to 0.4. For the simulation, a mean constant value of 0.4 was taken.
IV. Results and discussions
The simulation of the uniaxial single-ended die compaction process of MCC Vivapur® 102 powder
was conducted using the software Abaqus® (Simulia). The user subroutine (USDFLD) was used to
update the elastic parameters and the parameters of the failure curves when the relative density
changed using the visual FORTRAN compiler. The powder was modelled as a deformable continuum,
while the punches and die were modelled as analytical rigid bodies without any deformation. The wall
friction effect was considered by adopting a Coulombic boundary condition on the interfaces
powder/wall and powder/punch. A constant friction coefficient equal to 0.4 was taken.
The numerical simulations correspond to two different geometries: flat-face and concave face. Due to
the axial symmetry, half of the powder bed was meshed with elements of type "CAX4R" four-node
axisymmetric elements and with a mirror effect we can see the whole tablet in Fig. 7. These
simulations were conducted by imposing a displacement to the upper punch as in the experimental
test. The model was validated by observing a good agreement between finite element prediction and
experimental measurement of loading-unloading curves and by a comparison between predicted
density distribution and experimental axial density presented in [11].
Numerical simulation produces a gradient of density distribution throughout the height of the tablet
(Fig. 7). The friction prevents the powder from sliding along the interfaces of punches and die. As a
result, very dense regions are developed on the upper edges of the tablet and low-density regions on
the lower edges. These results are similar to those obtained by Aydin et al. [24] and Michrafy et al. [9].
Also, similar results were obtained by Han et al. [13] for MCC powder and recently by Diarra et al. [18]
for ceramic powder.
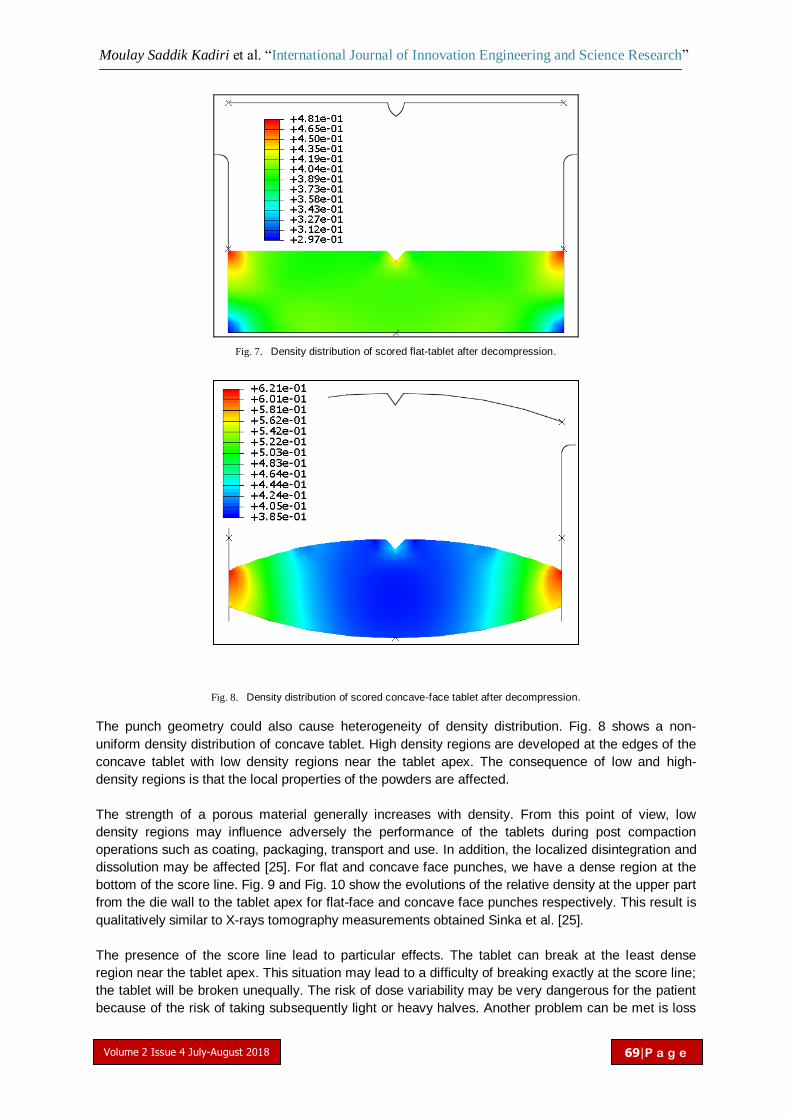
Moulay Saddik Kadiri et al. “International Journal of Innovation Engineering and Science Research”
Volume 2 Issue 4 July-August 2018
69|P a g e
Fig. 7. Density distribution of scored flat-tablet after decompression.
Fig. 8. Density distribution of scored concave-face tablet after decompression.
The punch geometry could also cause heterogeneity of density distribution. Fig. 8 shows a non-
uniform density distribution of concave tablet. High density regions are developed at the edges of the
concave tablet with low density regions near the tablet apex. The consequence of low and high-
density regions is that the local properties of the powders are affected.
The strength of a porous material generally increases with density. From this point of view, low
density regions may influence adversely the performance of the tablets during post compaction
operations such as coating, packaging, transport and use. In addition, the localized disintegration and
dissolution may be affected [25]. For flat and concave face punches, we have a dense region at the
bottom of the score line. Fig. 9 and Fig. 10 show the evolutions of the relative density at the upper part
from the die wall to the tablet apex for flat-face and concave face punches respectively. This result is
qualitatively similar to X-rays tomography measurements obtained Sinka et al. [25].
The presence of the score line lead to particular effects. The tablet can break at the least dense
region near the tablet apex. This situation may lead to a difficulty of breaking exactly at the score line;
the tablet will be broken unequally. The risk of dose variability may be very dangerous for the patient
because of the risk of taking subsequently light or heavy halves. Another problem can be met is loss
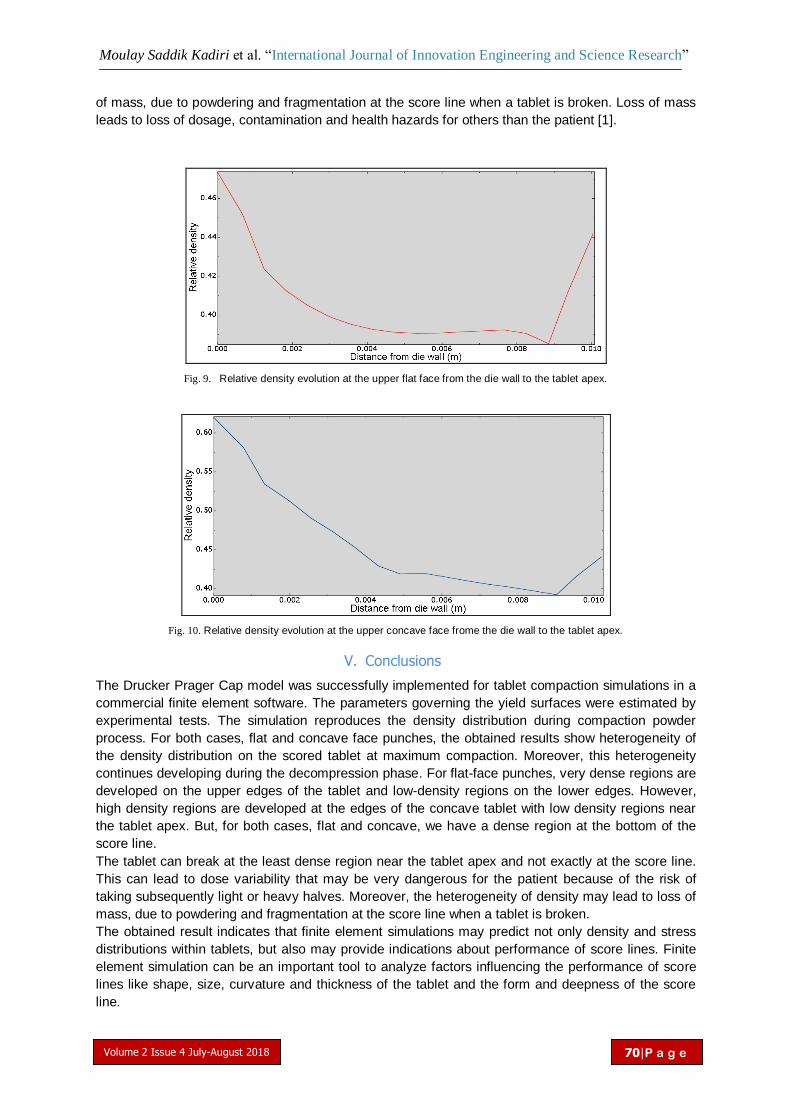
Moulay Saddik Kadiri et al. “International Journal of Innovation Engineering and Science Research”
Volume 2 Issue 4 July-August 2018
70|P a g e
of mass, due to powdering and fragmentation at the score line when a tablet is broken. Loss of mass
leads to loss of dosage, contamination and health hazards for others than the patient [1].
Fig. 9. Relative density evolution at the upper flat face from the die wall to the tablet apex.
Fig. 10. Relative density evolution at the upper concave face frome the die wall to the tablet apex.
V. Conclusions
The Drucker Prager Cap model was successfully implemented for tablet compaction simulations in a
commercial finite element software. The parameters governing the yield surfaces were estimated by
experimental tests. The simulation reproduces the density distribution during compaction powder
process. For both cases, flat and concave face punches, the obtained results show heterogeneity of
the density distribution on the scored tablet at maximum compaction. Moreover, this heterogeneity
continues developing during the decompression phase. For flat-face punches, very dense regions are
developed on the upper edges of the tablet and low-density regions on the lower edges. However,
high density regions are developed at the edges of the concave tablet with low density regions near
the tablet apex. But, for both cases, flat and concave, we have a dense region at the bottom of the
score line.
The tablet can break at the least dense region near the tablet apex and not exactly at the score line.
This can lead to dose variability that may be very dangerous for the patient because of the risk of
taking subsequently light or heavy halves. Moreover, the heterogeneity of density may lead to loss of
mass, due to powdering and fragmentation at the score line when a tablet is broken.
The obtained result indicates that finite element simulations may predict not only density and stress
distributions within tablets, but also may provide indications about performance of score lines. Finite
element simulation can be an important tool to analyze factors influencing the performance of score
lines like shape, size, curvature and thickness of the tablet and the form and deepness of the score
line.

Moulay Saddik Kadiri et al. “International Journal of Innovation Engineering and Science Research”
Volume 2 Issue 4 July-August 2018
71|P a g e
References
[1] E. van Santen, D.M. Barendsa, H.W. Frijlink, Breaking of scored tablets: a review, Eur. J. Pharm. & Biopharm.,
2002(53), 139-145.
[2] S.M. Carr-Lopez, M.S. Mallett, T. Morse, The tablet splitter: barrier to compliance or cost-saving instrument? Am. J.
Health-Syst. Pharm., 1995(23), 2707–2708.
[3] E. Duman, N. Yuksel, B. Olin, A. Sakr, Effect of scoring design on the uniformity of extended release matrix tablet
halves, Pharm. Ind., 2000(7), 547–550.
[4] D. Drucker, R. Gibson, D. Henkel, Soil mechanics and work hardening theories of plasticity, Transactions ASCE,
1957(122), 338-346.
[5] [5] A. Schofield, C. Wroth, Critical State Soil Mechanics, McGraw-Hill, London, 1968.
[6] F. D. Maggio, I. Sandler, Material model for granular soils, Journal of Engineering Mechanics, 1971, 935-950.
[7] A. Gurson, Continuum theory of ductile rupture by void nucleation and growth: Part i-yield criteria and flow rules for
porous ductile media, Journal of Engineering Material Technology (Transactions ASME), 1977, 2-15.
[8] R. Green, A plasticity theory for porous solids, International Journal of Mechanical Science, 1972(14), 215-224.
[9] A. Michrafy, D. Ringenbacher, P. Tchoreloff, Modelling the compaction behaviour of powders: application to
pharmaceutical powders, Powder Technology, 2002(3), 257-266.
[10] M. Kadiri, Compression de poudres pharmaceutiques et interaction avec l'outillage, Ph.D. thesis, Institut National
Polytechnique de Toulouse, France, 2004.
[11] M. Kadiri, A. Michrafy, J. Dodds, Pharmaceutical powders compaction: Experimental and numerical analysis of the
density distribution, Powder Technology, 2005(157), 176-182.
[12] J. Cunningham, I. Sinka, A. Zavaliangos, Analysis of tablet compaction. Characterization of mechanical behavior of
powder and powder/tooling friction, Journal of Pharmaceutical Sciences, 2004(8), 2022-2039.
[13] L. Han, J. Elliott, A. Bentham, A. Mills, G. Amidon, B. Hancock, “A modified Drucker-Prager Cap model for die
compaction simulation of pharmaceutical powders”, International Journal of Solids and Structures, 2008(45), 3088-
3106.
[14] T. Sinha, J. Curtis, B. Hancock, C. Wassgren, “A study on the sensitivity of Drucker-Prager Cap model parameters
during the decompression phase of powder compaction simulations”, Powder Technology, 2010(198), 315-324.
[15] T. Sinha, R. Bharadwaj, J. Curtis, B. Hancock, C. Wassgren, “Finite element analysis of pharmaceutical tablet
compaction using a density dependent material plasticity model”, Powder Technology, 2010(202), 46-54.
[16] N. Stanley-Wood, M. Sarrafi, “Variations in, and relationships of surface area, internal angle of friction and compact
diametral fracture strength with degree of compaction”, Particle and Particles Systems Characterization, 1988(4), 186-
192.
[17] I. Sinka, J. Cunningham, A. Zavaliangos, “The effect of wall friction in the compaction of pharmaceutical tablets with
curved faces : a validation study of the Drucker-Prager cap model”, Powder Technology, 2003(133), 33-43.
[18] H. Diarra, V. Mazel, A. Boillon, L. Rehault, V. Busignies, S. Bureau, P. Tchoreloff, “Finite element method (fem)
modeling of the powder compaction of cosmetic products: Comparison between simulated and experimental results”,
Powder Technology, 2012.
[19] W. M. LONG, “Radial pressures in powder compaction”, Powder Metall., 1960(6), 73-86.
[20] W. M. LONG, “Die design and related questions in powder compaction”, 2nd symposium of special ceramics, 1962,
327-340.
[21] A. Michrafy, S. Haas, M. Kadiri, K. Sommer, J. Dodds, “The effects of ambient temperature on the compaction of
pharmaceutical powders”, Proc. IMechE : J. Process Mechanical Engineering 220, 2006(E), 1-6.
[22] R. M. Nedderman, “Statics and Kinematics of Granular Materials”, Cambridge University Press, New York, 192.
[23] A. Michrafy, M. Kadiri, J. Dodds, “Wall friction and its effects on the density distribution in the compaction of
pharmaceutical excipients”, Trans IChemE, 2003(81), 946-952.
[24] I. Aydin, B. Briscoe, K. Sanliturk, “internal form of compacted ceramic components: a comparison of a finite element
modelling with experiment”, Powder Technology, 1996(89), 239-254.
[25] I.C. Sinka, S.F. Burch, J.H. Tweed, J.C. Cunningham, “Measurement of density variations in tablets using X-ray
computed tomography”, International Journal of Pharmaceutics, 2004 (271), 215–224.