Soil Science and Agricultural Engineering
18
Zagazig J. Agric. Res., Vol. 45 No. (6A) 2018 2031 EVALUATION OF LAND SUITABILITY FOR AGRICULTURAL USE IN EL-NUBARIA REGION, EGYPT Manal A. Alnaimy * , K.G. Soliman and E.A. El-Naka Soil Sci. Dept., Fac. Agric., Zagazig Univ., Egypt Received: 18/10/2018 ; Accepted: 28/10/2018 ABSTRACT: The current study was carried on a newly reclaimed area of El-Nubaria where major of agricultural project for development is underway West of the Nile Delta, Egypt. The objective was to determine the capability and suitability of soils which are marine- lacustrine silty clay soils with shallow to medium depth in El-Nubaria region. The system of evaluation was on ASLE model (Applied System of Land Evaluation) integrated with the geographic information system (GIS). Three soil profiles were chosen (representing the pre-specified geomorphological soil unit) which were morphologically described and samples were analysed. Spatial thematic distribution maps of soil characteristics were created for the study unit using GIS software; Arc GIS V. 10.3. Three current land productivity classes were recognized class 2 "good soil productivity" for profile 3; class 3 "fair soil productivity" for profile 2 and class 5 "very poor soil productivity" for profile 1. Soil limitations were water table depth, carbonates, texture, irrigation water salinity, alkalinity (ESP) and organic matter. Wheat, barley, alfalfa, sunflower, cotton, date palm and olive were the optimum crops for land use in the study unit. Key words: Calcareous soil, ALES model, land evaluation, geographic information systems (GIS), geostatistics, thematic maps. INTRODUCTION Increasing population in Egypt caused the decrease in the agricultural area per capita, consequently the agricultural sector suffered low profitability and widening the gap between food production and consumption. Such unbalanced distribution beside the overpopulation caused serious socio-economic problems (Abd El-Kawy et al., 2010). Only 4% of the total Egypt land is cultivated, mainly in the Nile Delta and the narrow strip of the Nile Valley. To increase the cultivated area, Egypt started to reclaim desert regions outside the Nile Delta and the Valley. About 210000 ha (500000 faddans) West of Nubaria canal have been identified as suitable for reclamation and 105000 ha (250000 fad.) as suitable, though the area is mostly calcareous (Abou-Hadid et al., 2010). Calcareous soils cover more than 30% of the earth surface, mainly in arid and semi-arid regions, and can have calcic horizons (El-Khodre and Bedaiwy, 2008). In Egypt, calcareous soils constitute about 25 to 30% of the total area, located mainly in the northern coastal region (Labib and Khalil, 1977) and they are most promising for agriculture expansion. The main problems of calcareous soils are related to one or more of the followings: high salinity, high pH, inadequate texture and structure, very low organic matter or biological activities, low availability of many nutrients (Mohamed, 2011). El-Nubaria region was selected for the current study and surveyed by ELSA (1985). The area was grouped in 4 main soil units, marine- lacustrine silty clay soils with shallow to medium depth, marine lacustrine silty soils with very deep- on its surface safi sand- shaped thick pools, http:/www.journals.zu.edu.eg/journalDisplay.aspx?Journalld=1&queryType=Master Soil Science and Agricultural Engineering * Corresponding author: Tel. : +201063030327 E-mail address: [email protected] 2031-2048
-
Upload
khangminh22 -
Category
Documents
-
view
8 -
download
0
Transcript of Soil Science and Agricultural Engineering

Zagazig J. Agric. Res., Vol. 45 No. (6A) 2018 2031
EVALUATION OF LAND SUITABILITY FOR AGRICULTURAL USE IN EL-NUBARIA REGION, EGYPT
Manal A. Alnaimy*, K.G. Soliman and E.A. El-Naka
Soil Sci. Dept., Fac. Agric., Zagazig Univ., Egypt
Received: 18/10/2018 ; Accepted: 28/10/2018
ABSTRACT: The current study was carried on a newly reclaimed area of El-Nubaria where major of agricultural project for development is underway West of the Nile Delta, Egypt. The objective was to determine the capability and suitability of soils which are marine- lacustrine silty clay soils with shallow to medium depth in El-Nubaria region. The system of evaluation was on ASLE model (Applied System of Land Evaluation) integrated with the geographic information system (GIS). Three soil profiles were chosen (representing the pre-specified geomorphological soil unit) which were morphologically described and samples were analysed. Spatial thematic distribution maps of soil characteristics were created for the study unit using GIS software; Arc GIS V. 10.3. Three current land productivity classes were recognized class 2 "good soil productivity" for profile 3; class 3 "fair soil productivity" for profile 2 and class 5 "very poor soil productivity" for profile 1. Soil limitations were water table depth, carbonates, texture, irrigation water salinity, alkalinity (ESP) and organic matter. Wheat, barley, alfalfa, sunflower, cotton, date palm and olive were the optimum crops for land use in the study unit.
Key words: Calcareous soil, ALES model, land evaluation, geographic information systems (GIS), geostatistics, thematic maps.
INTRODUCTION
Increasing population in Egypt caused the decrease in the agricultural area per capita, consequently the agricultural sector suffered low profitability and widening the gap between food production and consumption. Such unbalanced distribution beside the overpopulation caused serious socio-economic problems (Abd El-Kawy et al., 2010).
Only 4% of the total Egypt land is cultivated, mainly in the Nile Delta and the narrow strip of the Nile Valley. To increase the cultivated area, Egypt started to reclaim desert regions outside the Nile Delta and the Valley. About 210000 ha (500000 faddans) West of Nubaria canal have been identified as suitable for reclamation and 105000 ha (250000 fad.) as suitable, though the area is mostly calcareous (Abou-Hadid et al., 2010).
Calcareous soils cover more than 30% of the earth surface, mainly in arid and semi-arid regions, and can have calcic horizons (El-Khodre and Bedaiwy, 2008).
In Egypt, calcareous soils constitute about 25 to 30% of the total area, located mainly in the northern coastal region (Labib and Khalil, 1977) and they are most promising for agriculture expansion. The main problems of calcareous soils are related to one or more of the followings: high salinity, high pH, inadequate texture and structure, very low organic matter or biological activities, low availability of many nutrients (Mohamed, 2011).
El-Nubaria region was selected for the current study and surveyed by ELSA (1985). The area was grouped in 4 main soil units, marine- lacustrine silty clay soils with shallow to medium depth, marine lacustrine silty soils with very deep- on its surface safi sand- shaped thick pools,
http:/www.journals.zu.edu.eg/journalDisplay.aspx?Journalld=1&queryType=Master
Soil Science and Agricultural Engineering
* Corresponding author: Tel. : +201063030327 E-mail address: [email protected]
2031-2048

Alnaimy, et al. 2032
transported soil by sand limestone bonds with sandy loam soil and transported soil by sand limestone bonds with coarse sandy loam soil or silty clay soils. Detailed studies were applied through the present work for marine- lacustrine with silty clay soils and shallow to medium depth. It is characterized by prominent cultivated lands having abundant water resources.
The capability index is an expression of the natural fertility and can therefore be correlated with crop production under natural conditions without use of fertilizers or implementation of soil improvement works (Elzahaby et al., 2015).
Land evaluation aims to guide wisely the present land management and plan its future use. Parametric land evaluation aims to identify the main limiting factors for land productivity (LP) as well as the different degrees of land suitability (LS) for crops (Khalifa, 2004).
The objectives of the current study are studying morphological features of different pedogenesis occurring on different landscapes of calcareous soil in the western desert, testing the criteria of different pedons revised by Soil Taxonomy and FAO classification systems, using resultant soil mapping units with an integrated parametric model to assess land productivity, limiting factors, and land suitability for crops.
MATERIALS AND METHODS
The Study Area
The area under investigation is located at El-Nubaria City, km 180 west of Cairo- Alexandria desert road and North West of Egypt, about 47 km South of Alexandria. It lies at longitudes 30° 10'and latitudes 30° 52'. It is geographically bounded by four governorates: Beheira, Alexandria, Monoufia and Giza (Fig. 1). A total of 20 soil observations profiles were dug, described pedomorphologically according to guidelines for soil description of FAO (2006).
Climatic
The study area is characterized by short rainy season, long hot summer, high relative humidity, small diurnal temperature variations.
Geology and Geomorphology
The study area is part of Pleistocene limestone sediments of old marine-lacustrine plains and older coastal beach ridges formed by successive high sea level. The subsoil layers are coarse
gravelly sands of both deltaic and fluviomarine origin (GSMA, 1981). Recent and Holocene aeolian sand occupy the southern part of the area. Therefore the studied area is considered an area of wind-blown sand and marine sediments.
Laboratory Analyses
Soil samples were air-dried, ground and passed through a 2 mm sieve. Mechanical analysis was done by the international pipette method (Gee and Bauder, 1986). Soil real density and soil bulk density were determined according to Klute (1986). Hydraulic conductivity columns were taken from field by undisturbed cores of 30 cm length (Klute, 1986). Soil color was determined using the MUNSEL chart, on wet and dry material. Organic matter content and organic carbon were determined using the Walkely and Black method (Black, 1965). Active calcium carbonate was determined according to Page et al. (1982). Exchangeable sodium percent was determined according to Page et al. (1982).
Parametric Land Evaluation
According to ASEL (Applied System of Land Evaluation) of Mohamed and Ihab (2007), land productivity and suitability indices were determined. Evaluation included of the following parameters: physical, chemical, parameters, fertility, irrigation water parameters, climatic parameters. Every property was evaluated and described as a percentage.
The ASLE software can be integrated with the Geographic Information Systems (GIS) in order to digitize its outputs in a map form.
GIS Processing
Resultant data were exported to ARC-GIS, 10.3 (ESRI, 2007) for soil mapping. Soil properties were used to generate the final soil map and different evaluation maps using GIS.
RESULTS AND DISCUSSION
Soil Physical-chemical Properties
Soil texture
Soil texture is one of the most important soil criteria affecting soil behavior and land management. It affects a number of physical and chemical soil characteristics. Growth and development of the plant, root penetration, nutrition absorption and soil water properties are all affected by soil texture (Ismail and Yacoub, 2012).

Zagazig J. Agric. Res., Vol. 45 No. (6A) 2018 2033
Fig. 1. Location map of the study unit
The clay content of the study unit was classified into the following 3 classes using geostatistical analyses; less than 10%, 10 - 20% and 20 - 40% (Fig. 2). Clay content in soils of the studied unit varied from 4.55% in horizon 80 – 130 cm of profile 1 to 27.33% in horizon 98 - 145 cm of profile 2 (Table 1). Silt varied from 9.00% in horizon 98 - 145 cm of profile 2 to 33.21% in horizon 15 - 39 cm of profile 3. Total sand varied from 47.76 % in horizon 106 - 129 cm of profile 3 to 80.11 % in horizon 80 - 130 cm of profile 1. The weighted mean values of clay content varied from 5.04% in profile 1, which a virgin soil (that had no reclamation or cultivation) to 22.08% in profile 2 (which had more than 20 years of reclamation or cultivation processes). It reflects the effect of parent material in the study area. The texture varied
from loamy sand, sandy loam and sandy clay loam. These results are in agreement with Tantawy et al. (2012).
Soil real density
Soil real density values of the study unit fluctuated from 2.41 Mgm-3 in surface horizon 0-15 cm of profile 3 to 2.66 Mgm-3 in surface horizon 0-20 cm of profile 1 (Table 2). The weighted mean of real density varied from 2.45 Mgm-3 in profile 3 to 2.62 Mgm-3 in profile 1. Low real density may be due to high content of organic matter in the surface layer of cultivated soil of profile 3. High real density may be due to high content of sand or iron oxides. These results are in agreement with those of Fayed (2003).

Alnaimy, et al. 2034
Fig. 2. Spatial distribution of clay (%) content in the study unit
Table 1. Particle size distribution, texture and weighted mean values of soil profiles in the study area
Soil profile No. Horizon symbol
Horizon depth (cm)
Corse sand (%)
Fine sand (%)
Total sand (%)
Silt (%)
Clay (%)
Texture
A 0-20 19.36 59.98 79.34 14.12 6.54 Loamy sand CB1 20-35 19.89 57.89 77.78 15.57 6.65 Loamy sand CB2 35-55 20.47 57.98 78.45 15.56 5.99 Loamy sand 1 C 55-80 24.21 53.66 77.87 16.90 5.23 Loamy sand CD 80-130 25.03 55.08 80.11 15.34 4.55 Loamy sand DR 130-220 - - - - - Rock Weighted mean 23.97 56.55 80.52 14.44 5.04 Loamy sand
A0 0-15 9.60 58.07 67.67 17.89 14.44 Sandy loam ACa 15-26 16.77 49.99 66.76 17.35 15.89 Sandy loam B1Ca 26-37 15.55 49.56 65.11 16.91 17.98 Sandy loam BFe,Ca 37-53 19.23 45.22 64.45 16.56 18.99 Sandy loam
BCa,mot. 53-82 18.83 44.99 63.82 15.53 20.65 Sandy clay loam CBCa, mot. 82-98 18.60 43.90 62.50 12.39 25.11 Sandy clay loam
CBD 98-145 18.69 44.98 63.67 9.00 27.33 Sandy clay loam
2
Weighted mean 17.48 46.95 64.43 13.50 22.08 Sandy loam
At 0-15 11.68 44.88 56.56 33.21 10.23 Sandy loam ACa 15-39 13.47 43.98 57.45 29.90 12.65 Sandy loam B1 39-47 16.41 38.04 54.45 32.65 12.90 Sandy loam B2 47-73 13.92 38.86 52.78 30.44 16.78 Sandy loam
CCa,mot. 73-106 8.00 43.87 51.87 28.26 19.87 Sandy clay loam C2 106-129 7.89 39.87 47.76 26.26 25.98 Sandy clay loam
3
CD 129-145 16.52 40.09 56.61 22.74 20.65 Sandy clay loam Weighted mean 11.73 41.72 53.46 28.75 17.79 sandy clay loam - : No soil for analysis
Clay (%)

Zagazig J. Agric. Res., Vol. 45 No. (6A) 2018 2035
Table 2. Real density, Bulk density, active calcium carbonate, organic matter and weighted mean values for soil profiles of the study area
Soil profile No. Horizon symbol Horizon depth (cm)
Real density, (Mgm-3)
Bulk density (Mgm-3)
Active CaCO3
(%)
Organic matter
(%) A 0-20 2.66 1.69 1.98 0.27 CB1 20-35 2.65 1.66 1.68 0.20 1 CB2 35-55 2.65 1.78 1.87 0.27 C 55-80 2.62 1.76 1.03 0.07 CD 80-130 2.60 1.80 1.02 0.20 DR 130-220 - - - - Weighted mean 2.62 1.78 1.23 0.14
A0 0-15 2.50 1.45 9.34 0.67 ACa 15-26 2.53 1.45 9.02 0.67 B1Ca 26-37 2.55 1.43 7.14 0.47 BFe,Ca 37-53 2.54 1.40 5.66 0.34
BCa,mot. 53-82 2.56 1.44 5.23 0.34 CBCa, mot. 82-98 2.60 1.42 4.65 0.20
2
CBD 98-145 2.61 1.43 3.78 0.13 Weighted mean 2.57 1.43 5.56 0.32
At 0-15 2.41 1.14 10.15 1.01 ACa 15-39 2.43 1.16 9.65 0.67 B1 39-47 2.42 1.15 9.23 0.67 B2 47-73 2.47 1.22 6.11 0.34
CCa,mot. 73-106 2.45 1.23 4.56 0.34 C2 106-129 2.48 1.31 3.43 0.13
3
CD 129-145 2.47 1.32 2.77 0.07 Weighted mean 2.45 1.23 6.14 0.42
Soil bulk density
Bulk density is an indicator of soil compaction. Bulk density is dependent on soil organic matter, soil moisture, the density of soil minerals and their packing. Soil bulk density of the study unit fluctuated from 1.14 Mgm-3 in horizon 0 - 15 cm of profile 3 to 1.80 Mgm-3 in horizon 80 - 130 cm of profile 1(Table 2). The weighted mean varied from 1.23 Mgm-3 in profile 3, which had more than 20 years of reclamation and cultivation to 1.78 Mgm-3 in profile 1 which had compact soil. Cultivation causes a decrease in bulk density of the surface horizon due to the plowing as well as presence of organic matter. These results are in agreement with Fayed (2003). Soil bulk density typically increases with soil depth since subsurface horizons are more compacted and have less organic matter, less aggregation, and less root penetration compared with surface horizons.
Active calcium carbonate
Content of active calcium carbonate (A-CaCO3) increased with increasing organic matter content (Table 2). Part of total CaCO3 in soil is converted to A-CaCO3. The current results are similar to those of Reyhanitabar and Gilkes (2010). The content of active calcium carbonate decreases slightly with increasing salinity depth of irrigation.
The active calcium carbonate content of the study unit soils was classified into the following 2 classes using geostatistical analyses; less than 2% and 4-8% (Fig. 3). The lowest was 1.02% in horizon 80 - 130 cm of profile 1, which had low organic matter, columnar structure and low clay content. The highest value was 10.15% in horizon 0 - 15 cm of profile 3, which had high content of organic matter, granular structure and high clay content. The weighted means of active calcium carbonate content varied from 1.23% in

Alnaimy, et al. 2036
Fig. 3. Spatial distribution of active calcium carbonate content (%) in the study unit
profile 1 to 6.14% in profile 3. Increased clay content and structure stability leads to increased active CaCO3 content. These results are in agreement with those of Moreno et al. (2006).
Organic matter content
The soils are very poor in their organic matter content (Table 2). These areas are almost barren of natural vegetation or have few scattered desert shrubs, and exist in hot arid environment which facilitates the decomposition of organic matter (Abd- Kader, 2006). Low organic matter occurred in the 55-80 cm of profile 1, which had no any cultivation with 0.07 organic matter. The high value was in horizon 0-15 cm of profile 3 with 1.01 organic matter which attributed to crop residues and organic manure addition. High salinity and calcareousness may causes crusts and may increase organic matter content in soil (Abbas et al., 2012). The weighted mean varied from 0.14% in profile 1 to 0.42% in profile 3.
Porosity
Porosity (Table 3) was varied from 31.02% in horizon 80-130 cm of profile 1 to 51.34% in horizon 0-15 cm of profile 3. The weighted mean varied from 32.00 in profile 1 to 39.81 in profile 3. Low soil porosity is caused by soil compaction.
Saturated hydraulic conductivity (Ks)
High CaCO3 content leads to more structure stability and high saturated hydraulic conductivity (Dexter and Richard, 2009).
Classification of hydraulic conductivity was in two classes using geostatistics analyses; less than 1 cm/hour and more than 1 cm/hour (Fig. 4).
Hydraulic conductivity values varied from 0.12 cmh-1 in horizon 80-130 cm of profile 1 to 6.48 cmh-1 in the surface horizon 0-15 cm of profile 3 (Table 3). Hydraulic conductivity must be taken into account when irrigation and drainage systems are designed (Abdel Aleem et al., 2008).
Petrocalcic layer in calcareous soils is the main reason for low permeability of soil hence, minimizing the ability for surface drainage. Cultivation decreases exchangeable sodium in the soil surface and as a result, soil permeability increases (Sayed, 2013).
Exchangeable sodium percentage (ESP)
The main implication arising from high ESP is on the physical properties of soil. In surface soil layers, high ESP results in poor soil structure. This is evidenced by setting of soil into large blocks on drying. Poor soil structure leads to decreased soil permeability and poor soil drainage (Abd- Kader, 2006). Values of ESP in soils were classified into 3 classes using geostatistical analyses; less than 2, 2-4 and more than 8 (Fig. 5). Values varied from 1.11% in horizon 0-15cm of profile 3, which was under cultivation to 15.87% in horizon 80-130 cm of profile 1, which had no any cultivation (Table 3).

Zagazig J. Agric. Res., Vol. 45 No. (6A) 2018 2037
Table 3. Porosity, hydraulic conductivity and exchangeable sodium percentage values for soil profiles of the study area
Soil profile No. Horizon symbol Horizon depth (cm)
Porosity (%)
Hydraulic conductivity (cm hr-1)
ESP
A 0-20 35.83 0.19 10.60 CB1 20-35 37.41 0.17 12.87 1 CB2 35-55 32.88 0.17 12.99 C 55-80 32.66 0.16 13.24 CD 80-130 31.02 0.12 15.87 DR 130-220 - 0.00 - Weighted mean 32.00 0.10 14.54
A0 0-15 45.40 2.94 2.27 ACa 15-26 46.50 2.76 3.30 B1Ca 26-37 46.11 2.30 3.33 BFe,Ca 37-53 37.50 1.36 3.39
BCa,mot. 53-82 38.27 1.33 3.58 CBCa, mot. 82-98 35.21 0.54 3.60
2
CBD 98-145 39.16 0.14 3.62 Weighted mean 39.81 1.19 3.40
At 0-15 51.34 6.48 1.11 ACa 15-39 42.73 4.11 1.13 B1 39-47 47.27 3.11 1.16 B2 47-73 34.54 1.11 1.44
CCa,mot. 73-106 31.11 0.98 1.52 C2 106-129 33.65 0.56 2.70
3
CD 129-145 31.40 0.45 3.57 Weighted mean 37.07 2.08 1.79
Fig. 4. Spatial distribution of hydraulic conductivity (cm/hr.) in the study unit
Fig. 5. Spatial distribution of ESP in the study unit

Alnaimy, et al. 2038
Morphology of Unit One in El-Nubaria Soils Profiles
Profile No. 1
Date of examination: 2016
Location: El-Nubaria region
Parent material: Marine lacustrine deposits (parent material)
Topography: Gently undulating
Slope: Gently sloping to the north
Vegetation: Nil
Water table: 220 cm
Irrigation system: None
Drainage: None
Fig. 6. Profile 1
Depth (cm) Description 0-35
Brownish yellow (10YR 6/6, dry) to yellowish brown (10YR 5/6, moist) loamy sand, massive, soft, slightly sticky, slightly plastic, very few fine gravels, many soft and hard CaCO3
concretions, strongly calcareous, clear smooth boundary. 35-80 Yellow (10YR 7/6, dry) to brownish yellow (10YR 6/6, moist)
sand, massive, non-sticky, non-plastic, very few fine gravels, many soft and hard CaCO3 segregations, strongly calcareous, clear smooth boundary.
80-130 Very pale brown (10YR 8/3, dry) to light yellowish brown (10YR 6/4, moist) loamy sand, massive, slightly hard, non-sticky, non- plastic, many fine to coarse gravels, many soft and hard CaCO3 concretions, strongly calcareous, clear wavy boundary.
130-220 Yellow (10YR 7/8, dry) to brownish yellow (10YR 6/6, moist) loamy sand, massive, very hard (rock of parent material), non-sticky, non- plastic, strongly calcareous.
0
20
35
55
80
130
220
A
CB1
CB2
C
CD
DR
cm

Zagazig J. Agric. Res., Vol. 45 No. (6A) 2018 2039
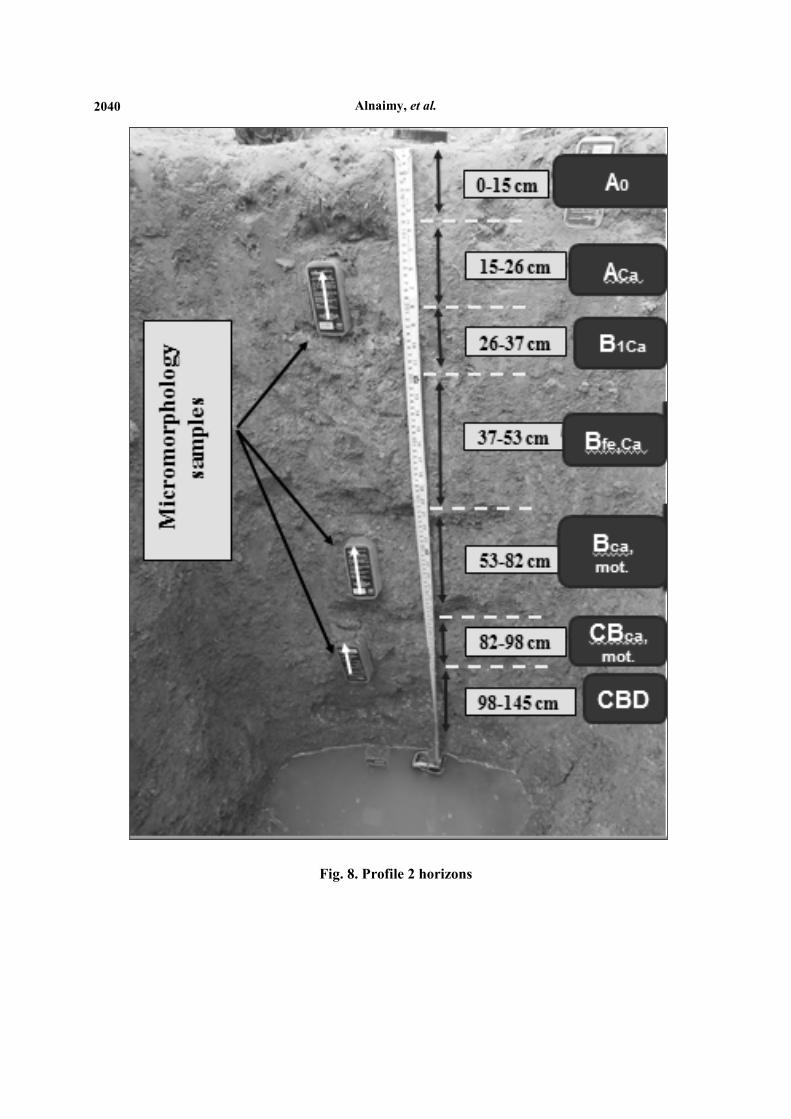
Profile No. 2
Date of examination: 2016
Location: El-Nubaria region
Parent material: Marine lacustrine deposits
Topography: Almost flat
Slope: Flat
Vegetation: Alfalfa
Water table: 145 cm
Irrigation system: Flooding Irrigation
Drainage: Rather well drained
Depth (cm) Description
0-37
Pale brown (10YR 6/3, dry) to light brownish gray (10YR 6/2, moist) sandy loam, massive, soft, moderately sticky, moderately plastic, common soft and hard CaCO3 concretions, many fine to medium fresh roots, many decomposed organic matter, very porous, many small shell fragments, cavernous porosity, diffuse smooth boundary.
37-82 Yellow (10YR 7/6, dry) to brownish yellow (10YR 6/6, moist) sandy clay loam, weak coarse sub angular blocky, firm moist, slightly hard dry, very sticky, very plastic, many soft and hard CaCO3 concretions, moderate fine roots, few decomposed organic matter, moderately porous, some scattered shell fragments, diffuse smooth boundary.
82-145 Yellow (10YR 7/6, dry) to brownish yellow (10YR 6/6, moist) sandy clay, weak coarse sub angular blocky, firm, slightly sticky, slightly plastic, many soft and hard CaCO3 concretions, no roots, few scattered shell fragments, strongly calcareous.
Fig. 7. External morphology view of profile 2
0
15
26
37
53
82
98
145
A0
ACa
B1Ca
BFe,Ca
BCa, mot.
CBCa,mot.
CBD
cm
Alnaimy, et al. 2040
Fig. 8. Profile 2 horizons
Zagazig J. Agric. Res., Vol. 45 No. (6A) 2018 2041
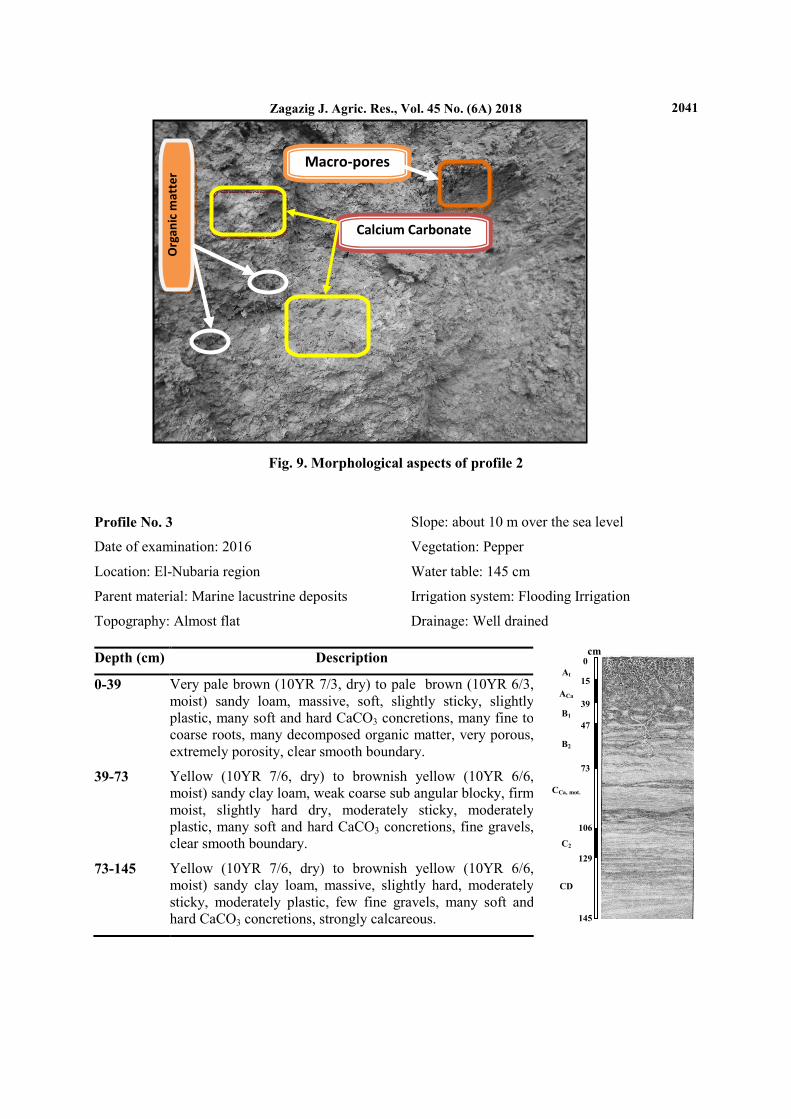
Fig. 9. Morphological aspects of profile 2
Profile No. 3
Date of examination: 2016
Location: El-Nubaria region
Parent material: Marine lacustrine deposits
Topography: Almost flat
Slope: about 10 m over the sea level
Vegetation: Pepper
Water table: 145 cm
Irrigation system: Flooding Irrigation
Drainage: Well drained
Depth (cm) Description
0-39
Very pale brown (10YR 7/3, dry) to pale brown (10YR 6/3, moist) sandy loam, massive, soft, slightly sticky, slightly plastic, many soft and hard CaCO3 concretions, many fine to coarse roots, many decomposed organic matter, very porous,extremely porosity, clear smooth boundary.
39-73 Yellow (10YR 7/6, dry) to brownish yellow (10YR 6/6, moist) sandy clay loam, weak coarse sub angular blocky, firm moist, slightly hard dry, moderately sticky, moderately plastic, many soft and hard CaCO3 concretions, fine gravels,clear smooth boundary.
73-145 Yellow (10YR 7/6, dry) to brownish yellow (10YR 6/6, moist) sandy clay loam, massive, slightly hard, moderately sticky, moderately plastic, few fine gravels, many soft and hard CaCO3 concretions, strongly calcareous.
Calcium Carbonate
Org
an
ic m
att
er
Macro-pores
0
15
39
47
73
106
129
145
At
ACa
B1
B2
CCa, mot.
C2
CD
cm

Alnaimy, et al. 2042
Fig. 10. Horizons and soil micromorphology samples of profile 3
Zagazig J. Agric. Res., Vol. 45 No. (6A) 2018 2043
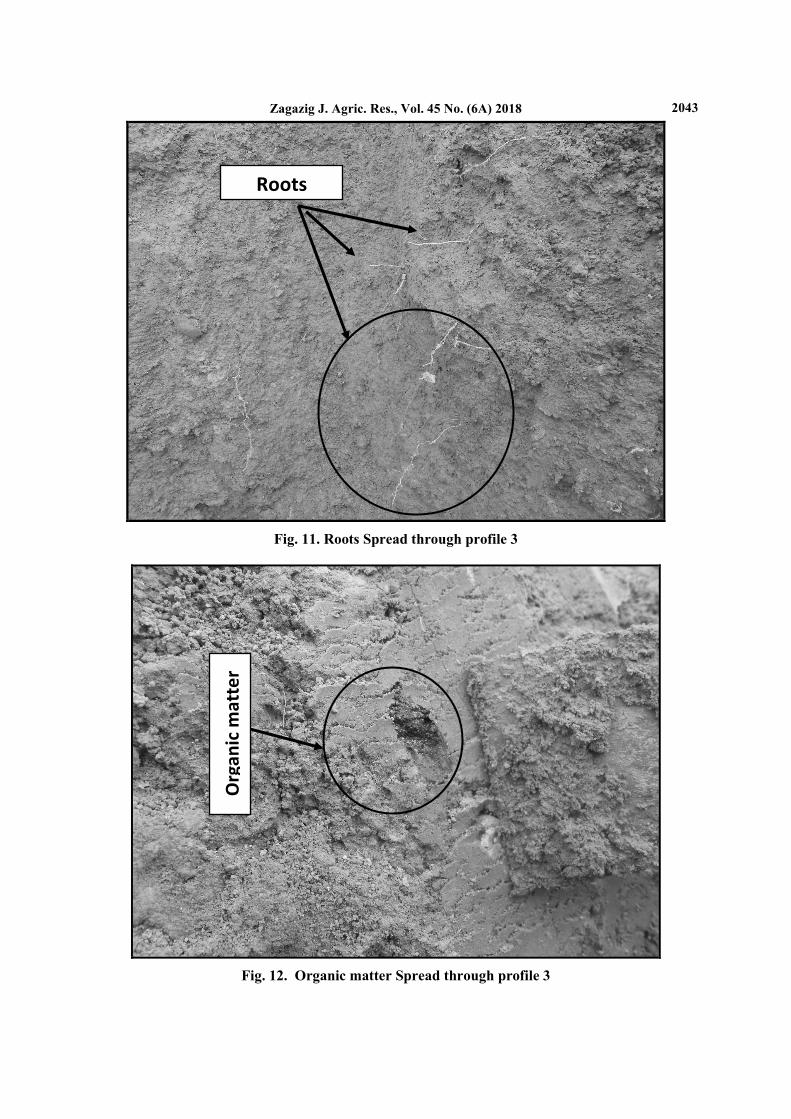
Fig. 11. Roots Spread through profile 3
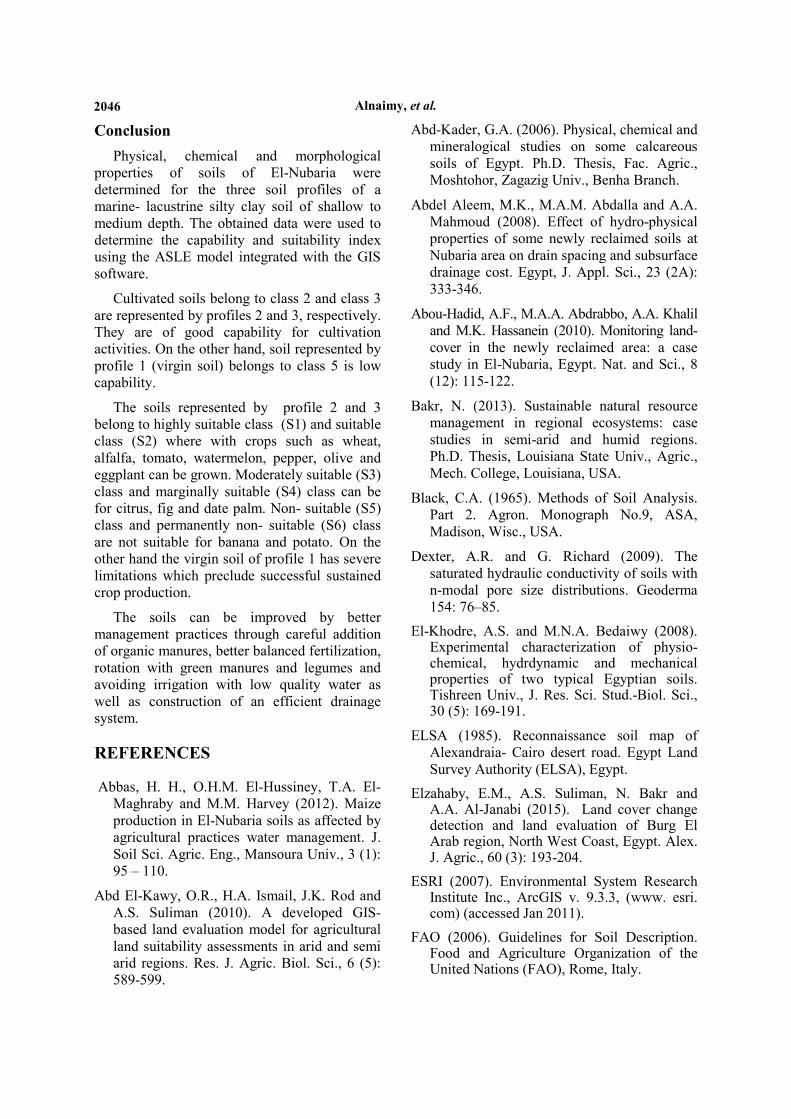
Fig. 12. Organic matter Spread through profile 3
Roots
Org
an
ic m
att
er

Alnaimy, et al. 2044
Land Evaluation
Land capability
Land capability is an expression of the natural fertility and can be related with crop production under natural conditions without use of fertilizers or implementation of soil improvement (Sys et al., 1993).
Based on the soil physical, chemical and fertility properties as well as irrigation water quality, the land capability indices were calculated for the study area, using the ASLE software developed by (Ismail and Moharam, 2009).
The geomorphological unit of the study area was classified into three capability classes (Table 4), the first class is class 2 (C2) which represents soils cultivated for 30 years represented by profile 3. These soils require general soil conservation systems which may require special tillage methods. Soils in this class have slight limitations and conservation practices easy to apply.
The second class is class 3 (C3) which is described as fair productivity. Soil of this class is represented by profile 2. This class had several limitations such as clay content, available water, hydraulic conductivity, cation exchange capacity, and alkalinity. The number of limitations varied between one and five limiting factors. These limiting factors reduce the choices of possible crops for cultivation. When these soils become under cultivation, careful management and conservation practices are required to improve and conserve their properties. Each distinctive kind of soil in this capability class has one or more alternative combinations of use. The number of practical alternatives is less than that for the soils of higher capability classes (Sys et al., 1991). However, some of these limitations can be readily corrected such as water availability and cation exchange capacity. It is commonly necessary to use soil amendments and soil conditions that help improving and modifying soil physical and chemical properties, which may speed up reclamation, cultivation, and rehabilitation.
The third class is Class 5 (C5) which is described as very poor productivity. Soil of this class is represented by profile 1 which had no cultivation practice. This soil is affected by very severe limitations. Cultivation results in improving land capability.
Land Suitability for field crops
Land suitability classes reflect degrees of a given soil area to support and sustain the growth and development of a certain crop. It is an evaluation system for defining the most suitable crop for specific soil. The basic concept of land suitability is to determine the matching of the soil properties or qualities and climatic conditions with the crop requirements. It helps in establishing the most suitable cropping of an area. Suitability indices of the studied unit are shown in Table 5. Crops are categorized into field crops, vegetables and fruits.
Highly suitable (S1) class is for soils of no significant limitations, or only slight limitations that will not significantly reduce productivity or benefits and will not raise inputs above an acceptable level. Suitable (S2) class is for soils of minor limitations which reduce productivity or benefits and may need application for certain corrective measures for maximum production. Moderately suitable (S3) class is for soils of limitations which in are moderately severe for sustained application of a given crop. Such limitations reduce productivity and increase the inputs required to mark the soil productive. Marginally suitable (S4) class is for soils having limitations which are severe for sustained application of a given use causing a reduced productivity or benefits and would need high inputs to become productive. Non-suitable (S5) class for soils having limitations which may be surmountable in time but cannot be corrected with existing knowledge at currently acceptable cost such limitations are severe to preclude successful sustained crop production.
Concerning the effect of cultivation on soil suitability, data indicate that cultivation tends to improve slightly the suitability classes and such effect increases as land use period increases. In this respect, data show that cultivation for 50 years resulted in improving soil suitability class from S5 (Very low) to S3 (Moderate) as shown in Table 5.
It can be concluded that the present cropping system in El-Nubaria seems to remain unchanged. The kind and level of management is the possible change in the present use. Soils of current study could attain higher suitability classes if management and conservation practices are applied in a proper manner. These results are in agreement with those of Bakr (2013) and Abd El-Kawy et al. (2010).

Zagazig J. Agric. Res., Vol. 45 No. (6A) 2018 2045
Table 4. Capability indexes of soil profiles in the study area according to the ASLE model
Profile Index Capability
1 29.95 C5
2 44.78 C3
3 60.11 C2
Table 5. Suitability indexes for some crops of soil profiles in the study area produced by ASLE model
P. No.
Highly suitable
Index Suitable Index Moderately suit.
Index Marginally Suit.
Index Currently non-suit.
Index Permanently non-suit.
Index
Pepper 30.90 Alfalfa 19.30 Onion 8.04
Watermelon 28.17 Rice 18.80 Potato 7.12
Apple 27.62 Sugarcane 17.87 Pear 6.80
1 Pea 26.22 Peanut 6.55
Soyabean 25.57 Citrus 2.47
Maize 22.78 banana 2.11
Faba bean 22.78
Sugarbeet 21.15
Wheat 20.45
Tomato 82.79 Olive 77.66 Data Palm 25.21 Banana 18.77 Potato 6.69
Sunflower 82.31 pepper 77.66 Fig 23.34 Peanut 6.69
Cabbage 76.07 Grape 22.31 Citrus 6.57
Watermelon 75.49
Pea 75.06
Cotton 73.67
Apple 71.36
Sorghum 70.43
2
Alfalfa 70.43
Sunflower 92.41 Data palm 24.84 Potato 7.12
Olive 89.27 Fig 24.84 Peanut 7.12
3 Pepper 88.11 Grape 24.52 Citrus 7.05
Tomato 88.11 Alfalfa 23.76 Banana 6.84
Pea 87.00 Onion 23.76
Watermelon 86.78 Sugar beet 23.76
Sorghum 85.40 Wheat 23.76
Cabbage 85.40 Rice 23.14
Cotton 85.40 Sugarcane 22.72
Alnaimy, et al. 2046
Conclusion
Physical, chemical and morphological properties of soils of El-Nubaria were determined for the three soil profiles of a marine- lacustrine silty clay soil of shallow to medium depth. The obtained data were used to determine the capability and suitability index using the ASLE model integrated with the GIS software.
Cultivated soils belong to class 2 and class 3 are represented by profiles 2 and 3, respectively. They are of good capability for cultivation activities. On the other hand, soil represented by profile 1 (virgin soil) belongs to class 5 is low capability.
The soils represented by profile 2 and 3 belong to highly suitable class (S1) and suitable class (S2) where with crops such as wheat, alfalfa, tomato, watermelon, pepper, olive and eggplant can be grown. Moderately suitable (S3) class and marginally suitable (S4) class can be for citrus, fig and date palm. Non- suitable (S5) class and permanently non- suitable (S6) class are not suitable for banana and potato. On the other hand the virgin soil of profile 1 has severe limitations which preclude successful sustained crop production.
The soils can be improved by better management practices through careful addition of organic manures, better balanced fertilization, rotation with green manures and legumes and avoiding irrigation with low quality water as well as construction of an efficient drainage system.
REFERENCES
Abbas, H. H., O.H.M. El-Hussiney, T.A. El-Maghraby and M.M. Harvey (2012). Maize production in El-Nubaria soils as affected by agricultural practices water management. J. Soil Sci. Agric. Eng., Mansoura Univ., 3 (1): 95 – 110.
Abd El-Kawy, O.R., H.A. Ismail, J.K. Rod and A.S. Suliman (2010). A developed GIS-based land evaluation model for agricultural land suitability assessments in arid and semi arid regions. Res. J. Agric. Biol. Sci., 6 (5): 589-599.
Abd-Kader, G.A. (2006). Physical, chemical and mineralogical studies on some calcareous soils of Egypt. Ph.D. Thesis, Fac. Agric., Moshtohor, Zagazig Univ., Benha Branch.
Abdel Aleem, M.K., M.A.M. Abdalla and A.A. Mahmoud (2008). Effect of hydro-physical properties of some newly reclaimed soils at Nubaria area on drain spacing and subsurface drainage cost. Egypt, J. Appl. Sci., 23 (2A): 333-346.
Abou-Hadid, A.F., M.A.A. Abdrabbo, A.A. Khalil and M.K. Hassanein (2010). Monitoring land-cover in the newly reclaimed area: a case study in El-Nubaria, Egypt. Nat. and Sci., 8 (12): 115-122.
Bakr, N. (2013). Sustainable natural resource management in regional ecosystems: case studies in semi-arid and humid regions. Ph.D. Thesis, Louisiana State Univ., Agric., Mech. College, Louisiana, USA.
Black, C.A. (1965). Methods of Soil Analysis. Part 2. Agron. Monograph No.9, ASA, Madison, Wisc., USA.
Dexter, A.R. and G. Richard (2009). The saturated hydraulic conductivity of soils with n-modal pore size distributions. Geoderma 154: 76–85.
El-Khodre, A.S. and M.N.A. Bedaiwy (2008). Experimental characterization of physio-chemical, hydrdynamic and mechanical properties of two typical Egyptian soils. Tishreen Univ., J. Res. Sci. Stud.-Biol. Sci., 30 (5): 169-191.
ELSA (1985). Reconnaissance soil map of Alexandraia- Cairo desert road. Egypt Land Survey Authority (ELSA), Egypt.
Elzahaby, E.M., A.S. Suliman, N. Bakr and A.A. Al-Janabi (2015). Land cover change detection and land evaluation of Burg El Arab region, North West Coast, Egypt. Alex. J. Agric., 60 (3): 193-204.
ESRI (2007). Environmental System Research Institute Inc., ArcGIS v. 9.3.3, (www. esri. com) (accessed Jan 2011).
FAO (2006). Guidelines for Soil Description. Food and Agriculture Organization of the United Nations (FAO), Rome, Italy.

Zagazig J. Agric. Res., Vol. 45 No. (6A) 2018 2047
Fayed, R.I.M. (2003). Impact of land management practices on soil quality in sandy soils, El-Bostan region- Egypt. Ph.D. Thesis, Fac. Agric., Alex. Univ., Egypt.
Gee, G.W. and J.W. Bauder (1986). Particle Size Analysis In Klute, A. Ed., Methods of Soil Analysis Part1. 383- 409, Agron 9. Ame. Soc. Agron. Madison. Wi. USA.
GSMA. (1981). Geological Map of Egypt. Geological Survey and Mining Authority (GSMA), Cairo, Egypt.
Ismail, H.A. and I.M. Moharam (2009). Applied System of Land Evaluation (ASLE). Alex. Univ., Egypt.
Ismail, M. and R.K. Yacoub (2012). Digital soil map using the capability of new technology in sugar beet area, Nubariya, Egypt. Egypt. J. Remote Sensing and Space Sciences. Nati. Auth. Remote Sens. Space Sci.
Khalifa, M.E.A. (2004). An integrated parametric evaluation model for land resource management: A case study for El- Bostan extension sector, West Nubaria, Egypt. Ph.D. Thesis, Fac. Agri., Univ. Alex., Egypt.
Klute, A. (1986). Methods of soil analysis : Part 1: Physical and mineralogical methods. (2
nd Ed), Ame. Soc. Agron. Monog. No. 9, Madison, WI. USA.
Labib, F. and J.B. Khalil (1977). Pedological study of some sediments in the Western Desert. Egypt. J. Soil Sci., 17 (2): 203-221.
Mohamed E. A. K and M. M. Ihab (2007). Land use planning at mechanical farm sector West of Nubaria using parametric models. J. Agric. Env. Sci. Alex. Univ., Egypt, 6 (2): 159- 167.
Mohamed, M. (2011). The Effectiveness of agricultural extension programs in the desert areas of Nubaria, Egypt: A case study of a
sugar beet program. Ph. D. Fac. Agric. Sci., Georg-August-Univ., Göttingen, Germany.
Moreno, F., J.M. Murillo, F. Pelegrin and I.F. Giran (2006). Long-term impact of conservation tillage on stratification ratio of soil organic carbon and loss of total and active CaCO3 soil. Soil Till. Res., 85: 86-93.
Page, A.L., R.H. Miller and D.R. Keeney (1982). Method of soil analysis. Part 2- Chemical and Microbiological Properties Soil Sci. Soc. Amer. Inc. Publ., Madison, WI, USA.
Reyhanitabar, A. and R.J. Gilkes (2010). The reactivity of carbonates in selected soils from Iran. World Congress of Soil Sci., Soil Solutions for a Changing World, 19:37-39.
Sayed, A.S.A. (2013). Evaluation of the land resources for agricultural development - case study: El-Hammam canal and its extension, NW coast of Egypt. PhD. Hamburg Univ., Germany.
Sys, C., E. Van Ranst and J. Debaveye (1991). Land evaluation. Part 1: Principles in Land Evaluation and Crop Production Calculations; Part 2: Methods in Land Evaluation; Part 3: Crop Requirements. Agric. Publications No. 7, General Admin. for Dev. Cooperation, Brussels, Belgium.
Sys Ir, C., E.V.R. Ir, J. Debaveye and F. Beernaert (1993). Land Evaluation, Part III, Crop Requirements. International Training Cinter for Post-graduate Soil Scientists, Univ. Ghent, Belgium.
Tantawy, M.F., E.A. Abou Hussien, M.A. Ahmed and A.A. Ali (2012). Relative changes of chemical properties of calcareous soils treated by organic acids under different salinity levels of irrigation water. J. Soil Sci. and Agric. Eng., Mans. Univ., 3 (10): 1017 – 1032.

Alnaimy, et al. 2048
منطقة النوبارية لVستخدام الزراعىتقييم مدى مVئمة بعض أراضى
السيد أحمد الناقة- خالد جوده سليمان -عيد النعيمى منال الس
مصر - جامعة الزقازيق- كلية الزراعة-يقسم علوم اSراض
بعد دراسة لى عمل تقييم للمنطقةإالدراسة تھدفت ھذه اسأجريت ھذه الدراسة في منطقة النوبارية غرب الدلتا بمصر، وولتقييم ھذه المنطقة تم ، المنطقة ل�نتاج الزراعىعض الخواص الطبيعية والكيميائية والمورفولوجية للتربة لتحديد انتاجية ب
حيث تم وصف ھذه القطاعات وصفا ) عينة تربة ٢٠تضمنت ( إختيار ث�ث قطاعات أرضية لتمثل منطقة الدراسة عليھا لتوضيح التباين لوعمل خرائط للنتائج المتحصة والكيميائية ض خصائصھا الطبيعي موفورلوجيا والتعرف علي بع
وقد بينت النتائج أن ، للمحاصيل المختلفةنتاجية ومدى م�ئمتھا إلتحديد درجة ) اسل(فيما بينھا ثم استخدام احد برامج التقييم كربونات الكالسيوم نت متوسطات نسبة ، وكاقوام التربة لمنطقة الدراسة تتباين من طميية رملية الي رملية طينية طميية
لمنطقة الدراسة تراوحت بين ) K(وقيم معامل النفاذية ،%٦٫١٤ ، ١٫٢٣النشطة في طبقات التربة في مدي يتراوح بين ، %٣٧، ٣٢وقيم المسامية تراوحت بين ،%٠٫٤٢ و٠٫١٤ ساعة، وقيم المادة العضوية تراوحت بين/ سم٢٫٠٨، ٠٫١٠
٣ ىوقد تم تقسيم منطقة الدراسة بناء علي إنتاجيتھا إل ،%١٥٫٨٧ و١٫١١بادل تراوحت بين ونسبة الصوديوم المت ذات C3والثانى ذات المحتوى المرتفع من الطين ومستوى الماء اSرضي C2المستوي اSول : مستويات وھى كا±تى
يمكناSراضي التي ± C5 الثالث ى المستو، مع ارتفاع نسبة الصوديةالمحتوى المرتفع من الطين ومستوى الماء اSرضي الصودية وانخفاض ±رتفاعوذلك ، سبيل المثال كمزارع سمكيةىيمكن استخدامھا علواستخدامھا فى زراعة المحاصيل
وضحت النتائج المتحصل عليھا أن منطقة الدراسة أكما ، المادة العضويةكذلك انخفاض محتوى معدل رشح الماء فيھا و، مناسبة بشكل معتدل S1 مناسبة ¸نتاج المحاصيل : عدة مستويات علي حسب إنتاجيتھا للمحاصيل المختلفة وھيتنتمي إلي
S2 مناسبة حدية ، S3 غير مناسبة ل¹نتاج ، NS .
ــــــــــــــــــــــ :المحكمــــون
. جامعة بنھا- كلية الزراعة-تاذ علوم اSراضىأس Vمـــدالســد عبــــعلى أحم .د. أ-١ . جامعة الزقازيق- كلية الزراعة-أستاذ علوم اSراضى بو زيدأيمن محمود حلمى أ. د. أ-٢