International equity market integration in a small open economy: Ireland January 1990–December...
27
Munich Personal RePEc Archive International Equity Market Integration in a Small Open Economy: Ireland January 1990 – December 2000 Cotter, John UNSPECIFIED 2004 Online at http://mpra.ub.uni-muenchen.de/3538/ MPRA Paper No. 3538, posted 07. November 2007 / 03:16
Transcript of International equity market integration in a small open economy: Ireland January 1990–December...

MPRAMunich Personal RePEc Archive
International Equity Market Integrationin a Small Open Economy: IrelandJanuary 1990 – December 2000
Cotter, John
UNSPECIFIED
2004
Online at http://mpra.ub.uni-muenchen.de/3538/
MPRA Paper No. 3538, posted 07. November 2007 / 03:16

International Equity Market Integration in a Small Open Economy: Ireland January 1990 – December 2000
JOHN COTTER University College Dublin
Abstract We examine the relationship between the Irish, German, UK and US equity markets. Our main finding is that the Irish equity market depends heavily on trading activity in the other markets but not vice versa. Significant return and volatility spillover effects occur in the direction of, but not from the Irish market. We also find that dual listing in the form of ADRs has an important role to play in these spillover effects. Our findings obtain throughout the sample, but are strongest for the period after the ERM crises and before the introduction of the euro. JEL classification: G1; G10. Keywords: Equity market linkages, return and volatility spillovers, dual trading.
Address for Correspondence: Dr. John Cotter, Department of Banking and Finance, Graduate School of Business, University College Dublin, Blackrock, Co. Dublin, Ireland. Ph. 00-353-1-7168900. E-mail. [email protected]. Acknowledgements: The author would like to thank participants at the symposium on International Equity Market Integration at Trinity College Dublin, a Dublin City University seminar, Raj Aggarwal, Liam Gallagher, Colm Kearney, Brian Lucey, and Kate Phylaktis for their helpful comments on this paper. A UCD faculty research grant provided financial support.

1
1. Introduction
Ireland is recognized as a small open economy with a heavy reliance on external
trade that has been increasing over time (EUROSTAT, 2000). The nature of
Ireland’s capital flows is less clear, however, and this paper addresses this subject by
describing the bivariate interactions between the Irish equity market and the markets
in Germany, the UK and the US. Traditional strong interactions between the Irish
and the UK markets for economic and political purposes may have been superseded
by new relationships with the Eurozone-dominated German markets and the globally
dominant US market.
The literature provides some insights into the areas of investigation. Capital markets
in general have been characterised by increased integration (Claessen and Forbes,
2001).1 Within this, the extent and speed of these interactions have also increased.
Harmonisation of regulatory and market structures, and the removal of capital
control barriers are driving forces in these increased market interactions. Market
linkages are decomposed into short and long run components with strong support for
the former and weaker evidence on the latter (Malliaris and Urrutia, 1992). These
interactions have incorporated both return and volatility linkages in a time-varying
fashion (Bae and Karolyi, 1994; King et al., 1995). Dual listing equities also have an
important influence on the time varying interactions (Karolyi, 2002).
The Irish equity market is small by international standards, with the majority of
companies thinly traded and dominated in size by a few organizations. These latter
equities have a dual listing with the American Depositary Receipts (ADR)
programme being a popular mechanism. Accounting for these features, this paper
examines market interactions during the 1990s by focusing on four issues: first, the
long run relationship between the markets; second, the dynamic relationship between
them; third, the return and volatility transmission process between them; and fourth,
the impact of dual listing with ADRs on the return and volatility linkages. We also
break the full sample into a number of separate sub-periods to discern whether our
findings change as a result of key political and economic events.
The paper proceeds as follows. In the next section, a discussion of related studies
that model the Irish market is presented, coupled with an outline of the

2
methodological framework. Section 3 describes the data and some preliminary
findings. The main empirical results are discussed in section 4. Finally a summary
and conclusions are given in section 5.
2. Prior related studies and methodological framework
From a vast literature that examines the relationship between international equity
markets, a number have specifically modelled the Irish market. Hardouvelis et al
(1999) examine the development of the euro and its impact on equity market
integration from a European-wide context using weekly price data. In a time-
varying process, each county’s returns are linked to an EU benchmark index and
currency returns, and they use the BEKK (1990) model to detail volatility spillovers.
They find that the development of EMU led to increased integration due to a
reduction in restrictions related to the currency composition of investors’ portfolios.
Integration increases with the likelihood of the country joining EMU and the closer
the launch date of the euro. In contrast to this, Aggarwal, Lucey and Muckley
(2003) use cointegration methods on daily European returns for 11 European
markets. They provide a dynamic multivariate approach with a Kalman filter to
determine whether markets are converging. They find a long run relationship
between all markets that increased over the 1990s driven by the EMU project, and a
convergence in returns towards London and Frankfurt that is more rapid for the latter
market.
While this study’s emphasis is on examining the trading relationships for the Irish
equity market in a bivariate setting, there is some previous evidence addressing this
subject explicitly. Gallagher (1995) examines interdependence between the Irish,
UK and German markets at weekly intervals using Granger causality tests. This
study finds that while increased short run linkages occur, no long run cointegrating
relationship exists between the markets. Granger causality occurred from the UK
and German markets to Ireland but not in reverse. However, using a non-
overlapping timeframe, Kearney (1998) finds that a long run relationship does in fact
exist between the Dublin and London markets using monthly observations. He
examines the causes of volatility in Ireland with a univariate GARCH approach
incorporating macroeconomic explanatory variables. He finds that volatility in the
Irish equity market is impacted most by FTSE and exchange rate volatility. Using a

3
bivariate GARCH specification Gallagher and Twomey (1998) examine return and
volatility spillovers from the FTSE100 index and specific UK sector indexes to the
10 largest Dublin traded equities. They find weak evidence of return linkages from
the UK, with stronger volatility effects from both industry specific and market
indexes.
Our study examines the bivariate linkages between the Irish equity market and its
main partners, and it deviates from previous studies in our modelling approaches, in
our data, and in the hypotheses that we test. We use impulse response analysis to
determine the speed of, and the variance decomposition to measure the magnitude of
these interactions. Using a bivariate GARCH specification, the impact of the US, the
largest world equity market, is investigated. We then examine the influence of dual
trading by examining return and volatility spillovers of Irish ADR’s. These
relationships are analysed during the 1990s, which incorporates a period before,
during and after the EMS crises.
Equity market relationships can be examined using the following framework in
prices:
P ISEQ,t = �0+ �Pf,t + et (1)
Here, ISEQ is the Irish stock market index, f is the foreign index (FTSE, DAX30, and
S&P500), and this notation can be extended to apply to returns and higher moments.
A number of key issues arise here. First, what is the long run relationship between
the Irish equity market and other markets? To address this, cross-correlations provide
an average estimate of the linkage of markets for any time period. The long run
relationship between the markets is examined using the cointegration techniques of
Engle and Granger (1987) and Johansen and Juselius (1990). Following Engle and
Granger an error correction model is estimated for the ISEQ:
� P ISEQ,t = �1 + �ISEQ ê t – 1 + � �11(i) � P ISEQ,t - i + ��12 (i)� Pf,t – i + �ISEQt (2)

4
In (2), i = 1 … n, and the error correction model shows the long run dynamics of
the adjustment process between two national market indices. Johansen and Juselius
(1990) extend Engle and Granger’s cointegration to a multivariate framework using
a VAR. Following Johansen and Juselius (1990), the following is estimated:
� P ISEQ,t = �−
=
1
1
p
i
�i � P ISEQ,t - i + � P ISEQ,t - p + �t (3)
The parameter matrix, �, indicates whether the vector of stock prices has a long run
relationship or not. The rank of � equals the number of independent cointegrating
vectors. The procedures adopted provide information on any deviations of the long
run relationships for equity markets.
The second issue we focus on concerns the dynamic relationship between the Irish
equity market and other markets. Using the VAR in (3), we examine innovation
accounting using forecast variance decomposition and impulse response analysis.
Following Eun and Shim (1989), this divides the dynamic relationship into two
concerns. The variance decomposition uses the VAR’s forecast error to determine
the extent to which movements in one market can be explained by a shock in
another. Impulse responses then determine the speed in which price movements are
transmitted between markets. In estimating the VAR system, the dynamic responses
of each national stock index to innovations in a particular market using simulated
responses can be traced out. In addition, the innovation accounting technique allows
us to measure the relative importance of a market in generating unexpected
variations of returns in another market, and thus establishes a causal ordering among
the national stock markets. The findings of the VAR analysis are thus expected to
shed light on the interdependence structure of national stock markets, in general, and
on the international transmission of stock market movements, in particular.
The third issue concerns the return and volatility linkages between the Irish equity
market and other markets. Volatility linkages are examined with the BEKK (1990)
multivariate GARCH (1, 1) model:

5
*' * *' * *' ' *, 0 0 11 , 1 11 11 , 1 , 1 11i t i t i t i tH C C A H A B Bε ε− − −= + + (4)
where Hi,t is the conditional variance covariance matrix at t. Each matrix, C, A and
B is 2 x 2 and C is restricted to be upper triangular with 11 free parameters in the
model. Multivariate GARCH models are notoriously hard to estimate, and for
practical purposes the BEKK specification can be used without detriment to the
application. The BEKK parameterisation has the advantage of being parsimonious
while capturing the interactions requiring estimation of only 11 parameters for a
bivariate setting in the conditional variance-covariance structure. It also ensures that
,i tH positive definite.
Our use of the bivariate setting allows us to explicitly examine country pair
interactions, focusing on the respective linkage of each other market with the Dublin
market. The mean linkages are examined with a first order VAR that also acts as a
filter removing any covariation between the indexes arising from lead and lag
relationships in returns themselves. Parameters describe the extent of return
interaction between the respective indexes and directional causality. Volatility
spillover effects are ascertained from the GARCH estimates. The BEKK model
implies that only the magnitude of past return innovations is important in
determining current time-varying variances and covariances irrespective of sign.
Fourth, do ADRs impact the return and volatility linkages for the Irish equity
market? A number of Irish equities have obtained dual listing by trading on the
Dublin equity market and in the US as an ADR. ADRs, the most attractive means of
conferring dual listing status on the US market, are negotiable certificates that confer
ownership of shares in the foreign company. Their attractiveness is due to the
liquidity and transparency available to traders, and importantly for the companies
themselves, minimizing the cost of capital by diversifying across the investor base.
There are restrictions placed on the dual listed company, however, including
necessary sponsorship of a US bank and meeting the trading and financial
requirements as specified in the sponsoring programme.

6
Using a case study approach for dual listing on the US and Irish markets, we
determine whether the return and volatility linkages carry through to individually
quoted equities. The methodology remains unchanged in the analysis of pair-wise
linkages where a VAR provides a description of the return spillover effects, and a
bivariate GARCH (1, 1) model is fitted to determine the volatility spillover effects in
terms of magnitude and causality. Overall a profile of return and volatility spillover
effects is provided based on trading location detailing the role that ADRs provide in
this process.
3. Data considerations
We use daily closing price data from Datastream over an 11-year period from
01/01/1990 to 29/12/2000.2 The Irish ISEQ, the UK FTSE All Share, the German
DAX30 and the US S&P500 indices are analysed. When national stock exchanges
were closed due to trading restrictions such as national holidays, the index price is
removed from analysis. The dual listed companies chosen are AIB, Elan and
Jefferson Smurfit, representing a cross section of dominant companies traded on the
Irish market. Returns are denoted as the first difference of the natural logarithm of
prices. There is an element of non-synchronous data to be accounted for. Both the
London and Dublin markets operate contemporaneously from 09.00-17.00
Greenwich Mean Time (GMT). In contrast, the Frankfurt bourse trades between
09.30-16.00, and in New York trading occurs between 09.30-16.00. A common
GMT framework has the German market open between 08.30-15.00, and the US
between 14.30-21.00. We assume that the Frankfurt times overlap perfectly with the
Irish market and that the lead days closing price is used for measuring prices in New
York.3
The dataset is divided into three time periods to capture the effects of changing
financial and economic integration between Ireland and the other markets over time.
These sub-periods are based on key economic and political events that have occurred
and are as follows:
• Sub-period 1 runs from 1 January 1990 to 31 July 1993 involving the period
leading upto and including the ERM crises,

7
• Sub-period 2 runs from 3 August 1993 to 31 December 1998 involving the
period post ERM crises and pre Euro, and
• Sub-period 3 runs from 1 January 1999 to 29 December 2000 involving the
introduction of the Euro.
Some preliminary statistics are reported in Table 1. Positive daily returns averaged
approximately 1 percent over the full period for the ISEQ with volatility of 0.5
percent. Turning to the sub-periods, volatility has increased as the decade
progressed associated with a very strong equity market performance during the mid
1990’s. There is evidence of excess skewness and kurtosis relative to the normal
distribution. Cross-correlations provide a preliminary indicator of equity integration,
with positive correlation exhibited for the full period of analysis. The markets are
most closely linked with US equities, although this is weakest for the ISEQ, which
has relatively strong links (and of equal magnitude) with the UK and German
markets. This correlation structure changes over time with increased linkage from
sub-period 1 to 2 reversing in sub-period 3.
Insert Table 1 about here
4. Empirical findings
The first key question to be addressed concerns the nature of the long run
relationship between the Irish equity market and other markets. Several interesting
findings emerge and these are given in Table 2. At a common significance levels
there is a cointegrating relationship between the ISEQ and FTSE but not with the
other markets. This drives the long run relationship that exists for the 4 markets
together. Variations occur across the sub-periods with evidence supporting
increased integration between 1993 and 1999 that surprisingly decreased since 1999.
Possible explanations include increased integration associated with bull markets, and
contagion effects from the fallout of the ERM and Asian crises with the reduction
caused by noise inducement from using daily data.
Insert Table 2 about here

8
For the cointegration analysis, stationarity is first verified with estimates in Table 2.
The results are consistent across markets and support previous studies. The
hypothesis that each index contains a unit root is not rejected, the markets are
integrated of order 1, I(1).4 No qualitative deviations occur across the sub-periods.
Augmented Dickey-Fuller test statistics provide weak support for no cointegration.
Given this weak support for a long run relationship for the country pairs and the
conflicting past evidence in the literature, the Johansen and Juselius procedure is
applied in the bivariate setting. There is general support for the bivariate
cointegrating regression results with a lack of cointegrating relationships between the
ISEQ and other markets for the full period, although a long run relationship is not
rejected for the ISEQ and FTSE at 10% significance levels. However, a long run
bivariate relationship is documented for sub-period 2 suggesting that the findings
might be dependent on time periods chosen. This lack of consistency over the full
period suggests that the contradictory bivariate findings of Gallagher (1995) and
Kearney (1998) may be explained by the respective timeframes chosen.
This brings us to our second issue about the dynamic relationship between the Irish
equity market and the other markets. The dynamic relationship is broken into two
areas of investigation. First, variance decomposition is examined with results
presented in Table 3 indicating that the Irish market is not exogenous. Thus a
substantial amount of the ISEQ’s variance is a result of activity in other markets.
The breakdown of influence indicates that the US is the most important player in the
ISEQ’s variance decomposition followed by the UK. This is not surprising.
Movements in the ISEQ index have negligible influence on those of other markets
again supporting evidence of a casual effect for, and not by, the Irish market.
Insert Table 3 about here
Turning to the impulse response estimates, Table 4 provides normalised responses
for the ISEQ index for a typical shock to and from the Irish market. These responses
represent unit shocks measured in standard deviations. As can be seen from the
results, innovations in the international equity markets are rapidly transmitted to the
ISEQ. For instance, the response to a US shock on day 0 is 5.92. As expected, the
response to a US shock also lags by 1 day and is even stronger with an estimate of

9
10.31. Shocks in the other markets also impact the ISEQ rapidly with the UK having
the largest influence. In contrast, unit shocks in the ISEQ have little influence over
the other markets. In general, the speed of transmission is quick with impulse
response estimates reducing dramatically from day 2 onwards. These results suggest
that the ISEQ becomes informationally efficient rapidly regardless of which market
it is responding to. We now focus on the third issue.
Insert Table 4 about here
We now consider the third question about the return and volatility linkages between
the Irish equity market and other markets. To examine this issue a VAR(1)-
GARCH(1, 1) model is applied and estimates are presented in Table 5. The model is
well specified according to the Ljung-Box statistics and suggests the dependence in
the returns and especially squared returns is much reduced for the residual series.
The VAR examines the direction and magnitude of the return linkages. The BEKK
specification determines the causality and extent of volatility linkages. Note that the
return interactions suggest that the spillover effects are in general positive,5 with
significant spillover effects to, but not from, the ISEQ index. As expected, the mean
spillover effects are dominated by causality in the direction of the Irish equity
market. The UK and US markets dominate and have a similar impact on the ISEQ
although statistically the latter has slightly stronger effects.
Insert table 5 about here
Considering the second moment, the main diagonal elements of the variance
covariance matrix are typical of a GARCH process with autoregressive and time
dependent volatility effects reported for each index. The volatility spillover effects
provides similar conclusions to the return interactions. As with the mean, the off
diagonal of the covariance matrix identifies volatility spillover effects in the
direction of, but not from, the Irish equity market. The US market has the biggest
impact in terms of past squared innovations, while the German market has the largest
impact for spillover of past conditional variances. Time variation in the covariance
relationship for the ISEQ and the other indexes is given in Figure 1.

10
Insert Figure 1 about here
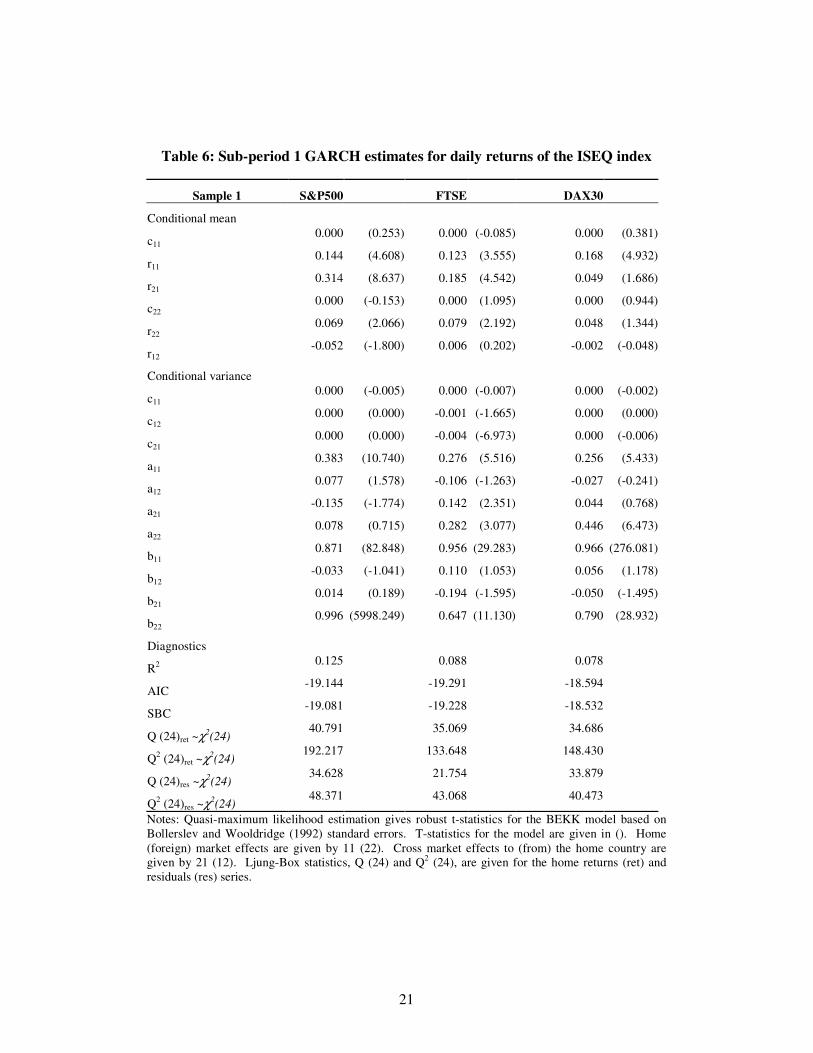
Considering the sub-periods gives an indication of how the market interactions have
changed during the 1990’s. The VAR(1)-GARCH(1, 1) results are presented in
Tables 6-8 for all three sub-periods. The findings reinforce the full-period results
with some notable variations. Beginning with similarities, mean spillovers are uni-
directional to, and not from, the ISEQ index, with the US market being dominant.
For all markets, the returns linkage is strongest for sub-period 2 and of reasonably
similar magnitude during the other sub-periods. Also, autoregressive and time
dependent volatility is generally documented for each index across the sub-periods.
The variations in the sub-period results are interesting. In sub-period 1, weak
volatility spillover effects are recorded along with negligible spillover effects in
terms of past squared innovations, except for the FTSE. In sub-period 2, the
movement towards the introduction of the euro impacts on increased integration
between the Irish and German markets. Analysis of the final sub-period supports
this view with the strongest volatility spillover effects to Ireland coming from the
German market.
Insert Tables 6 – 8 about here
We now use a case study of dual listed companies to examine the fourth issue about
whether ADRs impact on the return and volatility linkages for the Irish equity
market. As described earlier, dual listing via ADRs is popular for allowing Irish
equities trade in the US. A few companies dominate trading on the Dublin market,
and three of these are chosen for analysis.6 A VAR(1)-GARCH(1, 1) model is
estimated for AIB, Elan and Jefferson Smurfit with findings presented in Table 9.
The estimation procedure follows the investigation into the return and volatility
interactions to the equities traded in Dublin and to the ISEQ index. The results
reinforce the findings for the interactions between the ISEQ and S&P indexes.
Strong mean and volatility spillover effects occur and their direction is from the
ADRs to the Dublin market.
Insert Table 9 about here

11
In fact, the return spillovers have an even greater impact based on trading location
than between the indexes. For instance, mean spillovers indicate that a 1% increase
on the Jefferson Smurfit ADR causes a 0.472% increase on this equity traded on the
ISEQ. The comparable spillover effect for the ISEQ index is 0.096%. These
findings are consistent across equities, with AIB ADRs having the strongest
statistical effect. Once again, the mean spillover effect is not always bi-directional
with the exception of Elan. However all spillover effects are dominated by causality
in the direction of equities traded in Dublin. Turning to the volatility effects,
evidence of strong autoregressive and dependent volatility are consistent with the
index analysis. As in the analysis of US and Irish indexes, past return innovations
spillovers are based on trading location of the individual equities with causality
toward trading in Dublin. The past volatility interactions however are not as strong
although again they spillover to Dublin for AIB and Smurfit, impacting both the
equities themselves and the ISEQ index. The results presented here indicate that
dual trading has an important role to play in explaining the interactions between the
Irish and US markets, with causality coming from activity in the ADRs.
5. Summary and conclusions
This paper examines bivariate relations for the Irish equity market with the US, UK
and German markets. The long run relation between the markets was first
determined using correlation analysis and cointegration techniques. The dynamic
relationship between the markets was then profiled using forecast variance
decomposition and impulse response analysis. The linkages between the markets
were then analysed using multivariate GARCH techniques. Finally, a case study
approach was adopted to determine the role of dual listing with ADRs on the time
varying return and volatility linkages. Throughout our analysis, the impact of key
economic and political events, namely the period pre and post ERM crises and the
period after the introduction of the euro was examined.
Our main findings are that return interactions for the Irish equity market were
strongest during the mid 1990s with the UK market having the dominant relation,
and they were relatively weak for the other sub-periods. Thus, overall support for a
long run relation, using cointegration techniques might be tenuous, and this might
explain the inconsistent findings of previous studies. Variance decomposition

12
findings indicate that the Irish equity market is heavily dependent on the activity of
other markets, especially the US market. In addition, impulse response analysis of
innovations indicates a rapid speed of transmission for the ISEQ that tapers off
quickly.
Multivariate GARCH analysis points to significant return and volatility spillover
effects to, but not from, the Irish equity market. These are strongest for the period
post ERM crises and before the introduction of the euro, with the US and UK
markets having a notable influence. The influence of the German market has risen
over time, supporting greater integration of Eurozone markets. The role of dual
listing for the return and spillover effects for the Irish equity market indicates a
strong impact from US traded ADRs. These impacts are more pronounced than
those emanating from our analysis using the indexes. Overall, our analysis
demonstrates significant interactions of a direction and magnitude that are expected
in the context of a small open economy.

13
References
Aggarwal, R., B. M. Lucey, and C. Muckley, 2003, Time varying equity market integration in Europe. Paper presented to the symposium on International Equity Market Integration, Institute for International Integration Studies, Trinity College Dublin, June. Ang, A., and G. Bekaert, 2002, International asset allocation with regime shifts, Review of Financial Studies, 15, 1137-1187. Baba, Y., Engle, R. F., Kraft, D, and K. Kroner, 1990, Multivariate simultaneous generalized ARCH, Working paper, University of California San Diego. Bae, K.H., and G. A. Karolyi, 1994, Good news, bad news and international spillovers of stock return volatility between Japan and the U.S., Pacific-Basin Finance Journal 2, 405-438. Bollerslev, T. and J.M. Wooldridge, 1992, Quasi-maximum likelihood estimation and inference in models with time varying covariances, Econometric Reviews, 11, 143-72. Claessens, S., and K. Forbes, 2001, International financial contagion (Kluwer Academic Publishers, New York). DeSantis, G., and B. Gerard, 1998, How big is the premium for currency risk?, Journal of Financial Economics 49, 375-412. Engle, R., and C. W. J. Granger, 1987, Cointergration and error correction: representation, estimation, testing, Econometrica, 55, 251-276. Eun, C. S., and S. Shim, 1989, International transmission of stock market movements, Journal of Financial and Quantitative Analysis, 24, 241-256. EUROSTAT, 2000, External and intra European Union trade, Statistical yearbook, Eurostat, Luxembourg. Gallagher, L., 1995, Interdependencies among the Irish, British and German stock markets, Economic and Social Review, 26, 131-147. Gallagher, L., and C. Twomey, 1998, Identifying the source of mean and volatility spillovers in Irish equities: a multivariate GARCH analysis, Economic and Social Review, 29, 341-356. Hardouvelis, G., D. Malliaroupoulos, and R. Priestley, 1999, EMU and European stock market integration, CEPR Discussion Paper 2124. Irish Stock Exchange, 2001, Annual statistical review. Johansen, S., and K. Juselius, 1990, Maximum likelihood estimation and inference on cointegration with applications to the demand for money, Oxford Bulletin of Economics and Statistics, 52, 169-210.

14
Karolyi, G. A., 2002, The role of ADRs in the developments and integration of emerging equity markets, Working paper, Ohio State University. Kearney, C., 1998, The causes of volatility in a small integrated stock market: Ireland 1975-1994, Journal of Financial Research, 21, 85-105. King, M., E. Sentana, and S. Wadhwani, 1995, Volatility and links between national stock markets, Econometrica 62, 901-933. Longin, F. M., and B. Solnik, 1995, Is the correlation in international equity returns constant: 1970-1990?, Journal of International Money and Finance 14, 3-26. Malliaris, A. G., and J. L. Urrutia, 1992, The international crash of October 1987: Causality tests, Journal of Financial and Quantitative Analysis, 27, 353-364.

15
Table 1: Summary statistics for equity index returns
Full period Moments Correlation ISEQ FTSE DAX30 S&P500 ISEQ FTSE DAX30 S&P500Mean 0.98 1.62 0.15 0.29 ISEQ 1.00 Std Dev 0.53 1.01 0.12 0.15 FTSE 0.43 1.00 Skew -0.29* -0.17* -0.09* -0.23* DAX30 0.49 0.52 1.00 Kurtosis 8.84* 4.26* 5.81* 9.01* S&P500 0.23 0.40 0.34 1.00 Sub-period 1 Correlation ISEQ FTSE DAX30 S&P500Mean -0.18 0.67 -0.01 0.11 ISEQ 1.00 Std Dev 0.41 0.85 0.10 0.10 FTSE 0.32 1.00 Skew -0.11 0.47* -0.42* -0.07 DAX30 0.41 0.40 1.00 Kurtosis 3.52* 3.37* 7.19* 1.64* S&P500 0.22 0.32 0.29 1.00 Sub-period 2
Correlation ISEQ FTSE DAX30 S&P500Mean 2.02 2.58 0.26 0.38 ISEQ 1.00 Std Dev 0.75 1.34 0.16 0.18 FTSE 0.53 1.00 Skew -0.60* -0.11* -0.62* -0.89* DAX30 0.57 0.55 1.00 Kurtosis 13.14* 4.66* 5.89* 12.73* S&P500 0.27 0.43 0.34 1.00 Sub-period 3 Correlation ISEQ FTSE DAX30 S&P500Mean 0.17 0.67 0.16 0.35 ISEQ 1.00 Std Dev 1.99 3.93 0.49 0.66 FTSE 0.40 1.00 Skew -0.02 0.16 0.17 -0.02 DAX30 0.47 0.60 1.00 Kurtosis 0.76* 0.87* 0.85* 0.97* S&P500 0.16 0.44 0.40 1.00Notes: The first two moments are expressed in percentage form. The symbol * indicates significance at the 5 percent level. Cross-correlations for the indexes are reported in the right-hand columns.

16
Table 2: Unit root tests and cointegration analysis for equity indexes
Unit root Cointegration
Indices Returns Returns
Full period ADF PP ADF PP ADF JJ
ISEQ -2.84 -2.73 -49.32* -49.32* ISEQ-FTSE -3.17* 13.76
FTSE -2.93 -3.05 -33.89* -49.82* ISEQ-DAX30 -2.39 7.47
DAX30 -3.18 -3.18 -51.24* -51.24* ISEQ-S&P500 -2.09 5.57
S&P500 -2.44 -2.58 -33.96* -51.64* ISEQ-FTSE, DAX30,S&P500 -3.89*
Sub-period 1
ISEQ -2.01 -1.41 -26.64* -26.78* ISEQ-FTSE -2.59 11.14
FTSE -2.78 -2.78 -29.23* -29.23* ISEQ-DAX30 -3.62* 15.16
DAX30 -1.89 -1.92 -29.27* -29.30* ISEQ-S&P500 -2.75 14.33
S&P500 -0.01 -2.26 -29.00* -29.06* ISEQ-FTSE, DAX30, S&P500 -3.98*
Sub-period 2
ISEQ 0.12 -1.79 -15.68* -33.29* ISEQ-FTSE -4.42* 25.25*
FTSE -2.47 -2.21 -26.74* -33.27* ISEQ-DAX30 -3.89* 23.80*
DAX30 -0.36 -2.64 -30.28* -36.44* ISEQ-S&P500 -3.63* 16.41*
S&P500 0.56 -2.49 -36.07* -36.10* ISEQ-FTSE, DAX30, S&P500 -5.09*
Sub-period 3
ISEQ -1.95 -1.72 -22.13* -22.18* ISEQ-FTSE -2.51 28.30*
FTSE -3.08 -3.03 -21.99* -21.99* ISEQ-DAX30 -2.45 15.58*
DAX30 -1.68 -1.72 -21.83* -21.80* ISEQ-S&P500 -2.15 13.36
S&P500 -2.28 -2.99 -22.01* -22.02* ISEQ-FTSE, DAX30, S&P500 -2.74 Notes: The critical values for the Augmented Dickey Fuller (ADF) and Phillips and Perron (PP) tests of the null hypothesis of a unit root are -3.12, -3.41 and -3.96 at the 10%, 5% and 1% levels of significance respectively. The critical values for the ADF test for the null hypothesis of no cointegration, are –2.5671 at the 10% level, -2.8621 and –3.4336 at the 5% and 1% levels respectively. The critical values for the Johansen and Juselius (JJ) trace and maximum maximum eigenvalue statistics are 13.33 at the 10% level, 15.41 and 20.04 at the 5% and 1% levels respectively. The symbol * indicates significance at the 5 percent level.

17
Table 3: Forecast variance decomposition analysis for equity markets
Horizon S&P500 FTSE DAX30 ISEQ ISEQ
1 17.53 11.15 6.81 64.51 5 17.71 11.09 7.07 64.13
10 17.71 11.09 7.07 64.12 Horizon S&P500 FTSE DAX30 ISEQ
FTSE 1 21.60 15.44 61.63 1.33 5 21.68 15.55 61.27 1.50
10 21.68 15.55 61.27 1.50 Horizon S&P500 FTSE DAX30 ISEQ
DAX30 1 25.94 73.00 0.57 0.49 5 25.92 72.44 1.15 0.50
10 25.92% 72.43 1.15 0.50 Horizon S&P500 FTSE DAX30 ISEQ
S&P500 1 99.51 0.23 0.01 0.26 5 98.88 0.30 0.12 0.70
10 98.87 0.31 0.12 0.71
Notes: The forecast variance of each markets price is broken up into portions accounted for by price shocks coming from other markets represented in percentage form.

18
Table 4: Impulse responses for the ISEQ index
No. of days S&P500 FTSE DAX30 ISEQ To ISEQ
0 5.93 9.30 7.41 22.791 10.31 1.83 0.06 -0.902 0.50 0.56 -0.82 -1.473 1.44 -0.08 -0.61 0.844 -0.85 0.52 1.30 0.685 0.45 -0.31 0.26 -0.016 0.06 0.04 -0.03 0.017 0.16 -0.04 0.09 0.028 -0.05 0.14 -0.02 0.009 0.02 0.00 -0.03 0.02
10 0.00 0.00 0.00 0.02 No. of days S&P500 FTSE DAX30 ISEQ From ISEQ
0 0.00 0.00 0.00 22.791 -0.41 -3.73 -0.77 -0.902 -0.07 -0.30 -0.11 -1.473 0.49 0.65 0.24 0.844 0.22 0.26 0.11 0.685 -0.06 -0.07 0.00 -0.016 -0.05 -0.07 -0.01 0.017 0.01 0.09 -0.01 0.028 0.02 0.07 0.00 0.009 0.00 0.02 0.00 0.02
10 0.00 -0.01 0.00 0.02
Notes: The impulse response coefficients represent the normalised response of a particular market to a shock of one standard error in another market.

19
Table 5: GARCH estimates for daily returns of the ISEQ index
Full period S&P500 FTSE DAX30 Conditional mean c11 0.000 (0.561) 0.000 (1.659) 0.000 (0.941) r11 0.145 (8.014) 0.028 (1.348) 0.082 (3.919) r21 0.178 (9.904) 0.235 (9.899) 0.094 (5.631) c22 0.001 (3.018) 0.000 (2.229) 0.000 (1.549) r22 0.019 (0.988) 0.136 (6.295) 0.063 (2.983) r12 -0.020 (-1.079) -0.076 (-3.972) -0.090 (-3.379) Conditional variance
c11 0.000 (0.837) 0.000 (0.389) 0.000 (-0.055)
c12 0.000 (1.343) -0.001 (-10.493) 0.000 (0.176)
c21 0.000 (-0.232) -0.001 (-7.993) 0.000 (0.112)
a11 0.283 (7.055) 0.185 (3.781) 0.165 (4.482)
a12 -0.047 (-1.772) 0.018 (0.553) -0.002 (-0.034)
a21 0.283 (5.232) 0.139 (1.756) 0.124 (4.627)
a22 0.106 (3.140) 0.247 (5.474) 0.317 (12.351)
b11 0.856 (78.024) 0.965 (153347.882) 0.975 (33643.644)
b12 0.047 (3.140) -0.001 (-0.196) -0.007 (-7.341)
b21 -0.041 (-4.533) -0.055 (-5.419) -0.046 (-11.115)
b22 0.992 (153741.777) 0.949 (1378.691) 0.932 (433.596) Diagnostics R2 0.067 0.072 0.032 AIC -18.786 -19.367 -18.588 SBC -18.761 -19.342 -18.563
Q (24)ret ~χ2(24) 70.988 48.697 46.337
Q2 (24)ret ~χ2(24) 229.351 235.720 280.279
Q (24)res ~χ2(24) 25.382 19.618 28.444
Q2 (24)res ~χ2(24) 119.918 113.803 116.793 Notes: Quasi-maximum likelihood estimation gives robust t-statistics for the BEKK model based on Bollerslev and Wooldridge (1992) standard errors. T-statistics for the model are given in (). Home (foreign) market effects are given by 11 (22). Cross market effects to (from) the home country are given by 21 (12). Ljung-Box statistics, Q (24) and Q2 (24), are given for the home returns (ret) and residuals (res) series.

20
Figure 1: Plots of equity index conditional covariances
1990-2000
ISE
Q-S
&P
500
0 500 1000 1500 2000 2500
-0.0
001
0.00
02
1990-2000
ISE
Q-F
TSE
0 500 1000 1500 2000 2500
0.0
0.00
020.
0004
1990-2000
ISE
Q-D
AX
30
0 500 1000 1500 2000 2500
0.0
0.00
04
21
Table 6: Sub-period 1 GARCH estimates for daily returns of the ISEQ index
Sample 1 S&P500 FTSE DAX30
Conditional mean
c11 0.000 (0.253) 0.000 (-0.085) 0.000 (0.381)
r11 0.144 (4.608) 0.123 (3.555) 0.168 (4.932)
r21 0.314 (8.637) 0.185 (4.542) 0.049 (1.686)
c22 0.000 (-0.153) 0.000 (1.095) 0.000 (0.944)
r22 0.069 (2.066) 0.079 (2.192) 0.048 (1.344)
r12 -0.052 (-1.800) 0.006 (0.202) -0.002 (-0.048)
Conditional variance
c11 0.000 (-0.005) 0.000 (-0.007) 0.000 (-0.002)
c12 0.000 (0.000) -0.001 (-1.665) 0.000 (0.000)
c21 0.000 (0.000) -0.004 (-6.973) 0.000 (-0.006)
a11 0.383 (10.740) 0.276 (5.516) 0.256 (5.433)
a12 0.077 (1.578) -0.106 (-1.263) -0.027 (-0.241)
a21 -0.135 (-1.774) 0.142 (2.351) 0.044 (0.768)
a22 0.078 (0.715) 0.282 (3.077) 0.446 (6.473)
b11 0.871 (82.848) 0.956 (29.283) 0.966 (276.081)
b12 -0.033 (-1.041) 0.110 (1.053) 0.056 (1.178)
b21 0.014 (0.189) -0.194 (-1.595) -0.050 (-1.495)
b22 0.996 (5998.249) 0.647 (11.130) 0.790 (28.932)
Diagnostics
R2 0.125 0.088 0.078
AIC -19.144 -19.291 -18.594
SBC -19.081 -19.228 -18.532
Q (24)ret ~χ2(24) 40.791 35.069 34.686
Q2 (24)ret ~χ2(24) 192.217 133.648 148.430
Q (24)res ~χ2(24) 34.628 21.754 33.879
Q2 (24)res ~χ2(24) 48.371 43.068 40.473
Notes: Quasi-maximum likelihood estimation gives robust t-statistics for the BEKK model based on Bollerslev and Wooldridge (1992) standard errors. T-statistics for the model are given in (). Home (foreign) market effects are given by 11 (22). Cross market effects to (from) the home country are given by 21 (12). Ljung-Box statistics, Q (24) and Q2 (24), are given for the home returns (ret) and residuals (res) series.

22
Table 7: Sub-period 2 GARCH estimates for daily returns of the ISEQ index
Sample 2 S&P500 FTSE DAX30
Conditional mean
c11 0.000 (1.845) 0.001 (3.036) 0.001 (2.226)
r11 0.039 (1.711) -0.047 (-1.450) 0.041 (1.284)
r21 0.515 (22.732) 0.355 (9.564) 0.139 (5.687)
c22 0.000 (1.212) 0.000 (2.177) 0.000 (0.559)
r22 -0.007 (-0.278) 0.221 (6.633) 0.084 (2.606)
r12 -0.015 (-0.550) -0.136 (-4.690) -0.141 (-3.339)
Conditional variance
c11 0.000 (-0.069) 0.002 (6.615) 0.000 (-0.052)
c12 0.001 (3.123) 0.000 (1.922) 0.000 (-0.147)
c21 -0.001 (-2.575) 0.000 (0.103) 0.000 (-0.112)
a11 0.182 (4.657) 0.398 (7.592) -0.113 (-4.438)
a12 0.115 (3.127) 0.094 (1.824) -0.260 (-4.471)
a21 -0.100 (-4.390) -0.216 (-2.097) 0.209 (20.561)
a22 0.279 (11.930) 0.089 (1.857) 0.350 (18.754)
b11 0.960 (963.118) 0.855 (100.498) 0.978 (1977.510)
b12 -0.012 (-1.316) -0.044 (-4.910) -0.042 (-26.288)
b21 0.039 (2.874) 0.094 (4.378) -0.010 (-20.694)
b22 0.945 (327.737) 1.010 (65887.546) 0.969 (2001.192)
Diagnostics
R2 0.304 0.098 0.044
AIC -19.418 -19.866 -18.939
SBC -19.374 -19.821 -18.895
Q (24)ret ~χ2(24) 71.553 71.419 61.250
Q2 (24)ret ~χ2(24) 247.212 155.489 229.264
Q (24)res ~χ2(24) 30.346 25.080 27.362
Q2 (24)res ~χ2(24) 83.299 58.323 128.587
Notes: Quasi-maximum likelihood estimation gives robust t-statistics for the BEKK model based on Bollerslev and Wooldridge (1992) standard errors. T-statistics for the model are given in (). Home (foreign) market effects are given by 11 (22). Cross market effects to (from) the home country are given by 21 (12). Ljung-Box statistics, Q (24) and Q2 (24), are given for the home returns (ret) and residuals (res) series.

23
Table 8: Sub-period 3 GARCH estimates for daily returns of the ISEQ index
Sample 3 S&P500 FTSE DAX30
Conditional mean
c11 0.001 (1.125) 0.001 (1.321) 0.001 (1.069)
r11 -0.020 (-0.470) -0.028 (-0.577) -0.012 (-0.239)
r21 0.312 (8.951) 0.176 (3.484) 0.097 (2.566)
c22 0.000 (0.235) 0.000 (0.540) 0.001 (1.092)
r22 0.046 (1.049) 0.114 (2.297) 0.075 (1.553)
r12 -0.082 (-1.576) -0.128 (-2.686) -0.145 (-2.351)
Conditional variance
c11 0.001 (0.097) 0.000 (-1.359) 0.000 (0.123)
c12 -0.008 (-1.112) 0.002 (5.463) 0.007 (17.661)
c21 -0.007 (-1.299) -0.001 (-0.889) -0.003 (-6.608)
a11 0.296 (1.504) -0.088 (-1.729) -0.032 (-0.271)
a12 -0.069 (-0.110) -0.007 (-0.120) 0.092 (0.860)
a21 0.059 (0.155) 0.094 (1.780) 0.258 (5.007)
a22 0.183 (0.630) 0.210 (3.994) 0.057 (0.954)
b11 0.368 (1.163) 0.983 (302.219) 0.620 (39.272)
b12 -0.831 (-0.904) 0.094 (6.255) 0.349 (6.720)
b21 -0.322 (-0.642) -0.050 (-7.334) 0.120 (16.007)
b22 0.392 (0.813) 0.928 (338.944) 0.824 (178.120)
Diagnostics
R2 0.142 0.054 0.017
AIC -18.044 -18.573 -17.909
SBC -17.946 -18.475 -17.811
Q (24)ret ~χ2(24) 33.046 26.602 23.056
Q2 (24)ret ~χ2(24) 51.117 40.608 37.846
Q (24)res ~χ2(24) 35.838 30.651 30.273
Q2 (24)res ~χ2(24) 37.322 37.538 38.709
Notes: Quasi-maximum likelihood estimation gives robust t-statistics for the BEKK model based on Bollerslev and Wooldridge (1992) standard errors. T-statistics for the model are given in (). Home (foreign) market effects are given by 11 (22). Cross market effects to (from) the home country are given by 21 (12). Ljung-Box statistics, Q (24) and Q2 (24), are given for the home returns (ret) and residuals (res) series.

24
Table 9: GARCH estimates for daily returns of ADRs
AIB SMURFIT ELAN Conditional mean ISEQ AIB ISEQ SMURFIT ISEQ ELAN
c11 0.000 (2.377) 0.001 (1.533) 0.001 (2.445) -0.001 (-1.090) 0.000 (1.781) 0.001 (2.448)
r11 0.099 (5.530) -0.005 (-0.304) 0.078 (3.076) -0.142 (-5.773) 0.134 (7.462) -0.039 (-2.242)
r21 0.201 (20.374) 0.478 (28.466) 0.096 (8.934) 0.472 (16.192) 0.078 (11.780) 0.374 (19.871)
c22 0.000 (0.354) 0.000 (0.294) 0.000 (0.326) 0.000 (0.376) 0.000 (-0.047) 0.000 (-0.033)
r22 -0.021 (-1.063) -0.024 (-1.208) 0.052 (1.952) 0.044 (1.634) 0.079 (4.271) 0.078 (4.205)
r12 0.003 (0.092) 0.027 (1.361) 0.053 (0.852) 0.039 (1.733) -0.153 (-3.037) -0.050 (-2.915) Conditional Variance
c11 0.000 (0.034) 0.000 (-0.033) 0.000 (0.004) 0.001 (0.136) 0.000 (-0.002) 0.000 (0.024)
c12 0.000 (0.214) -0.003 (-0.594) 0.000 (0.024) -0.012 (-11.884) 0.000 (0.004) -0.002 (-1.082)
c21 0.000 (1.549) 0.000 (0.742) 0.000 (-0.030) -0.001 (-0.526) 0.000 (0.041) -0.002 (-0.439)
a11 0.188 (3.837) 0.153 (2.673) 0.227 (4.790) 0.227 (3.912) 0.345 (10.807) 0.161 (2.383)
a12 0.122 (2.973) 0.062 (2.025) 0.208 (2.178) 0.023 (0.500) -0.103 (-0.653) -0.006 (-0.156)
a21 -0.163 (-10.283) -0.267 (-5.522) -0.071 (-2.435) -0.503 (-13.040) 0.052 (1.241) 0.547 (9.049)
a22 0.100 (10.932) 0.084 (5.628) 0.145 (2.053) 0.058 (1.376) 0.096 (5.160) -0.044 (-0.552)
b11 0.875 (236.005) 0.865 (118.742) 0.940 (228.506) 0.683 (30.616) 0.879 (36.029) 0.829 (28.324)
b12 -0.004 (-0.201) -0.016 (-0.794) -0.203 (-8.688) -0.066 (-2.641) 0.056 (0.540) 0.067 (1.927)
b21 0.026 (6.103) 0.040 (2.849) 0.035 (8.866) 0.126 (2.472) -0.007 (-1.436) -0.038 (-1.367)
b22 0.991 (363550.490) 0.995 (353008.136) 0.977 (268.086) 1.007 (58072.001) 0.994 (290935.741) 0.991 (14273.660)
Diagnostics
R2 0.166 0.245 0.081 0.172 0.080 0.136
AIC -17.798 -16.756 -16.803 -14.890 -16.828 -14.737
SBC -17.771 -16.729 -16.759 -14.846 -16.803 -14.712
Q (24)ret ~χ2(24) 48.191 77.449 48.461 86.354 61.160 141.936
Q2 (24)ret ~χ2(24) 162.727 155.832 115.297 106.583 254.556 51.030
Q (24)res ~χ2(24) 30.043 74.640 29.285 140.661 26.426 121.493
Q2 (24)res ~χ2(24) 124.085 129.766 61.303 85.447 114.316 87.199
Notes: Quasi-maximum likelihood estimation gives robust t-statistics for the BEKK model based on Bollerslev and Wooldridge (1992) standard errors. T-statistics for the model are given in (). Home (foreign) market effects are given by 11 (22) where home represents trading on Dublin market. Cross market effects to (from) the home country are given by 21 (12). Ljung-Box statistics, Q (24) and Q2 (24), are given for the home returns (ret) and residuals (res) series. For each ADR, spillovers to the ISEQ index are included in the first set of columns followed by the equity trading in Dublin. Reported findings based on data availability are given for Elan for the full period of analysis, AIB between 28 November 1990 and 29 December 2000 and Jefferson Smurfit between 17 January 1995 and 29 December 2000.

25
Endnotes 1 This finding documented extensively has implications for equity pricing and asset allocation procedures (Longin and Solnik, 1995; DeSantis and Gerard, 1998; Ang and Bekaert, 2002). Traditional asset pricing models such as the Capital Asset Pricing Model (CAPM) need to incorpate the impact of international diversification and time-varying correlation features. Furthermore, asset allocation needs to be examined in the context of reduced benefits from international diversification. 2 Daily data is used to capture potential interactions, for example impulse responses, since a month or
even a week may be long enough to obscure interactions that may last only a few days.
3 This is due to data availability and recognises that it does not make the time series fully synchronous.
4 An exception occurs for the DAX30 at 10% significance levels.
5 The S&P500 estimates presented use lead values to overcome non-synchronous trading. Results for
the same trading day are qualitatively similar but not as pronounced and are available on request.
6 The companies represent approximately 40% of the ISEQ’s market capitalization (Irish Stock
Exchange, 2001). The sub-period results support the overall findings and are available on request.