Internal vs External Migration in Post-Soviet Space
28
67/125 INTERNAL VS EXTERNAL MIGRATION IN POST-SOVIET SPACE CARIM-East Research Report ZUZANNA BRUNARSKA JOANNA NESTOROWICZ STEFAN MARKOWSKI February 2014 www.migracje.uw.edu.pl
Transcript of Internal vs External Migration in Post-Soviet Space
1
67/125
INTERNAL VS EXTERNAL MIGRATION IN POST-SOVIET
SPACE CARIM-East Research Report
ZUZANNA BRUNARSKA JOANNA NESTOROWICZ
STEFAN MARKOWSKI
February 2014 www.migracje.uw.edu.pl
2
CARIM-East Creating an Observatory of Migration East of Europe
The CARIM-East project is co-financed by the European Commission. The CARIM-East project at the Centre of Migration Research (CMR) at The University of Warsaw is also supported by the Polish Ministry of Science and Higher Education.
The CARIM-east project is led by the European University Institute (EUI) in Florence, Italy with Centre of Migration Research, University of Warsaw as the partner institution. The views expressed in this publication cannot in any circumstances be regarded as the official position of the European Commission. This text may be downloaded only for personal research purposes. Any additional reproduction for other purposes, whether in hard copies or electronically, requires the consent of the Centre of Migration Research. Requests should be addressed to [email protected]. If cited or quoted, reference should be made as follows: Brunarska Z., Nestorowicz J., Markowski
S. (2014). Internal vs External Migration in the Post-Soviet Space, CARIM-East Research Report. CMR
Working Papers No 67(125). Warsaw: Centre of Migration Research, University of Warsaw.
3
About the CARIM-East project: This project is the first migration observatory focused on the Eastern Neighbourhood of the European Union and covers all countries of the Eastern Partnership initiative (Belarus, Ukraine, the Republic of Moldova, Georgia, Armenia and Azerbaijan) and Russian Federation.
The project’s two main themes are: (1) migration from the region to the European Union (EU) focusing in particular on countries of emigration and transit on the EU’s eastern border; and (2) intra-regional migration in the post-Soviet space.
The project started on 1 April 2011 as a joint initiative of the European University Institute (EUI), Florence, Italy (the lead institution), and the Centre of Migration Research (CMR) at the University of Warsaw, Poland (the partner institution).
CARIM researchers undertake comprehensive and policy-oriented analyses of very diverse aspects of human mobility and related labour market developments east of the EU and discuss their likely impacts on the fast evolving socio-economic fabric of the six Eastern Partners and Russia, as well as that of the European Union.
In particular, CARIM-East:
• builds a broad network of national experts from the region representing all principal disciplines focused on human migration, labour mobility and national development issues (e.g. demography, law, economics, sociology, political science);
• develops a comprehensive database to monitor migration stocks and flows in the region, relevant legislative developments and national policy initiatives;
• undertakes, jointly with researchers from the region, systematic and ad hoc studies of emerging migration issues at regional and national levels;
• provides opportunities for scholars from the region to participate in workshops organized by the EUI and CMR, including academic exchange opportunities for PhD candidates;
• provides forums for national and international experts to interact with policymakers and other stakeholders in the countries concerned.
For more information: CARIM-East CARIM-East Robert Schuman Centre for Advanced Studies (EUI)
Centre of Migration Research,University of Warsaw (CMR)
Convento, Via delle Fontanelle 19 Banacha 2 B, St 50014 San Domenico di Fiesole Warsaw 02-097 Italy Poland Tel: +39 055 46 85 817 Tel/fax: (+48 22) 659 74 11 Fax: + 39 055 46 85 770 Email: [email protected] E-mail: [email protected] www.eui.eu/RSCAS/ www.migracje.uw.edu.pl/ Zuzanna Brunarska – Centre of Migration Research, University of Warsaw, Warsaw, Poland; e-mail: [email protected] Joanna Nestorowicz – Centre of Migration Research, University of Warsaw, Warsaw, Poland; e-mail: [email protected] Stefan Markowski – Centre of Migration Research, University of Warsaw, Warsaw, Poland; Tishner European University, Krakow, Poland; The University of New South Wales, UNSW Canberra, Canberra, Australia; e-mail: [email protected]
4
Abstract
The paper addresses the distinctiveness of migration flows in the post-Soviet space east of the
European Union: the Commonwealth of Independent States (CIS) and Georgia. Population
mobility within this region is hypothesized to differ from extra-regional population movements
due to the common institutional past of these states, all of which were once the USSR republics.
Within the framework of the migration systems theory, the paper offers a quantitative analysis
of the scale and mechanics of cross-border population mobility in the region. By means of
island analysis, it examines the intensity and distinctiveness of intra-regional migration flows
relative to those between the region and third countries. Next, an econometric gravity model has
been applied to identify the main drivers of migration flows in the region. The resultant findings
show that the distinctiveness of the intra-regional migration processes is questionable or at best
rather weak as mobility of people from and to the CIS region is relatively high. Thus, it is
argued that the existence of the ‘post-Soviet migration system’ should not be treated
axiomatically. The region is increasingly integrated into the international division of labour
through trade and capital mobility and the cross-border mobility of people also reflects this
globalization trend.
Key words: migration, CIS, post-Soviet space, Pajek, island analysis, gravity model, migration system
Streszczenie
Artykuł poświęcony jest specyfice przepływów migracyjnych na wschód od Unii Europejskiej –
na obszarze poradzieckim. U podstaw naszych rozważań leży założenie, że w związku ze
wspólną przeszłością instytucjonalną krajów, które niegdyś wchodziły w skład ZSRR,
mobilność ludności na tym obszarze może różnić się od mobilności wykraczającej poza ten
obszar. Odwołując się do teorii systemów migracyjnych artykuł koncentruje się na analizie
ilościowej skali i mechanizmów rządzących mobilnością na terenie Wspólnoty Niepodległych
Państw (WNP) i Gruzji. Przy pomocy analizy wysp (ang. island analysis) badana była relatywna
intensywność i odrębność wewnętrznych przepływów migracyjnych w regionie i przepływów
pomiędzy krajami regionu a resztą świata. Następnie przy pomocy ekonometrycznego modelu
grawitacyjnego zidentyfikowano czynniki determinujące te przepływy. Wyniki pokazują, że
odrębność wewnątrz regionalnych procesów migracyjnych jest wątpliwa lub co najwyżej słaba,
jako że przepływy ludności z i do regionu są stosunkowo duże. W związku z tym sugerujemy,
aby nie traktować istnienia “poradzieckiego systemu migracyjnego” w sposób aksjomatyczny.
Region w coraz większym stopniu wchodzi w międzynarodowy podział pracy poprzez handel
oraz mobilność kapitału i migracje ludności także odzwierciedlają ten trend.
Słowa kluczowe: migracja, WNP, obszar poradziecki, Pajek, analiza wysp, model grawitacyjny, system
migracyjny
5
1. Introduction
Countries constituting the former USSR take up approximately one sixth of the world’s land area and
account for about 4 per cent of its population. The collapse of the USSR in 1991 led to the emergence of a
number of new states: the Baltic States, now in the European Union, and members of the Commonwealth of
Independent States (CIS) plus Georgia1. Thus, population movements which prior to 1991 had been
represented as ‘internal migration’, after 1991 became ‘international (cross-border) migration’. To analyze
migration patterns in the post-Soviet space it is necessary to understand the region’s Soviet past. All these
new migrant sending and receiving countries share the legacy of common Soviet institutions, enduring social
and cultural links with each other, and the widespread use of the Russian language. Their dependence on the
Russian economy has historically been high and continues to be significant. In the light of this Soviet
institutional legacy and economic dependence of many CIS countries on Russia, it is tempting to represent
the CIS region as the ‘post-Soviet migration system’ (see Ivakhnyuk 2003; 2008; 2012). However, it remains
an open question whether over 20 years after the establishment of the new geopolitical order in Eastern
Europe, South Caucasus and Central Asia, intra-regional migration flows substantially differ from the
broader pattern of international mobility from/to the region.
To determine whether or not, and if so to what an extent, migration between CIS countries is a
distinctive phenomenon is an topical question as the post-Soviet space is increasingly integrated with other
regions of intensive migration flows, particularly the European Union (EU) and Asia. Two aspects of this
problem should be considered. First, the distinctiveness of intra-CIS migration flows can be related to their
scale. If the intra-CIS mobility is significantly greater than that between CIS and non-CIS sending/receiving
countries, it might be inferred that the region represents a distinct cluster of migratory movements. Second,
the Soviet legacy could be a factor responsible for the regional specificity of migration mechanics, i.e.,
distinct migration push and pull factors operating within the region. By addressing these two aspects we can
test the hypothesis about the distinctiveness of migration within the CIS region and consider whether it is
meaningful to talk about the post-Soviet migration system. In this paper we therefore wish to address two
research questions:
1. are migration linkages between CIS countries stronger than migration linkages between CIS and
non-CIS countries?; and
2. are migration flows between CIS countries determined by economic and geo-demographic
factors that are distinct from those influencing migration flows between CIS and non-CIS countries?
The article contributes to existing research in three ways. First, it examines, using tools designed for
network analysis, the scale/intensity of migration in the post-Soviet space from a multidimensional,
quantitative perspective. Second, it addresses macroeconomic, cultural and geopolitical features which could
be responsible for the region-specific push and pull factors driving the contemporary cross-border population
mobility. This analysis uses an econometric gravity model of migration flows. Third, it contributes to the
migration systems literature, which has recently attracted some renewed interest (see Bakewell 2013).
1 Although Georgia is not longer a member of the CIS, in this paper whenever CIS is referred to Georgia is included in it.
6
By taking the migration systems perspective, we can identify factors that affect the scale of migration
flows and which, at the same time, may explain the specificity of these migration flows. These factors
include, inter alia, institutional characteristics – such as historical, legal and political legacies – that
differentiate a particular system from other systems and the broader environment in which it is nested. The
systems perspective seems particularly useful when applied to the post-Soviet migratory space where legacy
factors appear to be preeminent. By addressing the two research questions, the paper will contribute to the
wider debate concerning the existence of the ‘post-Soviet migration system’.
The article is structured as follows: the next section presents a brief overview of migration flows in the
post-Soviet space. This is followed by an outline of the systemic approach to migration research, which has
been applied in this study. The subsequent two sections present the data, methodology and results of our
empirical analyses. First, the network analysis is explained, which we have used to study the relative scale of
migration flows to draw inferences regarding the cohesion of intra-CIS flows. Second, we present the gravity
model, in which a dummy variable indicating intra-CIS migration is included as a moderator of economic
and demo-political determinants of migration flows. The final section summarizes the findings, assesses the
effectiveness of the applied theoretical approach, and suggests areas for future research.
2. Migrations in the post-Soviet era: An overview
The opening of USSR’s external borders resulted in a substantial migration outflows from many parts of the
former Soviet empire. Numerous conflicts which erupted in the post-Soviet area also contributed to
increased peoples’ mobility. The immediate post-Soviet period was dominated by political and ethnic
migration. Members of numerous nations repatriated to their homelands. Declining living standards, deep
economic crisis and political uncertainty in the newly emerged states provided additional incentives for
migration.
Until the end of the 1990s, settlement migration (migrants seeking permanent residence in host
countries) was the most common type of migration. Since the beginning of the present, other, more flexible
forms of migration have dominated. Labour migration, often in the form of circular flows of migrant
workers, has become one of the most common survival strategies among citizens of the post-Soviet
republics. For many, migration has become the only way to survive. Also, entire countries have grown
dependent on migrant remittances. In 2011, for example, migrant remittances constituted 47 per cent of GDP
in Tajikistan, 29 per cent in Kyrgyzstan and 23 per cent in Moldova (World Bank 2011). Today, 20 years
after the collapse of the USSR, intra-regional migration flows still prevail, with Russia being the main
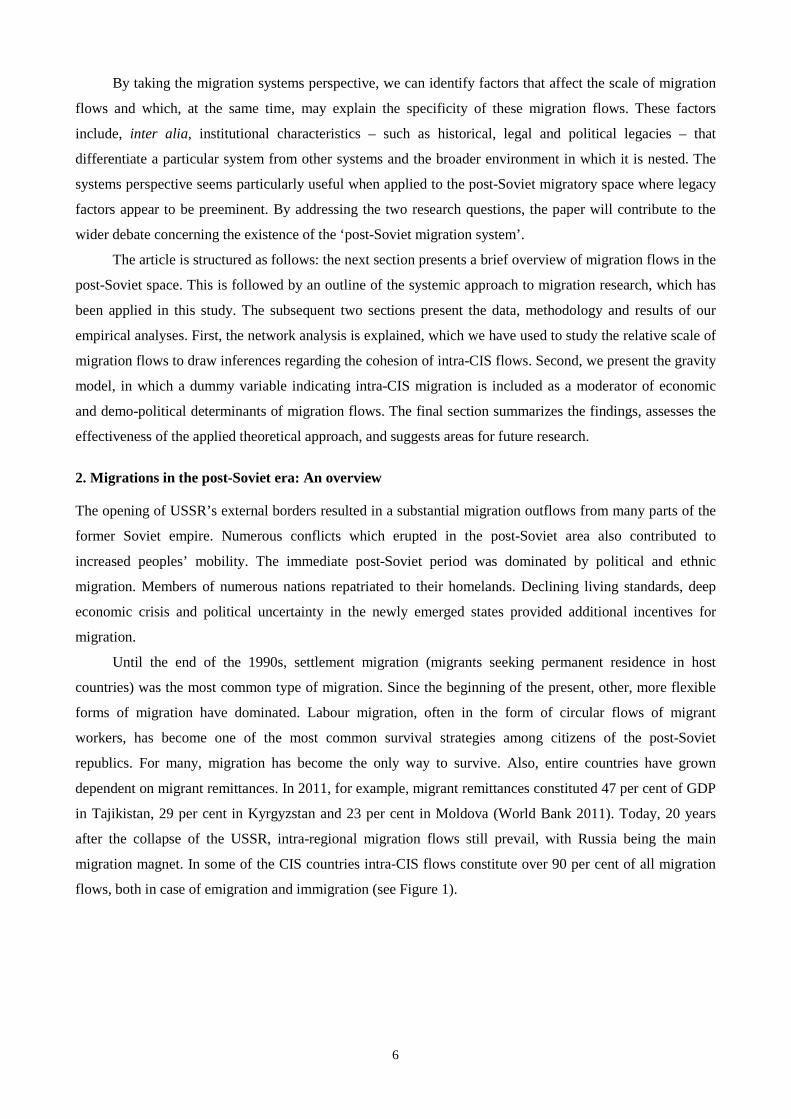
migration magnet. In some of the CIS countries intra-CIS flows constitute over 90 per cent of all migration
flows, both in case of emigration and immigration (see Figure 1).
7
Figure 1: Share of intra-CIS migration in total migration exchange in 2009, per cent
0102030405060708090
100
Azerba
ijan
Armenia
Belarus
Kazakh
stan
Kyrgyzs
tan
MoldovaRussi
a
Tajik
istan
Turkm
enist
an
Ukraine
emigration
immigration
Source: Cisstat.
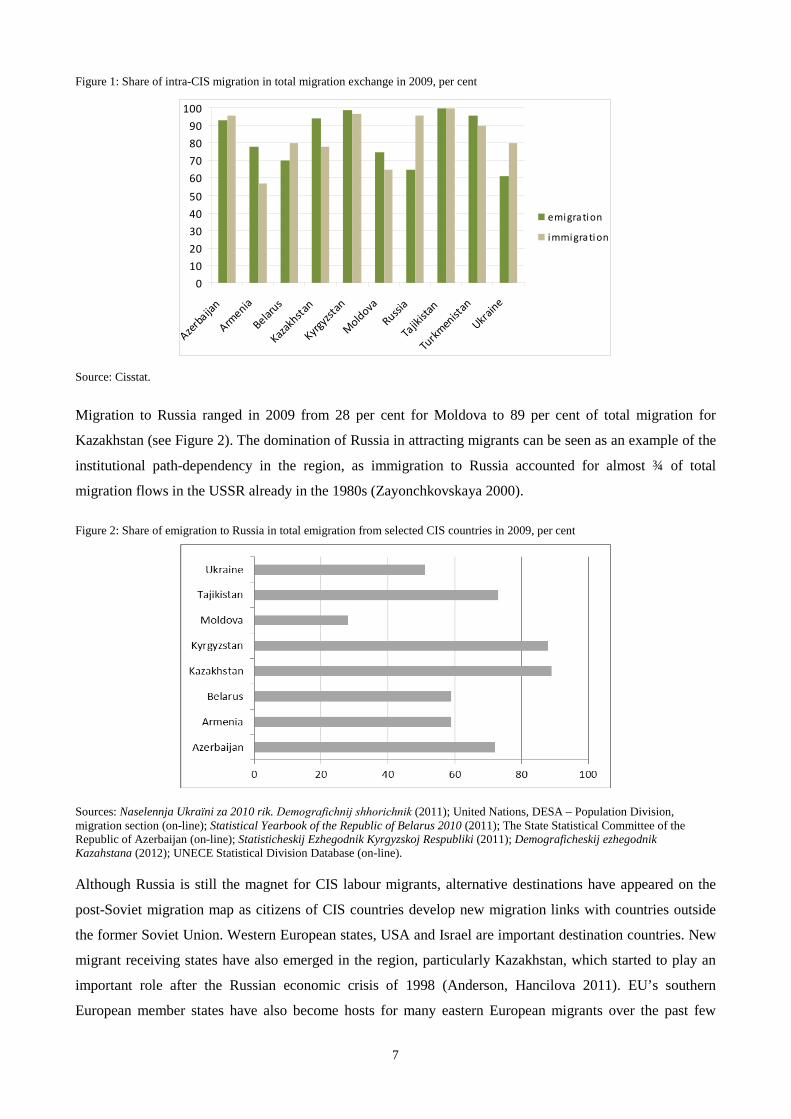
Migration to Russia ranged in 2009 from 28 per cent for Moldova to 89 per cent of total migration for
Kazakhstan (see Figure 2). The domination of Russia in attracting migrants can be seen as an example of the
institutional path-dependency in the region, as immigration to Russia accounted for almost ¾ of total
migration flows in the USSR already in the 1980s (Zayonchkovskaya 2000).
Figure 2: Share of emigration to Russia in total emigration from selected CIS countries in 2009, per cent
Sources: Naselennja Ukraїni za 2010 rіk. Demografіchnij shhorіchnik (2011); United Nations, DESA – Population Division, migration section (on-line); Statistical Yearbook of the Republic of Belarus 2010 (2011); The State Statistical Committee of the Republic of Azerbaijan (on-line); Statisticheskij Ezhegodnik Kyrgyzskoj Respubliki (2011); Demograficheskij ezhegodnik Kazahstana (2012); UNECE Statistical Division Database (on-line).
Although Russia is still the magnet for CIS labour migrants, alternative destinations have appeared on the
post-Soviet migration map as citizens of CIS countries develop new migration links with countries outside
the former Soviet Union. Western European states, USA and Israel are important destination countries. New
migrant receiving states have also emerged in the region, particularly Kazakhstan, which started to play an
important role after the Russian economic crisis of 1998 (Anderson, Hancilova 2011). EU’s southern
European member states have also become hosts for many eastern European migrants over the past few
8
years. Moldovan and Ukrainian labour migration to Italy, Greece, Spain and Portugal gained momentum in
the 2000s. Turkey is another destination, which has started to receive significant numbers of labour migrants
from the CIS region.
There are numerous factors strengthening migration ties between Russia and other post-Soviet states.
These include historical and institutional ties (i.e., the Russian language factor, existing bilateral and
multilateral agreements concerning migration issues, visa free-regimes, simplified access to citizenship,
similar legal solutions formulated on the basis of the Soviet law); demographic and economic factors
(including, but not limited to demographic pressure in some CIS states vs. depopulation in others, significant
wage differences); geographical factors such as spatial proximity between various migration nods and well
developed transportation networks); and others. Many of these are the continuing Soviet legacy. Moreover,
there are contemporary attempts to strengthen regional ties as Russia attempts to exert soft power to integrate
post-Soviet states into its sphere of influence.
3. Systemic approach to migration research in the post-Soviet space
Given the geopolitical developments in the post-Soviet region, the area has often been referred to as a
‘migration system’. Ivakhnyuk (2003; 2008; 2012) describes it as the Eurasian migration system. This
implies that (1) if CIS countries form a migration system, migration linkages between them should be
stronger than linkages developed between CIS and non-CIS countries; and (2) there are structural differences
in the push and pull factors that influence the intra-CIS migration as opposed the migration between CIS and
non-CIS countries. That said, what is a ‘migration system’?
In one of the earliest applications of the systems approach to migration research Mabogunje (1970)
defined a system as a close set of “interacting elements, together with their attributes and relationships”
(Mabogunje 1970: 3). In terms of international mobility such ‘elements’ could be sending and receiving
countries, their ‘attributes’ could be push and pull factors affecting migration (Ravenstein 1885; 1889; Lee
1966), and their ‘relationships’ could be the relative intensity of the push and pull factors and the intensity of
migration per se. It has not been specified what minimal intensity of relationships between elements is
needed to define a system. However, Salt (1989) and de Hass (2007) refer to ‘greater’ intra-system
connectivity and complexity as a factor differentiating a system from its environment. Boutang and
Papademetriou recognize that a system is characterized by ‘a “particular” combination of types of population
flows between countries’ (Boutang, Papademetriou 1994: 20). Kritz, Lim and Zlotnik (1992) claim that a
system is formed by at least two countries that exchange “relatively high” numbers of migrants. Though
existing conceptualizations do not define the necessary and sufficient conditions for a system to emerge, they
all point out to relatively strong migration links between countries within the system as opposed to those
outside it. In this interpretation, for a CIS migration system to exist, migration flows between CIS countries
should be stronger than flows between CIS and non-CIS countries.
The expected structural differences between intra- and extra-systemic mobility have been envisaged
by most migration systems theorists. Mabogunje (1970) specified that every system operates in a specific
environment, which comprises elements influencing and being influenced by the system. In case of
9
migration phenomena such environment consists of factors such as wages, prices, education, health,
technology, governmental policies, etc. The changing environment causes changes in the operation of a
system nested within it. This approach was followed by Fawcett (1989) and Boyd (1989), who also
emphasized the relevance of systemic linkages between countries, which influence migration itself. In this
vein Jones and Findlay (1998) examined the East Asian international migration system and noted that its
development would be not possible without wage differentials within the region.
Boutang and Papademetriou stressed that a system comprises not only flows, but also “the rules
regulating these flows, and their administration” (Boutang, Papademetriou 1994: 20). Finally, Kritz et al.
(1992) claim that in order to be part of one migratory system, countries need to share similar levels of
development, a common cultural background and some degree of coherence in policy making. They also
believe that the presence of strong economic and political ties with a specific destination country, in
particular of dependent nature, provides an additional justification for the existence of a migration system.
Intuitively, the CIS countries or, even more generally, all the post-Soviet states, share the common
institutional background and, thus, they have strong legacy ties. This is precisely what has made us adopt the
migration systems framework for our analysis. It remains unclear, though, how the geopolitical, historical
and social factors shared by countries constituting a potential ‘migration system’ could influence the
relatively large population flows hypothesized to exist between these countries.
4. Island analysis: intensity of migration ties
To identify groups of countries which have relatively more intensive internal than external migration
exchange we apply an analytical technique used in network analysis, namely the concept of islands. An
island is sub-network in which the connections inside the community are significantly stronger than those
outside the community.2
In order to identify the islands in a given network we have to perform a ‘line-cut’ at a selected level.
The idea behind recognizing islands is the following: let us imagine that all the nodes of a network (in our
case – countries) are connected by bridges; the stronger the link between two nodes (which in our case
means bigger migration exchange), the higher the bridge between them. Now let us ‘flood’ the network in a
way that all bridges are under water. As we lower the level of water some bridges become visible. The
countries connected by them form what is called an island. By continuously lowering the level of water more
and more bridges become visible and more and more countries are incorporated into an island. If the water
level is brought down to zero all the bridges become visible and the obtained island comprises the whole
network. What is most interesting in applying island analysis is exploring in which order the bridges become
visible as we lower the level of water in a stepwise manner, i.e., how does the structure of the network
evolve if we decrease the required strength of interlinkages between the nodes of the network.3
2 Pajek – a program for the analysis and visualization of large networks – has been used to perform the analysis. The program is available at http://pajek.imfm.si/doku.php and can be downloaded free of charge. 3 Technically, Pajek allows to set the minimal and maximal number of nodes to be included in one island, rather than the ‘level of water’. Nevertheless, the logic behind the procedure is exactly the same and the metaphor of water levels has been used for clarity.
10
4.1 Data and data aggregation
For the purpose of our empirical analyses we have constructed a data set which consists of 4050 data
records. Each record is an ordered pair of countries in three selected years: 2004, 2007 and 2010. The
countries we consider are the CIS official member countries, Turkmenistan and Ukraine (participating
states), Georgia (member of the CIS from 1994 to 2009), 27 EU Member States, and other major migration
partners for CIS countries4. As we are interested in migration to and from CIS countries, the dataset excludes
country pairs in which neither sending nor receiving country is a CIS country5. For the islands analysis we
have only used one part of our database, namely data for 2010.
In order to measure the strength of contemporary migration ties between two countries various
measures can be used. We decided to take into account not only flows, but supplement it additionally with
stocks, analyzing both of them first separately and in the end together. Migration data were in the first place
collected from statistical offices of particular countries (Eurostat in case of EU states) and only later we have
filled some of the gaps with UN data6. Unfortunately, some data are still unavailable. We have chosen to use
the flows by country of previous/next residence. First argument in favor of that choice was better data
availability. Second – the fact that we were interested in measuring the flows between two spaces. The use of
data on flows by citizenship or country of birth would to a lesser extent allow us to treat the countries as
nodes of a migration network as we would only know, for example, that a person of Ukrainian citizenship
migrated but we would not know from which (or to which) country that person has actually moved.
Similarly, information regarding migrant's country of birth does not give us the information from which
country that person has come in reality and therefore it does not provide us with information whether the
flow between two countries has indeed taken place. In the first place we have taken the flows registered by
the receiving country (migration inflows by country of previous residence) based on the assumption that
these are really people who have migrated from country A to B. In the absence of such data, we have taken
the data registered by a sending country (migration outflows by country of next residence), which is a poorer
measure as it registers only declarations as to the intended and not necessarily actual destination. Data
regarding the stocks for 2010 were taken from the World Bank dataset7. Those data are mainly based on
information on foreign-born migrants supplemented by foreign nationality data when the former are not
available (Ratha, Shaw 2007).
Going out of the assumption that migration flows and stocks can be perceived as relatively small/big
depending on the size of population of both sending and receiving states, we have created four separate
indicators – the size of flows divided by the size of population of the country of origin and divided by the
size of population of the destination country and analogical indicators for stocks. The source of population 4 These were selected if migration to or from such a country to either of the CIS countries (including Ukraine, Turkmenistan and Georgia) in any of the selected years was larger than 100 people. These countries include: Australia, Israel, USA, Canada, Norway, Turkey, Afghanistan, China, India, Mongolia, Serbia, South Korea, Syria, Vietnam. 5 An exception are three Baltic states (Lithuania, Latvia and Estonia) for which we have also taken into account their migration exchange with non-CIS states with the objective to perform sensitivity analysis by including these three countries in the CIS (or, alternatively, to check distinctiveness of migration processes for all post-Soviet states not only CIS). 6 For more detailed information concerning the data see Appendix 1. 7 Bilateral migration matrix 2010, http://econ.worldbank.org/WBSITE/EXTERNAL/EXTDEC/EXTDECPROSPECTS/0,,contentMDK:22803131~pagePK:64165401~piPK:64165026~theSitePK:476883,00.html, accessed on 15.06.2013.
11
data was the UN Population Division’s data (World Population Prospects: the 2010 Revision, 2011). This
way we have obtained four dimensions (see Table A): two for flows and two for stocks, which needed to be
reduced to one in order to get a network in a one-dimensional space and perform the analysis.
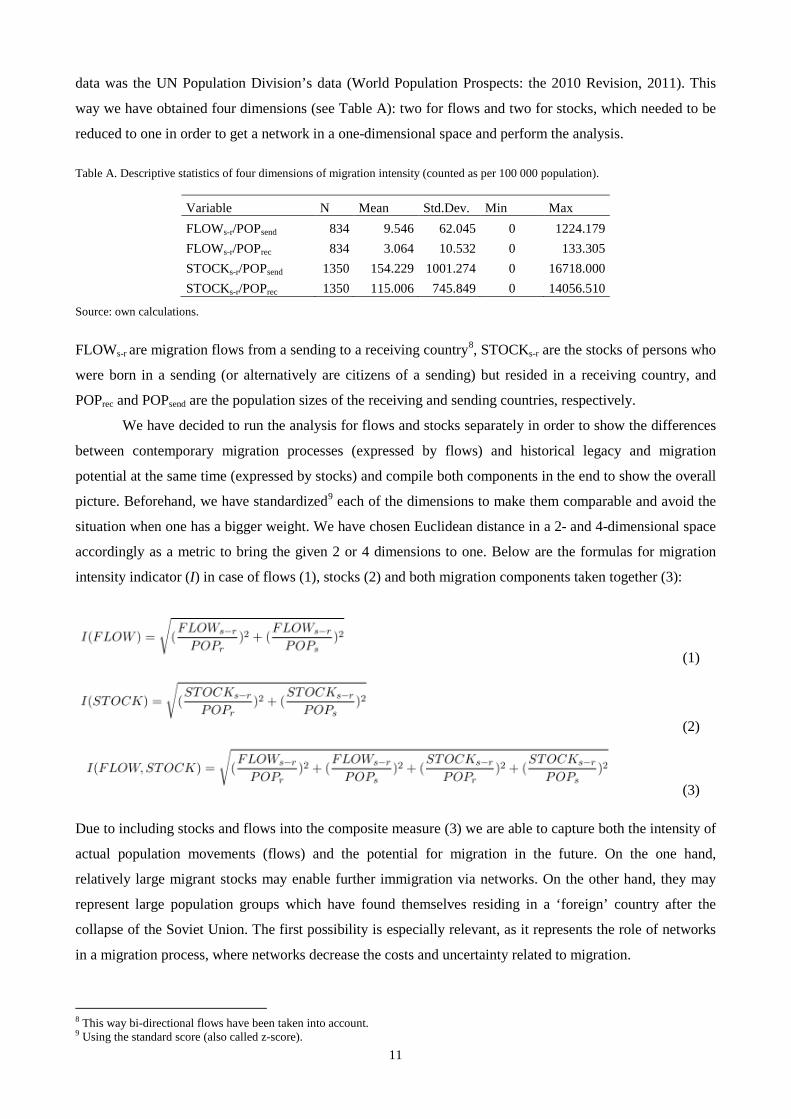
Table A. Descriptive statistics of four dimensions of migration intensity (counted as per 100 000 population).
Variable N Mean Std.Dev. Min Max FLOWs-r/POPsend 834 9.546 62.045 0 1224.179 FLOWs-r/POPrec 834 3.064 10.532 0 133.305 STOCKs-r/POPsend 1350 154.229 1001.274 0 16718.000 STOCKs-r/POPrec 1350 115.006 745.849 0 14056.510
Source: own calculations.
FLOWs-r are migration flows from a sending to a receiving country8, STOCKs-r are the stocks of persons who
were born in a sending (or alternatively are citizens of a sending) but resided in a receiving country, and
POPrec and POPsend are the population sizes of the receiving and sending countries, respectively.
We have decided to run the analysis for flows and stocks separately in order to show the differences
between contemporary migration processes (expressed by flows) and historical legacy and migration
potential at the same time (expressed by stocks) and compile both components in the end to show the overall
picture. Beforehand, we have standardized9 each of the dimensions to make them comparable and avoid the
situation when one has a bigger weight. We have chosen Euclidean distance in a 2- and 4-dimensional space
accordingly as a metric to bring the given 2 or 4 dimensions to one. Below are the formulas for migration
intensity indicator (I) in case of flows (1), stocks (2) and both migration components taken together (3):
(1)
(2)
(3)
Due to including stocks and flows into the composite measure (3) we are able to capture both the intensity of
actual population movements (flows) and the potential for migration in the future. On the one hand,
relatively large migrant stocks may enable further immigration via networks. On the other hand, they may
represent large population groups which have found themselves residing in a ‘foreign’ country after the
collapse of the Soviet Union. The first possibility is especially relevant, as it represents the role of networks
in a migration process, where networks decrease the costs and uncertainty related to migration.
8 This way bi-directional flows have been taken into account. 9 Using the standard score (also called z-score).
12
Having obtained one-dimensional links between countries from the above equations, we have
conducted island's analysis in Pajek aimed at identifying groups of states possessing stronger migration ties
with one another than with the rest of countries considered.
4.2 Results
The starting point for our island analysis was a situation when we had no links between the nodes (countries)
of our network. By gradually ‘lowering the water level’10 bridges emerge linking certain nodes with one
another (forming islands). In subsequent steps further bridges emerge and more and more countries join the
existing islands increasing their size. By observing this process, we obtain valuable information about the
network structure. The thickness and darkness of lines in the graphs presented below are proportional to the
strength of the connection. As we include bi-directional migration data it is always the stronger link that is
visible.11 This is not problematic, though, as we are not interested in directionality, but only in the strength of
the connection.
Examining the distinctiveness of the group of CIS/post-Soviet states in terms of migration exchange
first we look at a situation in which the water level is low enough to allow at most 12 countries (the number
of CIS countries, including Georgia) to constitute one island. Next we consider a situation in which the
maximal number of nodes in an island is 15 (the number of post-Soviet states, CIS countries, Georgia and
three Baltic states – Latvia, Lithuania and Estonia). If all post-Soviet states are not actually visible at that
stage, we then continue to ‘lower the water level’ until this is achieved (what we will call the ‘last stage’).
We start our analysis with migration stocks data which tell us how many people born in the sending
country – or alternatively of sending country’s citizenship if the data on foreign-born are missing (see Ratha,
Shaw 2007) – reside in the receiving country. Wanting to check if CIS countries form a distinctive group we
set the maximal number of nodes in one island to 12 (see Figure 3). Provided that CIS states form a
distinctive group (‘system’), in which interconnections are stronger then with out-of-group countries, we
should obtain an island gathering all of them together with no other nodes belonging to it.
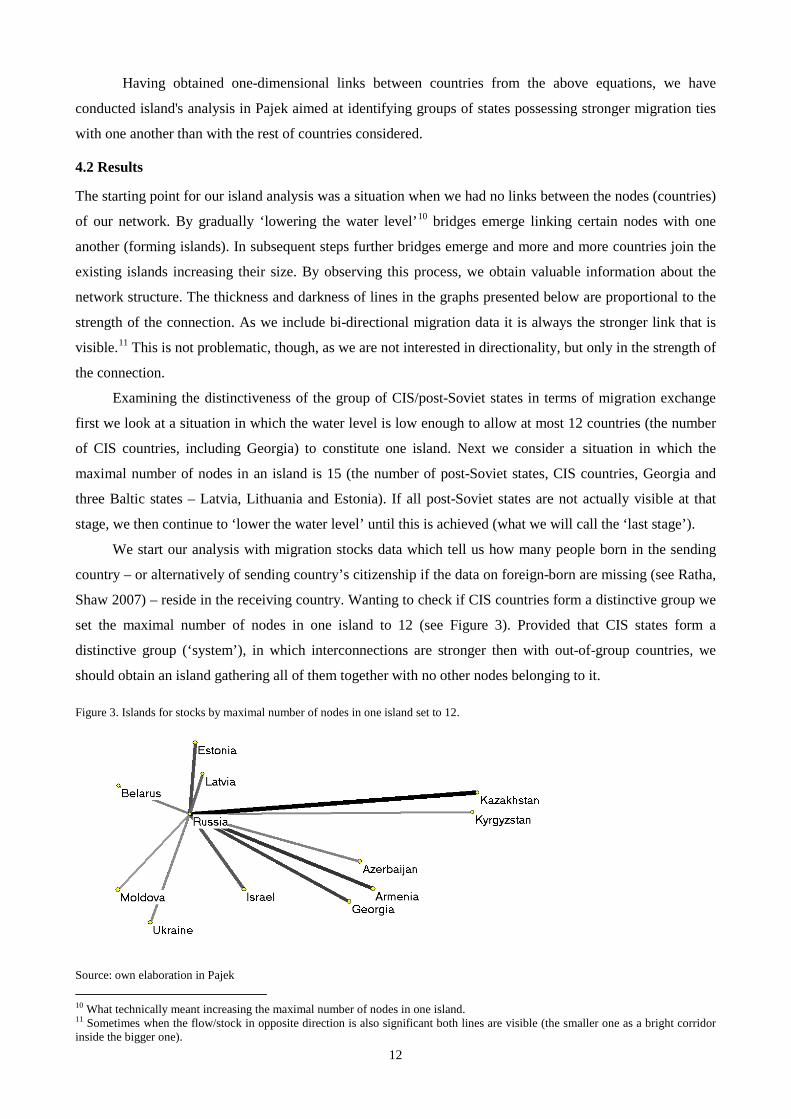
Figure 3. Islands for stocks by maximal number of nodes in one island set to 12.
Source: own elaboration in Pajek 10 What technically meant increasing the maximal number of nodes in one island. 11 Sometimes when the flow/stock in opposite direction is also significant both lines are visible (the smaller one as a bright corridor inside the bigger one).
13
At this stage we obtained one single island centered on Russia. However, it does not comprise 12 CIS states.
Instead, there are two Baltic States visible (Estonia and Latvia) while three Central Asian countries are
missing (Tajikistan, Turkmenistan and Uzbekistan). What is, however, more important is the fact that Israel
is also a part of the island. Israel is a highly specific case as its migration exchange with the post-Soviet area
concerned the arrivals of people of Jewish origin which gained mass character in the second half of 80s and
at the beginning of 90s. Summing up, as far as CIS countries are concerned, we cannot distinguish a clearly
detached system based on migration stock data. Therefore, we run an analysis for the maximal number of
nodes in one island set to 15 in order to check for the distinctiveness of the ‘system’ for all post-Soviet states
(see Figure 4).
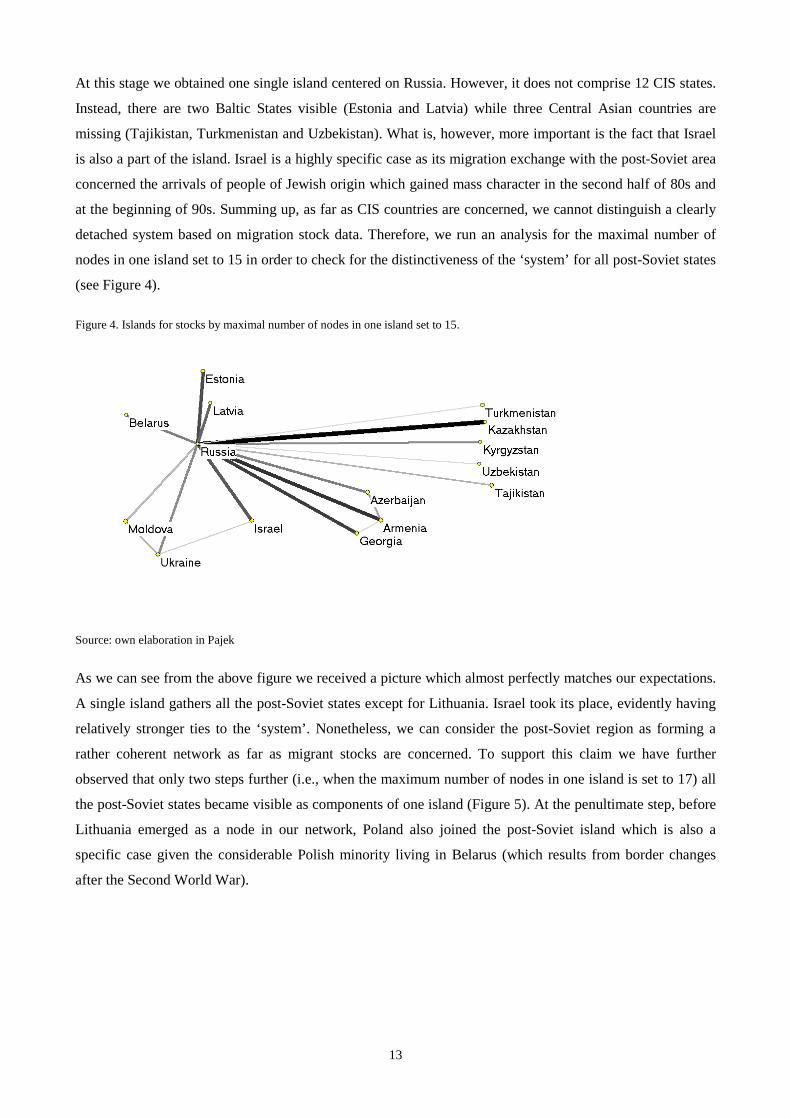
Figure 4. Islands for stocks by maximal number of nodes in one island set to 15.
Source: own elaboration in Pajek
As we can see from the above figure we received a picture which almost perfectly matches our expectations.
A single island gathers all the post-Soviet states except for Lithuania. Israel took its place, evidently having
relatively stronger ties to the ‘system’. Nonetheless, we can consider the post-Soviet region as forming a
rather coherent network as far as migrant stocks are concerned. To support this claim we have further
observed that only two steps further (i.e., when the maximum number of nodes in one island is set to 17) all
the post-Soviet states became visible as components of one island (Figure 5). At the penultimate step, before
Lithuania emerged as a node in our network, Poland also joined the post-Soviet island which is also a
specific case given the considerable Polish minority living in Belarus (which results from border changes
after the Second World War).
14
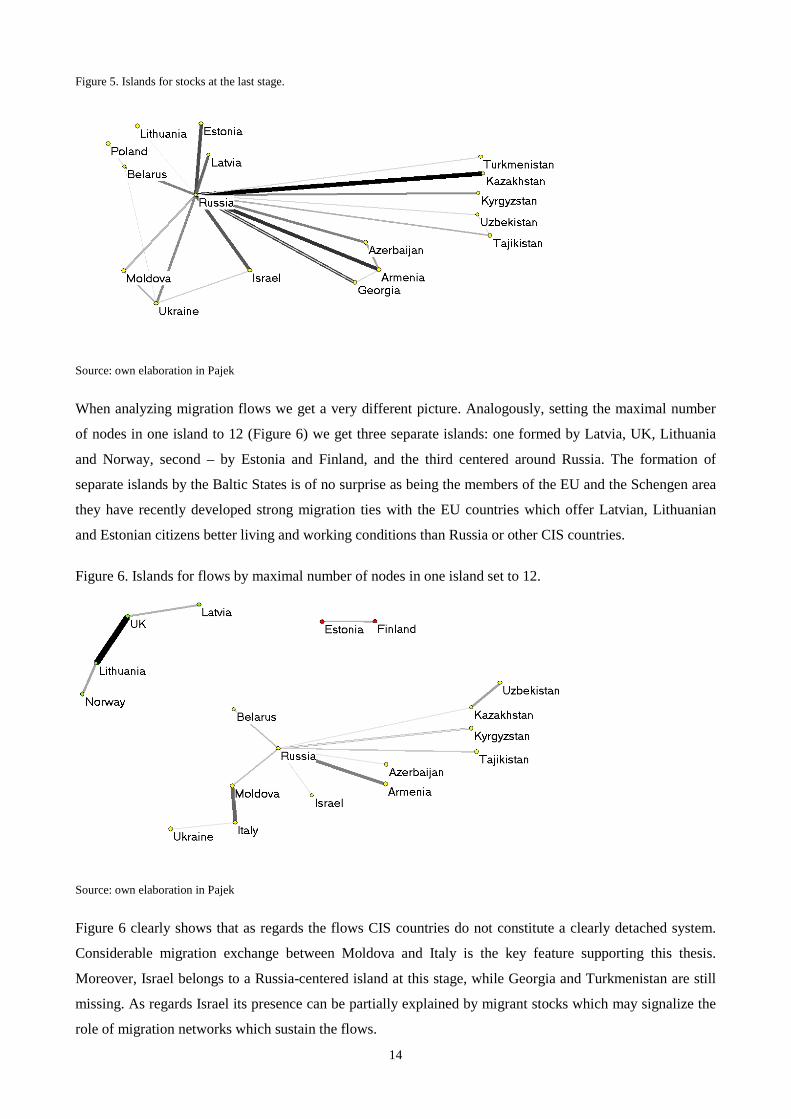
Figure 5. Islands for stocks at the last stage.
Source: own elaboration in Pajek
When analyzing migration flows we get a very different picture. Analogously, setting the maximal number
of nodes in one island to 12 (Figure 6) we get three separate islands: one formed by Latvia, UK, Lithuania
and Norway, second – by Estonia and Finland, and the third centered around Russia. The formation of
separate islands by the Baltic States is of no surprise as being the members of the EU and the Schengen area
they have recently developed strong migration ties with the EU countries which offer Latvian, Lithuanian
and Estonian citizens better living and working conditions than Russia or other CIS countries.
Figure 6. Islands for flows by maximal number of nodes in one island set to 12.
Source: own elaboration in Pajek
Figure 6 clearly shows that as regards the flows CIS countries do not constitute a clearly detached system.
Considerable migration exchange between Moldova and Italy is the key feature supporting this thesis.
Moreover, Israel belongs to a Russia-centered island at this stage, while Georgia and Turkmenistan are still
missing. As regards Israel its presence can be partially explained by migrant stocks which may signalize the
role of migration networks which sustain the flows.
15
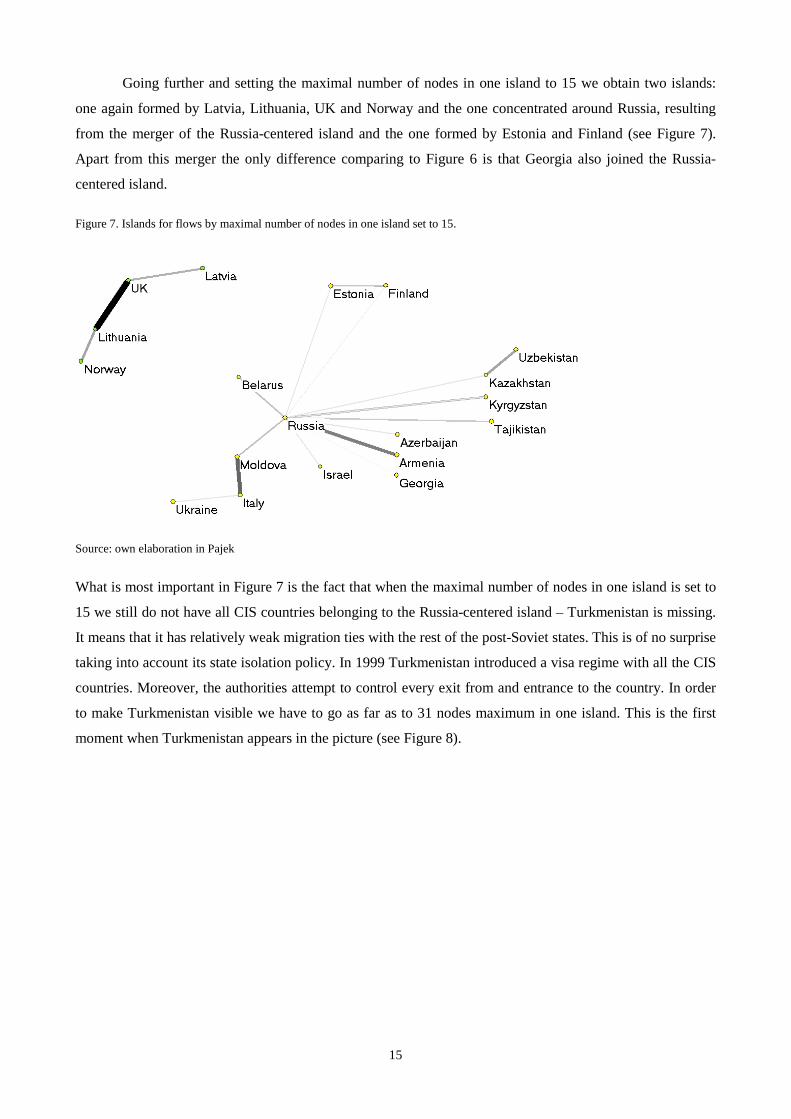
Going further and setting the maximal number of nodes in one island to 15 we obtain two islands:
one again formed by Latvia, Lithuania, UK and Norway and the one concentrated around Russia, resulting
from the merger of the Russia-centered island and the one formed by Estonia and Finland (see Figure 7).
Apart from this merger the only difference comparing to Figure 6 is that Georgia also joined the Russia-
centered island.
Figure 7. Islands for flows by maximal number of nodes in one island set to 15.
Source: own elaboration in Pajek
What is most important in Figure 7 is the fact that when the maximal number of nodes in one island is set to
15 we still do not have all CIS countries belonging to the Russia-centered island – Turkmenistan is missing.
It means that it has relatively weak migration ties with the rest of the post-Soviet states. This is of no surprise
taking into account its state isolation policy. In 1999 Turkmenistan introduced a visa regime with all the CIS
countries. Moreover, the authorities attempt to control every exit from and entrance to the country. In order
to make Turkmenistan visible we have to go as far as to 31 nodes maximum in one island. This is the first
moment when Turkmenistan appears in the picture (see Figure 8).
16
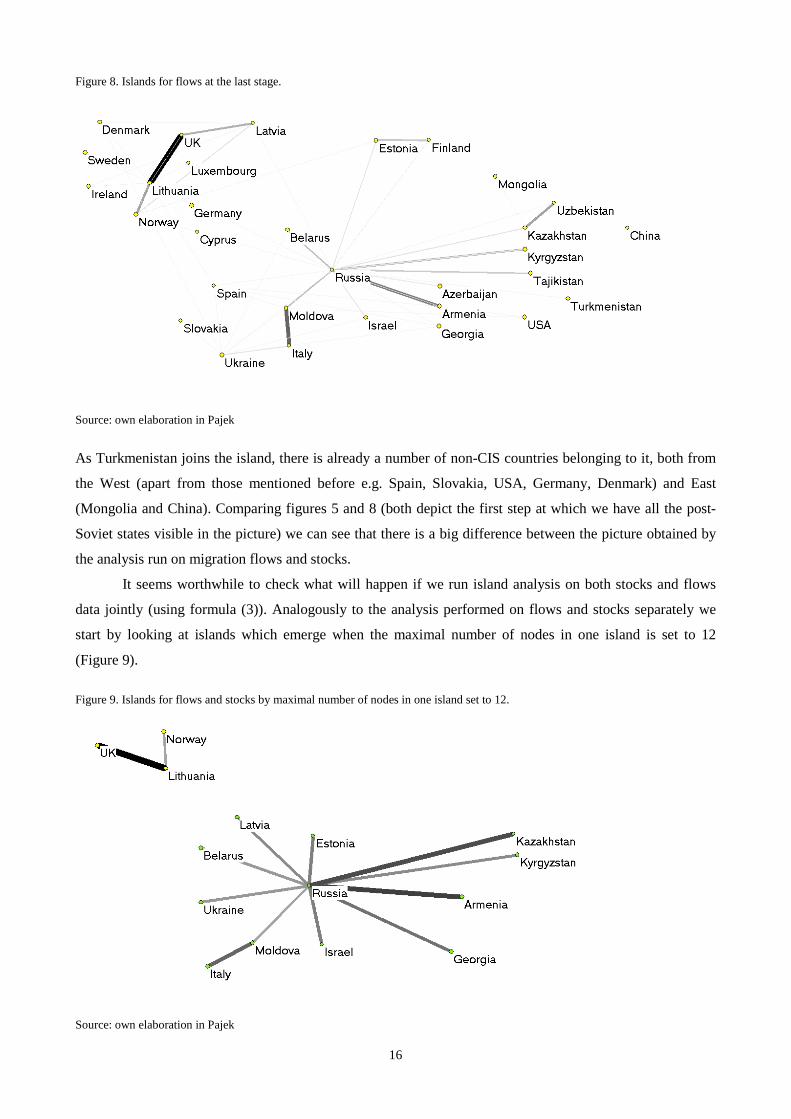
Figure 8. Islands for flows at the last stage.
Source: own elaboration in Pajek
As Turkmenistan joins the island, there is already a number of non-CIS countries belonging to it, both from
the West (apart from those mentioned before e.g. Spain, Slovakia, USA, Germany, Denmark) and East
(Mongolia and China). Comparing figures 5 and 8 (both depict the first step at which we have all the post-
Soviet states visible in the picture) we can see that there is a big difference between the picture obtained by
the analysis run on migration flows and stocks.
It seems worthwhile to check what will happen if we run island analysis on both stocks and flows
data jointly (using formula (3)). Analogously to the analysis performed on flows and stocks separately we
start by looking at islands which emerge when the maximal number of nodes in one island is set to 12
(Figure 9).
Figure 9. Islands for flows and stocks by maximal number of nodes in one island set to 12.
Source: own elaboration in Pajek
17
As it could be expected the obtained picture combines the features of pictures received by flows and by
stocks. On the one hand, Latvia and Estonia seem to have stronger migration ties with Russia than with EU
states. Migration stocks are mainly responsible for that fact. On the other hand, Italy appears in our Russia-
centered island due to considerable migration flows connecting it to Moldova. Clearly, Israel also belongs to
Russia-centered island taking into account that it was visible both as regards flows and stocks. Nonetheless,
there are still a few CIS countries missing (Azerbaijan, Tajikistan, Turkmenistan and Uzbekistan). Israel is a
specific case due to ethnic character of the migration exchange with post-Soviet states, but the presence of
Italy certainly is a sign pointing to the lack of distinctiveness of a CIS ‘migration system’.
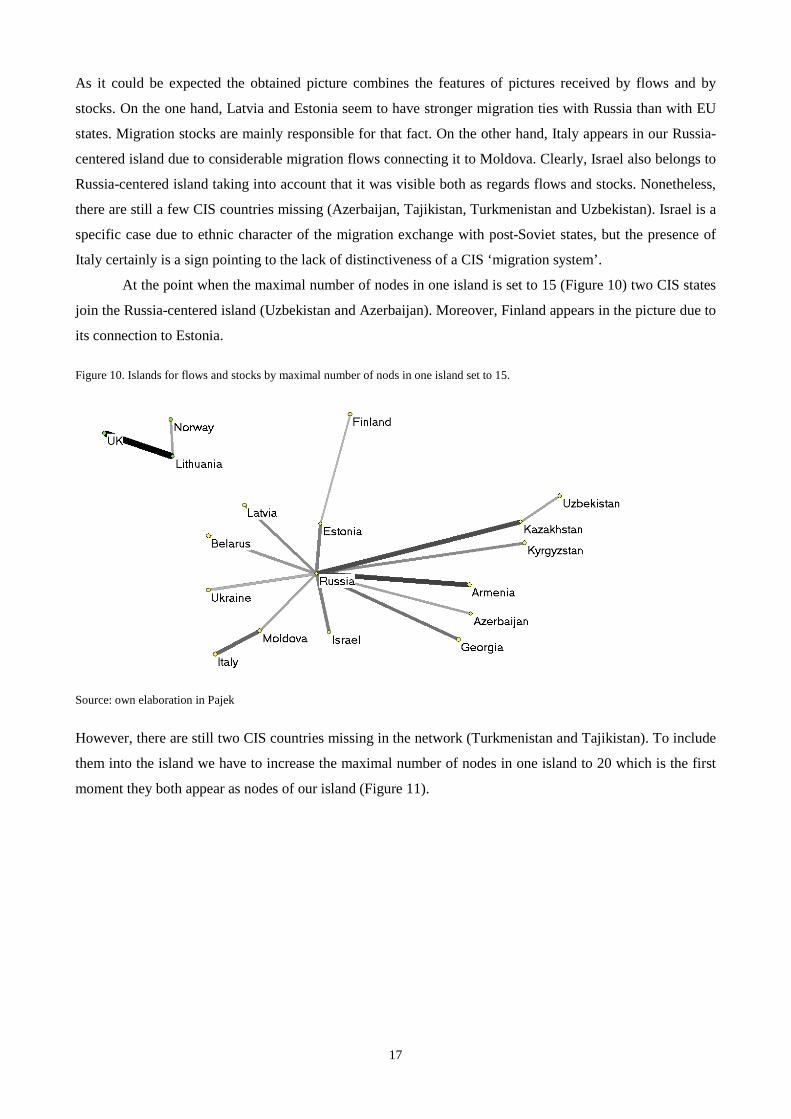
At the point when the maximal number of nodes in one island is set to 15 (Figure 10) two CIS states
join the Russia-centered island (Uzbekistan and Azerbaijan). Moreover, Finland appears in the picture due to
its connection to Estonia.
Figure 10. Islands for flows and stocks by maximal number of nods in one island set to 15.
Source: own elaboration in Pajek
However, there are still two CIS countries missing in the network (Turkmenistan and Tajikistan). To include
them into the island we have to increase the maximal number of nodes in one island to 20 which is the first
moment they both appear as nodes of our island (Figure 11).
18
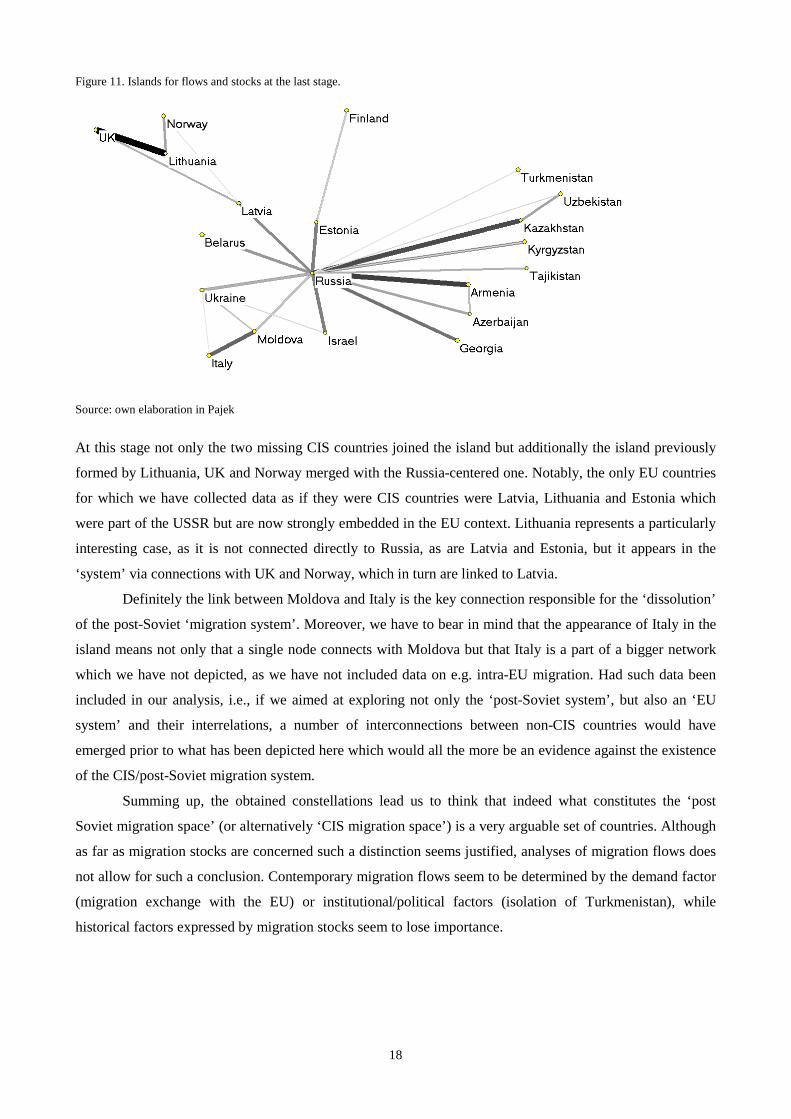
Figure 11. Islands for flows and stocks at the last stage.
Source: own elaboration in Pajek
At this stage not only the two missing CIS countries joined the island but additionally the island previously
formed by Lithuania, UK and Norway merged with the Russia-centered one. Notably, the only EU countries
for which we have collected data as if they were CIS countries were Latvia, Lithuania and Estonia which
were part of the USSR but are now strongly embedded in the EU context. Lithuania represents a particularly
interesting case, as it is not connected directly to Russia, as are Latvia and Estonia, but it appears in the
‘system’ via connections with UK and Norway, which in turn are linked to Latvia.
Definitely the link between Moldova and Italy is the key connection responsible for the ‘dissolution’
of the post-Soviet ‘migration system’. Moreover, we have to bear in mind that the appearance of Italy in the
island means not only that a single node connects with Moldova but that Italy is a part of a bigger network
which we have not depicted, as we have not included data on e.g. intra-EU migration. Had such data been
included in our analysis, i.e., if we aimed at exploring not only the ‘post-Soviet system’, but also an ‘EU
system’ and their interrelations, a number of interconnections between non-CIS countries would have
emerged prior to what has been depicted here which would all the more be an evidence against the existence
of the CIS/post-Soviet migration system.
Summing up, the obtained constellations lead us to think that indeed what constitutes the ‘post
Soviet migration space’ (or alternatively ‘CIS migration space’) is a very arguable set of countries. Although
as far as migration stocks are concerned such a distinction seems justified, analyses of migration flows does
not allow for such a conclusion. Contemporary migration flows seem to be determined by the demand factor
(migration exchange with the EU) or institutional/political factors (isolation of Turkmenistan), while
historical factors expressed by migration stocks seem to lose importance.
19
5. Gravity model: Distinctiveness of intra-regional migration flows
This section aimed at finding an answer to the question whether population flows between CIS countries are
governed by economic and geo-demographic determinants of migration in a distinct manner from migration
flows between CIS and non-CIS countries. It has been anticipated that due to the common Soviet past the
CIS countries share not only are the flows among them relatively large in magnitude, but also that they are
governed by statistically different relationships with macro-level determinants of mobility.
5.1 Data
On top of migration flow and population data described for the purpose of the network analysis, in this
section we have employed a number of variables commonly treated as the determinants of migration in
gravity-type models (Zipf 1962; Andrienko, Guriev 2003; Lewer, van den Berg 2008; Mayda 2010;
Uzagalieva et al. 2012). The data comprises: economic indicators – GDP pc PPP and the unemployment rate;
a geographic indicator – the average distance between countries; and cultural and institutional indicators
such as common language and common historical institutional setting. The summary statistics of variables
used are presented in Table B.
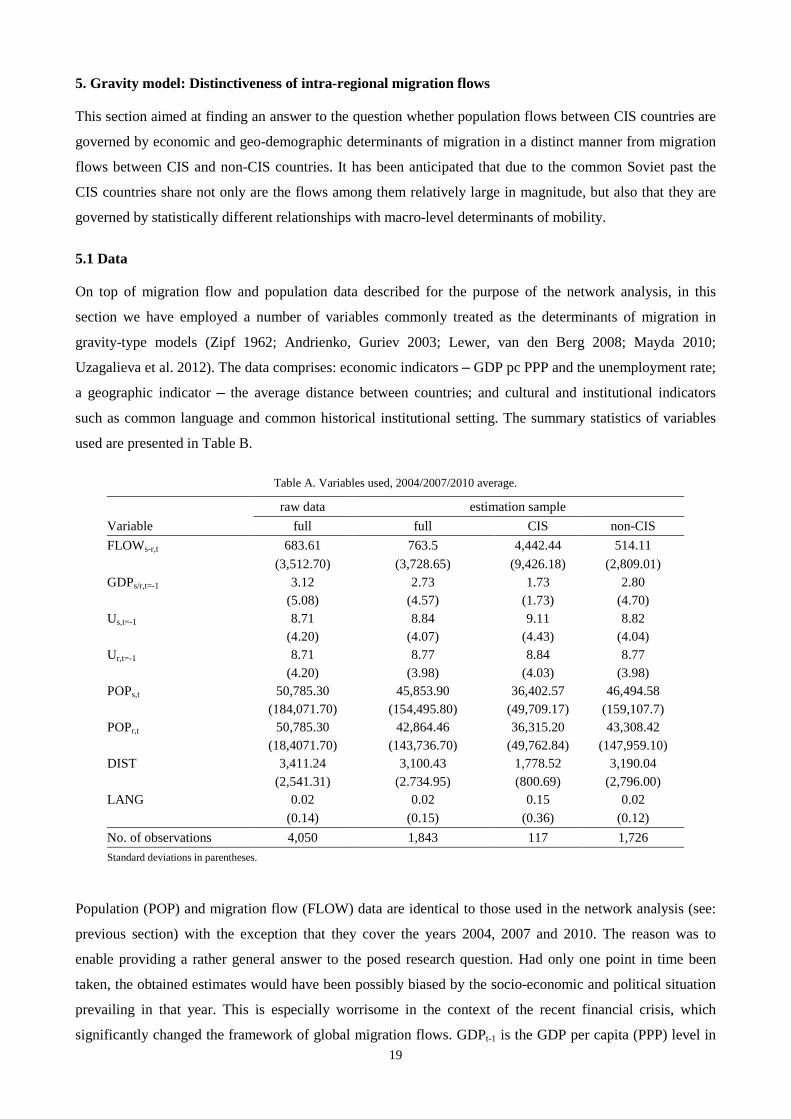
Table A. Variables used, 2004/2007/2010 average.
raw data estimation sample Variable full full CIS non-CIS FLOWs-r,t 683.61 763.5 4,442.44 514.11 (3,512.70) (3,728.65) (9,426.18) (2,809.01) GDPs/r,t=-1 3.12 2.73 1.73 2.80 (5.08) (4.57) (1.73) (4.70) Us,t=-1 8.71 8.84 9.11 8.82 (4.20) (4.07) (4.43) (4.04) Ur,t=-1 8.71 8.77 8.84 8.77 (4.20) (3.98) (4.03) (3.98) POPs,t 50,785.30 45,853.90 36,402.57 46,494.58 (184,071.70) (154,495.80) (49,709.17) (159,107.7) POPr,t 50,785.30 42,864.46 36,315.20 43,308.42 (18,4071.70) (143,736.70) (49,762.84) (147,959.10) DIST 3,411.24 3,100.43 1,778.52 3,190.04 (2,541.31) (2.734.95) (800.69) (2,796.00) LANG 0.02 0.02 0.15 0.02 (0.14) (0.15) (0.36) (0.12) No. of observations 4,050 1,843 117 1,726 Standard deviations in parentheses.
Population (POP) and migration flow (FLOW) data are identical to those used in the network analysis (see:
previous section) with the exception that they cover the years 2004, 2007 and 2010. The reason was to
enable providing a rather general answer to the posed research question. Had only one point in time been
taken, the obtained estimates would have been possibly biased by the socio-economic and political situation
prevailing in that year. This is especially worrisome in the context of the recent financial crisis, which
significantly changed the framework of global migration flows. GDPt-1 is the GDP per capita (PPP) level in
20
US dollars12 in the preceding year (2003, 2006 and 2009 accordingly). Ut-1 is the unemployment rate in the
preceding year13. The distance measure (DIST14) indicates distance between capital cities of respective
countries, weighed by the population shares living in these capital cities15. The common language variable
(LANG16) is a dummy taking the value of 1 if a given pair of sending and receiving countries shares a
common language spoken by at least 9 per cent of the respective populations. The distinction between CIS
and non-CIS country pairs in straightforward, i.e., CIS pairs include two CIS countries (where Georgia is
also considered a CIS country while Latvia, Lithuania and Estonia are not) while non-CIS pairs include one
CIS and one non-CIS country.
Notably the estimation sample differs from the raw data in two ways. The first difference are the
unequal population sizes and unemployment rates in case of sending and receiving countries. Recall that, as
we consider bilateral migration flows, each pair of countries is recorded twice – once the flow is considered
in one direction and the second time in the other direction. Thus we have the same set of receiving and
sending countries leading to identical average unemployment rates and population sizes in the raw sample. In
the full estimation sample, however, these variables are not due to the fact that in case of some country pairs
migration flows were reported only in one direction. This lead to including such a pair of countries only once
and, in effect, to unequal average unemployment rates and population sizes across the sending and receiving
countries. The second difference between the full estimation sample and the raw sample also in the number
of observations, which is smaller by a half in the former. This issue, which arose from missing data in case
of many countries, seems not to change the value of the considered explanatory variables to a very large
extent though. This suggests that our results are not highly influenced by sample selection.
5.2 Empirical approach
Given the time dimension of the data and the macro-level of analysis, the technique applied to test for this
contingency is a panel regression with random effects, resembling a gravity model:
ln(FLOWs-r)t = β1 ln(GDPs/GDPr)t-1 + β2 lnUs,t-1 + β3 lnUr,t-1 (economic indicators)
+ β4 ln(POPs,t x POPr,t) + β5lnDISTs-r (demo-geographic indicators)17 (4)
+ β6 LANGs-r + β7 CISs-r (institutional indicators)
+ β0 + εs-r,t + us-r,t
where t indicates the year 2004, 2007 or 2010, and s and r denote the sending or receiving country,
respectively. All continuous variables have been transformed into natural logarithms18. The sending and
12 The World Bank Indicators: http://data.worldbank.org/indicator/NY.GDP.PCAP.PP.KD 13 The World Bank Indicators: http://data.worldbank.org/indicator/SL.UEM.TOTL.ZS 14 The GeoDist dataset by Mayer and Zignago (2011). 15 Other distance measures available in the GeoDist dataset have also been considered. All yield similar results. 16 The GeoDist dataset by Mayer and Zignago (2011). 17 The specification β4 ln(POPst x POPrt) has been taken from Zipf (1962). It is equivalent to β4 ln(POPst) + β5 ln(POPrt) under the condition that β4= β5. The actual model has been run in the form β4 ln(POPst) + β5 ln(POPrt) and the condition that β4= β5 has been tested for and found true. 18 Three alternative specifications have been run – one excluding flows of value 0 (logarithm impossible to compute, N=1,645), one replacing these 0 with the value of 0.001 to enable computation of logarithm (N=1,843). The estimators obtained from these models
21
receiving countries’ unemployment rates and populations have been included in the model independently, as
it seems that they must not necessarily affect migration flows in relative terms (Aldashev, Dietz 2011). The
GDP and U variables are lagged one year to conceptually enable migration to be a response to the economic
situation at the sending and receiving countries.
We are most interested in the estimator of the CIS variable, β8. Given the results of the island
analysis (see: previous section) we have defined the CIS dummy in two ways:
- in the first specification (used in model (4) presented in Table B) we have allowed it to take two
values: 0 for CIS to/from non-CIS migration flows, 1 for flows between CIS countries.
- in the second specification (used in model (5) presented in Table B) we have allowed it to take
three possible values: the reference category (value 0) are CIS to/from non-CIS migration flows just as in the
first specification, but what has received the value of 1 in the first specification (CIS-CIS flows) has now
been divided into two components: flows between CIS countries, but excluding Russia (value of 1), and
flows between Russia and CIS countries (value of 2).
First, we expect the CIS dummy estimators to be significant and positive for when the category of
interest includes intra-CIS flows (with CIS to/from non-CIS flows as the reference category). This
expectation is based on the common institutional past of the CIS countries. Second, we expect that flows
between Russia and other CIS countries are significantly larger in scale than flows between CIS countries
when neither of them is Russia. This expectation is based on the findings of the island analysis and the
observation that Russia still remains a dominant actor in the region.
By interacting the CIS dummy variable with the other explanatory variables we also wanted to
explore whether the fact that a sending and receiving country share a common Soviet past is a significant
moderator of the relationship between the explanatory variables and migration flows. In light of existing
conceptual approaches taking the existence of a post-Soviet system as granted, the considered interaction
effects should turn out to be significant. This would imply that, indeed, a common post-Soviet past
significantly affects migration processes among CIS countries and makes them distinct from mobility
between CIS and non-CIS countries.
5.3 Results
The results of estimating the above model are presented in Table B. Column (1) presents the estimates
obtained from the base case model, which includes only the economic indicators. Column (2) adds demo-
geographic indicators. Columns (3), (4) and (5) add the institutional indicators of interest – common
language and the CIS dummy in the dichotomous version (4) and in the trichotomous version (5).
were stable in terms of sign and significance but differed slightly in terms of magnitude. The model enabling the inclusion of more observations has been eventually used.
22
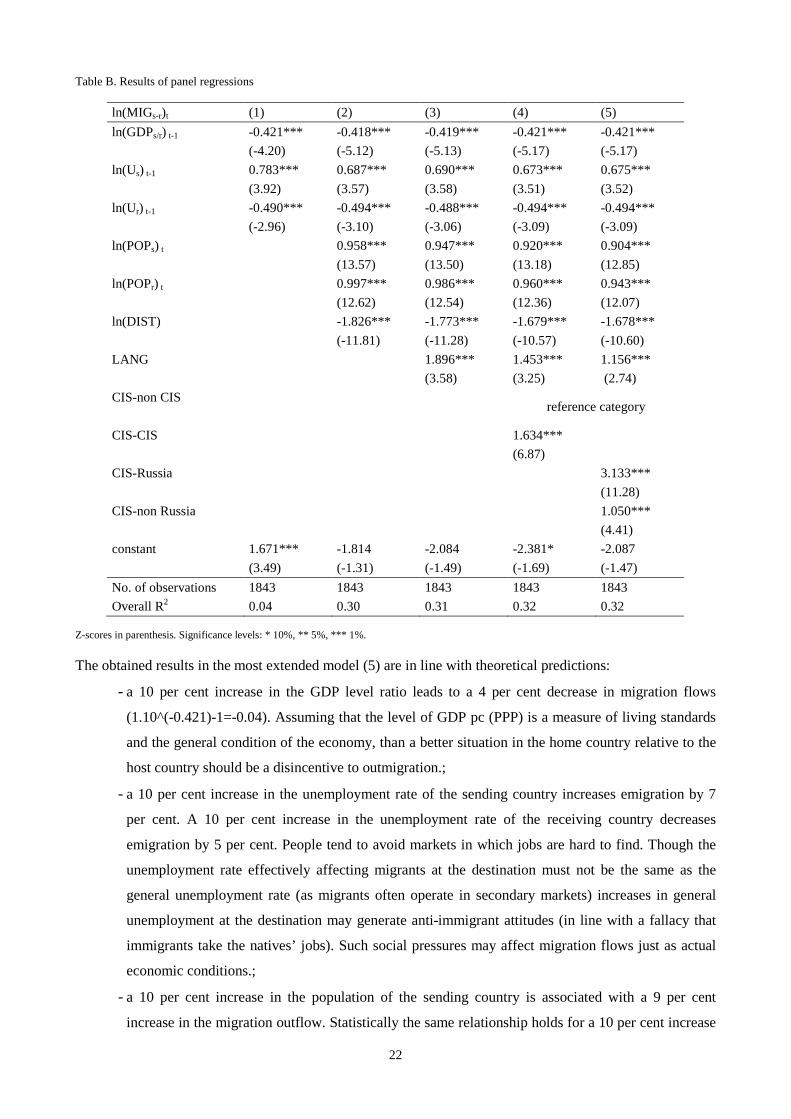
Table B. Results of panel regressions
ln(MIGs-r)t (1) (2) (3) (4) (5) ln(GDPs/r) t-1 -0.421*** -0.418*** -0.419*** -0.421*** -0.421*** (-4.20) (-5.12) (-5.13) (-5.17) (-5.17) ln(Us) t-1 0.783*** 0.687*** 0.690*** 0.673*** 0.675*** (3.92) (3.57) (3.58) (3.51) (3.52) ln(Ur) t-1 -0.490*** -0.494*** -0.488*** -0.494*** -0.494*** (-2.96) (-3.10) (-3.06) (-3.09) (-3.09) ln(POPs) t 0.958*** 0.947*** 0.920*** 0.904*** (13.57) (13.50) (13.18) (12.85) ln(POPr) t 0.997*** 0.986*** 0.960*** 0.943*** (12.62) (12.54) (12.36) (12.07) ln(DIST) -1.826*** -1.773*** -1.679*** -1.678*** (-11.81) (-11.28) (-10.57) (-10.60) LANG 1.896*** 1.453*** 1.156*** (3.58) (3.25) (2.74) CIS-non CIS
reference category CIS-CIS 1.634*** (6.87) CIS-Russia 3.133*** (11.28) CIS-non Russia 1.050*** (4.41) constant 1.671*** -1.814 -2.084 -2.381* -2.087 (3.49) (-1.31) (-1.49) (-1.69) (-1.47) No. of observations 1843 1843 1843 1843 1843 Overall R2 0.04 0.30 0.31 0.32 0.32
Z-scores in parenthesis. Significance levels: * 10%, ** 5%, *** 1%.
The obtained results in the most extended model (5) are in line with theoretical predictions:
- a 10 per cent increase in the GDP level ratio leads to a 4 per cent decrease in migration flows
(1.10^(-0.421)-1=-0.04). Assuming that the level of GDP pc (PPP) is a measure of living standards
and the general condition of the economy, than a better situation in the home country relative to the
host country should be a disincentive to outmigration.;
- a 10 per cent increase in the unemployment rate of the sending country increases emigration by 7
per cent. A 10 per cent increase in the unemployment rate of the receiving country decreases
emigration by 5 per cent. People tend to avoid markets in which jobs are hard to find. Though the
unemployment rate effectively affecting migrants at the destination must not be the same as the
general unemployment rate (as migrants often operate in secondary markets) increases in general
unemployment at the destination may generate anti-immigrant attitudes (in line with a fallacy that
immigrants take the natives’ jobs). Such social pressures may affect migration flows just as actual
economic conditions.;
- a 10 per cent increase in the population of the sending country is associated with a 9 per cent
increase in the migration outflow. Statistically the same relationship holds for a 10 per cent increase
23
in the population of the receiving country. This captures the potential of the home country to send
migrants and of the host country to receive migrants. The higher this joint potential, the larger the
migration flow.;
- doubling the distance between the sending and receiving country implies a decrease in migration
flow by 69 per cent. Here distance is a proxy for the costs of migration, both pecuniary and non-
pecuniary. The monetary costs of travel along with the costs of family separation and possible visits
at home are, as expected, inversely related to the scale of migration between two countries.;
- sharing a language increases migration between two countries over three times (EXP(1.156)-
1=2.18), ceteris paribus;
- migration within the CIS is on average 5 times larger in scale than between the CIS and the ‘outside
world’ (see column (4) for reference, EXP(1,633946)-1=4.12);
- if we take Russia out of the CIS picture the difference in the scale of intra-CIS migration flows and
migration flows between CIS to/from non-CIS countries is much smaller – not even threefold
(EXP(1.05)-1=1.86). Hence we can conclude that Russia as a major receiving country in the CIS
region induces a great proportion of mobility within the CIS. Flows between CIS countries and
Russia are nearly 23 times larger than flows between CIS and non-CIS countries (EXP(3.133)-
1=21.94). In numerical terms the CIS-non Russia migration flows are 88 per cent smaller than flows
between a CIS country and Russia.;
Regardless of specification the estimators obtained for the economic, demo-geographic and common
language indicators are very stable leaving us confident about the results.
An attempt was made at including three Baltic states (Latvia, Lithuania, and Estonia) in the CIS
group, as they were also republics of the USSR. Nowadays they seem more tightly connected with the
European Union, though, which is why they were not initially included in the CIS dummy. However, when
the CIS dummy also includes the three Baltic states, the magnitude of the CIS estimator is slightly smaller
(1.22, in comparison to 1.634 in model (4) in Table B), yet of the same sign and significance. This is
indicative of their relatively weak connections with non-EU post-Soviet states which indicates that in terms
of migration flows ‘Soviet heritage’ might not be as important of a determinant, as anticipated.
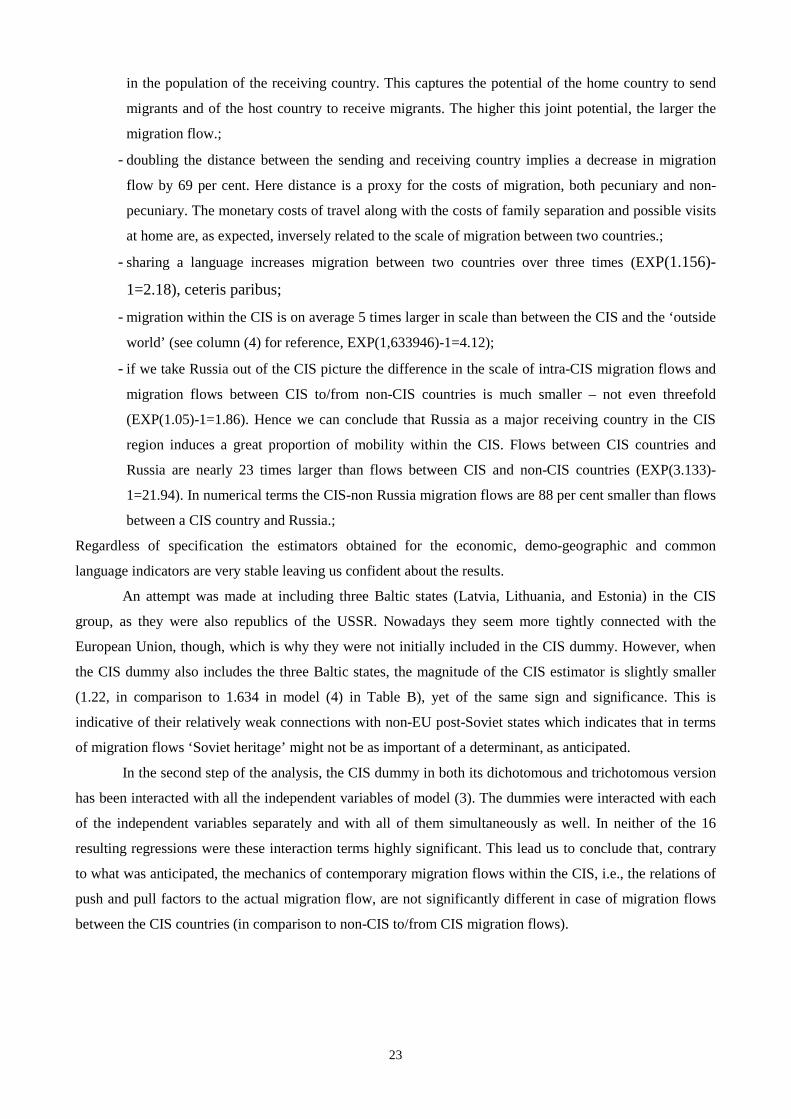
In the second step of the analysis, the CIS dummy in both its dichotomous and trichotomous version
has been interacted with all the independent variables of model (3). The dummies were interacted with each
of the independent variables separately and with all of them simultaneously as well. In neither of the 16
resulting regressions were these interaction terms highly significant. This lead us to conclude that, contrary
to what was anticipated, the mechanics of contemporary migration flows within the CIS, i.e., the relations of
push and pull factors to the actual migration flow, are not significantly different in case of migration flows
between the CIS countries (in comparison to non-CIS to/from CIS migration flows).
24
6. Summary and conclusions
This paper has made an attempt to provide a multidimensional and quantitative evaluation of the
distinctiveness of migration flows in the post-Soviet space. Using the systems perspective, we have
anticipated that migration flows in the CIS region significantly differ both in terms of their scale and
mechanics from flows directed to or originating from outside of the region. This hypothesis was tested by
employing network analysis and an econometric gravity model. The dataset used for the analysis was
compiled specifically for the purpose of this study.
Our goal was to quantitatively explore certain features and patterns of migration within this region and
between it and the rest of the world. We found no evidence to support the hypothesis of the existence of the
CIS/post-Soviet migration system. The island analysis has shown that, as far as the scale of flows is
concerned, CIS states do not form a clearly distinct group of major sending and receiving countries. This
distinctiveness is only visible when analyzing migrant stocks, which reflect past migration interdependencies
between CIS countries rather than of the contemporary population mobility within the region. Interpreting
our results in terms of the migration systems theory, we infer that claiming the existence of the CIS
migration system in the CIS migration space could be potentially misleading. Given the limitations of our
study, which took a purely quantitative perspective, to refute the CIS migration system hypothesis would
also require considering other ties between the CIS countries such as economic, political or historical
linkages. This was not our objective in this paper, however, and it remains to be addressed by future
research.
The results of the gravity model show that migration between CIS states is, on average, more intense
that between CIS and non-CIS countries. In light of the findings of the island analysis, though, it must be
kept in mind that the actual migration patterns within and out of the region are far more nuanced. Despite the
fact that migration flows within the CIS are on average larger then between CIS and major non-CIS sending
and receiving countries, there are certain migration corridors involving CIS and non-CIS states that are
quantitatively more significant than some CIS-CIS migration flows. The gravity model was also meant to
test the mechanics of intra-CIS migration flows, i.e., whether certain correlates of the scale of migration
flows relate to intra-CIS mobility differently than migration between a CIS and non-CIS country. This part
of the analysis revealed that, in comparison to inter-regional mobility, intra-CIS migration flows do not
respond to the considered push and pull factors in a significantly different way. This finding suggests that the
distinctiveness of the migration processes between the CIS countries is questionable or at best very weak as
far as the migration mechanics is concerned.
Speaking of the migration situation in the post-Soviet area we should bear in mind the limitations of
our dataset. Registration for permanent residence is the main proxy for the scale of migration. Obviously this
constitutes only a smart part of the whole process, even when irregular migration flows are excluded. In
2010-2012, the number of officially registered labour migrants in Russia exceeded the number of migrants
registered for permanent residence over five times (Chudinovskikh, Denisenko 2014). Nevertheless, we have
limited our analysis to permanent migration data for the sake of completeness and comparability of the data
set. Future research should incorporate labour migration into the analysis.

25
Despite the above-mentioned drawbacks, the study sheds new light on the phenomenon of migration
in the post-Soviet space. It questions the asserted distinctiveness of the region and the existence of the post-
Soviet migration system. Although the observed flows are, on average, relatively large, it seems that they are
influenced by similar push and pull factors as those influencing the mobility between the region and the rest
of the world. Notwithstanding this finding, it must be noted that the socio-economic differences between
countries that were formerly the USSR republics are very large, with Russia being a major recipient of
migrants from the region.
26
References
Aldashev A., Dietz B. (2011). Determinants of Internal Migration in Kazakhstan. MPRA Paper No. 34922. Online: http://mpra.ub.uni-muenchen.de/34922/
Anderson B., Hancilova B. (2011). Migrant Labour in Kazakhstan: A Cause for Concern? Journal of Ethnic and Migration Studies 37(3): 467–483.
Andrienko Y., Guriev S. (2003). Determinants of Interregional Mobility in Russia: Evidence from Panel Data. William Davidson Institute (WDI). Working Papers 551. Online: www.wdi.umich.edu/files/Publications/WorkingPapers/wp551.pdf
Bakewell O. (2013). Relaunching migration systems, Migration Studies, November: 1-19.
Boutang Y. M., Papademetriou D. (1994). Migration Systems: Comparative Analysis and Case Studies [in:] Migration and development: new partnerships for co-operation. Paris: OECD.
Boyd M. (1989). Family and Personal Networks in International Migration: Recent Developments and New Agendas, International Migration Review. Special Silver Anniversary Issue: International Migration an Assessment for the 90's 23(3): 638-670.
Chudinovskikh O., Denisenko M. (2014). Population Mobility and the Common Migration Policy in the Commonwealth of Independent States, CMR Working Paper (in preparation).
De Haas H. (2007). North African Migration Systems: Evolution, Transformations and Development Linkages. Working Papers 6. Oxford: International Migration Institute, University of Oxford.
Demograficheskij ezhegodnik Kazahstana [Demographic Yearbook of Kazakhstan] (2012). Astana: Agentstvo Respubliki Kazahstan po statistike.
Fawcett J. T. (1989). Networks, Linkages, and Migration Systems, International Migration Review. Special Silver Anniversary Issue: International Migration an Assessment for the 90’s 23(3): 671-680.
Ivahnjuk I. (2008). Mezhdunarodnaja migracija na postsovetskom prostranstve: formirovanie novoj migracionnoj sistemy. [International migration on the post-Soviet area: formation of the new migration system.] Vestnik KRSU 8.
Ivahnjuk I. (2012). Evrazijskaja migracionnaja sistema: ot jekonomicheskogo pragmatizma k vozrozhdeniju civilizacionnogo edinstva. [Eurasian migration system: from economic pragmatism to revival of civilizational unity.] Online: http://www.gumilev-center.ru/evrazijjskaya-migracionnaya-sistema-ot-ehkonomicheskogo-pragmatizma-k-vozrozhdeniyu-civilizacionnogo-edinstva/
Ivakhnyuk I. (2003). Two Migration Systems in Europe: Development Trends and Cooperation Interaction Perspectives. Report presented during the 4th regional conference of the Council of Europe ‘Migration policies on the eve of the EU enlargement: what challenges for future co-operation within the East European region’, Kiev, 9-10 Oct 2003. Online: http://www.archipelag.ru/agenda/povestka/povestka-immigration/strategii/dve_sistemi/, 13.12.2011.
Jones H., Findlay A. (1998). Regional Economic Integration and the Emergence of the East Asian International Migration System, Geoforum 29(I): 87-104.
Kritz M., Lim L.L, Zlotnik H. (1992). International Migration Systems: a Global Approach. Clarendon, Oxford: Oxford University Press.
Lee, E. S. (1966). A Theory of Migration, Demography 3: 47-57.
Lewer J. J., van den Berg H. (2008). A Gravity Model of Immigration, Economics Letters 99(1): 164-167.
Mabogunje A. L. (1970). Systems Approach to a Theory of Rural-Urban Migration, Geographical Analysis 2(1): 1-18.
27
Mayda A. M. (2010). International Migration: a Panel Data Analysis of the Determinants of Bilateral Flows, Journal of Population Economics 23(4): 1249-1274.
Mayer T., Zignago S. (2011). Notes on CEPII’s distances measures (GeoDist). CEPII Working Paper 2011-25.
Naselennja Ukraїni za 2010 rіk. Demografіchnij shhorіchnik [Population of Ukraine in 2010. Demographic Yearbook] (2011). Kiїv: Derzhavna sluzhba statistiki Ukraїni.
Ratha D., Shaw W. (2007). South-South Migration and Remittances. World Bank Working Paper 102.
Ravenstein E. G. (1885). The Laws of Migration, Journal of the Royal Statistical Society 48: 167-222.
Ravenstein E. G. (1889). The Laws of Migration, Journal of the Royal Statistical Society 52: 214-301.
Salt J. (1989). A Comparative Overview of International Trends and Types, 1950-80, International Migration Review 23: 431-456.
Statistical Yearbook of the Republic of Belarus 2010 (2011). Minsk: National Statistical Committee of the Republic of Belarus.
Statisticheskij Ezhegodnik Kyrgyzskoj Respubliki [Statistical Yearbook of the Republic of Kyrgyzstan] (2011). Bishkek: Nacional'nyj statisticheskij komitet Kyrgyzskoj Respubliki.
The State Statistical Committee of the Republic of Azerbaijan (2013). Online: stat.gov.az.
UNECE (2013). UNECE Statistical Division Database. Online: http://w3.unece.org/pxweb/.
United Nations DESA – Population Division, migration section (2013). Online: http://esa.un.org/unpd/wpp/Excel-Data/migration.htm.
Uzagalieva A., Chojnicki X., Filer R.K., de Menezes A.G. (2012). Migration in CIS in the Context of European Integration and Changing Socio-political Borders. CEEAplA WP 03/2012. Universidade dos Açores.
World Bank (2011). Remittances Data, Annual remittances data, Inflows. Online: http://econ.worldbank.org/WBSITE/EXTERNAL/EXTDEC/EXTDECPROSPECTS/0,,contentMDK:22759429~pagePK:64165401~piPK:64165026~theSitePK:476883,00.html, accessed 27.08.2013.
World Bank (2013). Bilateral Migration Matrix 2010. Online: http://econ.worldbank.org/WBSITE/EXTERNAL/EXTDEC/EXTDECPROSPECTS/0,,contentMDK:22803131~pagePK:64165401~piPK:64165026~theSitePK:476883,00.html, accessed on 15.06.2013.
World Population Prospects: the 2010 Revision (2011). Geneva: United Nations, Population Division.
Zayonchkovskaya Z. (2000). Recent Migration Trends in the Commonwealth of Independent States, International Social Science Journal 52: 343–355.
Zipf G. (1946). The PP/D hypothesis: on the Intercity Movement of Persons, American Sociological Review 11: 677-686.
28
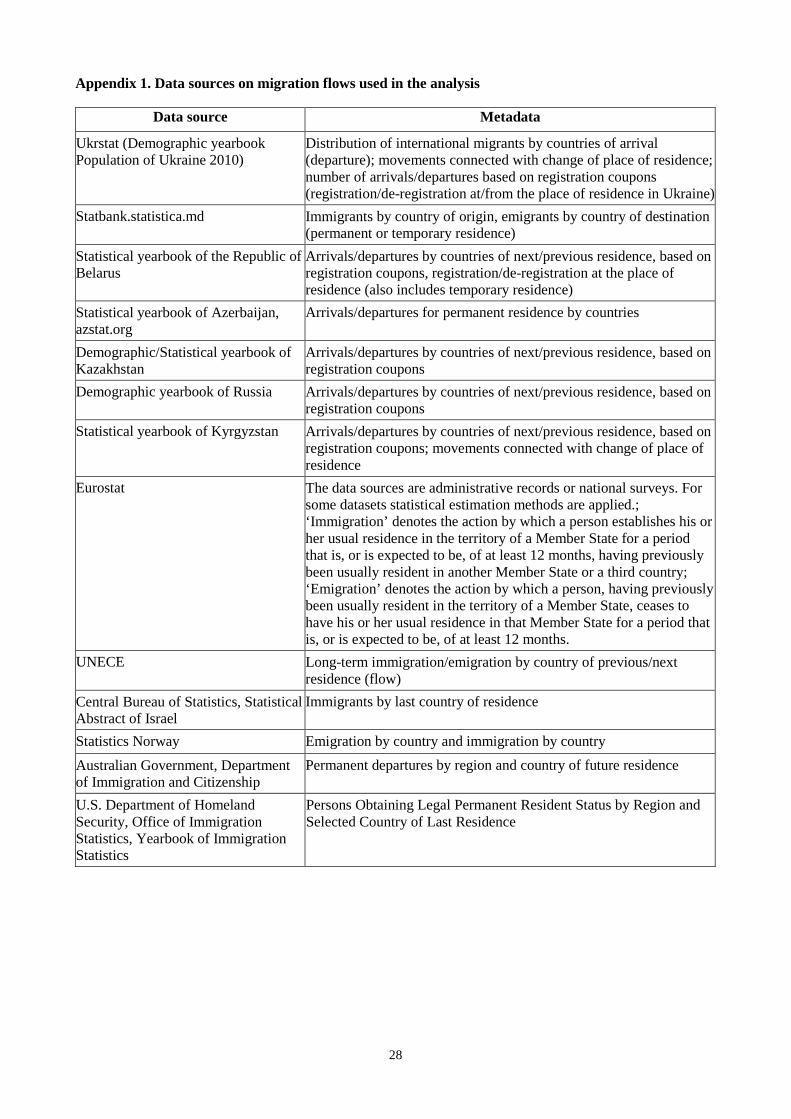
Appendix 1. Data sources on migration flows used in the analysis
Data source Metadata
Ukrstat (Demographic yearbook Population of Ukraine 2010)
Distribution of international migrants by countries of arrival (departure); movements connected with change of place of residence; number of arrivals/departures based on registration coupons (registration/de-registration at/from the place of residence in Ukraine)
Statbank.statistica.md Immigrants by country of origin, emigrants by country of destination (permanent or temporary residence)
Statistical yearbook of the Republic of Belarus
Arrivals/departures by countries of next/previous residence, based on registration coupons, registration/de-registration at the place of residence (also includes temporary residence)
Statistical yearbook of Azerbaijan, azstat.org
Arrivals/departures for permanent residence by countries
Demographic/Statistical yearbook of Kazakhstan
Arrivals/departures by countries of next/previous residence, based on registration coupons
Demographic yearbook of Russia Arrivals/departures by countries of next/previous residence, based on registration coupons
Statistical yearbook of Kyrgyzstan Arrivals/departures by countries of next/previous residence, based on registration coupons; movements connected with change of place of residence
Eurostat The data sources are administrative records or national surveys. For some datasets statistical estimation methods are applied.; ‘Immigration’ denotes the action by which a person establishes his or her usual residence in the territory of a Member State for a period that is, or is expected to be, of at least 12 months, having previously been usually resident in another Member State or a third country; ‘Emigration’ denotes the action by which a person, having previously been usually resident in the territory of a Member State, ceases to have his or her usual residence in that Member State for a period that is, or is expected to be, of at least 12 months.
UNECE Long-term immigration/emigration by country of previous/next residence (flow)
Central Bureau of Statistics, Statistical Abstract of Israel
Immigrants by last country of residence
Statistics Norway Emigration by country and immigration by country Australian Government, Department of Immigration and Citizenship
Permanent departures by region and country of future residence
U.S. Department of Homeland Security, Office of Immigration Statistics, Yearbook of Immigration Statistics
Persons Obtaining Legal Permanent Resident Status by Region and Selected Country of Last Residence