Effects of external and internal cues on gait function in Williams syndrome
7
Effects of external and internal cues on gait function in Williams syndrome Darren R. Hocking a,b, ⁎, Jennifer L. McGinley c , Simon A. Moss d , John L. Bradshaw a,e , Nicole J. Rinehart a a Centre for Developmental Psychiatry and Psychology, School of Psychology and Psychiatry, Monash University, Notting Hill, VIC, Australia b Bruce Lefroy Centre for Genetic Health Research, Murdoch Childrens Research Institute, Royal Children's Hospital, Parkville, VIC, Australia c Centre for Clinical Research Excellence in Gait Analysis and Gait Rehabilitation, Murdoch Childrens Research Institute, Parkville, VIC, Australia d School of Psychology and Psychiatry, Monash University, Caulfield, VIC, Australia e Experimental Neuropsychology Research Unit, School of Psychology and Psychiatry, Monash University, Clayton, VIC, Australia abstract article info Article history: Received 30 September 2009 Received in revised form 26 November 2009 Accepted 22 December 2009 Available online 6 February 2010 Keywords: Gait Parkinsonian Williams syndrome Fronto-parietal Neurological Basal ganglia Williams syndrome (WS), a rare genetically based neurodevelopmental disorder, is characterized by gait abnormalities that resemble basal ganglia-parkinsonian deficits in the internal regulation of stride length. In the current study, we explored whether visual or attentional cues would improve gait function in adults with WS, when compared to adults with Down syndrome (DS) and neurologically normal controls. The spatiotemporal characteristics of gait were measured using the GAITRite walkway while participants walked with visual cues set at 20% greater than preferred stride length (externally cued), or with an attentional strategy of maintaining the stride length without the assistance of visual cues (internally cued). Although the WS and DS groups were able to achieve the criterion and normalize stride length in both conditions, the WS group significantly reduced their gait speed and cadence in the externally cued condition when compared to controls. In the internally cued condition, the WS group also showed reduced speed and increased intra-individual variability in speed and stride time. These findings suggest that the primary deficit is not one of difficulty regulating stride length in WS, but rather indicates more widespread dysfunction within visuomotor regions. © 2010 Elsevier B.V. All rights reserved. 1. Introduction Williams syndrome (WS) is a rare genetically based disorder, affecting 1 in 20,000 births, with more recent estimates of 1 in 7500 [1], caused by a microdeletion on a section of chromosome 7 including approximately 28 genes. The unique cognitive profile of WS has been well documented; this profile includes mild-to-moderate intellectual disability, with relative strengths in the verbal domain and face recognition, but with poor abilities in the visuospatial domain [2]. These characteristics are assumed to be related to specific dysfunction in the dorsal visual pathway in individuals with WS, an area which underpins the processing of spatial information associated with visually-guided movement; in contrast, ventral visual areas, which subserve perceptual processes such as object and face recognition, seem to be preserved [3]. Although several studies have shown visuomotor deficits within both upper limb and gait function in individuals with WS [4–7], the neural basis of the visuomotor abnormalities observed in WS are, as yet, unclear. Anecdotal and clinical observations indicate that visuomotor deficits in WS are more pronounced during more complex motor tasks, such as descending stairs or walking across uneven surfaces [5,8]. The results of our previous research on the spatiotemporal gait patterns associated with WS indicate that, when compared to a neurologically intact control group, individuals with WS are characterised by slow, wide-based (broad distance between the feet) and variable gait; however, we concluded that the primary deficit appears to be difficulty in regulating stride length rather than cadence (stepping frequency) [7]. More specifically, the WS group showed a consistently reduced stride length at any given increase in speed, with a disproportionate increase in cadence as speed increased. Accordingly, the gait disturbances observed in WS resembled basal ganglia-parkinsonian deficits in the internal regulation of stride length [9,10]. Imaging studies have shown that, when compared with healthy controls and individuals with Down syndrome (DS), the volume of the caudate nuclei and basal ganglia is significantly reduced in individuals with WS [11–14]. In contrast, individuals with DS show relatively preserved volume of the basal ganglia and posterior (parietal and occipital) regions, whereas frontal, temporal and cerebellar regions are typically reduced in size [15,16]. Imaging studies, however, have shown either preserved or increased volume of the cerebellum in WS [11,13,14,17,18]. Nevertheless, biochemical differences (reduction of the neurotransmitter N-acetylaspartate) in the cerebellum have been observed during performance on visuospatial and visuomotor tasks in WS [19]. One of the most consistent findings to date, in the imaging studies in WS, is primary dysfunction in the dorsal visual stream of the posterior parietal cortex [3,20,21]. However, it is not clear how these Journal of the Neurological Sciences 291 (2010) 57–63 ⁎ Corresponding author. Developmental Neuroscience and Genetic Disorders Laboratory, Monash University, School of Psychology and Psychiatry, Clayton Road, Clayton VIC 3800 Australia. Tel.: +61 3 9905 3966. E-mail address: [email protected] (D.R. Hocking). 0022-510X/$ – see front matter © 2010 Elsevier B.V. All rights reserved. doi:10.1016/j.jns.2009.12.026 Contents lists available at ScienceDirect Journal of the Neurological Sciences journal homepage: www.elsevier.com/locate/jns
Transcript of Effects of external and internal cues on gait function in Williams syndrome

Journal of the Neurological Sciences 291 (2010) 57–63
Contents lists available at ScienceDirect
Journal of the Neurological Sciences
j ourna l homepage: www.e lsev ie r.com/ locate / jns
Effects of external and internal cues on gait function in Williams syndrome
Darren R. Hocking a,b,⁎, Jennifer L. McGinley c, Simon A. Moss d, John L. Bradshaw a,e, Nicole J. Rinehart a
a Centre for Developmental Psychiatry and Psychology, School of Psychology and Psychiatry, Monash University, Notting Hill, VIC, Australiab Bruce Lefroy Centre for Genetic Health Research, Murdoch Childrens Research Institute, Royal Children's Hospital, Parkville, VIC, Australiac Centre for Clinical Research Excellence in Gait Analysis and Gait Rehabilitation, Murdoch Childrens Research Institute, Parkville, VIC, Australiad School of Psychology and Psychiatry, Monash University, Caulfield, VIC, Australiae Experimental Neuropsychology Research Unit, School of Psychology and Psychiatry, Monash University, Clayton, VIC, Australia
⁎ Corresponding author. Developmental NeurosciLaboratory, Monash University, School of PsychologyClayton VIC 3800 Australia. Tel.: +61 3 9905 3966.
E-mail address: [email protected]
0022-510X/$ – see front matter © 2010 Elsevier B.V. Adoi:10.1016/j.jns.2009.12.026
a b s t r a c t
a r t i c l e i n f oArticle history:Received 30 September 2009Received in revised form 26 November 2009Accepted 22 December 2009Available online 6 February 2010
Keywords:GaitParkinsonianWilliams syndromeFronto-parietalNeurologicalBasal ganglia
Williams syndrome (WS), a rare genetically based neurodevelopmental disorder, is characterized by gaitabnormalities that resemble basal ganglia-parkinsonian deficits in the internal regulation of stride length. In thecurrent study, we explored whether visual or attentional cues would improve gait function in adults with WS,when compared to adults with Down syndrome (DS) and neurologically normal controls. The spatiotemporalcharacteristics of gait weremeasured using the GAITRite walkwaywhile participantswalkedwith visual cues setat 20% greater than preferred stride length (externally cued), or with an attentional strategy of maintaining thestride lengthwithout the assistance of visual cues (internally cued). Although theWSandDS groupswere able toachieve the criterion and normalize stride length in both conditions, theWSgroup significantly reduced their gaitspeed and cadence in the externally cued conditionwhen compared to controls. In the internally cued condition,the WS group also showed reduced speed and increased intra-individual variability in speed and stride time.These findings suggest that the primary deficit is not one of difficulty regulating stride length in WS, but ratherindicates more widespread dysfunction within visuomotor regions.
ence and Genetic Disordersand Psychiatry, Clayton Road,
(D.R. Hocking).
ll rights reserved.
© 2010 Elsevier B.V. All rights reserved.
1. Introduction
Williams syndrome (WS) is a rare genetically based disorder,affecting 1 in 20,000 births, with more recent estimates of 1 in 7500[1], caused by amicrodeletion on a section of chromosome 7 includingapproximately 28 genes. The unique cognitive profile of WS has beenwell documented; this profile includes mild-to-moderate intellectualdisability, with relative strengths in the verbal domain and facerecognition, but with poor abilities in the visuospatial domain [2].These characteristics are assumed to be related to specific dysfunctionin the dorsal visual pathway in individuals with WS, an area whichunderpins the processing of spatial information associated withvisually-guided movement; in contrast, ventral visual areas, whichsubserve perceptual processes such as object and face recognition,seem to be preserved [3]. Although several studies have shownvisuomotor deficits within both upper limb and gait function inindividuals with WS [4–7], the neural basis of the visuomotorabnormalities observed in WS are, as yet, unclear.
Anecdotal and clinical observations indicate that visuomotor deficitsin WS are more pronounced duringmore complexmotor tasks, such as
descending stairs or walking across uneven surfaces [5,8]. The results ofour previous research on the spatiotemporal gait patterns associatedwithWS indicate that,when compared to a neurologically intact controlgroup, individuals with WS are characterised by slow, wide-based(broad distance between the feet) and variable gait; however, weconcluded that the primary deficit appears to be difficulty in regulatingstride length rather than cadence (stepping frequency) [7]. Morespecifically, the WS group showed a consistently reduced stride lengthat any given increase in speed, with a disproportionate increase incadence as speed increased. Accordingly, the gait disturbances observedin WS resembled basal ganglia-parkinsonian deficits in the internalregulation of stride length [9,10].
Imaging studies have shown that, when compared with healthycontrols and individuals with Down syndrome (DS), the volume of thecaudate nuclei and basal ganglia is significantly reduced in individualswith WS [11–14]. In contrast, individuals with DS show relativelypreserved volume of the basal ganglia and posterior (parietal andoccipital) regions, whereas frontal, temporal and cerebellar regionsare typically reduced in size [15,16]. Imaging studies, however, haveshown either preserved or increased volume of the cerebellum in WS[11,13,14,17,18]. Nevertheless, biochemical differences (reduction ofthe neurotransmitter N-acetylaspartate) in the cerebellum have beenobserved during performance on visuospatial and visuomotor tasks inWS [19]. One of the most consistent findings to date, in the imagingstudies inWS, is primary dysfunction in the dorsal visual stream of theposterior parietal cortex [3,20,21]. However, it is not clear how these
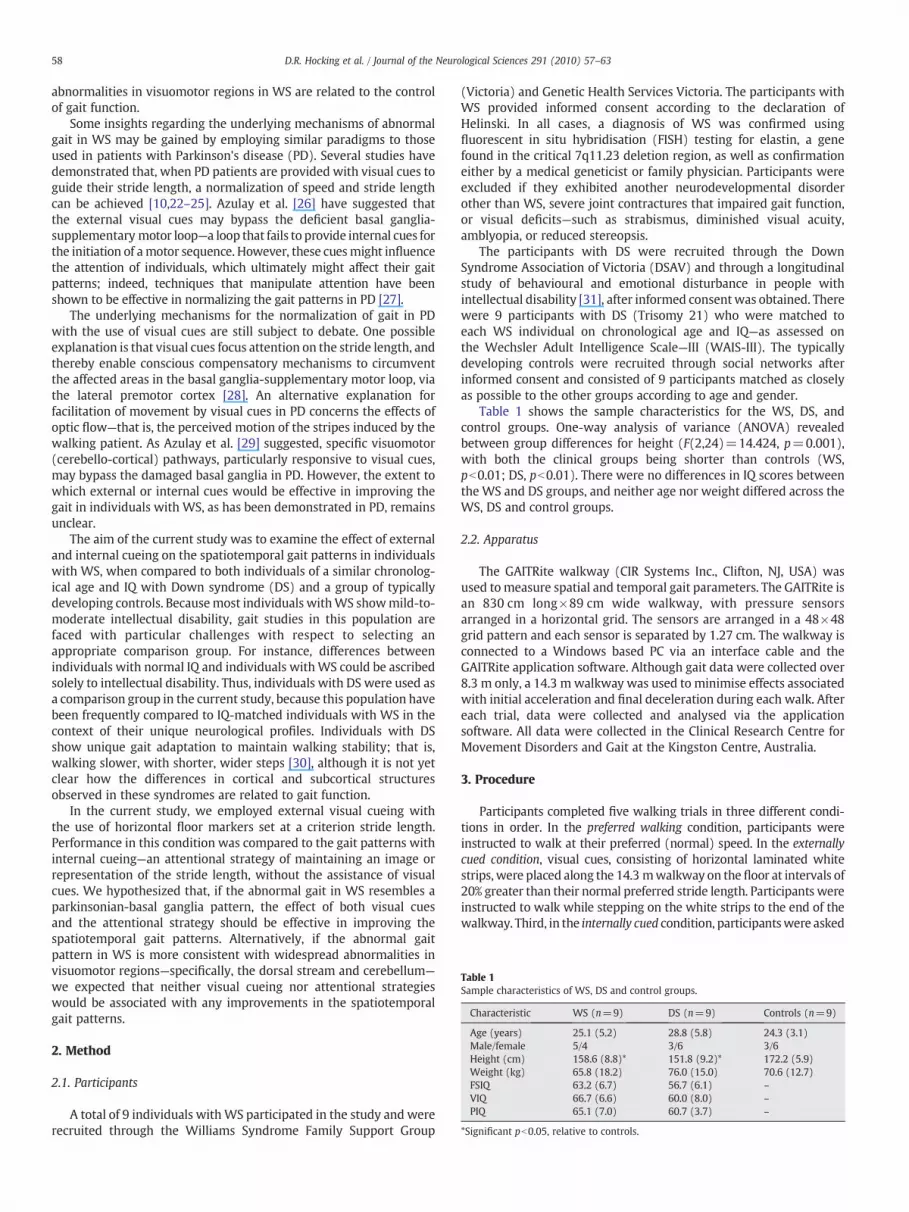
Table 1Sample characteristics of WS, DS and control groups.
Characteristic WS (n=9) DS (n=9) Controls (n=9)
Age (years) 25.1 (5.2) 28.8 (5.8) 24.3 (3.1)Male/female 5/4 3/6 3/6Height (cm) 158.6 (8.8)* 151.8 (9.2)* 172.2 (5.9)Weight (kg) 65.8 (18.2) 76.0 (15.0) 70.6 (12.7)FSIQ 63.2 (6.7) 56.7 (6.1) –
VIQ 66.7 (6.6) 60.0 (8.0) –
PIQ 65.1 (7.0) 60.7 (3.7) –
*Significant pb0.05, relative to controls.
58 D.R. Hocking et al. / Journal of the Neurological Sciences 291 (2010) 57–63
abnormalities in visuomotor regions in WS are related to the controlof gait function.
Some insights regarding the underlying mechanisms of abnormalgait in WS may be gained by employing similar paradigms to thoseused in patients with Parkinson's disease (PD). Several studies havedemonstrated that, when PD patients are provided with visual cues toguide their stride length, a normalization of speed and stride lengthcan be achieved [10,22–25]. Azulay et al. [26] have suggested thatthe external visual cues may bypass the deficient basal ganglia-supplementary motor loop—a loop that fails to provide internal cues forthe initiation of amotor sequence. However, these cuesmight influencethe attention of individuals, which ultimately might affect their gaitpatterns; indeed, techniques that manipulate attention have beenshown to be effective in normalizing the gait patterns in PD [27].
The underlying mechanisms for the normalization of gait in PDwith the use of visual cues are still subject to debate. One possibleexplanation is that visual cues focus attention on the stride length, andthereby enable conscious compensatory mechanisms to circumventthe affected areas in the basal ganglia-supplementary motor loop, viathe lateral premotor cortex [28]. An alternative explanation forfacilitation of movement by visual cues in PD concerns the effects ofoptic flow—that is, the perceived motion of the stripes induced by thewalking patient. As Azulay et al. [29] suggested, specific visuomotor(cerebello-cortical) pathways, particularly responsive to visual cues,may bypass the damaged basal ganglia in PD. However, the extent towhich external or internal cues would be effective in improving thegait in individuals with WS, as has been demonstrated in PD, remainsunclear.
The aim of the current study was to examine the effect of externaland internal cueing on the spatiotemporal gait patterns in individualswith WS, when compared to both individuals of a similar chronolog-ical age and IQ with Down syndrome (DS) and a group of typicallydeveloping controls. Becausemost individuals withWS showmild-to-moderate intellectual disability, gait studies in this population arefaced with particular challenges with respect to selecting anappropriate comparison group. For instance, differences betweenindividuals with normal IQ and individuals withWS could be ascribedsolely to intellectual disability. Thus, individuals with DS were used asa comparison group in the current study, because this population havebeen frequently compared to IQ-matched individuals with WS in thecontext of their unique neurological profiles. Individuals with DSshow unique gait adaptation to maintain walking stability; that is,walking slower, with shorter, wider steps [30], although it is not yetclear how the differences in cortical and subcortical structuresobserved in these syndromes are related to gait function.
In the current study, we employed external visual cueing withthe use of horizontal floor markers set at a criterion stride length.Performance in this condition was compared to the gait patterns withinternal cueing—an attentional strategy of maintaining an image orrepresentation of the stride length, without the assistance of visualcues. We hypothesized that, if the abnormal gait in WS resembles aparkinsonian-basal ganglia pattern, the effect of both visual cuesand the attentional strategy should be effective in improving thespatiotemporal gait patterns. Alternatively, if the abnormal gaitpattern in WS is more consistent with widespread abnormalities invisuomotor regions—specifically, the dorsal stream and cerebellum—
we expected that neither visual cueing nor attentional strategieswould be associated with any improvements in the spatiotemporalgait patterns.
2. Method
2.1. Participants
A total of 9 individuals withWS participated in the study and wererecruited through the Williams Syndrome Family Support Group
(Victoria) and Genetic Health Services Victoria. The participants withWS provided informed consent according to the declaration ofHelinski. In all cases, a diagnosis of WS was confirmed usingfluorescent in situ hybridisation (FISH) testing for elastin, a genefound in the critical 7q11.23 deletion region, as well as confirmationeither by a medical geneticist or family physician. Participants wereexcluded if they exhibited another neurodevelopmental disorderother than WS, severe joint contractures that impaired gait function,or visual deficits—such as strabismus, diminished visual acuity,amblyopia, or reduced stereopsis.
The participants with DS were recruited through the DownSyndrome Association of Victoria (DSAV) and through a longitudinalstudy of behavioural and emotional disturbance in people withintellectual disability [31], after informed consentwas obtained. Therewere 9 participants with DS (Trisomy 21) who were matched toeach WS individual on chronological age and IQ—as assessed onthe Wechsler Adult Intelligence Scale—III (WAIS-III). The typicallydeveloping controls were recruited through social networks afterinformed consent and consisted of 9 participants matched as closelyas possible to the other groups according to age and gender.
Table 1 shows the sample characteristics for the WS, DS, andcontrol groups. One-way analysis of variance (ANOVA) revealedbetween group differences for height (F(2,24)=14.424, p=0.001),with both the clinical groups being shorter than controls (WS,pb0.01; DS, pb0.01). There were no differences in IQ scores betweenthe WS and DS groups, and neither age nor weight differed across theWS, DS and control groups.
2.2. Apparatus
The GAITRite walkway (CIR Systems Inc., Clifton, NJ, USA) wasused tomeasure spatial and temporal gait parameters. The GAITRite isan 830 cm long×89 cm wide walkway, with pressure sensorsarranged in a horizontal grid. The sensors are arranged in a 48×48grid pattern and each sensor is separated by 1.27 cm. The walkway isconnected to a Windows based PC via an interface cable and theGAITRite application software. Although gait data were collected over8.3 m only, a 14.3 mwalkway was used to minimise effects associatedwith initial acceleration and final deceleration during each walk. Aftereach trial, data were collected and analysed via the applicationsoftware. All data were collected in the Clinical Research Centre forMovement Disorders and Gait at the Kingston Centre, Australia.
3. Procedure
Participants completed five walking trials in three different condi-tions in order. In the preferred walking condition, participants wereinstructed to walk at their preferred (normal) speed. In the externallycued condition, visual cues, consisting of horizontal laminated whitestrips, were placed along the 14.3 mwalkway on the floor at intervals of20% greater than their normal preferred stride length. Participants wereinstructed to walk while stepping on the white strips to the end of thewalkway. Third, in the internally cued condition, participantswere asked
59D.R. Hocking et al. / Journal of the Neurological Sciences 291 (2010) 57–63
to use an attentional strategy by walking at 20% greater than preferredstride length without the assistance of the visual markers. Participantswere asked to walk with the same size steps as before (with the whitestrips) by keeping the step size in mind.
4. Data analysis
The GAITRite software produces both mean values for gaitmeasures and step-to-step values, which were used to calculatevariability—representing fluctuations in gait variables across the stepswithin a singlewalk. Gait variability wasmeasured using coefficient ofvariation (CoV; SD/mean×100), which is a common method toexpress variability in this domain [32]. The primary dependentmeasures that were analysed were as follows: speed (cm walkedper second), cadence (steps per minute), stride length (combinedlength of left and right footfalls in full gait cycle), double support(percentage of time both feet are grounded in a complete gait cycle),and heel-to-heel base of support (perpendicular distance from theheel point of one footfall to the line of progression of the oppositefoot). CoV values were also calculated for stride time (variability intime elapsed between the first contacts of two consecutive footfalls ofthe same foot).
To examine baseline differences in the average gait parametersand CoV values across the three groups—WS, DS and controls—weconducted one-way analyses of covariance (ANCOVAs), using heightas a covariate. To explore differences between the three groups duringthe externally and internally cued conditions, we developed a gaitratio. That is, for each of the gait measures, we divided the value in thecued conditions by the value in the preferred or baseline condition.The ratio reflects a relative change from baseline to cued conditionswhere each participant acts as their own control. Given that the gaitratio controlled for group differences at baseline, we conducted one-way analyses of variance (ANOVAs) to compare mean gait ratios foreach gait variable across the groups.
5. Results
5.1. Baseline preferred walking
Table 2 shows average values for the gait measures for the preferred(baseline) walking condition. ANCOVA was used to compare the threegroups on the gaitmeasures in this condition,with height as a covariate.Although cadence did not differ across the groups during preferredwalking, speed (F(2,23)=5.872, p=0.009), stride length (F(2,23)=11.659, pb0.001) and base of support (F(2,23)=3.305, pb0.05) didvary significantly across these groups. Additional ANCOVAs, exploringeach pair of groups at a time, were conducted. As Table 2 shows, these
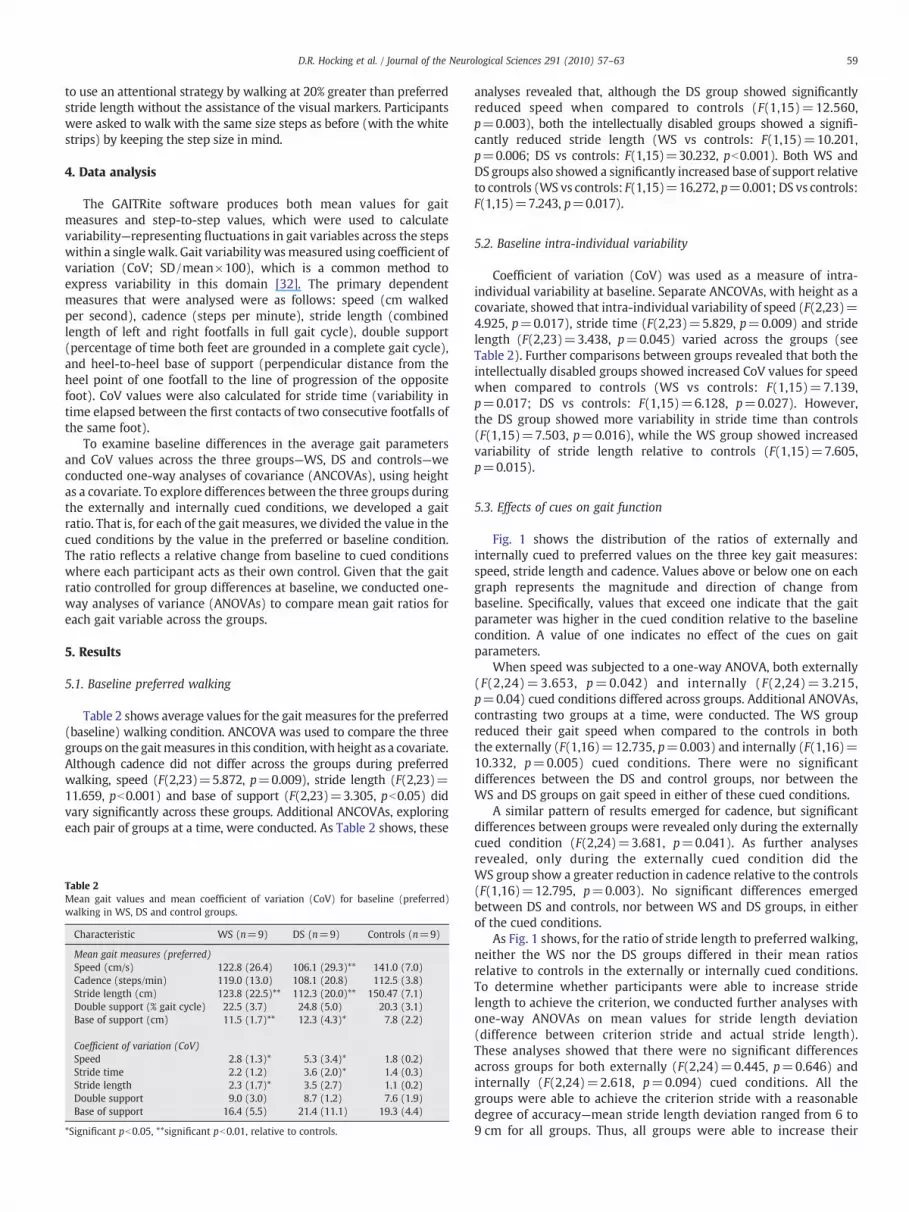
Table 2Mean gait values and mean coefficient of variation (CoV) for baseline (preferred)walking in WS, DS and control groups.
Characteristic WS (n=9) DS (n=9) Controls (n=9)
Mean gait measures (preferred)Speed (cm/s) 122.8 (26.4) 106.1 (29.3)** 141.0 (7.0)Cadence (steps/min) 119.0 (13.0) 108.1 (20.8) 112.5 (3.8)Stride length (cm) 123.8 (22.5)** 112.3 (20.0)** 150.47 (7.1)Double support (% gait cycle) 22.5 (3.7) 24.8 (5.0) 20.3 (3.1)Base of support (cm) 11.5 (1.7)** 12.3 (4.3)* 7.8 (2.2)
Coefficient of variation (CoV)Speed 2.8 (1.3)* 5.3 (3.4)* 1.8 (0.2)Stride time 2.2 (1.2) 3.6 (2.0)* 1.4 (0.3)Stride length 2.3 (1.7)* 3.5 (2.7) 1.1 (0.2)Double support 9.0 (3.0) 8.7 (1.2) 7.6 (1.9)Base of support 16.4 (5.5) 21.4 (11.1) 19.3 (4.4)
*Significant pb0.05, **significant pb0.01, relative to controls.
analyses revealed that, although the DS group showed significantlyreduced speed when compared to controls (F(1,15)=12.560,p=0.003), both the intellectually disabled groups showed a signifi-cantly reduced stride length (WS vs controls: F(1,15)=10.201,p=0.006; DS vs controls: F(1,15)=30.232, pb0.001). Both WS andDS groups also showed a significantly increased base of support relativeto controls (WS vs controls: F(1,15)=16.272, p=0.001; DS vs controls:F(1,15)=7.243, p=0.017).
5.2. Baseline intra-individual variability
Coefficient of variation (CoV) was used as a measure of intra-individual variability at baseline. Separate ANCOVAs, with height as acovariate, showed that intra-individual variability of speed (F(2,23)=4.925, p=0.017), stride time (F(2,23)=5.829, p=0.009) and stridelength (F(2,23)=3.438, p=0.045) varied across the groups (seeTable 2). Further comparisons between groups revealed that both theintellectually disabled groups showed increased CoV values for speedwhen compared to controls (WS vs controls: F(1,15)=7.139,p=0.017; DS vs controls: F(1,15)=6.128, p=0.027). However,the DS group showed more variability in stride time than controls(F(1,15)=7.503, p=0.016), while the WS group showed increasedvariability of stride length relative to controls (F(1,15)=7.605,p=0.015).
5.3. Effects of cues on gait function
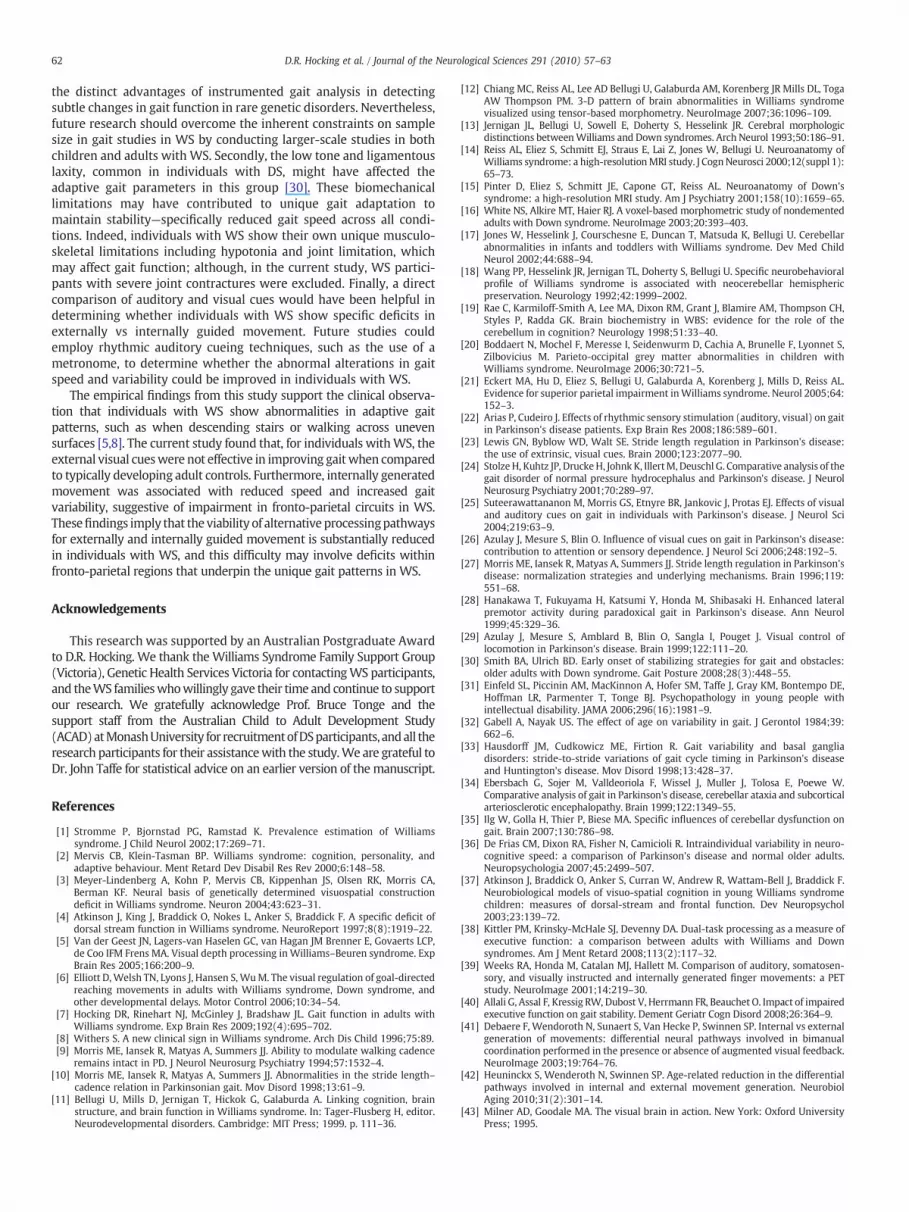
Fig. 1 shows the distribution of the ratios of externally andinternally cued to preferred values on the three key gait measures:speed, stride length and cadence. Values above or below one on eachgraph represents the magnitude and direction of change frombaseline. Specifically, values that exceed one indicate that the gaitparameter was higher in the cued condition relative to the baselinecondition. A value of one indicates no effect of the cues on gaitparameters.
When speed was subjected to a one-way ANOVA, both externally(F(2,24)=3.653, p=0.042) and internally (F(2,24)=3.215,p=0.04) cued conditions differed across groups. Additional ANOVAs,contrasting two groups at a time, were conducted. The WS groupreduced their gait speed when compared to the controls in boththe externally (F(1,16)=12.735, p=0.003) and internally (F(1,16)=10.332, p=0.005) cued conditions. There were no significantdifferences between the DS and control groups, nor between theWS and DS groups on gait speed in either of these cued conditions.
A similar pattern of results emerged for cadence, but significantdifferences between groups were revealed only during the externallycued condition (F(2,24)=3.681, p=0.041). As further analysesrevealed, only during the externally cued condition did theWS group show a greater reduction in cadence relative to the controls(F(1,16)=12.795, p=0.003). No significant differences emergedbetween DS and controls, nor between WS and DS groups, in eitherof the cued conditions.
As Fig. 1 shows, for the ratio of stride length to preferred walking,neither the WS nor the DS groups differed in their mean ratiosrelative to controls in the externally or internally cued conditions.To determine whether participants were able to increase stridelength to achieve the criterion, we conducted further analyses withone-way ANOVAs on mean values for stride length deviation(difference between criterion stride and actual stride length).These analyses showed that there were no significant differencesacross groups for both externally (F(2,24)=0.445, p=0.646) andinternally (F(2,24)=2.618, p=0.094) cued conditions. All thegroups were able to achieve the criterion stride with a reasonabledegree of accuracy—mean stride length deviation ranged from 6 to9 cm for all groups. Thus, all groups were able to increase their
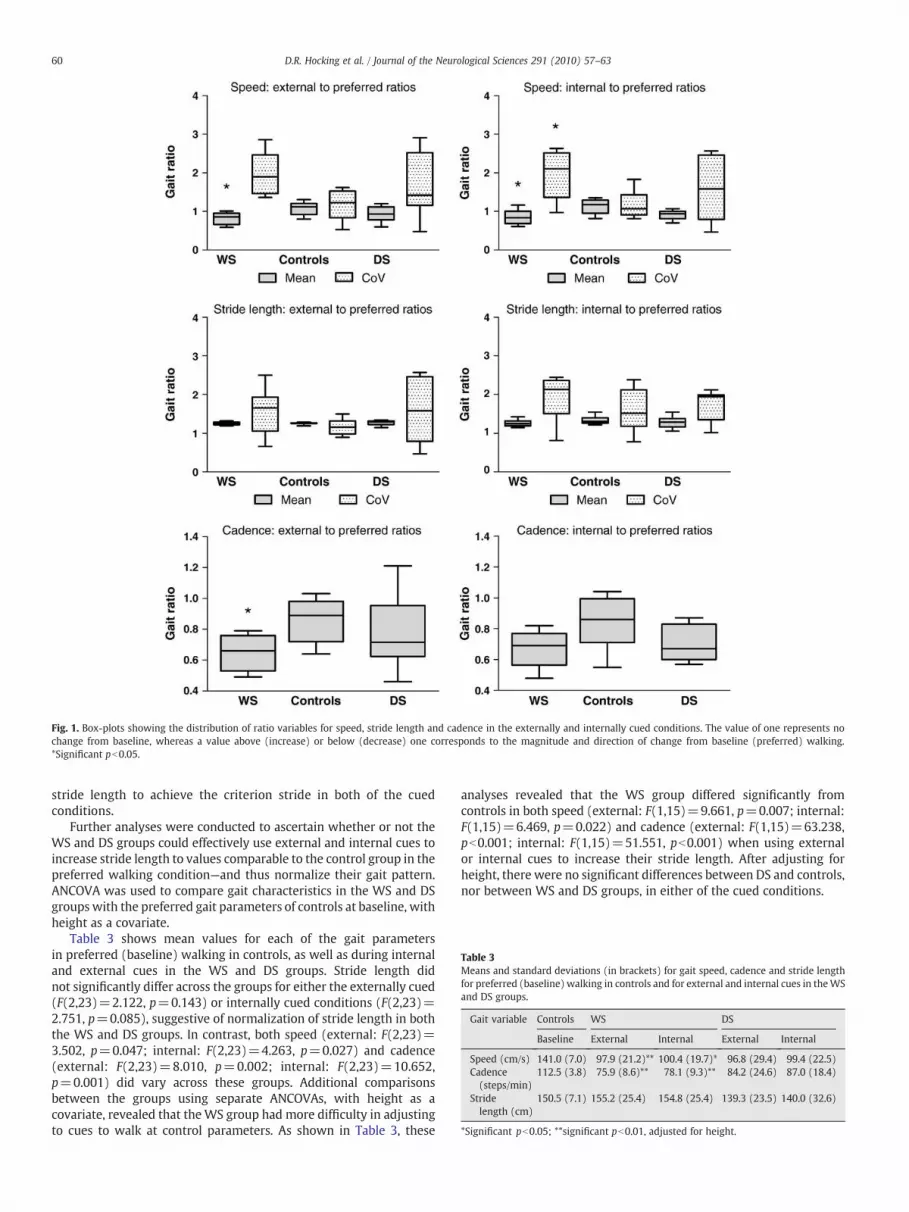
Fig. 1. Box-plots showing the distribution of ratio variables for speed, stride length and cadence in the externally and internally cued conditions. The value of one represents nochange from baseline, whereas a value above (increase) or below (decrease) one corresponds to the magnitude and direction of change from baseline (preferred) walking.*Significant pb0.05.
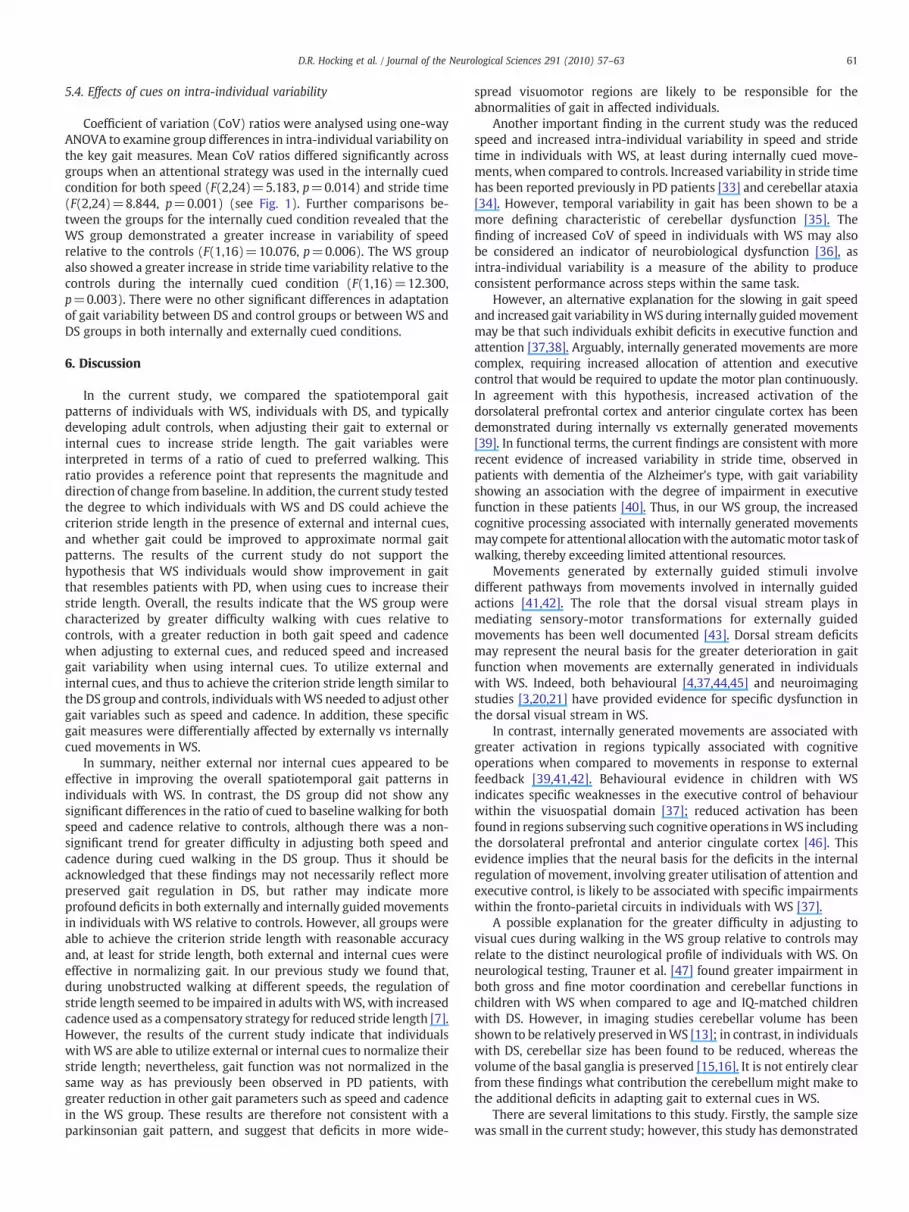
Table 3Means and standard deviations (in brackets) for gait speed, cadence and stride lengthfor preferred (baseline) walking in controls and for external and internal cues in theWSand DS groups.
Gait variable Controls WS DS
Baseline External Internal External Internal
Speed (cm/s) 141.0 (7.0) 97.9 (21.2)** 100.4 (19.7)* 96.8 (29.4) 99.4 (22.5)Cadence(steps/min)
112.5 (3.8) 75.9 (8.6)** 78.1 (9.3)** 84.2 (24.6) 87.0 (18.4)
Stridelength (cm)
150.5 (7.1) 155.2 (25.4) 154.8 (25.4) 139.3 (23.5) 140.0 (32.6)
*Significant pb0.05; **significant pb0.01, adjusted for height.
60 D.R. Hocking et al. / Journal of the Neurological Sciences 291 (2010) 57–63
stride length to achieve the criterion stride in both of the cuedconditions.
Further analyses were conducted to ascertain whether or not theWS and DS groups could effectively use external and internal cues toincrease stride length to values comparable to the control group in thepreferred walking condition—and thus normalize their gait pattern.ANCOVA was used to compare gait characteristics in the WS and DSgroupswith the preferred gait parameters of controls at baseline, withheight as a covariate.
Table 3 shows mean values for each of the gait parametersin preferred (baseline) walking in controls, as well as during internaland external cues in the WS and DS groups. Stride length didnot significantly differ across the groups for either the externally cued(F(2,23)=2.122, p=0.143) or internally cued conditions (F(2,23)=2.751, p=0.085), suggestive of normalization of stride length in boththe WS and DS groups. In contrast, both speed (external: F(2,23)=3.502, p=0.047; internal: F(2,23)=4.263, p=0.027) and cadence(external: F(2,23)=8.010, p=0.002; internal: F(2,23)=10.652,p=0.001) did vary across these groups. Additional comparisonsbetween the groups using separate ANCOVAs, with height as acovariate, revealed that theWS group had more difficulty in adjustingto cues to walk at control parameters. As shown in Table 3, these
analyses revealed that the WS group differed significantly fromcontrols in both speed (external: F(1,15)=9.661, p=0.007; internal:F(1,15)=6.469, p=0.022) and cadence (external: F(1,15)=63.238,pb0.001; internal: F(1,15)=51.551, pb0.001) when using externalor internal cues to increase their stride length. After adjusting forheight, there were no significant differences between DS and controls,nor between WS and DS groups, in either of the cued conditions.
61D.R. Hocking et al. / Journal of the Neurological Sciences 291 (2010) 57–63
5.4. Effects of cues on intra-individual variability
Coefficient of variation (CoV) ratios were analysed using one-wayANOVA to examine group differences in intra-individual variability onthe key gait measures. Mean CoV ratios differed significantly acrossgroups when an attentional strategy was used in the internally cuedcondition for both speed (F(2,24)=5.183, p=0.014) and stride time(F(2,24)=8.844, p=0.001) (see Fig. 1). Further comparisons be-tween the groups for the internally cued condition revealed that theWS group demonstrated a greater increase in variability of speedrelative to the controls (F(1,16)=10.076, p=0.006). The WS groupalso showed a greater increase in stride time variability relative to thecontrols during the internally cued condition (F(1,16)=12.300,p=0.003). There were no other significant differences in adaptationof gait variability between DS and control groups or between WS andDS groups in both internally and externally cued conditions.
6. Discussion
In the current study, we compared the spatiotemporal gaitpatterns of individuals with WS, individuals with DS, and typicallydeveloping adult controls, when adjusting their gait to external orinternal cues to increase stride length. The gait variables wereinterpreted in terms of a ratio of cued to preferred walking. Thisratio provides a reference point that represents the magnitude anddirection of change from baseline. In addition, the current study testedthe degree to which individuals with WS and DS could achieve thecriterion stride length in the presence of external and internal cues,and whether gait could be improved to approximate normal gaitpatterns. The results of the current study do not support thehypothesis that WS individuals would show improvement in gaitthat resembles patients with PD, when using cues to increase theirstride length. Overall, the results indicate that the WS group werecharacterized by greater difficulty walking with cues relative tocontrols, with a greater reduction in both gait speed and cadencewhen adjusting to external cues, and reduced speed and increasedgait variability when using internal cues. To utilize external andinternal cues, and thus to achieve the criterion stride length similar tothe DS group and controls, individuals withWS needed to adjust othergait variables such as speed and cadence. In addition, these specificgait measures were differentially affected by externally vs internallycued movements in WS.
In summary, neither external nor internal cues appeared to beeffective in improving the overall spatiotemporal gait patterns inindividuals with WS. In contrast, the DS group did not show anysignificant differences in the ratio of cued to baseline walking for bothspeed and cadence relative to controls, although there was a non-significant trend for greater difficulty in adjusting both speed andcadence during cued walking in the DS group. Thus it should beacknowledged that these findings may not necessarily reflect morepreserved gait regulation in DS, but rather may indicate moreprofound deficits in both externally and internally guidedmovementsin individuals with WS relative to controls. However, all groups wereable to achieve the criterion stride length with reasonable accuracyand, at least for stride length, both external and internal cues wereeffective in normalizing gait. In our previous study we found that,during unobstructed walking at different speeds, the regulation ofstride length seemed to be impaired in adults withWS, with increasedcadence used as a compensatory strategy for reduced stride length [7].However, the results of the current study indicate that individualswithWS are able to utilize external or internal cues to normalize theirstride length; nevertheless, gait function was not normalized in thesame way as has previously been observed in PD patients, withgreater reduction in other gait parameters such as speed and cadencein the WS group. These results are therefore not consistent with aparkinsonian gait pattern, and suggest that deficits in more wide-
spread visuomotor regions are likely to be responsible for theabnormalities of gait in affected individuals.
Another important finding in the current study was the reducedspeed and increased intra-individual variability in speed and stridetime in individuals with WS, at least during internally cued move-ments, when compared to controls. Increased variability in stride timehas been reported previously in PD patients [33] and cerebellar ataxia[34]. However, temporal variability in gait has been shown to be amore defining characteristic of cerebellar dysfunction [35]. Thefinding of increased CoV of speed in individuals with WS may alsobe considered an indicator of neurobiological dysfunction [36], asintra-individual variability is a measure of the ability to produceconsistent performance across steps within the same task.
However, an alternative explanation for the slowing in gait speedand increased gait variability inWSduring internally guidedmovementmay be that such individuals exhibit deficits in executive function andattention [37,38]. Arguably, internally generated movements are morecomplex, requiring increased allocation of attention and executivecontrol that would be required to update the motor plan continuously.In agreement with this hypothesis, increased activation of thedorsolateral prefrontal cortex and anterior cingulate cortex has beendemonstrated during internally vs externally generated movements[39]. In functional terms, the current findings are consistent with morerecent evidence of increased variability in stride time, observed inpatients with dementia of the Alzheimer's type, with gait variabilityshowing an association with the degree of impairment in executivefunction in these patients [40]. Thus, in our WS group, the increasedcognitive processing associated with internally generated movementsmay compete for attentional allocationwith the automaticmotor taskofwalking, thereby exceeding limited attentional resources.
Movements generated by externally guided stimuli involvedifferent pathways from movements involved in internally guidedactions [41,42]. The role that the dorsal visual stream plays inmediating sensory-motor transformations for externally guidedmovements has been well documented [43]. Dorsal stream deficitsmay represent the neural basis for the greater deterioration in gaitfunction when movements are externally generated in individualswith WS. Indeed, both behavioural [4,37,44,45] and neuroimagingstudies [3,20,21] have provided evidence for specific dysfunction inthe dorsal visual stream in WS.
In contrast, internally generated movements are associated withgreater activation in regions typically associated with cognitiveoperations when compared to movements in response to externalfeedback [39,41,42]. Behavioural evidence in children with WSindicates specific weaknesses in the executive control of behaviourwithin the visuospatial domain [37]; reduced activation has beenfound in regions subserving such cognitive operations inWS includingthe dorsolateral prefrontal and anterior cingulate cortex [46]. Thisevidence implies that the neural basis for the deficits in the internalregulation of movement, involving greater utilisation of attention andexecutive control, is likely to be associated with specific impairmentswithin the fronto-parietal circuits in individuals with WS [37].
A possible explanation for the greater difficulty in adjusting tovisual cues during walking in the WS group relative to controls mayrelate to the distinct neurological profile of individuals with WS. Onneurological testing, Trauner et al. [47] found greater impairment inboth gross and fine motor coordination and cerebellar functions inchildren with WS when compared to age and IQ-matched childrenwith DS. However, in imaging studies cerebellar volume has beenshown to be relatively preserved inWS [13]; in contrast, in individualswith DS, cerebellar size has been found to be reduced, whereas thevolume of the basal ganglia is preserved [15,16]. It is not entirely clearfrom these findings what contribution the cerebellum might make tothe additional deficits in adapting gait to external cues in WS.
There are several limitations to this study. Firstly, the sample sizewas small in the current study; however, this study has demonstrated
62 D.R. Hocking et al. / Journal of the Neurological Sciences 291 (2010) 57–63
the distinct advantages of instrumented gait analysis in detectingsubtle changes in gait function in rare genetic disorders. Nevertheless,future research should overcome the inherent constraints on samplesize in gait studies in WS by conducting larger-scale studies in bothchildren and adults with WS. Secondly, the low tone and ligamentouslaxity, common in individuals with DS, might have affected theadaptive gait parameters in this group [30]. These biomechanicallimitations may have contributed to unique gait adaptation tomaintain stability—specifically reduced gait speed across all condi-tions. Indeed, individuals with WS show their own unique musculo-skeletal limitations including hypotonia and joint limitation, whichmay affect gait function; although, in the current study, WS partici-pants with severe joint contractures were excluded. Finally, a directcomparison of auditory and visual cues would have been helpful indetermining whether individuals with WS show specific deficits inexternally vs internally guided movement. Future studies couldemploy rhythmic auditory cueing techniques, such as the use of ametronome, to determine whether the abnormal alterations in gaitspeed and variability could be improved in individuals with WS.
The empirical findings from this study support the clinical observa-tion that individuals with WS show abnormalities in adaptive gaitpatterns, such as when descending stairs or walking across unevensurfaces [5,8]. The current study found that, for individuals withWS, theexternal visual cueswere not effective in improving gaitwhen comparedto typically developing adult controls. Furthermore, internally generatedmovement was associated with reduced speed and increased gaitvariability, suggestive of impairment in fronto-parietal circuits in WS.Thesefindings imply that the viability of alternative processingpathwaysfor externally and internally guided movement is substantially reducedin individuals with WS, and this difficulty may involve deficits withinfronto-parietal regions that underpin the unique gait patterns in WS.
Acknowledgements
This research was supported by an Australian Postgraduate Awardto D.R. Hocking. We thank theWilliams Syndrome Family Support Group(Victoria), Genetic Health Services Victoria for contactingWS participants,and theWS familieswhowillingly gave their time and continue to supportour research. We gratefully acknowledge Prof. Bruce Tonge and thesupport staff from the Australian Child to Adult Development Study(ACAD)atMonashUniversity for recruitmentofDSparticipants, andall theresearch participants for their assistancewith the study.We are grateful toDr. John Taffe for statistical advice on an earlier version of themanuscript.
References
[1] Stromme P, Bjornstad PG, Ramstad K. Prevalence estimation of Williamssyndrome. J Child Neurol 2002;17:269–71.
[2] Mervis CB, Klein-Tasman BP. Williams syndrome: cognition, personality, andadaptive behaviour. Ment Retard Dev Disabil Res Rev 2000;6:148–58.
[3] Meyer-Lindenberg A, Kohn P, Mervis CB, Kippenhan JS, Olsen RK, Morris CA,Berman KF. Neural basis of genetically determined visuospatial constructiondeficit in Williams syndrome. Neuron 2004;43:623–31.
[4] Atkinson J, King J, Braddick O, Nokes L, Anker S, Braddick F. A specific deficit ofdorsal stream function in Williams syndrome. NeuroReport 1997;8(8):1919–22.
[5] Van der Geest JN, Lagers-van Haselen GC, van Hagan JM Brenner E, Govaerts LCP,de Coo IFM Frens MA. Visual depth processing in Williams–Beuren syndrome. ExpBrain Res 2005;166:200–9.
[6] Elliott D,Welsh TN, Lyons J, Hansen S,WuM. The visual regulation of goal-directedreaching movements in adults with Williams syndrome, Down syndrome, andother developmental delays. Motor Control 2006;10:34–54.
[7] Hocking DR, Rinehart NJ, McGinley J, Bradshaw JL. Gait function in adults withWilliams syndrome. Exp Brain Res 2009;192(4):695–702.
[8] Withers S. A new clinical sign in Williams syndrome. Arch Dis Child 1996;75:89.[9] Morris ME, Iansek R, Matyas A, Summers JJ. Ability to modulate walking cadence
remains intact in PD. J Neurol Neurosurg Psychiatry 1994;57:1532–4.[10] Morris ME, Iansek R, Matyas A, Summers JJ. Abnormalities in the stride length–
cadence relation in Parkinsonian gait. Mov Disord 1998;13:61–9.[11] Bellugi U, Mills D, Jernigan T, Hickok G, Galaburda A. Linking cognition, brain
structure, and brain function in Williams syndrome. In: Tager-Flusberg H, editor.Neurodevelopmental disorders. Cambridge: MIT Press; 1999. p. 111–36.
[12] Chiang MC, Reiss AL, Lee AD Bellugi U, Galaburda AM, Korenberg JR Mills DL, TogaAW Thompson PM. 3-D pattern of brain abnormalities in Williams syndromevisualized using tensor-based morphometry. NeuroImage 2007;36:1096–109.
[13] Jernigan JL, Bellugi U, Sowell E, Doherty S, Hesselink JR. Cerebral morphologicdistinctions betweenWilliams and Down syndromes. Arch Neurol 1993;50:186–91.
[14] Reiss AL, Eliez S, Schmitt EJ, Straus E, Lai Z, Jones W, Bellugi U. Neuroanatomy ofWilliams syndrome: a high-resolutionMRI study. J CognNeurosci 2000;12(suppl 1):65–73.
[15] Pinter D, Eliez S, Schmitt JE, Capone GT, Reiss AL. Neuroanatomy of Down'ssyndrome: a high-resolution MRI study. Am J Psychiatry 2001;158(10):1659–65.
[16] White NS, Alkire MT, Haier RJ. A voxel-based morphometric study of nondementedadults with Down syndrome. NeuroImage 2003;20:393–403.
[17] Jones W, Hesselink J, Courschesne E, Duncan T, Matsuda K, Bellugi U. Cerebellarabnormalities in infants and toddlers with Williams syndrome. Dev Med ChildNeurol 2002;44:688–94.
[18] Wang PP, Hesselink JR, Jernigan TL, Doherty S, Bellugi U. Specific neurobehavioralprofile of Williams syndrome is associated with neocerebellar hemisphericpreservation. Neurology 1992;42:1999–2002.
[19] Rae C, Karmiloff-Smith A, Lee MA, Dixon RM, Grant J, Blamire AM, Thompson CH,Styles P, Radda GK. Brain biochemistry in WBS: evidence for the role of thecerebellum in cognition? Neurology 1998;51:33–40.
[20] Boddaert N, Mochel F, Meresse I, Seidenwurm D, Cachia A, Brunelle F, Lyonnet S,Zilbovicius M. Parieto-occipital grey matter abnormalities in children withWilliams syndrome. NeuroImage 2006;30:721–5.
[21] Eckert MA, Hu D, Eliez S, Bellugi U, Galaburda A, Korenberg J, Mills D, Reiss AL.Evidence for superior parietal impairment inWilliams syndrome. Neurol 2005;64:152–3.
[22] Arias P, Cudeiro J. Effects of rhythmic sensory stimulation (auditory, visual) on gaitin Parkinson's disease patients. Exp Brain Res 2008;186:589–601.
[23] Lewis GN, Byblow WD, Walt SE. Stride length regulation in Parkinson's disease:the use of extrinsic, visual cues. Brain 2000;123:2077–90.
[24] StolzeH, Kuhtz JP, DruckeH, Johnk K, IllertM, Deuschl G. Comparative analysis of thegait disorder of normal pressure hydrocephalus and Parkinson's disease. J NeurolNeurosurg Psychiatry 2001;70:289–97.
[25] Suteerawattananon M, Morris GS, Etnyre BR, Jankovic J, Protas EJ. Effects of visualand auditory cues on gait in individuals with Parkinson's disease. J Neurol Sci2004;219:63–9.
[26] Azulay J, Mesure S, Blin O. Influence of visual cues on gait in Parkinson's disease:contribution to attention or sensory dependence. J Neurol Sci 2006;248:192–5.
[27] Morris ME, Iansek R, Matyas A, Summers JJ. Stride length regulation in Parkinson'sdisease: normalization strategies and underlying mechanisms. Brain 1996;119:551–68.
[28] Hanakawa T, Fukuyama H, Katsumi Y, Honda M, Shibasaki H. Enhanced lateralpremotor activity during paradoxical gait in Parkinson's disease. Ann Neurol1999;45:329–36.
[29] Azulay J, Mesure S, Amblard B, Blin O, Sangla I, Pouget J. Visual control oflocomotion in Parkinson's disease. Brain 1999;122:111–20.
[30] Smith BA, Ulrich BD. Early onset of stabilizing strategies for gait and obstacles:older adults with Down syndrome. Gait Posture 2008;28(3):448–55.
[31] Einfeld SL, Piccinin AM, MacKinnon A, Hofer SM, Taffe J, Gray KM, Bontempo DE,Hoffman LR, Parmenter T, Tonge BJ. Psychopathology in young people withintellectual disability. JAMA 2006;296(16):1981–9.
[32] Gabell A, Nayak US. The effect of age on variability in gait. J Gerontol 1984;39:662–6.
[33] Hausdorff JM, Cudkowicz ME, Firtion R. Gait variability and basal gangliadisorders: stride-to-stride variations of gait cycle timing in Parkinson's diseaseand Huntington's disease. Mov Disord 1998;13:428–37.
[34] Ebersbach G, Sojer M, Valldeoriola F, Wissel J, Muller J, Tolosa E, Poewe W.Comparative analysis of gait in Parkinson's disease, cerebellar ataxia and subcorticalarteriosclerotic encephalopathy. Brain 1999;122:1349–55.
[35] Ilg W, Golla H, Thier P, Biese MA. Specific influences of cerebellar dysfunction ongait. Brain 2007;130:786–98.
[36] De Frias CM, Dixon RA, Fisher N, Camicioli R. Intraindividual variability in neuro-cognitive speed: a comparison of Parkinson's disease and normal older adults.Neuropsychologia 2007;45:2499–507.
[37] Atkinson J, Braddick O, Anker S, Curran W, Andrew R, Wattam-Bell J, Braddick F.Neurobiological models of visuo-spatial cognition in young Williams syndromechildren: measures of dorsal-stream and frontal function. Dev Neuropsychol2003;23:139–72.
[38] Kittler PM, Krinsky-McHale SJ, Devenny DA. Dual-task processing as a measure ofexecutive function: a comparison between adults with Williams and Downsyndromes. Am J Ment Retard 2008;113(2):117–32.
[39] Weeks RA, Honda M, Catalan MJ, Hallett M. Comparison of auditory, somatosen-sory, and visually instructed and internally generated finger movements: a PETstudy. NeuroImage 2001;14:219–30.
[40] Allali G, Assal F, Kressig RW, Dubost V, Herrmann FR, Beauchet O. Impact of impairedexecutive function on gait stability. Dement Geriatr Cogn Disord 2008;26:364–9.
[41] Debaere F, Wendoroth N, Sunaert S, Van Hecke P, Swinnen SP. Internal vs externalgeneration of movements: differential neural pathways involved in bimanualcoordination performed in the presence or absence of augmented visual feedback.NeuroImage 2003;19:764–76.
[42] Heuninckx S, Wenderoth N, Swinnen SP. Age-related reduction in the differentialpathways involved in internal and external movement generation. NeurobiolAging 2010;31(2):301–14.
[43] Milner AD, Goodale MA. The visual brain in action. New York: Oxford UniversityPress; 1995.

63D.R. Hocking et al. / Journal of the Neurological Sciences 291 (2010) 57–63
[44] Atkinson J, Braddick O, Rose FE, Searcy YM, Wattam-Bell J, Bellugi U. Dorsal-stream motion processing deficits persist into adulthood in Williams syndrome.Neuropsychologia 2006;44(5):828–33.
[45] Dilks DD, Hoffman JE, Landau B. Vision for perception and vision for action: normaland unusual development. Dev Sci 2008;11(4):474–86.
[46] Mobbs D, Eckert MA, Mills D, Korenberg J, Bellugi U, Galaburda AM, Reiss AL.Frontostriatal dysfunction during response inhibition in Williams syndrome. BiolPsychiatry 2007;62:256–61.
[47] TraunerDA, Bellugi U, Chase C. Neurologic features ofWilliams andDown syndrome.Pediatr Neurol 1989;5:166–8.