An Economic Cost Benefit Analysis of Internal and External Warehouses in Food Retail Industry
106
An Economic Cost Benefit Analysis of Internal and External Warehouses in Food Retail Industry By Vikas Mehrotra BE. Mechanical. Engineering (1996) Regional Engineering College, Allahabad (India) MS., Industrial Engineering (2000) University of Wisconsin, Madison (USA) Submitted to the Department of Center of Transportation and Logistics in partial fulfillment of the requirements for the degree of Master of Engineering in Logistics at the Massachusetts Institute of Technology June 2003 © 2003 Vikas Mehrotra All Rights Reserved The author hereby grants to MIT permission to reproduce and to distribute publicly paper and electronic copies of this thesis document in whole or in part. Signature of the Author................................. ...................... Center for Transportation and Logistics Engineering Systems Division May 9, 2003 C ertified by......................... ................... James M. Masters Executive Direct, Master of Engineering in LogistW Program 111 T is Advisor A ccepted by..................................... .............. y, - Yossi Sheffi MASSACHUSETS INS EProfessor of Civil & Environmental Engineering OFA TECHNOLEY Co-Director, Center for Transportation and Logistics JUL 2 7 2004 LIBRARIES BARKER
-
Upload
independent -
Category
Documents
-
view
0 -
download
0
Transcript of An Economic Cost Benefit Analysis of Internal and External Warehouses in Food Retail Industry
An Economic Cost Benefit Analysis of Internal and External
Warehouses in Food Retail Industry
By
Vikas MehrotraBE. Mechanical. Engineering (1996)
Regional Engineering College, Allahabad (India)MS., Industrial Engineering (2000)
University of Wisconsin, Madison (USA)
Submitted to the Department of Center of Transportation and Logistics inpartial fulfillment of the requirements for the degree of
Master of Engineering in Logistics
at the
Massachusetts Institute of Technology
June 2003
© 2003 Vikas MehrotraAll Rights Reserved
The author hereby grants to MIT permission to reproduce and to distribute publicly paper andelectronic copies of this thesis document in whole or in part.
Signature of the Author................................. ......................Center for Transportation and Logistics
Engineering Systems DivisionMay 9, 2003
C ertified by......................... ...................James M. Masters
Executive Direct, Master of Engineering in LogistW Program111 T is Advisor
A ccepted by..................................... ..............
y, - Yossi SheffiMASSACHUSETS INS EProfessor of Civil & Environmental Engineering
OFA TECHNOLEY Co-Director, Center for Transportation and Logistics
JUL 2 7 2004
LIBRARIES BARKER
1 Abstract
In today's supermarket world, consumers apart from demanding 'higher and higher quality at
lower and lower prices', want more and more product choices. This has put tremendous pressure
on supermarkets and their infrastructure. With better information technology, forecasting
techniques, planning tools, demand fulfillment and supplier relationships supermarkets can meet
the rising demand much better than ever before. But inorder to meet this demand at the lowest
price they need to rethink their inbound logistics and re-optimize their warehouses. This has
spurred a growth in warehousing outsourcing. The study is concerned with evaluating the cost
benefit between the internal and the external warehousing for the food retail industry, while
addressing the following issues:
1. Advantages and disadvantages of an internal and external warehouse.
2. Importance of alignment of logistics strategy and corporate strategy.
3. Vendor items which should be outsourced or insourced
The study was conducted by evaluating the economic value for fifteen different vendors of a
regional supermarket chain with the objective to help the supermarket chain reassess its
warehousing strategy.
1-2
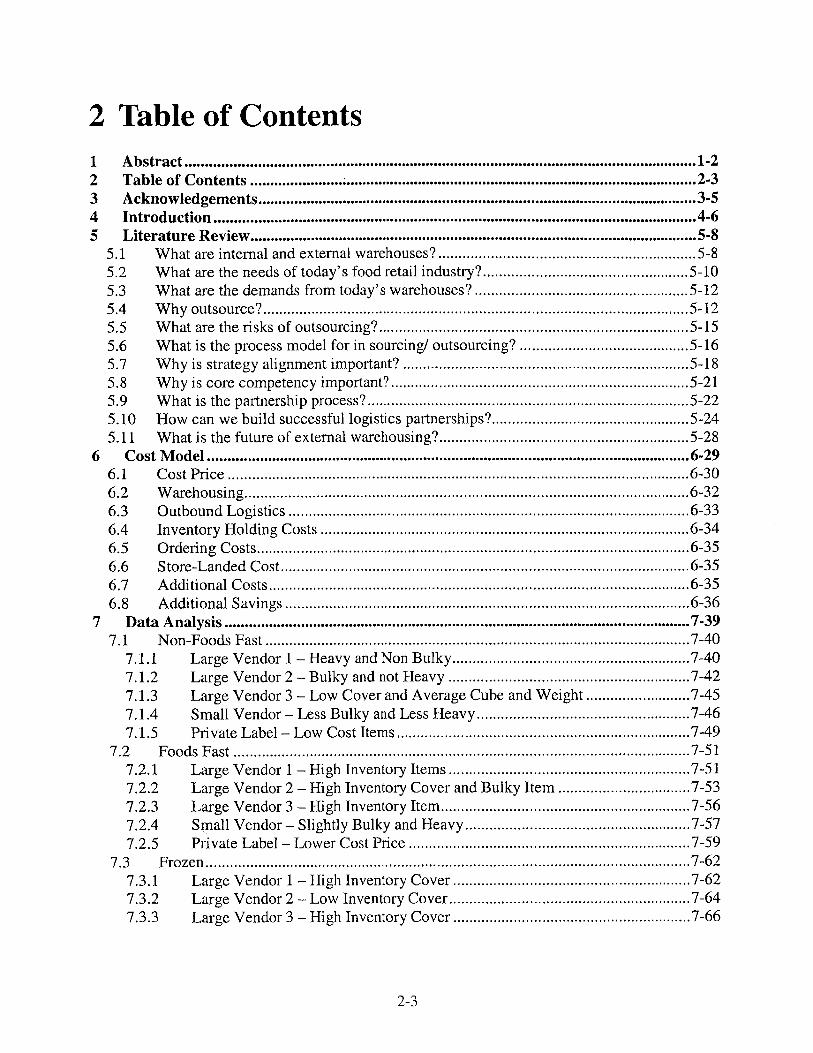
2 Table of ContentsI Abstract...............................................................................................................................1-22 Table of Contents ............................................................................................................... 2-33 Acknowledgem ents.............................................................................................................3-54 Introduction........................................................................................................................4-65 Literature Review ............................................................................................................... 5-8
5.1 W hat are internal and external warehouses?................................... . . . . . . . . . . . . .. . . . . . .. . . . . . . . . 5-85.2 W hat are the needs of today's food retail industry9 ............................ . . . . . .. . . .. . . . . . . .. . . . . 5-105.3 W hat are the dem ands from today's warehouses?............................. . . . . . . . . . . . . . . . . . .. . . . . . 5-125.4 W hy outsource? .......................................................................................................... 5-125.5 W hat are the risks of outsourcing?........................................... . . . . . . . . . . . . . . . . . . . . . . . . . . . . . . . . . .5-155.6 W hat is the process m odel for in sourcing/ outsourcing? .......................................... 5-165.7 W hy is strategy alignm ent im portant? ....................................... . . . . . . . . . . . . . . . . . . . . . . . . . . . . . . . .5-185.8 W hy is core com petency im portant?......................................... . . . . . . . . . . . . . . . . . . . . . . . . . . . . . . . . .5-215.9 W hat is the partnership process?............................................. . . . . . . . . . . . . . . . . . . . . . . . . . . . . . . . . . . .5-225.10 How can we build successful logistics partnerships?.................................................5-245.11 W hat is the future of external warehousing?................................... . . . . . . . . . . . . . . . . . . . . . . . . . . .5-28
6 Cost M odel........................................................................................................................6-296.1 Cost Price ................................................................................................................... 6-306.2 W arehousing...............................................................................................................6-326.3 Outbound Logistics .................................................................................................... 6-336.4 Inventory Holding Costs ............................................................................................ 6-346.5 Ordering Costs............................................................................................................6-356.6 Store-Landed Cost......................................................................................................6-356.7 Additional Costs.........................................................................................................6-356.8 Additional Savings ..................................................................................................... 6-36
7 Data Analysis .................................................................................................................... 7-397.1 Non-Foods Fast .......................................................................................................... 7-40
7.1.1 Large Vendor 1 - Heavy and Non Bulky...........................................................7-407.1.2 Large Vendor 2 - Bulky and not Heavy ............................................................ 7-427.1.3 Large Vendor 3 - Low Cover and Average Cube and Weight .......................... 7-457.1.4 Sm all Vendor - Less Bulky and Less Heavy.....................................................7-467.1.5 Private Label - Low Cost Item s ......................................................................... 7-49
7.2 Foods Fast .................................................................................................................. 7-517.2.1 Large Vendor 1 - High Inventory Item s ............................................................ 7-517.2.2 Large Vendor 2 - High Inventory Cover and Bulky Item ................................. 7-537.2.3 Large Vendor 3 - High Inventory Item .............................................................. 7-567.2.4 Sm all Vendor - Slightly Bulky and Heavy........................................................7-577.2.5 Private Label - Lower Cost Price ...................................................................... 7-59
7.3 Frozen.........................................................................................................................7-627.3.1 Large Vendor 1 - High Inventory Cover ........................................................... 7-627.3.2 Large Vendor 2 - Low Inventory Cover............................................................7-647.3.3 Large Vendor 3 - High Inventory Cover ........................................................... 7-66
2-3
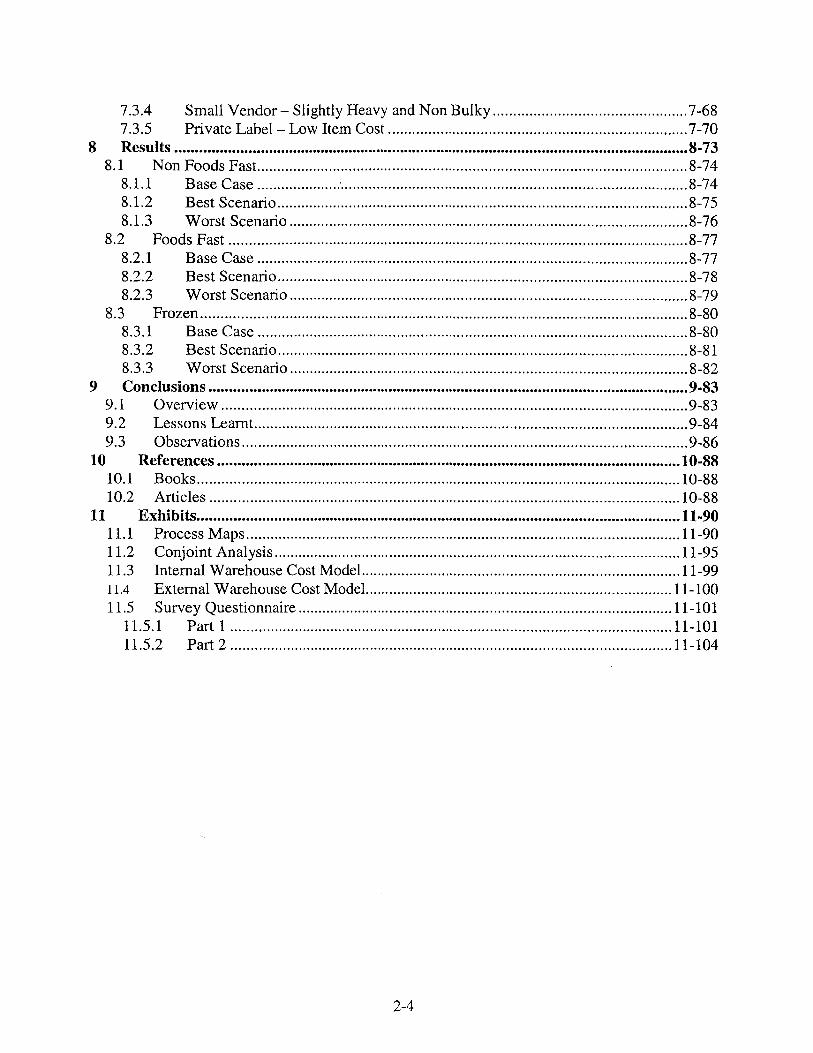
7.3.4 Sm all Vendor - Slightly Heavy and N on Bulky ................................................ 7-687.3.5 Private Label - Low Item Cost .......................................................................... 7-70
8 Results ............................................................................................................................... 8-738.1 Non Foods Fast ........................................................................................................... 8-74
8.1.1 Base Case ............................................................................................................ 8-748.1.2 Best Scenario ...................................................................................................... 8-758.1.3 W orst Scenario ................................................................................................... 8-76
8.2 Foods Fast .................................................................................................................. 8-778.2.1 Base Case ........................................................................................................... 8-778.2.2 Best Scenario ...................................................................................................... 8-788.2.3 W orst Scenario ................................................................................................... 8-79
8.3 Frozen ......................................................................................................................... 8-808.3.1 Base Case ........................................................................................................... 8-808.3.2 Best Scenario ...................................................................................................... 8-818.3.3 W orst Scenario ................................................................................................... 8-82
9 Conclusions ....................................................................................................................... 9-839.1 Overview .................................................................................................................... 9-839.2 Lessons Learnt ............................................................................................................ 9-849.3 Observations ............................................................................................................... 9-86
10 References ................................................................................................................... 10-8810.1 Books ........................................................................................................................ 10-8810.2 Articles ..................................................................................................................... 10-88
11 Exhibits ........................................................................................................................ 11-9011.1 Process M aps ............................................................................................................ 11-9011.2 Conjoint Analysis ..................................................................................................... 11-9511.3 Internal W arehouse Cost M odel ............................................................................... 11-9911.4 External W arehouse Cost M odel ............................................................................ 11-10011.5 Survey Questionnaire ............................................................................................. 11-101
11.5.1 Part I .............................................................................................................. 11-10111. 5.2 Part 2 .............................................................................................................. 11-104
2-4
3 Acknowledgements
I am greatly indebted to MIT and the regional supermarket chain for providing me with this
learning opportunity. Although, a lot of people have helped me with my thesis I would specially
like to thank Dr. Jim Masters, Dr. Jonathan Byrnes for providing me valuable insights into the
subject; Jonathan Fleck for being a constant source of encouragement and for successfully
steering the partner's thesis program. I will also like to thank Mike Lech, Eddie Rodricks and
Mike Griswold from the supermarket chain for enthusiastically supporting my work. This thesis
would not have seen the light of day if not for their commitment and time. Last but not the least,
my special thanks to Jim Holland who has helped me tremendously with the data collection. If
not for his hard work the task could not have been completed. To all of you, I am deeply
indebted.
3-5
4 Introduction
In today's increasing price competitive supermarkets, and growing customizations demanded by
customers the warehouses are asked to process smaller orders with increased frequency, handle
more end items, and provide more value added services. This in turn results in increased returns.
Today's warehouses apart from processing more returns have to process more international
orders. At the same time they have lesser time to process an order, less margin for error and high
turnovers.
These are some of the extensive and strong motives for why companies are outsourcing their
warehousing activities although they know that they risk loss of control. Outsourcing is not a
short-term decision; rather it is a long-term relationship commitment. And the rational behind
outsourcing can be justified as a focused business strategy, which can be anyone from the one's
listed below -
# Focusing on core competencies
& Avoiding/ reducing capital expenditures
& Increasing service flexibility
& Cutting costs
& Accessing new processes, ideas and technologies
# Acquiring expertise
o Increasing productivity and efficiency
4-6
9 Gaining logistics leverage
' Avoiding labor issues
# Improving service performance
A successful outsourcing program focuses on cost management, partnership building and
customer satisfaction. The thesis analyzes the strategic, operational and financial implication of
outsourced distribution for a regional supermarket chain. The interest of the study consists of
knowing the smarter way to choose between market reliance and vertical integration by
answering the following questions -
# Which food categories should be outsourced?
# How deeply should they be outsourced?
8 To whom they should be outsourced?
# What logic should drive these decisions?
4-7

5 Literature Review
Goods produced at various manufacturing plants, located at various geographic locations, are
sent to warehouses where they are consolidated and then distributed to various food retail outlets
so as to offer food retailers a full line of merchandise from a single point. Warehouses also save
a lot in transportation cost by sending large shipments rather than small especially when the
market is fairly far away. Thus resulting in increased operational efficiency and improved service
in the supply chain. A warehouse could be broadly classified into two kinds an internal
warehouse and an external warehouse.
5.1 What are internal and external warehouses?
An internal or a private Warehouse is one in which the building, labor and equipment are
controlled by the warehouse user. An internal warehouse offers advantages such as total control
on the exclusive usage of the warehouse and a real estate investment that may increase in value.
Also, there is total decision making capability and an absolute flexibility towards expansion or
addition of specialized equipments to the building. On the other hand the disadvantage with the
internal warehouse is that if the capacity needs to be shrunk, or if there is a strike in the
warehouse. A fixed warehouse does not offer the flexibility of relocation. They are built with a
long time commitment. This inflexibility may cause difficulty in changing times.
Ackerman et al. Understanding today's Distribution Center
5-8
An independent contractor manages an external DC, who controls the building, its labor, and the
materials handling equipment. It is marked by absence of long-term customer contracts2 . There
are many advantages offered by an external warehouse. The most important is that the user does
not own the warehouse and therefore has the highest degree of external freedom. He can expand
or contract his service and space on a short notice and with rapidly changing times. There is
greater operational efficiency as the owner has the specialization. Higher productivity can also be
achieved as the managers gain time by not having to manage the warehouse operations. They can
therefore devote more of their time towards their other responsibilities. The disadvantage with
this kind of understanding is that prices of goods are slightly higher than otherwise, as a
premium is paid for the higher flexibility and lower fixed asset ownership. Also, one may suffer
a quality setback if the warehouse owners get relaxed for example it is seen that many external
warehouses, which offered specialized facilities earlier are offering more general-purpose
facilities. This is because of the risk factor associated with specialized facilities. Another
disadvantage could be lack of availability at places where one would want them to be.
There is a special kind of external warehouse that can be considered more as an extension to
internal warehouse than of an external warehouse. Also, from the thesis's point of view it will be
considered as an internal warehouse. I have mentioned this separately so as to capture the
distinction between 'these kinds' of warehouses and the external warehouse. These warehouses
are called as contract warehouses. They have longer formal agreement between the user and the
owner as compared to the external warehouses. They offer increased control over the warehouse
management, labor and other resources. The disadvantage with the contract is that like internal
2 Ackerman et al. Understanding today's Distribution Center
5-9
warehouses it limits degrees of freedom. The user cannot move his warehouse to other locations,
cut back on space or add space when conditions change. But unlike internal warehouses some
flexibility can be written into the contract.
Thus the tradeoff when deciding between an internal and an external warehouse is between total
flexibility and total control. I will look deeply into the cost and the service level at which the
flexibility and control are achieved. This along with the alignment with the core strategy should
be the deciding factor for a food retailer to choose between an internal and external warehouse.
5.2 What are the needs of today's food retail industry?
The rood retail industry is undergoing structural changes as they are facing more and more
competition from value grocers like Wal-Mart. Increasing technological advances let today's
food retailer have a more global presence, some food retailers have online shopping and home
deliveries. Today's customers want more item preferences this has put tremendous pressure on a
company's supply chain. Customers want more convenience, better in-store experience, high
quality fresh foods, improved in-stocks and better merchandise presentation. This all leads to a
more compelling shopping experience and thus leading to higher sales productivity. In a nutshell
we can see the conflicting functional objectives and their impact on each other in Table 1.
The table shows the impact of the functional objectives on the inventory, customer service and
the total costs, which are the most important value measures for their supply chain. So we see
that high customer service, which is highly desirable results in higher inventory and higher total
5-10
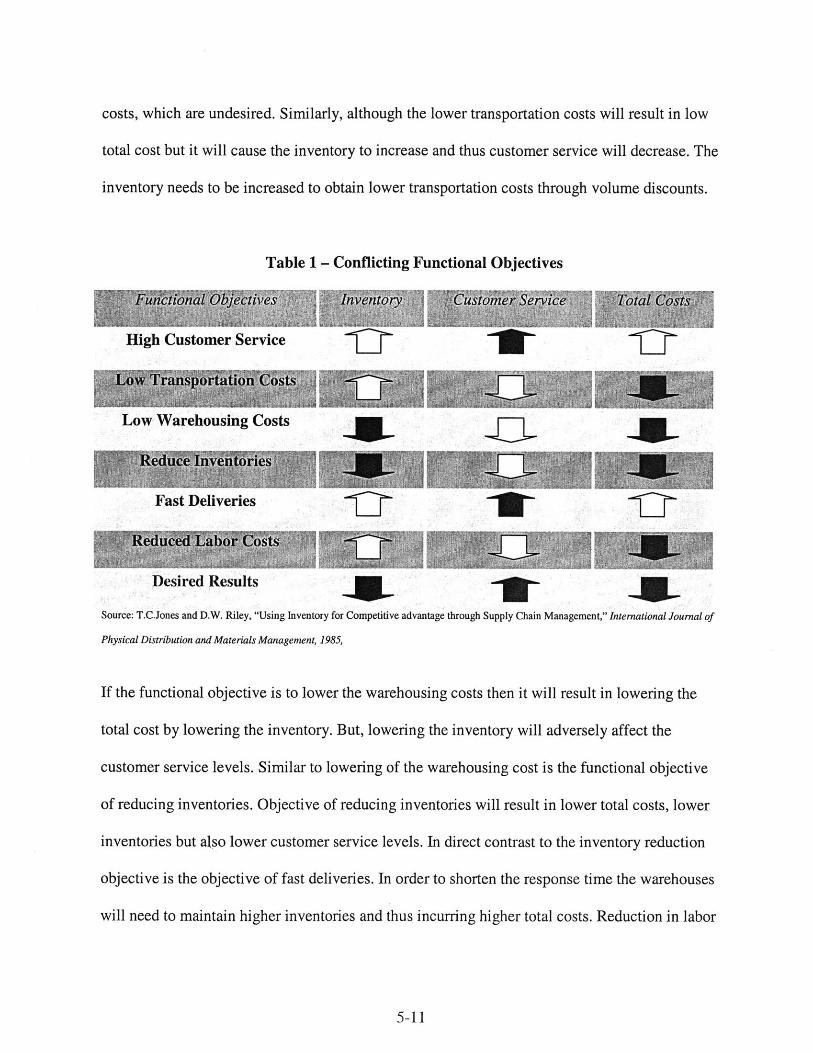
costs, which are undesired. Similarly, although the lower transportation costs will result in low
total cost but it will cause the inventory to increase and thus customer service will decrease. The
inventory needs to be increased to obtain lower transportation costs through volume discounts.
Table 1 - Conflicting Functional Objectives
Funcinal bjectves nventory' Customer Service TtlCs
High Customer Service
Low Warehousing Costs
educe Inve >cries A
Fast Deliveries
Desired Results
Source: T.C.Jones and D.W. Riley, "Using Inventory for Competitive advantage through Supply Chain Management," International Journal of
Physical Distribution and Materials Management, 1985,
If the functional objective is to lower the warehousing costs then it will result in lowering the
total cost by lowering the inventory. But, lowering the inventory will adversely affect the
customer service levels. Similar to lowering of the warehousing cost is the functional objective
of reducing inventories. Objective of reducing inventories will result in lower total costs, lower
inventories but also lower customer service levels. In direct contrast to the inventory reduction
objective is the objective of fast deliveries. In order to shorten the response time the warehouses
will need to maintain higher inventories and thus incurring higher total costs. Reduction in labor
5-11
costs results in the increase in inventory, a decrease in the customer service and a total cost
decrease. As seen from the table none of the above functional objectives lead us to our desired
goals. So the need is to strike a balance between lower total costs, lower inventory and higher
customer service. These demands at the store level have put pressure upstream of the supply
chain specially on the warehousing.
5.3 What are the demands from today's warehouses?
Today warehouses are asked to execute more, smaller transactions; handle and store more items;
provide more product and service customization; offer more value added services; at lower
prices. Thus we see they have to do 'more' for 'less cost'. On the other hand they have lesser
time to process orders, less margin for error, they need to process more returns and they receive
and ship more international orders with lesser assets. Thus we also see that they need to do 'more
service' with 'less'. They have more returns - that decreases their profit margins, more
international orders - which brings in more complexity, if they have less assets - fewer
manpower to run the warehouses, more automation, of material handling and less margin of
error.
5.4 Why outsource?
The demand on the supply chain has put tremendous pressure on the food retailers and in order
to compete in today's market they need to refocus their supply chain strategies. Outsourcing is a
way that helps them derive cost benefits in warehousing, and transportation, and thus reducing
5-12
the cost of sales; such reductions typically are 1-3%3 or could be higher depending on the
product flow characteristics. So let us see from a company's perspective -
Why does the company need to outsource?
What should the company outsource?
There could be various arguments for outsourcing' -
1. Volume argument: As the volume of an item increases - per item logistics cost decreases
since we attain economies of scale and vice versa. So for a food retailer it will be
important to identify the per item logistics costs in various categories - grocery food,
non-food, frozen etc. and then determine the break even point for each of them. So one
possible outcome to this would be that items with volume above the break-even point
could be outsourced and items below the break even could be in sourced. This is
assuming that the cost to outsource is higher than the in source for low volumes. If it is
the other way round then we can in source the high volume items and out source the
lower volume ones.
2. Flexibility argument: This argument is applicable at a higher level. It has much to do with
the strategic positioning of the company. Warehouses, transportation fleets are long lived
and fixed assets. With the ever-changing customer preferences and rapidly growing
technologies the company would want not to tie up its capital in the fixed assets and use
3 The implications of outsourcing, By: Lomas, Paul M. Frozen Food Age, Dec 97, Vol. 46, Issue 5
5-13
the same for growth opportunities. For example add new products, new stores, new
markets and use the flexibility provided by an outsourcer for demand fulfillment.
3. Control argument: Contrary to the flexibility argument it is possible that an item is of
high strategic importance and critical. In such a case it makes more sense to maintain
control over the quality, capacity and product flow. So in other words merchandises that
have unique characteristics and are vital for the company should be in sourced and
merchandises with common characteristics and of less importance should be outsourced.
With in-house capability a company can maintain control over schedules, quality,
capacity, priorities, and security related to the merchandise.
4. Expertise argument: The company should retain and enhance those activities which
represents its core competency and should source out and work with the best sources in
the world for others such as distribution and warehousing of items.
5. Leverage argument: In the same way that a company can create leverage and increase its
ROI (return on investment) by trading on the equity of the firm, they can increase their
ROI by outsourcing an operation, even if its operating costs increase as a result.
Outsourcing operation can take assets, inventory, and personnel off the books. This can
increase the market price of the firm's stock
5-14
5.5 What are the risks of outsourcing"?
The risks and costs of outsourcing are sometimes lost amidst the rhetoric about outsourcing's
benefits. It may appear that economies of scale will reduce costs. The vendor, however, must
earn a profit at its customer's expense. Furthermore, external contracting brings added sales and
transactions costs. Outsourcing converts fixed costs into variable costs, giving the firm greater
financial flexibility but the flip side is that most outsourcing vendors require long-term contracts
that provide them with stable revenues over time. Renegotiating these contracts may be more
expensive than changing internal commitments. If flexibility is the goal, the contract must be
carefully negotiated to allow variability in demand and cost. Demanding this flexibility comes at
a relatively high price.
Outsourcing is supposed to reduce the demand on senior management because a contract is
substituted for direct authority but this rarely proves to be the case. In fact, managing an
outsourcing vendor is no easier (and is often more difficult) than managing an internal logistics
team. If senior management becomes less involved in managing, outsourcing may actually be
counterproductive. It can be argued that vendors are more experienced than internal staff at
running a logistics function. This can be remedied by hiring competent logistics managers as
readily as by hiring an outsourcing vendor. Internal staff members have a history and an
expectation of continuity with the organization that may pay off in a better understanding of the
business and improved partnerships with clients. By contrast, outsourcing vendors may rotate
their staff more easily, since individuals develop loyalties to the outsourcing vendor rather than
one customer organization. The insiders' improved partnership advantage pays off in client
5-15
satisfaction and strategic alignment Long-term employees better understand the clients' culture,
strategies, and politics; and they know they'll be around to deal with the consequences of their
actions. Outsourcing vendors may be sincere about partnership, but ultimately they work for
different shareholders and ethically must (and will) place their shareholders' interests first.
5.6 What is the process model for in sourcing/ outsourcing?
Regardless of the motive for outsourcing decision, in essence a company compares the merits of
retaining logistics in-house as a core competency versus the opportunity afforded by a third party
alliance. But many a times although an outsourcing decision is made, the full leverage and
potential is not attained. In order to maximize the total benefits from a logistics decision a
framework approach using the following process model is suggested.
The process model consists of four focus areas which are the company strategy formulation; in
sourcing / outsourcing decision planning; in sourcing / outsourcing implementation; and
assessment and continuous improvement. In order to have a successful outsourcing strategy and
execution all four processes should be well aligned within themselves and with each other.
5-16
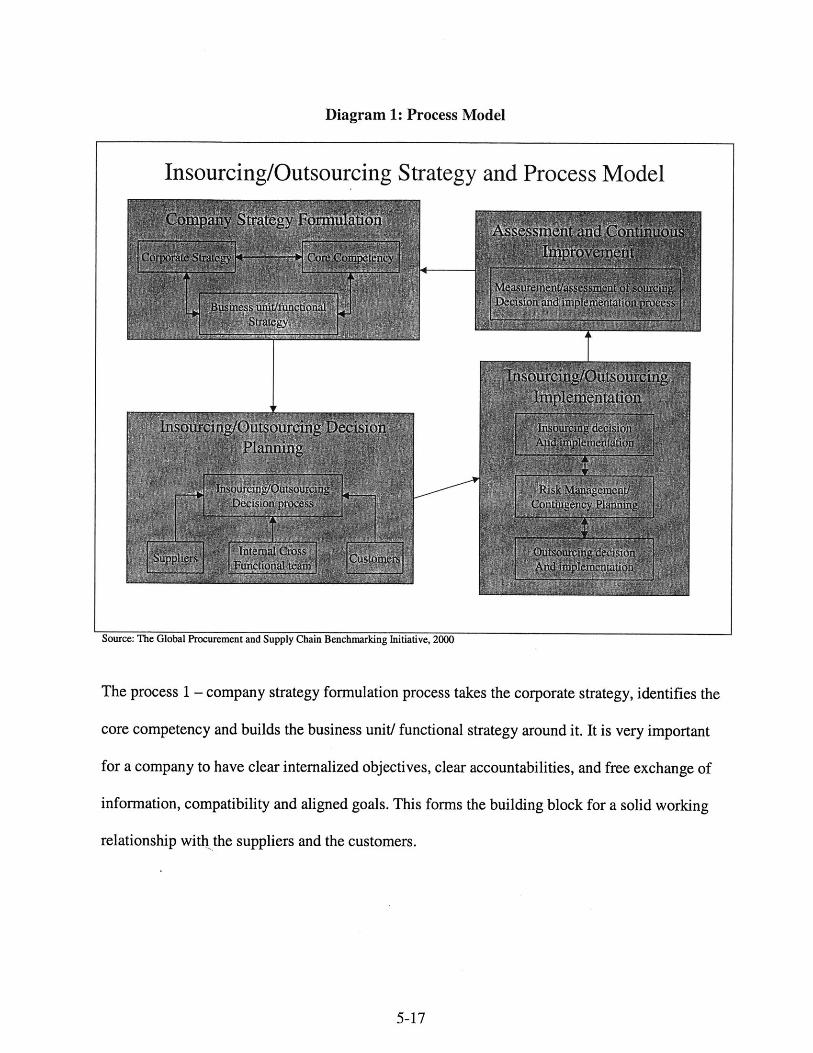
Diagram 1: Process Model
Source: The Global Procurement and Supply Chain Benchmarking Initiative, 2000
The process 1 - company strategy formulation process takes the corporate strategy, identifies the
core competency and builds the business unit/ functional strategy around it. It is very important
for a company to have clear internalized objectives, clear accountabilities, and free exchange of
information, compatibility and aligned goals. This forms the building block for a solid working
relationship with the suppliers and the customers.
5-17
Insourcing/Outsourcing Strategy and Process Model
TI
The process 2 - in sourcing/ outsourcing decision-planning process is done jointly with
suppliers, internal cross-functional team and the customers. The choice of team greatly impacts
the strategy, as area expertise is needed to prepare a detailed sourcing plan. Although, this
process requires a lot of time and in depth analysis, not many companies devote that much
resources and their time and tend to jump to the implementation process at their earliest. These
generally lead to less than fulfilling results. So all businesses should come together at an early
stage to build a comprehensive in sourcing / outsourcing strategy. The third process is the in
sourcing/ outsourcing implementation process. The decisions should be successfully
implemented and well documented. Also, contingency planning and risk management should be
done to prepare the partnership against any unforeseen untoward possibilities. The logistics
partnership should be carefully measured and monitored. The assessment and continuous
improvement process provides the feedback loop to the process 1 and thus a reinforcing
partnership is formed.
5.7 Why is strategy alignment important?
Let us take an example to develop the insight and understand the importance of the alignment of
logistics strategy with the corporate strategy and core competency. The idea here is just to
capture the importance of alignment in strategies and therefore the example is simplistic in
nature. Let us say that in a food retail industry the customers can be classified as follows -
i. The "Single" customer - I think the singles spend their money differently than others and
they would be more interested buying "single-serving" precooked meals.
5-18
ii. The "Family" customer - This is the direct contrast segment of a single customer. They
would interest in buying more raw food for cooking later in the house. Cost will be an
important factor for them and they will be more stable with their purchasing choices.
iii. The "Value" customer - I would like to classify them as the most price sensitive
customers. They would be willing to do self-service if it will lower their grocery costs.
They will also have willingness to selectively down-trade in pursuit of a better value.
iv. The "Quick" customer - they will be little price sensitive but very time sensitive.
v. The "Quality" customer - I would like to classify them as ones who prefer high quality
items and would be willing to up-trade in pursuit of a higher quality. More fastidious with
their choices.
Now, let us say the options for a corporate strategy are EDLP (Every Day Low Price) as Wal-
Mart has it or Hi-Lo (High - Low, promotions based) as most of the food retailers. Also, the
logistics strategy would be from options - internal, or external. If we have EDLP as the corporate
strategy then we would need a tight control on cost and quality and the only way to do so would
be through the internal warehousing. On the other hand if we have Hi-Lo as the corporate
strategy then we would benefit more from flexibility and therefore may go for the external
warehouse. Once again, this is just to communicate a big picture and an in depth study would be
needed to make any conclusions from the following.
5-19
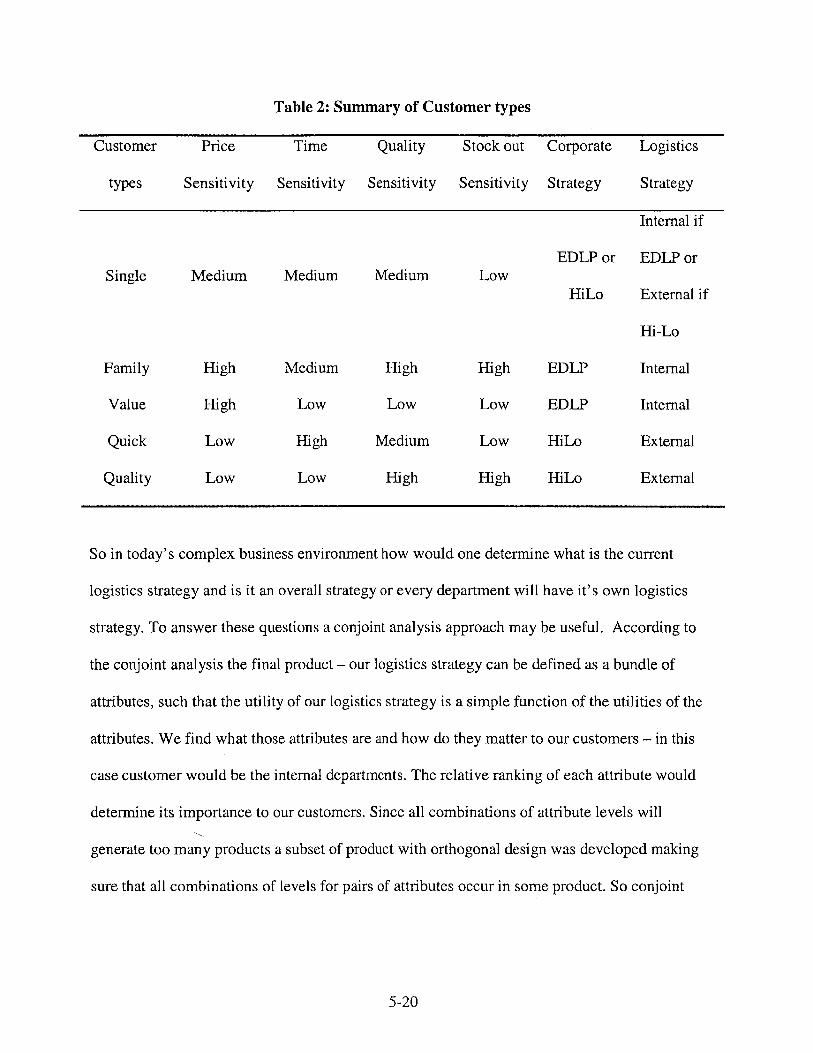
Summary of Customer types
Customer Price Time Quality Stock out Corporate Logistics
types Sensitivity Sensitivity Sensitivity Sensitivity Strategy Strategy
Internal if
EDLP or EDLP orSingle Medium Medium Medium Low
HiLo External if
Hi-Lo
Family High Medium High High EDLP Internal
Value High Low Low Low EDLP Internal
Quick Low High Medium Low HiLo External
Quality Low Low High High HiLo External
So in today's complex business environment how would one determine what is the current
logistics strategy and is it an overall strategy or every department will have it's own logistics
strategy. To answer these questions a conjoint analysis approach may be useful. According to
the conjoint analysis the final product - our logistics strategy can be defined as a bundle of
attributes, such that the utility of our logistics strategy is a simple function of the utilities of the
attributes. We find what those attributes are and how do they matter to our customers - in this
case customer would be the internal departments. The relative ranking of each attribute would
determine its importance to our customers. Since all combinations of attribute levels will
generate too many products a subset of product with orthogonal design was developed making
sure that all combinations of levels for pairs of attributes occur in some product. So conjoint
5-20
Table 2:
analysis could be one way to determine qualitatively the current logistics strategy. Please refer to
Exhibit 10.2 for a sample conjoint analysis questionnaire.
5.8 Why is core competencyH important?
With increasing economic pressures and customer expectations companies' concentrate most on
what they do best and that is the roots of the competitive advantage. A company that under
invests in its core competencies, or inadvertently surrenders them through alliances and
outsourcing, robs its own future4 . Therefore, a major issue facing companies with outsourcing of
logistics is to quantify the value obtained and compare it with the in sourcing costs. Although,
this is a good approach and gives a sense of the value from the outsourcing, I feel that this
decision should not just be based on the numbers. There are many softer or qualitative reasons
associated with the arrangement and all these should be in line with the core corporate strategy.
Also, new metrics should be developed to measure the effectiveness of the outsourcing strategies
used. New measures will then drive the new strategy and the help gain the competitive
advantage.
Core competence does not deteriorate over time, but are enhanced as they are applied and
shared 5. The core competence provides potential access to a wide variety of market. They are
built through a process of continuous improvement and enhancement that may span a decade or
longer.
4 Corporate imagination and expeditionary marketing, Harvard Business Review, Jul/Aug91, Hamel, G.; PrahaladC.H5 C.K. Prahalad, and Gary Hamel, "The core competence of the corporation," Harvard Business Review: May-June1990
5-21
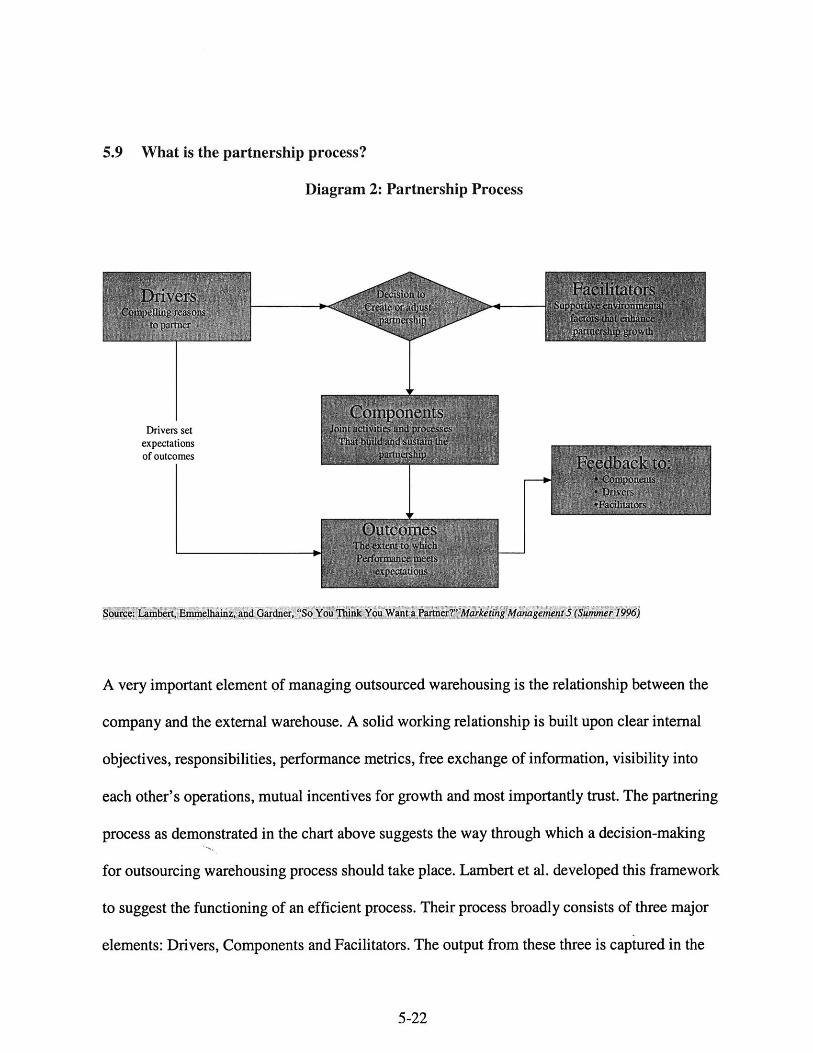
5.9 What is the partnership process?
Diagram 2: Partnership Process
IDrivers set
expectationsof outcomes
Source: Lambert Emmelhainz, and Gardner, "So Yoi Tliink You Want a Partner?"'Marketi4g'Managemten 5 (Summer 1996)
A very important element of managing outsourced warehousing is the relationship between the
company and the external warehouse. A solid working relationship is built upon clear internal
objectives, responsibilities, performance metrics, free exchange of information, visibility into
each other's operations, mutual incentives for growth and most importantly trust. The partnering
process as demonstrated in the chart above suggests the way through which a decision-making
for outsourcing warehousing process should take place. Lambert et al. developed this framework
to suggest the functioning of an efficient process. Their process broadly consists of three major
elements: Drivers, Components and Facilitators. The output from these three is captured in the
5-22
0
Outcomes. The drivers and facilitators may not be the same for each partnering party but
components should be same and should capture the most important elements of the partnership.
Let us understand what will be the drivers for a food retail industry. The drivers for the food
retail industry will be to gain flexibility, competitive advantage, free up its management and
manpower and relocate the assets in to growth. Cost reduction through economies of scale,
higher service levels and reduced labor unions will be additional needs and drivers for the
industry. On the other hand the drivers for an external warehouse would be more business, more
profit and hence growth. Consolidation of core expertise, springboard into other similar markets
and develop a long-term partnership. Similar to the drivers the facilitators would be government
policies like regulation or deregulation, symmetry of operations of the warehousing between the
two parties, management philosophies and techniques for example cost focused and customer
centric.
Drivers and Facilitators comprise the design phase of an agreement and Components form the
means to attain the end results of the agreement. They are important as they determine how the
partnership progresses. Some examples of the components would be like a joint planning team,
which is highly active and addresses the ongoing issues and challenges. Another component
would be the performance measurements that are jointly developed and help keep check on the
important value parameters. The companies can have risk/ reward sharing between them. They
can have reciprocal financial investments in each other's businesses. These components help
bring the parties together into an effective partnership.
5-23

The Drivers and Facilitators form the vision, the Components keep the partnering companies on
track and the outcomes are the vision. The outcomes provide a positive feedback to the drivers,
facilitators and the components. An example of the outcome would be the improvement in the
service level, cost reduction, better asset management, profitability, and gaining market share
and competitive advantage.
5.10 How can we build successful logistics partnerships?
When a firm chooses to do outsourcing it enters into a term or contract with the outsourcer. This
logistics partnership is formed keeping in mind a long-term perspective, value addition for both
the parties, a competitive advantage in the marketplace and greater profitability and higher
efficiencies. Lambert, Emmelhainz and Gardner define this partnership as " a tailored business
relationship based upon mutual trust, openness, shared risk, and shared rewards that yields a
competitive advantage, resulting in a business performance greater than would be achieved by
the firms individually," 6. This partnership can fail for various reasons, which can be clubbed into
two broad categories as defined by Stuart and McCutcheon viz. failure due to mismatched
perceptions and failure due to poor execution.
The following tables" reflect the various reasons that arise from the perceptions mismatch and
what is the solution to those failures. These reasons can be largely reduced during the up-start
planning phase and by continual upper management involvement. A list of common failure
6 Lambert, Emmelhainz, and Gardner, "Building Successful Logistics Partnerships" Journal of Business Logistics,Vol. 20, No.], 1999
5-24

points due to mismatched perceptions7 is provided and solutions are recommended to address
these issues.
Table 3: Successful Logistics Partnership 1
Failure due to Mismatched Prevention / Solution
Perceptions
Expectations mismatch
Culture and core strategy
differences
Not sufficient mutual benefits/
profitability
Absence of shared goals
Internal sabotages
Have high level meetings, ideally should be resolved at the
very start of partnership
These should also be resolved at the start of the partnership
before signing the contract. Important decisive factor
towards choosing an external warehouse.
This is dynamic in nature as degree of profitability changes
with time and economic conditions. There should be
enough flexibility in the contract to allow for such
adjustments.
The partnership is formed to have a win-win relationship. It
is beneficial to have shared goals. This should be
communicated at high levels. Each partner should
understand and accept each other's goals.
This could arise due to internal personal / departmental
misfit with the partnership. These attempts should be
7 Lambert, Emmelhainz, and Gardner, "Building Successful Logistics Partnerships" Journal of Business Logistics,Vol. 20, No.], 1999
5-25
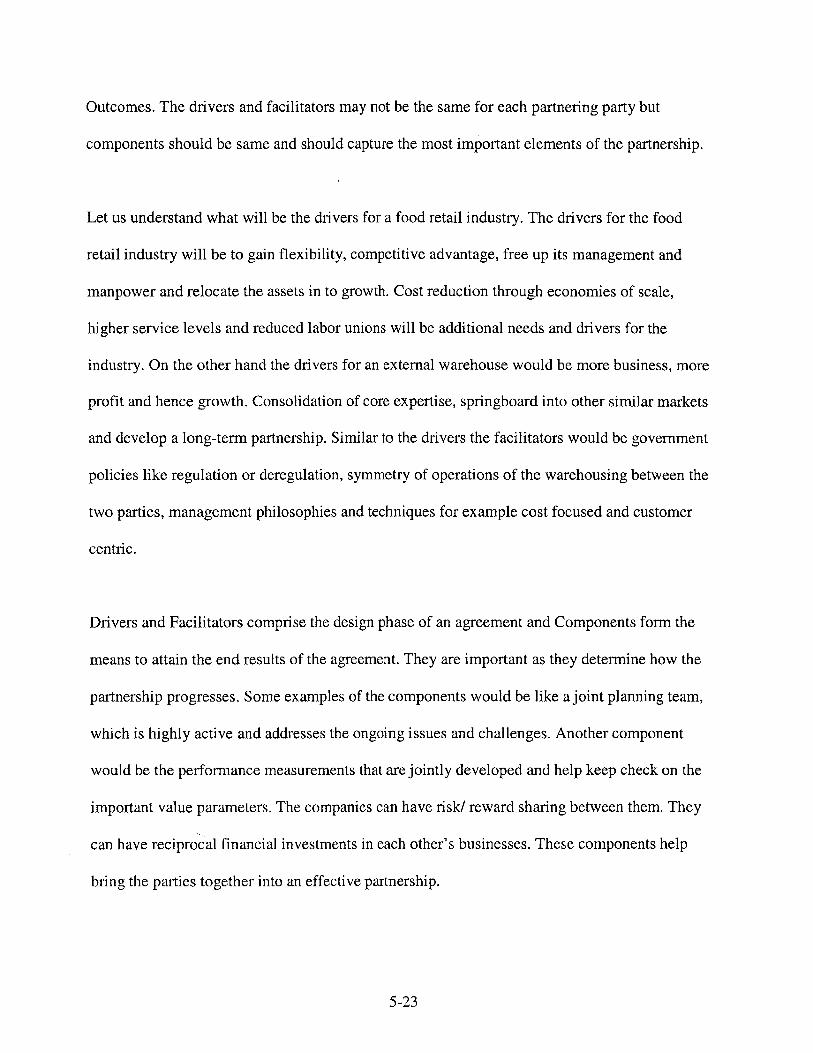
Lack of management commitment
Power imbalance
Failures can also be due to poor execution. These are at the operational level and can be due to
bad up-front planning or changing market conditions or government economic policies. They
should be addressed immediately and should be resolved mutually. If need arises then help from
upper management should be sought. This requires systematic data collection and data analysis
on the joint supply chain performance over a long period of time. Additionally, adequate metrics
should be developed to measure the outcomes and if need be then appropriate changes should be
based in the partnership contracts. A list of common failures because of poor execution, is
provided and prevention / solution is recommended to address the issues.
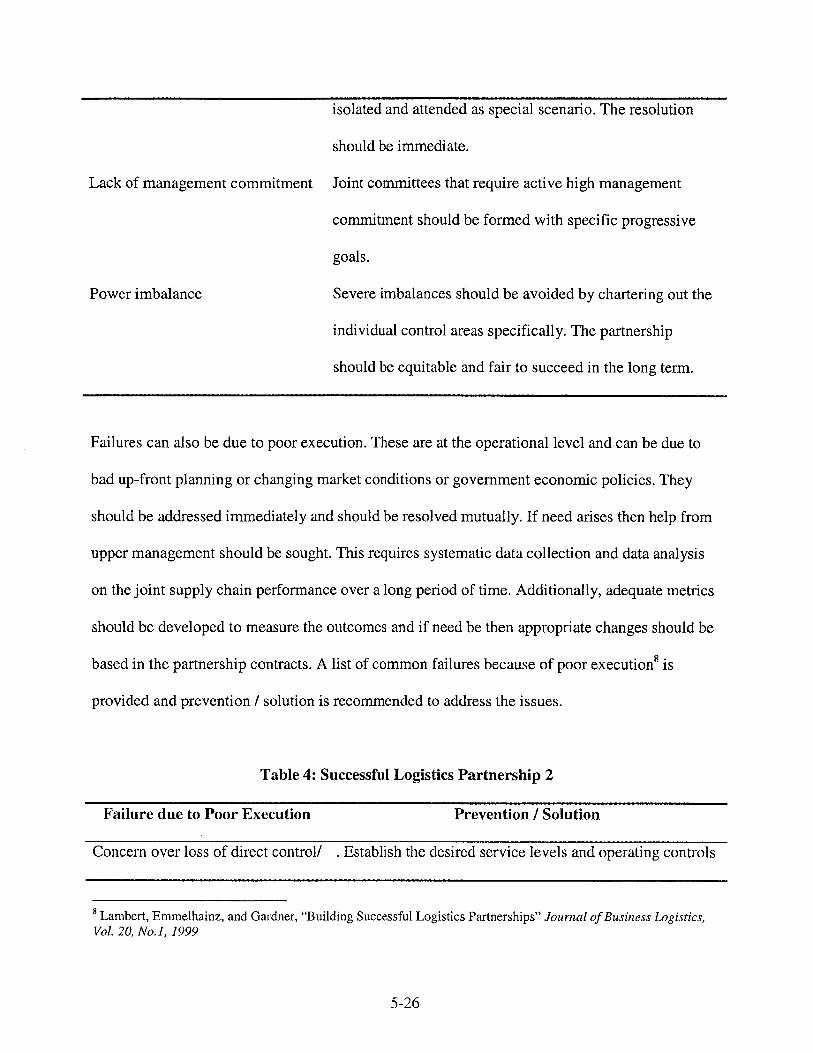
Table 4:
Failure due to Poor Execution
Concern over loss of direct control/
Successful Logistics Partnership 2
Prevention / Solution
Establish the desired service levels and operating controls
5-26
8 Lambert, Emmelhainz, and Gardner, "Building Successful Logistics Partnerships" Journal of Business Logistics,Vol. 20, No.], 1999
isolated and attended as special scenario. The resolution
should be immediate.
Joint committees that require active high management
commitment should be formed with specific progressive
goals.
Severe imbalances should be avoided by chartering out the
individual control areas specifically. The partnership
should be equitable and fair to succeed in the long term.
uncertainties about service level
Unfairness in cost and pricing
Poor up-front planning
Lack of trust
Over promising and under
delivering
Poor Communication
Failure to respond to changes in
corporate strategy / market
conditions
with rich communication as part of the contract before
hand
It demonstrates the trust between the food retailer and the
external warehouse. This should be addressed at a higher
level and detailed cost analysis should be done to a
partner's satisfaction.
Address all the aspects of the agreement before hand. It is
good to be specific and detailed.
Explicitly discuss and resolve the conflict points with
adequate support from the upper management and
executives
Develop benchmarks and performance metrics to measure
these utilities and then address them.
Develop joint quality circles, achievement units and
discussion forums to spear head continual development.
Award these activities. Develop operational controls and
ask for detailed documentations.
Stress on the long-term partnership and value creation.
Have and conduct joint training programs to address the
challenge. Develop partner / buddy support system.
5-27
5.11 What is the future of external warehousing?
Not very long ago the external warehousing was primarily a family owned and managed and
now it has excellent professional management. The companies have grown in size and have
deeper penetration pockets then they have had ever before. With the advent of superior
technology, relaxed economic and regulatory trends, more and more corporations have decided
to use third party logistics. Thus these companies offering flexibility, price competitiveness and
excellent service levels no longer have just regional presences. They are gaining national
coverage and may soon have global operations. Although, their will be companies that will grow
into global power houses, I believe their will always be a market for small third party logistics
companies. These will generally serve as the contract warehouses.
5-28

6 Cost Model
In order to compare the cost benefits of an internal and an external warehouse it was important to
capture the cost points within the two-distribution channels. In other words the cost points
associated with the flow of items through an internal or an external supply chain. In order to do
so the process footprint for the supply chain was created. Please refer to Exhibit 10.1 for the
process maps. The cost points were located and then they were grouped together to form the
most important components of the cost model, which are cost price, warehousing, outbound
logistics, additional costs, and additional savings. These components then sum up to the final net
landed cost. Final net landed cost is then the cost to the retailer from the two supply chains. The
final net landed cost values were used to formulate the strategy of what should be outsourced and
what should be in sourced. I will cover more about this in the later sections of the report.
Table 5: Data Model
Components Components
Cost Price Warehousing
Current Bracket List Price W/H Controllable
Taxes Warehouse Overheads
Efficiency Program W/H Admin Overhead
Deals Distribution Up charge
Cash Discounts Total Warehousing Cost
6-29
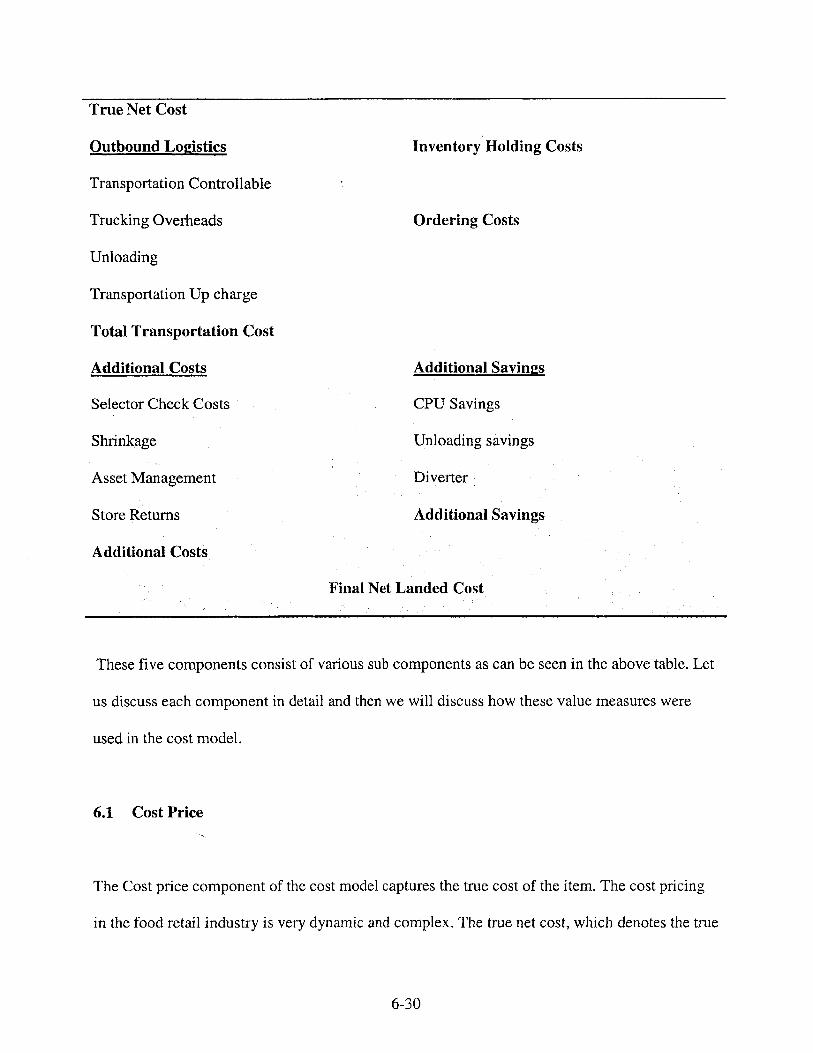
True Net Cost
Outbound Logistics
Transportation Controllable
Trucking Overheads
Unloading
Transportation Up charge
Total Transportation Cost
Additional Costs
Selector Check Costs
Shrinkage
Asset Management
Store Returns
Additional Costs
Inventory Holding Costs
Ordering Costs
Additional Savings
CPU Savings
Unloading savings
Diverter
Additional Savings
Final Net Landed Cost
These five components consist of various sub components as can be seen in the above table. Let
us discuss each component in detail and then we will discuss how these value measures were
used in the cost model.
6.1 Cost Price
The Cost price component of the cost model captures the true cost of the item. The cost pricing
in the food retail industry is very dynamic and complex. The true net cost, which denotes the true
6-30
cost price, comprises of bracket list price, the pay back from vendor efficiency programs, cash
discounts, bill back schemes and taxes. Let me explain each one of them briefly for the benefit of
the reader who is unfamiliar with the industry. Bracket list price is the price set by the vendor for
a particular item for the purchase of a certain amount of quantity. The list price varies on the
quantity and more the purchase better is the bracket pricing. Thus as one can see that the external
warehouses, if dealing in large volumes can immediately add cost benefits to its partner. The
vendor also gives cash discounts over the list price and this typically varies from 1% to 3% in the
grocery industry. The percentage cash discount generally obtained through the external
warehouse is lower than what one gets otherwise through the internal supply chain. This is
because the external warehouse retains a part of the cash discount for warehousing and
transportation.
Efficiency programs are cost incentives given generally by large vendors for timely payments
and superior collaboration initiatives. They are based on the steady demand generated over a
period of time. Since the project involved a big grocer and a big external warehouse, they both
were able to generate enough demand to qualify for the efficiency programs. So although this
may be one of the differentiating factors in the study in my case it was not Apart from these the
market is very seasonal and depending on this the vendor offers bill backs to promote their
products. The food retailer where the project was done was big enough to qualify for the best
bracket price in most of the cases. Another important cost is the excise cost on the inventory at a
warehouse, which gives a reason for carrying lesser inventory. Since the warehouses that were
under consideration in the project were in the states, which did not have this provision. The study
6-31
by and large excluded the excise taxes. So the sum of all these costs and discounts gets us to the
true net cost.
6.2 Warehousing
Warehousing can be broadly categorized into three kinds of cost components. First all the costs
in a warehouse that are fixed. Second, all the variable costs in a warehouse for example the
handling costs and the third would be the administrative costs. The fixed costs are referred to as
the W/H overheads, variable costs as the W/H controllable and the administrative costs as the
W/H admin overheads. Let us discuss some kinds of costs that go into warehousing.
Insurance cost: Very similar to the above mentioned excise cost is the insurance cost on the
warehoused inventories. This prevents the goods from damages from natural causes, theft etc.
The insurance premium is directly proportional to the amount of inventory carried at the
distribution centers.
Handling Costs: Handling cost is generally defined as the cost associated with the goods in
motion9 . They include labor and fringe benefits for warehouse workers and warehouse
supervision, materials handling equipment cost, warehouse supplies, cost of warehouse damage
and shipping errors. A depreciation charge or an equipment rental rate is developed for material
handling equipment. Equipment cost also includes maintenance, fuel and lubricants.
9 Ackerman et. Al. Understanding today's distribution center
6-32
Administrative and overhead costs: The cost incurred towards the overall management of the
warehouse, which includes the remuneration of executives, officers and staff. Also includes
subscriptions, charity, advertising, sales promotions, marketing and other such professional
overheads. They also include costs incurred for clerical activities.
The warehousing costs were obtained from the P&L (Profit and Loss) statements of the
company. They were divided into departmental level costs based on the weekly movement of the
department. Frozen, Grocery would be examples of a department. These departmental costs were
then further sub divided into costs incurred for each vendor item based on the weekly movement
and weighted against the cube per case. The cube per case measurement was used to find the
weighted cost values because I think that it is directly proportional to the labor activity. Higher
the cube per case more labor, space and transportation resource would be consumed. The
detailed information from the external distribution center was not available so an up charge that
was negotiated between the food retailer and the external warehouse was considered. The sum of
this gave the total warehousing cost.
6.3 Outbound Logistics
The transportation charges to and from the warehouse are one of the biggest contributors to the
costs. Location of a warehouse i.e. how far or close is it to the stores or to the vendors; it's
specific location in the city; like if it is next to the freeway or not, facility layout of the
warehouse building etc can greatly affect the vehicles turn around time. This all has a direct
impact on the transportation costs and the overall distribution costs. Also, if the truck is fully
6-33
loaded or if it is LTL (less than truck load), it will increase or decrease the unit cost of the
distributed items.
The transportation costs are very similarly structured. The variable costs are the transportation
controllable, the fixed cost are the trucking overheads. There is another kind of variable cost,
which is considered separately and not as part of the trucking variable costs is the unloading
costs. This is cost incurred to unload a truck at the superstore. Since the detailed data could not
be obtained on the transportation from the external warehouse, I considered the negotiated
transportation up charge for all my calculations. Similar to the warehouse costs weighted per
case for each vendor was determined and used to get the total transportation cost.
6.4 Inventory Holding Costs
Inventory holding cost is generally defined as the cost associated with the goods at rest10. Goods
are stored so as to act as a buffer to fluctuating demand or supply. For example in case of
seasonal production and stable consumption, or when there is stable production and seasonal
consumption. In both cases storing excess inventory allows increased efficiency. We assumed
that the average cover of 2.3 weeks consists of the average safety stock and the average weekly
quantity.
Weekly cover*number of cases/ week (weekly movement) is the average weekly inventory that
is held through out the year. This multiplied by Cp*9% gives us the annual holding cost of
'0 Ackerman et. Al. Understanding today's distribution center
6-34
inventory. Cp is the bracket list price. A percentage value of 9% was chosen since it was the
valued used internally by the food retailer. So holding cost per case is equal to this divided by the
number of cases in a week*52
Therefore, (inventory cover in weeks*Weekly movement)*Cp*9%/(52*weekly movement)=
inventory holding cost/case
6.5 Ordering Costs
Ordering costs are the administrative costs associated with the replenishment action. In order to
compute the ordering cost per case total annual administrative cost was determined, which was
divided by the total annual number of cases shipped.
6.6 Store-Landed Cost
The sum of true net cost, total warehousing cost, total transportation cost, inventory holding cost
and ordering cost gave the store-landed cost.
6.7 Additional Costs
Additional costs are those costs that are incurred indirectly due losses from asset management
store returns and shrinkages. It also has contains the cost incurred to keep a check on the
shrinkages and assets, which is called as selector check costs. Selector costs were based off the
6-35
total costs of auditors divided by the number of cases for that area that is the number of auditors
multiplied by their hourly rates. The selector per case cost is very small.
6.8 Additional Savings
There are additional sources of revenue generation that go hand in hand with the warehousing for
example the customer pick up, unloading savings, and diverter. Customer pick up is when the
company picks up its merchandise directly from the vendor. The vendor shares inbound savings
with the customer. Similar to the customer pick up, unloading savings are when the customer
unloads the trucks at the warehouse.
The food retail industry can be broadly categorized into non-food fast, non-food slow, food fast,
food slow, frozen, dairy, and perishables. For the thesis I focused on the non-food fast, food fast,
and frozen. The reason for which was the availability of data from both the internal and external
warehouses. Five vendors from each category were selected. They were divided into the three
large vendors (vendors supplying more than twenty five items), one small vendor (less than
twenty five items), and one private label vendor. The private label vendor could be either large or
small. Inputs were received from various category managers and high-level analysis was done to
select the vendors. The following chart provides the information that was collected for each
vendor. The fifteen vendors are discussed more in detail in the next chapter of data analysis.
6-36
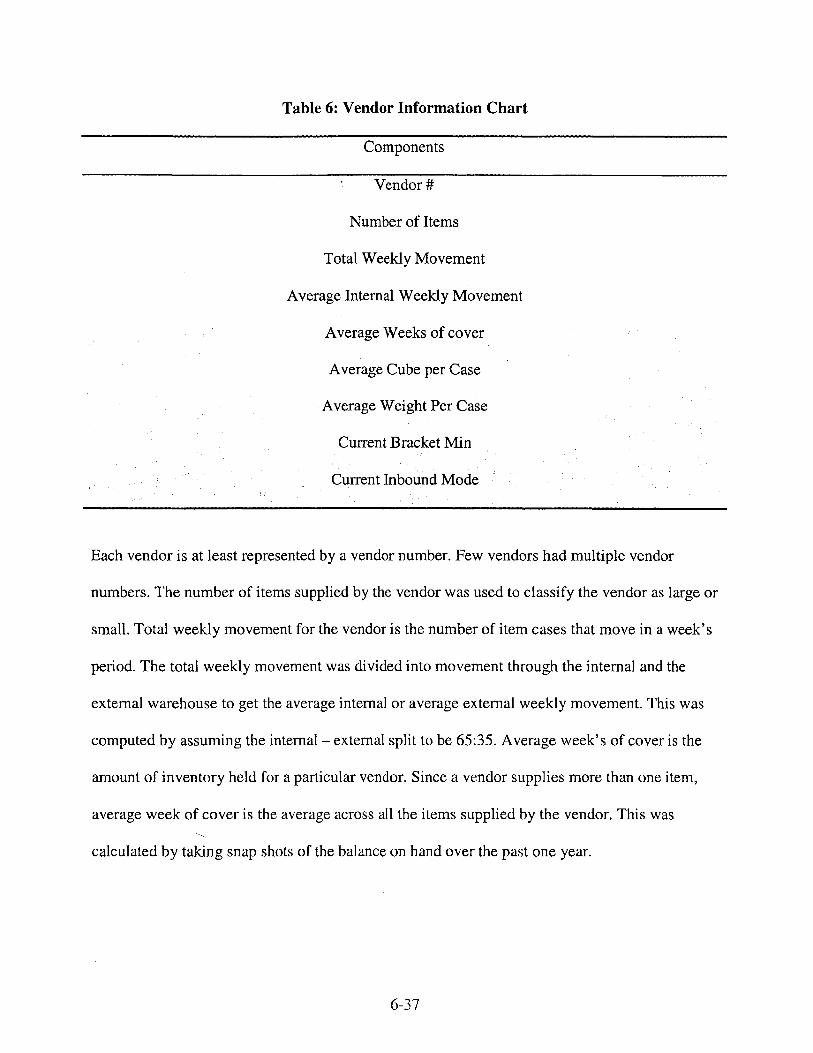
Table 6: Vendor Information Chart
Components
Vendor #
Number of Items
Total Weekly Movement
Average Internal Weekly Movement
Average Weeks of cover
Average Cube per Case
Average Weight Per Case
Current Bracket Min
Current Inbound Mode
Each vendor is at least represented by a vendor number. Few vendors had multiple vendor
numbers. The number of items supplied by the vendor was used to classify the vendor as large or
small. Total weekly movement for the vendor is the number of item cases that move in a week's
period. The total weekly movement was divided into movement through the internal and the
external warehouse to get the average internal or average external weekly movement. This was
computed by assuming the internal - external split to be 65:35. Average week's of cover is the
amount of inventory held for a particular vendor. Since a vendor supplies more than one item,
average week of cover is the average across all the items supplied by the vendor. This was
calculated by taking snap shots of the balance on hand over the past one year.
6-37

Average cube per case is defined as the size of a case in cubic feet. The movement for the past
six months was taken for the vendor to compute this number. Non-food fast vendors who supply
paper-towels, cereals etc have a high average cube per case. Average weight per case was
calculated similarly to the average cube per case.
Current bracket minimum is measured in units of lbs or cubes (cube is applicable when the item
cubes out earlier than it weighs out). It is the minimum the food retailer needs to order in order to
get the bracket price. To get the quantity discounts the buyer places orders in multiples of the
current bracket minimum quantity and at times at the expense of higher holding costs.
Current inbound mode is of two kinds - delivery or pick up. Delivery signifies that the vendor
delivers the product; pick up is when the customer picks up the product.
Please refer to the Exhibit 10.3 internal warehouse cost model and Exhibit 10.4 for the external
warehouse cost model.
6-38
7 Data Analysis
The data was collected and partially derived for five vendors for each of the three categories non-
food fast, food fast and frozen. The base case, which will be discussed later in this section, was
based on the collected data. Since the numbers were fairly approximate therefore it made good
sense to do a sensitivity analysis on the base data. The following variables were chosen for the
sensitivity analysis - deals, shrinkages, internal warehousing cost and the external warehousing
cost, they are represented in the following sensitivity charts as Base Case; FNLC W/H (+/-10%);
FNLC T (+/-10%); FNLC Shrink (+/-10%); FNLC Deals (+/-10%) (FNLC - Final Net landed
Cost, WIH - Warehouse, T - Transportation cost). These variables were decided based upon
the input from the senior executives the range was decided to be from -10% to +10%. In order to
keep things simple, I decided to group all these into two scenarios - best scenario and the worst
scenario. The best scenario will have 10% reduction in transportation costs (FNLC T (-10%));
warehousing costs (FNLC W/H (-10%)); shrinkages (FNLC Shrink (-10%)) and 10% increase in
the deals (FNLC Deals (+10%)). The second scenario would be the worst scenario, which will
have 10% increase in the internal warehousing costs (FNLC W/H (+10%)); transportation costs
(FNLC T (+10%)); shrinkages (FNLC Shrink (+10%)) and also a 10% reduction in the deals
(FNLC Deals (-10%)) at the internal warehouse. The reason for taking the extreme scenarios
approach was that all the values obtained from various permutations and combinations amongst
these variables would fall within this range.
7-39

7.1 Non-Foods Fast
As mentioned earlier three categories of the food retail industry were chosen to determine the
cost benefits of an internal warehouse over the external warehouse. Non-foods fast was one of
the categories. This category comprised of items that were fast moving and were actively
sourced from both internal and the external warehouse. Five vendors were selected and they are
discussed in detail in the following sections. In order to maintain the data confidentiality the
vendor names are hidden and, cost values are modified from the original but the underlying
message obtained from the study is retained. Same vendors were chosen from internal and
external warehouses.
7.1.1 Large Vendor 1 - Heavy and Non Bulky
The large vendor 1 supplies close to 90 items to the food retailer and has a weekly movement of
over 13,000 cases. The inventory for this vendor in the internal warehouse was maintained
around 2 weeks but this was lower than the average weekly cover of non-food fast items stored
at the warehouse. The average cube per case was 0.96, which was also lower than the average
non-food fast cube per case value. This suggests that the merchandise from the vendor was less
bulky on an average. The average weight per case of the item was close to 25 lbs and was higher
than the category average value. So in could be concluded that the large vendor 1 supplied non
bulky but heavier items. The inbound mode for the vendor was delivery. Delivery means that the
merchandise was delivered to the warehouse by the vendor. The following chart shows the
comparative costs at the internal and the external warehouses. The 1 and 2 in the chart refer to
the internal and external warehouses respectively. As it can be seen the total warehousing cost
7-40
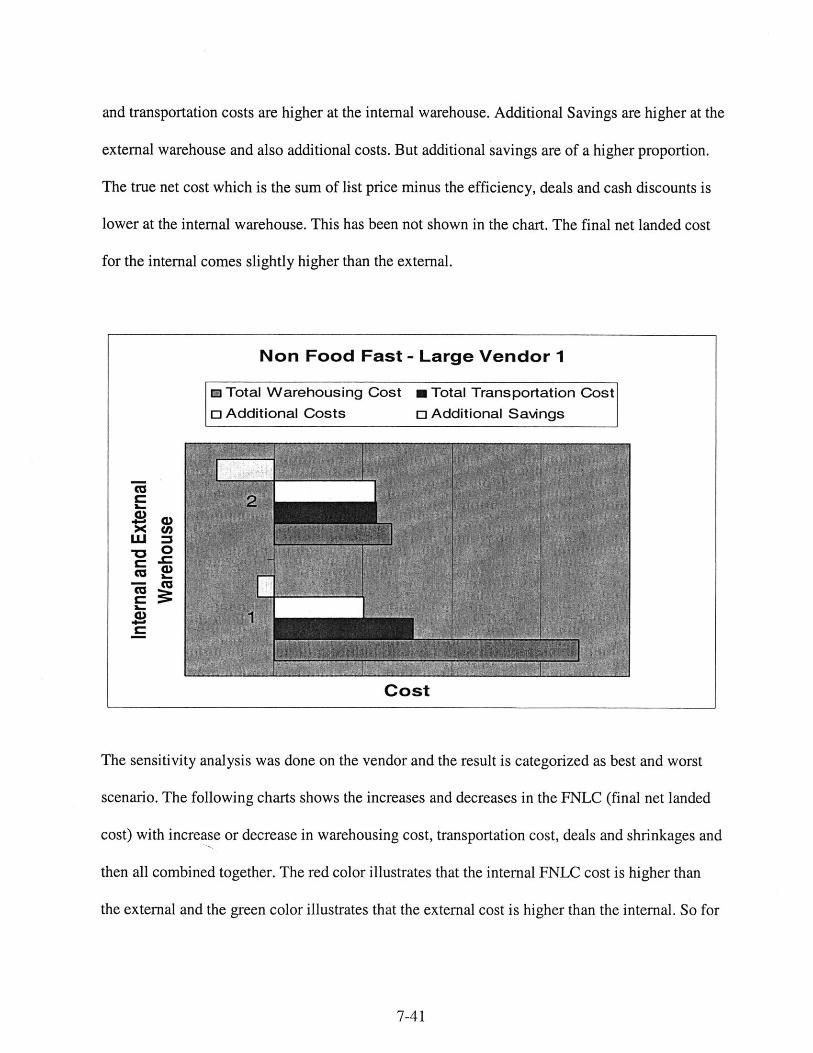
and transportation costs are higher at the internal warehouse. Additional Savings are higher at the
external warehouse and also additional costs. But additional savings are of a higher proportion.
The true net cost which is the sum of list price minus the efficiency, deals and cash discounts is
lower at the internal warehouse. This has been not shown in the chart. The final net landed cost
for the internal comes slightly higher than the external.
Non Food Fast - Large Vendor 1
m Total Warehousing Cost
o Additional Costs
m Total Transportation Cost
o Additional Savings
Cost
The sensitivity analysis was done on the vendor and the result is categorized as best and worst
scenario. The following charts shows the increases and decreases in the FNLC (final net landed
cost) with increase or decrease in warehousing cost, transportation cost, deals and shrinkages and
then all combined together. The red color illustrates that the internal FNLC cost is higher than
the external and the green color illustrates that the external cost is higher than the internal. So for
7-41
0
cc
xI..
cc
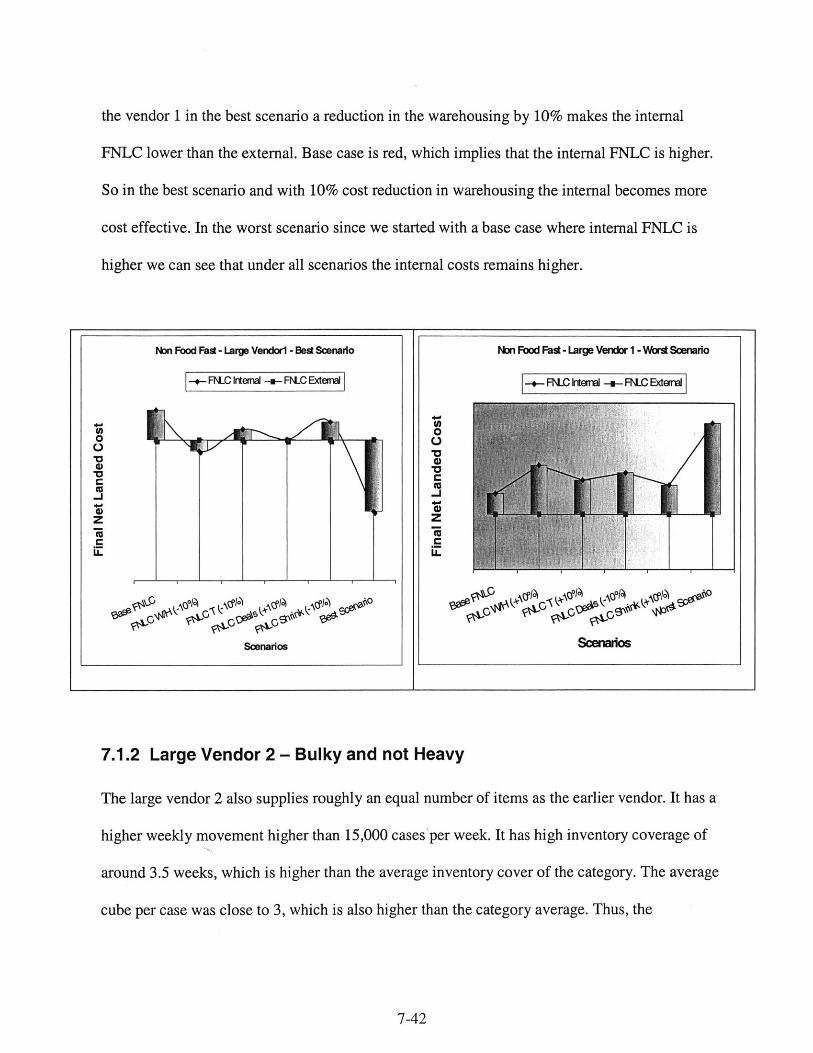
the vendor 1 in the best scenario a reduction in the warehousing by 10% makes the internal
FNLC lower than the external. Base case is red, which implies that the internal FNLC is higher.
So in the best scenario and with 10% cost reduction in warehousing the internal becomes more
cost effective. In the worst scenario since we started with a base case where internal FNLC is
higher we can see that under all scenarios the internal costs remains higher.
7.1.2 Large Vendor 2 - Bulky and not Heavy
The large vendor 2 also supplies roughly an equal number of items as the earlier vendor. It has a
higher weekly movement higher than 15,000 cases'per week. It has high inventory coverage of
around 3.5 weeks, which is higher than the average inventory cover of the category. The average
cube per case was close to 3, which is also higher than the category average. Thus, the
7-42
Non Food Fas - Large Vendor1 - Bed Scenaio
-.- FNLC Intemr -ri- FNLC ExterM
40
U)
z
Scenarios
Non Food Fast - Large Vendor 1 - V~ Scienatio
-- FN.C ktemd i FN.C Bdard
0
cc
a)EL
vtpo o o) L\-J0 -0
eo4- 4N
Scenos
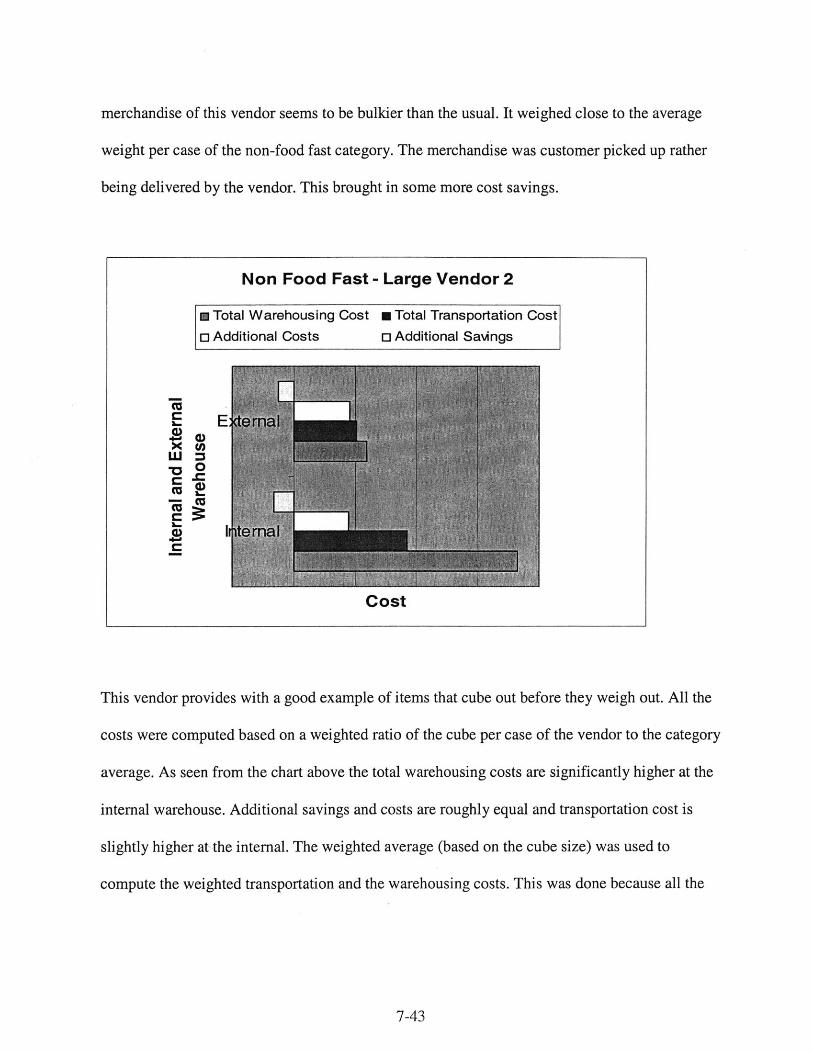
merchandise of this vendor seems to be bulkier than the usual. It weighed close to the average
weight per case of the non-food fast category. The merchandise was customer picked up rather
being delivered by the vendor. This brought in some more cost savings.
Non Food Fast
m Total Warehousing Cost
o Additional Costs
- Large Vendor 2
* Total Transportation Cost
o Additional Savings
Cost
This vendor provides with a good example of items that cube out before they weigh out. All the
costs were computed based on a weighted ratio of the cube per case of the vendor to the category
average. As seen from the chart above the total warehousing costs are significantly higher at the
internal warehouse. Additional savings and costs are roughly equal and transportation cost is
slightly higher at the internal. The weighted average (based on the cube size) was used to
compute the weighted transportation and the warehousing costs. This was done because all the
7-43
a)
0
cc
a)i
-x
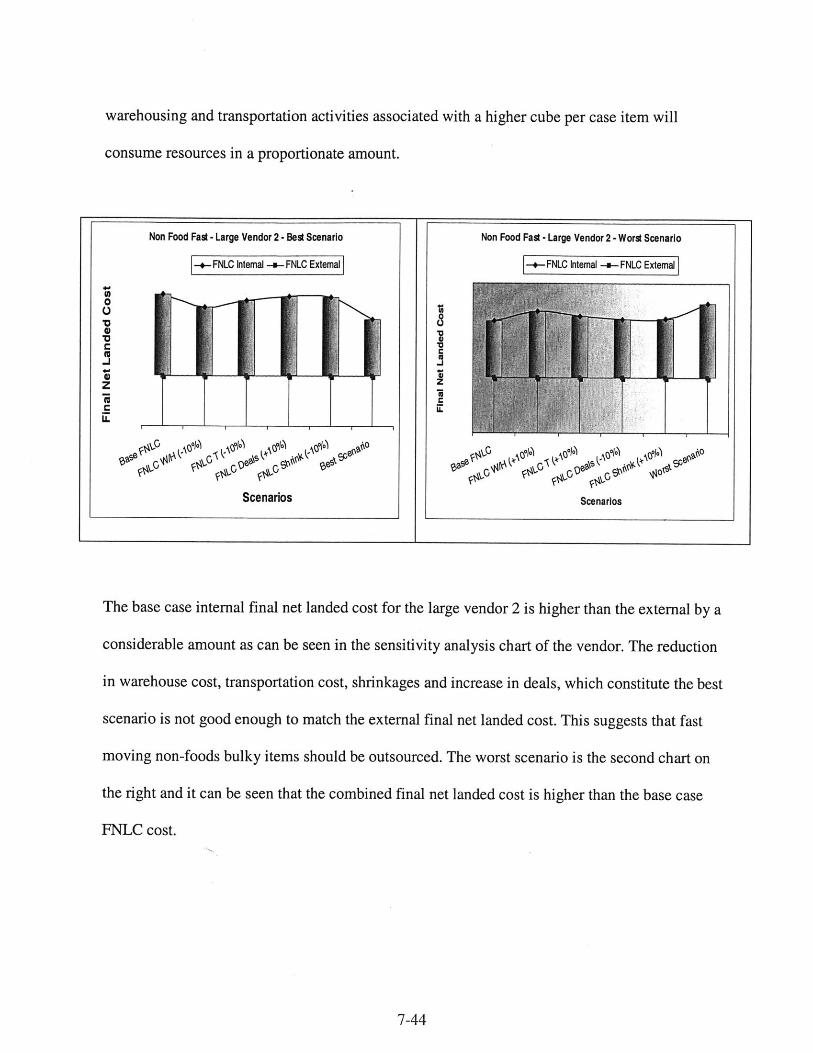
warehousing and transportation activities associated with a higher cube per case item will
consume resources in a proportionate amount.
Non Food Fast - Large Vendor 2 - Best Scenario Non Food Fast - Large Vendor 2 -Worst Scenario
FNLC Intemal FNLC Extemal -- FNLC Intemal -a-FNLC Extemal
0
zz
ILL
oy- ' .
Scenarios Scenarios
The base case internal final net landed cost for the large vendor 2 is higher than the external by a
considerable amount as can be seen in the sensitivity analysis chart of the vendor. The reduction
in warehouse cost, transportation cost, shrinkages and increase in deals, which constitute the best
scenario is not good enough to match the external final net landed cost. This suggests that fast
moving non-foods bulky items should be outsourced. The worst scenario is the second chart on
the right and it can be seen that the combined final net landed cost is higher than the base case
FNLC cost.
7-44

7.1.3 Large Vendor 3 - Low Cover and Average Cube and Weight
Large vendor 3 was the biggest non-food fast vendor. It supplied almost double the number of
items supplied by the earlier vendors. It had a weekly movement of more than 30,000 cases.
Although, a very high weekly movement it surprisingly had the lowest inventory cover, much
lower than the average inventory cover of the category. A reason for the low inventory cover
would be sophisticated forecasting tools employed by the large vendor and much of the demand
of the fast moving goods would be stable. Their cubes per case size were close to the category
average and it also had an average weight as well. This vendor represented the bulk of the
characteristics of the non-food fast category.
Non Food Fast - Large Vendor 3
m Total Warehousing Cost
o Additional Costs
LEE
* Total Transportation Cost
o Additional Savings
'ItInternal and External Warehouses
7-45
01-(0
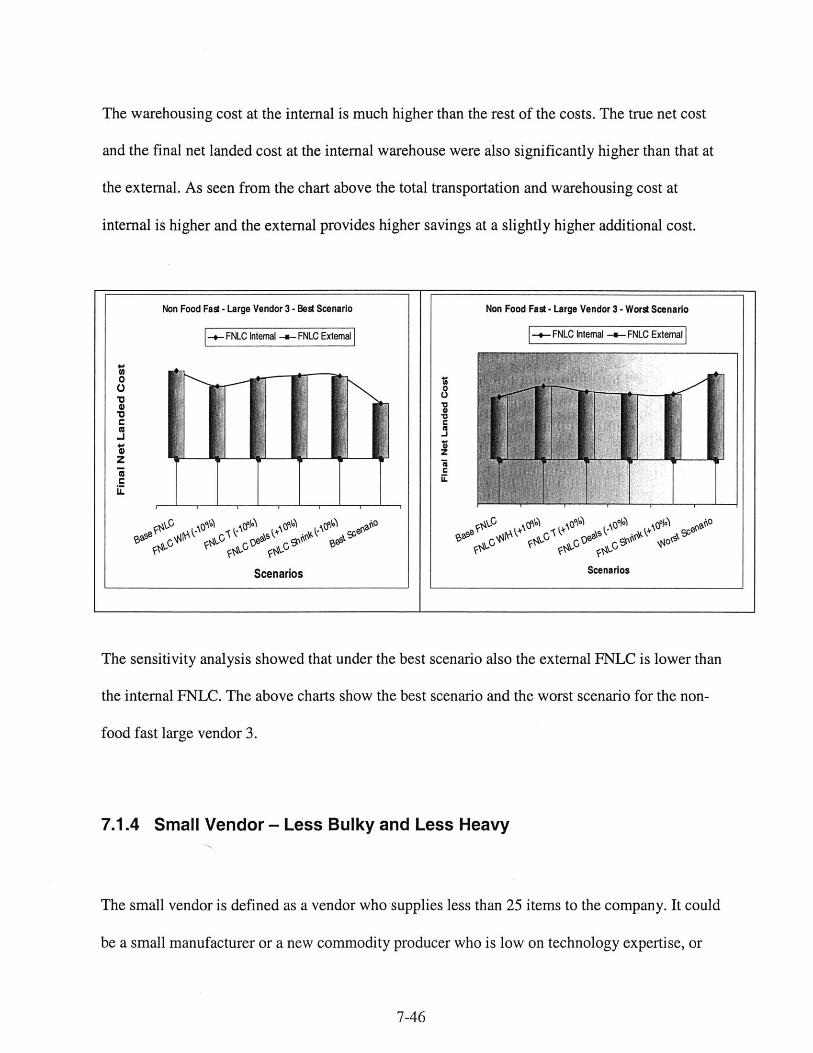
The warehousing cost at the internal is much higher than the rest of the costs. The true net cost
and the final net landed cost at the internal warehouse were also significantly higher than that at
the external. As seen from the chart above the total transportation and warehousing cost at
internal is higher and the external provides higher savings at a slightly higher additional cost.
Non Food Fast - Large Vendor 3 - Best Scenario Non Food Fast - Large Vendor 3 -Worst Scenario
- -- FNLC Interal -.- FNLC Extemal
0
I'z I
IL
Scenarios Scenarios
The sensitivity analysis showed that under the best scenario also the external FNLC is lower than
the internal FNLC. The above charts show the best scenario and the worst scenario for the non-
food fast large vendor 3.
7.1.4 Small Vendor - Less Bulky and Less Heavy
The small vendor is defined as a vendor who supplies less than 25 items to the company. It could
be a small manufacturer or a new commodity producer who is low on technology expertise, or
7-46
could be one with very specific or specialized item. It should have high inventory cover as will
not have highly sophisticated forecasting tools, and will try to over sell.
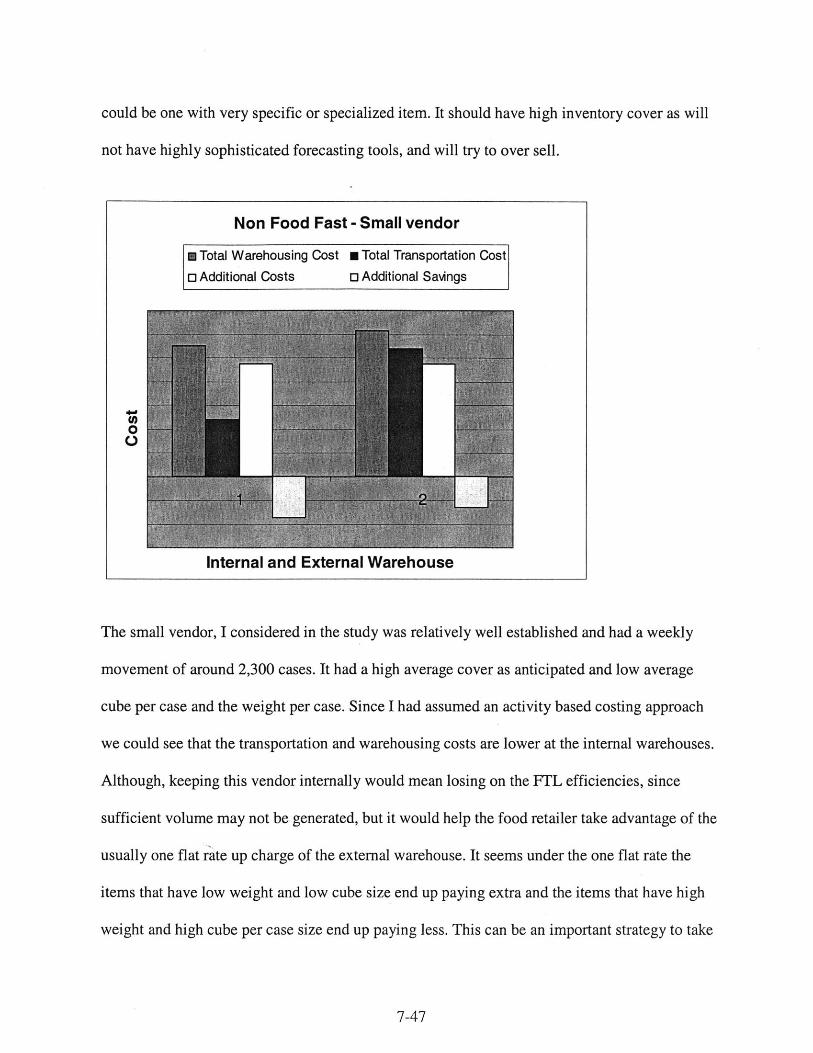
The small vendor, I considered in the study was relatively well established and had a weekly
movement of around 2,300 cases. It had a high average cover as anticipated and low average
cube per case and the weight per case. Since I had assumed an activity based costing approach
we could see that the transportation and warehousing costs are lower at the internal warehouses.
Although, keeping this vendor internally would mean losing on the FTL efficiencies, since
sufficient volume may not be generated, but it would help the food retailer take advantage of the
usually one flat rate up charge of the external warehouse. It seems under the one flat rate the
items that have low weight and low cube size end up paying extra and the items that have high
weight and high cube per case size end up paying less. This can be an important strategy to take
7-47
Non Food Fast - Small vendor
m Total Warehousing Cost m Total Transportation Cost
o Additional Costs o Additional Savings
(0
Internal and External Warehouse
advantage of the one flat rate up charge at the external warehouses. The true net cost is lower at
the internal because of better deals and cash discounts.
Non Food Fast - Small Vendor - Best Scenario Non Food Fast -Small Vendor -Worst Scenario
-+.-FNLC Internal --- FNLC Extemal -s-FNLC Intemal -a-FNLC Extemal
zzzICC
0 \,G Ve E)% 14O0
Scenarios Scenarios
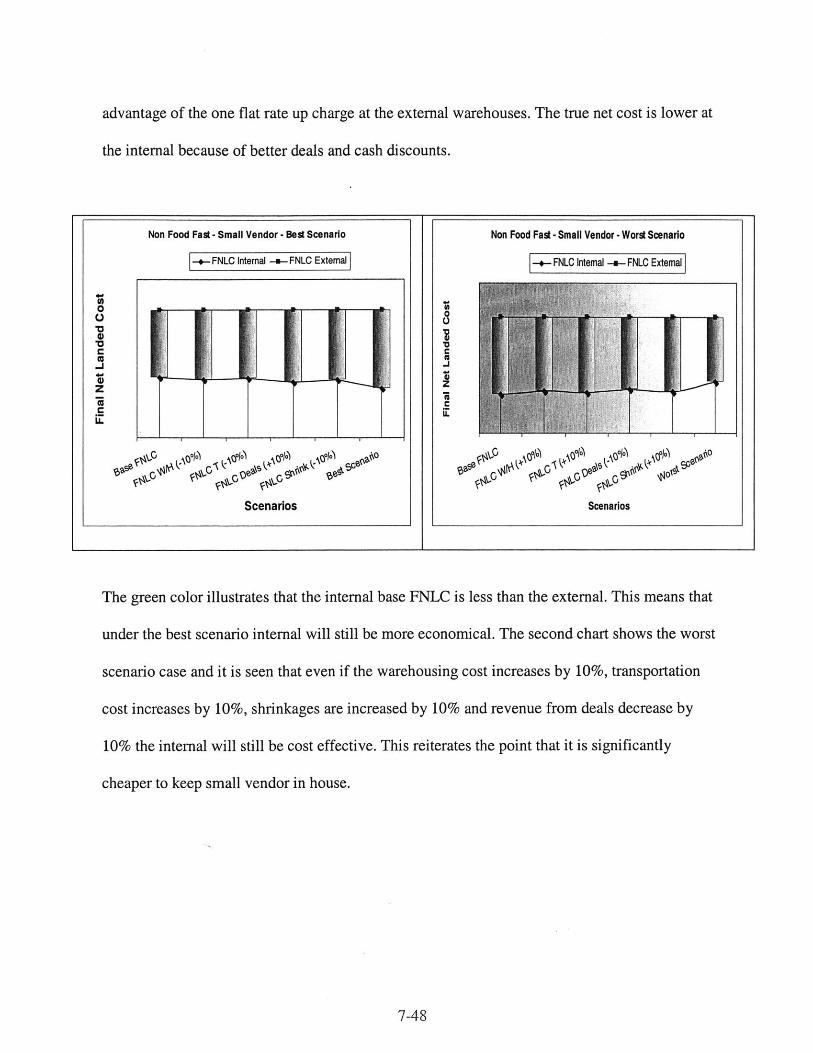
The green color illustrates that the internal base FNLC is less than the external. This means that
under the best scenario internal will still be more economical. The second chart shows the worst
scenario case and it is seen that even if the warehousing cost increases by 10%, transportation
cost increases by 10%, shrinkages are increased by 10% and revenue from deals decrease by
10% the internal will still be cost effective. This reiterates the point that it is significantly
cheaper to keep small vendor in house.
7-48
7.1.5 Private Label - Low Cost Items
A large private label vendor was considered who supplied almost 70 items to the food retailer. It
had an average weekly movement of over 7,000 cases. At the internal warehouse an average
cover of 2.1 weeks was maintained for the vendor, which was close to the average cover in the
non-food fast category. The average cube per case and the weight per case were lower than the
average for the category. So unlike the small vendor this vendor supplied more number of items
but shared the similar weight per case and cube per case characteristics.
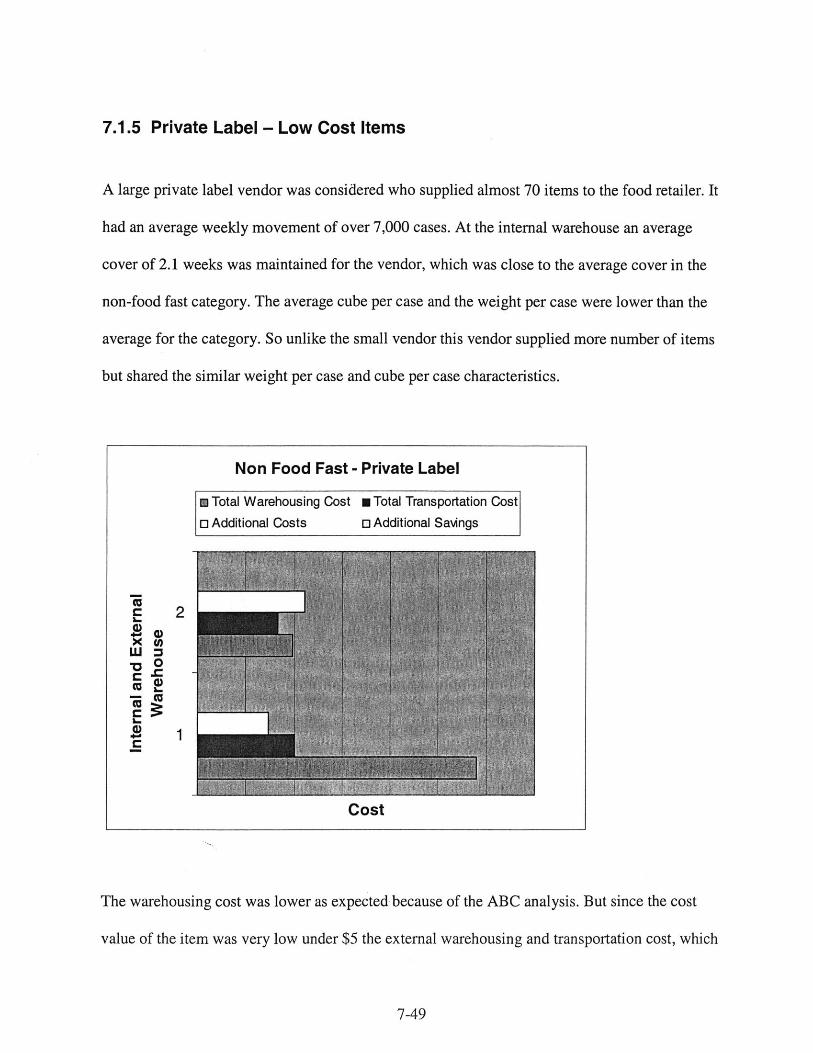
The warehousing cost was lower as expected because of the ABC analysis. But since the cost
value of the item was very low under $5 the external warehousing and transportation cost, which
7-49
Non Food Fast - Private Label
m Total Warehousing Cost * Total Transportation Cost
o Additional Costs 0 Additional Savings
4)1
c2
2
LC
Cost
are a percentage of the cost value came out to be very low. This brings me to another conclusion
that it is profitable to outsource the lower dollar value items. The additional savings are zero. The
transportation costs are also higher at the internal warehouse.
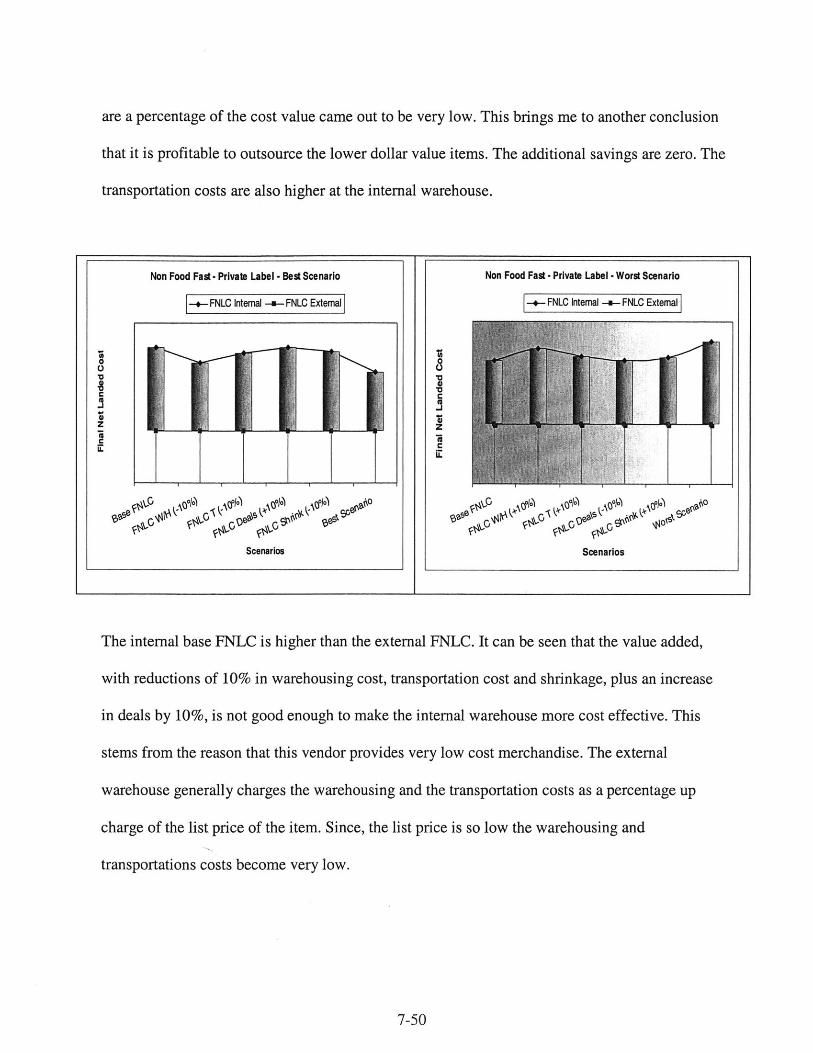
The internal base FNLC is higher than the external FNLC. It can be seen that the value added,
with reductions of 10% in warehousing cost, transportation cost and shrinkage, plus an increase
in deals by 10%, is not good enough to make the internal warehouse more cost effective. This
stems from the reason that this vendor provides very low cost merchandise. The external
warehouse generally charges the warehousing and the transportation costs as a percentage up
charge of the list price of the item. Since, the list price is so low the warehousing and
transportations costs become very low.
7-50
Non Food Fast - Private Label - Best Scenario
s.-FNLC Internl .. FNLC External
0
Z
00
Scenarios
Non Food Fast - Private Label -Worst Scenario
s.. FNLC Internal -.- FNLC External
J0
kI k
Scenarios
7.2 Foods Fast
This category comprises of fast moving food items, which are actively sourced from both
internal and the external warehouses. Five vendors were selected just like the non-food fast
category and are discussed below. They consist of three large vendors, one small vendor and one
private label. In order to maintain the data confidentiality the vendor names, cost values are
modified from the original but the underlying message obtained from the study is retained. Same
vendors were chosen from internal and external warehouses to maintain uniformity.
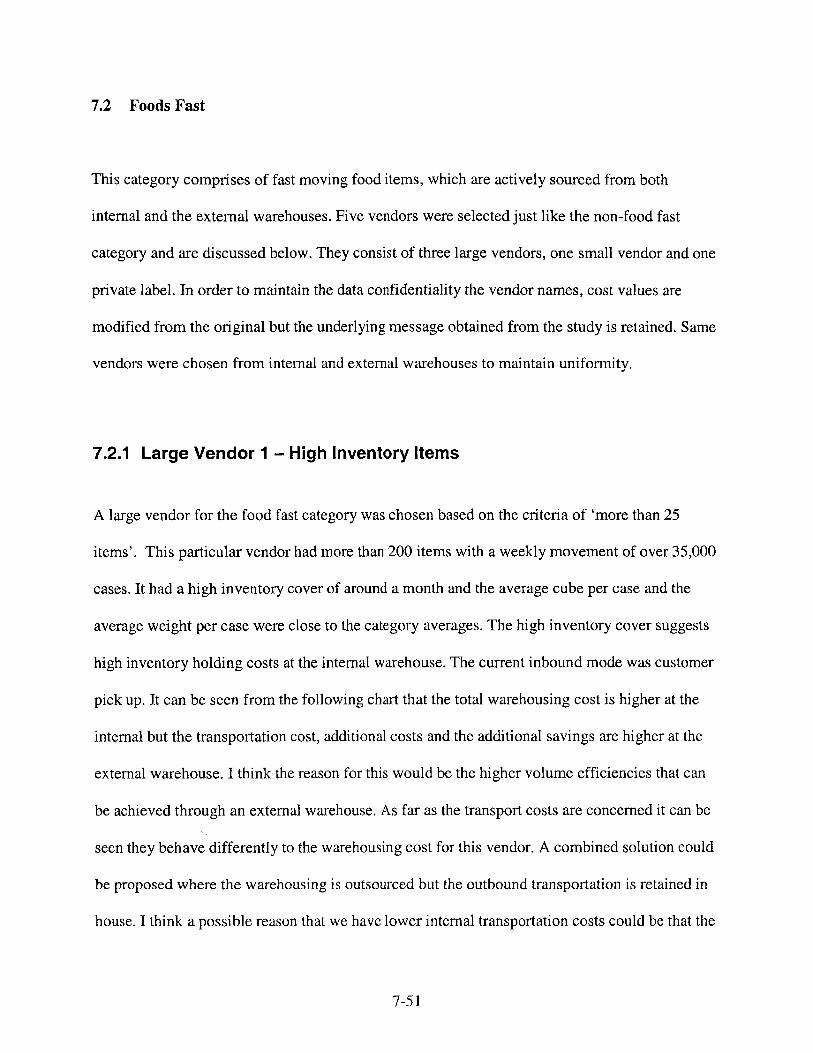
7.2.1 Large Vendor 1 - High Inventory Items
A large vendor for the food fast category was chosen based on the criteria of 'more than 25
items'. This particular vendor had more than 200 items with a weekly movement of over 35,000
cases. It had a high inventory cover of around a month and the average cube per case and the
average weight per case were close to the category averages. The high inventory cover suggests
high inventory holding costs at the internal warehouse. The current inbound mode was customer
pick up. It can be seen from the following chart that the total warehousing cost is higher at the
internal but the transportation cost, additional costs and the additional savings are higher at the
external warehouse. I think the reason for this would be the higher volume efficiencies that can
be achieved through an external warehouse. As far as the transport costs are concerned it can be
seen they behave differently to the warehousing cost for this vendor. A combined solution could
be proposed where the warehousing is outsourced but the outbound transportation is retained in
house. I think a possible reason that we have lower internal transportation costs could be that the
7-51
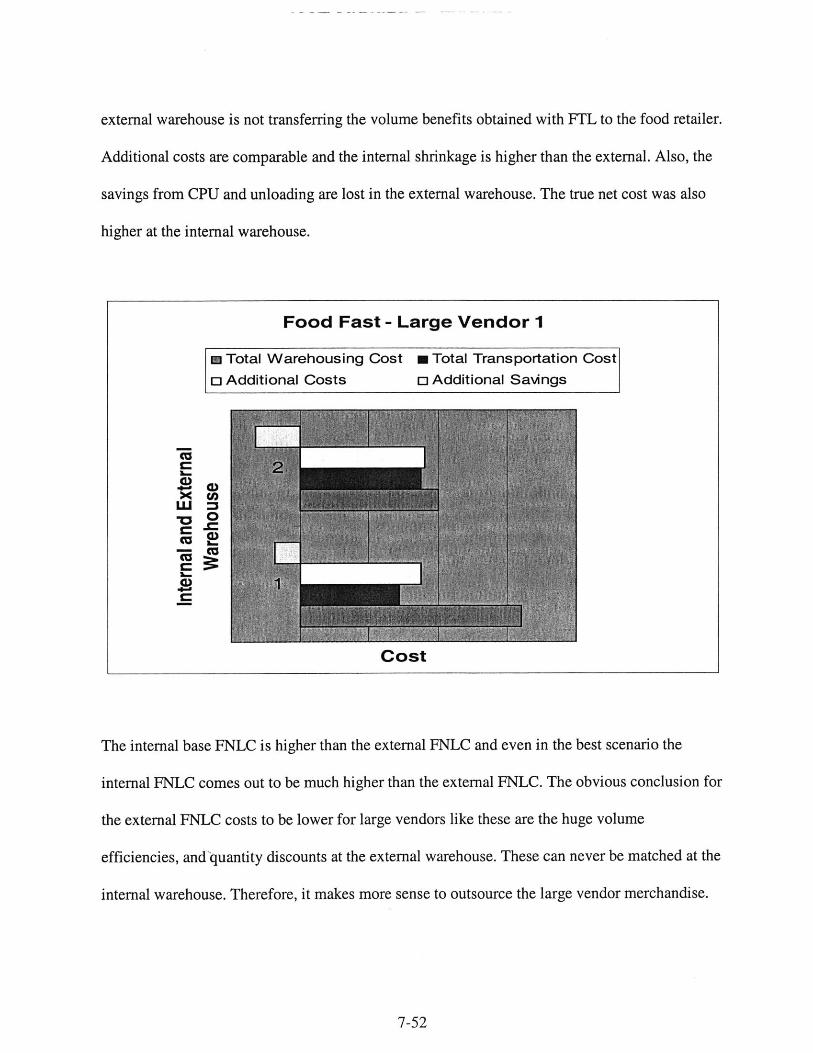
external warehouse is not transferring the volume benefits obtained with FTL to the food retailer.
Additional costs are comparable and the internal shrinkage is higher than the external. Also, the
savings from CPU and unloading are lost in the external warehouse. The true net cost was also
higher at the internal warehouse.
Food Fast - Large Vendor 1
m Total Warehousing Cost
o Additional Costs
* Total Transportation Cost
o Additional Savings
Cost
The internal base FNLC is higher than the external FNLC and even in the best scenario the
internal FNLC comes out to be much higher than the external FNLC. The obvious conclusion for
the external FNLC costs to be lower for large vendors like these are the huge volume
efficiencies, and'quantity discounts at the external warehouse. These can never be matched at the
internal warehouse. Therefore, it makes more sense to outsource the large vendor merchandise.
7-52
()
0
ccB::
L.
co-Cu
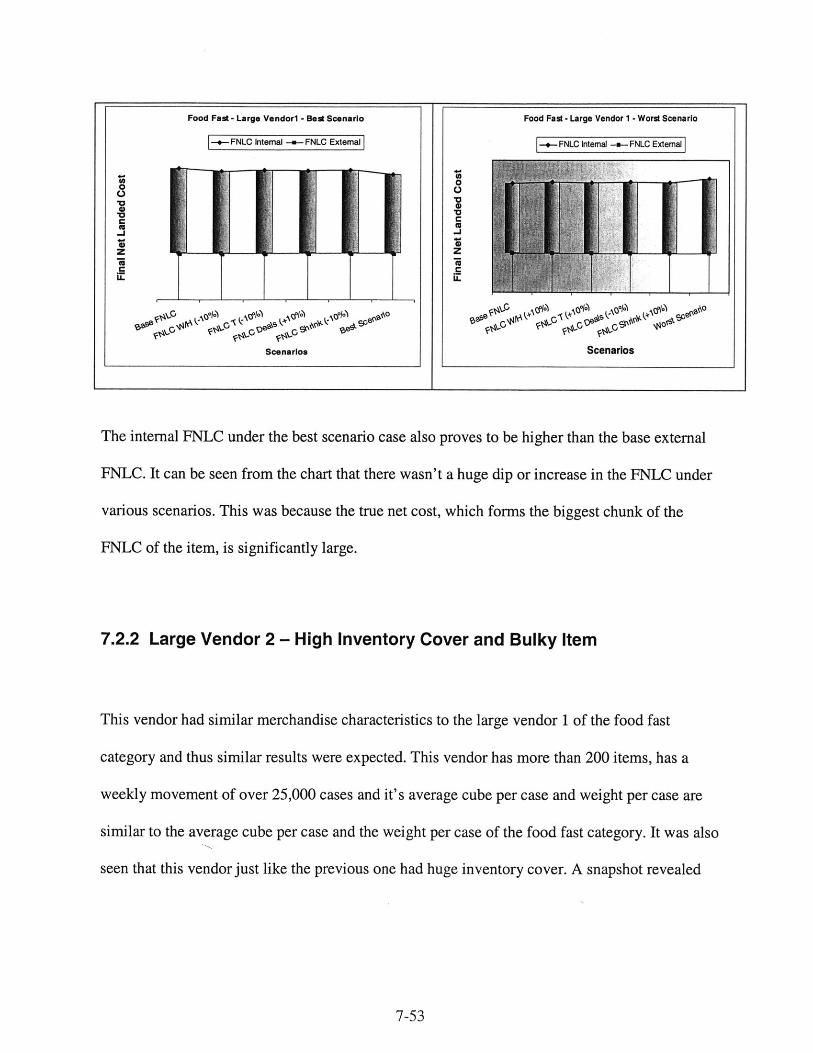
Foo FM LrgeVedoi Be Senri Fod ag- arg Vndr -. or Senri
-- FNLC Internal -e- FNLC Extemal -+-FNLC Intemal -a- FNLC External
000
C
z z
U..
1-4
Scenarios Scenarios
The internal FNLC under the best scenario case also proves to be higher than the base external
FNLC. It can be seen from the chart that there wasn't a huge dip or increase in the FNLC under
various scenarios. This was because the true net cost, which forms the biggest chunk of the
FNLC of the item, is significantly large.
7.2.2 Large Vendor 2 - High Inventory Cover and Bulky Item
This vendor had similar merchandise characteristics to the large vendor 1 of the food fast
category and thus similar results were expected. This vendor has more than 200 items, has a
weekly movement of over 25,000 cases and it's average cube per case and weight per case are
similar to the average cube per case and the weight per case of the food fast category. It was also
seen that this vendor just like the previous one had huge inventory cover. A snapshot revealed
7-53
Food Fast - Large Vendor1 - Best Scenario Food Fast -Large Vendor I - Worst Scenario
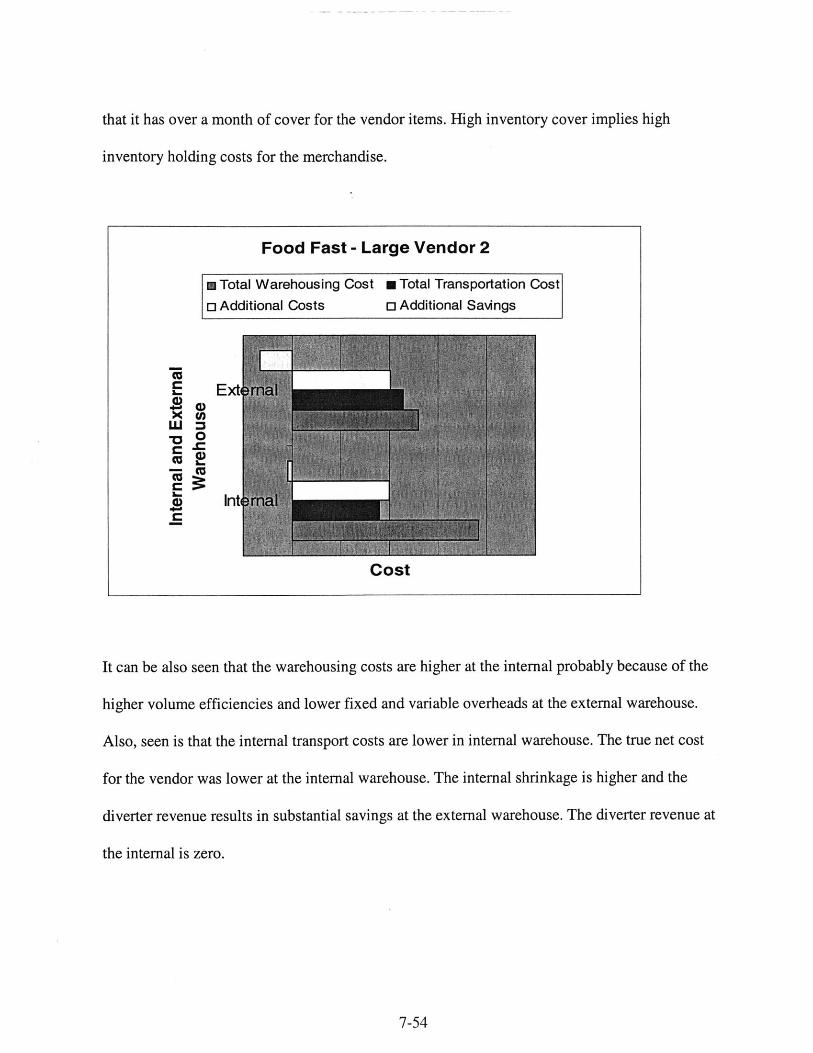
that it has over a month of cover for the vendor items. High inventory cover implies high
inventory holding costs for the merchandise.
Food Fast - Large Vendor 2
m Total Warehousing Cost
o Additional Costs
m Total Transportation Cost
o Additional Savings
Cost
It can be also seen that the warehousing costs are higher at the internal probably because of the
higher volume efficiencies and lower fixed and variable overheads at the external warehouse.
Also, seen is that the internal transport costs are lower in internal warehouse. The true net cost
for the vendor was lower at the internal warehouse. The internal shrinkage is higher and the
diverter revenue results in substantial savings at the external warehouse. The diverter revenue at
the internal is zero.
7-54
I-U)
w~0Cu
1~U)4..
4)
0
cc
Ir
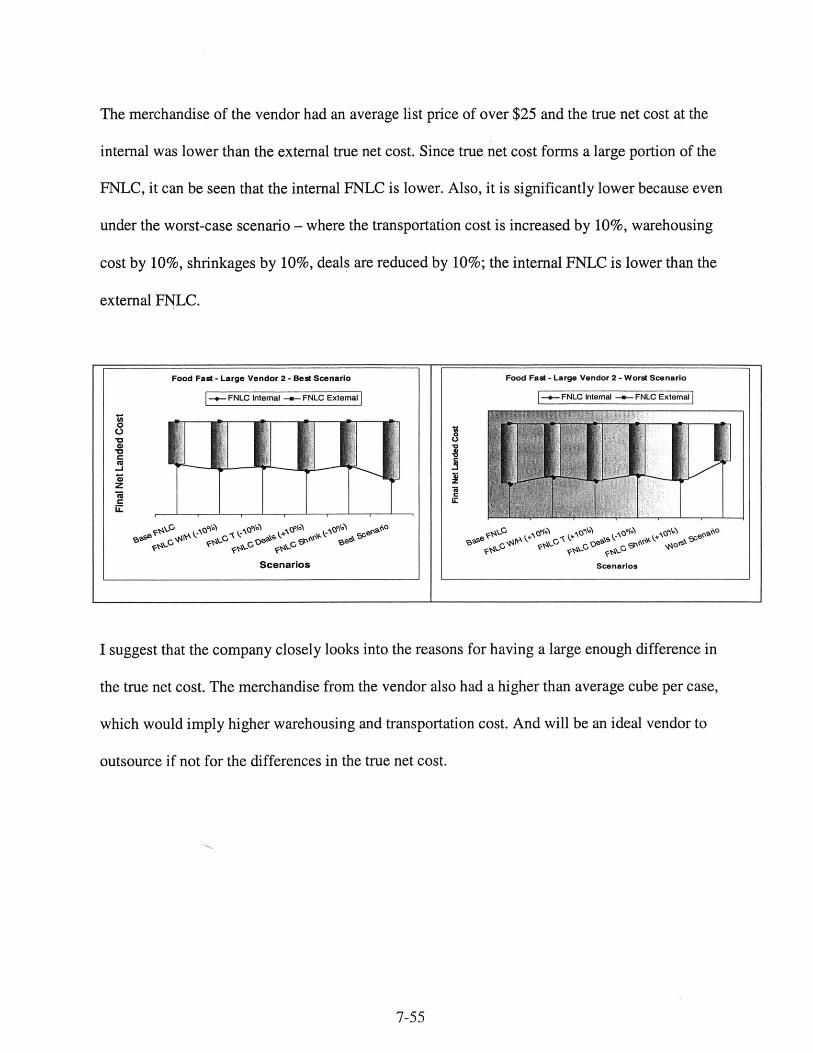
The merchandise of the vendor had an average list price of over $25 and the true net cost at the
internal was lower than the external true net cost. Since true net cost forms a large portion of the
FNLC, it can be seen that the internal FNLC is lower. Also, it is significantly lower because even
under the worst-case scenario - where the transportation cost is increased by 10%, warehousing
cost by 10%, shrinkages by 10%, deals are reduced by 10%; the internal FNLC is lower than the
external FNLC.
Food Fast - Large Vendor 2 - Best Scenario Food Fast - Large Vendor 2 - Worst Scenario
-.- FNLC Internal --- FNLC External -+- FNLC Internal -a- FNLC Extemal
4)
z -IC
Scenarios Scenarios
I suggest that the company closely looks into the reasons for having a large enough difference in
the true net cost. The merchandise from the vendor also had a higher than average cube per case,
which would imply higher warehousing and transportation cost. And will be an ideal vendor to
outsource if not for the differences in the true net cost.
7-55
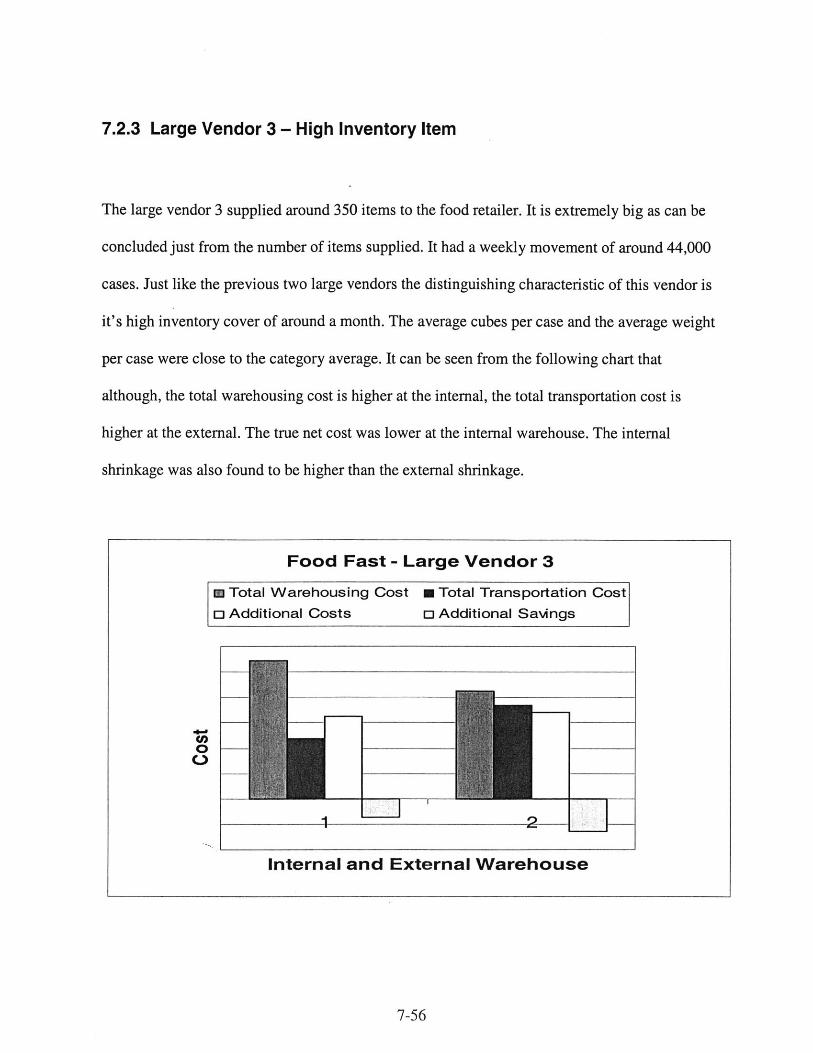
7.2.3 Large Vendor 3 - High Inventory Item
The large vendor 3 supplied around 350 items to the food retailer. It is extremely big as can be
concluded just from the number of items supplied. It had a weekly movement of around 44,000
cases. Just like the previous two large vendors the distinguishing characteristic of this vendor is
it's high inventory cover of around a month. The average cubes per case and the average weight
per case were close to the category average. It can be seen from the following chart that
although, the total warehousing cost is higher at the internal, the total transportation cost is
higher at the external. The true net cost was lower at the internal warehouse. The internal
shrinkage was also found to be higher than the external shrinkage.
7-56
Food Fast - Large Vendor 3
m Total Warehousing Cost m Total Transportation Cost
o Additional Costs o Additional Savings
0dn
Internal and External Warehouse
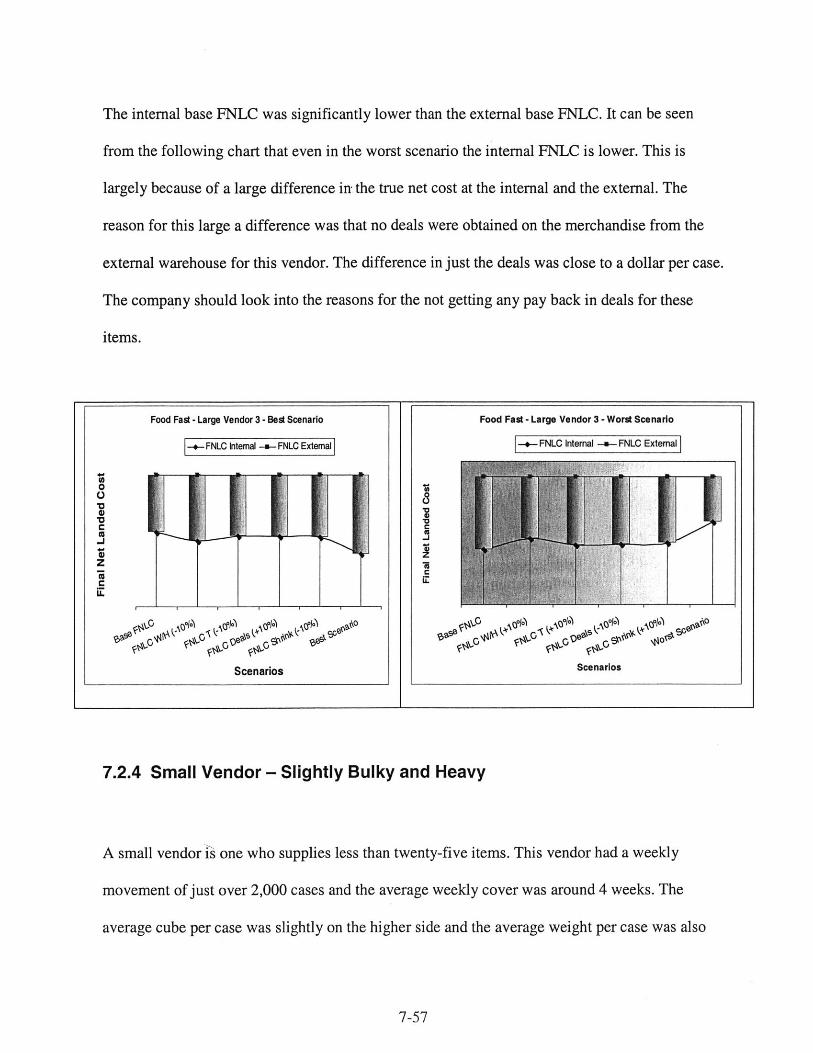
The internal base FNLC was significantly lower than the external base FNLC. It can be seen
from the following chart that even in the worst scenario the internal FNLC is lower. This is
largely because of a large difference in the true net cost at the internal and the external. The
reason for this large a difference was that no deals were obtained on the merchandise from the
external warehouse for this vendor. The difference in just the deals was close to a dollar per case.
The company should look into the reasons for the not getting any pay back in deals for these
items.
Food Fast - Large Vendor 3 - Best Scenario Food Fast - Large Vendor 3 - Worst Scenario
-+-FNLC Internal -.-- FNLC External -+ FNLC Intemal -u- FNLC External
0
zE
Scenarios Scenarios
7.2.4 Small Vendor - Slightly Bulky and Heavy
A small vendor is one who supplies less than twenty-five items. This vendor had a weekly
movement of just over 2,000 cases and the average weekly cover was around 4 weeks. The
average cube per case was slightly on the higher side and the average weight per case was also
7-57
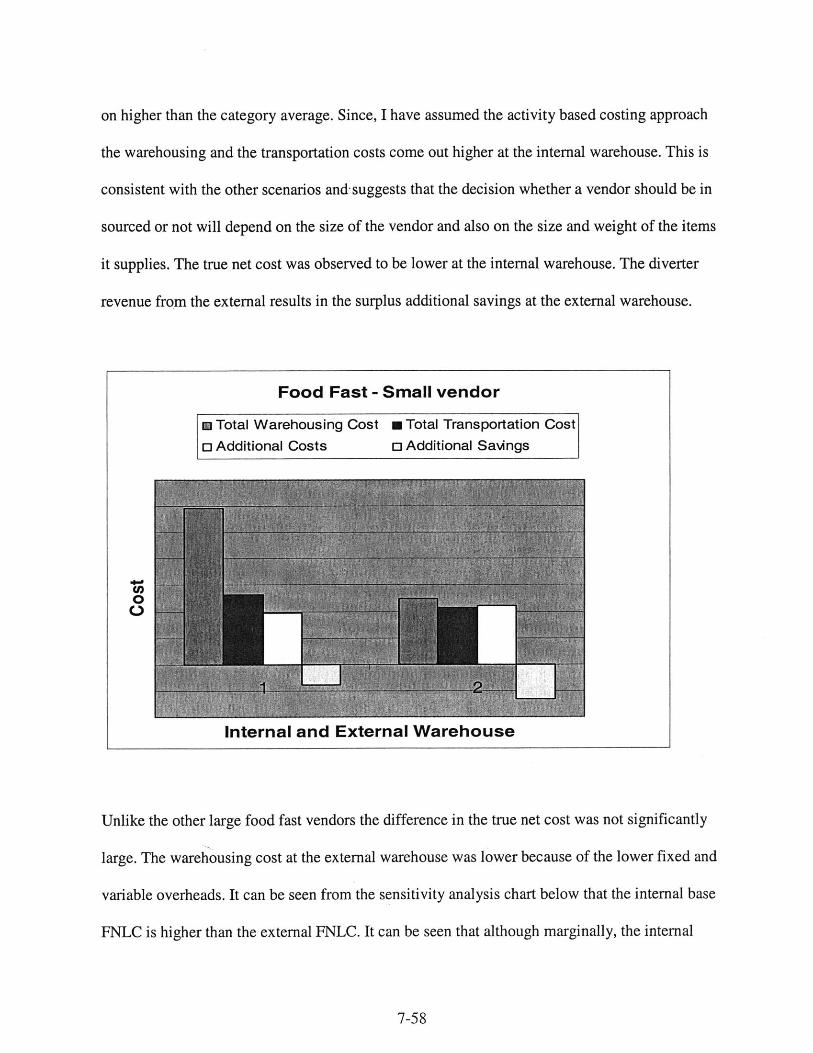
on higher than the category average. Since, I have assumed the activity based costing approach
the warehousing and the transportation costs come out higher at the internal warehouse. This is
consistent with the other scenarios and- suggests that the decision whether a vendor should be in
sourced or not will depend on the size of the vendor and also on the size and weight of the items
it supplies. The true net cost was observed to be lower at the internal warehouse. The diverter
revenue from the external results in the surplus additional savings at the external warehouse.
Food Fast - Small vendor
m Total Warehousing Cost
o Additional Costs
* Total Transportation Cost
o Additional Saings
00
Internal and External Warehouse
Unlike the other large food fast vendors the difference in the true net cost was not significantly
large. The warehousing cost at the external warehouse was lower because of the lower fixed and
variable overheads. It can be seen from the sensitivity analysis chart below that the internal base
FNLC is higher than the external FNLC. It can be seen that although marginally, the internal
7-58
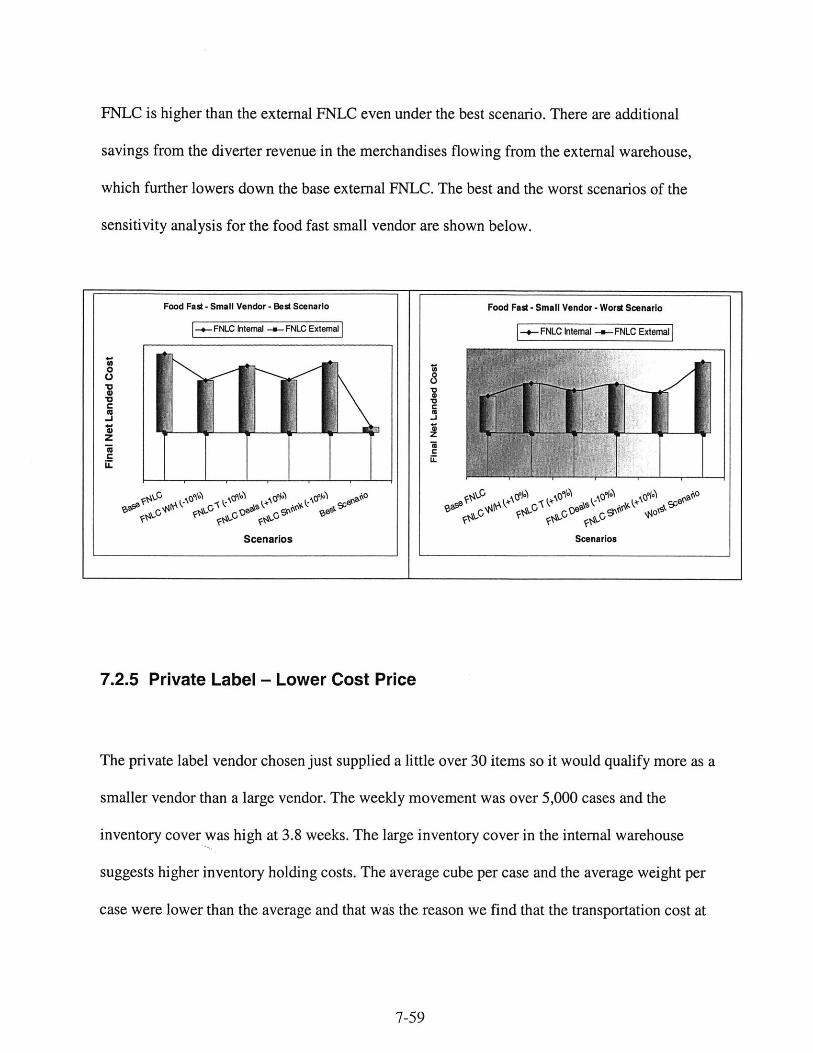
FNLC is higher than the external FNLC even under the best scenario. There are additional
savings from the diverter revenue in the merchandises flowing from the external warehouse,
which further lowers down the base external FNLC. The best and the worst scenarios of the
sensitivity analysis for the food fast small vendor are shown below.
Food Fast - Small Vendor - Best Scenario Food Fast - Small Vendor - Worst Scenario
-+- FNLC Internal -i- FNLC External _, FNLC Internal --- FNLC External
0
z
Scenarios Scenarios
7.2.5 Private Label - Lower Cost Price
The private label vendor chosen just supplied a little over 30 items so it would qualify more as a
smaller vendor than a large vendor. The weekly movement was over 5,000 cases and the
inventory cover was high at 3.8 weeks. The large inventory cover in the internal warehouse
suggests higher inventory holding costs. The average cube per case and the average weight per
case were lower than the average and that was the reason we find that the transportation cost at
7-59
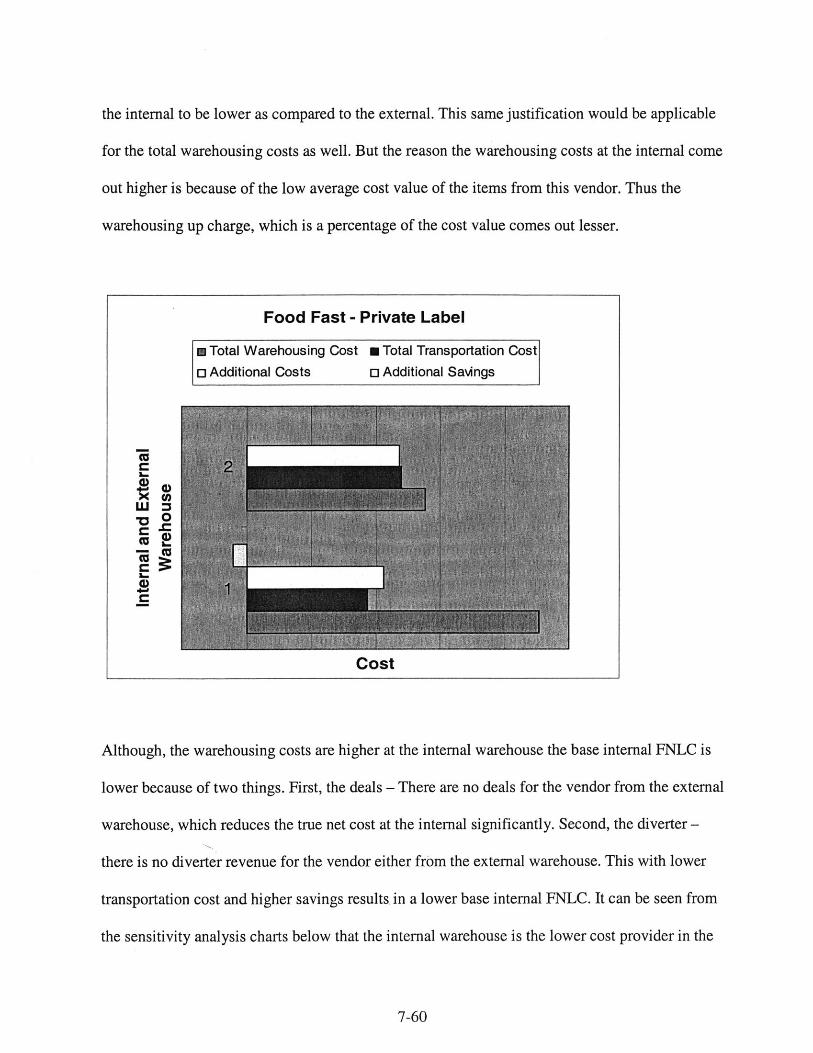
the internal to be lower as compared to the external. This same justification would be applicable
for the total warehousing costs as well. But the reason the warehousing costs at the internal come
out higher is because of the low average cost value of the items from this vendor. Thus the
warehousing up charge, which is a percentage of the cost value comes out lesser.
Although, the warehousing costs are higher at the internal warehouse the base internal FNLC is
lower because of two things. First, the deals - There are no deals for the vendor from the external
warehouse, which reduces the true net cost at the internal significantly. Second, the diverter -
there is no diverter revenue for the vendor either from the external warehouse. This with lower
transportation cost and higher savings results in a lower base internal FNLC. It can be seen from
the sensitivity analysis charts below that the internal warehouse is the lower cost provider in the
7-60
Food Fast - Private Label
m Total Warehousing Cost m Total Transportation Cost
o Additional Costs o Additional Savings
V0
CC
Cost
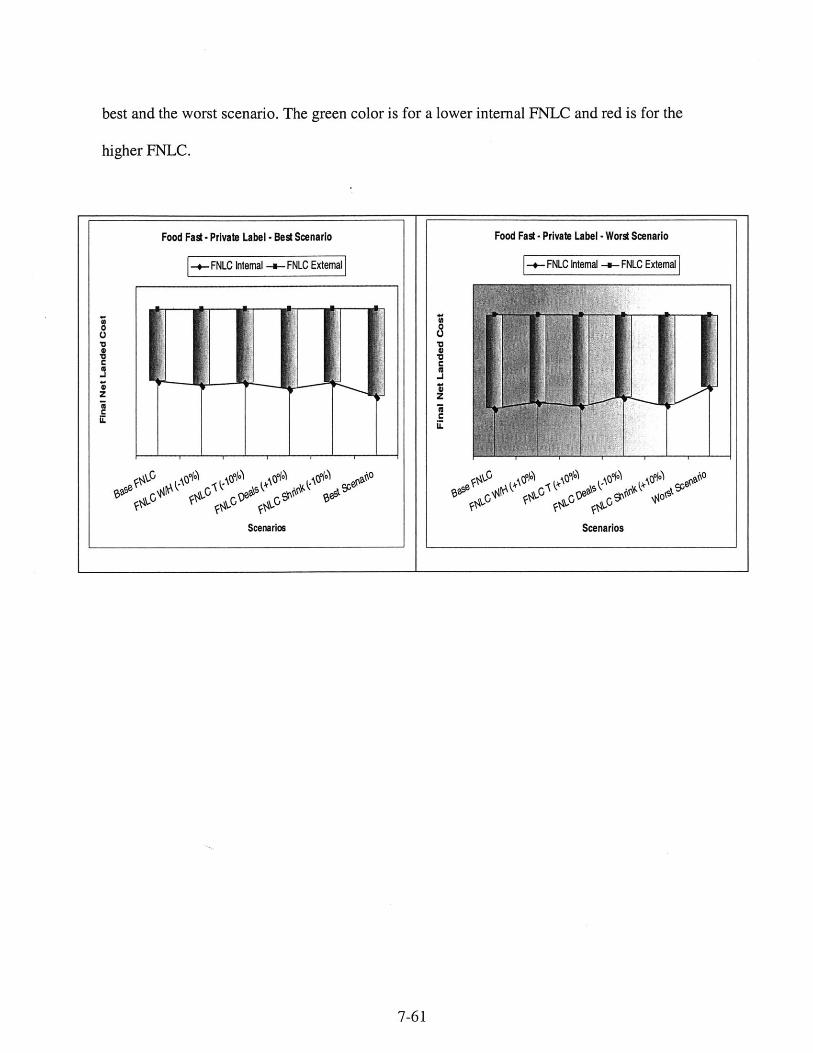
best and the worst scenario. The green color is for a lower internal FNLC and red is for the
higher FNLC.
*1~
7-61
Food Fat -Private Label -Bes Scenario
-- FNLC Intemal -a-FNLC External
'a
C
Ps 0
Scenarios
Food Fas -Private Label -Word Scenario
--- FNLC Internal -- FNLC External
z
S r
Scenarios
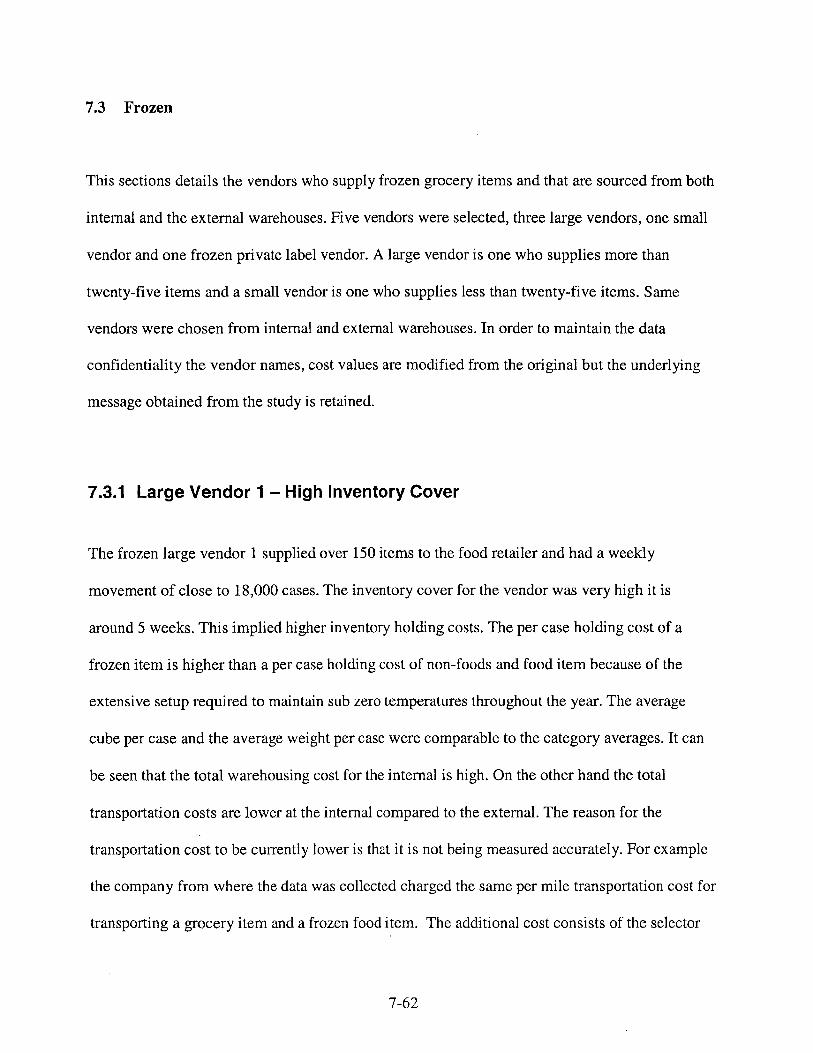
7.3 Frozen
This sections details the vendors who supply frozen grocery items and that are sourced from both
internal and the external warehouses. Five vendors were selected, three large vendors, one small
vendor and one frozen private label vendor. A large vendor is one who supplies more than
twenty-five items and a small vendor is one who supplies less than twenty-five items. Same
vendors were chosen from internal and external warehouses. In order to maintain the data
confidentiality the vendor names, cost values are modified from the original but the underlying
message obtained from the study is retained.
7.3.1 Large Vendor 1 - High Inventory Cover
The frozen large vendor 1 supplied over 150 items to the food retailer and had a weekly
movement of close to 18,000 cases. The inventory cover for the vendor was very high it is
around 5 weeks. This implied higher inventory holding costs. The per case holding cost of a
frozen item is higher than a per case holding cost of non-foods and food item because of the
extensive setup required to maintain sub zero temperatures throughout the year. The average
cube per case and the average weight per case were comparable to the category averages. It can
be seen that the total warehousing cost for the internal is high. On the other hand the total
transportation costs are lower at the internal compared to the external. The reason for the
transportation cost to be currently lower is that it is not being measured accurately. For example
the company from where the data was collected charged the same per mile transportation cost for
transporting a grocery item and a frozen food item. The additional cost consists of the selector
7-62
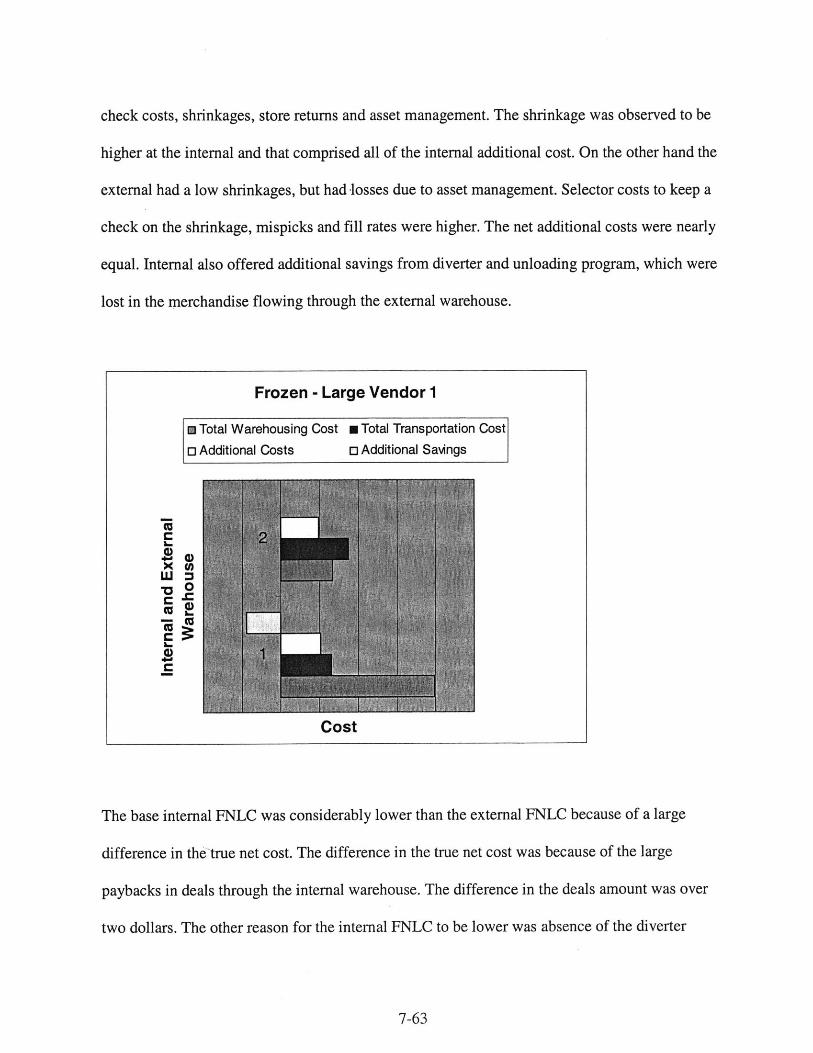
check costs, shrinkages, store returns and asset management. The shrinkage was observed to be
higher at the internal and that comprised all of the internal additional cost. On the other hand the
external had a low shrinkages, but had losses due to asset management. Selector costs to keep a
check on the shrinkage, mispicks and fill rates were higher. The net additional costs were nearly
equal. Internal also offered additional savings from diverter and unloading program, which were
lost in the merchandise flowing through the external warehouse.
The base internal FNLC was considerably lower than the external FNLC because of a large
difference in the-true net cost. The difference in the true net cost was because of the large
paybacks in deals through the internal warehouse. The difference in the deals amount was over
two dollars. The other reason for the internal FNLC to be lower was absence of the diverter
7-63
Frozen - Large Vendor 1
m Total Warehousing Cost m Total Transportation Cost
o Additional Costs o Additional Savings
0C
Cc4)
Cost
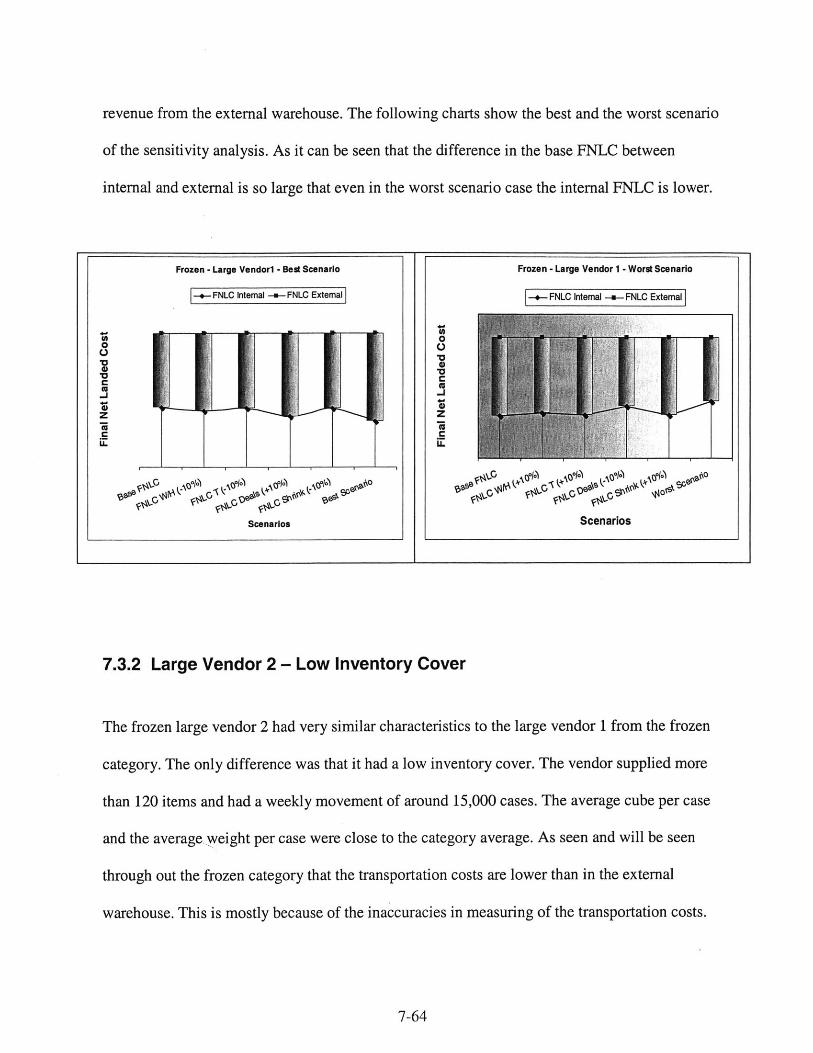
revenue from the external warehouse. The following charts show the best and the worst scenario
of the sensitivity analysis. As it can be seen that the difference in the base FNLC between
internal and external is so large that even in the worst scenario case the internal FNLC is lower.
Frozen - Large Vendorl - Best Scenario Frozen - Large Vendor 1 - Worst Scenario
-+- FNLC Internal -i-- FNLC External --- FNLC Intemal -i-- FNLC External
S0
*V
S
Scenarios SCenarios
7.3.2 Large Vendor 2 - Low Inventory Cover
The frozen large vendor 2 had very similar characteristics to the large vendor 1 from the frozen
category. The only difference was that it had a low inventory cover. The vendor supplied more
than 120 items and had a weekly movement of around 15,000 cases. The average cube per case
and the average weight per case were close to the category average. As seen and will be seen
through out the frozen category that the transportation costs are lower than in the external
warehouse. This is mostly because of the inaccuracies in measuring of the transportation costs.
7-64
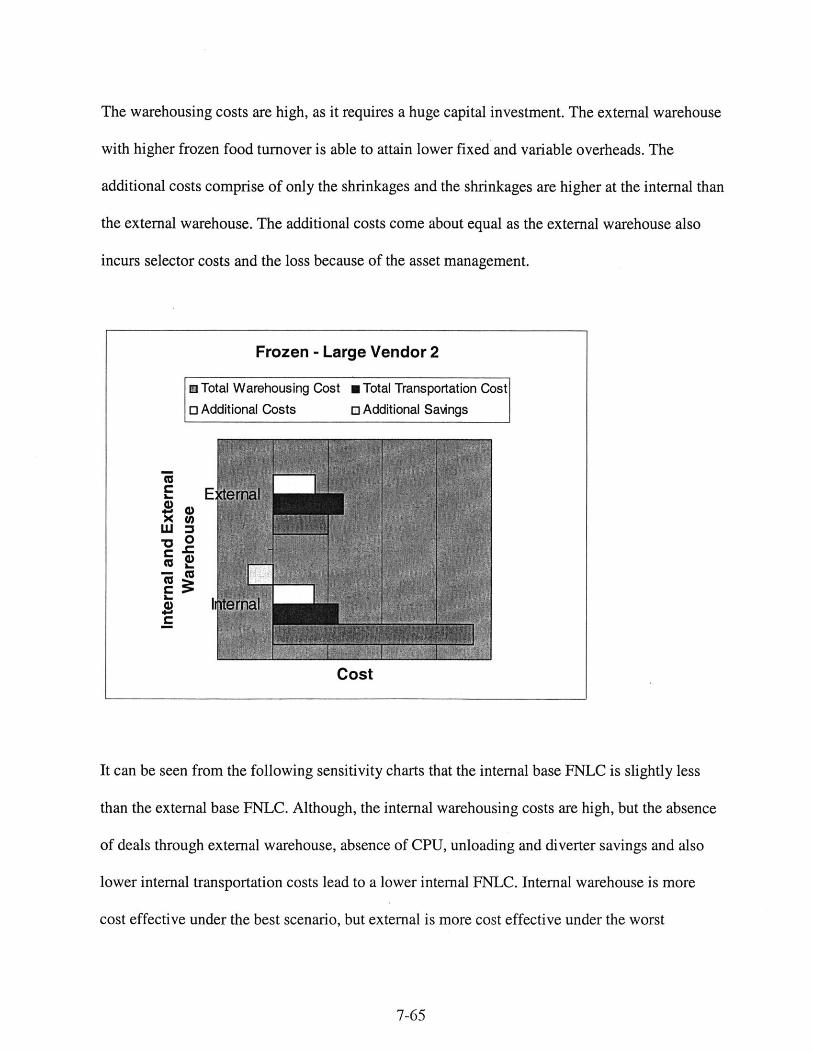
The warehousing costs are high, as it requires a huge capital investment. The external warehouse
with higher frozen food turnover is able to attain lower fixed and variable overheads. The
additional costs comprise of only the shrinkages and the shrinkages are higher at the internal than
the external warehouse. The additional costs come about equal as the external warehouse also
incurs selector costs and the loss because of the asset management.
It can be seen from the following sensitivity charts that the internal base FNLC is slightly less
than the external base FNLC. Although, the internal warehousing costs are high, but the absence
of deals through external warehouse, absence of CPU, unloading and diverter savings and also
lower internal transportation costs lead to a lower internal FNLC. Internal warehouse is more
cost effective under the best scenario, but external is more cost effective under the worst
7-65
Frozen - Large Vendor 2
m Total Warehousing Cost m Total Transportation Cost
o Additional Costs o Additional Savings
E
-D
c N
Cost
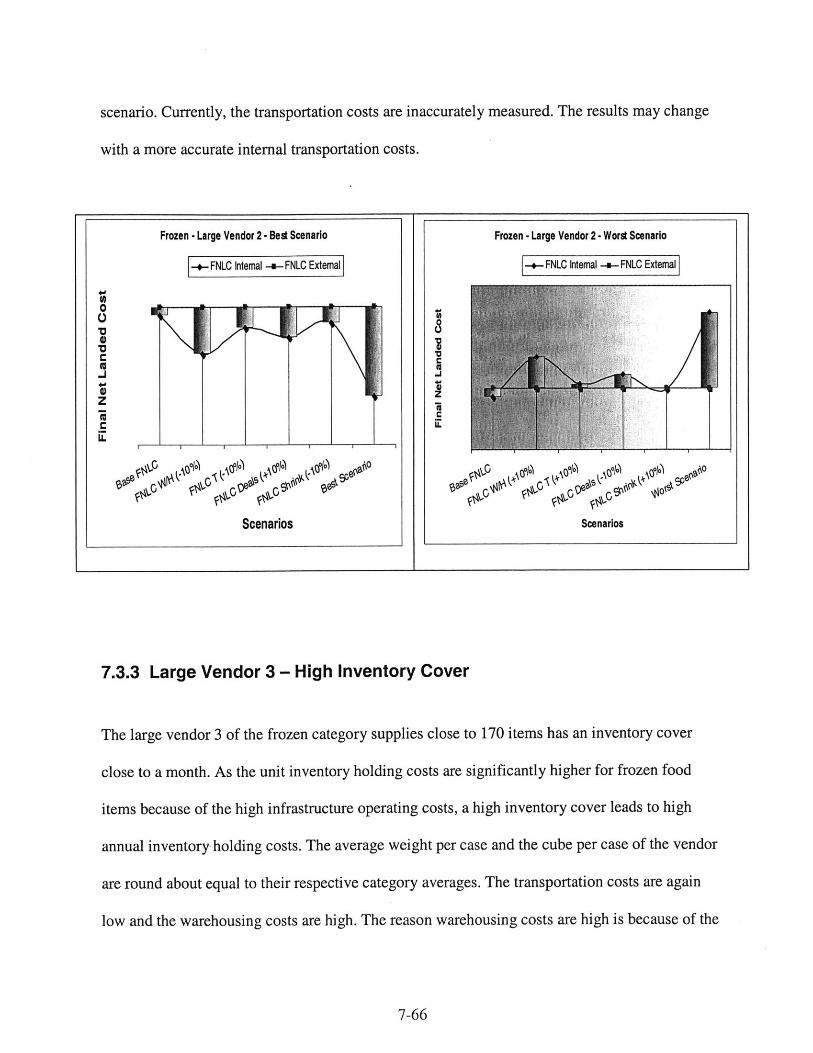
scenario. Currently, the transportation costs are inaccurately measured. The results may change
with a more accurate internal transportation costs.
7.3.3 Large Vendor 3 - High Inventory Cover
The large vendor 3 of the frozen category supplies close to 170 items has an inventory cover
close to a month. As the unit inventory holding costs are significantly higher for frozen food
items because of the high infrastructure operating costs, a high inventory cover leads to high
annual inventory holding costs. The average weight per case and the cube per case of the vendor
are round about equal to their respective category averages. The transportation costs are again
low and the warehousing costs are high. The reason warehousing costs are high is because of the
7-66
Frozen -Large Vendor 2 - Best Scenario
-*FNLC Internal -a-FNLC External
C
00 ve O
C5
Scnaio
Frozen - Large Vendor 2 -Worst Scenario
-+-FNLC Intemal --- FNLC Extemal
-
Scenarios
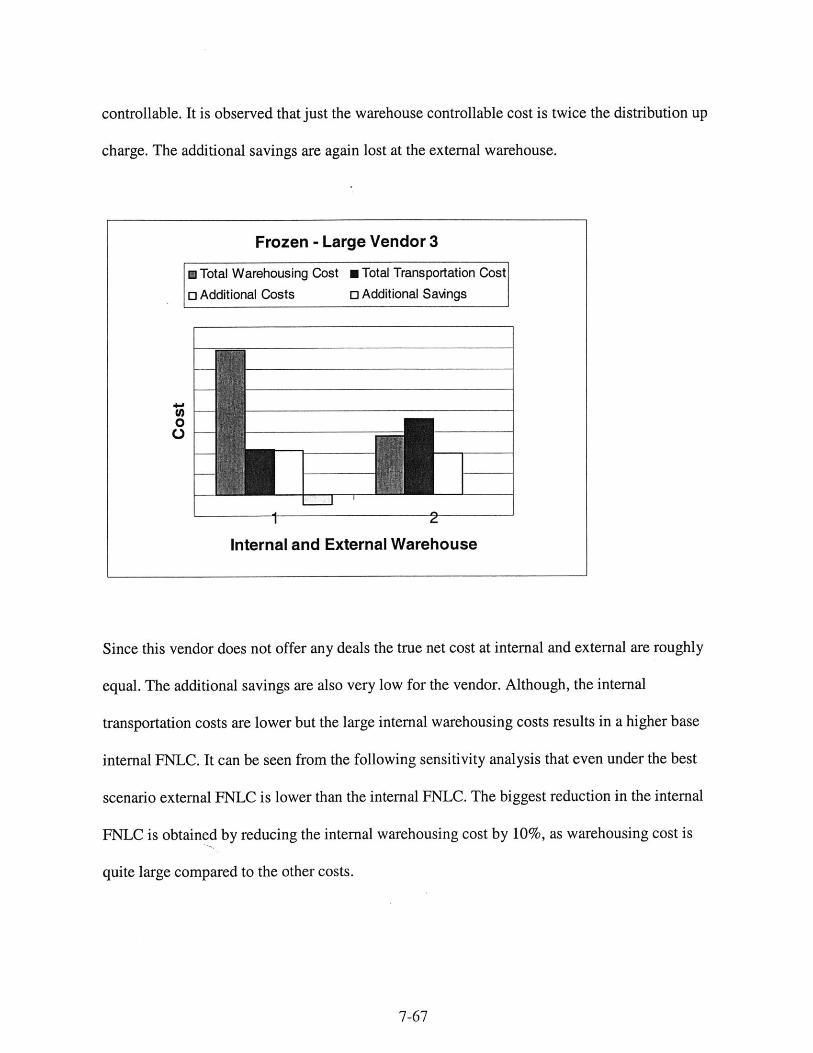
controllable. It is observed that just the warehouse controllable cost is twice the distribution up
charge. The additional savings are again lost at the external warehouse.
Since this vendor does not offer any deals the true net cost at internal and external are roughly
equal. The additional savings are also very low for the vendor. Although, the internal
transportation costs are lower but the large internal warehousing costs results in a higher base
internal FNLC. It can be seen from the following sensitivity analysis that even under the best
scenario external FNLC is lower than the internal FNLC. The biggest reduction in the internal
FNLC is obtained by reducing the internal warehousing cost by 10%, as warehousing cost is
quite large compared to the other costs.
7-67
Frozen - Large Vendor 3
m Total Warehousing Cost m Total Transportation Cost
o Additional Costs o Additional Savings
(0
a a2
Internal and External Warehouse
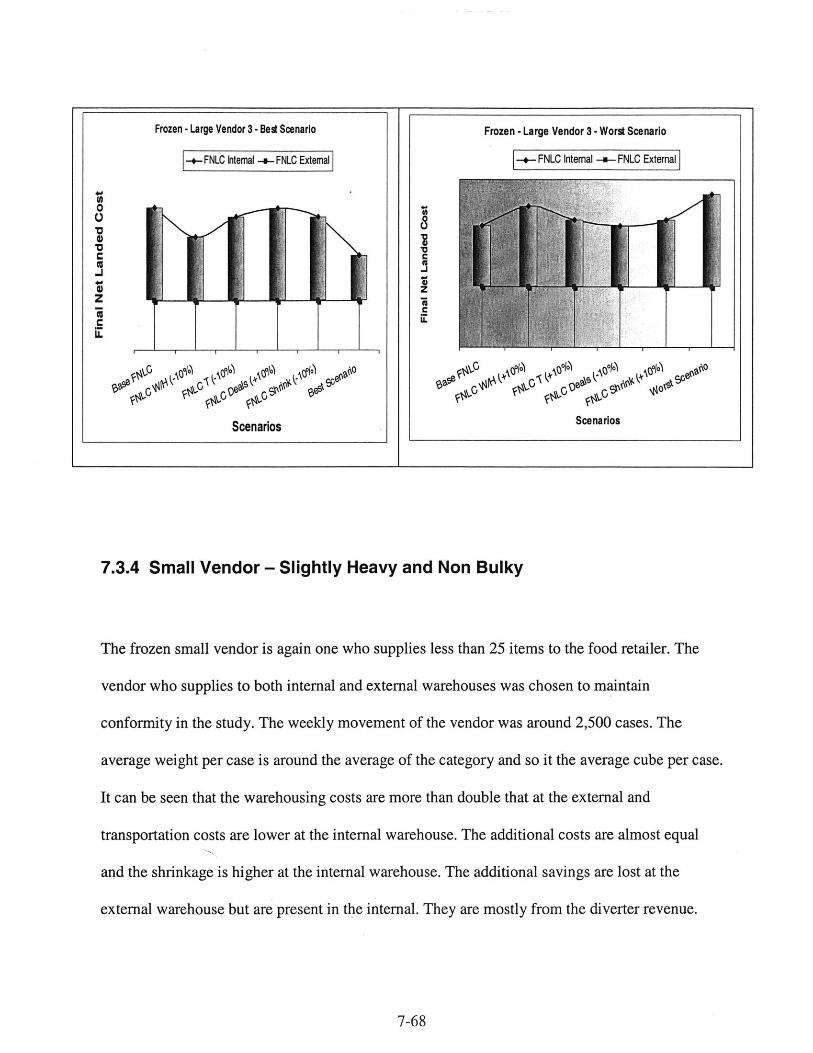
7.3.4 Small Vendor - Slightly Heavy and Non Bulky
The frozen small vendor is again one who supplies less than 25 items to the food retailer. The
vendor who supplies to both internal and external warehouses was chosen to maintain
conformity in the study. The weekly movement of the vendor was around 2,500 cases. The
average weight per case is around the average of the category and so it the average cube per case.
It can be seen that the warehousing costs are more than double that at the external and
transportation costs are lower at the internal warehouse. The additional costs are almost equal
and the shrinkage is higher at the internal warehouse. The additional savings are lost at the
external warehouse but are present in the internal. They are mostly from the diverter revenue.
7-68
Frozen - Large Vendor 3 -Best Scenario
FL temnaI FNL Exteral
0
Z0Z)C0
Scnaio
Frozen - Large Vendor 3 - Worst Scenario
-.- FNLC Internal -- FNLC External
I
f -
Scenarios
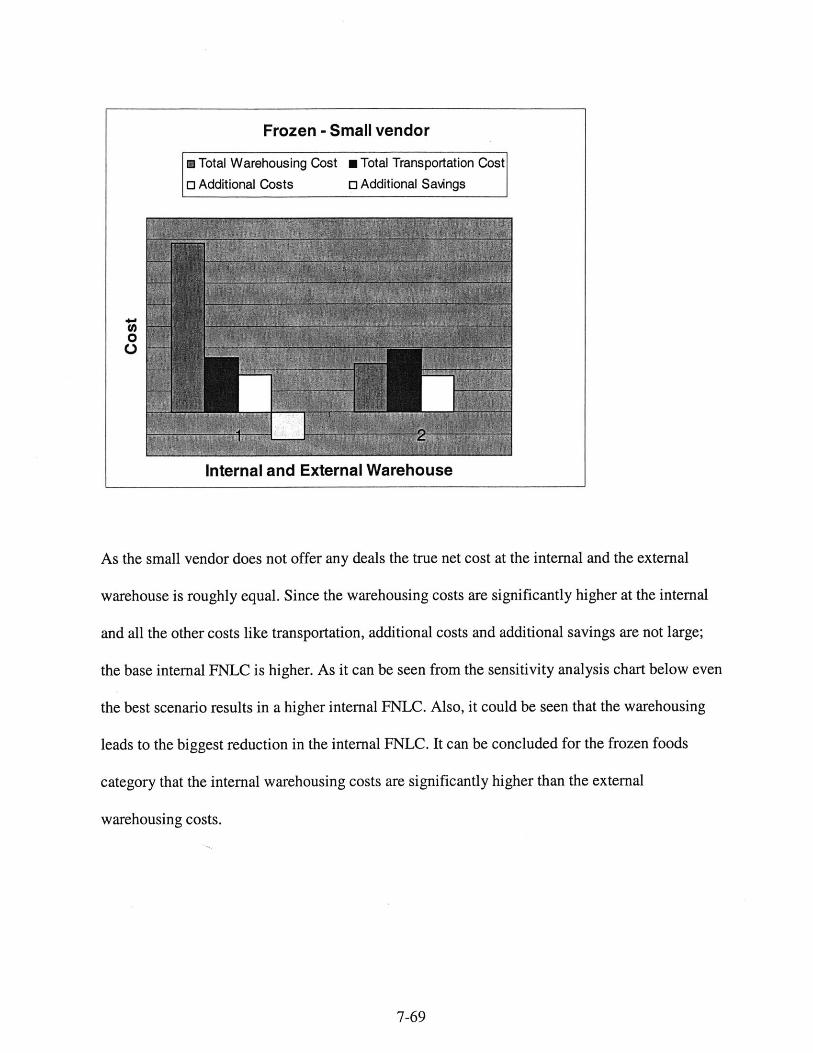
As the small vendor does not offer any deals the true net cost at the internal and the external
warehouse is roughly equal. Since the warehousing costs are significantly higher at the internal
and all the other costs like transportation, additional costs and additional savings are not large;
the base internal FNLC is higher. As it can be seen from the sensitivity analysis chart below even
the best scenario results in a higher internal FNLC. Also, it could be seen that the warehousing
leads to the biggest reduction in the internal FNLC. It can be concluded for the frozen foods
category that the internal warehousing costs are significantly higher than the external
warehousing costs.
7-69
Frozen - Small vendor
m Total Warehousing Cost * Total Transportation Cost
o Additional Costs o Additional Savings
00.
Internal and External Warehouse

Ii __________________________________________________
7.3.5 Private Label - Low Item Cost
The private label supplies around 50 items to the food retailer, which makes it a sufficiently large
and stable vendor. It had a weekly movement of around 8,000 cases and had a low weekly cover
much lower than the category average. The average cube per case and the average weight per
case are around the category averages. The important things to note here is that unlike the others
its external transportation cost are lower than its internal transportation costs. The reason behind
this is that it is a low cost item and the transportation up charge, which is a percentage of the list
price, gets lowered as the list price is lowered. So the important conclusion here is that all low
cost items should be outsourced, as the warehousing and transportation up charges will be
7-70
Frozen - Small Vendor - Best Scenario
-+--FNLC Internal -a-FNLCExternal
0V3
U)
JU
-j
iiz
Scenarios
Frozen -Small Vendor -Worst Scenario
-+FNLC Internal -i-FNLC External
0(U
44i,E
Scenarios
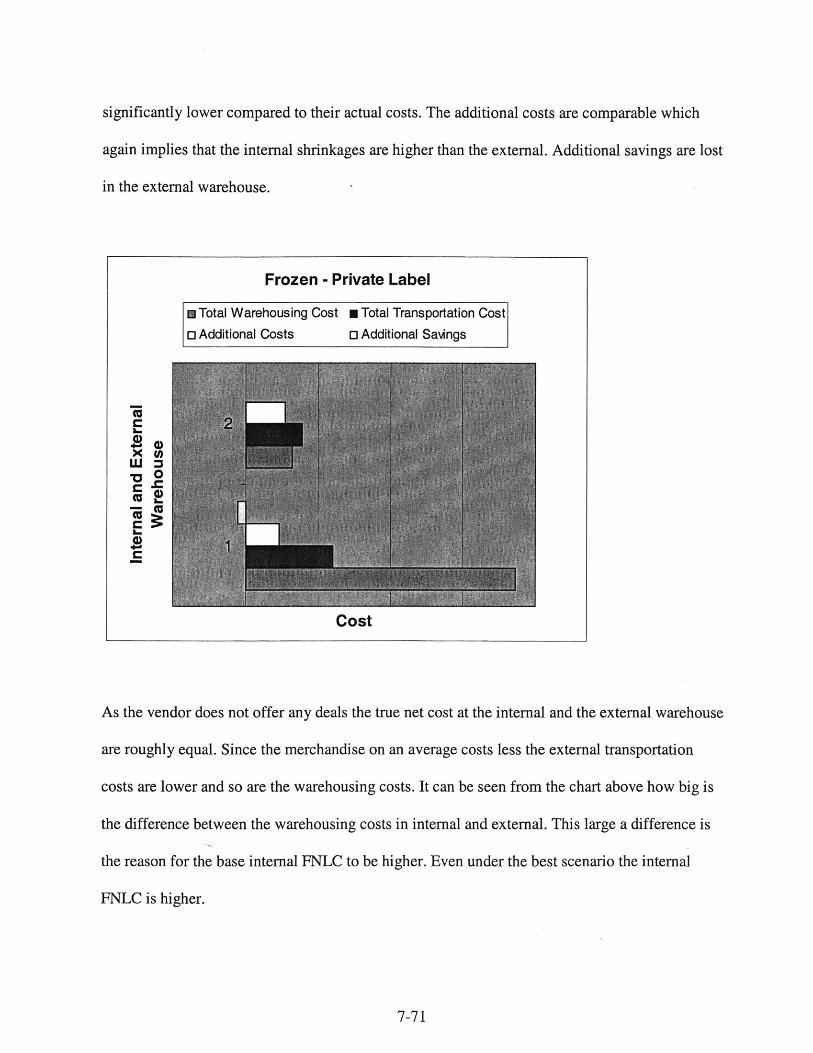
significantly lower compared to their actual costs. The additional costs are comparable which
again implies that the internal shrinkages are higher than the external. Additional savings are lost
in the external warehouse.
As the vendor does not offer any deals the true net cost at the internal and the external warehouse
are roughly equal. Since the merchandise on an average costs less the external transportation
costs are lower and so are the warehousing costs. It can be seen from the chart above how big is
the difference between the warehousing costs in internal and external. This large a difference is
the reason for the base internal FNLC to be higher. Even under the best scenario the internal
FNLC is higher.
7-71
Frozen - Private Label
m Total Warehousing Cost n Total Transportation Cost
o Additional Costs o Additional Savings
0.
c -2
Cost
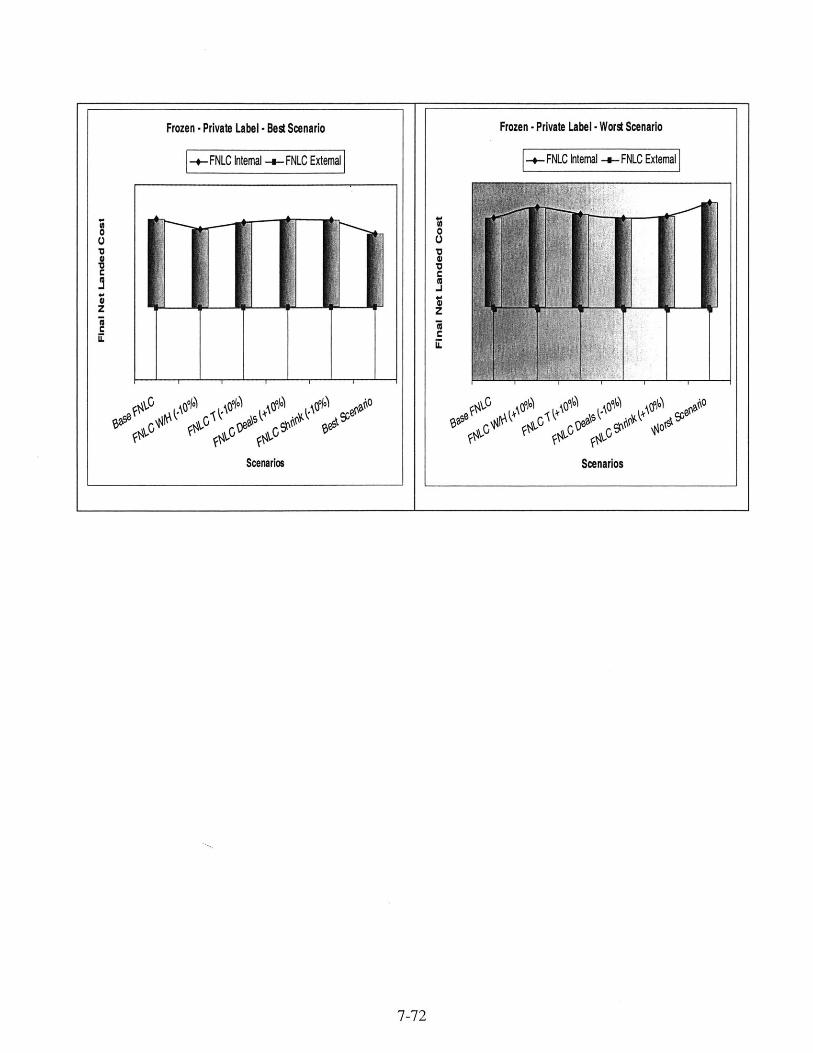
7-72
Frozen - Private Label - Bes Scenario
+FNLC Intemal -a- FNLC External
0
ii
C
Scenarios
Frozen -Private Label - Worst Scenario
-FNLC Internal -a- ENLO External
0
C)
0L
0 ~ 0 f 0
Scnro
8 Results
The following tables show the quantitative results from the study. The comparison is done on
internal vs. external, which means if a cell says 'less' it means that 'the internal cost is less than
the external'. Similarly, more would indicate that the cost at the internal is more than the cost at
the external. The ratio, which is the last line of the following tables, conveys the 'internal favor-
ratio'. An 'internal favor-ratio' of 1/5 would suggest that costs are in favor of the internal 1 out
of 5 times. Every category has three tables the base case, the best scenario and the worst
scenario. The values that have changed from the base case in best or worst scenario are in blue.
Also, the detailed reasons to determine the cost differences for a vendor were beyond the scope
of the project so it has been left open and is suggested as an area for further research.
The quantitative results, which are discussed below, do not take into account the qualitative
reasons, which can be the determining force for an outsourcing / in sourcing decision. In order to
collect data on this a survey questionnaire was prepared. Since the project was on a tight
deadline the information obtained from the survey could not be analyzed. I therefore, like to
propose that as the next step towards doing a deeper cost benefit analysis on internal and external
warehousing. The survey questionnaire (Exhibit 10.5) was formed to capture the qualitative
differences between the internal and the external warehouses specifically for the non-food fast,
food fast and the frozen departments of the food retailer.
8-73
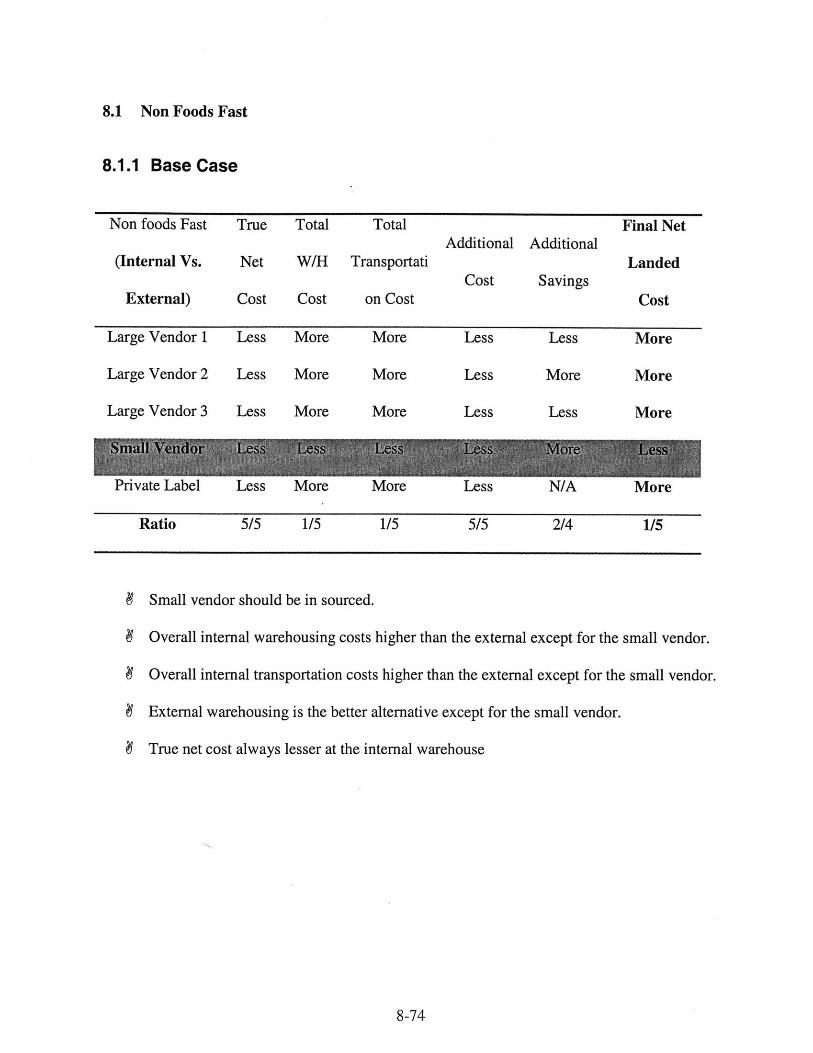
8.1 Non Foods Fast
8.1.1 Base Case
Non foods Fast True Total Total Final NetAdditional Additional
(Internal Vs. Net W/H Transportati LandedCost Savings
External) Cost Cost on Cost Cost
Large Vendor 1 Less More More Less Less More
Large Vendor 2 Less More More Less More More
Large Vendor 3 Less More More Less Less More
Private Label Less More More Less N/A More
Ratio 5/5 1/5 1/5 5/5 2/4 1/5
# Small vendor should be in sourced.
# Overall internal warehousing costs higher than the external except for the small vendor.
1 Overall internal transportation costs higher than the external except for the small vendor.
# External warehousing is the better alternative except for the small vendor.
# True net cost always lesser at the internal warehouse
8-74
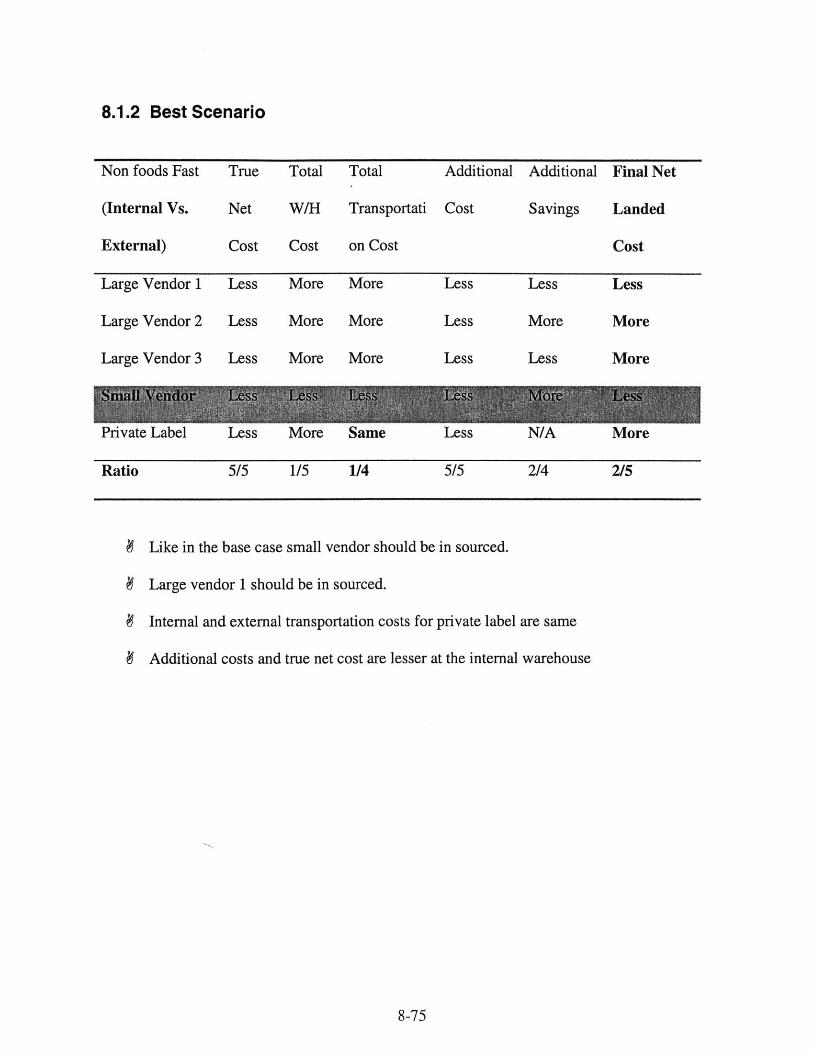
8.1.2 Best Scenario
Non foods Fast True Total Total Additional Additional Final Net
(Internal Vs. Net W/H Transportati Cost Savings Landed
External) Cost Cost on Cost Cost
Large Vendor 1 Less More More Less Less Less
Large Vendor 2 Less More More Less More More
Large Vendor 3 Less More More Less Less More
Private Label Less More Same Less N/A More
Ratio 5/5 1/5 1/4 5/5 2/4 2/5
Like in the base case small vendor should be in sourced.
Large vendor 1 should be in sourced.
Internal and external transportation costs for private label are same
Additional costs and true net cost are lesser at the internal warehouse
8-75
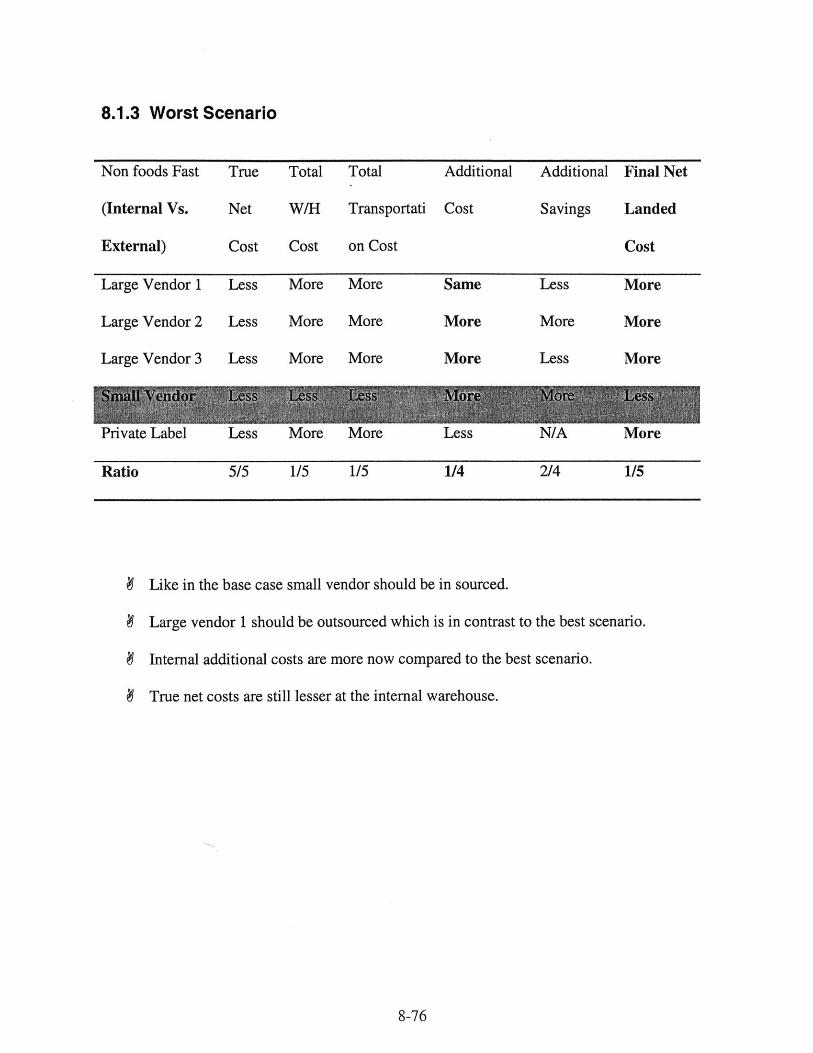
8.1.3 Worst Scenario
Non foods Fast True Total Total Additional Additional Final Net
(Internal Vs. Net W/H Transportati Cost Savings Landed
External) Cost Cost on Cost Cost
Large Vendor 1 Less More More Same Less More
Large Vendor 2 Less More More More More More
Large Vendor 3 Less More More More Less More
Private Label Less More More Less N/A More
Ratio 5/5 1/5 1/5 1/4 2/4 1/5
Like in the base case small vendor should be in sourced.
Large vendor 1 should be outsourced which is in contrast to the best scenario.
Internal additional costs are more now compared to the best scenario.
True net costs are still lesser at the internal warehouse.
8-76
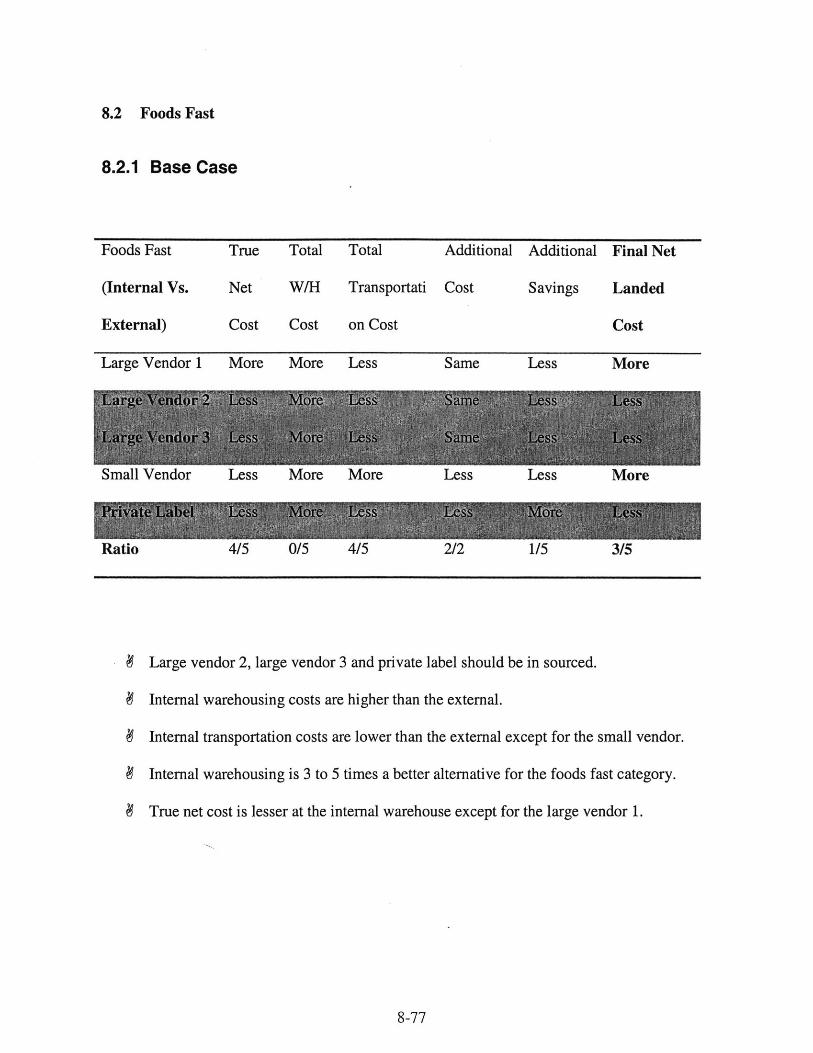
8.2 Foods Fast
8.2.1 Base Case
Foods Fast True Total Total Additional Additional Final Net
(Internal Vs. Net W/H Transportati Cost Savings Landed
External) Cost Cost on Cost Cost
Large Vendor 1 More More Less Same Less More
Small Vendor Less More More Less Less More
Ratio 4/5 0/5 4/5 2/2 1/5 3/5
Large vendor 2, large vendor 3 and private label should be in sourced.
Internal warehousing costs are higher than the external.
Internal transportation costs are lower than the external except for the small vendor.
Internal warehousing is 3 to 5 times a better alternative for the foods fast category.
True net cost is lesser at the internal warehouse except for the large vendor 1.
8-77
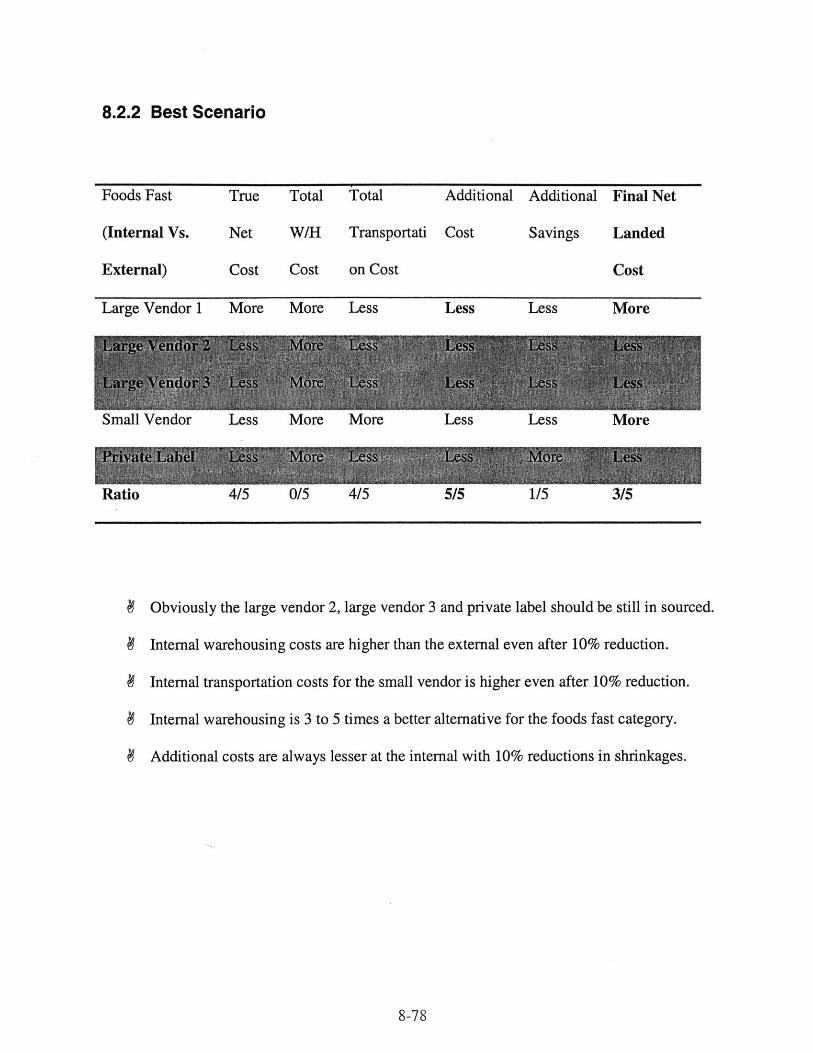
8.2.2 Best Scenario
Foods Fast True Total Total Additional Additional Final Net
(Internal Vs. Net W/H Transportati Cost Savings Landed
External) Cost Cost on Cost Cost
Large Vendor 1 More More Less Less Less More
Small Vendor Less More More Less Less More
Ratio 4/5 0/5 4/5 5/5 1/5 3/5
Obviously the large vendor 2, large vendor 3 and private label should be still in sourced.
Internal warehousing costs are higher than the external even after 10% reduction.
Internal transportation costs for the small vendor is higher even after 10% reduction.
Internal warehousing is 3 to 5 times a better alternative for the foods fast category.
Additional costs are always lesser at the internal with 10% reductions in shrinkages.
8-78
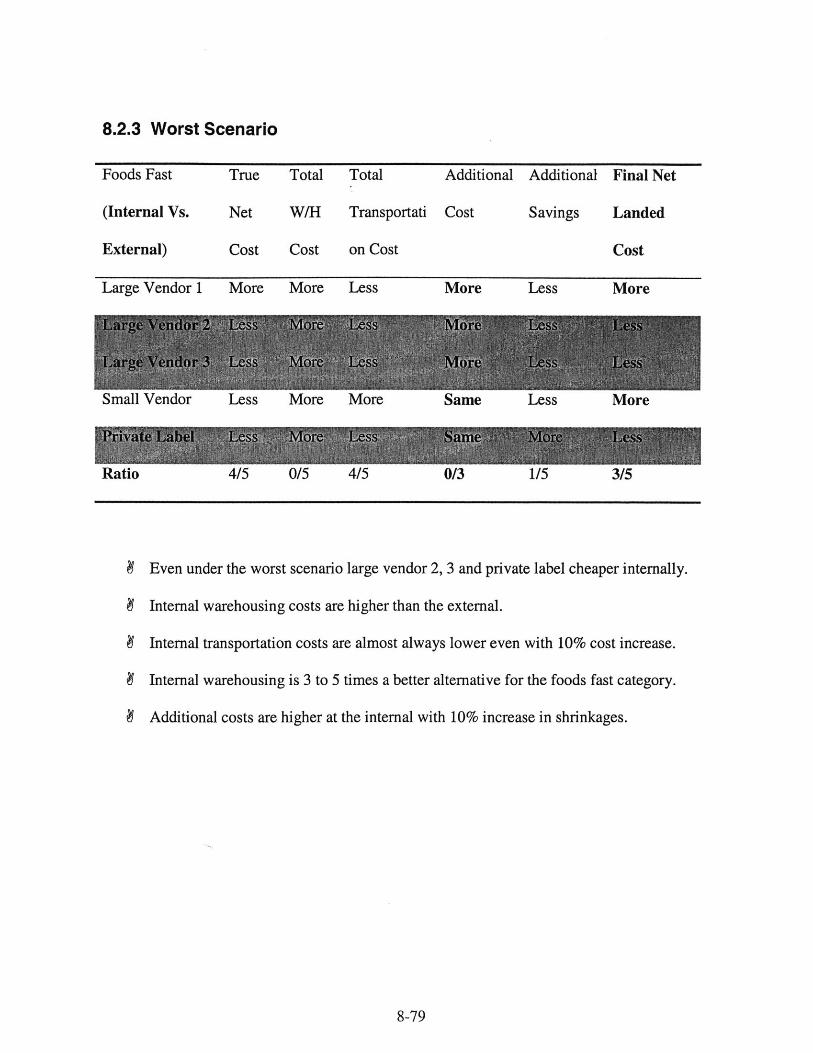
8.2.3 Worst Scenario
Foods Fast True Total Total Additional Additional Final Net
(Internal Vs. Net W/H Transportati Cost Savings Landed
External) Cost Cost on Cost Cost
Large Vendor 1 More More Less More Less More
Small Vendor Less More More Same Less More
Ratio 4/5 0/5 4/5 0/3 1/5 3/5
Even under the worst scenario large vendor 2, 3 and private label cheaper internally.
Internal warehousing costs are higher than the external.
Internal transportation costs are almost always lower even with 10% cost increase.
Internal warehousing is 3 to 5 times a better alternative for the foods fast category.
Additional costs are higher at the internal with 10% increase in shrinkages.
8-79
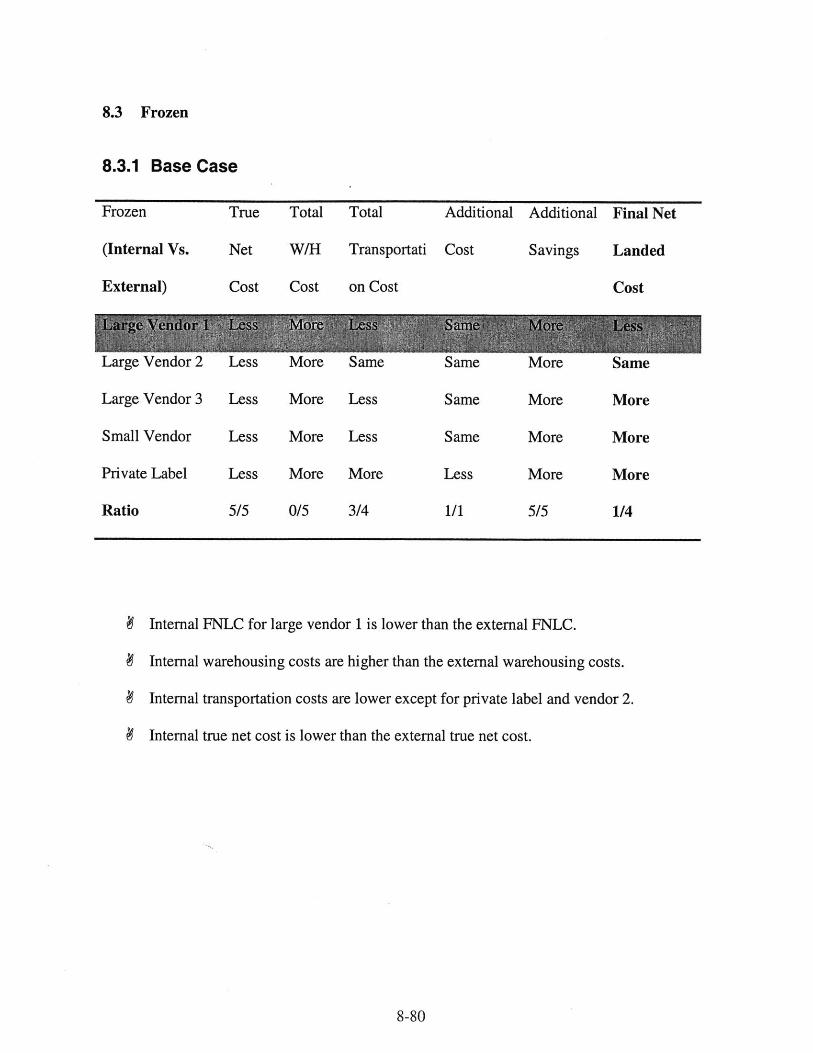
8.3 Frozen
8.3.1 Base Case
Frozen True Total Total Additional Additional Final Net
(Internal Vs. Net W/H Transportati Cost Savings Landed
External) Cost Cost on Cost Cost
Large Vendor 2 Less More Same Same More Same
Large Vendor 3 Less More Less Same More More
Small Vendor Less More Less Same More More
Private Label Less More More Less More More
Ratio 5/5 0/5 3/4 1/1 5/5 1/4
4 Internal FNLC for large vendor 1 is lower than the external FNLC.
9 Internal warehousing costs are higher than the external warehousing costs.
4 Internal transportation costs are lower except for private label and vendor 2.
9 Internal true net cost is lower than the external true net cost.
8-80
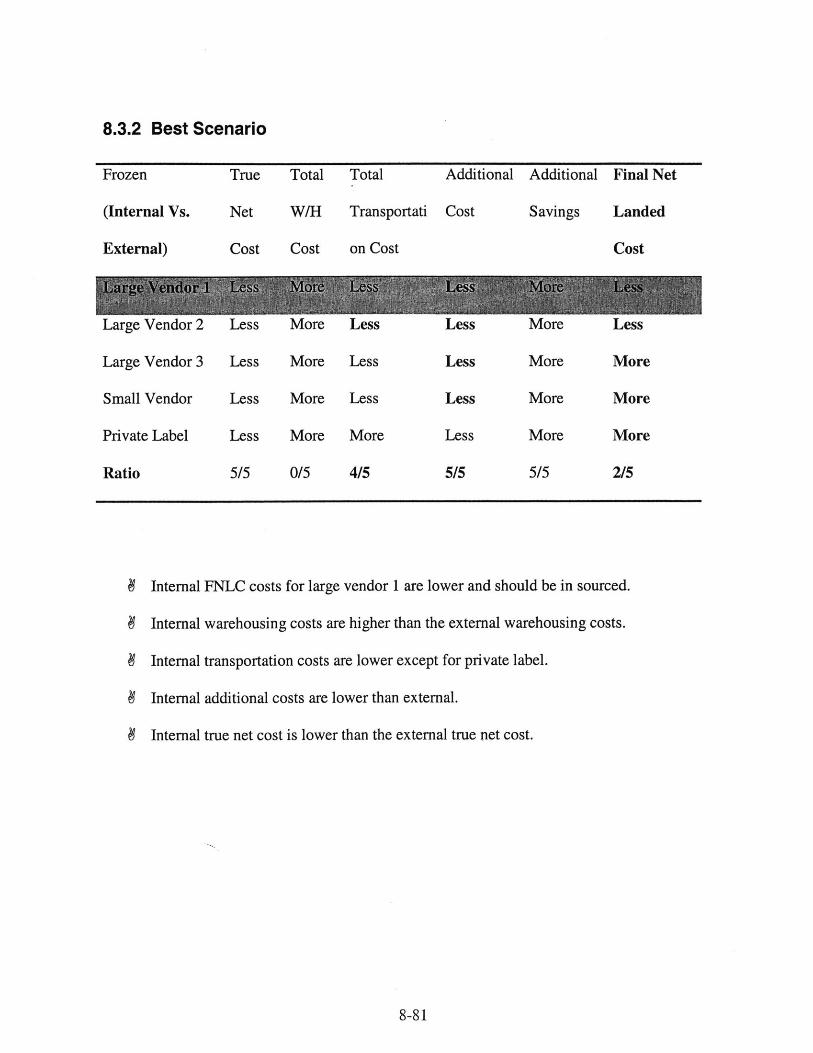
8.3.2 Best Scenario
Frozen True Total Total Additional Additional Final Net
(Internal Vs. Net W/H Transportati Cost Savings Landed
External) Cost Cost on Cost Cost
Large Vendor 2 Less More Less Less More Less
Large Vendor 3 Less More Less Less More More
Small Vendor Less More Less Less More More
Private Label Less More More Less More More
Ratio 5/5 0/5 4/5 5/5 5/5 2/5
9 Internal FNLC costs for large vendor 1 are lower and should be in sourced.
9 Internal warehousing costs are higher than the external warehousing costs.
9 Internal transportation costs are lower except for private label.
9 Internal additional costs are lower than external.
9 Internal true net cost is lower than the external true net cost.
8-81

8.3.3 Worst Scenario
Frozen
(Internal Vs.
External)
Large Vendor 2
Large Vendor 3
Small Vendor
Private Label
Ratio
True
Net
Cost
Total
W/H
Cost
Total Additional
Transportati Cost
on Cost
Additional
Savings
Final Net
Landed
Cost
Less More Same More More More
Less More Less More More More
Less More Same More More More
Less More More Same More More
5/5 0/5 2/3 4/4 5/5 1/5
Large vendor 1 has lower internal FNLC.
Internal warehousing costs are higher than the external.
Additional costs are higher at the internal warehouse under the worst scenario.
True net cost is lesser at the internal warehouse.
8-82
9 Conclusions
"Wal-Mart announces sale of McLane Company to Berkshire Hathaway 1 "
On May 2, 2003 Wal-Mart entered into an agreement to sell its acquired company 'McLane'
(one of North America's largest wholesale grocery and non-food distributor) to Warren Buffet's
Berkshire Hathaway Inc. The reason for doing this that it will enable Wal-Mart to focus solely
on its core retail business and it will create expanded business opportunities for McLane.
9.1 Overview
Today's traditional food retailers are undergoing a lot of structural changes as they face
increasing customer demand for more product choices, and increasing competition from value
grocers like Wal-Mart. Recent technological advances and sophisticated forecasting and
planning tools have raised their capability to meet the rising customer demand better than ever
before. But, in order to move forward and stay competitive they need to rethink their supply
chain strategy. Outsourcing of warehousing is one alternative, which can help them stay lean and
cost competitive. As discussed under the literature review section the common considerations
while making an outsourcing decision are -
9-83
11 Source: Wal-Mart General News
Cost reduction
# Alternative uses of funds
# Risk and uncertainty
# Locus of control
# Core competency and
& Strategy alignment
An outsourcing decision is not a short term but a long-term decision. This partnership is formed
keeping in mind the value addition for both parties, gaining competitive advantage in the
marketplace, greater profitability and greater efficiencies. It is also important to realize that the
partnerships can fail if there is mistrust, lack of upper management support, over promising -
under delivering, unprofitable external warehouse subsequent poor service, no proper planning
or orderly process, poor up-front planning, mismatch between core strategies and logistics
strategy and lack of shared goals.
9.2 Lessons Learnt
Important lessons learnt from the data analysis are as follows -
1. It is profitable to outsource the lower dollar value merchandise, as the negotiated up
charge is a percentage of the list price. Lower the list price lower will be the warehousing
and the transportation costs. For example outsourcing up charges on an item with $5 in
value will be lower than its actual warehousing and transportation costs.
9-84
2. It seems according to the activity based costing approach that under the 'one flat rate' the
items, which are 'light' or have 'low cube size' have higher than actual warehousing and
transportation costs. And items that are 'heavy' or have a 'high cube size' have lower
than actual warehousing and transportation costs. This realization can be an important
factor to take advantage of while negotiating the 'flat up charge rate' for the 'to be
outsourced merchandise' with an outsourcer.
3. While in sourcing the 'light and low cube size' merchandise the cost benefits should be
weighed against the loss in cost efficiencies due to FTL (full truck load) since sufficient
internal volume may not be generated, given the situation that the outsourcer currently
passes such cost benefits to the food retailer.
4. It is more profitable to outsource 'high volume vendors' because of higher volume
efficiencies. For a large vendor if the volume efficiencies are huge and are passed on to
the customer then the external warehouse should prove to be cheaper than the internal
warehouse. It was seen that although external warehouse proved to be cheaper for
warehousing for the above-mentioned reason, the transportation costs were higher. This
could possibly be because that the sufficient volume incentives were not passed on to the
food retailer from the outsourcer. This may require tighter negotiations.
5. Frozen foods should be completely outsourced, as the internal warehousing costs are
overwhelmingly higher than the external warehousing costs. The reasons for such high
9-85
internal warehousing costs are high internal controllable costs, which were almost twice
the frozen up charge paid to the external warehouse.
6. If the difference between the true net costs is significantly large and it is cheaper at the
internal than the item should be in sourced. On an average the warehousing and
transportation costs form a small fraction of the FNLC of an item.
7. The distinguishing factor between the internal and the external true net cost was the deals
from the vendor. If a vendor does not offer any significant deals then it was seen that the
true net cost were roughly equal. Since the warehousing and the transportation costs are
generally lower for the external it could be derived that in the absence of significant deals
external warehousing is more cost effective. This was much evident in the frozen food
category.
9.3 Observations
While working on the data a few of important observations that were made are mentioned below
1. On an average the fast food had higher inventory cover than the frozen. And frozen had a
higher inventory cover than the non-food fast category.
2. On an average internal 'total warehousing cost' is higher than the external warehousing
costs.
3. Internal shrinkages are higher than the external in frozen, foods fast and the non-foods
fast category
9-86
4. Internal diverter revenue is significantly less than the external diverter revenue. External
diverter revenue was negotiated as a cost benefit and is part of the agreement.
5. Although, non-food fast large vendor 3 had a 'very high weekly movement' and 'very
high number of items', it had a relatively low inventory cover.
To summarize, if quality and control are paramount to a food retailer's core image and the
outsourcer is not reliable enough then 'quality-critical' categories should be in sourced.
Otherwise, one can outsource anything that can be done at a lower cost by others, given the fact
that it aligns with the logistics and the corporate strategy. Also, it makes more sense to outsource
categories that require extensive capital investments or have high operating costs for example
frozen.
9-87
10 References
10.1 Books
" Nelson, Raymond A "Total Physical Distribution Management".
" Ackerman, Gardner, Thomas "Understanding Today's Distribution Center".
" Orbach Eliezer, Ayal Igal, Zif Jay "Supermarket Strategy"
" Frazelle Edward "World-Class Warehousing and Material Handling"
" Super Market Institute "Perspective"
" Cross Jennifer "The Supermarket Trap"
" Ortega Bob "In Sam we trust.
" Leonard L. Berry "The New Consumer" Competitive structure in Retail Markets: The
Department Store Perspective
* Frazelle Edward "Supply chain strategy - The logistics of supply chain management"
* Clifford F. Lynch "Logistics Outsourcing - A management guide"
* Robeson, Copacino "The Logistics Handbook"
10.2 Articles
" Hamel, G.; Prahalad C.H, "Corporate imagination and expeditionary marketing,"
Harvard Business Review, Jul/Aug91
" Lomas, Paul M., "The implications of outsourcing," Frozen Food Age Dec 97, Vol. 46,
Issue 5
10-88
* Meyer, N. Dean "A Sensible approach to outsourcing," Information Systems
Management Fall94, Vol. 11, Issue 4.
* Kenneth B. Ackerman, "Pitfalls in Logistics Partenrships," International Journal of
Physical Distribution and Logistics Management26, No.3 (1996).
" Douglas M. Lambert, Margaret A. Emmelhainz and Hohn T. Gardner, "Building
Successful Logistics Partnerships," Journal of Business Logistics, Vol. 20, No. 1, 1999.
* Douglas M. Lambert, Margaret A. Emmelhainz and Hohn T. Gardner, "So You Think
You Want a Partner?" Marketing Management, 5 (Summer 1996): 26.
" Yosef Sheffi, "Third Party Logistics: Present and Future Prospects" Journal of Business
Logistics, Vol. 11, No. 2, 1990.
* C.K. Prahalad, and Gary Hamel, "The core competence of the corporation," Harvard
Business Review: May-June 1990
* Mckinsey&Company "Competing in a Value-Driven World" North American Retail
Practice.
* Boothby, Suzy, "Outsourcing is in" Health and Facilities Management, 08996210,
Aug98, vol1l, Issue 8.
* Van Adelsberg, David, Trolley, Edward A. "Strategic Insourcing: Getting the most from
the best" Training and Development, Jul98, vol. 52, Issue 7.
* Dale S. Rogers, R T Lembke, "An examination of reverse logistics practices" Journal of
Business Logistics, vol. 22, No. 2. 2001
* McGinnis, Kohn, "Logistics Strategy - Revisited", Journal of Business Logistics, vol.23,
No.2, 2002
10-89
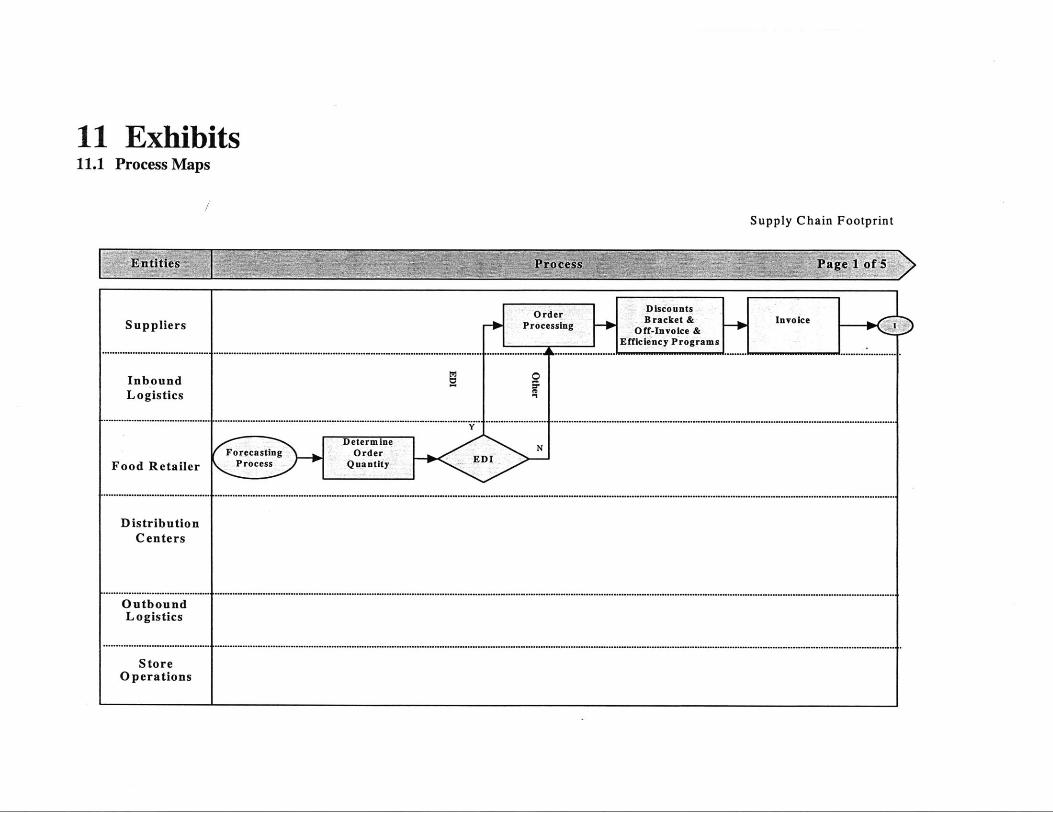
sdtN ssa;)oil 1-11
sllqiqxg 11 40
suoilig.iodoJols
........................................................................................................................................................... ....... ....................... ............... ....... .......................................................... ..........................................
sallsiso'lpu o*qjno
................................................... ............................... ....................................................................................................................................................................................... ..I ... ......................................
S.13JU33uoilnqlj;si([
...........................................................................................................................................................................................................................................................................................................
SS230.1d Jallyslad Po0aJapio sulisg3giog Nauluiiala(l
........................................................................................................................................ ........................ .................................................................................... ................... ......................
punoqul N .................
............ .......... ......... 1,26 ..... ........................ ...................... .......................................................................................................... ................ ......................... 21? OOIOAUI-Jjo
4dg--- -smssa3oj4 I siauddne
jui.idlooq uiuqD AlddnS
0310AUI 2f la3l3VJ ffapjo
sluno3sl(l:
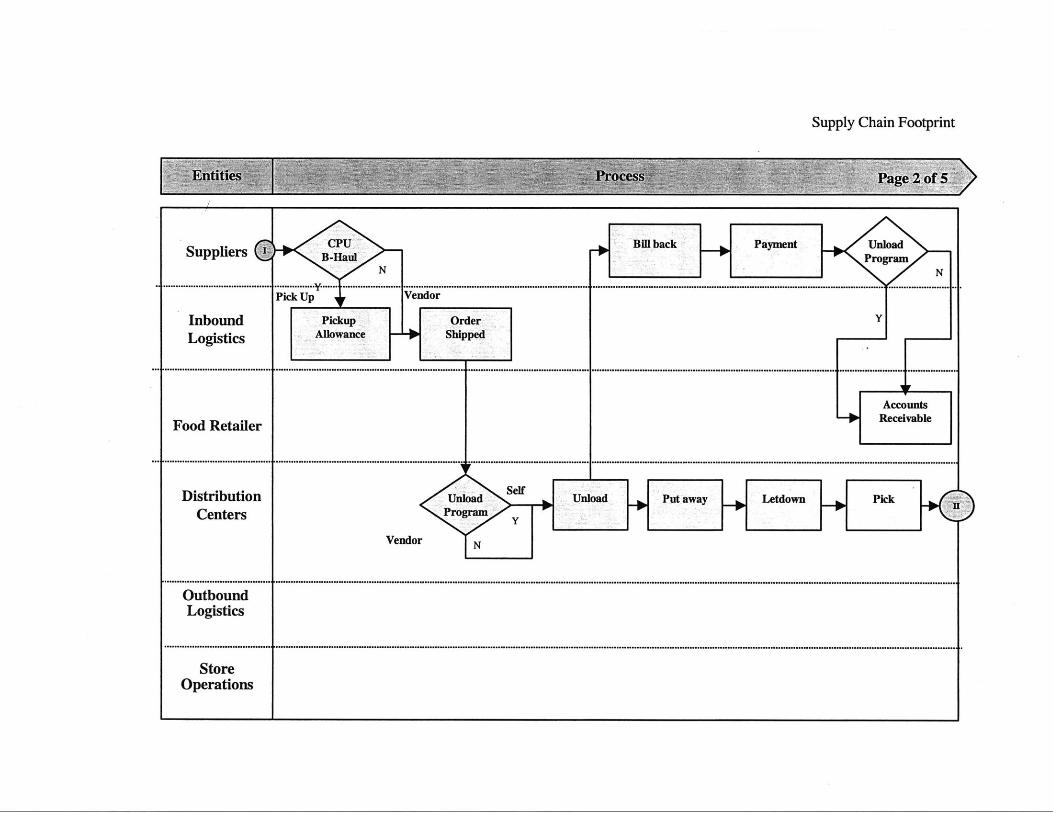
suollaxadoajols
................................................... .......................................................................................................................................................................................................................... I ........................... ..............
S;)Ils!20-jpunoqlno
............................................................................................................................................................................................................................................................................. ..........................................
................................................................................................................................................. ................................................. ................................................... ........................................... ...
liapinau poojswnoaaV
AL
.................... ......................... .. ...................................................................................... ................................................ ................ ......................................................... ........................................... ...t
PaddTqS a3UBAIOUV S;)Ils!20-j
A japjo dn3pld punoquj
-IOPuaA dfl 3pla.. ........................ ........................................................................................... ....................... ......................................................................... ....................... ....... A ............... .......................................... -
31a aq I p +j sa;ailddnS
II
PBOlufl wams"d
N JOPUaA
picolma Humoplal Slamig inj PROM
),Ufl ; >
sialmauo!lnqljlsl(l
lu!jcbooj uiuqD AjddnS

suop jlaqS ojL 3pojS PROM viadoajols
.............. ............................................................................... .................................................................................................................................................................. ..........................................
...psi 0-1ljodsuwl punoqlno
.......................... ......................................................................................................................................................... A ..................................................................................... ...........................................
JOPUaA uoneqdxHuollnqljlsl(l JOPU3A 1119 *r 41qmumlmlj J6,62MM(I 313aqj japalaS
......................................................................................................................................................................................................................................................................................................................IF
ajqVAla3OH xapupu P00A
nuno3av
..... ................................................................. ............................................................................................. ........................................................................................................ ...........................................
S;)Ilsl2o-j
punoqul
........... .............. .................... ... ................ v .... ................. ............................................................................................................................................................................. ...........................................
juxaged uailddnS
Z6-11
luudlooq upqD AlddnS
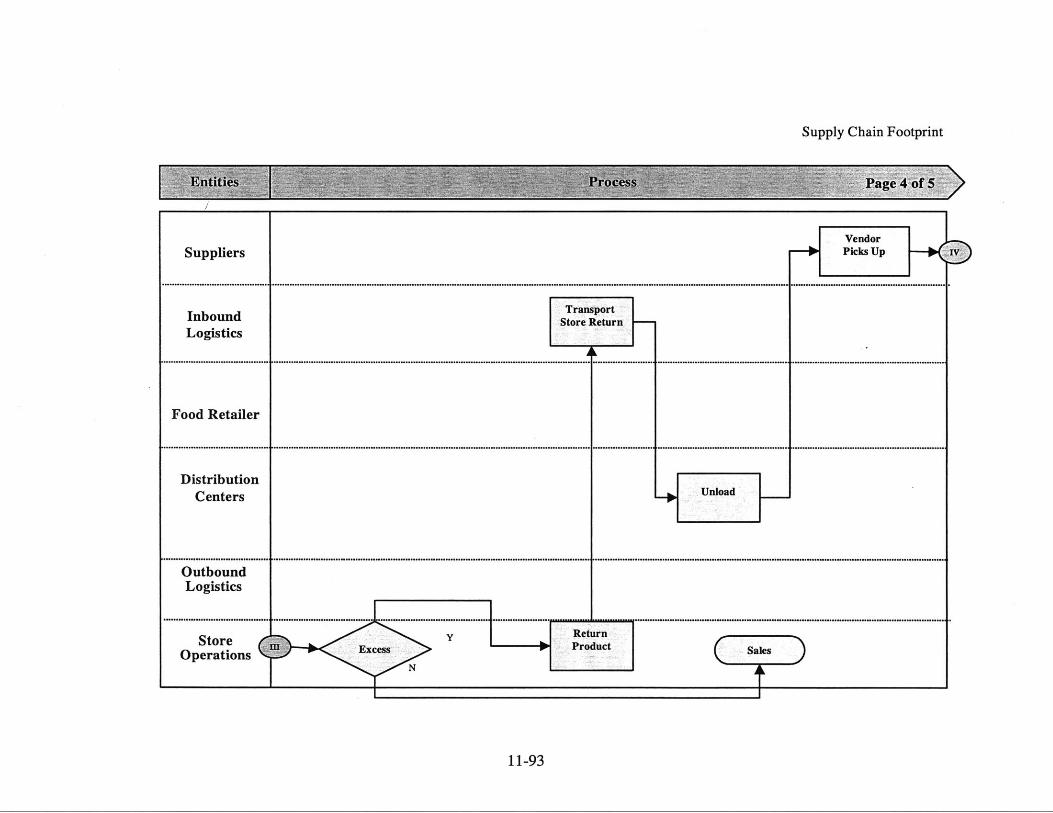
suoilmiadossaaxa lanpoid Jojs
......................... .... ........... ....................... .... .................. ............................ ................. ................ I ...................... ............................................. ........................................ ..........................................
sal.ISI50-1punoqlno
.......... .................. ............................ ................................................................................. ............................................................................................................................... ..........................................
PUOlufluoi nqlxlsi(I
..... ........... ......................... ......... ....... ...................................... ............. ........................ ........................................... .................................................................................... ...........................................
Jallulau pood
..........................................................................................................................................................................................................................................................................................................................
Uirnall'aJolspunoqul liodamij,
...................................... ........... ........... ........ .... .............................................................. ............. .... ..................................... ............................ ............................................ L ..........................................
E6-11
s.iaqddnS
jui.idlood upqD AjddnS
Al d1l MaliJOPUaA
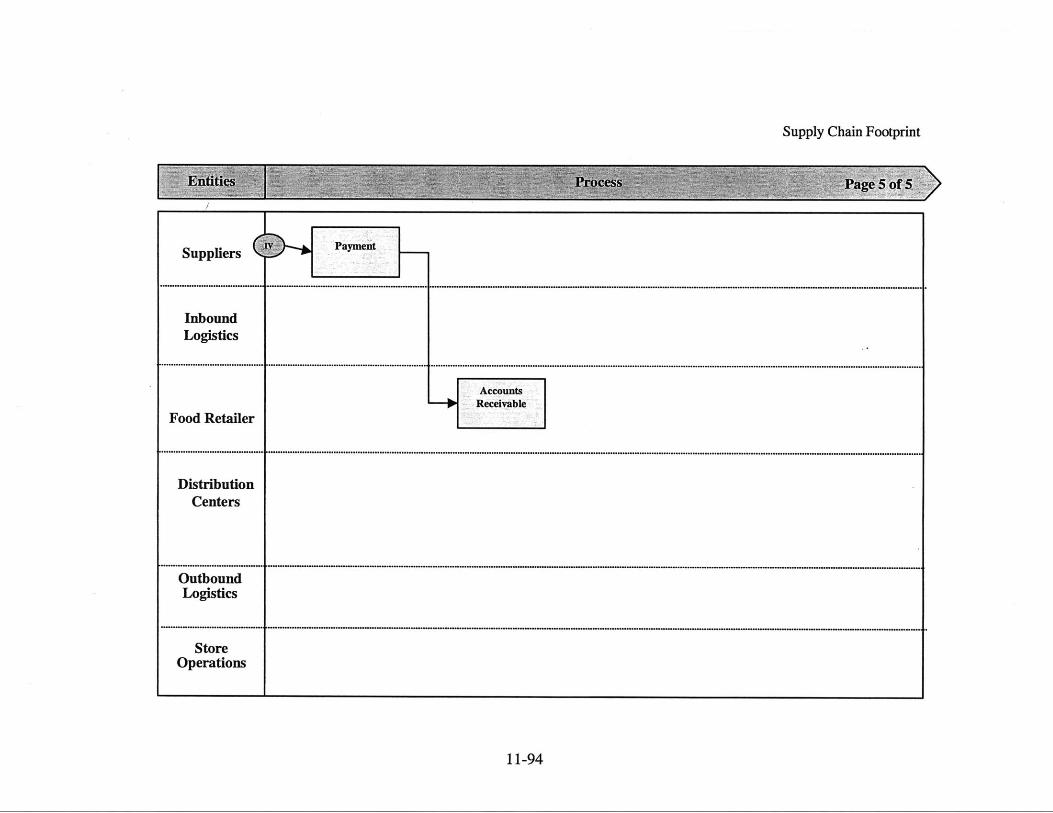
suollu.xadoa.lols
..... .......... ............... ................. ..................................... .................. ........................................................ .................................... ...................... ... .................... .................. I .... .....................................
punoqlno.... .................................. ................................... ............................ ................................... ....... ............ ............ .............................. .............. .............. ....... ......................... ..........................................
............................................................................................................................................................................................................................................................................. ...........................................
Jal.mau pood
sluno;)aV
.......................................................................................................................................................................................................... .................................................................. ...........................................
punoqul
..... ...................................... .......................................................................................................................................................... ............................................. ........ ..........................................
sxaqddnS
t,6-1 T
sialuoz)noi4nqplsl(l
mabooa u!tqD,(IddnS

11.2 Conjoint Analysis
Attributes
1. Cost: The Final Net Landed Cost - this will be the sum of the item cost + the
warehousing costs + the transportation costs + the additional administrative cost.
Warehousing + Transportation Up charges for the external warehouse
a. Current Level
b. 5% less
c. 5% more
2. Contract - the Outsourcing decision offers a lot of external freedom, one can expand or
contract his service on a short notice. But this flexibility, I believe is limited by the
contract terms and period. When choosing contract think about flexibility.
a. Contract is 2years long
b. Contract is 5years long
c. Contract is 10years long
3. Service level - On time delivery, shrinkage, mispick, fill rates
a. Current Level
b. 5o lower quality
c. 5% better quality
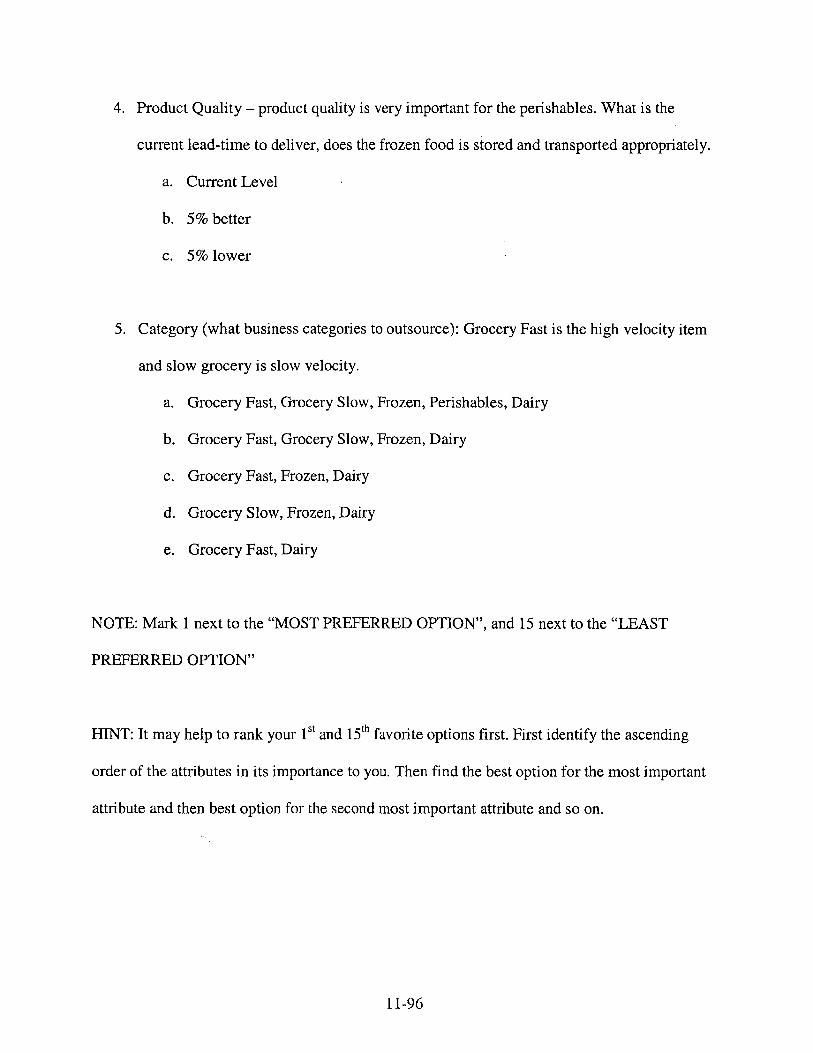
4. Product Quality - product quality is very important for the perishables. What is the
current lead-time to deliver, does the frozen food is stored and transported appropriately.
a. Current Level
b. 5% better
c. 5% lower
5. Category (what business categories to outsource): Grocery Fast is the high velocity item
and slow grocery is slow velocity.
a. Grocery Fast, Grocery Slow, Frozen, Perishables, Dairy
b. Grocery Fast, Grocery Slow, Frozen, Dairy
c. Grocery Fast, Frozen, Dairy
d. Grocery Slow, Frozen, Dairy
e. Grocery Fast, Dairy
NOTE: Mark 1 next to the "MOST PREFERRED OPTION", and 15 next to the "LEAST
PREFERRED OPTION"
HINT: It may help to rank your 05 and 15th favorite options first. First identify the ascending
order of the attributes in its importance to you. Then find the best option for the most important
attribute and then best option for the second most important attribute and so on.
11-96
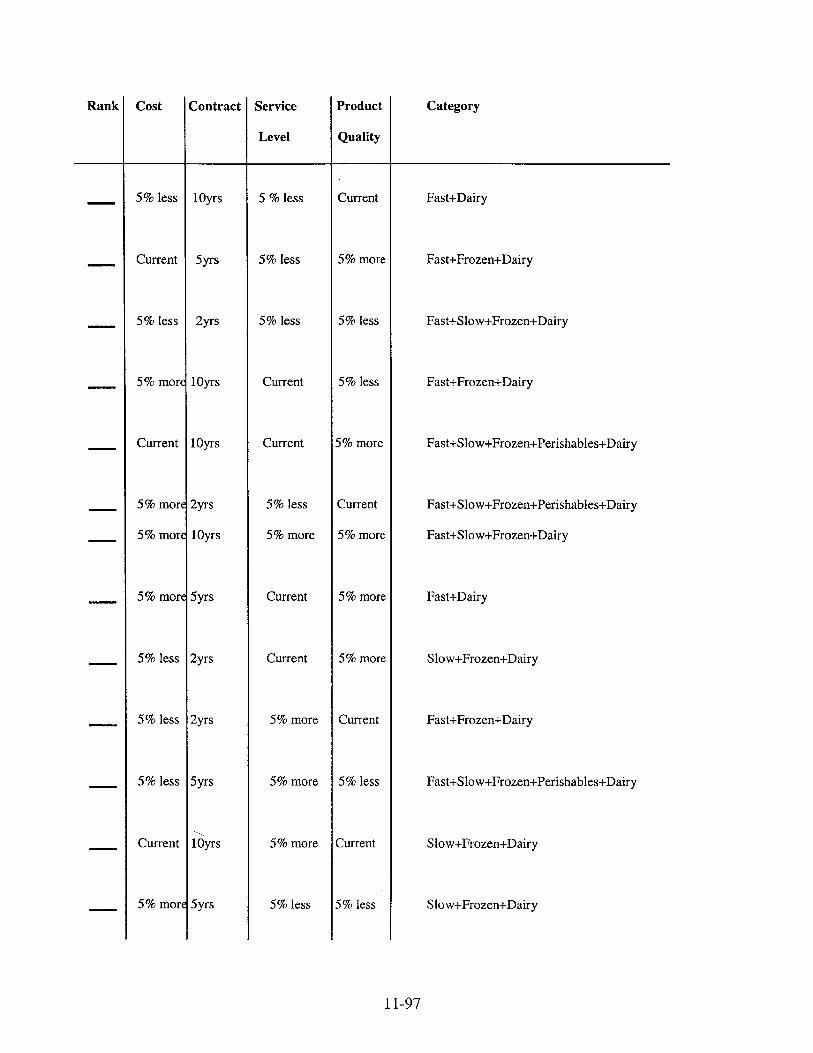
5% less
Current
5% less
Contract
10yrs
5yrs
2yrs
5% more 10yrs
Current
5% more
5% more
10yrs
2yrs
10yrs
5% more 5yrs
5% less
5% less
5% less
Current
2yrs
2yrs
5yrs
10yrs
5% more 5yrs
Service
Level
5 % less
5% less
5% less
Current
Current
5% less
5% more
Current
Current
5% more
5% more
5% more
5% less
Product
Quality
Current
5% more
5% less
5% less
5% more
Current
5% more
5% more
5% more
Current
5% less
Current
5% less
Category
Fast+Dairy
Fast+Frozen+Dairy
Fast+Slow+Frozen+Dairy
Fast+Frozen+Dairy
Fast+Slow+Frozen+Perishables+Dairy
Fast+Slow+Frozen+Perishables+Dairy
Fast+Slow+Frozen+Dairy
Fast+Dairy
Slow+Frozen+Dairy
Fast+Frozen+Dairy
Fast+Slow+Frozen+Perishables+Dairy
Slow+Frozen+Dairy
Slow+Frozen+Dairy
11-97
Rank I Cost
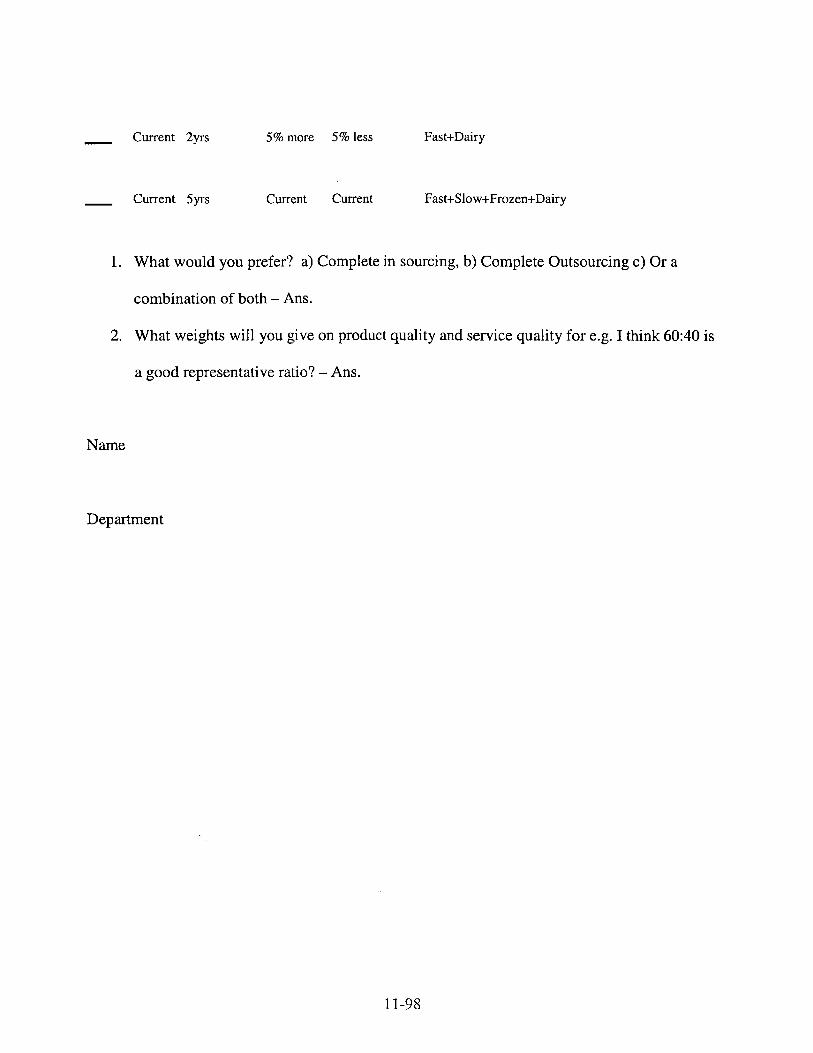
5% more 5% less Fast+Dairy
Current 5yrs Current Current Fast+Slow+Frozen+Dairy
1. What would you prefer? a) Complete in sourcing, b) Complete Outsourcing c) Or a
combination of both - Ans.
2. What weights will you give on product quality and service quality for e.g. I think 60:40 is
a good representative ratio? - Ans.
Name
Department
11-98
. _ Current 2yrs
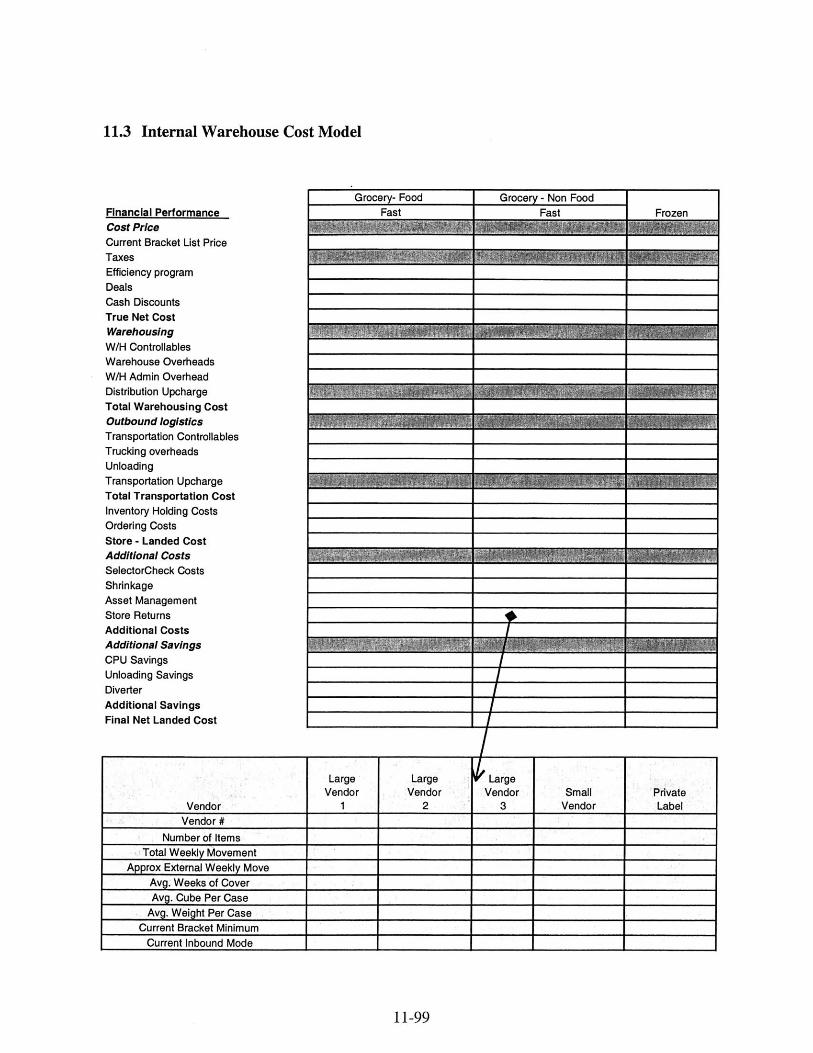
11.3 Internal Warehouse Cost Model
Financial PerformanceCost PriceCurrent Bracket List PriceTaxesEfficiency programDealsCash DiscountsTrue Net CostWarehousingW/H ControllablesWarehouse OverheadsW/H Admin OverheadDistribution UpchargeTotal Warehousing CostOutbound logisticsTransportation ControllablesTrucking overheadsUnloadingTransportation UpchargeTotal Transportation CostInventory Holding CostsOrdering CostsStore - Landed CostAdditional CostsSelectorCheck CostsShrinkageAsset ManagementStore ReturnsAdditional CostsAdditional SavingsCPU SavingsUnloading SavingsDiverterAdditional SavingsFinal Net Landed Cost
Large Large LargeVendor Vendor Vendor Small Private
Vendor 1 2 3 Vendor LabelVendor #
Number of ItemsTotal Weekly Movement
Approx External Weekly MoveAvg. Weeks of CoverAvg. Cube Per Case
Avg. Weight Per CaseCurrent Bracket Minimum I
Current Inbound Mode I
11-99
Grocery- Food Grocery - Non FoodFast Fast Frozen
gw
T
TRW Vw F,771
J-
7
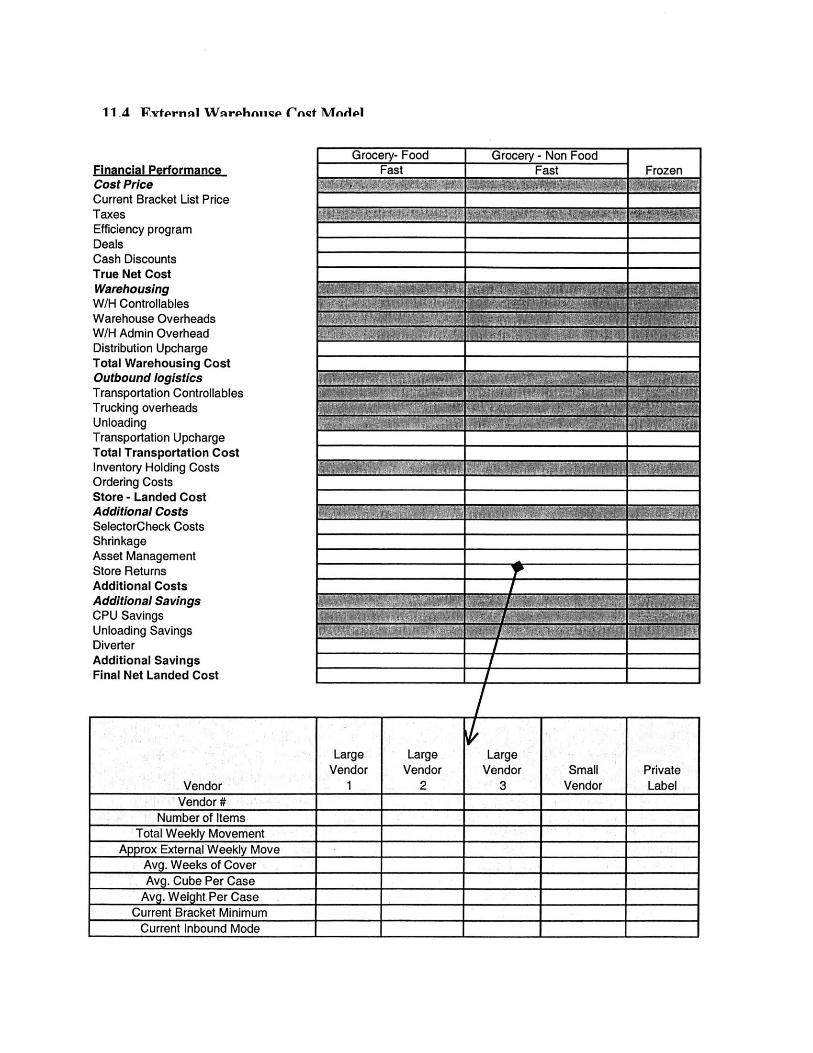
11.4 WvtPrnu1 Warhnnip Cndt Mndpl
Financial PerformanceCost PriceCurrent Bracket List PriceTaxesEfficiency programDealsCash DiscountsTrue Net CostWarehousingW/H ControllablesWarehouse OverheadsW/H Admin OverheadDistribution UpchargeTotal Warehousing CostOutbound logisticsTransportation ControllablesTrucking overheadsUnloadingTransportation UpchargeTotal Transportation CostInventory Holding CostsOrdering CostsStore - Landed CostAdditional CostsSelectorCheck CostsShrinkageAsset ManagementStore ReturnsAdditional CostsAdditional SavingsCPU SavingsUnloading SavingsDiverterAdditional SavingsFinal Net Landed Cost
Large Large LargeVendor Vendor Vendor Small Private
Vendor 1 2 3 Vendor LabelVendor #
Number of ItemsTotal Weekly Movement
Approx External-Weekly MoveAvg. Weeks of CoverAvg. Cube Per Case
Avg. Weight Per CaseCurrent Bracket Minimum
Current Inbound Mode
Grocery- Food Grocery - Non FoodFast Fast Frozen
7777
zu, 4 6MM W, -2
INV,
A-d kQ
7 7T 7 7777777
0"a
7 77 77 i!
7 -,7-,.W,1,1,11- Ar-
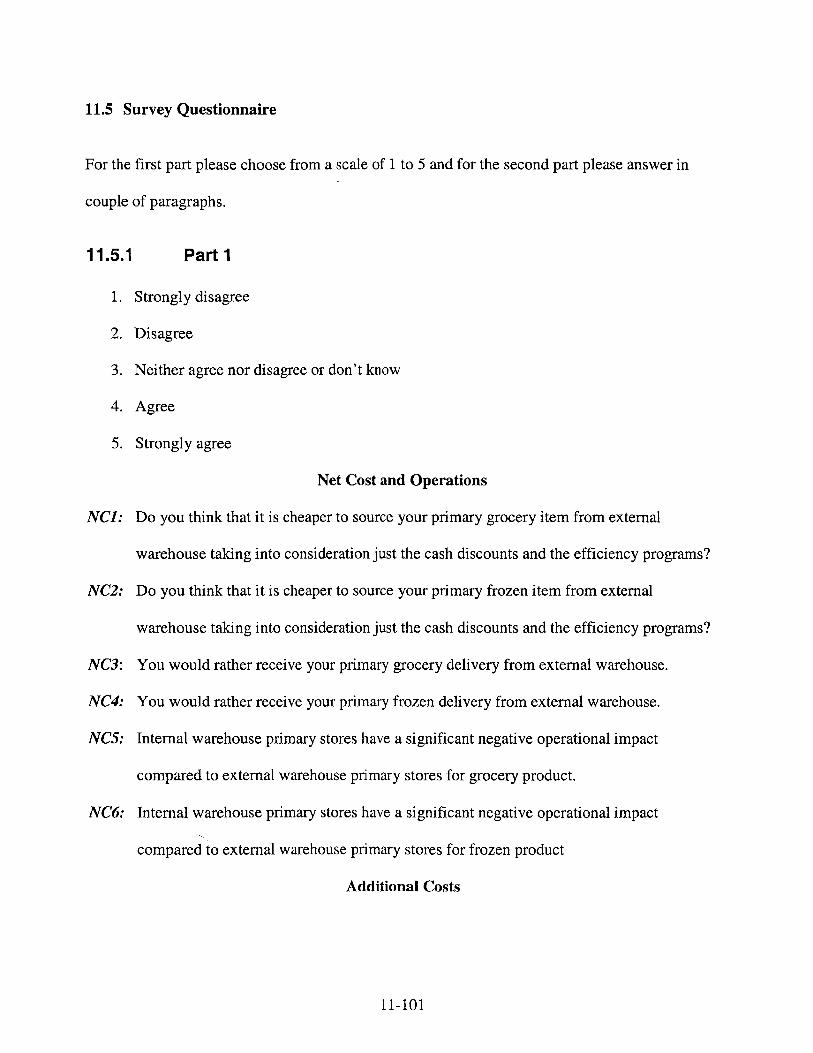
11.5 Survey Questionnaire
For the first part please choose from a scale of 1 to 5 and for the second part please answer in
couple of paragraphs.
11.5.1 Part 1
1. Strongly disagree
2. Disagree
3. Neither agree nor disagree or don't know
4. Agree
5. Strongly agree
Net Cost and Operations
NCJ: Do you think that it is cheaper to source your primary grocery item from external
warehouse taking into consideration just the cash discounts and the efficiency programs?
NC2: Do you think that it is cheaper to source your primary frozen item from external
warehouse taking into consideration just the cash discounts and the efficiency programs?
NC3: You would rather receive your primary grocery delivery from external warehouse.
NC4: You would rather receive your primary frozen delivery from external warehouse.
NC5: Internal warehouse primary stores have a significant negative operational impact
compared to external warehouse primary stores for grocery product.
NC6: Internal warehouse primary stores have a significant negative operational impact
compared to external warehouse primary stores for frozen product
Additional Costs
11-101
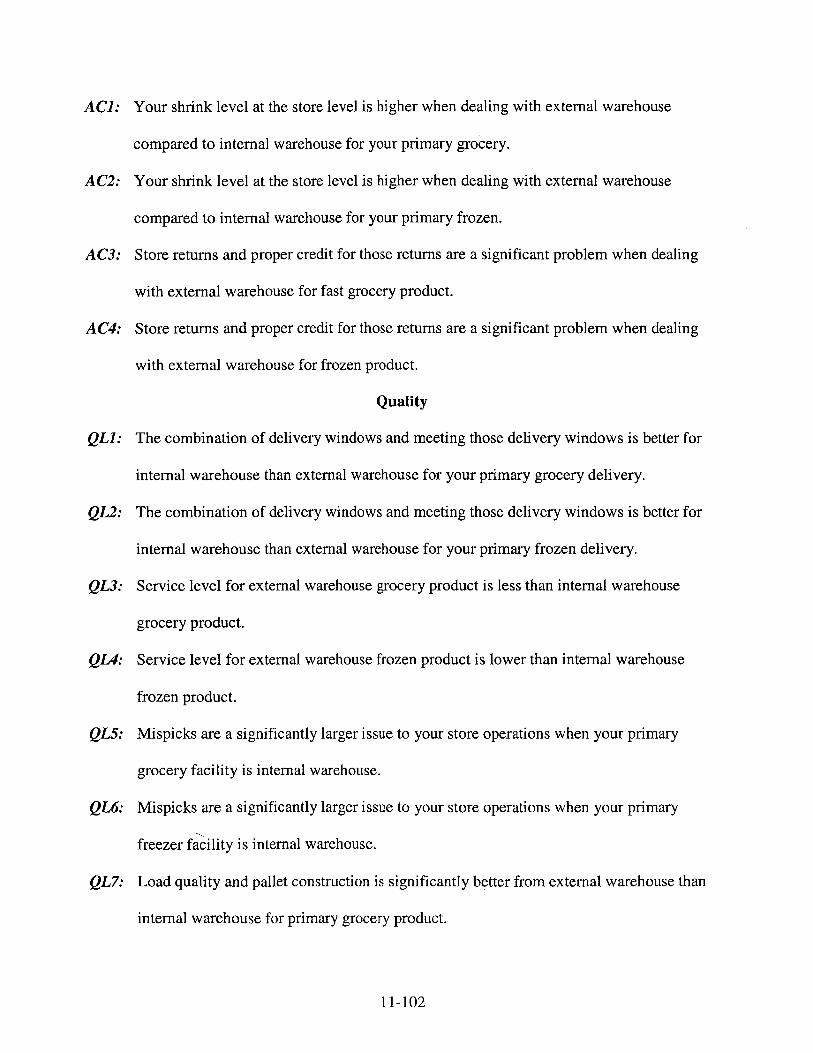
ACi: Your shrink level at the store level is higher when dealing with external warehouse
compared to internal warehouse for your primary grocery.
AC2: Your shrink level at the store level is higher when dealing with external warehouse
compared to internal warehouse for your primary frozen.
AC3: Store returns and proper credit for those returns are a significant problem when dealing
with external warehouse for fast grocery product.
AC4: Store returns and proper credit for those returns are a significant problem when dealing
with external warehouse for frozen product.
Quality
QLi: The combination of delivery windows and meeting those delivery windows is better for
internal warehouse than external warehouse for your primary grocery delivery.
QL2: The combination of delivery windows and meeting those delivery windows is better for
internal warehouse than external warehouse for your primary frozen delivery.
QL3: Service level for external warehouse grocery product is less than internal warehouse
grocery product.
QL4: Service level for external warehouse frozen product is lower than internal warehouse
frozen product.
QL5: Mispicks are a significantly larger issue to your store operations when your primary
grocery facility is internal warehouse.
QL6: Mispicks are a significantly larger issue to your store operations when your primary
freezer facility is internal warehouse.
QL7: Load quality and pallet construction is significantly better from external warehouse than
internal warehouse for primary grocery product.
11-102
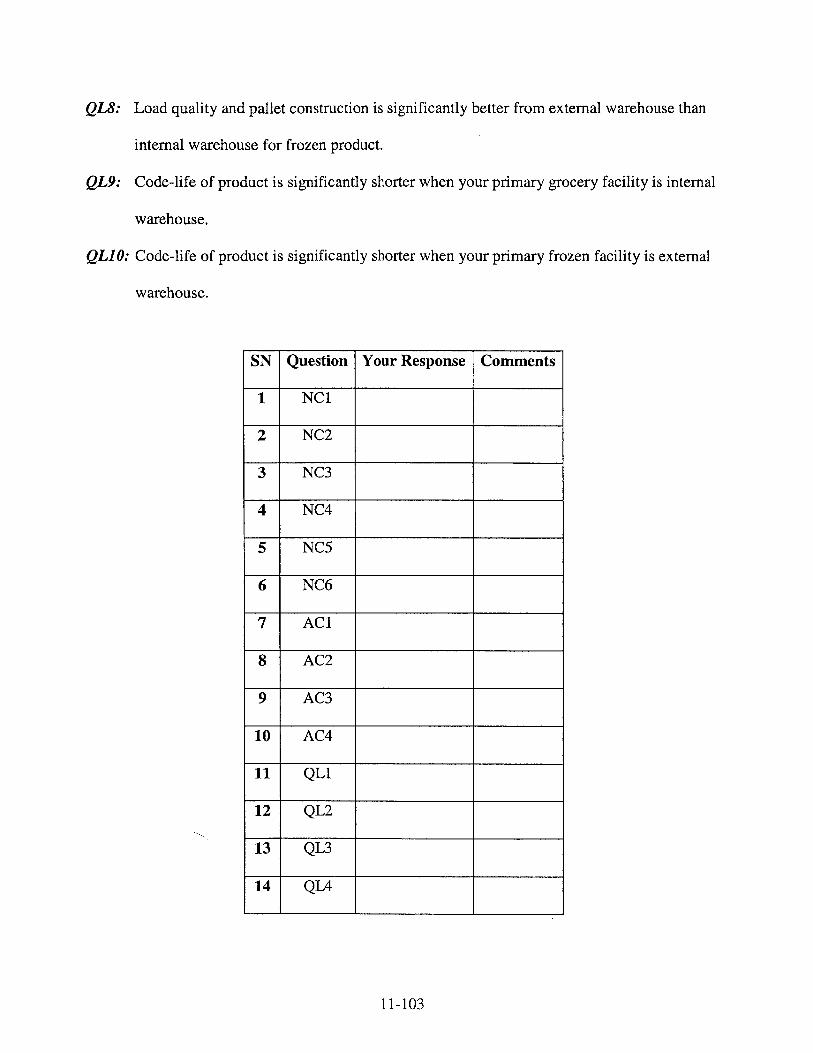
QL8: Load quality and pallet construction is significantly better from
internal warehouse for frozen product.
QL9: Code-life of product is significantly shorter when your primary
warehouse.
QLO: Code-life of product is significantly shorter when your primary
warehouse.
external warehouse than
grocery facility is internal
frozen facility is external
11-103
SN Question Your Response Comments
1 NC1
2 NC2
3 NC3
4 NC4
5 NC5
6 NC6
7 ACI
8 AC2
9 AC3
10 AC4
11 QL1
12 QL2
13 QL3
14 QL4
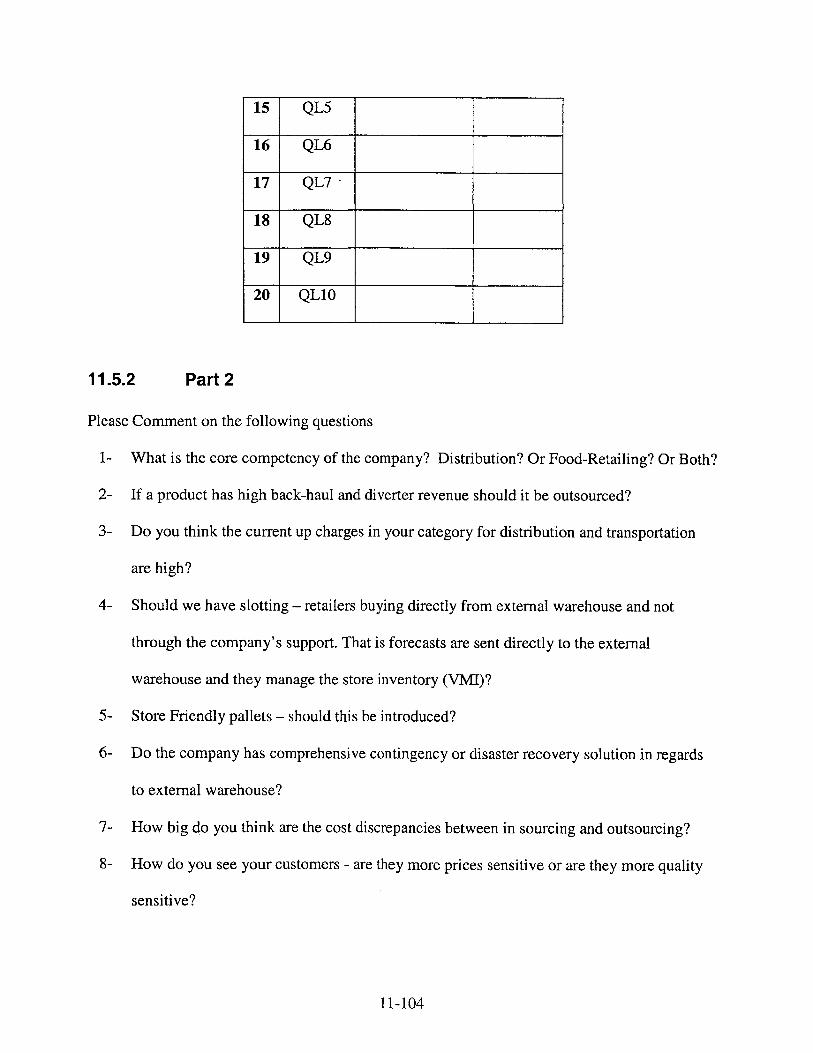
11.5.2 Part 2
Please Comment on the following questions
1- What is the core competency of the company? Distribution? Or Food-Retailing? Or Both?
2- If a product has high back-haul and diverter revenue should it be outsourced?
3- Do you think the current up charges in your category for distribution and transportation
are high?
4- Should we have slotting - retailers buying directly from external warehouse and not
through the company's support. That is forecasts are sent directly to the external
warehouse and they manage the store inventory (VMI)?
5- Store Friendly pallets - should this be introduced?
6- Do the company has comprehensive contingency or disaster recovery solution in regards
to external warehouse?
7- How big do you think are the cost discrepancies between in sourcing and outsourcing?
8- How do you see your customers - are they more prices sensitive or are they more quality
sensitive?
11-104
15 QL5
16 QL6
17 QL7
18 QL8
19 QL9
20 QL10
9- How are the IT capabilities at the external warehouse with regards to data quality, and
ability to integrate with other partners and systems - average, good or excellent?
10- Is it a good strategy to have multiple sourcing partners?
11- Does the company have a need for tighter performance metrics?
12- Currently, how much visibility is available in the external warehousing operations?
13- What do you think are the alternative uses of money (capital freed up because of
outsourcing) new hires, new facilities, IT ramp up etc.
14- In one to two paragraphs or bullet points, please comment on the differences between
internal vs. external distribution (Specifically for grocery and frozen product) as it
pertains to the Supply chain department.
15- Please compare costs or problems that occur that significantly impact, interrupt, or benefit
the supply chain when the company decides to distribute internally or outsource.
11-105
Adapted from the class notes of Dr. Jim Masters, Executive Director, MLOG program at MIT" Adapted from the article by Meyer, N. Dean "A sensible approach to outsourcing" Information SystemsManagement, Fall94, vol. 11, Issue 4.". Adapted from the article by C.K. Prahalad and G. Hamel, "The core competence of the corporation" HarvardBusiness Review, May-June 1990" To see how does these failures can be addressed through the Lambert, Emmelhainz and Gardner's PartnershipProcess Model refer Douglas M. Lambert, Margaret A. Emmelhainz and Hohn T. Gardner, "Building SuccessfulLogistics Partnerships," Journal of Business Logistics, Vol. 20, No. 1, 1999.
11-106