The internal and external factors influencing the cost of equity ...
184
VYSOKÉ UČENÍ TECHNICKÉ V BRNĚ BRNO UNIVERSITY OF TECHNOLOGY FAKULTA PODNIKATELSKÁ ÚSTAV EKOKOMIKY FACULTY OF BUSINESS AND MANAGEMENT DEPARTMENT OF ECONOMICS The internal and external factors influencing the cost of equity capital Vliv externích a interních faktorů na náklady vlastního kapitálu DOKTORSKÁ PRÁCE DOCTORAL THESIS AUTOR PRÁCE NATALIA MOKHOVA AUTHOR VEDOUCÍ PRÁCE doc. Ing. MAREK ZINECKER, Ph.D. SUPERVISOR
-
Upload
khangminh22 -
Category
Documents
-
view
2 -
download
0
Transcript of The internal and external factors influencing the cost of equity ...
VYSOKÉ UČENÍ TECHNICKÉ V BRNĚ
BRNO UNIVERSITY OF TECHNOLOGY
FAKULTA PODNIKATELSKÁ
ÚSTAV EKOKOMIKY
FACULTY OF BUSINESS AND MANAGEMENT
DEPARTMENT OF ECONOMICS
The internal and external factors influencing the cost of equity capital
Vliv externích a interních faktorů na náklady vlastního kapitálu
DOKTORSKÁ PRÁCE
DOCTORAL THESIS
AUTOR PRÁCE NATALIA MOKHOVA
AUTHOR
VEDOUCÍ PRÁCE doc. Ing. MAREK ZINECKER, Ph.D.
SUPERVISOR

1
DEDICATION
To my parents
for their unconditional love and belief

2
Statement of original authorship
I declare that this thesis is my own and has been generated by me as the result of my own original
research.

3
Acknowledgments
I am grateful to my supervisor doc. Ing. Marek Zinecker, Ph.D. for his invaluable guidance and
support throughout study, for encouraging my research and confidence in me.
I am also thankful to Brno University of Technology and Faculty of Business and Management that
gave opportunity to conduct my research and grow as a scientist.
I owe my deepest thanks to my parents, Galina and Sergey, for their endless love, support,
encouragement and belief.
In addition, I would like to thank my friends for the continuous encouragement and support.

4
Bibliographic citation
MOKHOVA, N. Vliv externích a interních faktorů na náklady vlastního kapitálu. Brno: Vysoké
učení technické v Brně, Fakulta podnikatelská, 2016. XY s. Vedoucí dizertační práce doc. Ing. Marek
Zinecker, Ph.D..
5
Abstract
The cost of equity capital is essential and significant element in the corporate decision making
process, which is exposed to the influence of internal and external factors. The aim of the doctoral
thesis is based on the comprehensive review of the theoretical literature on the internal and external
factors influencing the cost of equity capital and a subsequent primary empirical research towards
testing the identified theoretical approaches on a sample of Czech companies to transform the gained
knowledge into a methodology supporting CFO’s decision-making process on corporate financing
with regard to the cost of equity capital reduction. The thesis contributes to the explanation of the
corporate financing decision-making by combining different theories, surveyed gained data in
Czech business environment and statistical methods. The combination of primary and secondary
research enhances deeper understanding of relationship between CEC and its determinants revealing a
gap between theory and practice in a particular area of expertise. As an outcome of the research, the
designed methodology incorporates the worldwide knowledge of scientific community and practical
experience of Czech companies and is intended for application among corporate managers and
academics.
Keywords
Cost of equity capital, internal factors, disclosure, corporate governance, external factors, monetary
policy, fiscal policy, financial stability, corporate financing, decision-making process, methodology.
Abstrakt
Náklady vlastního kapitálu, jež jsou ovlivňovány řadou interních a externích činitelů, významným
faktorem ovlivňujícím rozhodovací procesy v podnikové sféře. Cílem této disertační práce je na
základě primárních a sekundárních dat formulovat původní metodiku řízení nákladů vlastního
kapitálu. Zdrojem sekundárních dat je rozsáhlá literární rešerše zahrnující zahraniční a tuzemské
vědecké studie a databáze. Primární data, na základě nichž byl zkoumán vztah mezi teoretickými
přístupy řízení nákladů vlastního kapitálu a podnikovou praxí, byla získána formou dotazníkového
šetření od finančních manažerů působících v podnicích se sídlem na území ČR. Data byla zpracována
s využitím statistických metod. Výsledky disertační práce přispívají k hlubšímu porozumění vztahu
mezi náklady vlastního kapitálu a jejich determinantů a odhalují rozdíly mezi teorií
a manažerskou praxí. Navrhovaná metodika řízení nákladů vlastního kapitálu je určená k použití
v podnikové praxi a lze předpokládat její další rozvíjení v rámci navazujících výzkumných aktivit.
Klíčová slova
Náklady vlastního kapitálů, interní faktory, corporate governance, externí faktory, měnová politika,
fiskální politika, finanční stabilita, financování podniku, rozhodovací proces, metodika.
6
CONTENT
Chapter 1 Introduction ------------------------------------------------------------------------------------- 13
1.1. Rationale and problem statement ------------------------------------------------------------------- 13
1.2. Aims and objectives of the Thesis ----------------------------------------------------------------- 14
1.3. The thesis work structure ---------------------------------------------------------------------------- 15
Chapter 2 Theoretical background: cost of equity capital -------------------------------------------- 16
2.1. Capital as economic category ------------------------------------------------------------------------- 16
2.2. Cost of equity capital estimation --------------------------------------------------------------------- 22
2.2.1. Traditional approaches to estimate the cost of equity capital ------------------------------- 23
2.2.2. Modifications and improvements: academics’ perception ----------------------------------- 27
Chapter 3 Internal factors influencing the cost of equity capital: literature review --------------- 30
3.1. Information asymmetry as a core of relation between internal factors and the cost of equity
capital 30
3.2. Financial disclosure, accounting information and audit quality ------------------------------- 32
3.2.1. Accounting information ------------------------------------------------------------------------ 32
3.2.4. Accounting standards ----------------------------------------------------------------------------- 35
3.2.3. Corporate disclosure policy ---------------------------------------------------------------------- 35
3.2.5. Financial disclosure, accounting information and cost of equity capital reduction ------ 40
3.3. Corporate governance and its elements ----------------------------------------------------------- 41
3.3.1. Shareholder rights --------------------------------------------------------------------------------- 45
3.3.2. Board characteristics and ownership structure ------------------------------------------------ 46
3.3.3. Audit committee and audit quality -------------------------------------------------------------- 47
3.3.4. The corporate governance and cost of equity capital minimization ------------------------ 48
3.4. Social factors as non-financial determinants ----------------------------------------------------- 49
Chapter 4 Financial stability of a country as a combination of external factors ------------------- 52
4.1. Financial stability: the way to define -------------------------------------------------------------- 52
4.2. Central banks on the financial stability issue ------------------------------------------------------- 57
4.3. Fiscal policy and its link to financial stability ------------------------------------------------------ 58
4.3.1. Sovereign debt as significant element of fiscal policy --------------------------------------- 59
7
4.4. Monetary policy and its link to financial stability ------------------------------------------------- 64
4.4.1. Unconventional monetary policy ---------------------------------------------------------------- 66
4.5. Macro-prudential policy towards national financial stability ---------------------------------- 71
4.6. Indicators and measures of financial stability ---------------------------------------------------- 73
Chapter 5 Methodology and research design ----------------------------------------------------------- 79
5.1. Types of research ------------------------------------------------------------------------------------- 80
5.2. Critical literature review as theoretical background --------------------------------------------- 82
5.3. The research questions and hypothesis ------------------------------------------------------------ 84
5.4. Primary research: survey ---------------------------------------------------------------------------- 87
5.5. Index construction ------------------------------------------------------------------------------------ 91
Chapter 6 Findings of primary research ----------------------------------------------------------------- 93
6.1. The survey design and findings ----------------------------------------------------------------------- 93
6.1.1. Is there a gap in knowledge? ----------------------------------------------------------------- 109
6.3. The survey as an experts’ evaluation -------------------------------------------------------------- 110
Chapter 7 Proposal: Methodology towards CEC reduction ------------------------------------- 113
7.1. Internal factors determination in index ----------------------------------------------------- 115
7.2. The external environment scenarios in index ---------------------------------------------- 117
7.3. The final methodology and proposed recommendations -------------------------------- 117
7.4. Verification of methodology: a case study ------------------------------------------------------ 121
Chapter 8 Discussion and concluding remarks ------------------------------------------------------- 128
8.2. Contributions of research: theoretical and practical --------------------------------------------- 129
8.3. Recommendations for future research ------------------------------------------------------------- 129
Reference --------------------------------------------------------------------------------------------------- 131
Appendix A ---------------------------------------------------------------------------------------------------- i
Appendix B ------------------------------------------------------------------------------------------------- xiv
Appendix C ----------------------------------------------------------------------------------------------- xviii
Appendix D ------------------------------------------------------------------------------------------------- xix
Appendix E ------------------------------------------------------------------------------------------------ xxv

8
Appendix F------------------------------------------------------------------------------------------------ xxvi
Appendix G ---------------------------------------------------------------------------------------------- xxvii
Biography ------------------------------------------------------------------------------------------------- xxxv
Publication list ------------------------------------------------------------------------------------------- xxxvi
9
List of Figures
Figure 1: The framework of the research ......................................................................................... 15
Figure 2: Capital classification in terms of time .............................................................................. 21
Figure 3: Equity capital classification .............................................................................................. 21
Figure 4: Corporate transparency classification by Bushman et al. 2004 ........................................ 37
Figure 5: Stability states of financial system.................................................................................... 55
Figure 6: The conceptual framework of research design ................................................................. 80
Figure 7: Internal factors influencing the cost of equity capital ....................................................... 83
Figure 8: The formulation of research questions and hypothesis ..................................................... 85
Figure 9: Distribution of Debt to Equity ratio ................................................................................. 94
Figure 10: Distributions of Internal factors ...................................................................................... 97
Figure 11: The significant correlation between internal factors....................................................... 99
Figure 12: The importance of influence of internal factors on the CEC in terms of IPO .............. 108
Figure 13: The ranking of internal factors by weights ................................................................... 112
Figure 14: The ranking of external factors by weights .................................................................. 112
Figure 15: The formative construction of methodology ............................................................... 113
Figure 16: The Methodology Structure .......................................................................................... 115
Figure 17: The influence of internal factors on CEC in Index ....................................................... 116
Figure 18: The influence of external environment on the relation between Index and CEC ......... 118
Figure 19: The influence of determinants changes on CEC level .................................................. 118
Figure 20: The algorithm of proposed recommendations towards determinants improvement ..... 119
Figure 21: the logic of recommendations on sub-level of Index .................................................... 121
Figure 22: Methodology simulation: Recommendations Company C .......................................... 127
10
List of Tables
Table 1: Types of capital and its definitions .................................................................................... 19
Table 2: The corporate disclosure measurement in research ........................................................... 40
Table 3: The categories of corporate governance ............................................................................ 43
Table 4: Definitions of financial stability in terms of the central banks ......................................... 54
Table 5: External and Internal risks of national financial instability ............................................... 56
Table 6: The Quantitative Easing timeline by Central Banks .......................................................... 68
Table 7: Macro- vs. micro-prudential perspectives .......................................................................... 72
Table 8: Alternative set of tools to foster financial stability ............................................................ 73
Table 9: The outline of primary research study ............................................................................... 88
Table 10: The selection criteria for primary research ...................................................................... 89
Table 11: Reliability Statistics ......................................................................................................... 91
Table 12 Descriptive statistics: Debt to Equity ratio ........................................................................ 93
Table 13: Descriptive statistics: the utilized CEC estimation methods by Czech companies ......... 94
Table 14: Descriptive statistics: Internal factors .............................................................................. 95
Table 15: The survey results on internal factors by the level of agreement and lack of awareness 97
Table 16: Rating of internal factors .................................................................................................. 98
Table 17: The survey results on external factors by the level of influence on the CEC ................ 101
Table 18: Descriptive statistics: External factors ........................................................................... 102
Table 19: The external factors and the direction of influence ........................................................ 103
Table 20: Rating of external factors .............................................................................................. 104
Table 21: Descriptive statistics: the risks influencing the cost of equity capital .......................... 105
11
Table 22: Survey result: under which external conditions there is the lowest CEC ...................... 106
Table 23: Descriptive statistics: macroeconomic conditions as a state of economy ...................... 106
Table 24: The companies by industry sector .................................................................................. 106
Table 25: The companies by IPO and export ................................................................................. 107
Table 26: The difference of impact in terms of IPO ..................................................................... 108
Table 27: Chi-Squared Test: Internal factors ................................................................................. 109
Table 28: Chi-Squared Test: External factors ................................................................................ 110
Table 29: the Index coding ............................................................................................................. 116
Table 30: Simulation – the specific variables of Index ICEC ........................................................ 122
12
Abbreviations:
CEC – the Cost of Equity Capital
GDP – Gross Domestic Product
IPO – Initial Public Offering
FSI – Financial Stability Indicators
Index ICEC – Index of Internal factors influencing the cost of equity capital
13
Chapter 1 Introduction
1.1. Rationale and problem statement
The cost of equity capital (CEC here and after) is an essential and significant element of decision
making process of a company. Specifically during the financial instability, it is very critical to manage
capital and its cost effectively towards sustained development of a company. There are various
internal and external factors influencing the cost of equity capital and other corporate financial
performance. One the one hand a company can manipulate the cost of equity capital by adjusting the
internal factors as the strength of corporate governance, financial disclosure, social responsibility and
etc. On the other hand, a company cannot manage external factors as inflation, interest rate, rate of
taxes or financial stability in order to adapt the capital cost to the company’s needs.
The knowledge on the theme of cost of equity capital and its determinants is very spread in the
recent academic theory. There are plenty of studies connected to influence of only one factor or
related group of factors. However in reality all internal and external factors influence together. For
companies it is difficult to collect all spread information regarding the influence of internal factors and
effectively integrate into their decision making process. The availability of applicable tool designed
for the final users of CEC that translate the worldwide knowledge into specific and straightforward
recommendations will benefit in corporate management.
Although the influence of several internal factors on the cost of equity capital has been extensively
studied in the past few decades, the knowledge is spread and is not translated into applicable tool for
final users of cost of equity capital.
The primary research is based on the evidence from the Czech Republic. Previous researches
provide evidence mostly from the USA, the UK, less in developed European countries and Asian
ones. Unfortunately, the evidence showing the situation in the countries with transmission economy
concerning the cost of capital and its adjustment is not given in full measure. The survey carried out
among Czech companies provides essential information for practice and theory, which has not been
mentioned before.
The essential background of this research is the comprehensive, in-depth and structural analysis of
previous worldwide theoretical and empirical studies on the theme of the influence of internal and
external factors on the cost of equity capital. The analysis attempt to establish the
The topic of research is critical due to several reasons:
14
The cost of equity capital is a significant element of corporate finance and essential factor
in the decision-making process of a company
There are many factors that influence the cost of equity capital thus a company has
opportunity to manage its internal environment or adjust its behaviour under certain
external conditions
The worldwide knowledge should be accumulated and transmitted to the final users of
equity capital.
This research is directed to enlarge the current state of knowledge on the CEC in the Czech
environment, compare the theoretical statements and corporate practice.
1.2. Aims and objectives of the Thesis
The name of the dissertation is “The influence of internal and external factors on the cost of equity
capital”. Hence the main aim of the doctoral thesis is
based on the comprehensive review of the theoretical literature on the internal and external factors
influencing the cost of equity capital and a subsequent primary empirical research towards testing the
identified theoretical approaches on a sample of Czech companies to transform the gained knowledge
into a methodology supporting CFO’s decision-making process on corporate financing with regard to
the cost of equity capital reduction. The thesis contributes to the explanation of the corporate
financing decision-making by combining different theories, surveyed gained data in
Czech business environment and econometric methods. In order to achieve the main aim the following
objectives are formulated:
1. To gather the current theoretical and empirical knowledge on the influence of external and
internal factors on the cost of equity capital (theoretical background composition)
2. To investigate the level of agreement between theoretical approaches and corporate
experience in respect of corporate financing assisted by evidence from a sample of Czech
companies gathered by the means of a primary survey on internal and external determinants
of CEC
3. To analyze the significance and influence of internal and external factors on the CEC from
the perspective of CFO in Czech Republic
4. To propose a functional methodology supporting CFO’s decision-making process in the
context of corporate financing with regard to the cost of equity capital reduction
15
The doctoral thesis contributes to the explanation of the corporate financing decisions by
combining different theories, surveyed gained data in Czech environment and econometric methods.
The thesis is intended to accumulate the previous findings on subject of internal and external factors
and their influence on the cost of equity capital and highlight the possible gap between theory and
practice.
The main outcome of the research is the methodology designed to support decision making process
of corporate managers in terms of corporate financing and capital management. The methodology
incorporates the worldwide knowledge of scientific community and practical experience of Czech
companies on the theme of external and internal determinants of the cost of equity capital.
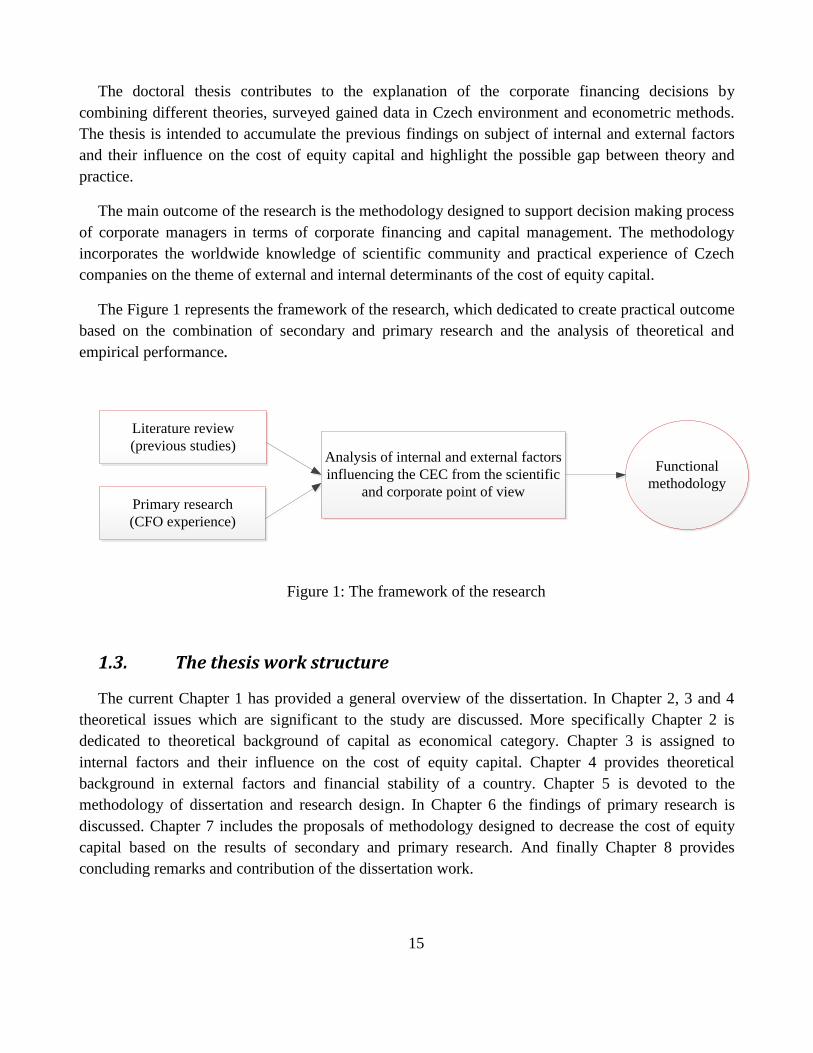
The Figure 1 represents the framework of the research, which dedicated to create practical outcome
based on the combination of secondary and primary research and the analysis of theoretical and
empirical performance.
Literature review
(previous studies)
Primary research
(CFO experience)
Analysis of internal and external factors
influencing the CEC from the scientific
and corporate point of view
Functional
methodology
Figure 1: The framework of the research
1.3. The thesis work structure
The current Chapter 1 has provided a general overview of the dissertation. In Chapter 2, 3 and 4
theoretical issues which are significant to the study are discussed. More specifically Chapter 2 is
dedicated to theoretical background of capital as economical category. Chapter 3 is assigned to
internal factors and their influence on the cost of equity capital. Chapter 4 provides theoretical
background in external factors and financial stability of a country. Chapter 5 is devoted to the
methodology of dissertation and research design. In Chapter 6 the findings of primary research is
discussed. Chapter 7 includes the proposals of methodology designed to decrease the cost of equity
capital based on the results of secondary and primary research. And finally Chapter 8 provides
concluding remarks and contribution of the dissertation work.

16
Chapter 2 Theoretical background: cost of equity capital
2.1. Capital as economic category
Capital is a polysemantic term that is used to characterize certain resource: economic, political,
financial and etc. Etymologically a word «capital» is rooted in VIII-VII centuries B.C. and derives
from the Latin word «caput», which means head. Originally, it was referred to the chopped off head.
In Rome the bulls were sacrificed at the Capitol Hill and their heads were dedicated to Jupiter (Roman
God). In other words, the Capitol Hill means a place of bull sacrifice. It is know that originally the
function of money was performed by cattle, fur etc. In Rome it was cattle thus the most precious
possession was given to Jupiter. The temple of Jupiter was located in the centre of the city as people
used to build their houses around the temple and over the course of time the word «capital» took a
new meaning in point of geographical centre. Subsequently a country arose around this centre, which
became a capital of the country. Given these points the term «capital» as economic and geographic
categories has the same roots. (Balikoev, 2008)
In terms of evolution of capital as economic category Ushakova (2005) outlines the following
stages of capital definition development through the time:
Capital as wealth represented by gold and silver money
Capital as the source of income obtained by agricultural activities
Capital as means of production, i.e. embodied tangible wealth, which utilization enable to
obtain income
Capital as the process of savings that enable to obtain income by the means of entrepreneurial
and management skills
Capital as social economic relations between people in the process of material goods
production
Capital as saved labour, i.e. property rights for it and profit earning are conditioned by
entrepreneurial skills
Capital as discounted income, regardless a sphere of capital utilization and nature of
performed activity
Capital as a set of knowledge, skills and abilities, which enable to obtain income from
realization of output.
Turning to corporate finance the treatment of the term capital as economic category is realized
within the frame of two concepts:
the physical nature of capital (where capital is a set of corporate resources)
the financial nature of capital (where capital is a fund of owners or investors of a company).
17
In accordance to the physical concept capital is a set of resources, which are universal sources of
income of society, and can be divided into personal, private and public. The last two types of capital
can be taken as real and financial. The real capital is realized in material goods as production factors
(buildings, equipment, transport and etc.). At the same time financial capital represents securities and
cash resources (Kovalev and Kovalev, 2014).
The exponents of the physical concept (F. Quesnay (1694-1774); A. Turgot (1727-1781))
determine the main resources of society (i.e. capital) as constantly reproductive wealth, which is able
to produce income (Chernikova, 2009). Together with physiocrats Adam Smith (1723-1790), the
pioneer of classical economics, is committed to physical concept of capital and defines it as machines,
instruments of labour, all buildings being instruments of income, land improvement and acquired
useful abilities of members of society. At the same time D. Ricardo characterizes capital as the part of
state wealth, which is utilized in production and consists of food, clothes, equipment, raw materials,
machines and other resources that are necessary to put labour in motion. He believes that only labour
could create a value and capital is devoid of production capability, but income of owner of capital and
wages have inverse relationship. A. Smith and D. Ricardo give precedence to working capital that is
marked by pre-industrial time (Komkova, 2011).
In the context of a company in line with physical concept capital represents a set of corporate
production capacity that directed to produce specific goods and profit by their realization. In other
words the term capital is considered as characteristics of corporate ability to generate profit. For
example, P. V. Struve (1870-1944) defines capital as economic good that is assigned not to final
consumption but to income generation and can be classified into two forms: natural and monetary.
Also L. V. Khodsky (1845-1919) gives a definition to capital in terms of physical concepts, where
capital is all values, except land, that are used for creation of new values in economic process
(Kovalev and Kovalev, 2014).
Neoclassical economics and I. Fisher consider capital as any goods that bring income to the owner.
The value of capital can be estimated based on the income received by the means of capital. Fisher
(1906) defines capital as “a stock of wealth existing at an instant of time”. Thus according to Fisher
capital is any asset that produces a flow of income over the time. At the same time a flow and a stock
are distinct but linked by the interest rate.
Turning to the financial concept of capital in accounting the category capital is an essential element
in the double-entry bookkeeping system that was used in Italian cities in XIII-XIV centuries. At the
beginning the corresponding account and its balance were considered just technically as equalizer that
counterweigh the cumulative amount of assets and liabilities, i.e. capital like surplice of assets over
liabilities. Later capital was comprehended as category that represents a share of owners in company’s
assets. According to financial concept of capital in terms of a company capital is a financial resources
that were invested directly or indirectly into corporate assets. In other words, capital can be
characterized as the interest of owners of a company in its total assets. Thereby the interest of owners
18
can spread from minimum, viz. savings their capital, to maximum, viz. capital expansion by means of
retained earnings.
For instance K. Menger (1840-1921), the pioneer of Austrian school, understands capital as fund or
set of assets that have monetary form or being evaluated in monetary forms, specifically productive
property as complex of effectively utilized monetary funds. Besides H.R. Hatfield (1866-1945), one
of the founders of US academic accounting, argues that the term capital was brought in by James
Peele, who used the notion in his book on accounting “The pathway to perfectness ” (1569) thus the
accountants accepted the concept of capital before economists discovered it.
The significant contribution was brought by Karl Marx (1818-1883) who is generally considered to
be the classic of the theory of capital and discloses its subject matter, the sources of origin, the laws of
movement, and the forms of manifestation. He treats capital as self-expanding value, where the
conditions are production factors as real labour and continuous movement. According to K. Marx
(1975) capital is a specific, social, belonging to certain historical formation production relation that is
presented as an object and assigns social nature to it. The first form of capital is generally thought to
be merchant or usury capital, which is transformed into production capital as a result of savings.
Moreover, production capital changes it form repeatedly in the process of circulation: monetary
capital – production capital – commodity capital. At the same time another type of capital had been
developed, namely the borrowed capital. Mainly it is characterized as transfer of funds for temporary
and compensated use. The borrowed capital represents monetary capital that is loaned and generates
for its owner returns in the form of interests. And opposed to the production capital the transformation
of the borrowed capital is characterized by formula: monetary capital – monetary capital*, where the
last is capital plus its self-expending value, i.e. interests. During economic development the
aggregation of production and borrowed capital took place that in turn resulted in the formation of
financial capital. Metamorphosis of capital in terms of its circulation and its transformation process in
historical retrospective are results of capital movement and its evolution. Nowadays the aggregate
capital of society consists of five main types of capital: natural capital, social capital, human capital,
infrastructural or production capital and financial.
Nowadays these tow concepts, physical and financial, are tightly bound between each other as
capital presents an asset, i.e. certain physical resource evaluated in monetary form. And in the process
of operation and financial activities this asset transforms into other assets and physical concepts
passes into financial (Kovalev and Kovalev, 2014).
Generally speaking according to Chernikova (2009) the treatments of capital theory can be
classified as follows:
the physical concept, namely the classical theory of capital or treatment of production factors
(presented by classical school of political economics);
the monetary concept, where capital covers by commodity-money flows (presented by
Chicago economic school and its ideologue M. Freedman);
19
the time concept, which is based on the theory of abstinence theory ( Austrian economic
school and W. Jevons; E. von Bawerk; L. Walras; N. Senior);
the marginal concept or marginal productivity theory ( neoclassical economic school and A.
Cournot; J. Dupoit; J. von Thünen; H. Gossen; C. Menger; V. Pareto)
the unity of physical and human capital in terms of theory of human capital (G. Becker;
P.Gutmann; F. Machlup; T.; Shultz; J. Schumpeter).
However, the continuous intensive evolution of capital and modern theory and practice promote the
formation of new specific types of capital: venture capital, brand equity, intellectual capital, goodwill,
information capital, social capital and etc. These contemporary types are referred to capital based on
the key features of capital as economic category: production factors, productive consumption, value
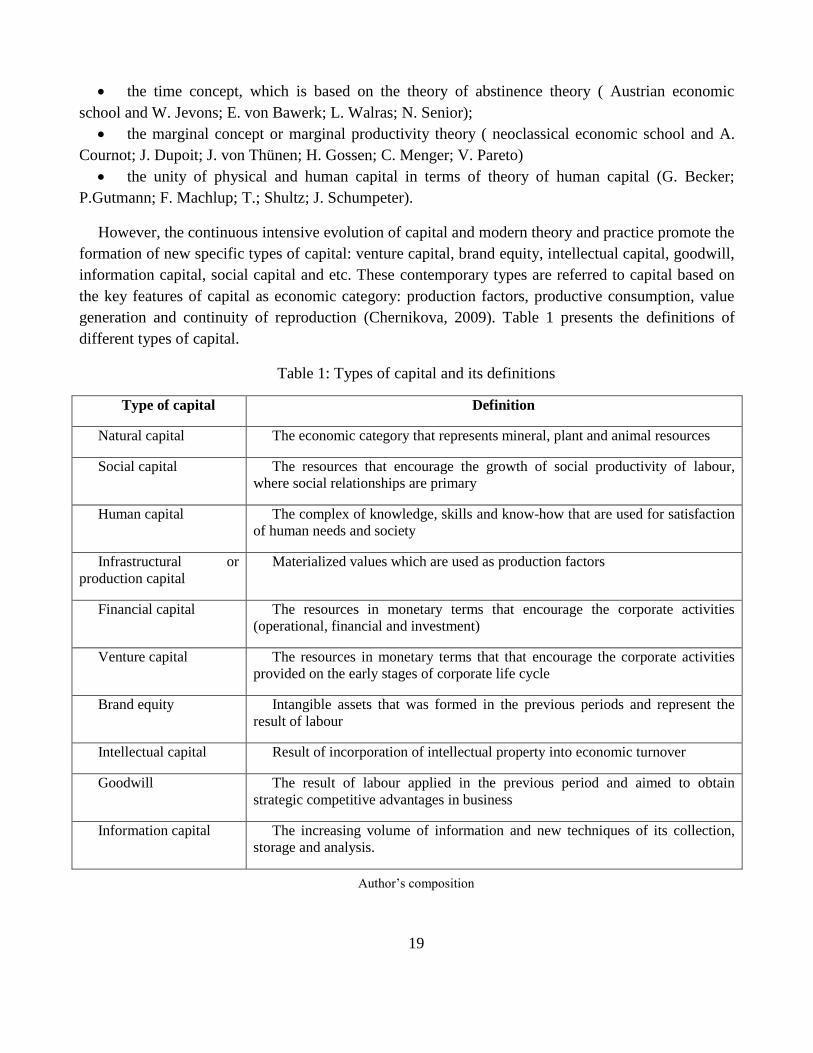
generation and continuity of reproduction (Chernikova, 2009). Table 1 presents the definitions of
different types of capital.
Table 1: Types of capital and its definitions
Type of capital Definition
Natural capital The economic category that represents mineral, plant and animal resources
Social capital The resources that encourage the growth of social productivity of labour,
where social relationships are primary
Human capital The complex of knowledge, skills and know-how that are used for satisfaction
of human needs and society
Infrastructural or
production capital
Materialized values which are used as production factors
Financial capital The resources in monetary terms that encourage the corporate activities
(operational, financial and investment)
Venture capital The resources in monetary terms that that encourage the corporate activities
provided on the early stages of corporate life cycle
Brand equity Intangible assets that was formed in the previous periods and represent the
result of labour
Intellectual capital Result of incorporation of intellectual property into economic turnover
Goodwill The result of labour applied in the previous period and aimed to obtain
strategic competitive advantages in business
Information capital The increasing volume of information and new techniques of its collection,
storage and analysis.
Author’s composition
20
In theoretical terms considering capital as economic category there are three fundamental
approaches for capital evaluation:
Economic
Accounting
Accounting-analytical
The economic approach describes capital through its physical concept, where capital represents the
set of resources being universal sources of income of society and which can be divided into several
groups: (1) personal; (2) private; and (3) public. The last one can be split into real and financial
capital. The real capital is realized in tangible goods as production factors (buildings, equipment,
transport and etc.)
The accounting approach is considered on the corporate level, where capital is a subject of interest
for owners in terms of assets. In other words under this approach the term capital is represented by the
net wealth.
The accounting -analytical approach is a combination of economic and accounting approaches. A
capital as a set of resources can be characterized by:
the direction of its investing
and the source of its origin.
In terms of accounting-analytical approach capital is considered as source of financing of corporate
operations. In addition from tangible point of view capital is spread across all assets of a company
(Shcherbakov and Prikhodko, 2007).
There are many classification of capital as economic category from the different perspectives. One
of the basic classifications determines capital as active and passive in terms of balance sheet. The
active capital represents production capacity of a company, which is formally presented in the assets
side of a balance sheet in the form of fixed capital (fixed assets, long-term investments, construction
in progress, intangible assets and etc.) and working capital (cash, inventory, accounts receivables,
accounts payable and etc.). On the other side of balance sheet there is a passive capital comprised by
long-term financing sources, which in turn form the assets of a company. Thereby passive capital is
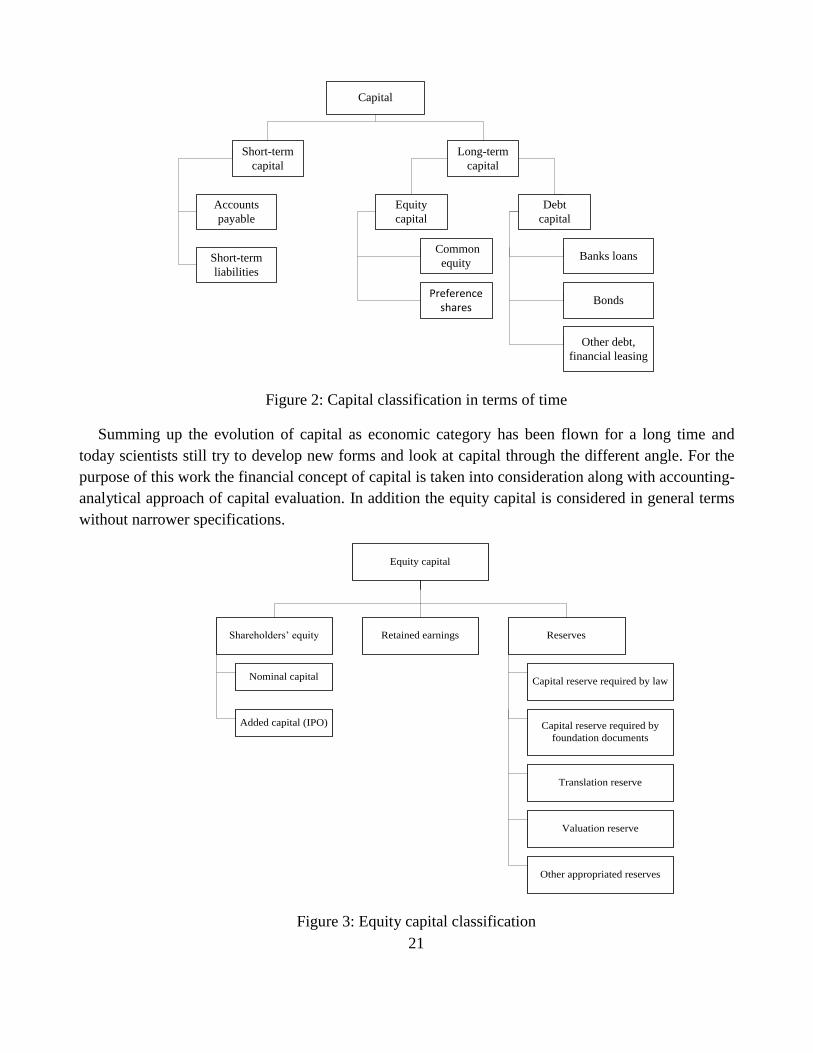
divided into equity and debt capital. Another classification divides capital based on the time response
(Figure 1). The common equity capital includes common shares, retained earnings, additional capital
fund (accumulated surplus), funds and reserves. The equity capital can be classified according to its
origin source of formation and the purpose of utilization (Figure 2)
21
Capital
Short-term
capital
Long-term
capital
Accounts
payable
Short-term
liabilities
Equity
capital
Debt
capital
Common
equity
Preference shares
Banks loans
Bonds
Other debt,
financial leasing
Figure 2: Capital classification in terms of time
Summing up the evolution of capital as economic category has been flown for a long time and
today scientists still try to develop new forms and look at capital through the different angle. For the
purpose of this work the financial concept of capital is taken into consideration along with accounting-
analytical approach of capital evaluation. In addition the equity capital is considered in general terms
without narrower specifications.
Equity capital
Shareholders’ equity Retained earnings Reserves
Nominal capital
Added capital (IPO)
Capital reserve required by law
Capital reserve required by
foundation documents
Translation reserve
Valuation reserve
Other appropriated reserves
Figure 3: Equity capital classification
22
2.2. Cost of equity capital estimation
The cost of capital and its estimation are very essential elements in the financial decision making
process due to following reasons:
• The main corporate aim is to maximize its value that is why the sub-objective is to minimize
costs including the cost of equity capital.
• In order to make an effective investment decision a manager has to find the optimal source of
financing with less costs.
• The financing policy including dividend policy takes into account the cost of capital in order
to make rational decision connecting with financial strategy and company’s further development.
There are a few surveys on the theme of capital, capital cost and different approaches for it
measurement and adjustment. Gitman and Mercurio (1982) survey 177 Fortune 1000 firms regarding
“cost of capital measurement techniques, risk considerations, and cost of capital administration
procedures”. They noticed the gap between financial theory and practice. Moore and Reichert (1983)
examine the application of financial analytical tools among the 74 companies from different industries
and found that 86% of them use time-adjusted capital budgeting techniques. However in comparison
with previous survey they highlight the high degree of compatibility between financial analytical
techniques applied by practitioners and theoretical approaches recommended by academics. The
survey by Beirman (1993) is focused on the utilization of capital budget techniques. Most of the
companies use any form of discounting in their capital budgeting and 93% use a WACC and “72%
used the rate applicable to the project based on the risk or the nature of the project…and 34% used the
rate based on the division’s risk”. It is important to notice that mentioned above surveys are based on
the evidence from U.S.A. Bruner et all. (1998) provide a cost of capital survey of several highly
regarded corporations, leading financial advisors and some bestselling text-books with further
comparison analysis in order to highlight the gap between theory and application. The findings show
that (a) Discounted Cash Flow is the dominant investment-evaluation technique; (b) WACC is the
dominant discount rate used in DCF analysis; (c) weights of capital structure based on the market
values; (d) after tax cost of debt based on marginal pretax costs and marginal or statutory tax rates; (e)
the CAPM is the dominant model to estimate cost of equity. The main difference between
practitioners and theory concern the cost of equity elements: free-risk rate, stock’s equity beta and
market premium rate. The best practice consider that “betas are drawn substantially from published
sources, preferring those betas using a long interval of equity”; risk free rate should regard to the tenor
of the cash flows; companies use a market-risk premium of 6% or lower, while theory and advisors
use higher (Bruner et all. 1998). As the cost of capital plays a great role in practice some analytic
companies provide surveys on the theme of capital cost. The Morningstar Cost of Capital Survey from
December 2010 is focused on the adjustment of industry risk within cost-of-equity models (Barad,
23
2011). The build-up Method and Capital Asset Pricing Model are heavily used in cost of capital
estimation (74,9% and 62% respectively). One-stage DCF are applied by 17.1% of companies and
18.6% use a multi-stage DCF. The least applicable method is Fama-French Model (5,7%). The
interesting fact that 43,7% of survey responders use published betas and only 15,6% estimate it on
their own. The Association of Financial Professionals also made their own research “Current Trends
in Estimating and Applying the Cost of Capital”. According to their findings, the profile of typical
project valuation process is composed. The DCF analysis is used to evaluate the uses of capital to
consider competing projects or long-term investments. The perpetuity growth model is used to
determinate the terminal value to all cash flows and multiple cash flow scenarios for unpredictable
cash flows. The WACC is applied as a rate to discount cash flows, but a company does not adjust it to
reflect considerable factors of a project or investment. However, the companies believe that WACC
method is not perfect. In order to determinate the weights of capital structure the current book debt-to-
equity ratio is used. The cost of debt is based on the current interest rate on the firm’s outstanding
debt with after-tax cost of debt estimated by effective tax rate. The cost of equity is estimated by
CAPM, where risk free rate based on the 10-years Treasure bills and beta taken from Bloomberg
reports using the monthly returns over 5 years period. In addition, the risk-premium is about 5-6%.
2.2.1. Traditional approaches to estimate the cost of equity capital
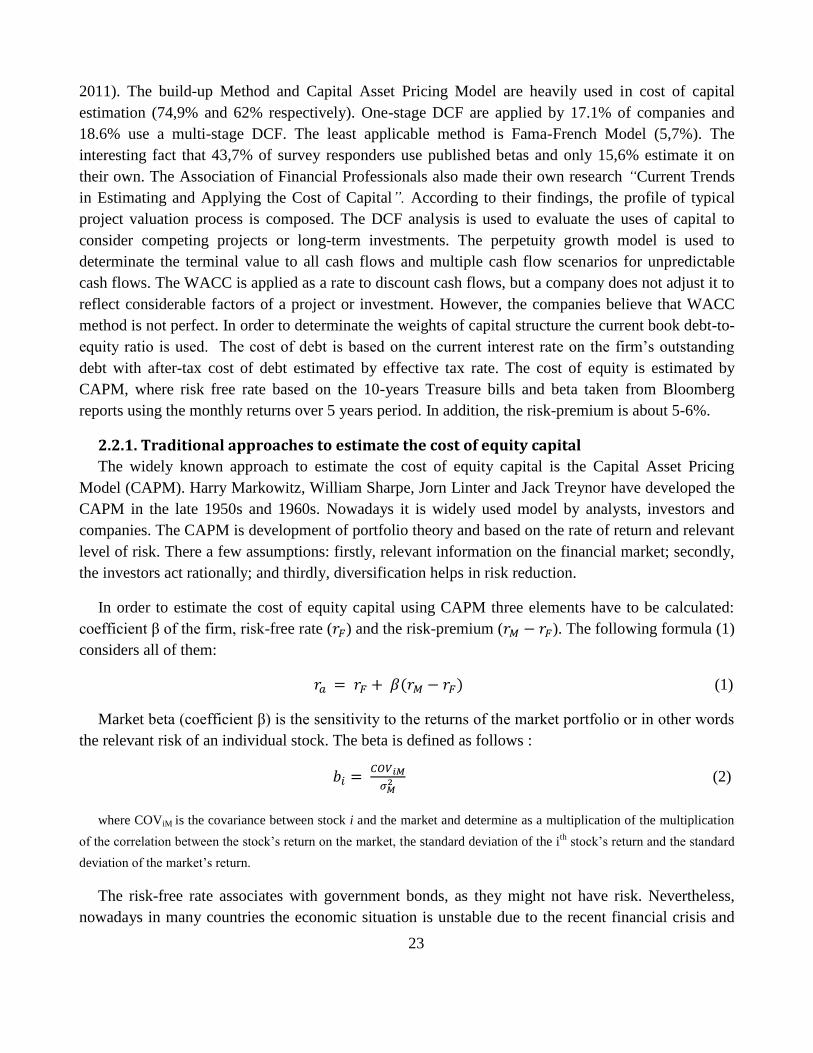
The widely known approach to estimate the cost of equity capital is the Capital Asset Pricing
Model (CAPM). Harry Markowitz, William Sharpe, Jorn Linter and Jack Treynor have developed the
CAPM in the late 1950s and 1960s. Nowadays it is widely used model by analysts, investors and
companies. The CAPM is development of portfolio theory and based on the rate of return and relevant
level of risk. There a few assumptions: firstly, relevant information on the financial market; secondly,
the investors act rationally; and thirdly, diversification helps in risk reduction.
In order to estimate the cost of equity capital using CAPM three elements have to be calculated:
coefficient β of the firm, risk-free rate ( ) and the risk-premium ( ). The following formula (1)
considers all of them:
(1)
Market beta (coefficient β) is the sensitivity to the returns of the market portfolio or in other words
the relevant risk of an individual stock. The beta is defined as follows :
(2)
where COViM is the covariance between stock i and the market and determine as a multiplication of the multiplication
of the correlation between the stock’s return on the market, the standard deviation of the ith
stock’s return and the standard
deviation of the market’s return.
The risk-free rate associates with government bonds, as they might not have risk. Nevertheless,
nowadays in many countries the economic situation is unstable due to the recent financial crisis and
24
default risk exists. As common stocks are usually long-term securities and many companies’ projects
have long-term period, the bonds for estimating risk-free rate have to be also long-term.
The risk premium is the difference between the return expected for the market as a whole and the
risk free rate. We can estimate the equity market risk premium with two approaches:
• on the bases of forecast data (FFCF) and the current share price;
• on the bases of historical data relating to rates of returns received by investors over the long
periods.
The historical risk premium is based on comparison of annual performance of equity markets
(including dividends) and the long-term risk-free rate. Expected risk premium is calculated by
estimating the future cash flows of all companies and the finding the discount rate that equates those
cash flows with current share prices. In the efficient markets historical rates of return should be equal
to future rate of return.
The approach based on the historical data has a big disadvantage: one of the most important goals
of a company is development and growth. Moreover, for investors it is important to know what will
be in the future not in the past, because they expect profit in the long-term period. The environment is
always changing and forecast based on historical data can be not relevant to current and future
conditions. Today world economy is unstable and volatility on the financial markets is high too. As a
result of the external changes methods based on historical data is not highly reliable.
On the one hand, there are many advantages of the CAPM. Firstly, it is the most used model. It
takes into account risk, one of the most important elements in estimating the cost of capital. Secondly,
there is a direct link between the profitability and the risk of an asset. Finally, the connection with
market activities gets the result more competitive and relative to the current conditions. In addition
CAPM can be used as a benchmark for a larger peer group of companies due to absence of additional
factors as firm-level data or leverage. For instance Barnes and Lopez (2005) argue that CAPM can be
an appropriate estimate of CEC for the Federal Resever Bank’s payment system.
On the other hand, the CAPM assumes that markets are efficient and it is the most widely used
model, but there are some disadvantages of this model:
the limits of diversification;
difficulties in measuring the required return and general market index;
risk free based on zero-coupon government bonds has default risk nowadays due to the last
financial crisis and uncertainty in some countries;
a different discount rate for each period of time have to be used in the CAPM model in order
to be close to reality;

25
the main disadvantage of beta is instability over the time. (a large amount of information turns
into its weakness);
as the CAPM is based on the current investors’ expectations, there is a probability of too high
or too low expectations that leads to the wrong expectations;
stochastic nature;
the CAPM is a function of only one variable, the systematic risk
the CAPM does not take into consideration the retained earnings and provides the cost of
capital of external equity.
Despite the merits, which CAMP has and the fact that it is one of the most used methods to
estimate the cost of equity capital, we should emphasize that demerits in this approach definitely
prevail. Thus, the economists try to modify this model in order to make it more effective and relevant.
They search for a new correlations and add additional variables.
Besides required return can also be a function of liquidity. In the update model the liquidity
premium might be added. Higher liquidity leads to lower cost of capital and lower risk encourages
lower cost of capital. But it is easier to increase the liquidity of the company’s stocks then to decrease
its risk. In order to raise the liquidity and as a result decrease cost of capital a company can provide
higher transparent disclosure or increase the quality of accounting information. There are several
researchers working on this problem. Also Acharya and Pedersen (2004) modified CAPM as
Liquidity Adjusted-capital Pricing Model. In this method a scurrility’s required rate of return depends
not only on its liquidity but also takes into account the covariance between its own and the market
return and liquidity. Moreover, a stable positive shock on a security’s liquidity can decrease current
rate of return and increase future (Acharya and Pedersen, 2005). Also Hamon and Jacquillat (1999)
add liquidity premium together with risk premium. Due to the liquidity crisis placed not long time ago
the liquidity risk adjustment is very important element of financial policy. The modified CAPM
model by liquidity coefficient can be effective tool for company’s stable growth in the post-crisis
period.
Another additional element that can be added to the model is a size premium. Size premium is the
additional remuneration due to the higher risk, the higher cost of capital, according to the smaller size
of a company. Moreover the small size companies’ risk rises due to the less trading volume. However,
the large companies are not so flexible and do not react fast on the changes of an environment as small
size companies do. In the small companies with smaller board size, the cost of capital is lower than in
large companies (Yermack, 1996). Thus there are several advantages for small size companies and it
is not necessary to add the size premium to the model.
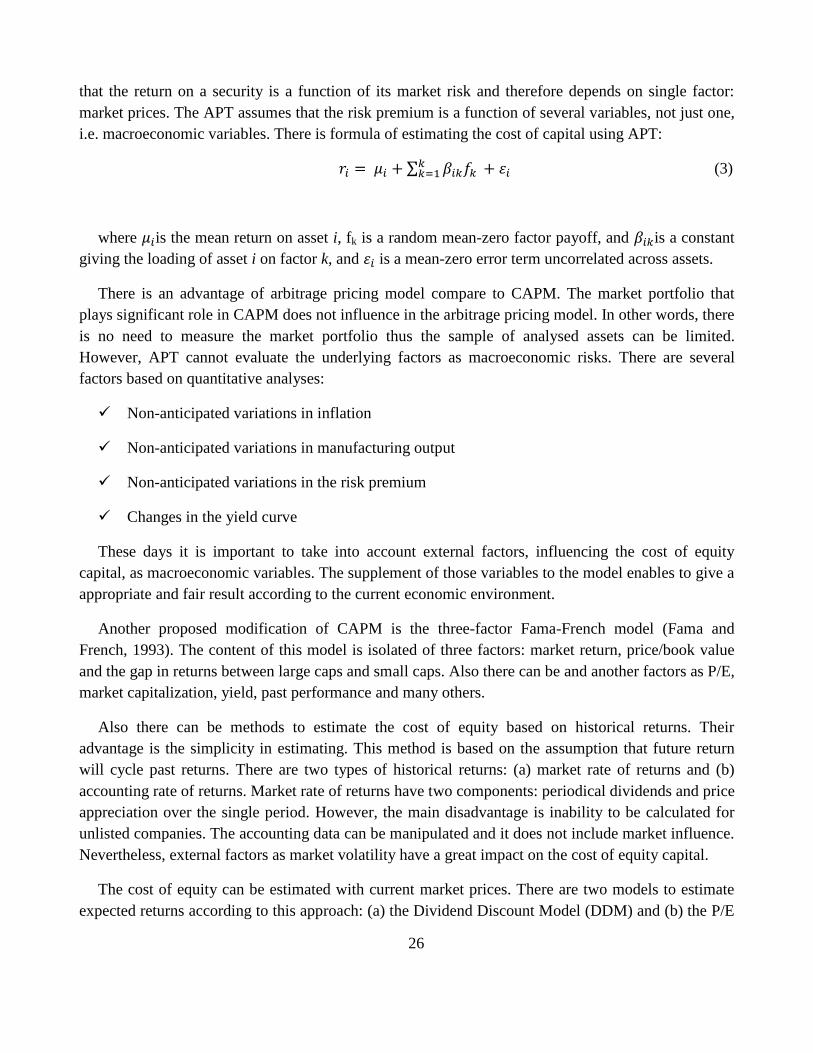
There are some others multifactor models that are used on practice. The first one is the arbitrage
pricing theory (APT) created by economist Stephen Ross in 1976 (Ross, 1976). The CAPM assumes
26
that the return on a security is a function of its market risk and therefore depends on single factor:
market prices. The APT assumes that the risk premium is a function of several variables, not just one,
i.e. macroeconomic variables. There is formula of estimating the cost of capital using APT:
(3)
where is the mean return on asset i, fk is a random mean-zero factor payoff, and is a constant
giving the loading of asset i on factor k, and is a mean-zero error term uncorrelated across assets.
There is an advantage of arbitrage pricing model compare to CAPM. The market portfolio that
plays significant role in CAPM does not influence in the arbitrage pricing model. In other words, there
is no need to measure the market portfolio thus the sample of analysed assets can be limited.
However, APT cannot evaluate the underlying factors as macroeconomic risks. There are several
factors based on quantitative analyses:
Non-anticipated variations in inflation
Non-anticipated variations in manufacturing output
Non-anticipated variations in the risk premium
Changes in the yield curve
These days it is important to take into account external factors, influencing the cost of equity
capital, as macroeconomic variables. The supplement of those variables to the model enables to give a
appropriate and fair result according to the current economic environment.
Another proposed modification of CAPM is the three-factor Fama-French model (Fama and
French, 1993). The content of this model is isolated of three factors: market return, price/book value
and the gap in returns between large caps and small caps. Also there can be and another factors as P/E,
market capitalization, yield, past performance and many others.
Also there can be methods to estimate the cost of equity based on historical returns. Their
advantage is the simplicity in estimating. This method is based on the assumption that future return
will cycle past returns. There are two types of historical returns: (a) market rate of returns and (b)
accounting rate of returns. Market rate of returns have two components: periodical dividends and price
appreciation over the single period. However, the main disadvantage is inability to be calculated for
unlisted companies. The accounting data can be manipulated and it does not include market influence.
Nevertheless, external factors as market volatility have a great impact on the cost of equity capital.
The cost of equity can be estimated with current market prices. There are two models to estimate
expected returns according to this approach: (a) the Dividend Discount Model (DDM) and (b) the P/E
27
model. The first one is based on the stream of the dividends. There are two assumptions: (a) the
growth rate of dividends and the cost of equity are constant from 0 to ∞ and (b) the growth rate of
dividends cannot exceed the cost of equity. But according to the research (Fama and French, 1999)
only 20,8% in 1999 of companies pay dividends. In ten years this index grew to 40% but still very
low (Hoberg and Prabhala, 2009).
2.2.2. Modifications and improvements: academics’ perception
As was mentioned before there is no unique and optimal model to estimate the cost of equity
capital. Thus, authors try to modify models, add different variables and combine approaches. The
studies according the influence of different studies on the cost of equity capital also face the problem
to estimate the cost of equity capital.
Never the less, equity valuation models use the discount rate, in order to estimate the present value
of expected dividends. They are based on the CAPM, so the discount rate is always represented by the
sum of the equity risk premium and the risk-free rate (Gode and Mohanram, 2003). There are two
ways to estimate risk premium: ex-post and ex-ante. Most of studies are based on the ex-ante
approach of equity capital estimation (Botason, 1997; Gebhardt et al., 2001; Botason and Plumlee,
2002; Hail, 2002; Armstrong et al., 2010). This method implies the current price and future expected
dividends for the risk premium.
Many researchers adopt several models and compute the estimates of the cost of equity capital.
There are several most used models that can be divided into two groups: residual income valuation
models (by Claus and Thomas, 2001; by Gebhardt, Lee and Swaminathan, 2001) and abnormal
earnings growth valuation models (by Ohlson and Juettner-Nauroth, 2005; by Easton, 2004).
The model by Claus and Thomas (2001) (CT model) is a special case of the residual income
valuation model. In order to obtain the expected future residual income series, they use the actual
book values per share and forecasted earnings per share up to five years ahead. This model is closed to
the dividend discount model, but the main difference is the utilization of the future earnings per share
with short-term and long-term growth rates. The following equation represents the model:
P0 = bvo + ae1 /(1+k)+ae2 / (1+k)2
+ ae3 / (1+k)3
+ae4/(1+k)4
+ ae4 / (1+k)5 + (4)
+ [ae5 (1+gae)/(k-gae)(a+k)5]
where Pot is a price at the end of year 0; bv0 is an expected book value of equity at the end of year 0; k is expected rate
of return on the market, g is an expected dividend growth rate; aet = et – k(bvt-1) is an expected abnormal earnings fro year
t.
28
The model by Gebhardt, Lee and Swaminathan (2001) (GLS model) is also residual income
valuation model, which uses actual book values per share and forecasted earnings per share up to three
years ahead to impute future expected residual income for initial three-year period.
The Ohlson and Juettner-Nauroth (2005) model (the OJ model) represents the abnormal earnings
growth valuation model, where one-year ahead forecasted earnings and dividends per share as well as
forecasts of short-term and long-term abnormal earnings growth are used.
In the model, the current price relates to forthcoming earnings per share, forthcoming dividends per
share, two-year-ahead earnings per share, and an assumed perpetual growth rate gamma. The OJ
model uses earnings instead of dividends and does not require forecast of book values or return on
equity. Another important feature is that the assumed perpetual growth rate gamma determines not
only the perpetual growth rate, but also the decay rate of short-term growth (Gode and Mohanram,
2003). One of the disadvantages of this model is that it does not deal with inflation. However, as it is
mainly based on accounting variables, the sample can be significantly increased (Lopes and de
Alencar, 2010). The OJ model is estimated by following formula:
= A +
(5)
where A =; gs =
; is the cost of equity capital; = is the long-term earnings growth rate
+1; is the short-term earnings growth rate; g1 is the long-term economic growth rate; is the yield on 3 –year treasury
bond; is the analysts’ forecast of earnings per share at time t; are the expected dividends per share at time t.
Gode and Mohanram (2003) also adopt the OJ model of the cost of equity capital estimation and
connect in the model current price with one-year-ahead forecasts, forthcoming dividends per share,
two-year-ahead forecasts, and an assumed perpetual growth rate, which reflect in the inflation rate and
dividends per share as the average for the past three years.
In addition, there are two modifications of residual income model (RIV) developed by Gebhardt et
al. (2001) and Liu et al. (2002), which are differ from the OJ model in their assumption about long-
term industry profitability. The OJ model as most used was adopted as one of the several proxies for
capital cost measure by Espinosa and Trombeta (2007); Daske et al. (2008); Shah and Butt (2009);
Pae and Choi (2010); Chen et al. (2011) and many others researchers.
Price-earnings growth (PEG) ratio model by Easton (2004) represents the modified model by
Ohlson and Juettner-Nauroth (2005), which use one-year-ahead and two-year-ahead earnings per
share forecasts as well as expected dividends per share in period t+1 to measure the abnormal earnings
growth. He develops “…a procedure for simultaneously estimating the implied market expectation of
the rate of return and the implied market expectation of the long-run change in abnormal growth in
earnings (beyond a short earnings forecast horizon) for a portfolio of stocks.” (Easton, 2005) There is
29
an assumption under this model that the growth in abnormal earnings persists in perpetuity after the
initial period. The main advantage is its practicability. The formula for estimating the cost of equity
capital by the modified PEG ratio can be applied as follows:
(6)
where ’ is the current price per share.
The modified PEG ratio by Easton (2004) is also the most used in the examined studies, for
example, this approach was implied by Ashbaugh et al. (2004); Byun et al. (2008); Daske et al.
(2008); Shah and Butt (2009); Pae and Choi (2010); Li (2010); Chen et al. (2011). The accounting-
based valuation models benefit as they are “…forward-looking and directly reflects the market
perception of a company’s risk.” (Lopes and de Alencar, 2010)
The previous studies according the cost of equity capital imply several models for more precise
results. For example, Daske et al. (2008); Chen et al. (2011) follow by Hail and Leuz (2006) use the
average of four models that are consistent with discounted dividend valuation but rely on different
earning-based representations: CT model (2001), GLS model (2001), OJ model (2005), and modified
price-earnings growth (PEG) ratio model by Easton (2004).
Espinosa and Trombeta (2007) use an average of the four estimates in order to obtain the cost of
equity capital. The first measure is calculated by using the residual income valuation model proposed
by Gebhardt et al. (2001), where the stock price is expressed as the reported book value, plus an
infinite sum of discount residual incomes. The other three measures are based on the OJ model: price
to forward earnings model, price to earnings growth model, and modified price to earnings growth
model.
Byun et al. (2008) adopt three measures of equity capital estimated by a mean or median analysts’
earnings forecast: the implied cost of equity capital estimated by Gode and Mohanaram (2003), by the
price-earnings growth model (PEG) and by the modified PEG ratio. The models use price and
analysts’ earnings forecasts, but the differences are in their assumptions about long-term growth rates
and dividends. Li (2010) also use a mean measure based on four estimation models: the industry ROE
model by Gebhardt et al. (2001), the economy-wide growth model by Claus and Thomas (2001), the
unrestricted abnormal earnings growth model by Gode and Mohanram (2003), and the restricted
abnormal earnings growth model by Easton (2004).
Many authors applied the average of these four models, in order to mitigate the effect of estimation
errors associated with one single model (Daske, 2008; Hail and Leuz, 2009; Li, 2010; Chen et al. ,
2010; Core et al, 2015 and etc.). The models vary in the use of analyst’ forecasts and the assumptions
of short-term and long-term growth.
30
Chapter 3 Internal factors influencing the cost of equity capital:
literature review
The internal environment factors facilitate the strengths and weakness of a company that in turn
affect its development and all company’s activities. A company is able to manage the internal factors
influencing the business processes in order to achieve its targets. The capital management is one of the
most significant elements of decision-making process. And the effective financial decisions supported
by the information regarding the relation between internal factors, the capital and its cost result as a
clue to the stable successful development of a company.
There are many research papers dedicated to different distinct internal factors that influencing the
cost of equity capital. As a rule the internal factors and their impacts that are analyzed by
international scientists can be divided into several groups as corporate disclosure, corporate
governance, social performance and other financial related performance. The information and its
asymmetry are an important link between the cost of equity capital and other factors.
3.1. Information asymmetry as a core of relation between internal factors and
the cost of equity capital
The availability of information is an essential factor in the decision-making process regarding the
efficiency of resource allocation on micro and macro levels. The inequality of available information
between corporate insiders and stakeholders as investors is thought of as information asymmetry.
Back to Myers (1984) and Myers and Majluf (1984) who argue that information asymmetry drives
financial decisions, the situation, when the private information exceed the publicly available
information about future corporate performance, leads to higher cost of equity capital required by less
informed investors.
Barron et al. (2012) show that information leads to higher cost of equity capital. In addition, they
find that average precision and precision of public information are negatively associated with cost of
equity capital. At the same time the precision of private information positively influences the CEC,
however the coefficient is relatively small. Besides, with lower public information the precision of
private information reduces the cost of capital. Lately He et al. (2013) investigate the relation between
information asymmetry and cost of equity capital of companies listed on the Australian Securities
Exchange. They find the significant positive relation between two variables. Authors also try to
analyse information asymmetry and its impact on CEC through different angles. For example,
Armstrong et al. (2010) examine the influence of information asymmetry on the cost of capital
according the market competition. If market is imperfect, the information asymmetry has a significant
effect on the cost of capital; and there is no impact, if there is a perfect market competition. Thus, the
31
studies investigating relation between information asymmetry and the cost of capital, should take into
account the level of market competition.
As the information asymmetry is very wide term, the researchers apply different types of proxies to
estimate the information asymmetry component in the cost of equity capital. The most popular
measure among researchers is bid-ask spread (Leuz and Verrecchia, 2000; Armstrong et al., 2010; He
et al., 2013), which represents the difference between the ask price and the bid price of a share. The
bid-ask spread refers to the adverse selection problem that emerges in shares transactions with
asymmetrically informed investors. Thus less information asymmetry is associated with less adverse
selection that in turn leads to smaller bid-ask spread. The alternative measure of asymmetric
information is trading volume, which refers to liquidity. It represents the willingness of investors to
sell the shares or to buy them that in turn is related to the existence of information asymmetry.
Another measure as share price volatility also is used as a proxy of information asymmetry (Lang and
Lundholm, 1993; Leuz and Verrecchia, 2000). The smooth transitions in share prices stand for the
absence of information asymmetry; the higher level of volatility indicates the increasing information
asymmetry between a company and shareholders or even between investors. However, the alternative
proxies as trading volume or price volatility might be affected also by other factors than information
asymmetry (Leuz and Verrecchia, 2000). Consequently, there can be the combination of several
proxies to measure information asymmetry. For example, Armstrong et al (2010) use five measures to
estimate information asymmetry: two market-based measures as (1) the adverse selection component
of the bid-ask spread (ASC spread) and (2) the bid-ask spread; two accounting-based measures as (3)
the ratio of annual research and development expense to sales and (4) scaled accruals quality; (5)
analyst coverage. The last one represents “the number of sell-side analysts issuing one-year-ahead
earnings-per-share forecasts for the firm during the year”. The greater analyst coverage might improve
the information environment that in turn leads to lower information asymmetry. As was mentioned
before the market-based proxies are widely used among researchers. According to authors the
advantage of ASC spread and spread itself is the precisely measurement of the information asymmetry
outcome. The existence of information asymmetry results in ASC spread increase. In terms of
accounting-based measures the R&D expense represents the intangible assets, which in turn might be
associated with information asymmetry. At the same time the higher variance of scaled is associated
with lower earnings quality that in turn leads to higher information asymmetry. Barron et al. (2012)
also use analyst coverage to measure information environment characteristics, including the
information asymmetry. Their approach takes into consideration the expected dispersion of analyst
forecast, as well as squared errors in the mean forecasts based on historical data and the number of
analyst following. The study of He et al. (2013) also shows that analyst coverage negatively influence
the CEC and earnings forecast dispersion leads to higher cost of equity capital.
The information asymmetry can be treated as idiosyncratic volatility. Therefore, in order to reduce
idiosyncratic component of cost of equity capital, the level of disclosure can used as influential tool to
decrease information asymmetry between managers and investors (Lopes and de Alencar, 2010).
32
3.2. Financial disclosure, accounting information and audit quality
Corporate disclosure is an important part of corporate governance (Ashbaugh et al., 2004; Byun et
al., 2008; Pae and Choi, 2011). The quality of accounting information and its transparency decrease
the information and agency risks. There is no doubt to say that disclosure reduce information
asymmetry and as a result decrease the cost of capital. The information asymmetry represents the
adverse selection into transactions between buyers and sellers, and therefore reduces liquidity in
company’s shares (Copeland and Galai, 1983; Kyle, 1985; Glosten and Miligrom, 1985). This effect
occurs in three ways. Firstly, investors demand a risk premium for bearing information risk. In turn,
disclosure reduces it, consequently risk premium decreases and as a result cost of equity capital.
Secondly, higher disclosure decreases estimation risk and thirdly it enhances stock market liquidity
and as a result reduce transaction cost that leads to lower cost of equity capital.
3.2.1. Accounting information
Accounting information plays a great role in the decision making process and other firm’s
activities. Moreover, its quality and quantity might decrease or increase the information asymmetry
and as a result have an impact on the cost of capital. Many researches examine the different aspects of
accounting information and their influence on the capital costs.
Firstly, Easley and O’Hara (2004) investigate the influence of private and public information on
the cost of capital with further development of asset-pricing model, where both types of information
affect asset returns. Investors demand higher return to the companies with greater private information
and correspondingly less public. Private information causes additional systematic risk and thus an
investor requires compensation for that kind of risk. According to their equilibrium a company with
information that is more private and less public faces a higher cost of equity capital.
Lately Li (2005) finds that low precision of noisy information about the expected aggregate
dividend growth rate increases the risk premium and stock return volatility and in turn the precise
information decreases the risk premium and as a result the cost of capital.
Apergis et al. (2011) provide theoretical model, which shows that “an increase in expected cash
flows, coming from improvements in the quality of accounting information, leads to a reduction in the
firm’s cost of capital”. From the model the authors point out several factors leading to the cost of
capital reduction: (1) “the decline of the variance in the idiosyncratic variation in firm’s cash flows”;
(2) “the decline of the variance in the common variation in firm’s cash flows with the market”; (3)
“the increase in the shareholder’s base of the economy or alternatively the increase in the number of
investors who participate in the market”; (4) “the increase in the risk tolerance of the market”; and (5)
the increase in the firm’s expected cash flows”.
33
The corporate earnings as a significant element of accounting information are a widespread subject
of research. The earnings are the significant part of accounting information, which can be disclosed, in
order to reduce the risk of information asymmetry. Consequently, the earnings characteristics are
examined as factors influencing the cost of equity capital. One of the most indicative attributes of
earnings is earnings smoothness. It is generally thought among executives that earning smoothness
might lead to lower cost of capital. However, McInnis (2010) finds that there is no relation between
earnings smoothness and average stock returns over 30 years period. At the same time there is
evidence that inverse association between cost of capital and earnings smoothness is driven by
optimism in analysts’ long-term earnings forecasts. Consequently, companies with volatile earnings
do not experience high returns.
Another significant earnings characteristic is their quality level. The researchers determine that low
quality of earnings increase information asymmetry, which lead to higher cost of equity capital
(Aboody et al., 2005; Lara et al., 2010). For instance, Apergis et al. (2012) empirically investigate the
influence of accounting information and the earnings quality on the cost of capital. According to
authors higher quality represents higher precession of public disclosure; when lower level of private
information minimizes gains obtained by privately informed investors. The quality of earnings is
defined by the absolute value of the abnormal component of accruals: the higher absolute value is
associated with lower quality. The authors conclude that discretionary accruals as a measure of
earnings quality are important proxy for corporate information environment. The abnormal
component of accruals reduces the effectiveness of public earnings announcements that in turn
increases the risk of information asymmetry.
Further, conservatism represents another attribute of earnings quality from the view were earnings
are determined to evaluate economic income. In terms of transparency and information asymmetry the
concept of accounting conservatism has been occurred. In 1980 the Financial Accounting Statements
Board developed the Statement of Financial accounting Concepts, where conservatism was defined as
“a prudent reaction to uncertainty to try to ensure that uncertainties and risks inherent in business
situations are adequately considered”. Givoly and Hayn (2000) define conservatism as “a selection
criterion between accounting principles that leads to the minimization of cumulative reported earnings
by slower revenue recognition, faster expense recognition, lower asset valuation, and higher liability
valuation”. They also determine two measures of conservatism: (1) the sign and magnitude of
accumulated accruals over period of time; and (2) the excess of the relation between stock price
movements and earnings signals in “bad news” periods of time over such relation in “good news”
periods. Watts (2003) points out the alternative explanations of conservatism as contracting,
shareholder litigation, taxation and accounting regulation. In general terms, the accounting
conservatism can be classified as ex post (also named as conditional or news-dependent) and ex ante
(also named as unconditional, news independent). Ex ante conservatism represents “aspect of the
accounting process determined at the inception of assets and liabilities yield expected unrecorded
34
goodwill”1. Ex-post conservatism refers to situation when “book values are written down under
sufficiently adverse circumstances but not written up under favourable circumstances, with the latter
being the conservative behaviour”2 (Beaver and Ryan, 2005).
As accounting conservatism incorporate transparency and timeliness of financial reporting, many
researchers investigate its influence on the cost of equity capital as one of the information
characteristics. Chan et al. (2009) find that ex ante conservatism leads to lower cost of equity capital.
Ex ante and ex post conservatism provide different information about the quality of a firm’s current
and future earnings to equity investors. Ex ante conservatism leads to lower cost of equity capital
because it provides more persistent and predictable current and future earnings streams and therefore
ensures good quality earnings and accounting information to the market. In addition, companies, with
higher level of ex ante accounting conservatism have lower cost of equity capital despite the level of
leverage, the firm’s size, earnings variability. Later Artiach and Clarkson (2010) also find negative
relation between ex ante firm-level conservatism and cost of equity capital; however, the association
becomes weaker with low information asymmetry.
Besides the conditional conservatisms is also significantly negatively related to cost of equity
capital. Basu (1997) determines conditional conservatism as “more timely recognition in earnings of
bad news regarding future cash flows than good news” that can be explained by hire sensitivity of
earnings to negative unexpected returns rather that to positive. Later based on the empirical evidence
Lara et al. (2011) argue that conditional conservatism leads to higher information precision, increased
company value and lower cost of equity capital by the means of decreasing the uncertainty in amount
and distribution of the future cash flows and volatility of future stock prices. In another words
additional conservatism decreases information asymmetry problems, improves investment efficiency
and results in stronger corporate governance. The research conducted by Mikhail et al. (2004) shows
that companies with repeated surprising quarterly earnings announcement experience higher cost of
capital. Moreover, the sign of earning surprise does not influence the outcome. In another words, the
market take into consideration the smoothness of earnings to a greater extent rather than the pattern of
news (i.e. bad or good news).
Summing up, there is no doubt that high quality accounting information reduces the information
asymmetry that in turn alleviates the conflict between managers and investors and as result lead to
lower cost of capital.
1 Examples of ex-ante conservatism are immediate expensing of the cost of most internally developed intangibles,
depreciation of property, plants and equipment as accelerated depreciation, historical cost accounting for positive net
present value projects (Beaver and Ryan, 2005) 2 Examples of ex-post conservatism can be lower of cost or market accounting for inventory and impairment
accounting for long-term tangible and intangible assets (Beaver and Ryan, 2005)
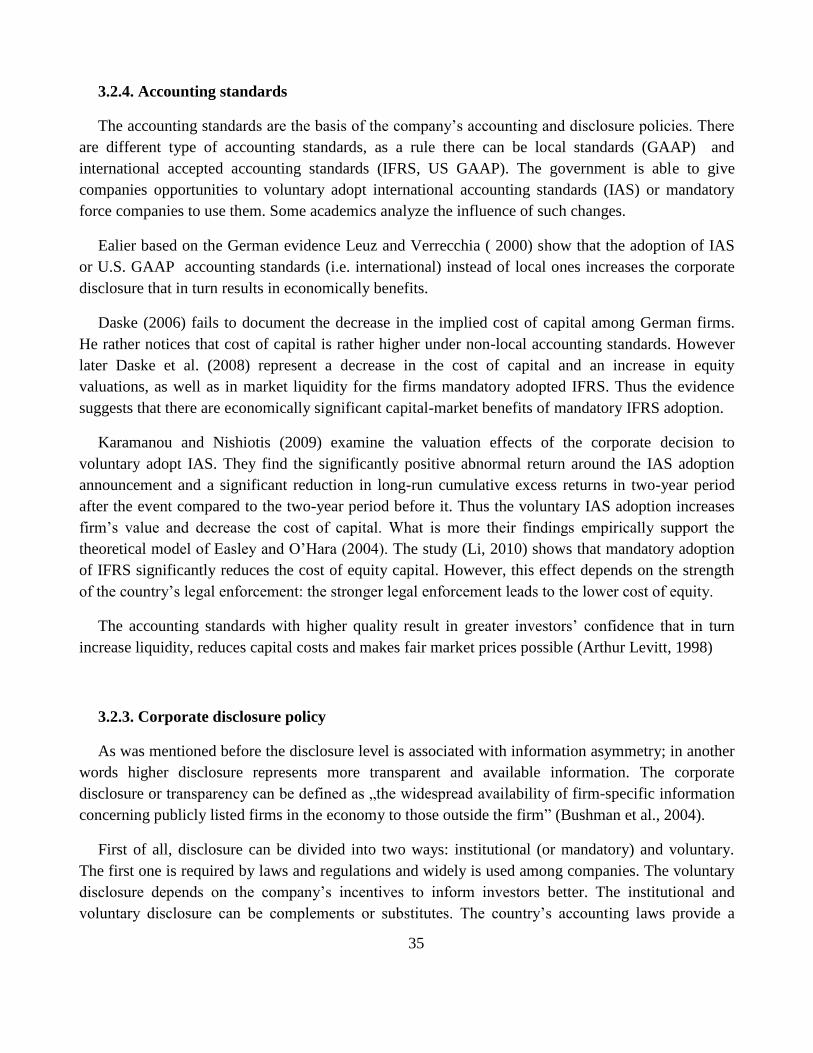
35
3.2.4. Accounting standards
The accounting standards are the basis of the company’s accounting and disclosure policies. There
are different type of accounting standards, as a rule there can be local standards (GAAP) and
international accepted accounting standards (IFRS, US GAAP). The government is able to give
companies opportunities to voluntary adopt international accounting standards (IAS) or mandatory
force companies to use them. Some academics analyze the influence of such changes.
Ealier based on the German evidence Leuz and Verrecchia ( 2000) show that the adoption of IAS
or U.S. GAAP accounting standards (i.e. international) instead of local ones increases the corporate
disclosure that in turn results in economically benefits.
Daske (2006) fails to document the decrease in the implied cost of capital among German firms.
He rather notices that cost of capital is rather higher under non-local accounting standards. However
later Daske et al. (2008) represent a decrease in the cost of capital and an increase in equity
valuations, as well as in market liquidity for the firms mandatory adopted IFRS. Thus the evidence
suggests that there are economically significant capital-market benefits of mandatory IFRS adoption.
Karamanou and Nishiotis (2009) examine the valuation effects of the corporate decision to
voluntary adopt IAS. They find the significantly positive abnormal return around the IAS adoption
announcement and a significant reduction in long-run cumulative excess returns in two-year period
after the event compared to the two-year period before it. Thus the voluntary IAS adoption increases
firm’s value and decrease the cost of capital. What is more their findings empirically support the
theoretical model of Easley and O’Hara (2004). The study (Li, 2010) shows that mandatory adoption
of IFRS significantly reduces the cost of equity capital. However, this effect depends on the strength
of the country’s legal enforcement: the stronger legal enforcement leads to the lower cost of equity.
The accounting standards with higher quality result in greater investors’ confidence that in turn
increase liquidity, reduces capital costs and makes fair market prices possible (Arthur Levitt, 1998)
3.2.3. Corporate disclosure policy
As was mentioned before the disclosure level is associated with information asymmetry; in another
words higher disclosure represents more transparent and available information. The corporate
disclosure or transparency can be defined as „the widespread availability of firm-specific information
concerning publicly listed firms in the economy to those outside the firm” (Bushman et al., 2004).
First of all, disclosure can be divided into two ways: institutional (or mandatory) and voluntary.
The first one is required by laws and regulations and widely is used among companies. The voluntary
disclosure depends on the company’s incentives to inform investors better. The institutional and
voluntary disclosure can be complements or substitutes. The country’s accounting laws provide a
36
minimum standard for its listed companies, indicated what kind of information has to be disclosed.
However the managers have discretion to voluntary provide additional information above
requirements.
Bushman et al. (2004) divide corporate transparency into two dimensions: (1) financial
transparency and (2) governance transparency. They argue that the financial transparency is related to
political regime and governance transparency is associated with legal regime. Under their framework
the corporate information mechanism can be classified into three categories: corporate reporting,
private information acquisition, and information dissemination (Figure 3). Following Bushman et al.
(2004) DeBoskey and Gilett (2013) conduct factor analysis of ten corporate transparency variables
used by other researchers and identify four independent dimensions of corporate disclosure: public
disclosure information, intermediary information, earnings quality information and insider
information. They also investigate the influence of these variables on the cost of equity capital and
other corporate performance. Their findings show that intermediary information transparency and
insider information transparency are significantly associated with cost of equity capital.
One of the most difficult challenges in corporate disclosure research is the choice of appropriate
proxy for disclosure. The key problems of disclosure measurement are difficulty in the identification
of the full population of disclosures and difficulty to consistently classify the form and type of
disclosure. As a rule researchers might use two alternative approaches to measure disclosure: own
created disclosure indices or ratings produced by external parties. The advantage of the researchers
constructed disclosure indices is ability to be applied a widely range of companies, compare to
external agency’ indices which are limited to companies covered by these external parties. On the
other hand, researcher-constructed index contains subjective opinion and explanation. Also the
external indices have several disadvantages. Firstly, they might be a time limitation. Secondly, the
external scores represent analysts’ understanding of disclosure quality rather than disclosure quality of
a company. On the contrary the advantage of this approach is the fact that it is constructed by primary
users of the disclosure information, moreover, they are experts in the investigated industry and
familiar with a company. In another words there is higher adequacy of external indices in terms of
specific companies or industries (Artiach and Clarkson, 2011). For example, Lopes and de Alencar
(2010) develop Brazilian Corporate Disclosure Index, which measure disclosure across several
dimensions: “… (1) general information about the firm; its market, and major events over the last
year; (2) relations to employees and managers regarding compensation and policies; (3) non-financial
information about markets, sales, and products; (4) information about forecasts of sales, cash flows,
and earnings; (5) discussion and analysis of financial data, including tie series information about
performance and explanations of past behaviour; and (6) other information”. In total there are 47
attributes, which were collected from annual reports, websites and other public sources. Earlier
Richardson and Welker (2001) also use disclosure rating as proxy for disclosure, which includes 20
categories from corporate annual reports. Baginski and Rakow (2012) use three dimensions to
determine the quality of voluntary disclosure represented by management earnings forecast: (1)
37
whether a company is “a supplier of at least one quarterly management earnings forecast over 16
quarters”; (2) forecast frequency of private information revelation; and (3) the precision of forecast.
The Table 2 summarizes implied measures of corporate disclosure in the selected studies on the
relation between corporate disclosure and CEC.
Disclosure intensity
Financial disclosures
(Segments, R&D, Capital Expenditures,
Accounting Policies, Subsidiaries
Governance disclosures
(Major Shareholders, Management,
Board, Director& officer remuneration,
Director and officer shareholding)
Accounting principles
(Consolidation, Dictionary Reserves)
Timeliness of disclosure
(Frequency of reporting, Consolidation
of interim reports, number of disclosed
items)
Credibility of disclosures
(% of audited by Big5)
Media channels:
Penetration
Components of corporate transparency by Bushman et al. (2004)
I. Corporate
Reporting
Communication channels:
1. Direct (reports):
Financial analysts
2. Indirect (trading):
Institutional investors
Inside trading
II. Private Information
Acquisition &
Communication
III. Information
Dissemination
Figure 4: Corporate transparency classification by Bushman et al. 2004
In the same way many studies have shown that both mandatory and voluntary disclosure decrease
the cost of equity capital by the means of information asymmetry reduction. Chen et al. (2010)
investigate the influence of mandatory disclosure on the cost of capital at the US market. In 2000 the
Securities and Exchange Commission’s Regulation Fair Disclosure (RFD) has become effective,
which “prohibits selective disclose of material information to a subset of market participants, such as
analysts and institutional investors, without simultaneously disclosing the same information to the
investing public”. The purpose of such mandatory disclosure is to increase investors’ confidence and
provide equal access to information. The findings show that there is a significant decline in the cost of
capital for medium and large companies in the post-RFD period; i.e. mandatory disclosure leads to
lower cost of equity capital. The latest research also indicates the negative relation between mandatory
38
disclosure and cost of equity capital. Based on the international evidence for the period between 1990
and 2004 Core et al. (2015) find that mandatory disclosure quality significantly decreases the cost of
equity capital. In addition they incorporate into model the inside ownership, which strengthens the
direct influence of disclosure.
Furthermore many studies are focused on the relation between voluntary disclosure policy and cost
of capital. Firstly, Botosan (1997) documents the negative association between the cost of equity
capital and voluntary disclosure level for firms with low analyst following, however finds no
association for firms with high analyst following. Later extended the previous study Botosan and
Plumlee (2002) examine influence of two types of disclosure: timely disclosure (including press
releases and newsletters) and annual report disclosure. They find that firm’s cost of equity capital
increases with timely disclosure and decreases at the annual report disclosure level. After Hail (2002)
also documents the negative and significant relation between voluntary disclosure and the ex-ante cost
of equity capital. In order to measure the voluntary disclosure level the author creates the disclosure
score DISC (the index based on the companies’ annual reports). The choice of criteria included in the
scorecard was based on financial analysts’ and investors’ requirements and needs.
Geitzmann and Trombetta (2003) investigate the influence of two communication channels
(accounting policy and voluntary disclosure strategy) on the cost of raising outside capital. Firms with
good prospects can adopt conservative accounting policy without voluntary disclosure. At the same
time firms adopted aggressive accounting policy even with voluntary disclosure may face higher cost
of capital then the first one. The influence of voluntary disclosure on the cost of capital depends on the
choice of accounting policy. Later Espinosa and Trombetta (2007) empirically prove the previous
theoretical suggestion of Geitzmann and Trombetta (2003) that companies may reduce the cost of
equity capital through two communication channels: the choice of a specific accounting policy and the
choice of the level of voluntary disclosure.
Another research (Geitzmann and Ireland, 2005) also shows the negative relation between the cost
of equity capital and the timely strategic disclosure (i.e. disclosure of strategic events). However the
significant influence of disclosure on the cost of capital is only for firms with aggressive accounting
choices. The listed companies have opportunity to disclose their information by the means of a
newswire service, which is a primary source of timely disclosure. Another study regarding the type of
information been disclosure is conducted by Kim and Shi (2011), who investigate the relation between
voluntary disclosure represented by management earnings forecasts and the cost of equity capital.
They find that disclosure forecasts with bad news significantly increase the costs of equity capital. At
the same time good news do not have influence on CEC, which can be explained by the fact that
investors might take good news as not credible information. Another study that analyzed earnings
forecast characteristics and their influence on the cost of equity by Rakow (2010) shows that
pessimistic forecasts, less specific forecasts or forecasts with loss lead to higher costs of capital. At
the same time forecasts with more information content or more timely forecasts are associated with
lower cost of equity capital. Later Baginski and Rakow (2012) find negative relation between the
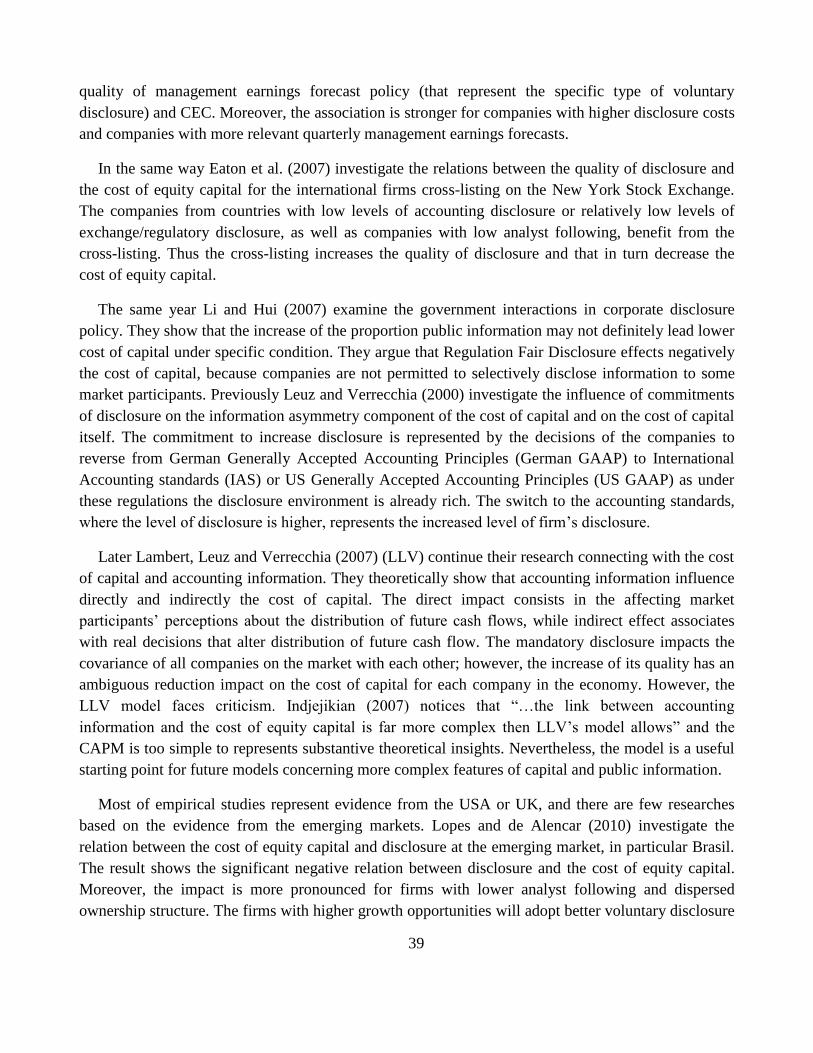
39
quality of management earnings forecast policy (that represent the specific type of voluntary
disclosure) and CEC. Moreover, the association is stronger for companies with higher disclosure costs
and companies with more relevant quarterly management earnings forecasts.
In the same way Eaton et al. (2007) investigate the relations between the quality of disclosure and
the cost of equity capital for the international firms cross-listing on the New York Stock Exchange.
The companies from countries with low levels of accounting disclosure or relatively low levels of
exchange/regulatory disclosure, as well as companies with low analyst following, benefit from the
cross-listing. Thus the cross-listing increases the quality of disclosure and that in turn decrease the
cost of equity capital.
The same year Li and Hui (2007) examine the government interactions in corporate disclosure
policy. They show that the increase of the proportion public information may not definitely lead lower
cost of capital under specific condition. They argue that Regulation Fair Disclosure effects negatively
the cost of capital, because companies are not permitted to selectively disclose information to some
market participants. Previously Leuz and Verrecchia (2000) investigate the influence of commitments
of disclosure on the information asymmetry component of the cost of capital and on the cost of capital
itself. The commitment to increase disclosure is represented by the decisions of the companies to
reverse from German Generally Accepted Accounting Principles (German GAAP) to International
Accounting standards (IAS) or US Generally Accepted Accounting Principles (US GAAP) as under
these regulations the disclosure environment is already rich. The switch to the accounting standards,
where the level of disclosure is higher, represents the increased level of firm’s disclosure.
Later Lambert, Leuz and Verrecchia (2007) (LLV) continue their research connecting with the cost
of capital and accounting information. They theoretically show that accounting information influence
directly and indirectly the cost of capital. The direct impact consists in the affecting market
participants’ perceptions about the distribution of future cash flows, while indirect effect associates
with real decisions that alter distribution of future cash flow. The mandatory disclosure impacts the
covariance of all companies on the market with each other; however, the increase of its quality has an
ambiguous reduction impact on the cost of capital for each company in the economy. However, the
LLV model faces criticism. Indjejikian (2007) notices that “…the link between accounting
information and the cost of equity capital is far more complex then LLV’s model allows” and the
CAPM is too simple to represents substantive theoretical insights. Nevertheless, the model is a useful
starting point for future models concerning more complex features of capital and public information.
Most of empirical studies represent evidence from the USA or UK, and there are few researches
based on the evidence from the emerging markets. Lopes and de Alencar (2010) investigate the
relation between the cost of equity capital and disclosure at the emerging market, in particular Brasil.
The result shows the significant negative relation between disclosure and the cost of equity capital.
Moreover, the impact is more pronounced for firms with lower analyst following and dispersed
ownership structure. The firms with higher growth opportunities will adopt better voluntary disclosure
40
even if they have weak governance and accounting regimes that in turn leads to lower cost of equity
capital.
Besides, some researches investigate disclosure more specifically. For instance, Barth et al. (2013)
analyze the relation between transparent earnings and lower cost of capital; they find that more
transparent earnings lead to lower cost of capital. The low transparency might push some investors to
private information acquisition. As a rule, such information about company’s economic value is costly
and investors would cover expenses by the means of higher required premium.
To conlcude the higher disclosure leads to more liquid markets that in turn reduces risks and
decreases the cost of equity capital.
Table 2: The corporate disclosure measurement in research
Authors Measure of disclosure Relation with CEC Region
Richardson
and Welker,
2001
Financial disclosure rating
based on annual reports
Negative relation between foinancal
disclosure and CEC for companies with
low analyst following
Canada
Lopes and de
Alencar, 2010
BCDI (Brasialian
Corporate Disclosure Index)
Negative relation between disclosure
index and CEC
Brasil
Kim and Shi,
2011 Managements earnings
forecasts (bad/*good news)
Negative relation with band news
forecast disclosure and CEC
No chnages for good news forecasts
discloures
USA
Baginski and
Rakow, 2012
Management earnings
forecast disclosure policy
(three dimention measure)
Negative realtion between the quality
of managemnt earnings foreact policy
and CEC
USA
Barth et al.
2013 Transparent earnings
Transparent earnings and cost of
capital have significant negative relation
USA
DeBoskey
and Gillett, 2013
Multi-dimensional corporate
transparency: public
disclosure information,
intermediary information,
earnings quality information,
insider information
Cost of equity, credit rating and beta
are significantly related with
intermediary information transparency
Cost of equity and beta are
significantly related with insider
information transparency
USA
Source: Author’s composition
3.2.5. Financial disclosure, accounting information and cost of equity capital reduction
Based on the literature review regarding the influence of accounting information, accounting
standards and corporate disclosure policy on the cost of equity capital (Appendix A), several
recommendations to decrease the cost of equity capital are generated:
41
Optimal information structure: the mix of private and public information with higher
share of public information.
The quantity of information: the quantity of information provided to the market has to
be enough to increase the investors’ confidence and decrease the information asymmetry.
The voluntary disclosure implementation.
The disclosure of strategic events implementation.
Application of timely disclosure represented by annual (or quarterly) reports with
announcement (news) reports by news services as Dow Jones News Retrieval Services or
R.N.S. of L.S.E.
Application of disclosure of forecast information and key non-financial statistics.
Usage of conservative accounting policy rather than aggressive.
Usage of ex ante accounting conservatism.
Usage of the high duality reporting system.
The switch to the International Accounting Standards.
Summing up, the companies can adjust the cost of equity capital by the means of influence of the
internal factors as the quality and quantity of accounting information, the accounting systems and
standards, the type of disclosure. The information environment influences the companies’ decision-
making process and has a direct influence on the cost of equity capital and its management by the
estimation risk and information asymmetry reduction. However, there are continuous debates between
proponents and opponents of greater discloser, because it is difficult to quantify and establish the
benefits of discloser.
3.3. Corporate governance and its elements
The relevant important factors influencing the cost of equity capital are corporate governance and
its elements. There are many components in corporate governance and all of them have different
influence on the cost of equity capital and consequently on the financial decisions. The analysis of
previous studies gives required knowledge about the influence of corporate governance on the cost of
capital for further research (Appendix A).
According to Morck and Steier (2005) the corporate governance framework can be classified into
four types in terms of so called capitalism, which represents “an economic system organized around
the production and allocation of capital”. The ways in which economies accumulate and allocate
capital vary in different countries and reflect in corporate governance types:
1. Shareholder capitalism. The individuals use to invest their savings directly in corporate stock
and bonds. The key condition is the investors’ confidence and trust. Thus the high quality of corporate
governance is critical in this type of framework. Hence the system is costly due to regular monitoring
the quality of corporate governance. In order to shift additional costs from investors, regulators
mandate the companies to disclose the corporate information as financial reports, insider share
42
holdings, management pay, and any other information that can cause the conflict of interest. The
examples of shareholder capitalism are USA and Great Britain.
2. Family capitalism. The wealthiest families control the largest companies in a country.
Investors prefer to entrust their saving to people with good reputation. Such situation occurs in
economy with weak investors’ legal rights. The main problem of such system is concentration of
corporate governance in the hands of a few families, which management can be excessively
conservative or protective of the status quo, which might lead to retention of week shareholders’
rights. The examples of family capitalism are Argentina, Mexico, and Greece.
3. Bank capitalism. Alternatively investors might save by the means of banking system. In turn
banks and financial institutions lend the money to companies or directly invest in stocks and bonds. In
this case banks monitor the corporate governance of companies and intervene if any mistakes take
place. As long as banking system is competent the allocation of capital goes on effectively; however,
if banks are misgoverned then the financial problems will arise in the whole system, which might lead
to financial instability. The main examples of bank capitalism are Germany, Japan and Korea.
4. State capitalism. On the contrary investors can save by the means of paying taxes to the
government. In this case a state provides capital to companies. The public officials supervise
corporate managers and correct the governance mistakes. The problems can emerge if officials behave
inefficient or in a favour of some individuals or groups of people. Historically such system was
applied by Fascist governments as Germany, Italy and Japan or Canada, Japan and India to support
industrial growth.
The Organisation for Economic Co-operation and Development (OECD) in its Principles of
Corporate Governance Report to G20 finance ministers and central bank governors (OECD, 2015)
determines the key principles of corporate governance framework, namely as (1) promotion of
transparency and fair markets, and efficient resources allocation; (2) consistency with the rule of law;
(3) promotion of effective supervision and enforcement.
However, there is no unique precise definition of corporate governance. According to Claessens
and Yortoglu (2013) the conception of corporate governance can be divided into two types. The first
type of definition uncovers the behavioral patterns of this term: behavior of a company in terms of
efficiency, performance, financial structure, growth, treatment of shareholders and stakeholders. From
this perspective corporate governance can be define as “the complex set of constrains that determine
the quasi-rents (profits) generated by the firm in the course of relationship with stakeholders and
shape the ex post bargaining over them”. The second type unfolds the normative framework of the
term: legal and judicial system, financial and labor markets regulations. On this view the corporate
governance can be defined based on the functional approach. The corporate governance can be
characterized as the selection of institutions and policies that are involved in the following functions
related to companies: (1) pooling resources and subdividing sharers; (2) transferring resources across
time and space; (3) risk management; (4) generating and providing information; (5) dealing with
stimulating problems; and (6) resolving competing claims on the funds generated by the companies.
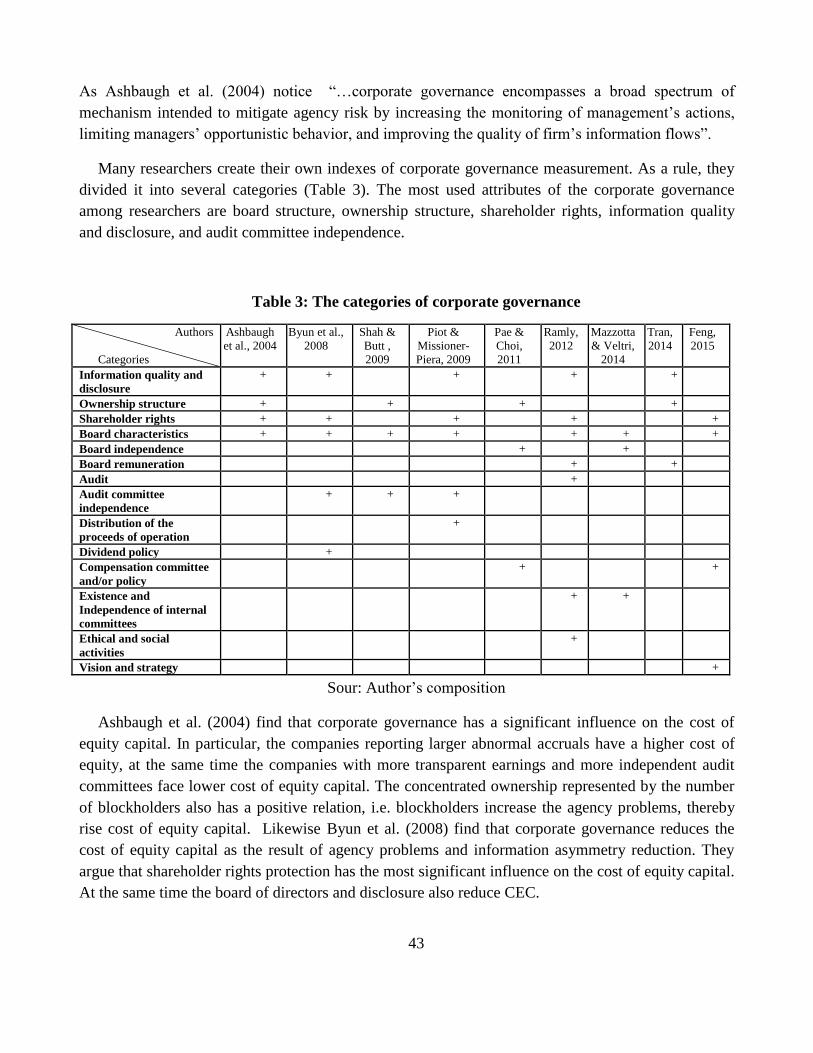
43
As Ashbaugh et al. (2004) notice “…corporate governance encompasses a broad spectrum of
mechanism intended to mitigate agency risk by increasing the monitoring of management’s actions,
limiting managers’ opportunistic behavior, and improving the quality of firm’s information flows”.
Many researchers create their own indexes of corporate governance measurement. As a rule, they
divided it into several categories (Table 3). The most used attributes of the corporate governance
among researchers are board structure, ownership structure, shareholder rights, information quality
and disclosure, and audit committee independence.
Table 3: The categories of corporate governance
Authors
Categories
Ashbaugh
et al., 2004
Byun et al.,
2008
Shah &
Butt ,
2009
Piot &
Missioner-
Piera, 2009
Pae &
Choi,
2011
Ramly,
2012
Mazzotta
& Veltri,
2014
Tran,
2014
Feng,
2015
Information quality and
disclosure
+ + + + +
Ownership structure + + + +
Shareholder rights + + + + +
Board characteristics + + + + + + +
Board independence + +
Board remuneration + +
Audit +
Audit committee
independence
+ + +
Distribution of the
proceeds of operation
+
Dividend policy +
Compensation committee
and/or policy
+ +
Existence and
Independence of internal
committees
+ +
Ethical and social
activities
+
Vision and strategy +
Sour: Author’s composition
Ashbaugh et al. (2004) find that corporate governance has a significant influence on the cost of
equity capital. In particular, the companies reporting larger abnormal accruals have a higher cost of
equity, at the same time the companies with more transparent earnings and more independent audit
committees face lower cost of equity capital. The concentrated ownership represented by the number
of blockholders also has a positive relation, i.e. blockholders increase the agency problems, thereby
rise cost of equity capital. Likewise Byun et al. (2008) find that corporate governance reduces the
cost of equity capital as the result of agency problems and information asymmetry reduction. They
argue that shareholder rights protection has the most significant influence on the cost of equity capital.
At the same time the board of directors and disclosure also reduce CEC.
44
The quality of corporate governance plays significant role in degree of the effect on the cost of
equity capital. Shah and Butt (2009) investigate the influence of the quality of corporate governance
on the expected cost of equity capital. They use the Corporate Governance Score as a measure for the
corporate governance quality. The research based on the Pakistan listed non-financial companies
shows that board size is negatively related to the cost of equity capital, i.e. the larger board lead to
lower cost of equity. In addition, managerial ownership has negative influence on the cost of equity,
i.e. a higher number of shares held by board members leads to the higher cost of equity capital. What
is more, the board independence and audit committee independence have a positive and insignificant
influence on the cost of equity capital. Thus, the companies with stronger corporate governance face
lower cost of equity capital. Similarly Ramly (2012) indicates the quality of corporate governance
based on the six categories as board structure and procedures, board compensation practices,
shareholder rights and relations, accountability and audit, transparency and social and environment
(139 items in total). The higher quality of corporate governance leads to lower cost of equity capital
for Malaysian listed companies. However, the significance of separate categories impact varies. The
board structure and procedure, shareholder rights and relations, and accountability and audit
characteristics are significant in explaining the level of CEC. At the same time the influence of board
compensation practices, transparency and ethic and social activities is not significant. Later Mazzotta
and Veltri (2014) apply more specific corporate governance index to indicate the influence of
corporate governance on the cost of equity capital for companies listed on the Italian stock exchange.
This index includes four dimensions of board characteristics: board independence, board size,
existence of internal board committees and independence of board committees. Pae and Choi (2011)
investigate the influence of comprehensive corporate governance on a value premium. They find that
the stronger corporate governance leads to the lower cost of equity capital. What is more, the lower
capital is for companies with stronger commitment to business ethics. However, the beneficial effect
of corporate governance on the cost of equity capital is stronger for companies with weaker
commitment to business ethics. In the case of local evidence Tran (2014) analyzes the relation
between cost of equity capital of German listed companies and corporate governance represented by
financial information quality, ownership structure and board remuneration. The findings show that
higher financial transparency and bonus compensations lead to lower cost of capital. Moreover, block
ownership is negatively associated with CEC, when block holders are other companies, managers or
founding-family members.
As was mentioned before the elements of corporate governance in themselves influence the cost of
equity capital. And one of the most fundamental components of corporate governance is shareholder
rights.
45
3.3.1. Shareholder rights
The corporate governance framework facilitates and protects the shareholder rights and ensures the
equality of all shareholders. According to OECF Principles of corporate governance (OECD, 2015)
the basic shareholder rights should include:
rights to secure methods of ownership registration;
rights to convey or transfer of shares;
rights to obtain relevant and material information on a company on a timely and
regular basis;
rights to participate and vote in general shareholder meetings;
rights to elect and remove members of the board;
rights to share in the profits of a company.
Many researchers find that stronger shareholder rights decrease the cost of equity capital (Gompers
et al, 2003; as Cheng and Collins, 2006; Huang and Zhang, 2009; Chen et al., 2011(a)). Earlier
Gompers et al. (2003) investigate the relationship between shareholder rights and corporate
performance in the 1990s. They find that companies with stronger shareholder rights have higher firm
value, higher profits, higher sales growth, lower capital expenditures, and make fewer corporate
acquisitions. Accordingly to Gompers et al. (2003) the shareholder rights can be divided into five sub-
indices: (1) tactics for delaying hostile bidders; (2) voting rights; (3) director/officer protection; (4)
other takeover defenses; and (5) state law. Huang and Wu (2010) analyze 24 shareholder rights
provisions (identified by Gompers et al., 2003) and their influence on the cost of equity capital. They
argue that shareholder rights provisions have different weights in influencing the cost of equity capital
and company’s value. More specifically the poison pill3 and golden parachute provisions
4
significantly increase the CEC. At the same time some restrictions on shareholder rights as the
presence of fair price provision decrease the cost of equity capital. Chen et al (2011(a)) also adopt
Gompers’ Governance Index to estimate the relation between shareholder rights and the ex-ante cost
of equity capital. They find that antitakeover provisions are significantly positively related to the cost
of equity capital. The results show that the stronger shareholder rights lead to lower cost of equity
capital. Besides, the influence is more significant for companies with more severe agency problems
from Financial Cash Flows. Along with shareholder rights the investors’ relation is a significant part
of corporate governance. There is empirical evidence that stronger investors’ relation leads to lower
cost of capital. Based on Japanese companies Ly (2010) finds negative link between two variables via
information asymmetry component of cost of capital.
On the contrary to the strong shareholder rights there is management entrenchment that can be a
result of restrictions on shareholder rights adopted by companies. Collins and Huang (2011) analyze
3 the defensive strategy designed to resist a hostile takeover
4 contractual benefits for the high-level employees that guarantee payment in the case of company’s take over and
following dismissal
46
the influence of management entrenchment on the cost of equity capital and find significant positive
relation between two variables. In order to measure the degree of entrenchment the authors apply six
factor index constructed by Bebchuk et al. (2009), which includes staggered boards, supermajority
requirements for mergers, limits on amending bylaws, limits on amending charters, poison pills, and
golden parachute. The first four provisions limit shareholders’ voting power that consequently results
in more intense management entrenchment.
Firstly, strong shareholder regimes reduce agency risks. Ability of investors to monitor and
discipline managers decreases potential agency costs that in turn decrease the cost of equity capital.
So stronger shareholder rights lead to lower estimation risk and lower agency risk and consequently to
lower cost of equity capital. However a company with weaker shareholder rights but higher
transparent disclosure policy has the similar cost of equity capital as a company with stronger
shareholder rights but lower disclosure. These factors have so strong relation because they are part of
corporate governance.
3.3.2. Board characteristics and ownership structure
Board effectiveness and its characteristics play a great role in the conflict of interests between
managers and investors and other stakeholders that in turn influence the information asymmetry,
agency and information risks and at least the cost of financing.
The previous studies suggest that board size has a significant impact on the ability of directors to
monitor and control managers, thus influence the information asymmetry. Several researches show
that board size influences the cost of debt financing. Anderson et al. (2004) argue that additional
member is associated with lower cost of debt. At the same time Lorca et al. (2010) also finds the
relation between cost of debt financing and board size. However, Piot and Missioner-Piera (2007) fail
to document the influence of board size on borrowing costs. The difference in results can be explained
by diversity of the external environment of the investigated companies, for example in Spain
companies rely mostly on bank loans, while in the USA companies raise their funds heavily through
public capital and debt markets (Lorca et al., 2010). In addition, some researches (Yermack, 1996;
Vafeas, 2000) show that small boards are more effective. Large boards have less effective
coordination, higher information costs and disorderly decision-making. What is more, companies with
small board size have higher market values and greater return-earnings relations. Mazzotta and Veltri
(2014) also argue that larger board is less efficient; moreover, there is a negative relation between
board size and the quality of corporate governance that in turn has influence on the cost of equity
capital.
Many economists (Weisbach, 1998; MacAvoy and Millstein, 1999) examine board independence.
They found that outside board increases corporate governance, leads to higher returns and better
market reaction and decreases the likelihood of fraudulent financial reporting, that in turn increases
47
quality of information. Moreover, the creditors consider board independence as one of the significant
factors that influence the company’s management and decrease their risks that in turn leads to lower
cost of capital. Anderson et al. (2004), Piot and Missioner–Piera (2007) and Lorca et al. (2010)
empirically present that board independence decrease cost of debt financing. Bhojraj and Sengupta
(2003) investigate the proportion of outsiders in the board and find the significant negative relation
with bond yields and ratings. Moreover, the board independence is analyzed by Mazzotta and Veltri
(2014) as a part of corporate governance. They use two proxies to measure independence: (1) the
number of non-executive and independent directors in the board; and (2) their proportion in the board.
The increased board independence leads to higher quality of corporate governance that in turn reduces
the cost of equity capital.
Despite the fact that in some countries there are regulations forcing companies to include financial
experts to the board of director. Some authors argue that there is no association between board
expertise and the cost of debt financing (Lorca et al. 2010). However Ashbaugh-Skaife et al. (2006)
find the positive relation between credit ratings and board expertise that in turn can lead to lower cost
of capital.
There is another board characteristic as board activity or the directors’ monitoring effort
represented by the number of board meetings (Adams, 2003; Lara et al, 2009) , which can decrease
the agency and information risks. However, Lorca et al. (2010) fail to document the relation between
board activity and cost of debt.
On the other hand ownership structure as one of the main attributes of corporate governance also
has a significant influence on the cost of capital (Ashbaugh et al., 2004; Shah and Butt, 2009; Pae and
Choi, 2011). Previously Bhojraj and Sengupta (2003) find the negative association between bond
yields and institutional ownership. Guedhami and Mishra (2009) investigate the influence of the
separation between ownership and control rights on the cost of equity capital. The ultimate ownership
structures (in another words excess control) “induce significant agency problems between controlling
owners and minority shareholders”. Their findings show that there is a positive significant relation
between excess control and cost of equity capital in nine East Asian and thirteen Western European
countries.
3.3.3. Audit committee and audit quality
The existence of internal committees also can increase the quality of corporate governance and
result in lower cost of equity capital. There can be several committees as the auditing committee, the
remuneration committee and the nomination committee (Mazzotta and Veltri, 2014). The board of
directors might delegate some functions to these committees. The nomination committee should
identify the optimal board composition and recommend the potential members, who can increase the
functionality and effectiveness of the board. The remuneration committee set the remuneration for all
48
top management, including pension rights and compensation payments; such setting should support
the strategic goals of a company. However the adequate performance of the internal committees
depends on their independence. In other words, the greater committee independence leads to better
corporate governance and that in turn influence the cost of equity capital.
Audit committee plays a big role in effectiveness of corporate governance because it provides
relevant and credible information to the investors. The existence of audit increases the quality of
information that in turn leads to the lower cost of equity capital. However, for better effectiveness
board committees should be independent. The audit committee provides the confidence of
stakeholders in the credibility of a company’s financial statements. Many researchers as Anderson et
al. (2004); Ashbaugh et al. (2004); Byun et al. (2008); Shah and Butt (2009) find the significant
influence of audit committee independence on the cost of capital. In terms of audit committee
effectiveness Hope et al. (2008) investigate the influence of excess auditor remuneration on the cost of
equity capital represented by the implied required rate of return (IRR). The excess auditor
remuneration positively influences IRR through the information risk effect. They argue that auditors
with high remuneration may have tight relations with a company that in turn decreases independence
of perception, investors’ confidence, increases information risk, and as a result raises the cost of
equity capital. What is more, they find that the relation is more significant for countries with stronger
investor protection environment.
As the audit improves information about the corporate performance thus it reduces the information
asymmetry between a company and investors, which in turn decreases the information risk and as a
result leads to lower cost of equity capital. In other words higher audit quality has greater effect on
the information risk. For example, in China Chen et al. (2011b) find that high-quality auditors lead to
significantly reduction in the cost of equity capital among non-state-owned enterprises. Another
research also shows the pronounced influence of audit quality on the cost of equity. Fernando et al.
(2010) find the negative relation between auditor size, auditor industry specialization and auditor
tenure with cost of equity capital. However the evidence indicates that the impact is referred to small
companies due to the low level of information environment.
3.3.4. The corporate governance and cost of equity capital minimization
Summing up the strong corporate governance and its attributes reduce the cost of equity capital by
decreasing the agency problems and information asymmetry. The conducted analysis of previous
studies contributes towards the following recommendations for the cost of capital minimization,
which companies may adopt in their financial strategies:
board independence improvement, i.e. increase the number of independent directors with
optimal level more than 50%;
board size adjustment;
fully independent audit committee;
49
the size of audit committee has to be about 4 – 5 members on average;
auditors’ compensation adjustment;
increase of investors’ protection;
shareholder rights improvement
Strong corporate governance provides effective financial decisions connecting with the cost of
capital and solves information asymmetry problems reducing moral hazard at the same time. Those
problems can be arisen because of low quality of management and imperfection of information on the
market about the real company’s value. In addition, strong corporate governance includes positive
abnormal returns, higher firms value, higher profits, higher sales growth, fewer corporate acquisitions
and lower capital expenditures.
3.4. Social factors as non-financial determinants
The social factors represent a new direction in evaluation of the cost of equity capital. At the
present time the sociology and psychology have become more integrated into economics as a science.
Scientists start to investigate the influence of social factors on the corporate performance as well as
cost of equity capital. One of these factors is social disclosure or social responsibility, which closely
interconnect with corporate disclosure in general. Richardson and Welker (2001) find that social
disclosure positively and significantly influence the costs of equity capital. The social disclosure is
measure by rating that includes 10 categories of information from corporate annual reports: human
resources; products; services, and consumers; community; environment; energy resources;
governments; suppliers; shareholders; competitors; miscellaneous.
In recent years interest to corporate social responsibility (CSR) has been increased: investors pay
attention to social activities of the companies and economists and researchers support companies in
social polices improvement. For instance, Ghoul et al. (2011) argue that corporate social
responsibility represented by investment in improving responsible employee relations, environmental
policies, and product strategies reduces cost of equity capital. In global terms the influence of social
responsibility on the cost of equity capital is investigated by Dhaliwal et al. (2015). Their results show
a negative relation between CSR disclosure and the cost of equity capital, moreover the association is
stronger in stakeholder-oriented countries. In addition there is evidence that financial and CSR
disclosures can be substitutes in reducing the CEC.
Later Feng et al. (2015) also analyze the relation between corporate social responsibility and cost
of equity capital based on the international evidence. They find that CSR is significantly associated
with lower cost of equity capital in North America and Europe. However in Asian countries the
relation is positive. The Commission of the European Community defines CSR as “a concept whereby
companies integrate social and environmental concerns in their business operations and in their
interaction with their stakeholders on a voluntary basis”. The CSR index consists of four dimensions:
50
environment performance, social performance, economic performance and corporate governance
performance. The findings show that in North America economic performance (that includes
profitability, long-term growth and cost) has more significant impact on the CEC. At the same time in
European countries greater environment protection, social performance or performance management
will lead to lower cost of equity capital. On the other hand in Asia corporate governance, environment
and social performance are significantly positively related to CEC, i.e. stronger social responsibility
leads to higher cost of equity capital.
The social and environment responsibility can be referred to sustainability as a new popular
concept. According to Feng et al. (2015) social performance consists of employment quality, health
and safety, training and development, diversity, human rights, community, product responsibility. Ng
and Rezaee (2015) investigate the relation between CEC and business sustainability, as well as
environmental, social and governance performance. The findings prove that economic sustainability
disclosure negatively influences the CEC; moreover, growth and research factors contribute in this
relation. In addition, the non-financial dimensions of sustainability as environmental and governance
performance reduce cost of equity capital. However social sustainability performance is not
significantly related to CEC.
Environmental performance as a part of social responsibility might include resource reduction,
emission reduction and product innovation (Feng et al., 2015). Sharfman and Fernando (2008)
analyze the environmental performance and its influence on the cost of equity capital. The higher
level of environmental risk management make a company more legitimate and increase investors’
confidence that in turn leads to lower cost of equity capital. The environmental risk management is
measured by quantitative measures as Toxic Release Inventory (TRI) data (data about the use,
emission and disposal of ca. 600 toxic elements) and qualitative measures (based on the Kinder,
Lydenberg, Domini & Co, Inc. or KLD social performance score). The findings show that stronger
environmental risk management reduced cost of equity capital.
In the same way corporate ethic or ethical commitment has become one of the important non-
financial factors influencing corporate performance, including cost of equity capital. The degree of
corporate ethic can be measured by index. For example, Choi and Jung (2009) combines corporate
ethical commitment index based on the self-administrated anonymous questionnaires, which includes
implicit dimensions of ethical commitment (top management support, corporate culture, ethical
leadership, open communication channels and ethical training) and explicit dimensions (codes of
ethics, ethics hotlines, ethics officers and ethics committees). Later based on corporate ethical
commitment index Choi (2012) investigates the influence of corporate ethics on the cost of equity
capital and finds significantly negative relation between two variables for companies listed on the
Korean stock market.
Extending the comprehension of non-financial performance the marketing and advertisement might
influence the corporate financial performance through earnings growth and expected cash flow
51
increase. For instance Singh et al. (2005) analyze the influence of product market advertising on the
cost of capital, including cost of equity capital. The study shows the negative relation between
advertising expenses and CEC for U.S. companies. Marketing expenses (among them advertisement)
are aimed to create customer loyalty, promote a brand, generate higher margins and increase revenue.
Moreover, the advertisement might improve a shareholder value. The increased visibility among
customers and investors will lead to higher liquidity and the spread of the stocks on the market.
Another research on the relation between non-financial performance and the cost of capital is
conducted by Himme and Fischer (2014). They investigate the influence of customer satisfaction,
brand value and corporate performance on the cost of capital, including cost of equity capital. The
findings show that only higher satisfaction ratings decrease cost of equity capital. Customer
satisfaction plays a significant information role as it reflects customers’ experience in the past and
assumes customers’ willing to come back or recommend a company that in turn might lead to
earnings increase and the higher future cash flows. In another words the customer satisfaction
provides information about customers’ willingness to pay thus expected earnings. At the same time,
authors do not find strong evidence on the relation between brand value and corporate reputation and
the cost of equity capital.
Summing up, the non-financial performance as social factors significantly influences the cost of
equity capital. Moreover, the improvement of such factors as social disclosure and social
responsibility, employee relations, product strategies, environmental performance, environmental risk
management will lead to lower cost of equity capital.
The overview of literature on the theme of internal factors and their influence on the cost of equity
capital is represented in Appendix A.

52
Chapter 4 Financial stability of a country as a combination of external factors
The attention to the financial stability issue has increased because of several reasons. First of all,
the last few decades were marked by series of financial stability episodes. Moreover, not only their
frequency was notable, but also the speed of their expansion. The government and central banks focus
on the increased potential costs of financial crises, as well as its prevention and resolution. Another
reason of greater concern about financial stability is growth in the volume of financial transactions
and extended complexity of new financial instruments.
Due to contagion effects and consequences of modified crises the costs of financial instability can
be very high; it can lead to series of bankruptcy, lost output, misallocation of resources, high
unemployment, and even decrease of living standards. Moreover, as a matter of fact the financial
stability influences the cost of equity capital as a key element of financial decision process of a
company.
4.1. Financial stability: the way to define
During the last few years the global financial crisis and debt crisis hit the financial stability of
many countries and show its importance and influence on the different spheres. Governments, central
banks and academics try to determine the notion of financial stability, its features and measures, in
order to adjust it and predict future events of imbalance.
In spite of the fact that financial stability is one of the most significant elements of effective
operation of a country as a system towards sustainable economic growth, there is no generally
accepted definition of financial stability. Many authors try to define it through the opposite term as
financial instability. For example, Mishkin (1991) argues that financial instability occurs when shocks
affecting the financial system stop the information flow that in turn lead to the non-optimal allowance
between savings and investment in economy. Crockett (1997) defines financial instability as a
situation, when fluctuations in the financial assets prices influence the economics performance.
Ferguson (2002) also tries to define instability as a situation, when negative external factors of the
market negatively influence the real economy. According to the Ferguson (2002) financial instability
is a situation, when some important set of financial asset prices seem to have diverged sharply from
fundamentals; market functioning and credit availability, domestically and perhaps internationally,
have been significantly distorted; and aggregate spending deviates significantly, either above or
below, from the economy’s ability to produce. Later Balakrishnan et al. (2009) describe financial
distress, as “a period when the financial system is under strain and its ability to intermediate is
impaired”.
53
Thus, according to the literature research several features characterize financial instability of a
country:
systematic risk and system-wide consequences;
Domino and Knock-on effects;
lack of robustness to shocks;
high volatility of main economic and financial indicators;
high volatility of financial asset prices;
lack of credit availability;
increased aggregate spending deviation;
non-optimal allocation of saving and investment
However, some authors determine the financial stability directly. For example, Udaibir et al.
(2010) set financial stability as “a stability of financial markets, reflected in a low level of volatility of
a number of economic and financial indicators”. The financial stability of a country represents the
efficient allocation of assets in real economy, the optimal price and risk management at the macro
level, ability of a system to accommodate the lenders and borrows according their needs, and ability to
predict or at least deal with economic imbalance and shocks (Shinasi, 2004; Houben et al., 2005;
Acharya et al., 2012). Moreover, it should robust in the face of a reasonable wide range of adverse
circumstances, i.e. efficiently provide sufficient financial services under significant stress (Freedman
and Goodlet, 2007).
The studies on the theme of financial stability can be divided into two groups (Sipko, 2010). The
first group is focused on the external shocks and their impact on the financial stability (for example,
Allen and Wood, 2006). The second approach takes into consideration shocks caused by financial
system (Schinashi, 2004). In other words, there are external and internal factors that shake the
financial stability of a country.
Allen and Wood (2006) sort out following features that should be incorporated in a determination
of financial stability: (1) substantial welfare costs; (2) observable state of affairs; (3) property of a
clearly defined politically significant entity, i.e. the property of a nation state; (4) probability of
collapse not only of financial institutions, but also non-financial companies and sovereign nations; (5)
avoid so called rigor mortis5.
5 The financial stability should not prevent any changes as evidence of instability: rigor is fine, but not rigor mortis
(Allen and Wood, 2006).
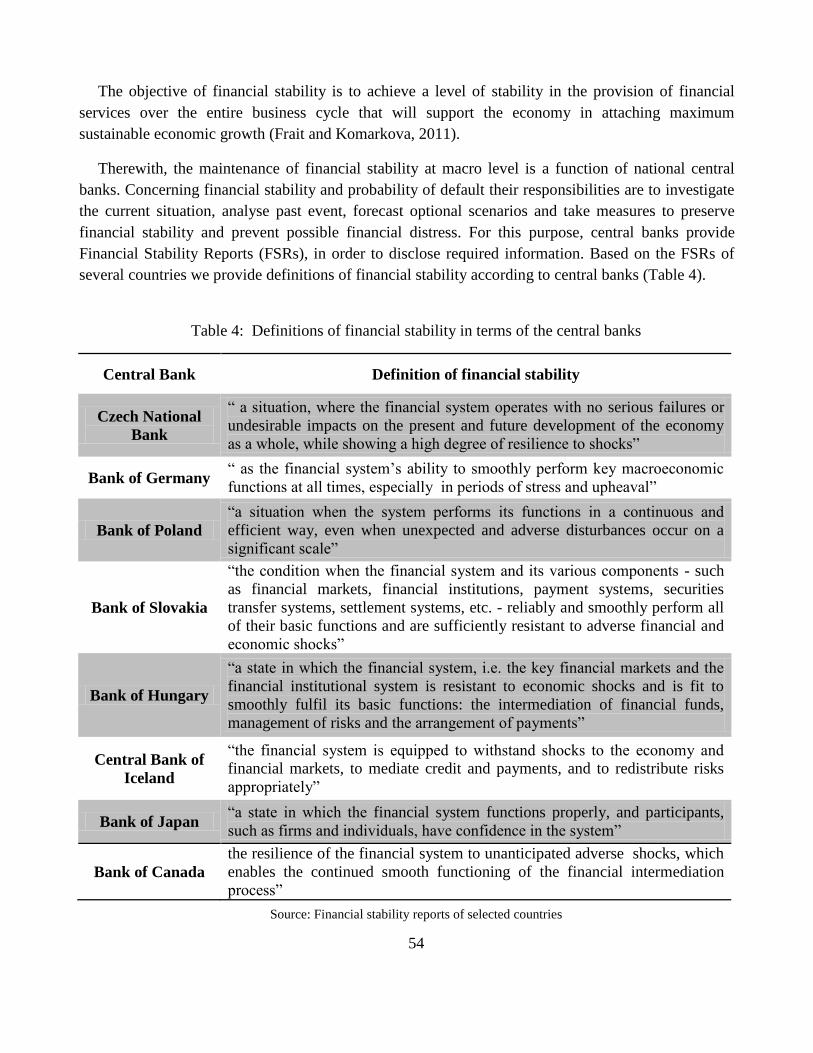
54
The objective of financial stability is to achieve a level of stability in the provision of financial
services over the entire business cycle that will support the economy in attaching maximum
sustainable economic growth (Frait and Komarkova, 2011).
Therewith, the maintenance of financial stability at macro level is a function of national central
banks. Concerning financial stability and probability of default their responsibilities are to investigate
the current situation, analyse past event, forecast optional scenarios and take measures to preserve
financial stability and prevent possible financial distress. For this purpose, central banks provide
Financial Stability Reports (FSRs), in order to disclose required information. Based on the FSRs of
several countries we provide definitions of financial stability according to central banks (Table 4).
Table 4: Definitions of financial stability in terms of the central banks
Central Bank Definition of financial stability
Czech National
Bank
“ a situation, where the financial system operates with no serious failures or
undesirable impacts on the present and future development of the economy
as a whole, while showing a high degree of resilience to shocks”
Bank of Germany “ as the financial system’s ability to smoothly perform key macroeconomic
functions at all times, especially in periods of stress and upheaval”
Bank of Poland
“a situation when the system performs its functions in a continuous and
efficient way, even when unexpected and adverse disturbances occur on a
significant scale”
Bank of Slovakia
“the condition when the financial system and its various components - such
as financial markets, financial institutions, payment systems, securities
transfer systems, settlement systems, etc. - reliably and smoothly perform all
of their basic functions and are sufficiently resistant to adverse financial and
economic shocks”
Bank of Hungary
“a state in which the financial system, i.e. the key financial markets and the
financial institutional system is resistant to economic shocks and is fit to
smoothly fulfil its basic functions: the intermediation of financial funds,
management of risks and the arrangement of payments”
Central Bank of
Iceland
“the financial system is equipped to withstand shocks to the economy and
financial markets, to mediate credit and payments, and to redistribute risks
appropriately”
Bank of Japan “a state in which the financial system functions properly, and participants,
such as firms and individuals, have confidence in the system”
Bank of Canada
the resilience of the financial system to unanticipated adverse shocks, which
enables the continued smooth functioning of the financial intermediation
process”
Source: Financial stability reports of selected countries
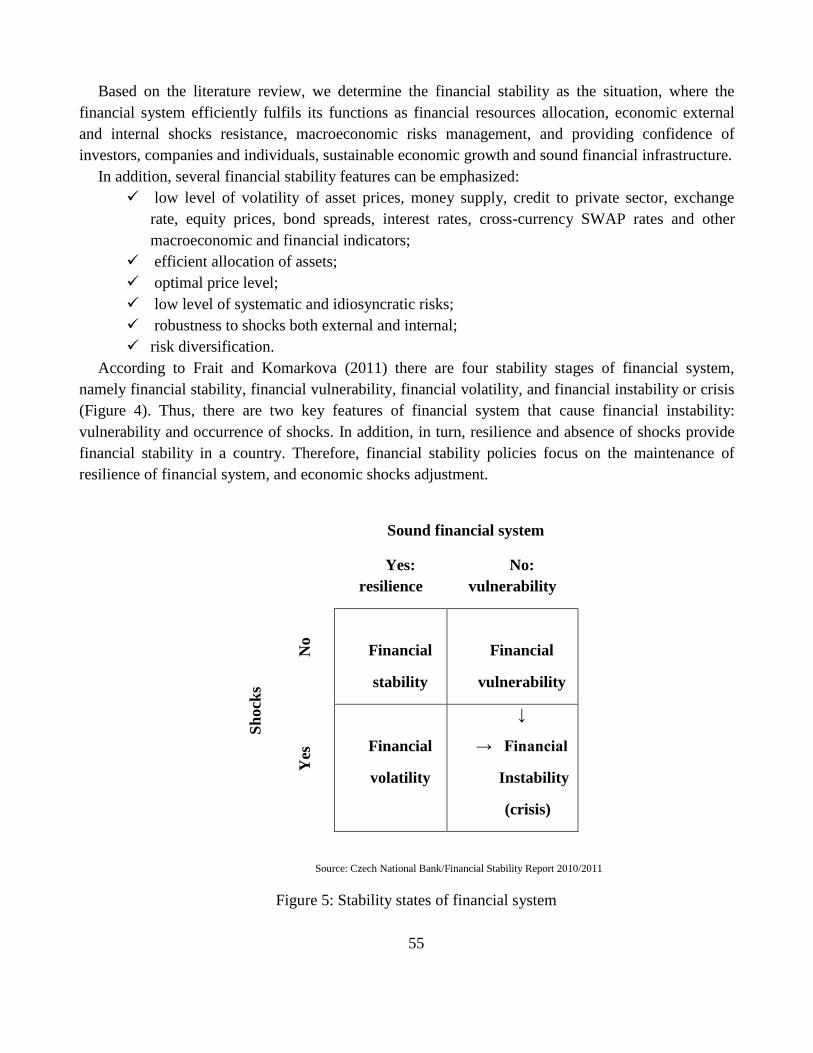
55
Based on the literature review, we determine the financial stability as the situation, where the
financial system efficiently fulfils its functions as financial resources allocation, economic external
and internal shocks resistance, macroeconomic risks management, and providing confidence of
investors, companies and individuals, sustainable economic growth and sound financial infrastructure.
In addition, several financial stability features can be emphasized:
low level of volatility of asset prices, money supply, credit to private sector, exchange
rate, equity prices, bond spreads, interest rates, cross-currency SWAP rates and other
macroeconomic and financial indicators;
efficient allocation of assets;
optimal price level;
low level of systematic and idiosyncratic risks;
robustness to shocks both external and internal;
risk diversification.
According to Frait and Komarkova (2011) there are four stability stages of financial system,
namely financial stability, financial vulnerability, financial volatility, and financial instability or crisis
(Figure 4). Thus, there are two key features of financial system that cause financial instability:
vulnerability and occurrence of shocks. In addition, in turn, resilience and absence of shocks provide
financial stability in a country. Therefore, financial stability policies focus on the maintenance of
resilience of financial system, and economic shocks adjustment.
Sound financial system
Yes:
resilience
No:
vulnerability
Sh
ock
s
No
Financial
stability
Financial
vulnerability
Yes
Financial
volatility
↓
→ Financial
Instability
(crisis)
Source: Czech National Bank/Financial Stability Report 2010/2011
Figure 5: Stability states of financial system
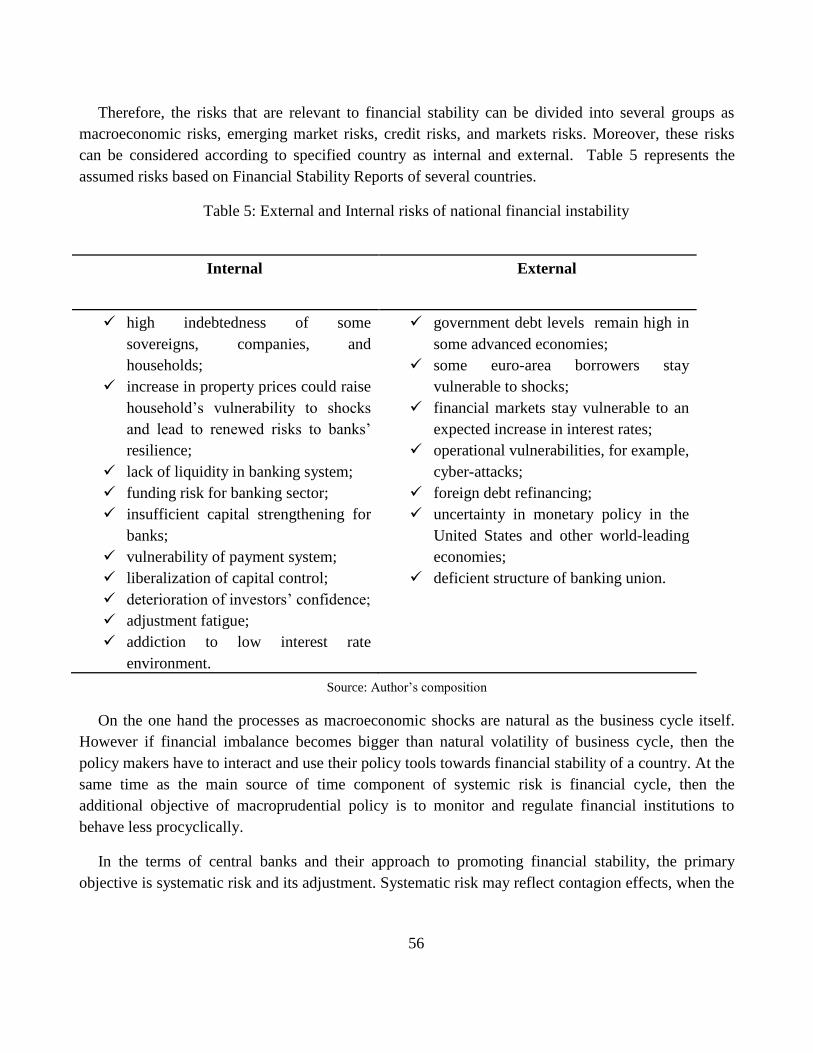
56
Therefore, the risks that are relevant to financial stability can be divided into several groups as
macroeconomic risks, emerging market risks, credit risks, and markets risks. Moreover, these risks
can be considered according to specified country as internal and external. Table 5 represents the
assumed risks based on Financial Stability Reports of several countries.
Table 5: External and Internal risks of national financial instability
Internal External
high indebtedness of some
sovereigns, companies, and
households;
increase in property prices could raise
household’s vulnerability to shocks
and lead to renewed risks to banks’
resilience;
lack of liquidity in banking system;
funding risk for banking sector;
insufficient capital strengthening for
banks;
vulnerability of payment system;
liberalization of capital control;
deterioration of investors’ confidence;
adjustment fatigue;
addiction to low interest rate
environment.
government debt levels remain high in
some advanced economies;
some euro-area borrowers stay
vulnerable to shocks;
financial markets stay vulnerable to an
expected increase in interest rates;
operational vulnerabilities, for example,
cyber-attacks;
foreign debt refinancing;
uncertainty in monetary policy in the
United States and other world-leading
economies;
deficient structure of banking union.
Source: Author’s composition
On the one hand the processes as macroeconomic shocks are natural as the business cycle itself.
However if financial imbalance becomes bigger than natural volatility of business cycle, then the
policy makers have to interact and use their policy tools towards financial stability of a country. At the
same time as the main source of time component of systemic risk is financial cycle, then the
additional objective of macroprudential policy is to monitor and regulate financial institutions to
behave less procyclically.
In the terms of central banks and their approach to promoting financial stability, the primary
objective is systematic risk and its adjustment. Systematic risk may reflect contagion effects, when the
57
failure of one financial institution lead to others bankruptcy, or when the financial markets
participants have familiar exposure to a single risk factor (Frait and Komarkova, 2011).
4.2. Central banks on the financial stability issue
A central bank or monetary authority is an institution that has as a function to manage national
currency, money supply and interest rates. In addition, it has supervisory power to control banking
system by setting requirements, in order to mitigate potential risks.
Another substantial function of central banks is a potential source of emergency liquidity provided
to markets through open market operations or to financial institutions through discount window
lending or as a lender of last resort. Thus, central banks have to monitor the current situation and
predict potential events of instability, in order to respond immediately and supply the lack of liquidity
in the system. At the time of financial instability or even crisis they use appropriate tools to ease
liquidity pressure and raise public confidence.
Along with macro objectives as price stability and satisfactory economic performance central
banks define financial stability as a significant objective. The financial imbalance may occur even at
times of price stability and when output is close to potential level. Therefore, central banks should
concentrate on both goals and be prepared to the different scenarios.
The main objectives of central banks according to financial stability could be:
indicating, monitoring and reducing systematic risks that can damage the financial
system of a country;
monitoring and preventing moral hazard, i.e. to promote markets that are fair;
monitor interactions between financial institutions and their environment;
banking system supervision, in order to predict its failure;
providing liquidity to the banking system;
ex-ante and ex-post analysing of financial stability; further preparing and publishing of
financial stability reports;
regulation of credit and currency in the best interest of the economic situation in a
country;
promotion the economic and financial welfare of a country;
maintaining price stability along with economic growth and employment.
58
Bauducco et al. (2011) argue that effective central bank would apply monetary easing during a
short-lived financial instability shock, in order to limit the short-term decrease in output and
consumption and quickly return to the normal trend.
The central bank has to coordinate with policy makers and another public and quasi-public
agencies in terms of financial stability, moreover, it should weight financial stability as an objective
vis-à-vis their other objectives.
4.3. Fiscal policy and its link to financial stability
The fiscal policy is focused on government spending and taxing for the purpose of economy
stabilization. As well, there are short-term and long-term goals. In short-term outlook government
prevent excessive unemployment and control inflation. For long-term perspectives fiscal policy
encourage economic growth for the purpose of higher standard of living. Therefore, the primary
objective of fiscal policy is to manage demand counter cyclically. Fiscal policy has two main tools as
changing tax rates and changing government expenditure. There are also expansionary and
contractionary fiscal policies. In the first case government increases aggregate demand by adjusting
the budget through increasing spending or decreasing taxes. The companies lose their tax benefits for
debt financing. Also raise in government spending may lead to bigger sales and profits thus the
retained earnings as internal capital will be available and more preferable. Consequently, the total
leverage is going to decrease. Under contractionary fiscal policy there is an opposite situation. The
government resorts to debt, when spending exceed its revenue, and it is inadvisable to increase taxes
or cut spending. The presence of well-functioning government debt market encourages development
of efficient financial markets. Financial market development is essential for ensuring stable economic
growth. Moreover, efficient financial markets provide longer-term loans for companies (Das et al.,
2010). A supply of interest-bearing sovereign debt facilitates the trading and valuation of all financial
instruments that provide liquidity to capital assets.
A key role of fiscal policy towards national financial stability is a shock absorber. First of all, the
government revenue and expenditure decisions have significant impact on aggregate demand.
Secondly, the government as a borrower provides a benchmark for risk free rates based on its bonds.
The risk-free rate represented as a rule by Treasury bills rate is a significant element of the cost of
equity capital.
The financial stability objective of fiscal policy is to maintain fiscal buffers that allow a response to
financial system stress. During the good times government could accumulate budget surpluses and
afterwards support the financial system in bad times. The recent crisis has shown the importance of
debt capacity and ability to sustain the financial sector through bank rescue packages and the real
59
economy through discretionary fiscal stimulus (Hannoun, 2010). However, nowadays we face the
opposite problem, when fiscal policy become a potential source of shocks rather than shock absorber.
The excessively loose fiscal policies and increased sovereign debt weaken the financial system and
economy in a whole.
A tax policy that is a part of fiscal policy can influence the economy and private investment and in
turn the cost of financing directly and indirectly. The direct channel includes the standard income and
substitutions effects that change households’ and companies’ budget constraints. The indirect impact
emerges in tax cuts on deficits, and higher government borrowing on national savings and interest
rates (Gale and Orzag, 2005). Taxes are the main source of government income. According to the
Czech central bank government revenue can be presented as five groups namely consumption tax,
wage tax, capital tax, social security contributions and lump-sum tax (Ambriško et al., 2013).
At the same time government expenditure can be divided into four categories: government
consumption, government investment, unemployment benefits, other social benefits and interest
payments paid on issued debt. Afonso et al. (2010) examine the influence of government spending on
higher economic growth in the existence of financial crisis. The increases in real government spending
growth have a positive effect on real GDP growth. The differences between the coefficients of
government spending during crisis and non-crisis periods turn out to be insignificant in their
estimation covered 127 countries for the period 1981-2007. However during banking crisis the
evidence does not support the idea that expansionary fiscal policies positively influence economic
growth. Earlier Afonso and Sousa (2009) argue that government spending shocks influence private
consumption and private investment, and positively affect price level and average cost of refinancing
debt.
Many economics argue that the economy reacts differently to fiscal policy during financial crisis
than in normal times. However when the Global Financial Crisis had occurred, the governments of
many countries all over the world implemented huge fiscal stimulus packages. Afterwards the
economist started to investigate the real effect of debt-financed fiscal policy measures as spending
programs and tax reductions. They found that there is a significant impact of fiscal policy on the
output (Fatás and Mihov, 2001; Galí et al., 2007; Afonso and Furceri, 2010).
4.3.1. Sovereign debt as significant element of fiscal policy
In a general way, debt is amount of money that one party borrows from another. In economic terms
debt is amount of money borrowed by one party from another under certain arrangements, and debt is
considered to be loans, bonds or commercial papers. The debt can be classified as corporate and
sovereign. According to Panizza et al. (2009) the main difference is the lack of a straightforward legal
mechanism to enforce repayment of the sovereigns. The legal penalties in the event of default for
sovereigns are more limited than for companies. However, in spite of shortage of direct power to
60
enforce repayment, the default will automatically limit access to a credit market as significant source
of financing.
As a rule government debt is associated with government securities as bonds, which sovereign
issues to raise funds and cover the budget deficit. The government securities are highly liquid and
low-risk, for this reason their rates are used to indicate the benchmark in capital cost estimation. The
sovereigns have advantages in compare with other borrowers: the ability to raise taxes, set laws,
control supply of money, which in turn makes them more creditworthy and thus decrease risks
(Standard & Poor’s, 2014). The government debt is a source of external financing that a government
uses to cover exceeded expenditures.
Based on the literature review conducted by Panizza et al. (2009) sovereigns issue debt, in order to
smooth consumption by transferring income from countries that are more prosperous to worse. Levy
Yeyati (2009) finds that private lending to sovereigns is procyclical, at the same time official lending
is countercyclical, which contradicts with statement that countries use foreign debt to smooth income
shocks.
A sovereign debt is widely traded on the fixed-income securities market, providing “vital
benchmark interest rates for most types of privately issued securities at the levels of both theory and
practice” (Scott et al., 2008). A supply of interest-bearing sovereign debt facilitates the trading and
valuation of all financial instruments that provide liquidity to capital assets. As a rule the risk-free rate
represented by Treasury bill rate is a significant element of the cost of equity, which in turn associated
with capital structure (Modigliani and Miller, 1958).
Sovereign debt increases the risk of higher future corporate taxes or expropriation of private
investments (Aktas at al. 2009). At the same time some studies show that sovereign debt can improve
corporate access to a foreign credit market. For example, Ditmar and Yuan (2008) argue that
sovereign bonds cause the sizable benefits for the development of corporate bond markets in emerging
economies. Moreover, sovereign debt represented by government bonds usually serve as collateral in
repo markets, for this reason banks keep them as an access to public liquidity.
On macro level a high sovereign debt leads to higher interest rates, higher labor taxes and increase
in households’ savings. However, the presence of a well-functioning government debt market
supports the development of efficient financial markets. Moreover, systematic and strong financial
market is essential for ensuring stable economic growth (Udaibir et al, 2010).
The effective debt management plays a crucial role both in short-term and long-term run. As
Aguiar et al. (2014) argue the government decides to increase or decrease debt level based on the
inflation credibility. If inflation credibility is low then the government might hold the current level of
debt or even reduce it. However, during high inflation credibility regime the debt level will be
increased. Nevertheless, the policies conducted by government should be complementary and support
61
the effectiveness of each other. For example, Bolton and Jeanne (2011) argue that “financial
integration without fiscal integration results in an inefficient supply of government debt”.
In time of deep integration and globalization it is not enough to pursue effectively internal
monetary and fiscal policies, but also countries should cooperate and follow similar rules, in order to
keep international stability. For the purpose of monetary stability, the treaty of Maastricht set five
criteria that countries should met if they want to adopt single currency of European Union regarding
inflation, budget deficit, debt, long-term interest rates and exchange rate mechanism. The national
budget deficit should be at or below 3% of GDP and national public debt should not exceed 60% of
GDP. Unfortunately, nowadays most of European countries do not satisfy these criteria. During
period 2005-2012 Greece had the highest level debt (as percentage to GDP). Italy also overreached
100% of debt to GDP, i.e. total amount of sovereign debt is larger than GDP of a country. France,
Germany and Hungary also exceed the limit (60%), however keep the level of debt around 75%.
Poland, Slovakia and the Czech Republic satisfy the required debt criteria keeping sovereign debt
ratio less than 50%.
Since government debt exceeds the appropriate level, there are a lot of debates regarding
consequences of raising sovereign debt. As it was mentioned before government debt is associated
with a tax raise. At high debt levels, the expected future tax increase will reduce the possible positive
effects of government debt, decreasing investment and consumption resulting in less employment and
lower output growth. Earlier Kumar and Woo (2010) find an inverse relation between debt and
subsequent growth in advanced and emerging economies. Later Afonso and Jalles (2013) find the
negative effect of government debt on growth.
Eaton (1995) argues that “problems relating to the sovereignty of the debtor can produce
inefficiencies”. Firstly, there is a need to finance repayment with tax revenue. Secondly, the debt
influences on the debtor’s incentives. Another significant issue of sovereign debt is the solvency of
the government itself. The administrative cost and excess burden of taxation may reduce the funds
that the government dispose to meet a debt service obligation. Even a relatively small amount of debt
may negatively influence investment and government revenue due to debt service obligations
financing sources. Subsequently another problem of debt is liquidity, i.e. the lack of resources
required to meet its current obligations and debt services.
Theoretically, in terms of closed economy, a higher level of debt will absorb share of national
wealth, then increase interest rates and cause the private capital decrease. And the consequences
reduce the level of output as new capital is more productive than old capital; and reduced rate of
capital accumulation leads to lower economic growth. On the other hand, in the open economy,
international financial markets may moderate such effects, if investors stay confident in country’s
ability to repay. However, larger share of foreign debt leads to lower domestic income reduced by
interest paid to foreign that in turn increase the gap between GDP and GNP. To a great extent the
62
higher level of debt might reduce the size and effectiveness of future fiscal response to the adverse
shocks (Cecchetti et al., 2010).
Similarly, researchers investigate the influence of sovereign debt not only on macroeconomic
performance, but also on corporate characteristics. There can be direct and indirect impact of
sovereign debt level on private sector. According to previous studies the fiscal deficit has positive
impact on the interest rates (Gale and Orzag, 2002). Therefore, the companies’ choice of financing
source is based on the cost of capital, where interest rate plays significant role in its estimation;
consequently corporate capital structure relies on interest rates.
In addition, Dailami (2010) argues that “investors’ perceptions of sovereign debt problems
translate into higher cost of capital for corporate issues, with the magnitude of such costs increasing at
times when sovereign bonds trade at spreads exceeding a threshold of 1000bps”. Also Ağca and
Celasun (2012) find the relation between external debt of a public sector and corporate borrowing
costs. They argue that companies face significantly higher borrowing costs with higher level of
sovereign debt; moreover, the relation is stronger for countries with weak creditor risks and episodes
of sovereign defaults.
Moreover, sovereign debt influences the availability of financing sources. Arteta and Hale (2008)
find that sovereign debt crisis and its aftermath influence the foreign credit availability to private
sector. They argue that there is a 20% decline of foreign credit to emerging market private companies
during debt renegotiation. Along with domestic private credit reduction sovereign defaults also
increase the risk of a banking crisis (Borensztein et al. 2007, Sandleris, 2008). Dick-Nielsen et al.
(2012) and their findings show that sovereign debt crisis increase corporate bond spreads.
Additionally Corsetti et al (2014) also find that higher risk premium on government debt leads to hire
corporate credit spreads.
The financial instability can manifest itself as sovereign debt crisis. In this case the financial
instability is caused by public sector. The recent sovereign debt crisis was a running consequence of
global financial crisis (2007-2008). Highly leveraged banks, deregulation of financial system,
securitization growth, bankruptcy of investment banks as Bear Stearns and Lehman Brothers in USA
caused panic in financial markets; increased systematic risk that in turn led to global financial crisis
and deep recession. In order to support financial system and increase investor’s confidence
government decided to implement expansionary fiscal policy and provided bailout packages to banks.
These measures dramatically raised public deficit, which led to sovereign debt growth and
consequently growing default risk. Contagion effect through the banking system was another
significant cause of sovereign debt crisis. The financial integration leads to the contagion, so
nowadays contagion risk is one of the important components of systematic risk.
The causes of debt crisis can be classified as fiscal problems and problems with banking system.
For example, Greece and Portugal had faced fiscal problems that led to sharp debt increase and
63
consequently caused crisis. On the other hand, Ireland and Spain suffered from banking crisis, in
particular mortgage boom (Blundell-Wignall and Slovik, 2011).
According to Junevicius and Liutkus (2011) the sovereign debt crisis cane be divided into 4 steps:
growing deficit, growing debt, downgrades of financial ratings and default. Logically, due to financial
crisis or some other economic shocks government’s expenditures increase (additional measures to
stabilized economy) and at the same time its revenue mainly from taxes decreases as the result of
downturn. Consequently the deficit emerges, which in turn forces government to borrow, the
government rises with probability of default.
Blundell-Wignall (2012) analyzes the policies for solving sovereign debt crisis in Europe and
highlights their advantages and disadvantages. The fiscal policy measures as fiscal consolidation,
international transfers, debt haircuts or Eurobond issues can reduce debt, improve credibility and euro
viability and cost reduction for problematic countries. However, such measure can lead to further
problems in banking system or high costs and lower rating for healthier countries. Moreover, debt
haircuts may cause political problems and uncontrolled incentives. The European Central Bank (ECB)
may provide LTRO operations and reduce collateral requirements that in turn will provide banks with
additional funding and cash, support interbank lending and prevent bank failures. One of the most
popular unconventional monetary measures is Quantitative Easing (QE) that helps to avoid debt
dynamics deteriorating and supports growth. The disadvantage of ECB intervention is greater
concentration on the crisis assets; also QE may cause higher inflation. Blundell-Wignall (2012) argues
that structural policies regarding labour market, product markets and pensions will reduce costs of
fiscal consolidation and improve competitiveness by the means of labour market. In addition,
transparent accounting for hidden losses and separation of retail and investment banking activities will
help to divide risk as leverage and contagion risks: separate domestic retail from high-risk globally-
priced assets. Later Ureche-Rangau and Burietz (2013) investigate the influence of government
interventions on sovereign debt and find negative impact on the cost of sovereign debts. Moreover, the
cost of the crisis depends on the instrument that the country primarily relies upon. As a rule it can be
bonds or loans, domestic or foreign. And the differences between them play a great role the financial
infrastructure as well as its stability. Interestingly, Hale (2007) argues that the debt crisis expected to
be more frequent in countries that rely primarily on bank lending.
According to Prinz and Beck (2012) several measures were proposed in an effort to solve
sovereign debt crisis in European Union. The first policy action conducted by ECB is bond-buying
program of nearly insolvent countries, i.e. financing of public debt. The major concern is probability
to transfer the full risk of defaulting countries to European taxpayers as bank and investors could force
ECB to buy all debt securities with high risk; and therefore ECB would have enormous amount of
critical assets on its balance sheet. The second solution is to issue Eurobonds, which emitted by the
European agency on behalf of European member countries. However, this measure could result in
higher moral hazard due to lack of sanction towards countries with excessive debt. As a result
Eurobonds would socialize the sovereign credit risk.
64
Another policy measure is leveraging European Financial Stability Facility (EFSF) or European
Stability Mechanism (ESM), i.e. ESM should buy sovereign debt securities and provide them as
collateral for money from ECB. Such policy also could lead to debt explosion. However, ESM could
recapitalize insolvent banks. The European Troubled Asset Relief Programme (Euro-TRAP) is
directed to buy high risky troubled assets from banks accounts, in other words cleaning banks’
balance sheets. Authors argue that Euro-TRAP would be better solution to solve sovereign debt crisis
as it combined “enforceable sovereign default and mandatory adequate capital basis for banks”.
According to Udaibir et al. (2010) debt management is a crucial component of sound policy
framework, i.e. the improvement in debt structure can significantly complement fiscal consolidation
“in ensuring robust recovery in post crisis environment”. In terms of macroeconomic and financial
stability the important decision is to attract foreign investors, which in turn can recue borrowing costs.
Several authors try to investigate the influence of sovereign debt crisis on private sector. Arteta and
Hale (2008) find that sovereign debt crisis leads to decline in foreign credit to domestic private firms,
first of all due to worsening macroeconomic fundamentals, political situation, and banking system
distress. Later Dick-Nielsen et al. (2012) show that sovereign debt crisis has increased corporate bond
spreads. However, most studies are focused on the sovereign debt crisis, its causes and consequences
on the macro level, the financial markets, in particular government bond market, banking systems, and
interest rates in connection with government bond yields. But the apparent influence of sovereign debt
on the private sector, including its performance and financing decisions has not been analyzed in full
extent.
4.4. Monetary policy and its link to financial stability
Monetary policy is a complex of actions managed by central bank. The main goal is to adjust the
money supply or interest rates, in order to stabilize economy. There can be to types of monetary
policy: expansionary and contractionary. The first one increases the total supply of money by
lowering interest rates, in order to adjust unemployment. The contractionary monetary policy
conversely decreases the money supply by raising interest rates to control inflation. The monetary
policy maintains price stability, full employment and economic growth. In monetary policy regimes
with target low and stable inflation, the key interest rate is the main policy instrument. Thus, there are
two principal monetary policy rules. Firstly, nominal interest rate peg is an extreme form of
stabilization which sets the short-term interest rate equal to a constant target plus noise (Bhamra,
Fisher & Kuehn, 2011). So called passive policy as it does not respond to inflation. And, second rule
is represented by constant inflation target as policy, where central bank fixes inflation rate and
preserves it by the means of interest rate changes and other monetary tools.
There are different objectives of monetary policy that vary from one country to another, depending
on the level of their development. However, recent years several new phenomena appear in economic
65
environment, which cause numerous difficulties and financial uncertainties regardless the strength of
economy. Bandoi et al. (2009) detach following:
deteriorating financial position of domestic companies and the existence of
external debt crisis;
the existence of conflict between economic stimulation and inflation;
interdependencies between monetary and financial markets with unstable funds
flows as a background, especially capital movement;
financial innovations that create new financial products, which lead to
difficulties to define monetary aggregates and establish their influence on monetary
policy.
Theoretically, there are three standard strategies of monetary policy: targeting monetary
aggregates, targeting exchange rate and inflation. Most of EU members have chosen to target inflation
in terms of European central Bank strategy (the Czech Republic, Poland, Hungary, Slovakia,
Germany, Greece, Netherlands etc.). Other countries also set medium-term price stability as the main
objective of monetary policy (Russian Federation, Japan, Great Britain, Argentina, Australia, and
South Africa). However there are some countries, mostly small open economy, that firstly focus on
exchange rate and the stability of domestic currency with further price stability as a primary objective
(Singapore, Indonesia, Madagascar).
As was mentioned before, inflation and consequently price stability are the main goal of monetary
policy and central banks. According to Bandoi et al. (2009) theoretically price stability can be
determine through several ideas:
price stability as the aggregate price level measured by indices (as Consumer
Price Index (CPI), Harmonized Index of Consumer Prices (HCIP), or Producer Price
Index (PPI);
price stability occurs, when the money keeps their value over the time the speed
erosion of purchasing power is slow;
the monetary stability concept overlaps price stability
Inflation represents an overall index for the cost of living. The expectation of changes in inflation
rate influences credit and reinvestment risks. As a rule, the high rate of inflation is expected to
adversely affect both the debt market and the stock market; consequently, the rate of return is
expected to be high, which adversely affects the price of the securities. As a result, the cost of capital
is increasing, which makes some investments projects unprofitable and thereby adversely affects the
rate of growth of the economy and consequently adversely affects the stock market. Therefore, under
66
the conditions of higher inflation rate the debt will be more beneficial for companies, because the cost
of debt decreases.
High and volatile inflation has adverse influence on the economic growth. It deteriorates the value
of income and savings, and leads to high nominal interest rates, which in turn increase the uncertainty
in the financial markets, decrease investors ‘confidence, and consequently increase the cost of capital
for private sector. However, excessively low inflation or even deflation also lead to recession.
As was mentioned before inflation stabilization is one of the major priorities of the Central bank.
Generally price stability is always associated with financial stability thus Akram and Eitrheim (2008)
investigate the influence of flexible inflation targeting on financial stability by the means of inflation
and output stabilization. They find that output stabilization has tendency to improve financial stability
in Norway. Moreover, growth in house prices, equity prices and credit increase inflation and output
stability; however, there is a mix effect on financial stability.
The nominal interest rates as a significant tool of monetary policy can be divided into long-term
and short-term interest rates. Short-term interest rates represent business cycle stage prevailing in the
economy. It reveals volatility in the capital market and the money market as well. Growth in interest
rates may lead companies to increase their debt ratio, because of tax benefits or decrease financial
leverage in order to reduce bankruptcy risk. The changes in monetary policy affect the demand for
money that in turn may influence financial market equilibrium, which consequently may change
financing channels and financial constrains for private sector. For instance, Cúrdia and Woodford
(2010) argue that the central focus of monetary policy should be interest rate. According to the study
there can be four different possible specifications of monetary policy: (1) a simple “Taylor rule”6; (2)
a “strict inflation targeting” regime, under which interest rate policy is used to ensure inflation never
deviates from its target level (zero) in response to any disturbance; (3) a “flexible inflation-targeting”
regime, under which interest policy ensures that inflation holds each period; and (4) a fully optimal
policy (the solution to Ramsey policy problem)7.
4.4.1. Unconventional monetary policy
The sluggish rate of economy recovery has shown that monetary policy itself is not effective
enough to return economy to full employment rate after financial crisis. Thus the policymakers start to
use unconventional policies during downturns. During global financial crisis the major central banks
have introduced so called non-standard monetary policy measures, in order to support the functioning
of the financial sector, to protect the real economy from the fallout, and preserve price stability over
the medium term.
6 Is a monetary policy rule on the relation between inflation and nominal interest rate change (Taylor, 1993)
7 Ramsey optimal policy should balance two goals as inflation and output stabilization
67
Trichet (2013), a former president of European Central Bank, emphasizes two distinct views on
non-standard measures. The first view determines non-standard measures as a continuation of
standard policy by other means. As central banks cannot decrease the nominal interest rates further,
they start to use another tools. According to the second view, the non-standard measures deal with
channels of more effective transformation of monetary policy. Thus, standard or traditional tools
depend on medium- and long-term outlook for price stability; and non-standard or so called
unconventional tools depend on the degree of dysfunction of monetary policy transmission through
the financial system and financial markets.
Labonte (2013) groups the non-standard policies into three sets, which are focused on: (1) applying
communication policies to adjust the future expectations regarding interest rates; (2) changing the
composition of the central bank’s balance sheet by the means of the target purchases of long-term
bonds, in order to reduce the long-term interest rate (3) increasing the size of the central bank’s
balance sheet or so called “quantitative easing”.
Sometimes conventional measures do not effectively work; it can happen when short-term interest
rates reach zero level. In the recent years one of the most well-known unconventional measurers of
monetary policy is quantitative easing. Quantitative easing (QE) is one of the unconventional
monetary policy measures that designed to prevent banking system failure and increase money supply.
The idea is to provide liquidity to the system and avert further financial distress. The central banks use
different tools of QE such as financial asset purchases and direct lending to banks. As a rule QE is
applied when interbank interest rate is close to or at zero level.
The particular QE programs vary across countries and depend on the specifics of economies and
the further Central Bank’s goals. As was mentioned above there are two main types of QE programs.
Thus Federal Reserve (FED) and Bank of England (BOE) rely on bonds purchases, while European
Central Bank (ECB) and Bank of Japan (BOJ) have chosen direct lending. The Table 7 represents the
timeline of the quantitative easing conducted by Central Banks. Fawley and Neely (2013) provide
comparison analysis regarding four central banks that applied QE to boost economy. In 2008 after
bankruptcy of Lehman Brothers FED started to buy long-tern government bonds, mortgage-backed
securities and government – sponsor enterprise debt. Later in 2011 and 2012 FED conducted so called
Operation Twist, when Treasury purchases were funded by sales of short-term securities. The FED
QE is distinguished into four separate programs: QE1 (asset purchases 2008-2009), QE2 (asset
purchases 2010), Operation Twist (long-term asset purchases and short-term asset sales 2011 and
2012), and Q3 (asset purchase 2012). In 2014 FED announced the end of mortgage-backed securities
purchase.
Quantitative easing provided by Bank of England can be divided into two episodes. The first stage
refers to time period from March 2009 to February 2010, when BOE was increasing the asset
purchase ceiling funded by money creation; and in February 2010 the first part of QE was ended with
announcement that new purchases would be funded by Treasury issuance. The second stage started in
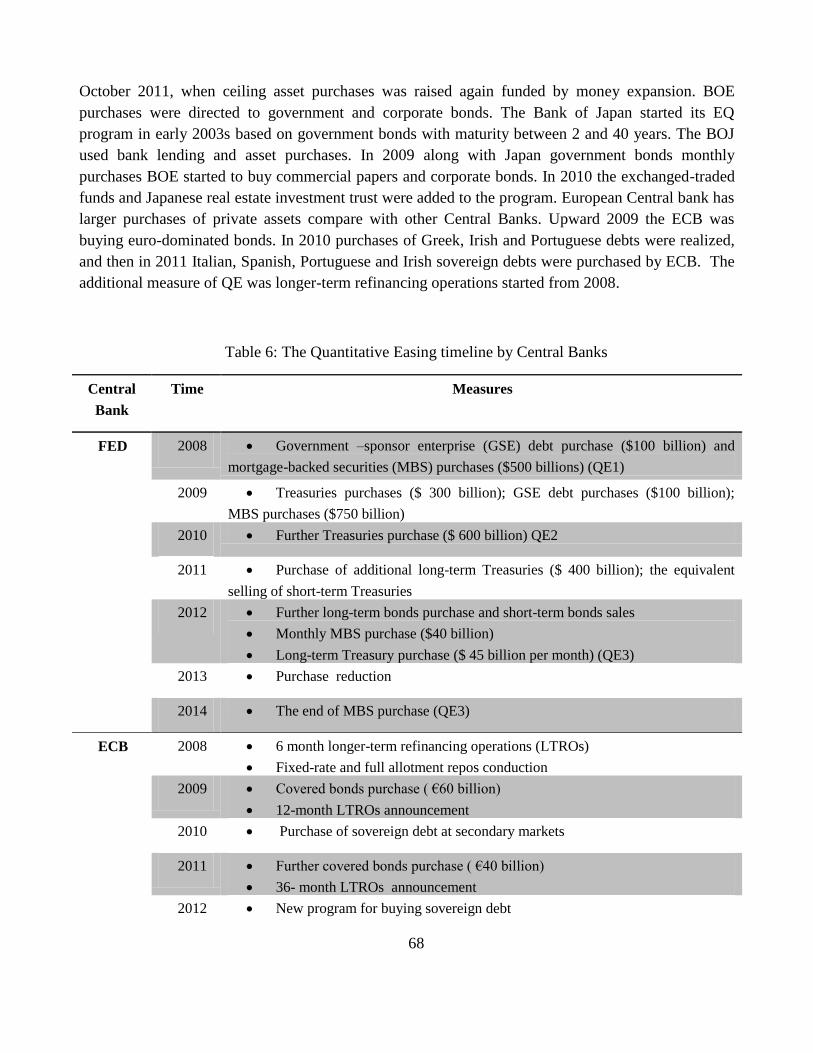
68
October 2011, when ceiling asset purchases was raised again funded by money expansion. BOE
purchases were directed to government and corporate bonds. The Bank of Japan started its EQ
program in early 2003s based on government bonds with maturity between 2 and 40 years. The BOJ
used bank lending and asset purchases. In 2009 along with Japan government bonds monthly
purchases BOE started to buy commercial papers and corporate bonds. In 2010 the exchanged-traded
funds and Japanese real estate investment trust were added to the program. European Central bank has
larger purchases of private assets compare with other Central Banks. Upward 2009 the ECB was
buying euro-dominated bonds. In 2010 purchases of Greek, Irish and Portuguese debts were realized,
and then in 2011 Italian, Spanish, Portuguese and Irish sovereign debts were purchased by ECB. The
additional measure of QE was longer-term refinancing operations started from 2008.
Table 6: The Quantitative Easing timeline by Central Banks
Central
Bank
Time Measures
FED 2008 Government –sponsor enterprise (GSE) debt purchase ($100 billion) and
mortgage-backed securities (MBS) purchases ($500 billions) (QE1)
2009 Treasuries purchases ($ 300 billion); GSE debt purchases ($100 billion);
MBS purchases ($750 billion)
2010 Further Treasuries purchase ($ 600 billion) QE2
2011 Purchase of additional long-term Treasuries ($ 400 billion); the equivalent
selling of short-term Treasuries
2012 Further long-term bonds purchase and short-term bonds sales
Monthly MBS purchase ($40 billion)
Long-term Treasury purchase ($ 45 billion per month) (QE3)
2013 Purchase reduction
2014 The end of MBS purchase (QE3)
ECB 2008 6 month longer-term refinancing operations (LTROs)
Fixed-rate and full allotment repos conduction
2009 Covered bonds purchase ( €60 billion)
12-month LTROs announcement
2010 Purchase of sovereign debt at secondary markets
2011 Further covered bonds purchase ( €40 billion)
36- month LTROs announcement
2012 New program for buying sovereign debt
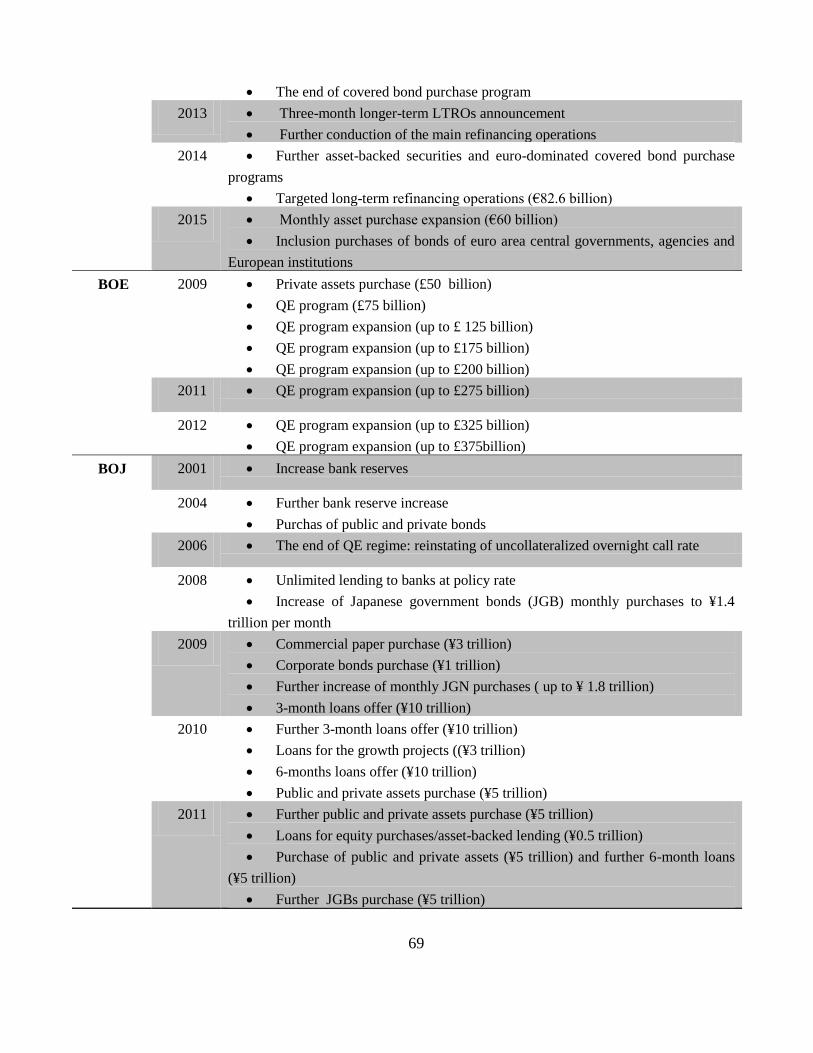
69
The end of covered bond purchase program
2013 Three-month longer-term LTROs announcement
Further conduction of the main refinancing operations
2014 Further asset-backed securities and euro-dominated covered bond purchase
programs
Targeted long-term refinancing operations (€82.6 billion)
2015 Monthly asset purchase expansion (€60 billion)
Inclusion purchases of bonds of euro area central governments, agencies and
European institutions
BOE 2009 Private assets purchase (£50 billion)
QE program (£75 billion)
QE program expansion (up to £ 125 billion)
QE program expansion (up to £175 billion)
QE program expansion (up to £200 billion)
2011 QE program expansion (up to £275 billion)
2012 QE program expansion (up to £325 billion)
QE program expansion (up to £375billion)
BOJ 2001 Increase bank reserves
2004 Further bank reserve increase
Purchas of public and private bonds
2006 The end of QE regime: reinstating of uncollateralized overnight call rate
2008 Unlimited lending to banks at policy rate
Increase of Japanese government bonds (JGB) monthly purchases to ¥1.4
trillion per month
2009 Commercial paper purchase (¥3 trillion)
Corporate bonds purchase (¥1 trillion)
Further increase of monthly JGN purchases ( up to ¥ 1.8 trillion)
3-month loans offer (¥10 trillion)
2010 Further 3-month loans offer (¥10 trillion)
Loans for the growth projects ((¥3 trillion)
6-months loans offer (¥10 trillion)
Public and private assets purchase (¥5 trillion)
2011 Further public and private assets purchase (¥5 trillion)
Loans for equity purchases/asset-backed lending (¥0.5 trillion)
Purchase of public and private assets (¥5 trillion) and further 6-month loans
(¥5 trillion)
Further JGBs purchase (¥5 trillion)
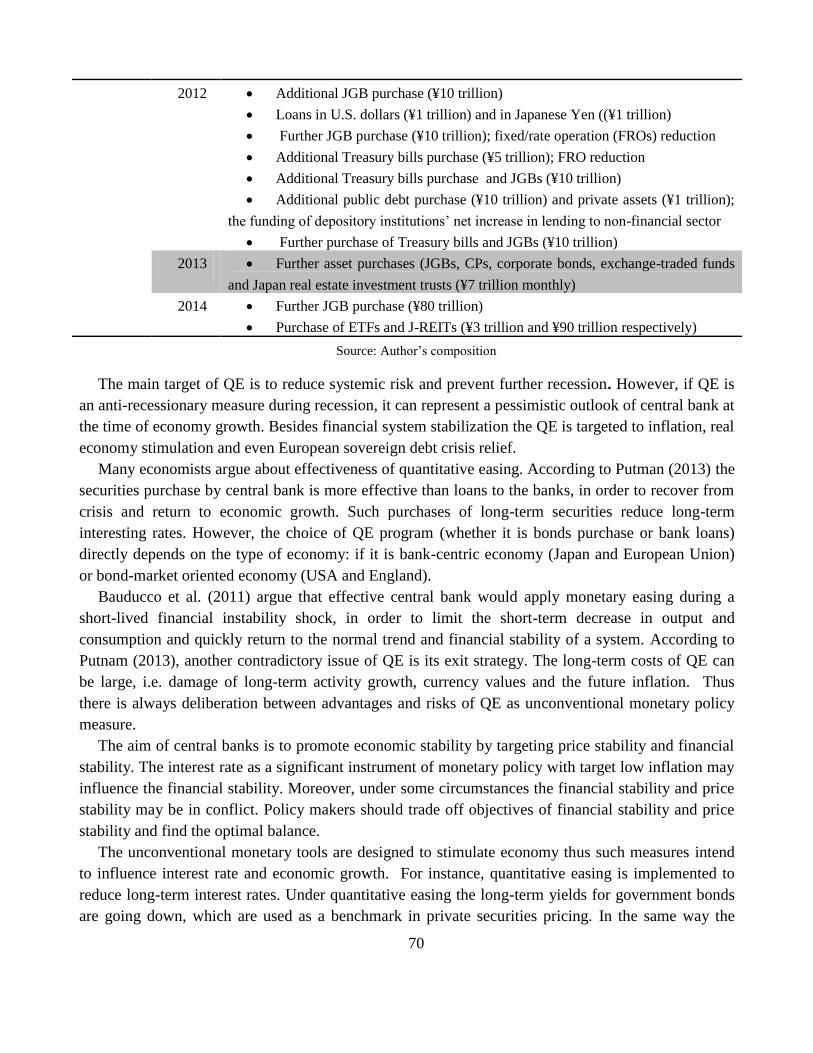
70
2012 Additional JGB purchase (¥10 trillion)
Loans in U.S. dollars (¥1 trillion) and in Japanese Yen ((¥1 trillion)
Further JGB purchase (¥10 trillion); fixed/rate operation (FROs) reduction
Additional Treasury bills purchase (¥5 trillion); FRO reduction
Additional Treasury bills purchase and JGBs (¥10 trillion)
Additional public debt purchase (¥10 trillion) and private assets (¥1 trillion);
the funding of depository institutions’ net increase in lending to non-financial sector
Further purchase of Treasury bills and JGBs (¥10 trillion)
2013 Further asset purchases (JGBs, CPs, corporate bonds, exchange-traded funds
and Japan real estate investment trusts (¥7 trillion monthly)
2014 Further JGB purchase (¥80 trillion)
Purchase of ETFs and J-REITs (¥3 trillion and ¥90 trillion respectively)
Source: Author’s composition
The main target of QE is to reduce systemic risk and prevent further recession. However, if QE is
an anti-recessionary measure during recession, it can represent a pessimistic outlook of central bank at
the time of economy growth. Besides financial system stabilization the QE is targeted to inflation, real
economy stimulation and even European sovereign debt crisis relief.
Many economists argue about effectiveness of quantitative easing. According to Putman (2013) the
securities purchase by central bank is more effective than loans to the banks, in order to recover from
crisis and return to economic growth. Such purchases of long-term securities reduce long-term
interesting rates. However, the choice of QE program (whether it is bonds purchase or bank loans)
directly depends on the type of economy: if it is bank-centric economy (Japan and European Union)
or bond-market oriented economy (USA and England).
Bauducco et al. (2011) argue that effective central bank would apply monetary easing during a
short-lived financial instability shock, in order to limit the short-term decrease in output and
consumption and quickly return to the normal trend and financial stability of a system. According to
Putnam (2013), another contradictory issue of QE is its exit strategy. The long-term costs of QE can
be large, i.e. damage of long-term activity growth, currency values and the future inflation. Thus
there is always deliberation between advantages and risks of QE as unconventional monetary policy
measure.
The aim of central banks is to promote economic stability by targeting price stability and financial
stability. The interest rate as a significant instrument of monetary policy with target low inflation may
influence the financial stability. Moreover, under some circumstances the financial stability and price
stability may be in conflict. Policy makers should trade off objectives of financial stability and price
stability and find the optimal balance.
The unconventional monetary tools are designed to stimulate economy thus such measures intend
to influence interest rate and economic growth. For instance, quantitative easing is implemented to
reduce long-term interest rates. Under quantitative easing the long-term yields for government bonds
are going down, which are used as a benchmark in private securities pricing. In the same way the
71
interest rates might decrease as a consequence of such called portfolio rebalancing effect, when low
yields on government bonds stimulate demand on other securities. Investors tend to buy them until the
yields are equalized. There is a direct effect of buying Mortgage-Backed Securities (MBS), as lower
yields on MBS leas to mortgage rates reduction that in turn stimulate demand on real estate. However,
it is complicated to evaluate the real effect on interest rates and as there are might be other
macroeconomic factors as inflation or economic growth. Even though there can be situation, when
low interest rates do not stimulate economic activity as there is another barrier to economic growth as
unavailability of financial resources, i.e. credit restrictions. Another effect of unconventional measure
as QE is money supply increase by the means of bank reserves. The banks have opportunity to extend
lending to private sector and as a result stimulate economy. However, on practice banks prefer to hold
their reserves. Potentially if banks start to lend their holdings created by the means if quantitative
easing, the money supply will increase and that in turn will lead to higher inflation. In addition,
quantitative easing should reduce the real exchange rate of domestic currency by the means of
unattractive assets (Labonte, 2014).
There are many other unconventional measures proposed by policy makers and economist.
However all of them have their cons and pros, which should be considered in the carefully weighted
decision towards financial stability of a country.
4.5. Macro-prudential policy towards national financial stability
The sequences of recent crises show the need to improve the traditional macro approaches and
analytical framework to predict and cope with suddenly happened events of financial instability. The
reason of necessity for macro-prudential policy is lack of fundamental understanding of system-wide
risk. Thus macro-prudential policy is the main element of financial stability policy, which is focused
on the system as a whole and monitors endogenous processes, where financial institutions may get
into situation of instability through common behaviour and mutual interactions (Frait and Komarkova,
2011). The general view in the term of goal of macro-prudential policy is to limit systematic risk and
cost of systematic financial distress. However, there are some differences in emphasis of macro-
prudential regulation role. For example, Brunnermeier et al. (2009) argue that the key purpose of
macro-regulation is to represent a countervailing force to the natural decrease in measured risks in a
boom and the subsequent rise in measured risks in the subsequent bust. Another view on the goal of
macro-prudential policy is to limit the risk of episodes of system-wide distress that have significant
macroeconomic costs (Borio and Drehmann, 2009a). Caruana (2010) describes the objective of
macro-prudential policy as “to reduce systemic risk by explicitly addressing the interlinkages
between, and common exposures of, all financial institutions, and the procyclicality of the financial
system”. At the same time, Hanson et al. (2010) argue that macro-prudential policy should be focused
on internalization of banks’ losses on their assets and mitigating moral hazard.
However, in order to understand the nature of macro-prudential policy, the micro-prudential policy
has to be taken into consideration, which adjusts the financial stability of each individual institution
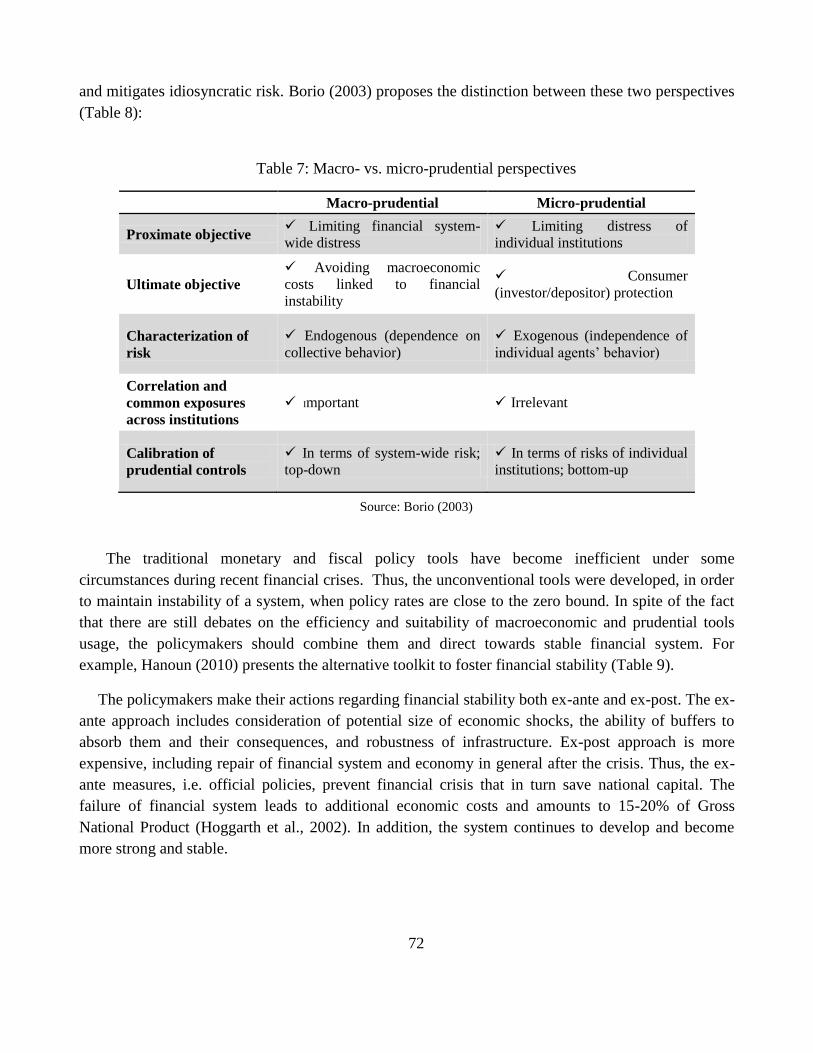
72
and mitigates idiosyncratic risk. Borio (2003) proposes the distinction between these two perspectives
(Table 8):
Table 7: Macro- vs. micro-prudential perspectives
Macro-prudential Micro-prudential
Proximate objective Limiting financial system-
wide distress
Limiting distress of
individual institutions
Ultimate objective
Avoiding macroeconomic
costs linked to financial
instability
Consumer
(investor/depositor) protection
Characterization of
risk
Endogenous (dependence on
collective behavior)
Exogenous (independence of
individual agents’ behavior)
Correlation and
common exposures
across institutions
Important Irrelevant
Calibration of
prudential controls
In terms of system-wide risk;
top-down
In terms of risks of individual
institutions; bottom-up
Source: Borio (2003)
The traditional monetary and fiscal policy tools have become inefficient under some
circumstances during recent financial crises. Thus, the unconventional tools were developed, in order
to maintain instability of a system, when policy rates are close to the zero bound. In spite of the fact
that there are still debates on the efficiency and suitability of macroeconomic and prudential tools
usage, the policymakers should combine them and direct towards stable financial system. For
example, Hanoun (2010) presents the alternative toolkit to foster financial stability (Table 9).
The policymakers make their actions regarding financial stability both ex-ante and ex-post. The ex-
ante approach includes consideration of potential size of economic shocks, the ability of buffers to
absorb them and their consequences, and robustness of infrastructure. Ex-post approach is more
expensive, including repair of financial system and economy in general after the crisis. Thus, the ex-
ante measures, i.e. official policies, prevent financial crisis that in turn save national capital. The
failure of financial system leads to additional economic costs and amounts to 15-20% of Gross
National Product (Hoggarth et al., 2002). In addition, the system continues to develop and become
more strong and stable.
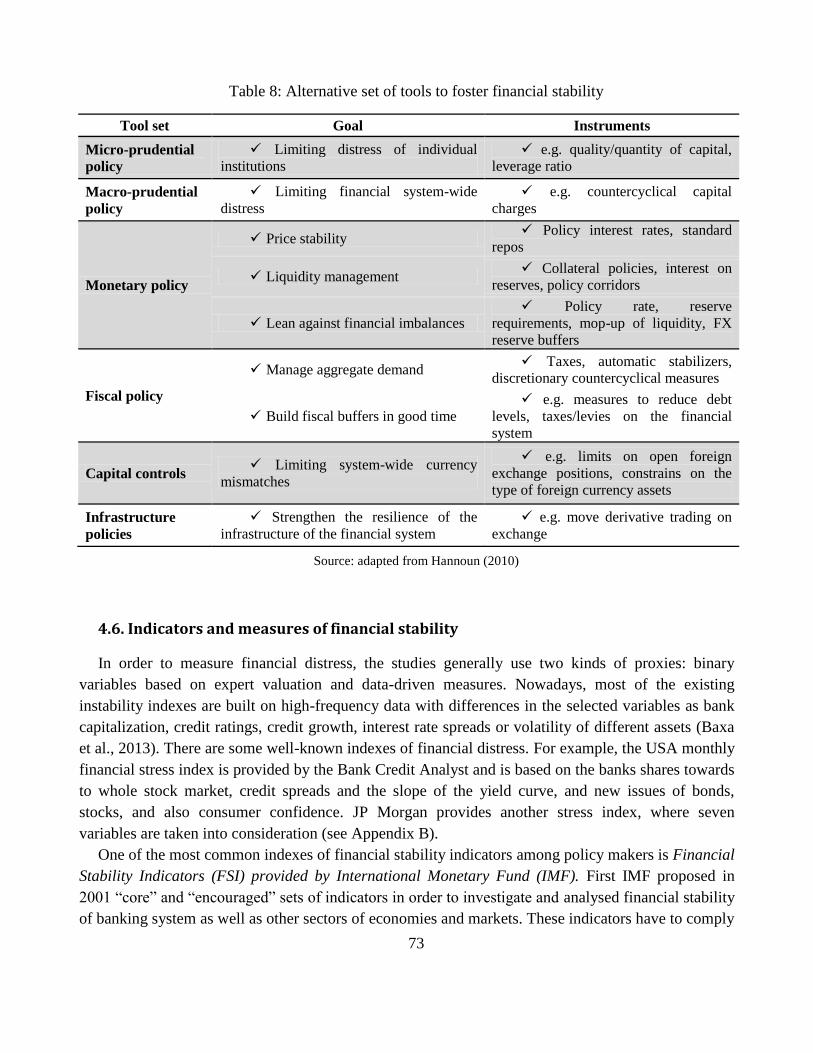
73
Table 8: Alternative set of tools to foster financial stability
Tool set Goal Instruments
Micro-prudential
policy
Limiting distress of individual
institutions
e.g. quality/quantity of capital,
leverage ratio
Macro-prudential
policy
Limiting financial system-wide
distress
e.g. countercyclical capital
charges
Monetary policy
Price stability Policy interest rates, standard
repos
Liquidity management Collateral policies, interest on
reserves, policy corridors
Lean against financial imbalances
Policy rate, reserve
requirements, mop-up of liquidity, FX
reserve buffers
Fiscal policy
Manage aggregate demand Taxes, automatic stabilizers,
discretionary countercyclical measures
Build fiscal buffers in good time
e.g. measures to reduce debt
levels, taxes/levies on the financial
system
Capital controls Limiting system-wide currency
mismatches
e.g. limits on open foreign
exchange positions, constrains on the
type of foreign currency assets
Infrastructure
policies
Strengthen the resilience of the
infrastructure of the financial system
e.g. move derivative trading on
exchange
Source: adapted from Hannoun (2010)
4.6. Indicators and measures of financial stability
In order to measure financial distress, the studies generally use two kinds of proxies: binary
variables based on expert valuation and data-driven measures. Nowadays, most of the existing
instability indexes are built on high-frequency data with differences in the selected variables as bank
capitalization, credit ratings, credit growth, interest rate spreads or volatility of different assets (Baxa
et al., 2013). There are some well-known indexes of financial distress. For example, the USA monthly
financial stress index is provided by the Bank Credit Analyst and is based on the banks shares towards
to whole stock market, credit spreads and the slope of the yield curve, and new issues of bonds,
stocks, and also consumer confidence. JP Morgan provides another stress index, where seven
variables are taken into consideration (see Appendix B).
One of the most common indexes of financial stability indicators among policy makers is Financial
Stability Indicators (FSI) provided by International Monetary Fund (IMF). First IMF proposed in
2001 “core” and “encouraged” sets of indicators in order to investigate and analysed financial stability
of banking system as well as other sectors of economies and markets. These indicators have to comply
74
with several features as analytical significance, usefulness, relevance, and availability. The “core” set
covers banking system represented by individual banks. In order to investigate the health of individual
banks, six groups of aggregating indicators were established, namely as Capital adequacy, Asset
quality, Management soundness, Earnings, Liquidity, and Sensitivity to market risk. Capital adequacy
as well as its availability appears to be a key to the robustness of financial institutions to shocks to
their balance sheets. The common used proxies of capital adequacy are aggregate risk-based capital
ratios. The quality of bank assets and off-balance sheet positions represents the credit risk of financial
institutions, notably their repayment performance and capacity to pay, diversification by individual
borrowers, by sectors, and even by country, and currency composition, if it is applicable. Further,
bank profitability also plays a great role in bank solvency, which can be attended by poor asset quality
and unsustainable asset/liability management. In this case return on assets (ROA) and return on equity
(ROE) are the widely used indicators of bank profitability. However, the liquidity problems may
occur even in solvent banks. Thus, the liquidity of bank assets and liabilities has to be monitored. In
addition, the systematic liquidity associated with country’s liquidity infrastructure is assessed by
indicators of the tightness and depth of key markets, such as bid-ask spreads and turnover ratios, and
relevant sectoral balance sheet indicators. This type of liquidity influences both bank and market
liquidity. The diversified operations make banks sensitive to market risks, notably interest rate risk,
exchange rate and other price risks. Net open positions or duration of assets and liabilities are used to
access these kinds of risks (IMF, 2001).
As the banking system and its stability have significant influence on the financial system as a
whole, the Basel Capital Framework is directed to strengthen the stability of the international banking
system. So far there are three modifications of the Basel Capital Framework (Basel I, Basel II and
Basel II). The Basel Capital Accord (i.e. Basel I or the 1988 Accord) was released in 1988 and
provided a minimum capital ratio of capital to risk-weighted assets of 8%, which had to be
implemented by the end of 1992. In July 1999 a new proposal for capital adequacy framework was
presented and later in 2004 the Revised Capital Framework (i.e. Basel II) was released and contained
three pillars: (1) minimum capital requirements; (2) supervisory review of an institution’s capital
adequacy and internal assessment process; (3) and effective use of disclosure. New framework was
directed to improve the influence of regulatory capital requirements on underlying risks and to address
the financial innovation in a better way. Under Global Financial Crisis the banking sector became
overly leveraged with inadequate liquidity buffers. Moreover, poor governance, risk management and
inappropriate incentive structures enhance the situation. These factors led to the mispricing of credit
and liquidity risks and excess credit growth. In order to stand against increased risks Basel Committee
issued Principles for sound liquidity risk management and supervision. After several further
documents aimed to strengthen the Basel II, in December 2010 the new standards were proposed,
namely Basel III: International framework for liquidity risk measurement, standards and monitoring8.
This accord is based on the same pillars as the previous one, but several innovations were added to it:
8 For more information see Basel III: I International framework for liquidity risk measurement, standards and
monitoring, December 2010, BIS
75
(1) the capital conservation buffer (an additional layer of common equity); (2) a countercyclical
capital buffer; (3) proposal to additional capital and liquidity requirements; (4) a leverage ratio; (5)
liquidity requirements (i.e. a minimum liquidity ratio); and (6) additional requirements s for
systemically important banks (BIS, 2013a). In January 2013 the improved Basel II was introduces:
The liquidity coverage ratio and liquidity risk monitoring tools9. The first objective of this document
was to promote short-term resilience of a banks’ liquidity risk profile. In order to achieve this goal, the
Liquidity Coverage Ratio was proposed, which should improve the banks’ ability to absorb shocks
arising from financial and economic instability and thus reduce the contagion risk that transits from
financial sector to real economy (BIS, 2013b). The second objective was resilience over a longer time
period by requirements for banks to fund their activities with more stable sources. For this purpose the
Net Stable Funding Ratio was introduced by new document, namely Basel III: the net stable funding
ratio10
. The available amount of stable funding should exceed or at least be equal to required amount
of stable funding, where required funding is measured based on the different characteristic of the
liquidity risk profile of an institution. Regularly Basel Committee on Banking Supervision provides
Monitoring reports in order to determine the influence of the Basel III framework on banks and
financial stability.
The health of financial system depends not only on banking system, but also development of
nonbank financial intermediaries, the corporate sectors, households, and the real estate market.
Therefore the Encouraged set represents the indicators of financial stability of these significant
economical groups.
The ability to work with both core and encouraged sets provides a degree of flexibility in the
selection of soundness indicators, in order to investigate the vulnerabilities and conduct
comprehensive analysis of financial stability under country-specific circumstances. Indicators of the
core set can be combined with other additional indicator, according to the level of financial
development of a country, its institutional structure, and regional circumstances.
Based on the current financial situation in the world and risks, which countries can face, IMF
modifies the list of FSI. In 2013 the current FSI list, in particular capital-based, liquidity and some
other Financial Soundness Indicators, was adjusted according to Third Basel Accord (so called Basel
III) that represents a global, voluntary regulatory standards on bank capital adequacy, stress testing
and market liquidity risk (IMF, 2013). The current list of FSI for deposit takers, other financial
corporations, non-financial corporations, households and real estate markets, both core set and
additional set, is represented in Appendix B. One of the advantages of FSIs by IMF is international
comparability.
9 For more information see Basel III: The liquidity coverage ratio and liquidity risk monitoring tools, January 2013,
BIS 10
For more information see Basel III: the net stable funding ratio, October 2014
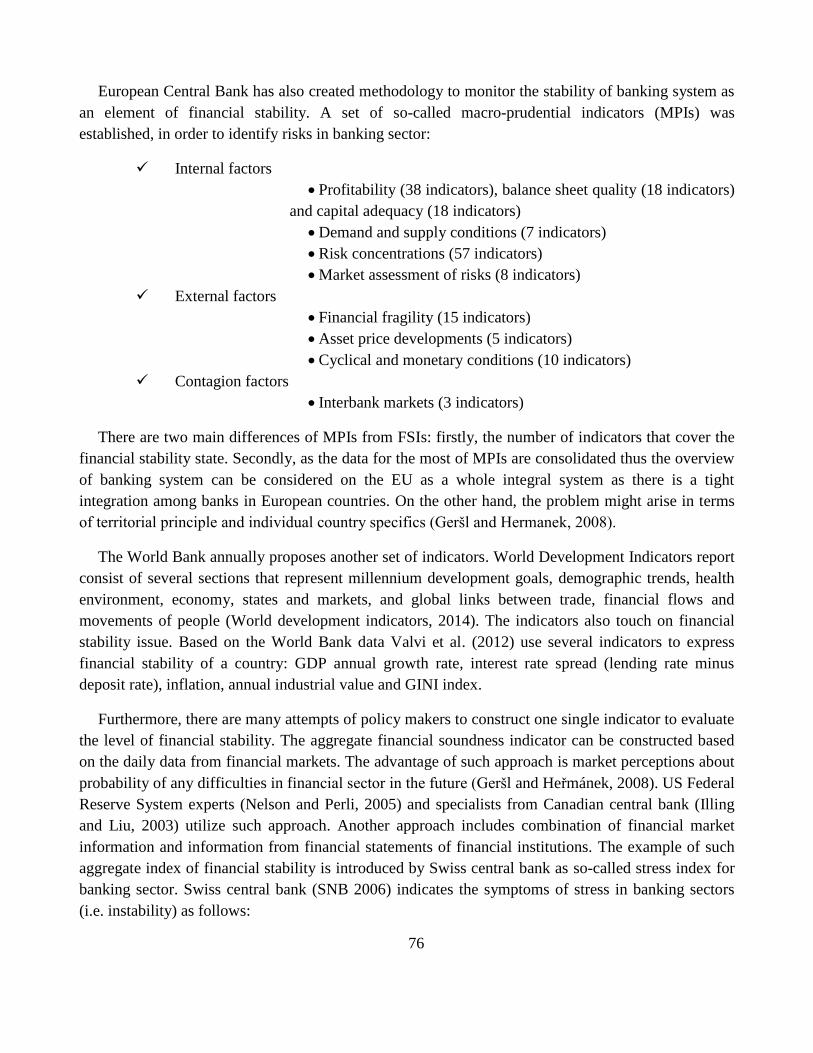
76
European Central Bank has also created methodology to monitor the stability of banking system as
an element of financial stability. A set of so-called macro-prudential indicators (MPIs) was
established, in order to identify risks in banking sector:
Internal factors
Profitability (38 indicators), balance sheet quality (18 indicators)
and capital adequacy (18 indicators)
Demand and supply conditions (7 indicators)
Risk concentrations (57 indicators)
Market assessment of risks (8 indicators)
External factors
Financial fragility (15 indicators)
Asset price developments (5 indicators)
Cyclical and monetary conditions (10 indicators)
Contagion factors
Interbank markets (3 indicators)
There are two main differences of MPIs from FSIs: firstly, the number of indicators that cover the
financial stability state. Secondly, as the data for the most of MPIs are consolidated thus the overview
of banking system can be considered on the EU as a whole integral system as there is a tight
integration among banks in European countries. On the other hand, the problem might arise in terms
of territorial principle and individual country specifics (Geršl and Hermanek, 2008).
The World Bank annually proposes another set of indicators. World Development Indicators report
consist of several sections that represent millennium development goals, demographic trends, health
environment, economy, states and markets, and global links between trade, financial flows and
movements of people (World development indicators, 2014). The indicators also touch on financial
stability issue. Based on the World Bank data Valvi et al. (2012) use several indicators to express
financial stability of a country: GDP annual growth rate, interest rate spread (lending rate minus
deposit rate), inflation, annual industrial value and GINI index.
Furthermore, there are many attempts of policy makers to construct one single indicator to evaluate
the level of financial stability. The aggregate financial soundness indicator can be constructed based
on the daily data from financial markets. The advantage of such approach is market perceptions about
probability of any difficulties in financial sector in the future (Geršl and Heřmánek, 2008). US Federal
Reserve System experts (Nelson and Perli, 2005) and specialists from Canadian central bank (Illing
and Liu, 2003) utilize such approach. Another approach includes combination of financial market
information and information from financial statements of financial institutions. The example of such
aggregate index of financial stability is introduced by Swiss central bank as so-called stress index for
banking sector. Swiss central bank (SNB 2006) indicates the symptoms of stress in banking sectors
(i.e. instability) as follows:
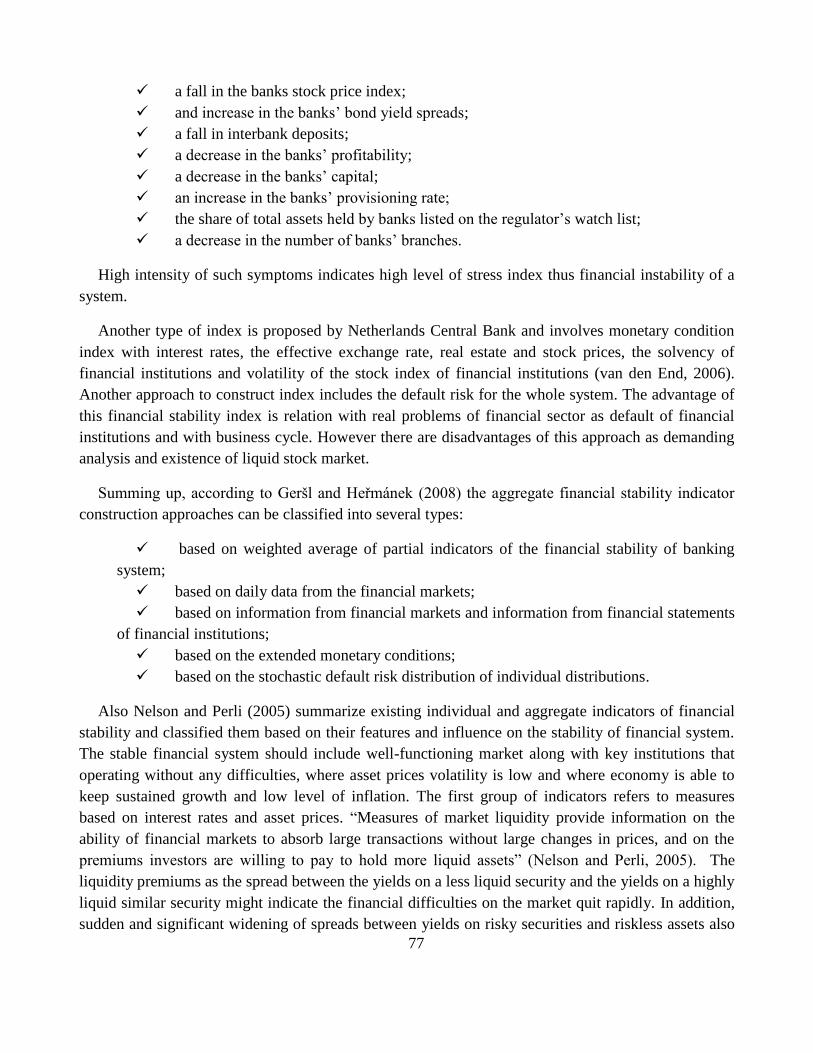
77
a fall in the banks stock price index;
and increase in the banks’ bond yield spreads;
a fall in interbank deposits;
a decrease in the banks’ profitability;
a decrease in the banks’ capital;
an increase in the banks’ provisioning rate;
the share of total assets held by banks listed on the regulator’s watch list;
a decrease in the number of banks’ branches.
High intensity of such symptoms indicates high level of stress index thus financial instability of a
system.
Another type of index is proposed by Netherlands Central Bank and involves monetary condition
index with interest rates, the effective exchange rate, real estate and stock prices, the solvency of
financial institutions and volatility of the stock index of financial institutions (van den End, 2006).
Another approach to construct index includes the default risk for the whole system. The advantage of
this financial stability index is relation with real problems of financial sector as default of financial
institutions and with business cycle. However there are disadvantages of this approach as demanding
analysis and existence of liquid stock market.
Summing up, according to Geršl and Heřmánek (2008) the aggregate financial stability indicator
construction approaches can be classified into several types:
based on weighted average of partial indicators of the financial stability of banking
system;
based on daily data from the financial markets;
based on information from financial markets and information from financial statements
of financial institutions;
based on the extended monetary conditions;
based on the stochastic default risk distribution of individual distributions.
Also Nelson and Perli (2005) summarize existing individual and aggregate indicators of financial
stability and classified them based on their features and influence on the stability of financial system.
The stable financial system should include well-functioning market along with key institutions that
operating without any difficulties, where asset prices volatility is low and where economy is able to
keep sustained growth and low level of inflation. The first group of indicators refers to measures
based on interest rates and asset prices. “Measures of market liquidity provide information on the
ability of financial markets to absorb large transactions without large changes in prices, and on the
premiums investors are willing to pay to hold more liquid assets” (Nelson and Perli, 2005). The
liquidity premiums as the spread between the yields on a less liquid security and the yields on a highly
liquid similar security might indicate the financial difficulties on the market quit rapidly. In addition,
sudden and significant widening of spreads between yields on risky securities and riskless assets also
78
signals the indications of financial turmoil. The option prices also might be used as an indicator of
instability through investors’ uncertainty. For instance, the options on Eurodollar futures represent the
expected volatility of short-term rates, which increase with investors’ uncertainty about future course
of monetary policy. The risks, liquidity, term spreads, market volatilities significantly increase during
financial instability thus the aggregate financial fragility indicator based on the information about the
changes of these variables might be utilized as measure of financial instability. The financial fragility
indicator assesses the probability of default or appearance of stress in economy. Furthermore, the
mortgage market indicators are considered as measures of financial stability through their impact on
long-term interest rates. Especially after Global Financial Crisis 2007/2008, where the mortgages
crisis in USA gave an impulse to Global Financial Crisis 2007/2008, the instability of mortgage
market might be significant indication of current and future problems in whole financial system.
Firstly, there are mortgage indicators that represent the duration of fix-rate mortgages. Secondly, there
are indicators that stand for convexity, i.e. the amount by which duration might change following 100
bps change in yields. The information on MBS duration and convexity might be applied to evaluate a
degree of mortgage-related hedging flows influence on the long-term interest rates shocks. The
conditions of individual institutions also play significant role in financial stability of economy. The
banks as financial intermediaries can transmit the financial problems to non-financial organizations
and household by the means of aggressive lending practices or on the contrary credit restrictions.
However nowadays Central Banks are able to maintain the soundness of financial organization in
some degree. At the same time, the stability of non-financial institutions also should be monitored as
an element of the system. The most frequent used indicators are commercial papers, corporate bonds,
and credit default swap spreads. As probability of default of an individual institution indicates the
degree of financial system stability then the probability of default of multiple entities might have
greater influence on the soundness of economy.
The main objective of financial stability indicators is to provide the concerned parties the idea bout
soundness of the financial system in a constructive and precise way. The profitability indicators
indicate the ability of the system to absorb losses without any impact on capital. The liquidity
indicators determine resilience of banking system to cash flow shocks. The foreign currency exposure
indicators measure risk exposure of banking system in terms of movements in asset prices on financial
markets (Geršl and Hermanek, 2008).
79
Chapter 5 Methodology and research design
The Chapter 5 describes the research methodology and design applied in this dissertation work.
The first part of this chapter deals with research paradigm including nature of research, its type and
approaches used in this study. Then the process of research question and hypothesis development are
presented. The third part is dedicated to primary research design with its instrumentation. The last
section deals with index construction modelling.
The scientific research is subject to specific ideals and norms, which represent generalized
conceptualizations of research aims and approaches. These ideals and norms of scientific knowledge
are the set of defined conceptual, value, methodological and other purposes of scientific research. The
combinations of different types of ideals, norms and perceptions of reality created through the
historical evaluation of scientific research stand for paradigms. The term paradigm became popular
after the works of Thomas Kuhn, who determines paradigm as scientific achievements that give to
scientific community the model of problem statement and examples of its solution (theories, rules,
methods, approaches, symbolic structures, metaphysical conceptual foundations of models of values).
A philosopher Jürgen Habermas understands paradigm as a set of researcher’s interest. In contrast
Paul Feyerabend denies the existence and necessity of paradigms and believes in concept of
“epistemological anachronism”. Stepin V.S. argues that paradigm is a type of rationality,
intrascientific strategy, the foundation of science, namely ideals and norms, world view, philosophical
underpinnings ( Kotenko, 2006).
The term paradigm can be interpreted in different ways, in the present dissertation work the
paradigm is considered as a type of research concept with a set of specific methods and techniques. In
modern theory there are two main paradigms positivist (or quantitative) and phenomenologist (or
qualitative) (Collins and Hussey, 2003). The present study tends to positivist research paradigm,
where environment is considered between two stages of continuum: a concrete process and the
contextual field of information (according to Morgan and Smircich, 1980). Logical reasoning,
precision, objectivity and rigour are peculiar to positivism paradigm.
The Figure 6 represents the conceptual framework of the research including specific steps of the
scientific work. The first step is to identify research problem. The research problem of current work is
influence of internal and external factors on the cost of equity capital from the corporate point of
view. The next step the development of theoretical framework is a fundamental part of research,
which support the explanation of research questions and determination of hypothesis. The critical
literature review of published previous studies on the investigated theme is conducted. Based on
literature review and composed theoretical background the research questions and hypothesis are
determined. In order to answer the indicated questions and test hypothesis the data should be
collected. The next step is data analysis of achieved results. The final step stands for results
application.
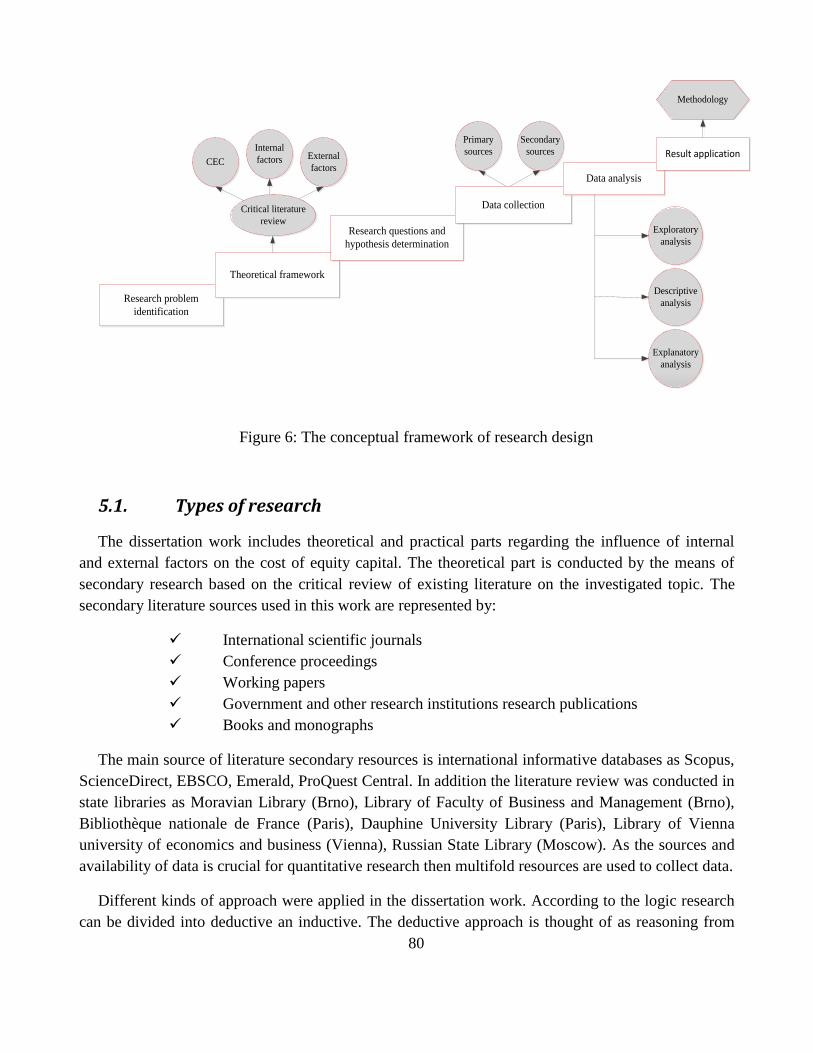
80
Research problem
identification
Theoretical framework
Critical literature
review
Internal
factorsCECExternal
factors
Research questions and
hypothesis determination
Data collection
Primary
sources
Secondary
sources
Data analysis
Result application
Exploratory
analysis
Descriptive
analysis
Explanatory
analysis
Methodology
Figure 6: The conceptual framework of research design
5.1. Types of research
The dissertation work includes theoretical and practical parts regarding the influence of internal
and external factors on the cost of equity capital. The theoretical part is conducted by the means of
secondary research based on the critical review of existing literature on the investigated topic. The
secondary literature sources used in this work are represented by:
International scientific journals
Conference proceedings
Working papers
Government and other research institutions research publications
Books and monographs
The main source of literature secondary resources is international informative databases as Scopus,
ScienceDirect, EBSCO, Emerald, ProQuest Central. In addition the literature review was conducted in
state libraries as Moravian Library (Brno), Library of Faculty of Business and Management (Brno),
Bibliothèque nationale de France (Paris), Dauphine University Library (Paris), Library of Vienna
university of economics and business (Vienna), Russian State Library (Moscow). As the sources and
availability of data is crucial for quantitative research then multifold resources are used to collect data.
Different kinds of approach were applied in the dissertation work. According to the logic research
can be divided into deductive an inductive. The deductive approach is thought of as reasoning from
81
general to particular. The research with deductive approach explores an existing theory, creates a set
of hypothesis, tests them with observations and in the end confirm or reject assigned hypothesis. The
opposite approach in terms of research logic is inductive approach, which begins with observations.
The inductive approach searches patterns from observations, which are developed into tentative
hypothesis and consequently reaches the conclusions, i.e. theory. Thus two types of research
deductive and inductive were applied in this dissertation work. The first one is used to generate the
hypothesis based on the critical literature review and verify them after. Moreover, the inductive
approach is used to generalize the research results and come to conclusion.
In terms of the purpose of research several types of research are applied as
Exploratory: research problem investigation, literature review
Descriptive: primary research
Explanatory (or analytical): evaluation of findings and creation of methodology
The main aim of exploratory research is to search for patterns, ideas or hypothesis, when the
investigated topic is not discovered in a full extent. According to exploratory research approach a
hypothesis is represented by idea that is tested for association or causality by extrapolating the
conclusion, which in turn can be explored towards empirical evidence. In this dissertation work the
exploratory approach was applied to search for internal and external factors that might influence the
cost so equity capital and investigate the direction of their influence on CEC.
The descriptive research approach is dedicated to deeper problem examination. It identifies and
obtains required information on the specific problem. The descriptive approach is applied to identify
the importance of external and internal factors in terms of CEC from the corporate managers’ point of
view. Besides the degree of influence of investigated relations (i.e. external and internal factors and
CEC) can be examined by the means of descriptive approach.
The explanatory (or analytical) represents the extension of descriptive research approach. The goal
of this kind of research is not only to describe the characteristics of the specific issue, but also to
analyse and explain the causes of association (Collins and Hussey, 2003). The analytical approach is
applied, in order to analyse the found relations and expert evaluations, test and explain the finding and
consequently create a methodology based on the discovered results.
As was mentioned before this research represents positivist (or quantitative) paradigm. At the
same time in the context of the process of the current research the quantitative approach is chosen, in
order to collect primary data on the investigated relations, which can be applied in further analysis.
The quantitative research is applied for the purpose of survey and further statistical analysis of results
and their application. The main advantage of quantitative approach is depth and accuracy of
conclusions and generalization. Several features of quantitative approach can be identified:
Utilization of numeric data
82
Utilization of standard data processing activities
Segregation of variables or categories of investigated object before the stage of
analysing
Average rates handling to determine variables
Generalization at the stage of analysis and attempts to discover cross-functional
patterns (Kasheeva, 2013).
Hereafter the outcome of research can be classified into fundamental and applied. The fundamental
research extends the theoretical knowledge of the investigated subject, while applied research is
focused on specific problems and their solutions. The present research attempts to fill the gap between
theory and practice on the theme of internal and external factors and their influence on the CEC and
thus to reevaluate the existing associations and facilitate the theory expansion and further research. On
the other hand the applied type of research is represented by the practical outcome. The applied
research is conducted in order to support the decision making process in the complicated area of
equity capital management and specifically in the area of cost of equity capital minimization.
5.2. Critical literature review as theoretical background
The literature review is essential in research as it provides a solid theoretical background, which
supports the development of research questions and further set of hypothesis. The first step of
literature review includes the investigation of existing literature on the research topic, in order to
identify the problems and gaps in scientific knowledge. The next step devotes to deeper literature
analysis, where the previous studies are analysed more precisely, in order to identify the existing
relations, causes and consequences of analysed phenomena.
The research topic is defined as influence of internal and external factors on the cost of equity
capital. The first part of literature is dedicated to internal factors that have impact on the cost of equity
capital. The internal factors are factors associated with corporate activities and can be managed by
managers. The internal factors can be classified in several categories: corporate disclosure, corporate
governance and social factors. However there is one singular factor that can be represented as a
linkage between many factors and the cost of equity capital. According to literature research the
information asymmetry is one of the significant factors that influence the cost of equity capital
directly. The lower information asymmetry leads to lower costs of equity capital. The corporate
disclosure is tightly related to information asymmetry. Higher corporate disclosure leads to lower
information asymmetry that in turn decreases the cost of equity capital. The corporate disclosure
policy is design to increase transparency and decrease information asymmetry that in turn is reflected
in company’s performance. The disclose can be presented as individual factors, but it can include
several separate internal factors that have their own degree of influence on the cost of equity capital
and that were analysed separately and consequently manage by managers. Besides researchers usually
construct accumulative corporate disclosure indexes that including different variables that influence
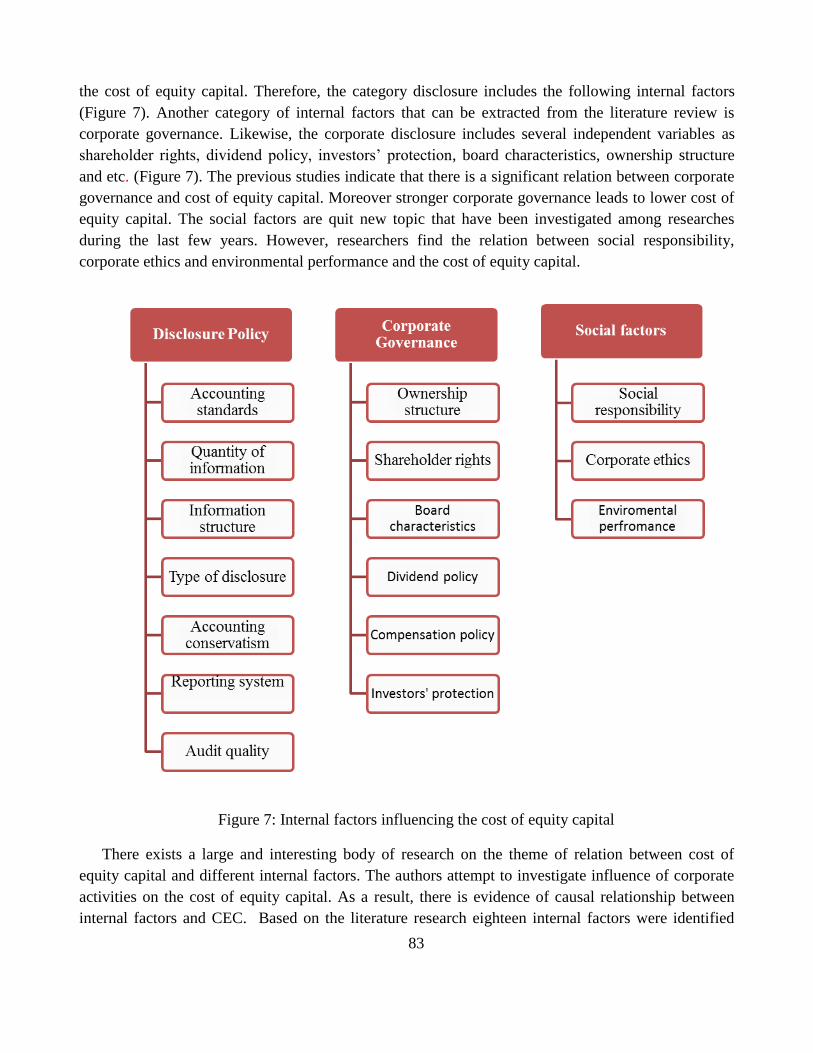
83
the cost of equity capital. Therefore, the category disclosure includes the following internal factors
(Figure 7). Another category of internal factors that can be extracted from the literature review is
corporate governance. Likewise, the corporate disclosure includes several independent variables as
shareholder rights, dividend policy, investors’ protection, board characteristics, ownership structure
and etc. (Figure 7). The previous studies indicate that there is a significant relation between corporate
governance and cost of equity capital. Moreover stronger corporate governance leads to lower cost of
equity capital. The social factors are quit new topic that have been investigated among researches
during the last few years. However, researchers find the relation between social responsibility,
corporate ethics and environmental performance and the cost of equity capital.
Figure 7: Internal factors influencing the cost of equity capital
There exists a large and interesting body of research on the theme of relation between cost of
equity capital and different internal factors. The authors attempt to investigate influence of corporate
activities on the cost of equity capital. As a result, there is evidence of causal relationship between
internal factors and CEC. Based on the literature research eighteen internal factors were identified
84
that should influence the cost of equity capital. In accordance with the findings of previous studies the
hypothesis are set to be tested in the further step of research.
The influence of external factors on the cost of equity capital is not discovered in a full extent as
the impact of internal factors. Only recent years a few studies have made attempt to evaluate the
direct influence of external factors on the cost of equity capital. However, financial performance
including the cost of equity capital varies based on the changes in the macroeconomical conditions
and the state of economy. The external factors are investigated as a set of variables that indicate the
state of financial stability of the system, where a company operates. The external factors also can be
classified in separate categories based on their nature. These categories represent the state polices as
monetary, fiscal, macroprudential. The combination of external factors and the level of their
development represent the state of economy. The five stages of economy as recession, stagnation,
stability, expansion and overheated economy are identified.
The literature analysis identifies many existing studies that investigate the influence of individual
internal factors (or at least categories) on the cost of equity capital. However the results show the
influence of one separate factor without taking into consideration the existence of other factors.
Moreover the managers would find difficult to combine and integrate these findings into their decision
making process. In another words the knowledge regarding the influence of internal factors on the
cost of equity capital exists but widely spread that decrease its value on practice.
5.3. The research questions and hypothesis
The research question has the substantial significance in any kind of research. By the means of in-
depth literature review the research questions are identified, which represent the object of the present
research. As shown on the Figure 7 the process of research question development has several steps
from the literature review on the research topic through brainstorming to final identification of
research questions and creation of hypothesis. The set of hypothesis represent the attempt to answer
those arisen questions of research. More precisely hypotheses are established for primary research
purpose.
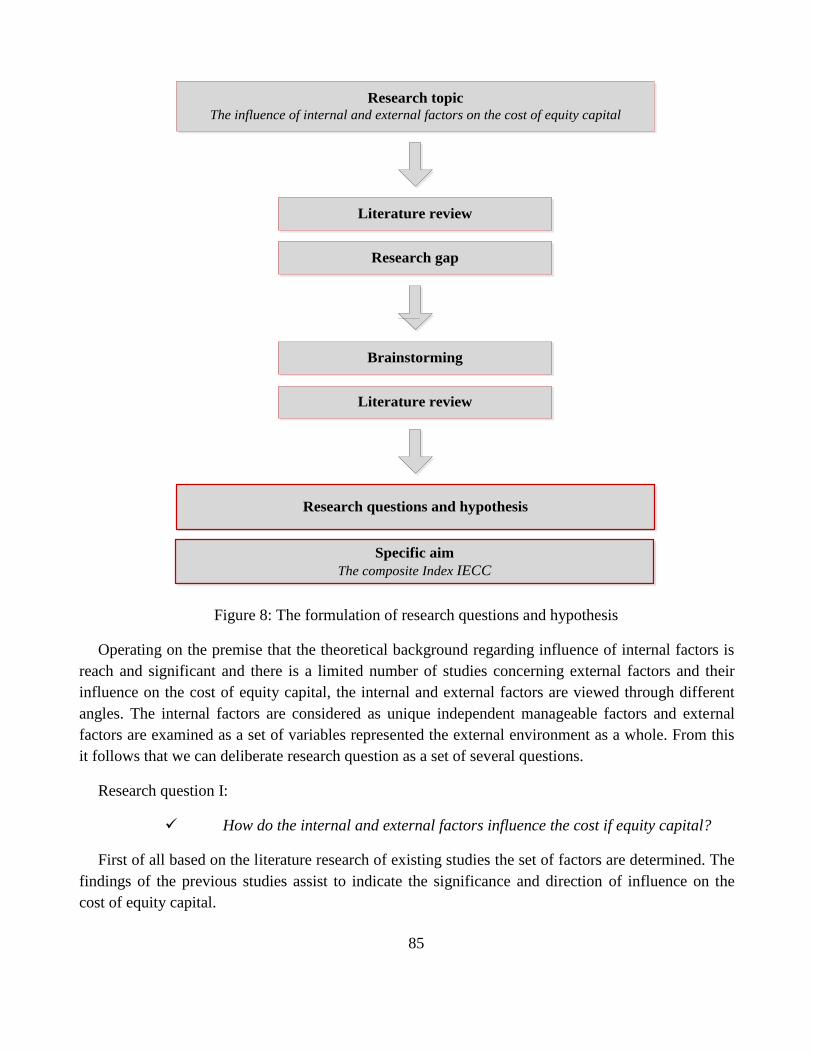
85
Research topic
The influence of internal and external factors on the cost of equity capital
Literature review
Research gap
Literature review
Brainstorming
Research questions and hypothesis
Specific aim
The composite Index IECC
Figure 8: The formulation of research questions and hypothesis
Operating on the premise that the theoretical background regarding influence of internal factors is
reach and significant and there is a limited number of studies concerning external factors and their
influence on the cost of equity capital, the internal and external factors are viewed through different
angles. The internal factors are considered as unique independent manageable factors and external
factors are examined as a set of variables represented the external environment as a whole. From this
it follows that we can deliberate research question as a set of several questions.
Research question I:
How do the internal and external factors influence the cost if equity capital?
First of all based on the literature research of existing studies the set of factors are determined. The
findings of the previous studies assist to indicate the significance and direction of influence on the
cost of equity capital.
86
The second research question arises due to the fact that there are many studies concerning the
influence of internal factors, where the managers can be lost. On the other hand, there are few studies
that show the direct influence of the external factors on the cost of equity capital. Needless to say,
there is still a gap between theory and practice (real economy). The theory is based on assumptions
that do not satisfy the real economic situation. Moreover, the corporate managers might be not aware
of research findings in the scientific sphere in terms of capital costs management. Thus, the second
question is arisen.
Research question II:
Is there a gap between theory and practice in terms of influence the internal
and external factors on the cost of equity capital?
In order to answer the first two questions, the comprehensive literature analysis is conducted. The
critical review indicates a set of internal and external factors and stages of financial stability of a
country. Towards the attempt to answer the raised questions several hypotheses are created. Based on
the purpose of this paper to create an aggregate index the analysed internal factors are combined in
three categories driven by their common nature. The external factors are transformed into the
development state of economy. Hypotheses are stated in the alternative form:
H1.1. There is significant negative influence of corporate disclosure on the cost of
equity capital.
H1.2. There is significant negative influence of corporate governance on the cost of
equity capital.
H1.3 There is significant negative influence of social factors on the cost of equity
capital.
H1.4 The recession as a state of economy leads to lower cost of equity capital.
The hypotheses are tested based on the conducted primary survey. The rejection of null hypothesis
can answer the second question. If the H0 is rejected then the theory is congruent with practice and
there is no gap. But if H0 is accepted than there is a possibility of knowledge gap between theory and
practice regarding the influence of specific factor on the cost of equity capital. The Chi-Squared Test
and one-sample Kolmogorov-Smirnov test were applied to test hypothesis.
Research question III:
How a company can reduce its cost of equity capital?
The third question is directly connected with the main aim of this paper to help a company reduce
its cost of equity capital by the means of internal and external factors. By the means of the secondary
and primary research the knowledge on the relation between internal and external factors and the CEC
87
is accumulated from theory and practice and transformed into a methodology that support corporate
decision making process in CEC reduction.
5.4. Primary research: survey
The survey has been chosen as a research strategy to gain primary data. The main aim of the survey
is to find the influence of the internal and external factors on the cost of equity capital and evaluate the
level of agreement between theory and practice. The survey is associated with deductive approach. It
is a popular instrument in research to collect primary data. It tends to be applied for exploratory and
descriptive research. According to Saunders et al. (2003) there are several advantages and
disadvantages of the survey:
Advantages:
ability collect large amount of data from a sizeable population
ability to compare with other studies in the field
highly economical
reliability
ability to control the collection process
Disadvantages:
time-consuming
possible software necessity
questions limitation
As a tool of survey the self-administrated questionnaire is applied in the conducted primary
research, which is divided into on-line questionnaire and postal questionnaire. In another words the
respondents receive a questionnaire by e-mail or regular post, fill the form and send back using the
same delivery method. The questionnaire as a research strategy is chosen due to several factors as
anonymity, respondent availability, simplicity form the respondents’ point of view and simplicity in
data coding and further statistical analysis.
In order to test the instrumentation of questionnaire, intelligibility of questions and to ensure an
appropriate response rate, the pilot survey was undertaken. The pilot survey was conducted in autumn
2011 by the means of direct e-mailing to selected sample of private non-financial joint-stock
companies. The pilot survey helped to correct the questions, design of questionnaires, the tools and
approaches. Afterwards, in order to receive representative and reliable primary data the several steps
were conducted (Table 11).
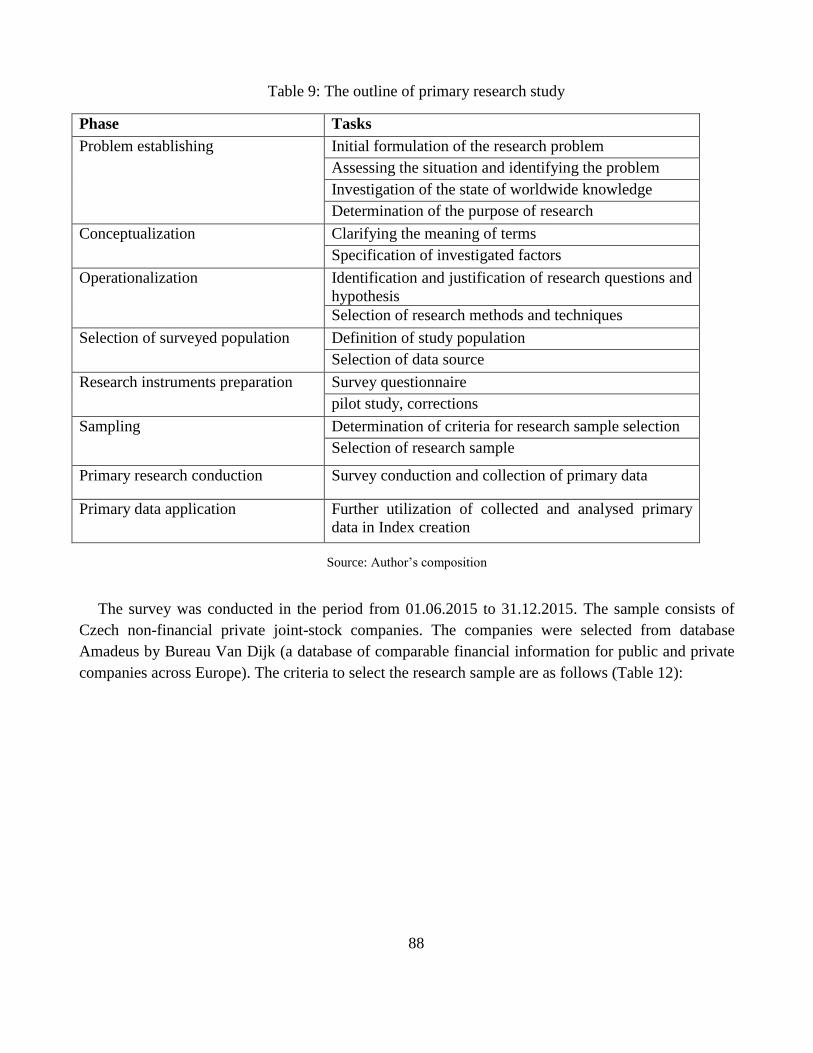
88
Table 9: The outline of primary research study
Phase Tasks
Problem establishing Initial formulation of the research problem
Assessing the situation and identifying the problem
Investigation of the state of worldwide knowledge
Determination of the purpose of research
Conceptualization Clarifying the meaning of terms
Specification of investigated factors
Operationalization Identification and justification of research questions and
hypothesis
Selection of research methods and techniques
Selection of surveyed population Definition of study population
Selection of data source
Research instruments preparation Survey questionnaire
pilot study, corrections
Sampling Determination of criteria for research sample selection
Selection of research sample
Primary research conduction Survey conduction and collection of primary data
Primary data application Further utilization of collected and analysed primary
data in Index creation
Source: Author’s composition
The survey was conducted in the period from 01.06.2015 to 31.12.2015. The sample consists of
Czech non-financial private joint-stock companies. The companies were selected from database
Amadeus by Bureau Van Dijk (a database of comparable financial information for public and private
companies across Europe). The criteria to select the research sample are as follows (Table 12):
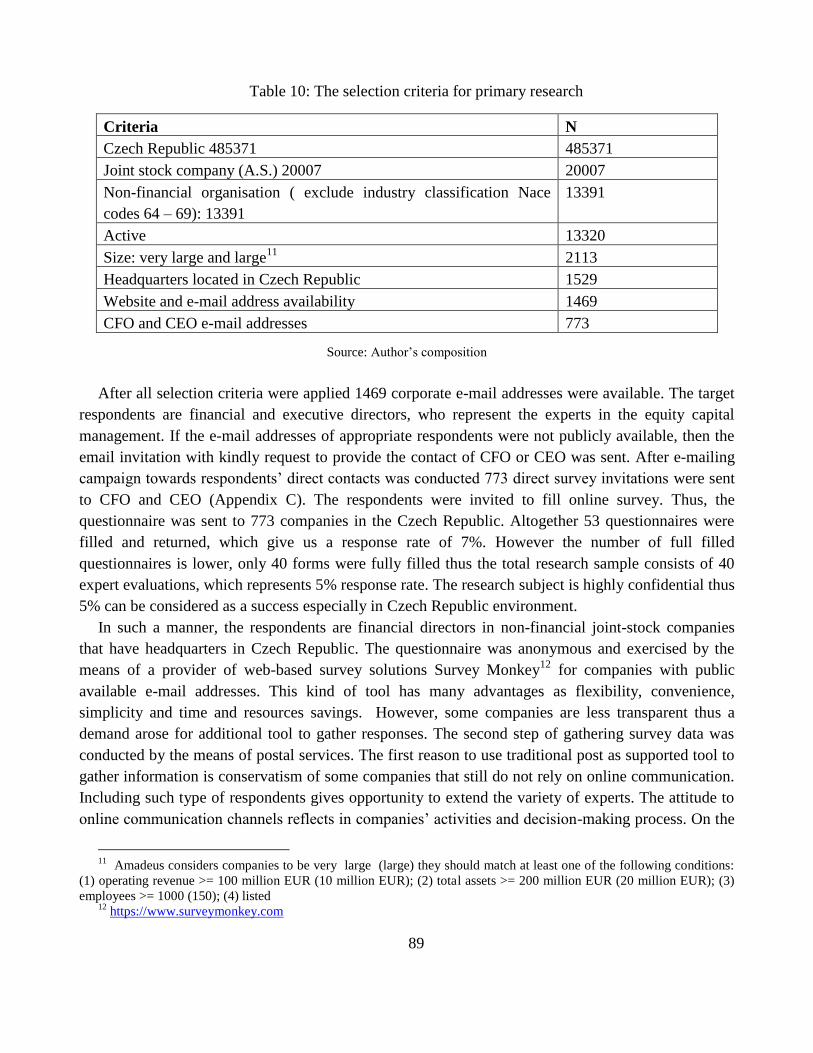
89
Table 10: The selection criteria for primary research
Criteria N
Czech Republic 485371 485371
Joint stock company (A.S.) 20007 20007
Non-financial organisation ( exclude industry classification Nace
codes 64 – 69): 13391
13391
Active 13320
Size: very large and large11
2113
Headquarters located in Czech Republic 1529
Website and e-mail address availability 1469
CFO and CEO e-mail addresses 773
Source: Author’s composition
After all selection criteria were applied 1469 corporate e-mail addresses were available. The target
respondents are financial and executive directors, who represent the experts in the equity capital
management. If the e-mail addresses of appropriate respondents were not publicly available, then the
email invitation with kindly request to provide the contact of CFO or CEO was sent. After e-mailing
campaign towards respondents’ direct contacts was conducted 773 direct survey invitations were sent
to CFO and CEO (Appendix C). The respondents were invited to fill online survey. Thus, the
questionnaire was sent to 773 companies in the Czech Republic. Altogether 53 questionnaires were
filled and returned, which give us a response rate of 7%. However the number of full filled
questionnaires is lower, only 40 forms were fully filled thus the total research sample consists of 40
expert evaluations, which represents 5% response rate. The research subject is highly confidential thus
5% can be considered as a success especially in Czech Republic environment.
In such a manner, the respondents are financial directors in non-financial joint-stock companies
that have headquarters in Czech Republic. The questionnaire was anonymous and exercised by the
means of a provider of web-based survey solutions Survey Monkey12
for companies with public
available e-mail addresses. This kind of tool has many advantages as flexibility, convenience,
simplicity and time and resources savings. However, some companies are less transparent thus a
demand arose for additional tool to gather responses. The second step of gathering survey data was
conducted by the means of postal services. The first reason to use traditional post as supported tool to
gather information is conservatism of some companies that still do not rely on online communication.
Including such type of respondents gives opportunity to extend the variety of experts. The attitude to
online communication channels reflects in companies’ activities and decision-making process. On the
11
Amadeus considers companies to be very large (large) they should match at least one of the following conditions:
(1) operating revenue >= 100 million EUR (10 million EUR); (2) total assets >= 200 million EUR (20 million EUR); (3)
employees >= 1000 (150); (4) listed 12
https://www.surveymonkey.com
90
other hand companies that broadly use web-sites, e-mails, social net-works, i.e. digital competent,
have higher corporate disclosure and are more forward-looking that in turn contributes in their
decision-making process. Therefore applying traditional (post) and modern (online based surveys)
tools of gathering information provides ability to cover different types of respondents from disclosure
and conservatism point of view.
As there are two types of questionnaire mail and online the online version has several advantages
and specific survey tools. In the online version, there were applied different tools of questions’
visualization, in order to make the questions more understandable for respondents and more
informative for further analysis of obtained data. These tools are multiple textboxes, answer choices,
multiple choice, matrix with rating scale, matrix of dropdown menus, comment box. In the key
questions regarding internal and external factors, the respondents in their questionnaire applied direct
valuation or so called point-factor evaluation approach. The respondents were able to evaluation the
significance of individual factors. The detailed description of conducted survey is presented in
Chapter 5 with questionnaire represented in Appendix D.
In order to perform further sophisticated analysis the primary research results were coded into one
unique scale for the purpose of comparability.
One of the crucial characteristics of primary research is it credibility. In another words the quality
of research is essential, as its findings will be applied in theory and practice. As a rule, the credibility
of research is represented by reliability and validity of research. The reliability corresponds to
repeatability of obtained observations or results of research. Joppe (2000) determines reliability as
“the extent to which results are consistent over time and an accurate representation of the total
population under study is referred to as reliability and if the results of a study can be reproduced under
a similar methodology, then the research instrument is considered to be reliable”. He also provides the
explanation of validity in quantitative research: “Validity determines whether the research truly
measures that which it was intended to measure or how truthful the research results are. In other
words, does the research instrument allow you to hit “the bull’s eye” of your research object?
Researchers generally determine validity by asking a series of questions, and will often look for the
answers in the research of others”. The credibility (reliability and validity) of the present research can
be evaluated through several aspects. First of all, the in-depth analysis of previous studies on the
investigated issue creates a solid theoretical background of research problem, facilitates to find out
specific required variables and determine their measures. The previous qualified surveys on the theme
of cost of equity capital are taken into consideration, in order to compose reliable questions in
questionnaire.
In order to evaluate the consistency reliability of primary data the reliability analysis by the means
of Cronbach’s alpha was conducted. The table 12 presents the reliability statistics on the primary data.
The reliability analysis is calculated by SPSS software applying the following formula:
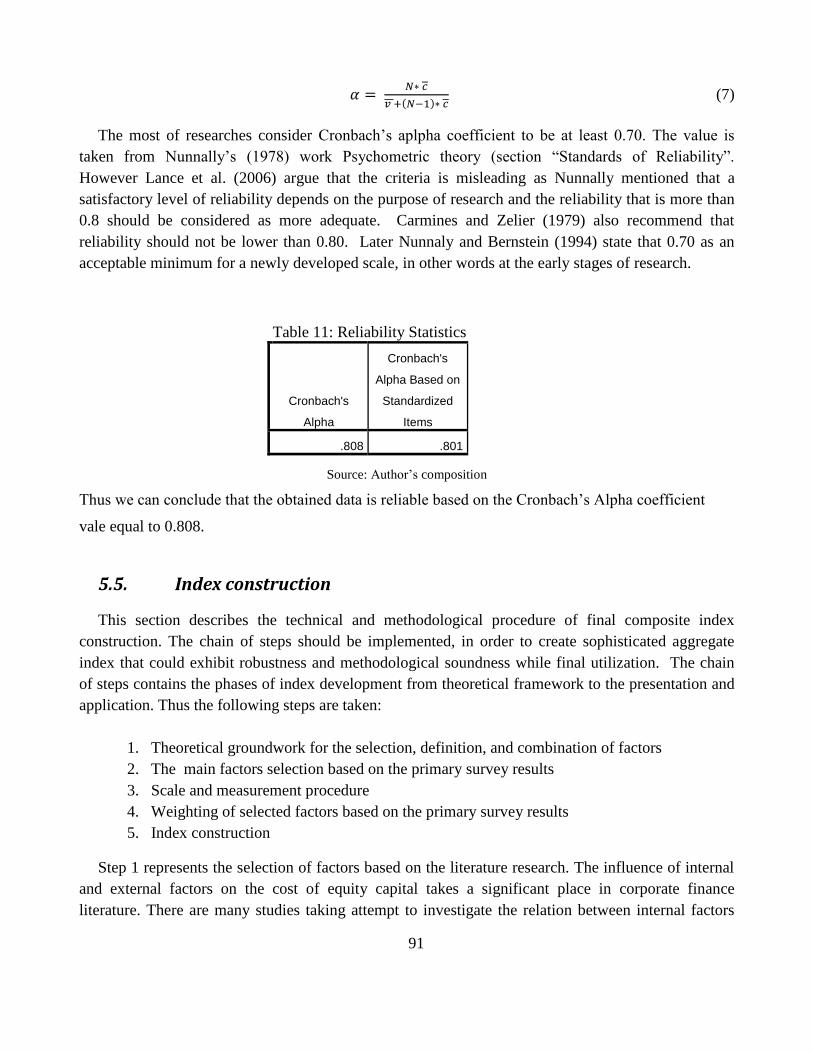
91
(7)
The most of researches consider Cronbach’s aplpha coefficient to be at least 0.70. The value is
taken from Nunnally’s (1978) work Psychometric theory (section “Standards of Reliability”.
However Lance et al. (2006) argue that the criteria is misleading as Nunnally mentioned that a
satisfactory level of reliability depends on the purpose of research and the reliability that is more than
0.8 should be considered as more adequate. Carmines and Zelier (1979) also recommend that
reliability should not be lower than 0.80. Later Nunnaly and Bernstein (1994) state that 0.70 as an
acceptable minimum for a newly developed scale, in other words at the early stages of research.
Table 11: Reliability Statistics
Cronbach's
Alpha
Cronbach's
Alpha Based on
Standardized
Items
.808 .801
Source: Author’s composition
Thus we can conclude that the obtained data is reliable based on the Cronbach’s Alpha coefficient
vale equal to 0.808.
5.5. Index construction
This section describes the technical and methodological procedure of final composite index
construction. The chain of steps should be implemented, in order to create sophisticated aggregate
index that could exhibit robustness and methodological soundness while final utilization. The chain
of steps contains the phases of index development from theoretical framework to the presentation and
application. Thus the following steps are taken:
1. Theoretical groundwork for the selection, definition, and combination of factors
2. The main factors selection based on the primary survey results
3. Scale and measurement procedure
4. Weighting of selected factors based on the primary survey results
5. Index construction
Step 1 represents the selection of factors based on the literature research. The influence of internal
and external factors on the cost of equity capital takes a significant place in corporate finance
literature. There are many studies taking attempt to investigate the relation between internal factors
92
and the cost of equity capital through different angles. These studies are taken as theoretical
background for internal factors selection, their definitions and impact on the cost of equity capital.
However, there are few studies that analyze the direct influence of external factors on the cost of
capital. Thus the external factors were considered as a combination of macro-economic conditions
that reflect the state of financial stability of a country. Consequently the state of economy influences
the level of capital costs. Thus the Step 1 indicates the pronounced background for aggregate index
creation.
Step 2 By the means of literature review and primary survey the selected factors were chosen to be
implemented in the aggregate index.
Step 3 deals with scale adjustments, measurement unit problems and suitable data normalization
procedure. The numerical values of Index are in the [0;1] range, where values close to zero represents
a week and unstable condition (i.e. the level of factor development), while those values that are close
to the opposite extreme (respectively 1) represent strong and stable value states. The main purpose of
such transformation is to make factors flexible for further integration into final Index. Besides, the
numerical values of final Index in unified scale make Index comparable and facilitated for practical
application and further analysis.
Step 4 stands for weighting the factors by the means of primary survey. Based on the expert
evaluations collected by the utilizing questionnaire the weights of selected factors were determined.
The weights are the measures of importance from the point of view of corporate financial directors
and executives.
The final step 5 reflects the index construction, where all weighted factors are aggregated into the
final index. In the last step the robustness of the index is checked.
There is an additional step that has not been included into the chain of index construction, however,
plays a significant role in index application. The last phase is to simulate the different scenarios of
Index utilization. The simulation shows different types of outcomes and recommendations to three
modelled companies with different levels of internal factors development and under changing
macroeconomic conditions.
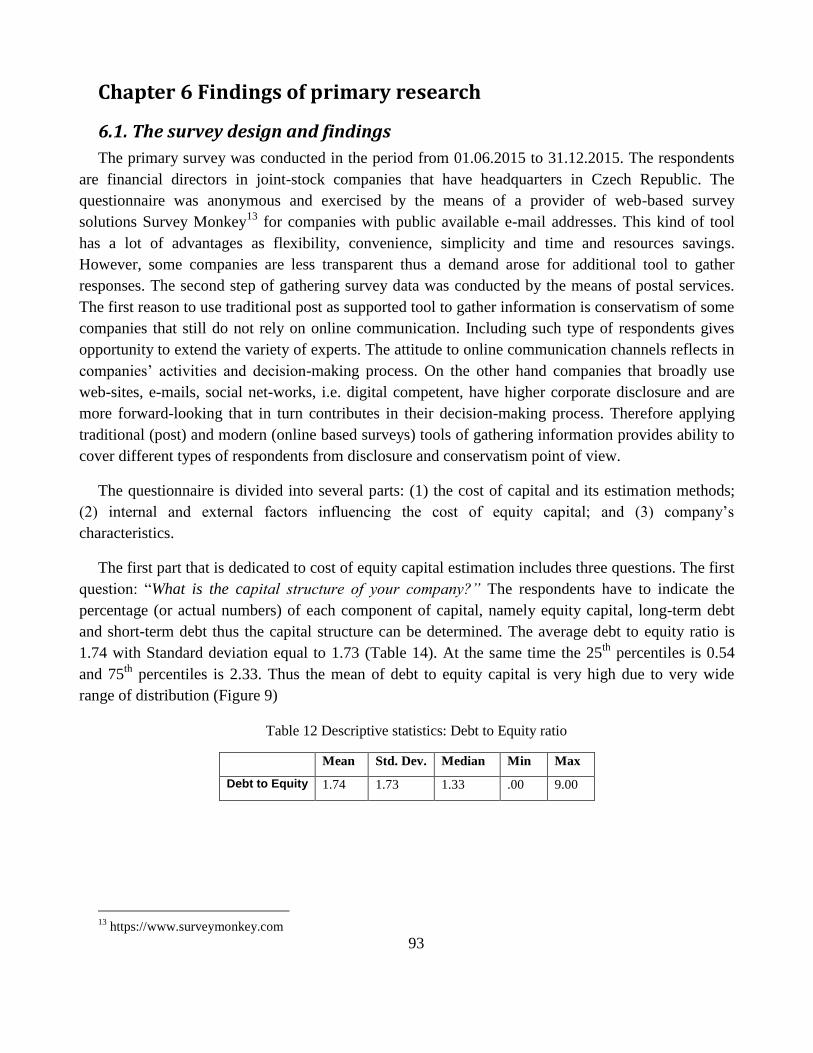
93
Chapter 6 Findings of primary research
6.1. The survey design and findings
The primary survey was conducted in the period from 01.06.2015 to 31.12.2015. The respondents
are financial directors in joint-stock companies that have headquarters in Czech Republic. The
questionnaire was anonymous and exercised by the means of a provider of web-based survey
solutions Survey Monkey13
for companies with public available e-mail addresses. This kind of tool
has a lot of advantages as flexibility, convenience, simplicity and time and resources savings.
However, some companies are less transparent thus a demand arose for additional tool to gather
responses. The second step of gathering survey data was conducted by the means of postal services.
The first reason to use traditional post as supported tool to gather information is conservatism of some
companies that still do not rely on online communication. Including such type of respondents gives
opportunity to extend the variety of experts. The attitude to online communication channels reflects in
companies’ activities and decision-making process. On the other hand companies that broadly use
web-sites, e-mails, social net-works, i.e. digital competent, have higher corporate disclosure and are
more forward-looking that in turn contributes in their decision-making process. Therefore applying
traditional (post) and modern (online based surveys) tools of gathering information provides ability to
cover different types of respondents from disclosure and conservatism point of view.
The questionnaire is divided into several parts: (1) the cost of capital and its estimation methods;
(2) internal and external factors influencing the cost of equity capital; and (3) company’s
characteristics.
The first part that is dedicated to cost of equity capital estimation includes three questions. The first
question: “What is the capital structure of your company?” The respondents have to indicate the
percentage (or actual numbers) of each component of capital, namely equity capital, long-term debt
and short-term debt thus the capital structure can be determined. The average debt to equity ratio is
1.74 with Standard deviation equal to 1.73 (Table 14). At the same time the 25th
percentiles is 0.54
and 75th
percentiles is 2.33. Thus the mean of debt to equity capital is very high due to very wide
range of distribution (Figure 9)
Table 12 Descriptive statistics: Debt to Equity ratio
Mean Std. Dev. Median Min Max
Debt to Equity 1.74 1.73 1.33 .00 9.00
13
https://www.surveymonkey.com
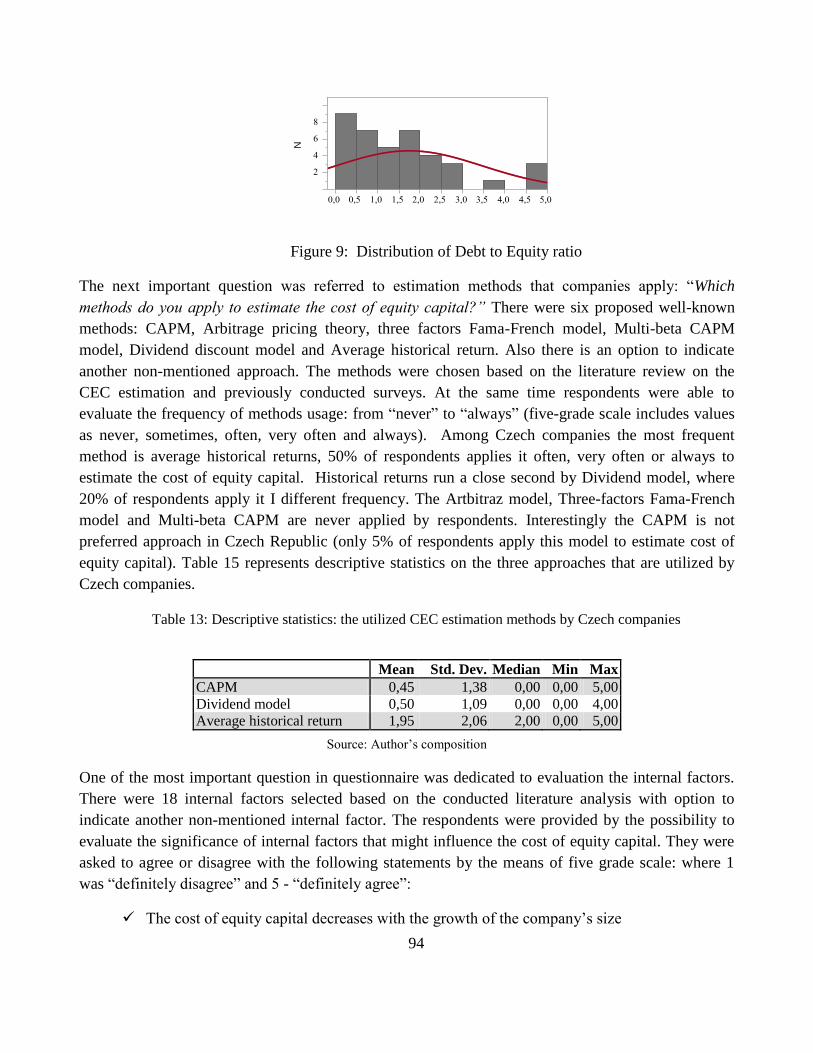
94
Figure 9: Distribution of Debt to Equity ratio
The next important question was referred to estimation methods that companies apply: “Which
methods do you apply to estimate the cost of equity capital?” There were six proposed well-known
methods: CAPM, Arbitrage pricing theory, three factors Fama-French model, Multi-beta CAPM
model, Dividend discount model and Average historical return. Also there is an option to indicate
another non-mentioned approach. The methods were chosen based on the literature review on the
CEC estimation and previously conducted surveys. At the same time respondents were able to
evaluate the frequency of methods usage: from “never” to “always” (five-grade scale includes values
as never, sometimes, often, very often and always). Among Czech companies the most frequent
method is average historical returns, 50% of respondents applies it often, very often or always to
estimate the cost of equity capital. Historical returns run a close second by Dividend model, where
20% of respondents apply it I different frequency. The Artbitraz model, Three-factors Fama-French
model and Multi-beta CAPM are never applied by respondents. Interestingly the CAPM is not
preferred approach in Czech Republic (only 5% of respondents apply this model to estimate cost of
equity capital). Table 15 represents descriptive statistics on the three approaches that are utilized by
Czech companies.
Table 13: Descriptive statistics: the utilized CEC estimation methods by Czech companies
Mean Std. Dev. Median Min Max
CAPM 0,45 1,38 0,00 0,00 5,00
Dividend model 0,50 1,09 0,00 0,00 4,00
Average historical return 1,95 2,06 2,00 0,00 5,00
Source: Author’s composition
One of the most important question in questionnaire was dedicated to evaluation the internal factors.
There were 18 internal factors selected based on the conducted literature analysis with option to
indicate another non-mentioned internal factor. The respondents were provided by the possibility to
evaluate the significance of internal factors that might influence the cost of equity capital. They were
asked to agree or disagree with the following statements by the means of five grade scale: where 1
was “definitely disagree” and 5 - “definitely agree”:
The cost of equity capital decreases with the growth of the company’s size
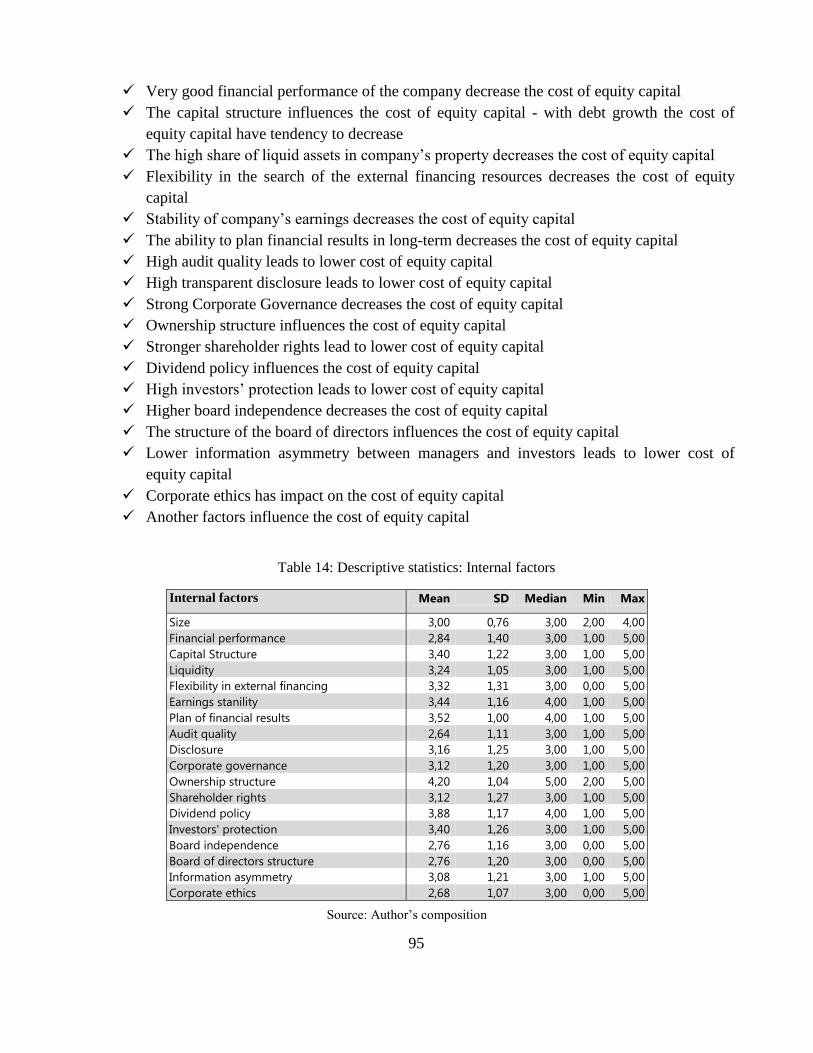
95
Very good financial performance of the company decrease the cost of equity capital
The capital structure influences the cost of equity capital - with debt growth the cost of
equity capital have tendency to decrease
The high share of liquid assets in company’s property decreases the cost of equity capital
Flexibility in the search of the external financing resources decreases the cost of equity
capital
Stability of company’s earnings decreases the cost of equity capital
The ability to plan financial results in long-term decreases the cost of equity capital
High audit quality leads to lower cost of equity capital
High transparent disclosure leads to lower cost of equity capital
Strong Corporate Governance decreases the cost of equity capital
Ownership structure influences the cost of equity capital
Stronger shareholder rights lead to lower cost of equity capital
Dividend policy influences the cost of equity capital
High investors’ protection leads to lower cost of equity capital
Higher board independence decreases the cost of equity capital
The structure of the board of directors influences the cost of equity capital
Lower information asymmetry between managers and investors leads to lower cost of
equity capital
Corporate ethics has impact on the cost of equity capital
Another factors influence the cost of equity capital
Table 14: Descriptive statistics: Internal factors
Internal factors Mean SD Median Min Max
Size 3,00 0,76 3,00 2,00 4,00
Financial performance 2,84 1,40 3,00 1,00 5,00
Capital Structure 3,40 1,22 3,00 1,00 5,00
Liquidity 3,24 1,05 3,00 1,00 5,00
Flexibility in external financing 3,32 1,31 3,00 0,00 5,00
Earnings stanility 3,44 1,16 4,00 1,00 5,00
Plan of financial results 3,52 1,00 4,00 1,00 5,00
Audit quality 2,64 1,11 3,00 1,00 5,00
Disclosure 3,16 1,25 3,00 1,00 5,00
Corporate governance 3,12 1,20 3,00 1,00 5,00
Ownership structure 4,20 1,04 5,00 2,00 5,00
Shareholder rights 3,12 1,27 3,00 1,00 5,00
Dividend policy 3,88 1,17 4,00 1,00 5,00
Investors' protection 3,40 1,26 3,00 1,00 5,00
Board independence 2,76 1,16 3,00 0,00 5,00
Board of directors structure 2,76 1,20 3,00 0,00 5,00
Information asymmetry 3,08 1,21 3,00 1,00 5,00
Corporate ethics 2,68 1,07 3,00 0,00 5,00
Source: Author’s composition
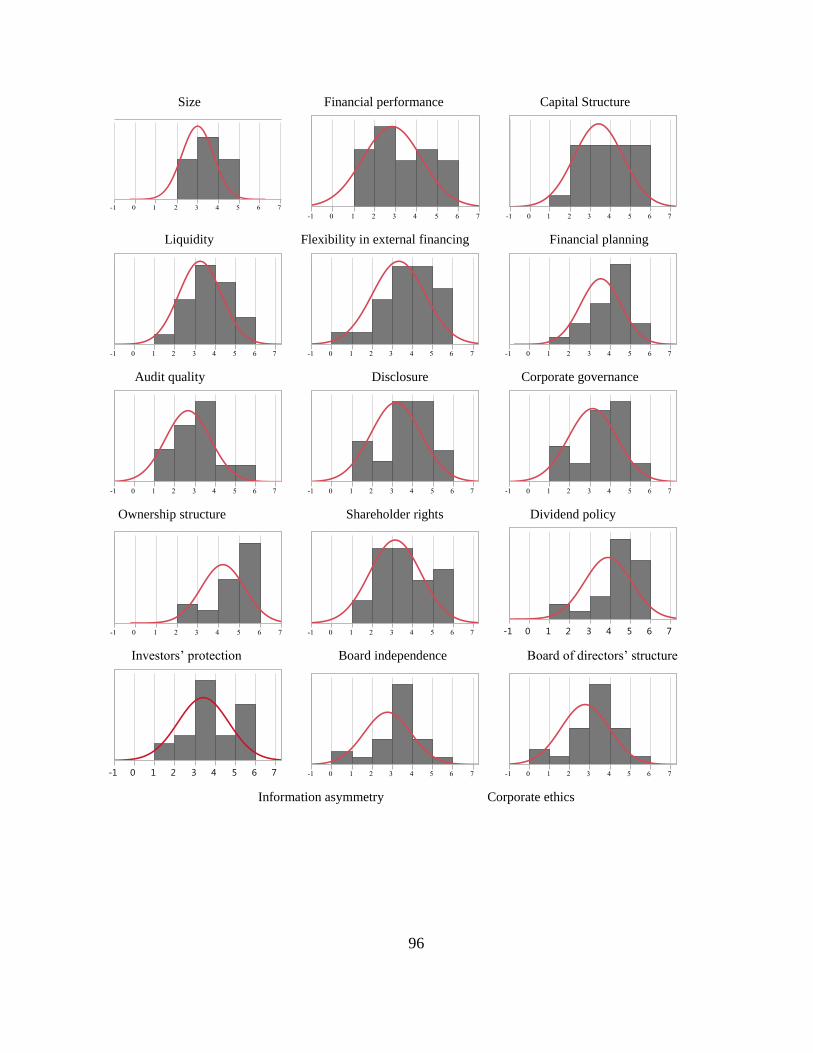
96
Size Financial performance Capital Structure
Liquidity Flexibility in external financing Financial planning
Audit quality Disclosure Corporate governance
Ownership structure Shareholder rights Dividend policy
Investors’ protection Board independence Board of directors’ structure
Information asymmetry Corporate ethics
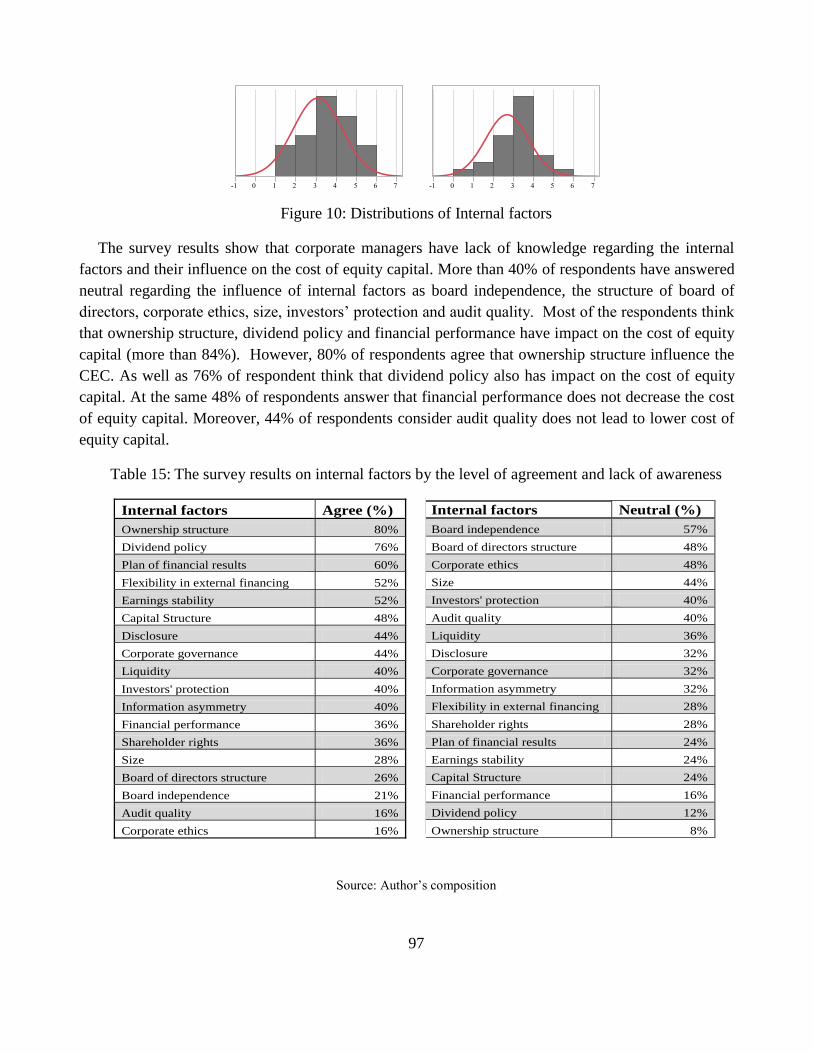
97
Figure 10: Distributions of Internal factors
The survey results show that corporate managers have lack of knowledge regarding the internal
factors and their influence on the cost of equity capital. More than 40% of respondents have answered
neutral regarding the influence of internal factors as board independence, the structure of board of
directors, corporate ethics, size, investors’ protection and audit quality. Most of the respondents think
that ownership structure, dividend policy and financial performance have impact on the cost of equity
capital (more than 84%). However, 80% of respondents agree that ownership structure influence the
CEC. As well as 76% of respondent think that dividend policy also has impact on the cost of equity
capital. At the same 48% of respondents answer that financial performance does not decrease the cost
of equity capital. Moreover, 44% of respondents consider audit quality does not lead to lower cost of
equity capital.
Table 15: The survey results on internal factors by the level of agreement and lack of awareness
Internal factors Agree (%)
Ownership structure 80%
Dividend policy 76%
Plan of financial results 60%
Flexibility in external financing 52%
Earnings stability 52%
Capital Structure 48%
Disclosure 44%
Corporate governance 44%
Liquidity 40%
Investors' protection 40%
Information asymmetry 40%
Financial performance 36%
Shareholder rights 36%
Size 28%
Board of directors structure 26%
Board independence 21%
Audit quality 16%
Corporate ethics 16%
Internal factors Neutral (%)
Board independence 57%
Board of directors structure 48%
Corporate ethics 48%
Size 44%
Investors' protection 40%
Audit quality 40%
Liquidity 36%
Disclosure 32%
Corporate governance 32%
Information asymmetry 32%
Flexibility in external financing 28%
Shareholder rights 28%
Plan of financial results 24%
Earnings stability 24%
Capital Structure 24%
Financial performance 16%
Dividend policy 12%
Ownership structure 8%
Source: Author’s composition
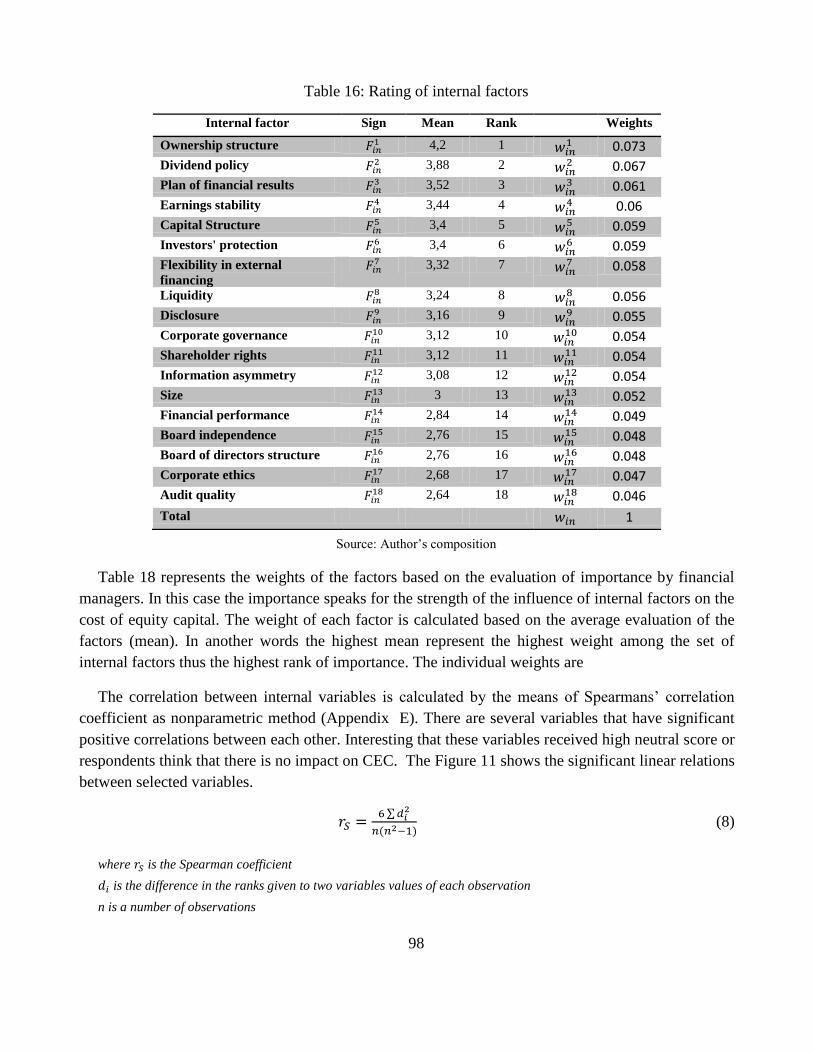
98
Table 16: Rating of internal factors
Internal factor Sign Mean Rank Weights
Ownership structure 4,2 1
0.073
Dividend policy 3,88 2
0.067
Plan of financial results 3,52 3
0.061
Earnings stability 3,44 4
0.06
Capital Structure 3,4 5
0.059
Investors' protection 3,4 6
0.059
Flexibility in external
financing
3,32 7
0.058
Liquidity 3,24 8
0.056
Disclosure 3,16 9
0.055
Corporate governance 3,12 10
0.054
Shareholder rights 3,12 11
0.054
Information asymmetry 3,08 12
0.054
Size 3 13
0.052
Financial performance 2,84 14
0.049
Board independence 2,76 15
0.048
Board of directors structure 2,76 16
0.048
Corporate ethics 2,68 17
0.047
Audit quality 2,64 18
0.046
Total 1
Source: Author’s composition
Table 18 represents the weights of the factors based on the evaluation of importance by financial
managers. In this case the importance speaks for the strength of the influence of internal factors on the
cost of equity capital. The weight of each factor is calculated based on the average evaluation of the
factors (mean). In another words the highest mean represent the highest weight among the set of
internal factors thus the highest rank of importance. The individual weights are
The correlation between internal variables is calculated by the means of Spearmans’ correlation
coefficient as nonparametric method (Appendix E). There are several variables that have significant
positive correlations between each other. Interesting that these variables received high neutral score or
respondents think that there is no impact on CEC. The Figure 11 shows the significant linear relations
between selected variables.
(8)
where is the Spearman coefficient
is the difference in the ranks given to two variables values of each observation
n is a number of observations
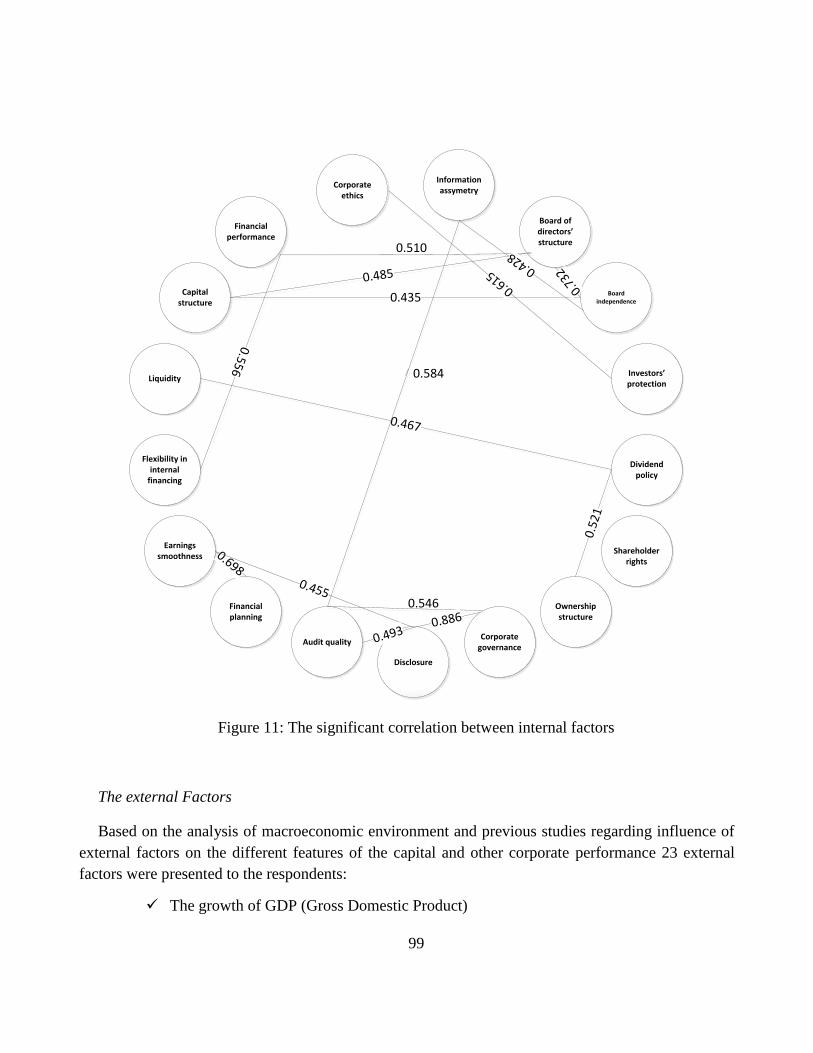
99
Financial performance
Capital structure
Liquidity
Flexibility in internal
financing
Earnings smoothness
Financial planning
Audit quality
Disclosure
Corporate governance
Ownership structure
Shareholder rights
Dividend policy
Investors’ protection
Board independence
Board of directors’ structure
Information assymetry
Corporate ethics
0.510
0.435
0.485
0.556
0.467
0.6980.455
0.493
0.546
0.584
0.886
0.52
1
0.615
0.73
20.428
Figure 11: The significant correlation between internal factors
The external Factors
Based on the analysis of macroeconomic environment and previous studies regarding influence of
external factors on the different features of the capital and other corporate performance 23 external
factors were presented to the respondents:
The growth of GDP (Gross Domestic Product)
100
The unemployment rate growth
The appreciation of domestic currency
The growth of Foreign Direct Investments
The growth of sovereign default probability
The growth of inflation (Consumer Price Index)
Raw materials prices growth (oil)
Money supply growth
Long-term interest rate growth
Short-term interest rate growth
Short-term interest rate growth
Sovereign debt
Country sovereign rating improvement
The growth of corporate tax rate
The growth of government expenditures
The growth of stock market volatility
The financial market development
The decrease of risk free rate (i.e. government bond yields)
The growth of banks capital adequacy
Banking system liquidity
The growth of bank lending to non-financial private sector
The probability growth of banking system default
The increasing level of corruption
Political stability
The external factors should be evaluated in terms of their influence on the cost of equity capital.
The seven-grade scale was applied to estimate the significance of the external factors. The choices
were ranged from “Decrease significantly” to “Increase significantly”.
Table 19 presents the percentage of respondents that consider selected external factors to have
impact on the cost of equity capital. All respondents agree that long-term interest rate growth
influence the CEC as well as short-term rate and inflation (88% and 87% of respondents respectively).
More than 70% of corporate managers think that such external factors as financial market
development, sovereign default and banking system default probabilities, sovereign rating, GDP
growth and risk free rate might influence the level of equity capital costs. At the same time 67% of
respondents consider sovereign debt not to influence the CEC. Besides unemployment rate is
evaluated as factor without any impact (63% of respondents). More than 50% of corporate managers
define foreign direct investment, government expenditures and political stability also as factors that do
not influence CEC.
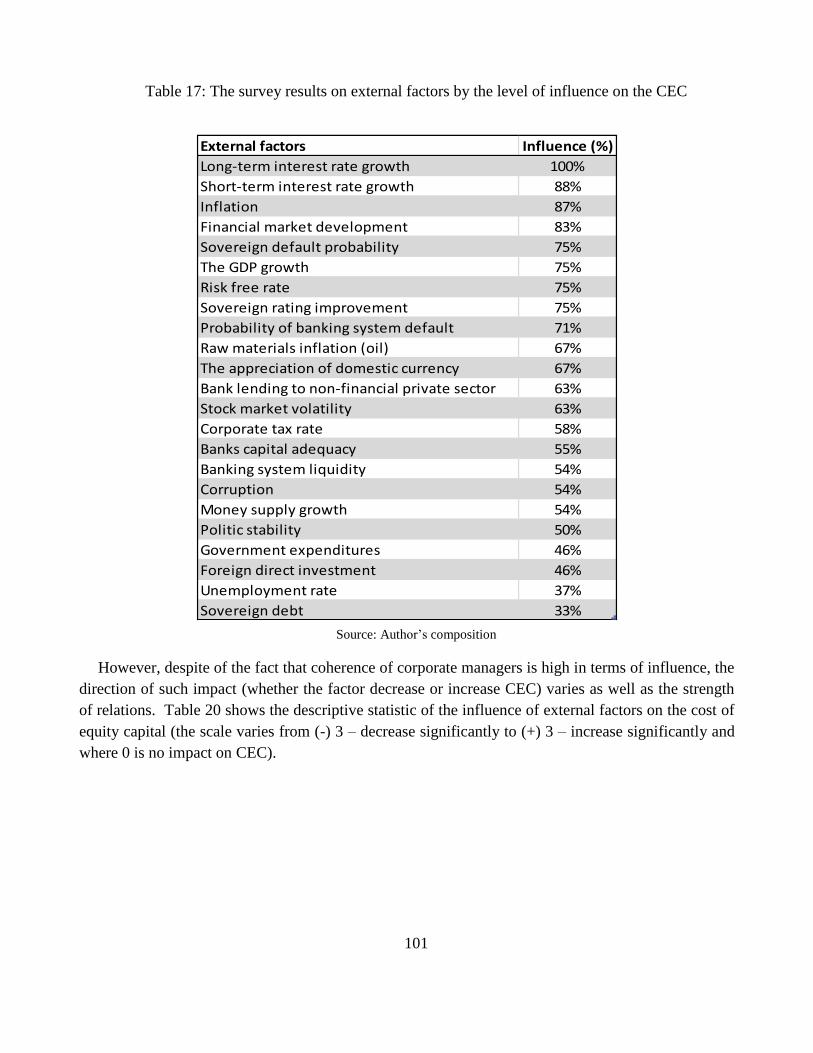
101
Table 17: The survey results on external factors by the level of influence on the CEC
Source: Author’s composition
However, despite of the fact that coherence of corporate managers is high in terms of influence, the
direction of such impact (whether the factor decrease or increase CEC) varies as well as the strength
of relations. Table 20 shows the descriptive statistic of the influence of external factors on the cost of
equity capital (the scale varies from (-) 3 – decrease significantly to (+) 3 – increase significantly and
where 0 is no impact on CEC).
External factors Influence (%)
Long-term interest rate growth 100%
Short-term interest rate growth 88%
Inflation 87%
Financial market development 83%
Sovereign default probability 75%
The GDP growth 75%
Risk free rate 75%
Sovereign rating improvement 75%
Probability of banking system default 71%
Raw materials inflation (oil) 67%
The appreciation of domestic currency 67%
Bank lending to non-financial private sector 63%
Stock market volatility 63%
Corporate tax rate 58%
Banks capital adequacy 55%
Banking system liquidity 54%
Corruption 54%
Money supply growth 54%
Politic stability 50%
Government expenditures 46%
Foreign direct investment 46%
Unemployment rate 37%
Sovereign debt 33%
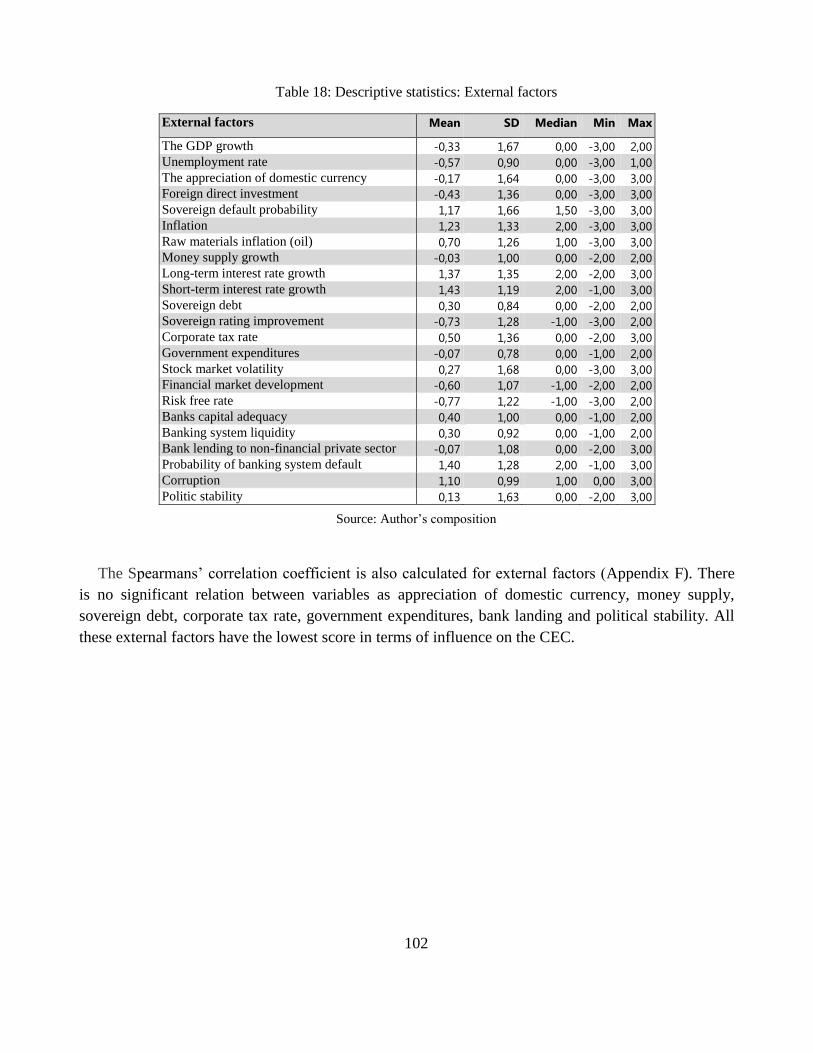
102
Table 18: Descriptive statistics: External factors
External factors Mean SD Median Min Max
The GDP growth -0,33 1,67 0,00 -3,00 2,00
Unemployment rate -0,57 0,90 0,00 -3,00 1,00
The appreciation of domestic currency -0,17 1,64 0,00 -3,00 3,00
Foreign direct investment -0,43 1,36 0,00 -3,00 3,00
Sovereign default probability 1,17 1,66 1,50 -3,00 3,00
Inflation 1,23 1,33 2,00 -3,00 3,00
Raw materials inflation (oil) 0,70 1,26 1,00 -3,00 3,00
Money supply growth -0,03 1,00 0,00 -2,00 2,00
Long-term interest rate growth 1,37 1,35 2,00 -2,00 3,00
Short-term interest rate growth 1,43 1,19 2,00 -1,00 3,00
Sovereign debt 0,30 0,84 0,00 -2,00 2,00
Sovereign rating improvement -0,73 1,28 -1,00 -3,00 2,00
Corporate tax rate 0,50 1,36 0,00 -2,00 3,00
Government expenditures -0,07 0,78 0,00 -1,00 2,00
Stock market volatility 0,27 1,68 0,00 -3,00 3,00
Financial market development -0,60 1,07 -1,00 -2,00 2,00
Risk free rate -0,77 1,22 -1,00 -3,00 2,00
Banks capital adequacy 0,40 1,00 0,00 -1,00 2,00
Banking system liquidity 0,30 0,92 0,00 -1,00 2,00
Bank lending to non-financial private sector -0,07 1,08 0,00 -2,00 3,00
Probability of banking system default 1,40 1,28 2,00 -1,00 3,00
Corruption 1,10 0,99 1,00 0,00 3,00
Politic stability 0,13 1,63 0,00 -2,00 3,00
Source: Author’s composition
The Spearmans’ correlation coefficient is also calculated for external factors (Appendix F). There
is no significant relation between variables as appreciation of domestic currency, money supply,
sovereign debt, corporate tax rate, government expenditures, bank landing and political stability. All
these external factors have the lowest score in terms of influence on the CEC.
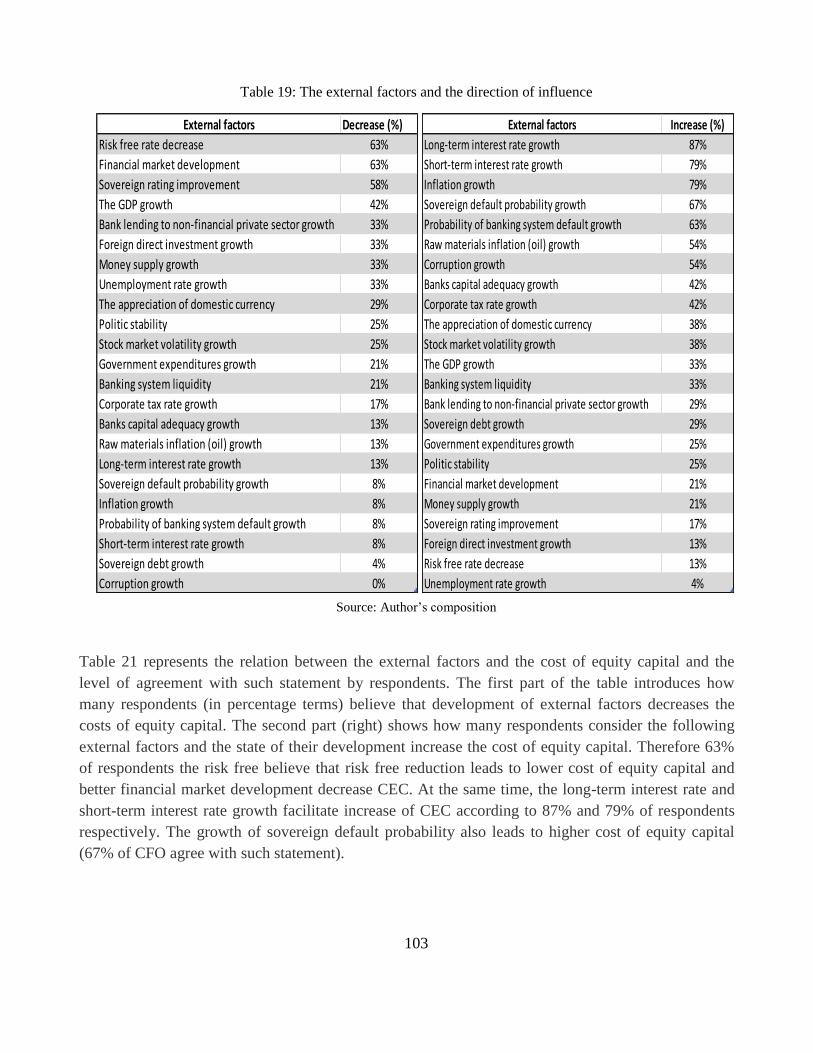
103
Table 19: The external factors and the direction of influence
Source: Author’s composition
Table 21 represents the relation between the external factors and the cost of equity capital and the
level of agreement with such statement by respondents. The first part of the table introduces how
many respondents (in percentage terms) believe that development of external factors decreases the
costs of equity capital. The second part (right) shows how many respondents consider the following
external factors and the state of their development increase the cost of equity capital. Therefore 63%
of respondents the risk free believe that risk free reduction leads to lower cost of equity capital and
better financial market development decrease CEC. At the same time, the long-term interest rate and
short-term interest rate growth facilitate increase of CEC according to 87% and 79% of respondents
respectively. The growth of sovereign default probability also leads to higher cost of equity capital
(67% of CFO agree with such statement).
External factors Decrease (%)
Risk free rate decrease 63%
Financial market development 63%
Sovereign rating improvement 58%
The GDP growth 42%
Bank lending to non-financial private sector growth 33%
Foreign direct investment growth 33%
Money supply growth 33%
Unemployment rate growth 33%
The appreciation of domestic currency 29%
Politic stability 25%
Stock market volatility growth 25%
Government expenditures growth 21%
Banking system liquidity 21%
Corporate tax rate growth 17%
Banks capital adequacy growth 13%
Raw materials inflation (oil) growth 13%
Long-term interest rate growth 13%
Sovereign default probability growth 8%
Inflation growth 8%
Probability of banking system default growth 8%
Short-term interest rate growth 8%
Sovereign debt growth 4%
Corruption growth 0%
External factors Increase (%)
Long-term interest rate growth 87%
Short-term interest rate growth 79%
Inflation growth 79%
Sovereign default probability growth 67%
Probability of banking system default growth 63%
Raw materials inflation (oil) growth 54%
Corruption growth 54%
Banks capital adequacy growth 42%
Corporate tax rate growth 42%
The appreciation of domestic currency 38%
Stock market volatility growth 38%
The GDP growth 33%
Banking system liquidity 33%
Bank lending to non-financial private sector growth 29%
Sovereign debt growth 29%
Government expenditures growth 25%
Politic stability 25%
Financial market development 21%
Money supply growth 21%
Sovereign rating improvement 17%
Foreign direct investment growth 13%
Risk free rate decrease 13%
Unemployment rate growth 4%
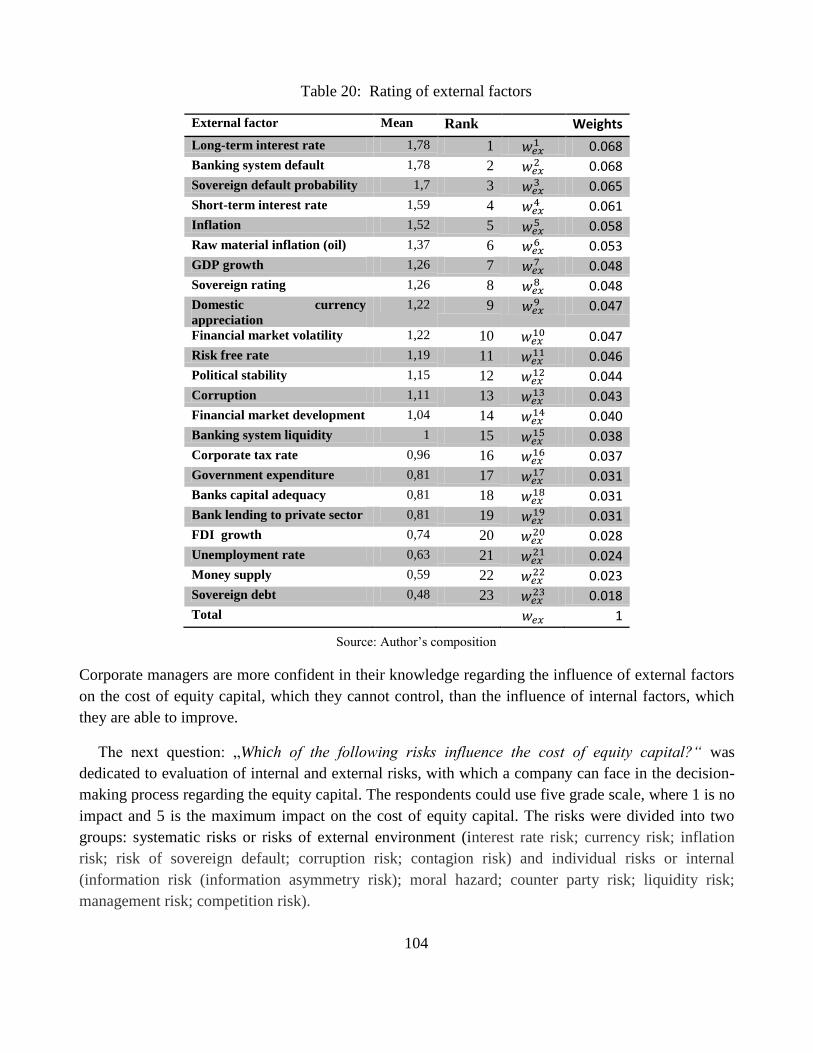
104
Table 20: Rating of external factors
External factor Mean Rank Weights
Long-term interest rate 1,78 1 0.068
Banking system default 1,78 2 0.068
Sovereign default probability 1,7 3 0.065
Short-term interest rate 1,59 4 0.061
Inflation 1,52 5 0.058
Raw material inflation (oil) 1,37 6 0.053
GDP growth 1,26 7 0.048
Sovereign rating 1,26 8 0.048
Domestic currency
appreciation
1,22 9 0.047
Financial market volatility 1,22 10 0.047
Risk free rate 1,19 11 0.046
Political stability 1,15 12 0.044
Corruption 1,11 13 0.043
Financial market development 1,04 14 0.040
Banking system liquidity 1 15 0.038
Corporate tax rate 0,96 16 0.037
Government expenditure 0,81 17 0.031
Banks capital adequacy 0,81 18 0.031
Bank lending to private sector 0,81 19 0.031
FDI growth 0,74 20 0.028
Unemployment rate 0,63 21 0.024
Money supply 0,59 22 0.023
Sovereign debt 0,48 23 0.018
Total 1
Source: Author’s composition
Corporate managers are more confident in their knowledge regarding the influence of external factors
on the cost of equity capital, which they cannot control, than the influence of internal factors, which
they are able to improve.
The next question: „Which of the following risks influence the cost of equity capital?“ was
dedicated to evaluation of internal and external risks, with which a company can face in the decision-
making process regarding the equity capital. The respondents could use five grade scale, where 1 is no
impact and 5 is the maximum impact on the cost of equity capital. The risks were divided into two
groups: systematic risks or risks of external environment (interest rate risk; currency risk; inflation
risk; risk of sovereign default; corruption risk; contagion risk) and individual risks or internal
(information risk (information asymmetry risk); moral hazard; counter party risk; liquidity risk;
management risk; competition risk).
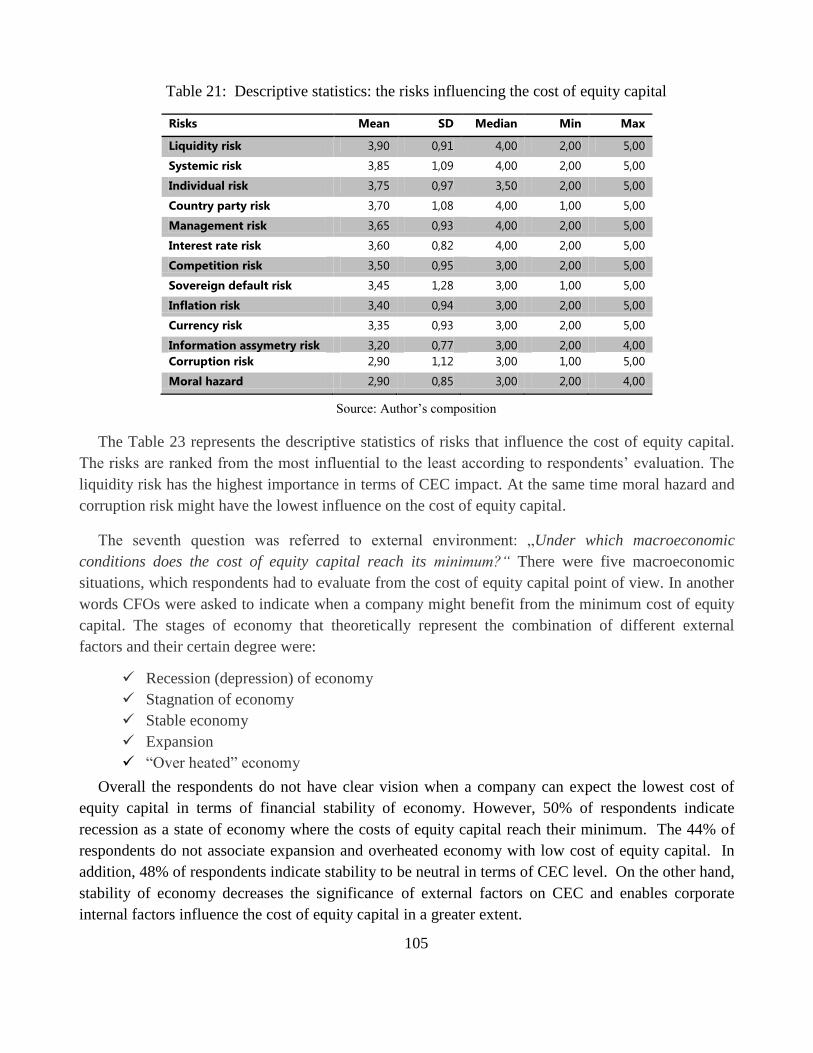
105
Table 21: Descriptive statistics: the risks influencing the cost of equity capital
Risks Mean SD Median Min Max
Liquidity risk 3,90 0,91 4,00 2,00 5,00
Systemic risk 3,85 1,09 4,00 2,00 5,00
Individual risk 3,75 0,97 3,50 2,00 5,00
Country party risk 3,70 1,08 4,00 1,00 5,00
Management risk 3,65 0,93 4,00 2,00 5,00
Interest rate risk 3,60 0,82 4,00 2,00 5,00
Competition risk 3,50 0,95 3,00 2,00 5,00
Sovereign default risk 3,45 1,28 3,00 1,00 5,00
Inflation risk 3,40 0,94 3,00 2,00 5,00
Currency risk 3,35 0,93 3,00 2,00 5,00
Information assymetry risk 3,20 0,77 3,00 2,00 4,00
Corruption risk 2,90 1,12 3,00 1,00 5,00
Moral hazard 2,90 0,85 3,00 2,00 4,00
Source: Author’s composition
The Table 23 represents the descriptive statistics of risks that influence the cost of equity capital.
The risks are ranked from the most influential to the least according to respondents’ evaluation. The
liquidity risk has the highest importance in terms of CEC impact. At the same time moral hazard and
corruption risk might have the lowest influence on the cost of equity capital.
The seventh question was referred to external environment: „Under which macroeconomic
conditions does the cost of equity capital reach its minimum?“ There were five macroeconomic
situations, which respondents had to evaluate from the cost of equity capital point of view. In another
words CFOs were asked to indicate when a company might benefit from the minimum cost of equity
capital. The stages of economy that theoretically represent the combination of different external
factors and their certain degree were:
Recession (depression) of economy
Stagnation of economy
Stable economy
Expansion
“Over heated” economy
Overall the respondents do not have clear vision when a company can expect the lowest cost of
equity capital in terms of financial stability of economy. However, 50% of respondents indicate
recession as a state of economy where the costs of equity capital reach their minimum. The 44% of
respondents do not associate expansion and overheated economy with low cost of equity capital. In
addition, 48% of respondents indicate stability to be neutral in terms of CEC level. On the other hand,
stability of economy decreases the significance of external factors on CEC and enables corporate
internal factors influence the cost of equity capital in a greater extent.
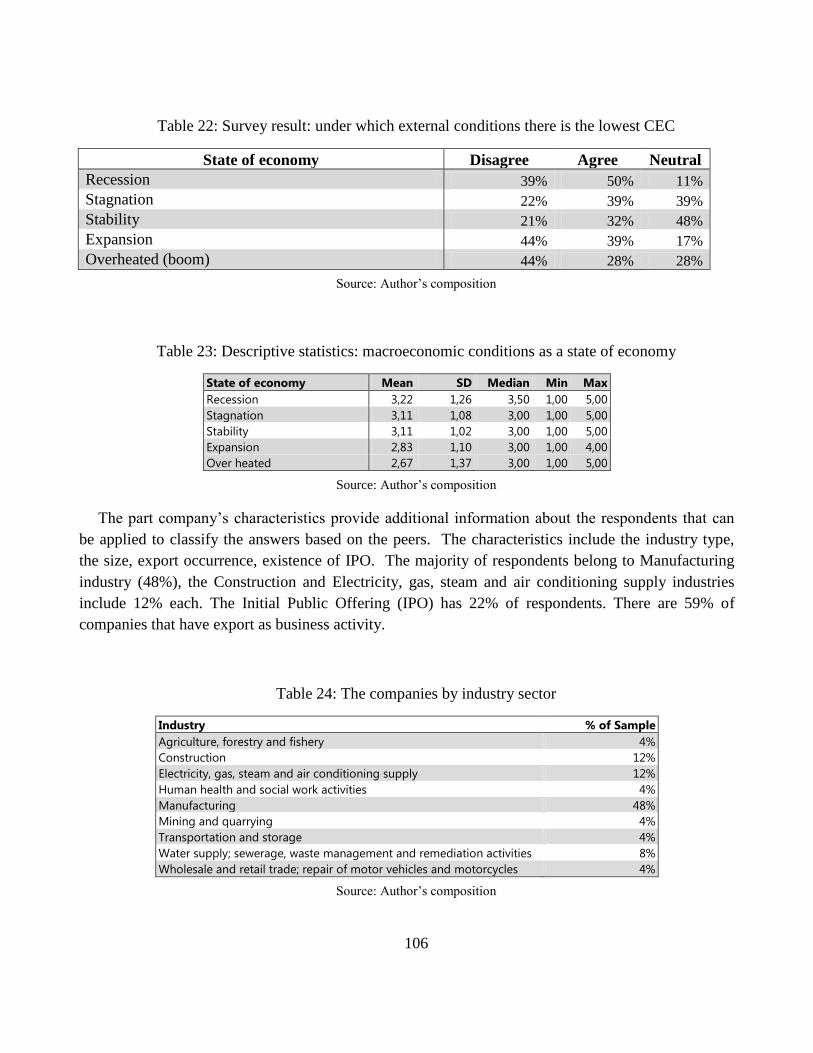
106
Table 22: Survey result: under which external conditions there is the lowest CEC
State of economy Disagree Agree Neutral
Recession 39% 50% 11%
Stagnation 22% 39% 39%
Stability 21% 32% 48%
Expansion 44% 39% 17%
Overheated (boom) 44% 28% 28%
Source: Author’s composition
Table 23: Descriptive statistics: macroeconomic conditions as a state of economy
State of economy Mean SD Median Min Max
Recession 3,22 1,26 3,50 1,00 5,00
Stagnation 3,11 1,08 3,00 1,00 5,00
Stability 3,11 1,02 3,00 1,00 5,00
Expansion 2,83 1,10 3,00 1,00 4,00
Over heated 2,67 1,37 3,00 1,00 5,00
Source: Author’s composition
The part company’s characteristics provide additional information about the respondents that can
be applied to classify the answers based on the peers. The characteristics include the industry type,
the size, export occurrence, existence of IPO. The majority of respondents belong to Manufacturing
industry (48%), the Construction and Electricity, gas, steam and air conditioning supply industries
include 12% each. The Initial Public Offering (IPO) has 22% of respondents. There are 59% of
companies that have export as business activity.
Table 24: The companies by industry sector
Industry % of Sample
Agriculture, forestry and fishery 4%
Construction 12%
Electricity, gas, steam and air conditioning supply 12%
Human health and social work activities 4%
Manufacturing 48%
Mining and quarrying 4%
Transportation and storage 4%
Water supply; sewerage, waste management and remediation activities 8%
Wholesale and retail trade; repair of motor vehicles and motorcycles 4%
Source: Author’s composition
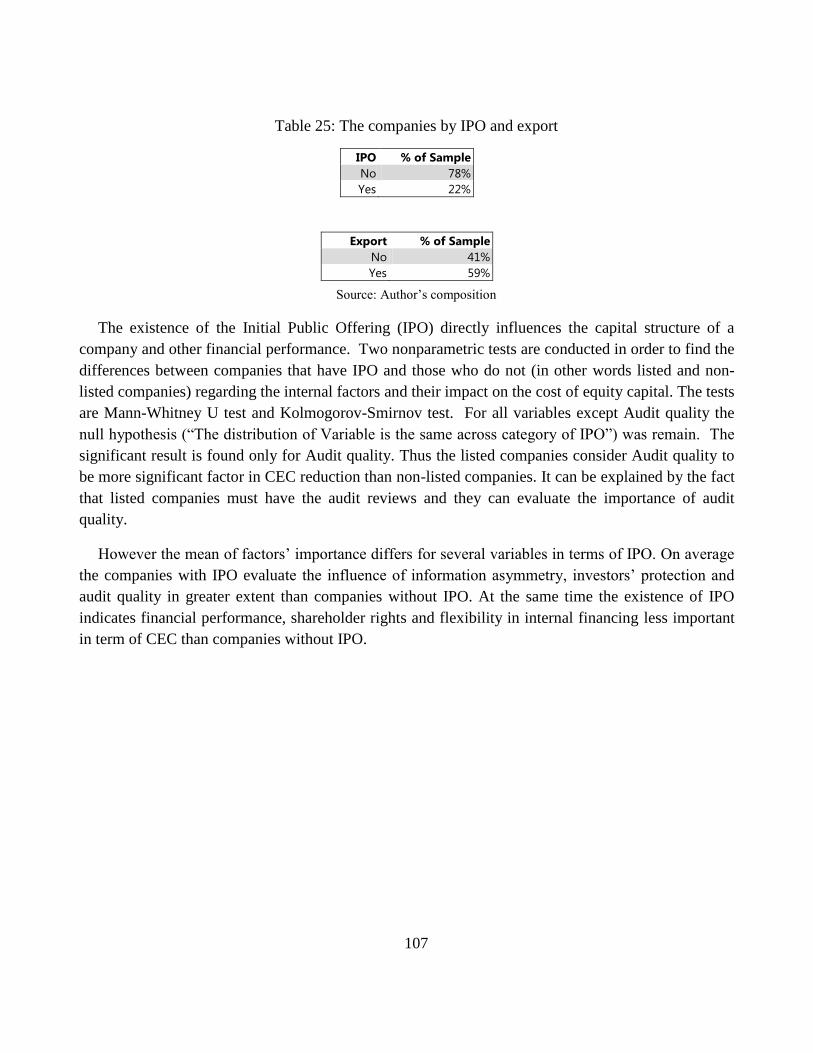
107
Table 25: The companies by IPO and export
IPO % of Sample
No 78%
Yes 22%
Export % of Sample
No 41%
Yes 59%
Source: Author’s composition
The existence of the Initial Public Offering (IPO) directly influences the capital structure of a
company and other financial performance. Two nonparametric tests are conducted in order to find the
differences between companies that have IPO and those who do not (in other words listed and non-
listed companies) regarding the internal factors and their impact on the cost of equity capital. The tests
are Mann-Whitney U test and Kolmogorov-Smirnov test. For all variables except Audit quality the
null hypothesis (“The distribution of Variable is the same across category of IPO”) was remain. The
significant result is found only for Audit quality. Thus the listed companies consider Audit quality to
be more significant factor in CEC reduction than non-listed companies. It can be explained by the fact
that listed companies must have the audit reviews and they can evaluate the importance of audit
quality.
However the mean of factors’ importance differs for several variables in terms of IPO. On average
the companies with IPO evaluate the influence of information asymmetry, investors’ protection and
audit quality in greater extent than companies without IPO. At the same time the existence of IPO
indicates financial performance, shareholder rights and flexibility in internal financing less important
in term of CEC than companies without IPO.
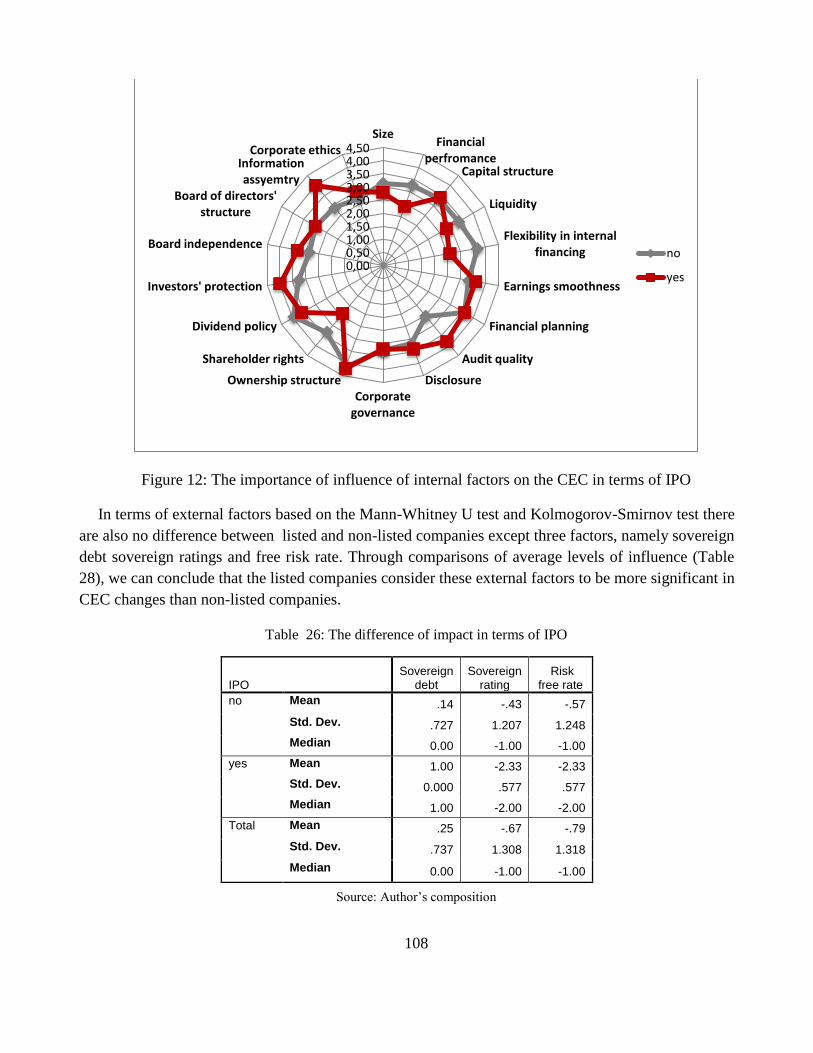
108
Figure 12: The importance of influence of internal factors on the CEC in terms of IPO
In terms of external factors based on the Mann-Whitney U test and Kolmogorov-Smirnov test there
are also no difference between listed and non-listed companies except three factors, namely sovereign
debt sovereign ratings and free risk rate. Through comparisons of average levels of influence (Table
28), we can conclude that the listed companies consider these external factors to be more significant in
CEC changes than non-listed companies.
Table 26: The difference of impact in terms of IPO
IPO Sovereign
debt Sovereign
rating Risk
free rate
no Mean .14 -.43 -.57
Std. Dev. .727 1.207 1.248
Median 0.00 -1.00 -1.00
yes Mean 1.00 -2.33 -2.33
Std. Dev. 0.000 .577 .577
Median 1.00 -2.00 -2.00
Total Mean .25 -.67 -.79
Std. Dev. .737 1.308 1.318
Median 0.00 -1.00 -1.00
Source: Author’s composition
0,00 0,50 1,00 1,50 2,00 2,50 3,00 3,50 4,00 4,50
Size Financial
perfromance Capital structure
Liquidity
Flexibility in internal financing
Earnings smoothness
Financial planning
Audit quality
Disclosure Corporate
governance
Ownership structure
Shareholder rights
Dividend policy
Investors' protection
Board independence
Board of directors' structure
Information assyemtry
Corporate ethics
no
yes
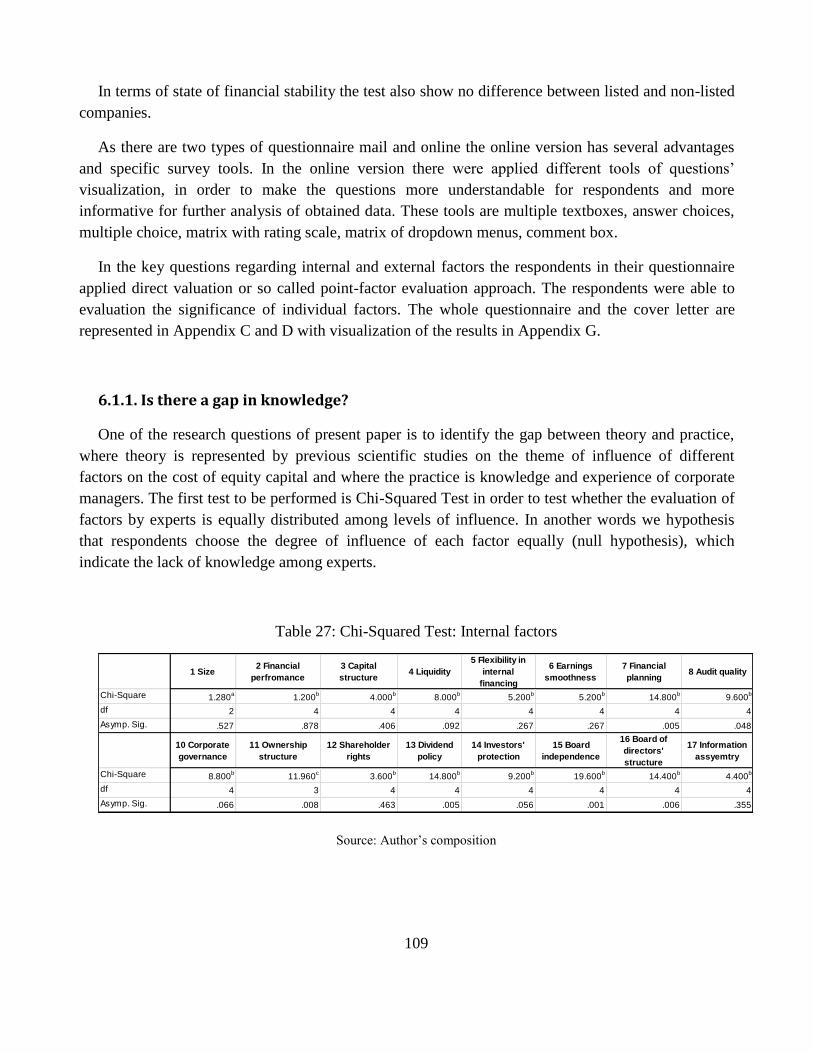
109
In terms of state of financial stability the test also show no difference between listed and non-listed
companies.
As there are two types of questionnaire mail and online the online version has several advantages
and specific survey tools. In the online version there were applied different tools of questions’
visualization, in order to make the questions more understandable for respondents and more
informative for further analysis of obtained data. These tools are multiple textboxes, answer choices,
multiple choice, matrix with rating scale, matrix of dropdown menus, comment box.
In the key questions regarding internal and external factors the respondents in their questionnaire
applied direct valuation or so called point-factor evaluation approach. The respondents were able to
evaluation the significance of individual factors. The whole questionnaire and the cover letter are
represented in Appendix C and D with visualization of the results in Appendix G.
6.1.1. Is there a gap in knowledge?
One of the research questions of present paper is to identify the gap between theory and practice,
where theory is represented by previous scientific studies on the theme of influence of different
factors on the cost of equity capital and where the practice is knowledge and experience of corporate
managers. The first test to be performed is Chi-Squared Test in order to test whether the evaluation of
factors by experts is equally distributed among levels of influence. In another words we hypothesis
that respondents choose the degree of influence of each factor equally (null hypothesis), which
indicate the lack of knowledge among experts.
Table 27: Chi-Squared Test: Internal factors
Source: Author’s composition
1 Size2 Financial
perfromance
3 Capital
structure4 Liquidity
5 Flexibility in
internal
financing
6 Earnings
smoothness
7 Financial
planning8 Audit quality
Chi-Square 1.280a
1.200b
4.000b
8.000b
5.200b
5.200b
14.800b
9.600b
df 2 4 4 4 4 4 4 4
Asymp. Sig. .527 .878 .406 .092 .267 .267 .005 .048
10 Corporate
governance
11 Ownership
structure
12 Shareholder
rights
13 Dividend
policy
14 Investors'
protection
15 Board
independence
16 Board of
directors'
structure
17 Information
assyemtry
Chi-Square 8.800b
11.960c
3.600b
14.800b
9.200b
19.600b
14.400b
4.400b
df 4 3 4 4 4 4 4 4
Asymp. Sig. .066 .008 .463 .005 .056 .001 .006 .355
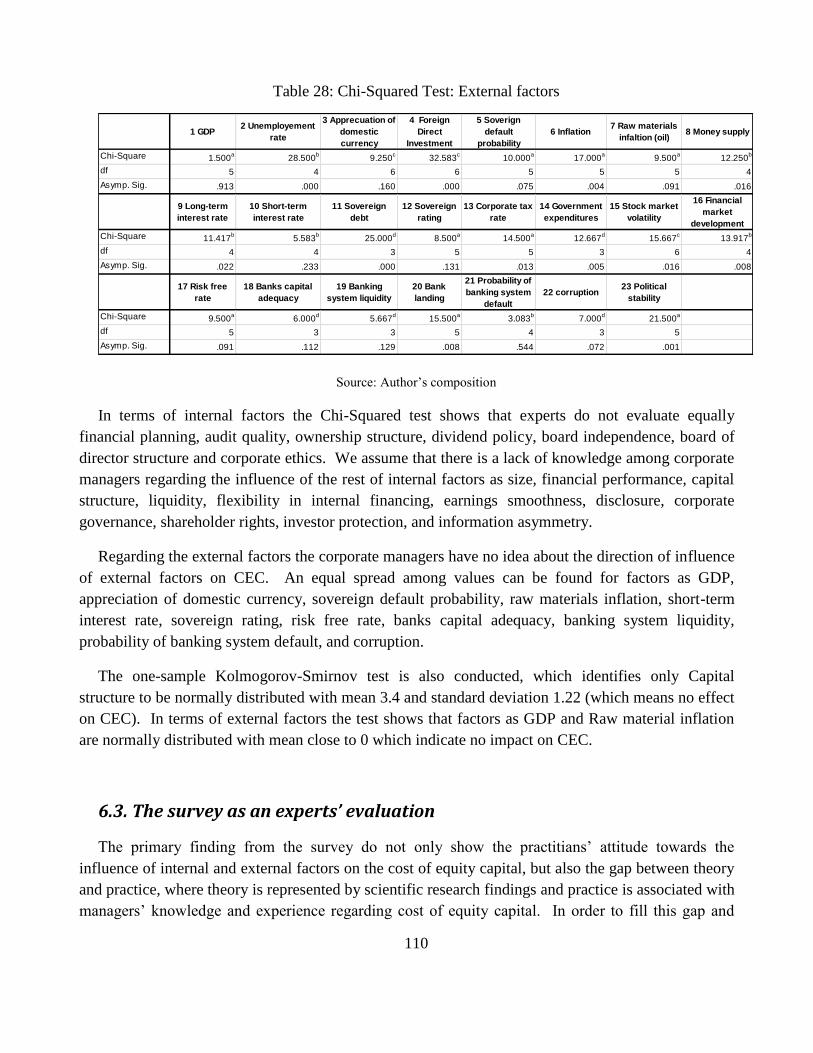
110
Table 28: Chi-Squared Test: External factors
Source: Author’s composition
In terms of internal factors the Chi-Squared test shows that experts do not evaluate equally
financial planning, audit quality, ownership structure, dividend policy, board independence, board of
director structure and corporate ethics. We assume that there is a lack of knowledge among corporate
managers regarding the influence of the rest of internal factors as size, financial performance, capital
structure, liquidity, flexibility in internal financing, earnings smoothness, disclosure, corporate
governance, shareholder rights, investor protection, and information asymmetry.
Regarding the external factors the corporate managers have no idea about the direction of influence
of external factors on CEC. An equal spread among values can be found for factors as GDP,
appreciation of domestic currency, sovereign default probability, raw materials inflation, short-term
interest rate, sovereign rating, risk free rate, banks capital adequacy, banking system liquidity,
probability of banking system default, and corruption.
The one-sample Kolmogorov-Smirnov test is also conducted, which identifies only Capital
structure to be normally distributed with mean 3.4 and standard deviation 1.22 (which means no effect
on CEC). In terms of external factors the test shows that factors as GDP and Raw material inflation
are normally distributed with mean close to 0 which indicate no impact on CEC.
6.3. The survey as an experts’ evaluation
The primary finding from the survey do not only show the practitians’ attitude towards the
influence of internal and external factors on the cost of equity capital, but also the gap between theory
and practice, where theory is represented by scientific research findings and practice is associated with
managers’ knowledge and experience regarding cost of equity capital. In order to fill this gap and
1 GDP2 Unemployement
rate
3 Apprecuation of
domestic
currency
4 Foreign
Direct
Investment
5 Soverign
default
probability
6 Inflation7 Raw materials
infaltion (oil)8 Money supply
Chi-Square 1.500a
28.500b
9.250c
32.583c
10.000a
17.000a
9.500a
12.250b
df 5 4 6 6 5 5 5 4
Asymp. Sig. .913 .000 .160 .000 .075 .004 .091 .016
9 Long-term
interest rate
10 Short-term
interest rate
11 Sovereign
debt
12 Sovereign
rating
13 Corporate tax
rate
14 Government
expenditures
15 Stock market
volatility
16 Financial
market
development
Chi-Square 11.417b
5.583b
25.000d
8.500a
14.500a
12.667d
15.667c
13.917b
df 4 4 3 5 5 3 6 4
Asymp. Sig. .022 .233 .000 .131 .013 .005 .016 .008
17 Risk free
rate
18 Banks capital
adequacy
19 Banking
system liquidity
20 Bank
landing
21 Probability of
banking system
default
22 corruption23 Political
stability
Chi-Square 9.500a
6.000d
5.667d
15.500a
3.083b
7.000d
21.500a
df 5 3 3 5 4 3 5
Asymp. Sig. .091 .112 .129 .008 .544 .072 .001
111
integrate the experience of experts into scientific research the primary results of survey are applied as
expert evaluation of investigated factors that have influence on the cost of equity capital. The experts
are the professionals from the field, i.e. financial directors of joint-stock companies, which have to
make effective and balanced decisions in terms of equity capital management.
The experts’ evaluations from the survey results were taken into consideration, in order to assess
the weights of the investigated factors. As a rule the importance of factors is estimated by the expert
evaluation, which process can be divided into two steps: collecting the data (by the means of
conducted survey) and data processing with mathematical methods. The weight of the factor is
always a positive number wi, i = 1, …, n, where
, (9)
where n – number of investigated factors
At the same time the numbers , represented the coefficients of relative importance, not
only assign harmonization of factors by importance, but define at what extent one factor is more
significant than other from the experts’ point of view.
Vector of real required coefficients of relative importance of analyzed factors:
(10)
For set of the internal factors the vector of importance has the following type
win = ( , , , , , , , , , , , , , , , , ) (11)
For set of the external factors the vector of importance has the following type
wex = ( , , , , , , , , , , , , , , , , , , , ,
, , ) (12)
The base of weights is average mean (μ) of expert evaluation from primary survey. The Figure 12
and Figure 13 represent the internal and external factors ranking by their weights respectively. The
rank value 1 represents the most significant factor from the experts’ point of view, as relevant 18th
rank represents the least significant internal factor and 23th
rank refers to the least significant
external factor.
112
Figure 13: The ranking of internal factors by weights
Figure 14: The ranking of external factors by weights
113
Chapter 7 Proposal: Methodology towards CEC reduction
The Chapter 7 covers the practical application of research findings. By the means of critical
literature review and primary research and subsequent analysis of accumulated knowledge, the
influence of internal and external factors on the cost of equity capital was determined. These findings
contribute to creation of functional methodology supporting CFO’s decision-making process in the
context of corporate financing with regard to the cost of equity capital manipulations. The
methodology represents the combination of internal and external factors that results in definite level of
CEC. The internal factors that are manageable compose aggregate Index of Internal factors; thereby
the combination of external factors and the level of their development represent the external
environment or in another words the state of economy. A company operates under certain
macroeconomic conditions at a specific period of time, which it cannot adjust.
The methodology is dedicated to evaluate the level of cost of equity capital based on the actual
internal factors and current macroeconomical conditions. The methodology accumulates the existing
knowledge on the influence of internal and external factors on the cost of equity capital and facilitates
effective decisions regarding CEC minimization. The formative construction of the Index is
represented by Figure 15 The combination of external factors compose a current state of economy.
The set of internal factors represent the internal environment of a company.
minimum
CEC
F1
F2
F3
Fm
...
External environment
F1
F2
F3
Fn
...
Internal environment
Figure 15: The formative construction of methodology
Based on literature review the several categories of internal factors are indicated: corporate
disclose, corporate governance and social factors. The common features and their nature lay into this
classification. They survey results also provide the background to limit the factors included into final
114
index. As the size and board characteristics are considered to be less significant among respondents,
the factors are excluded from the Index composition. Despite of the fact that only 16% of respondents
agree that corporate ethics influence the cost of equity capital, it is included into index as the evidence
concerning its impact is quite new and managers might not be aware about the significance of the
factor. However, the weight of corporate ethic in Index is the lowest. Besides, information asymmetry
is excluded from final Index as independent factor as it represent the link between other internal
factors and cost of equity capital.
The operational framework designed for synthetic index construction requires assumptions, in
order to ensure the correct methodological sequence. The main assumption is geographical and limits
the Index application to Czech companies. The limitation is caused by expert evaluation, which was
gathered among Czech experts thus the weights of factors reflect the Czech Republic specifics.
The utilization of index assumes to apply ex-ante cost of equity capital calculated based on four
models derived from the literature review. The purpose of this research is not to evaluate the measures
of cost of equity capital, but instead evaluate the influence of internal and external factors on the cost
of equity capital. Thus based on the literature research the composite measure of cost of equity capital
should be used in the Index application. The composite measure of CEC is the average of four
measures widely used in published financial research concerning the relation between CEC and
different factors: the industry ROE model by Gebhardt et al. (2001), the economy-wide growth model
by Claus and Thomas (2001), the unrestricted abnormal earnings growth model by Gode and
Mohanram (2003), and the restricted abnormal earnings growth model by Easton (2004).
These four measures of CEC were aggregated into one composite measure by the means of the
following formula:
(13)
where – the applied cost of equity capital as an average of four selected measures.
The internal factors are coded with strength distinctions thus the provisions of index can be
stronger, average or weaker. The complexity of the index construction will benefit in ability to
provide recommendations for internal factors adjustment and external factors adoptability and further
cost of equity capital minimization in the decision making process of a company.
The index is continues indicator of the level of the cost of equity capital, where the optimal level
for a company is its minimum. Thus the combination of factors (respectively their values) should lead
to minimum cost of equity capital.
The factors included in Index reflect three internal and one external categories. The Figure 14
represents the structure of Index IECEC
115
Figure 16: The Methodology Structure
As presented in the table the selected indicators have been used for the construction of the
aggregate Index for the influence of internal and external factors on the cost of equity capital for
Czech Republic.
7.1. Internal factors determination in index
As was mentioned before the internal factors are classified into several categories that represent
sub-indices. The Figure 16 represents the internal factors accumulated into Index ICEC and the
direction of their influence on the cost of equity capital.
I. Corporate Disclosure Policy
i. Corporate disclosure
ii. Audit quality
II. Corporate Governance
i. Shareholder rights
ii. Investors protection
iii. Ownership structure
III. Social and Financial Factors
i. Corporate ethics
ii. Liquidity
iii. Financial performance
iv. Earnings stability
v. Flexibility in external; financing
vi. Financial planning
IV. The Current State of Economy
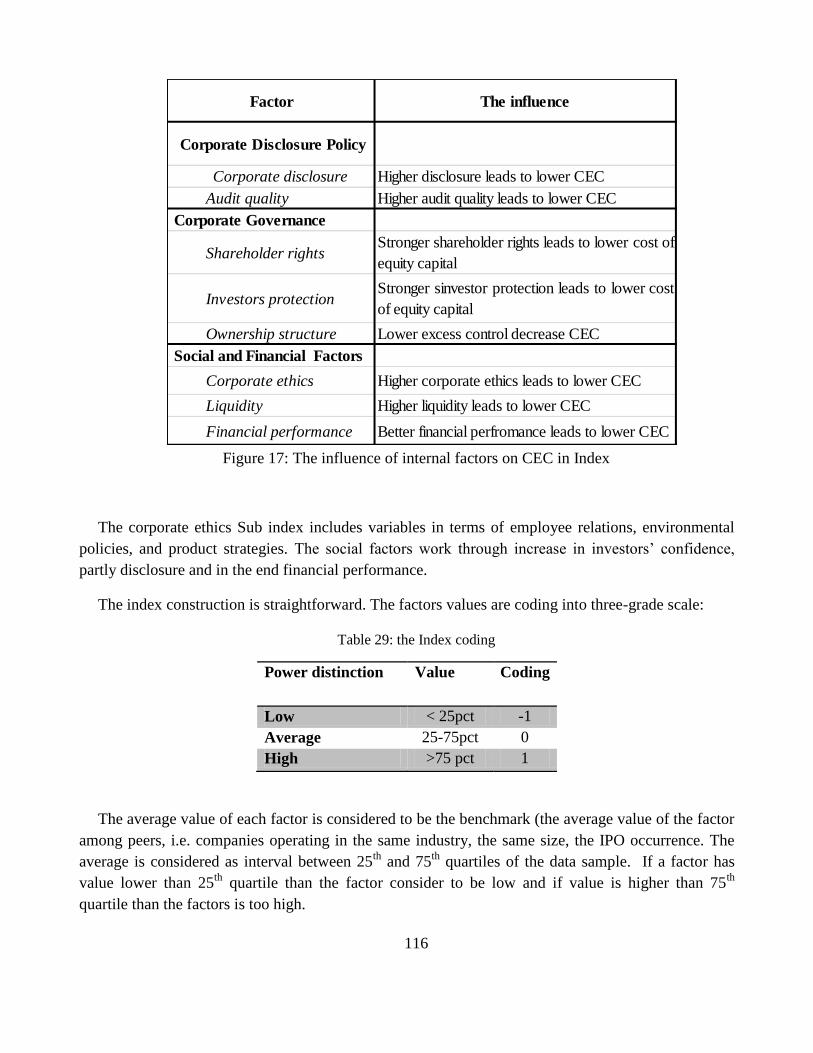
116
Figure 17: The influence of internal factors on CEC in Index
The corporate ethics Sub index includes variables in terms of employee relations, environmental
policies, and product strategies. The social factors work through increase in investors’ confidence,
partly disclosure and in the end financial performance.
The index construction is straightforward. The factors values are coding into three-grade scale:
Table 29: the Index coding
Power distinction Value Coding
Low < 25pct -1
Average 25-75pct 0
High >75 pct 1
The average value of each factor is considered to be the benchmark (the average value of the factor
among peers, i.e. companies operating in the same industry, the same size, the IPO occurrence. The
average is considered as interval between 25th
and 75th
quartiles of the data sample. If a factor has
value lower than 25th
quartile than the factor consider to be low and if value is higher than 75th
quartile than the factors is too high.
Factor The influence
Corporate Disclosure Policy
Corporate disclosure Higher disclosure leads to lower CEC
Audit quality Higher audit quality leads to lower CEC
Corporate Governance
Shareholder rightsStronger shareholder rights leads to lower cost of
equity capital
Investors protectionStronger sinvestor protection leads to lower cost
of equity capital
Ownership structure Lower excess control decrease CEC
Social and Financial Factors
Corporate ethics Higher corporate ethics leads to lower CEC
Liquidity Higher liquidity leads to lower CEC
Financial performance Better financial perfromance leads to lower CEC
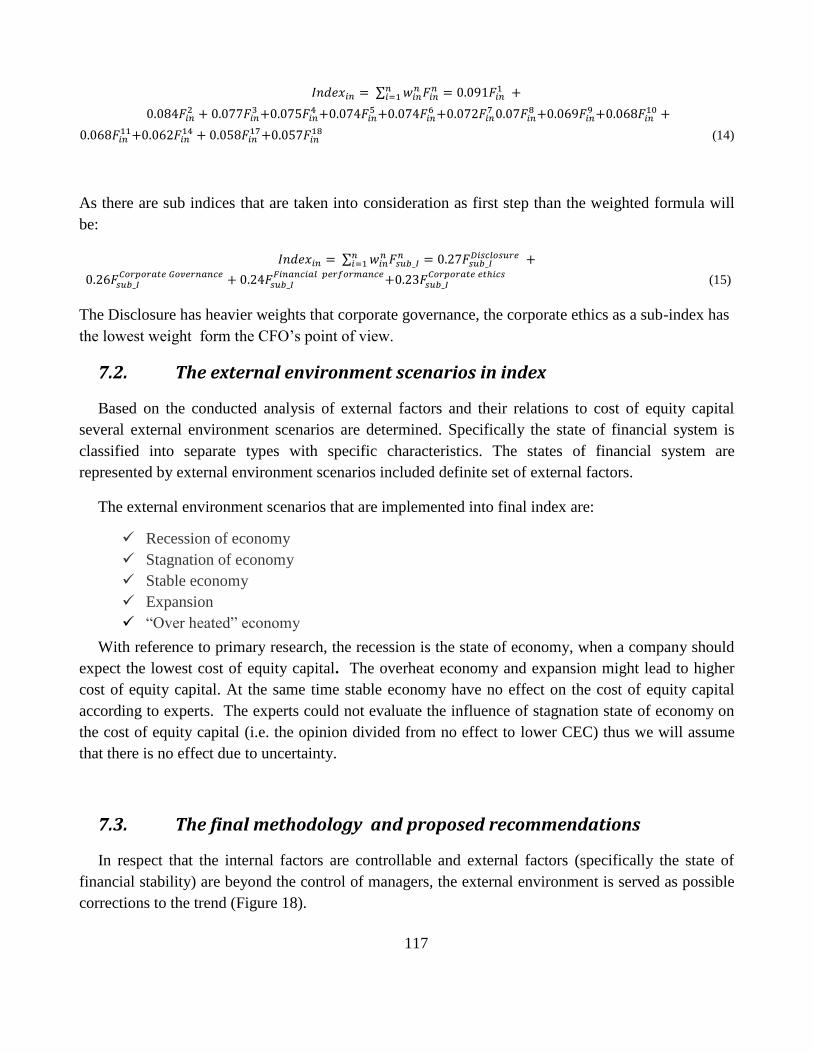
117
(14)
As there are sub indices that are taken into consideration as first step than the weighted formula will
be:
(15)
The Disclosure has heavier weights that corporate governance, the corporate ethics as a sub-index has
the lowest weight form the CFO’s point of view.
7.2. The external environment scenarios in index
Based on the conducted analysis of external factors and their relations to cost of equity capital
several external environment scenarios are determined. Specifically the state of financial system is
classified into separate types with specific characteristics. The states of financial system are
represented by external environment scenarios included definite set of external factors.
The external environment scenarios that are implemented into final index are:
Recession of economy
Stagnation of economy
Stable economy
Expansion
“Over heated” economy
With reference to primary research, the recession is the state of economy, when a company should
expect the lowest cost of equity capital. The overheat economy and expansion might lead to higher
cost of equity capital. At the same time stable economy have no effect on the cost of equity capital
according to experts. The experts could not evaluate the influence of stagnation state of economy on
the cost of equity capital (i.e. the opinion divided from no effect to lower CEC) thus we will assume
that there is no effect due to uncertainty.
7.3. The final methodology and proposed recommendations
In respect that the internal factors are controllable and external factors (specifically the state of
financial stability) are beyond the control of managers, the external environment is served as possible
corrections to the trend (Figure 18).
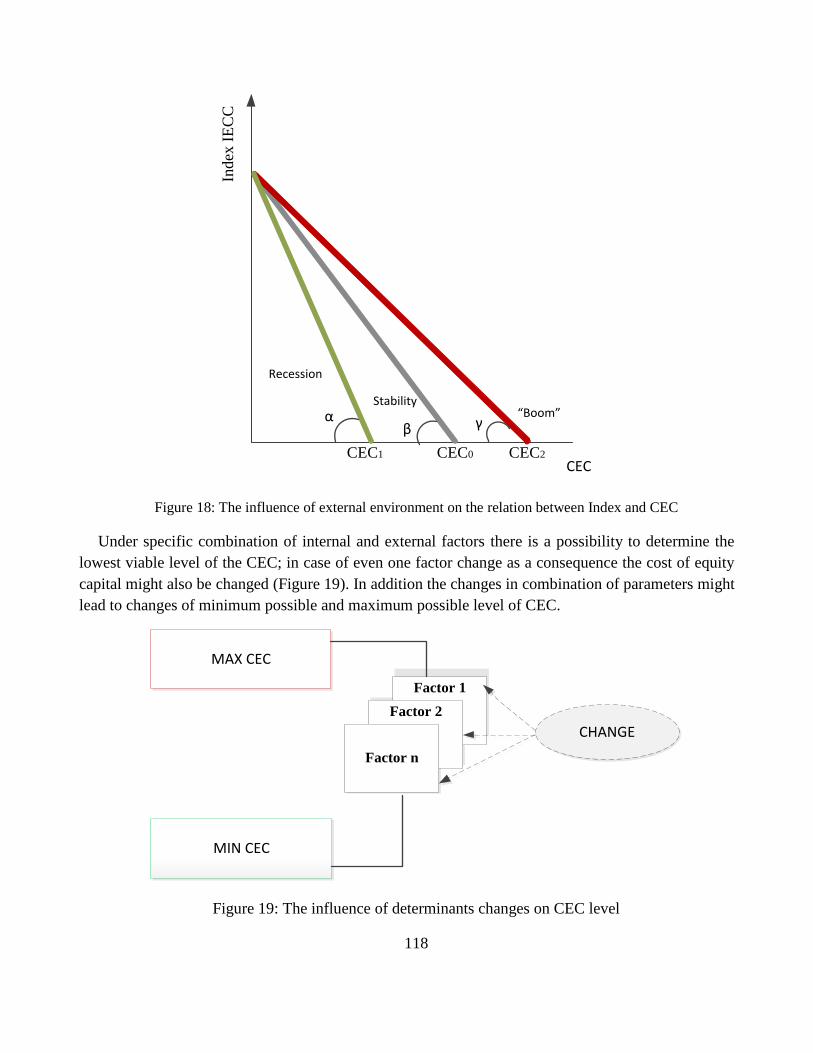
118
Ind
ex I
EC
C
CEC
“Boom”
Recession
Stability
CEC0CEC1 CEC2
αβ γ
Figure 18: The influence of external environment on the relation between Index and CEC
Under specific combination of internal and external factors there is a possibility to determine the
lowest viable level of the CEC; in case of even one factor change as a consequence the cost of equity
capital might also be changed (Figure 19). In addition the changes in combination of parameters might
lead to changes of minimum possible and maximum possible level of CEC.
MAX CEC
MIN CEC
Factor 1
Factor 2
Factor n
CHANGE
Figure 19: The influence of determinants changes on CEC level
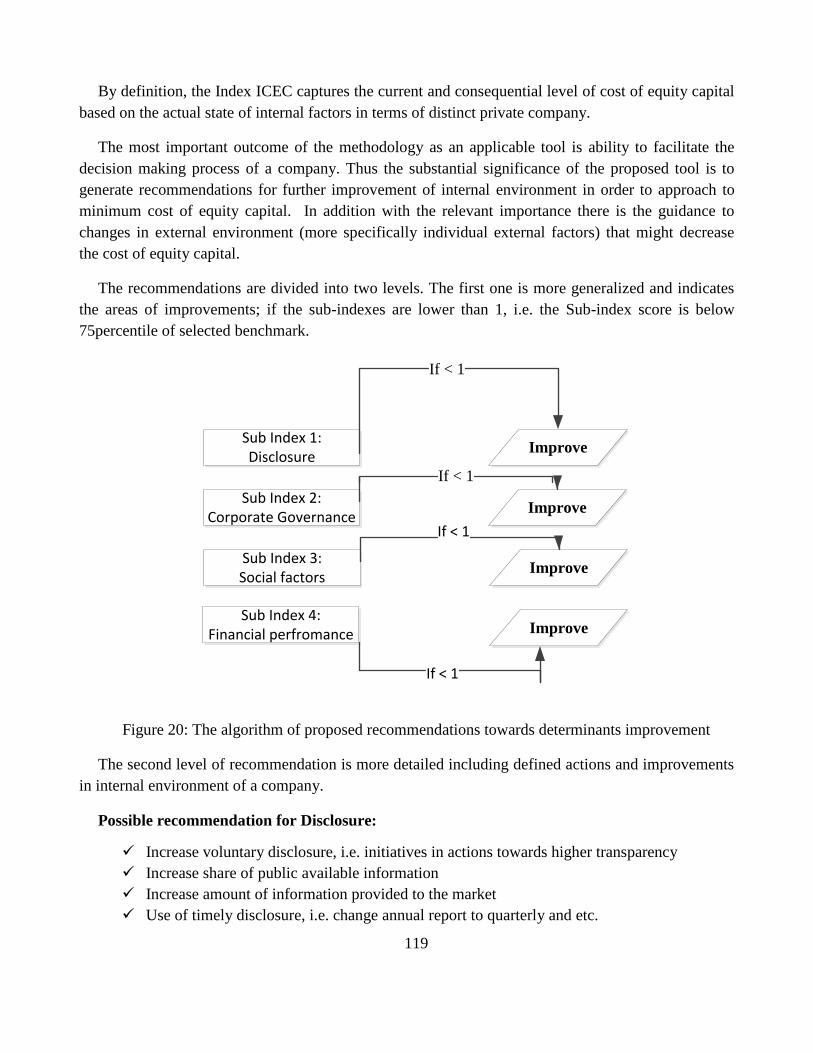
119
By definition, the Index ICEC captures the current and consequential level of cost of equity capital
based on the actual state of internal factors in terms of distinct private company.
The most important outcome of the methodology as an applicable tool is ability to facilitate the
decision making process of a company. Thus the substantial significance of the proposed tool is to
generate recommendations for further improvement of internal environment in order to approach to
minimum cost of equity capital. In addition with the relevant importance there is the guidance to
changes in external environment (more specifically individual external factors) that might decrease
the cost of equity capital.
The recommendations are divided into two levels. The first one is more generalized and indicates
the areas of improvements; if the sub-indexes are lower than 1, i.e. the Sub-index score is below
75percentile of selected benchmark.
Sub Index 1:Disclosure
Sub Index 2:Corporate Governance
Sub Index 3:Social factors
Sub Index 4:Financial perfromance
Improve
If < 1
Improve
Improve
Improve
If < 1
If < 1
If < 1
Figure 20: The algorithm of proposed recommendations towards determinants improvement
The second level of recommendation is more detailed including defined actions and improvements
in internal environment of a company.
Possible recommendation for Disclosure:
Increase voluntary disclosure, i.e. initiatives in actions towards higher transparency
Increase share of public available information
Increase amount of information provided to the market
Use of timely disclosure, i.e. change annual report to quarterly and etc.
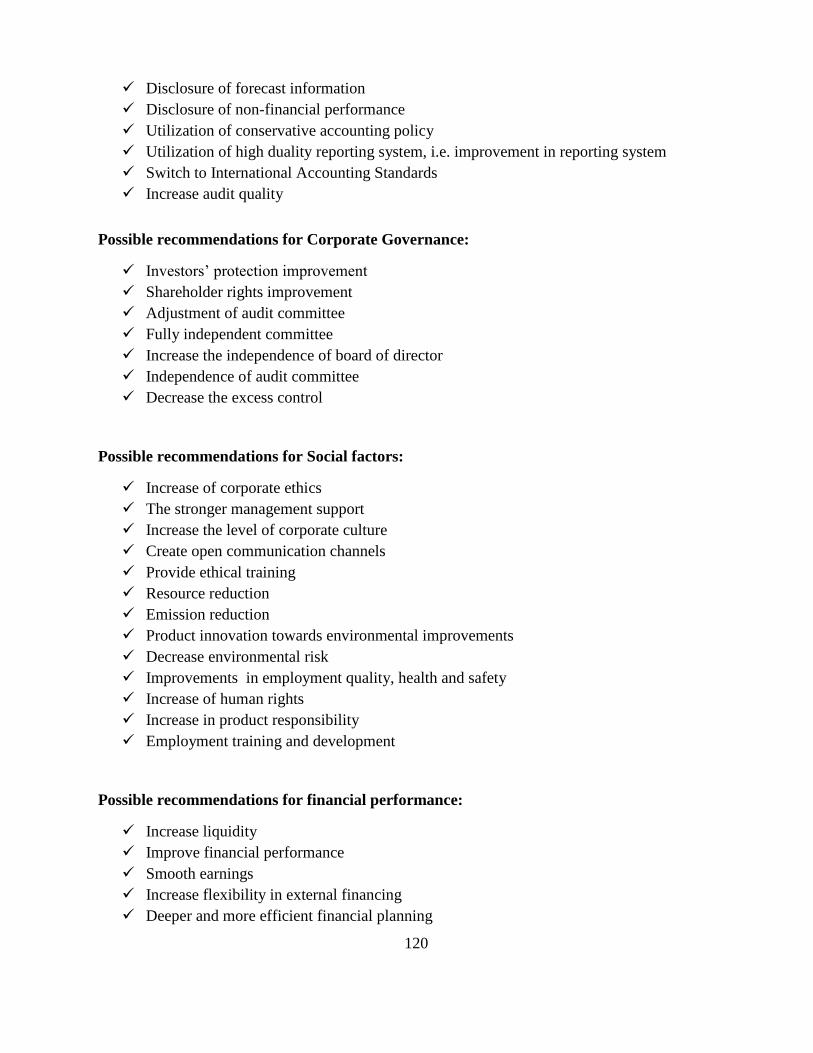
120
Disclosure of forecast information
Disclosure of non-financial performance
Utilization of conservative accounting policy
Utilization of high duality reporting system, i.e. improvement in reporting system
Switch to International Accounting Standards
Increase audit quality
Possible recommendations for Corporate Governance:
Investors’ protection improvement
Shareholder rights improvement
Adjustment of audit committee
Fully independent committee
Increase the independence of board of director
Independence of audit committee
Decrease the excess control
Possible recommendations for Social factors:
Increase of corporate ethics
The stronger management support
Increase the level of corporate culture
Create open communication channels
Provide ethical training
Resource reduction
Emission reduction
Product innovation towards environmental improvements
Decrease environmental risk
Improvements in employment quality, health and safety
Increase of human rights
Increase in product responsibility
Employment training and development
Possible recommendations for financial performance:
Increase liquidity
Improve financial performance
Smooth earnings
Increase flexibility in external financing
Deeper and more efficient financial planning
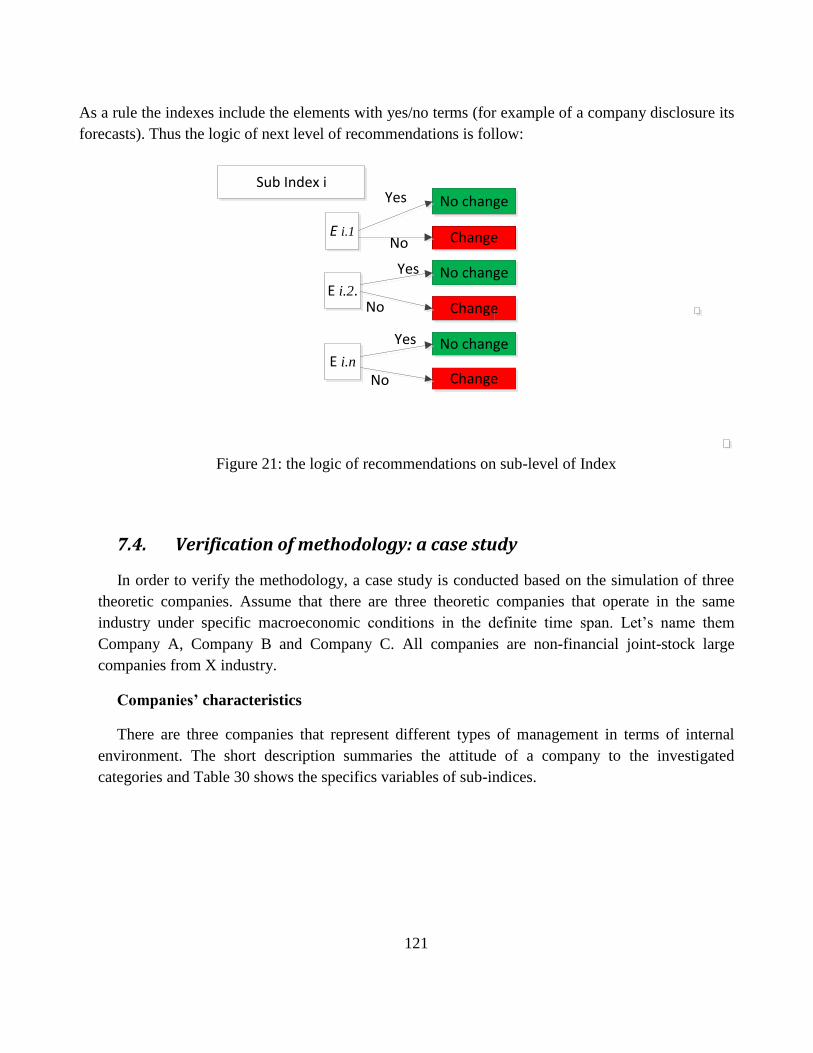
121
As a rule the indexes include the elements with yes/no terms (for example of a company disclosure its
forecasts). Thus the logic of next level of recommendations is follow:
Sub Index i
E i.1
E i.2.
E i.n
No change
Change
No change
Change
No change
Change
Yes
No
Yes
Yes
No
No
Figure 21: the logic of recommendations on sub-level of Index
7.4. Verification of methodology: a case study
In order to verify the methodology, a case study is conducted based on the simulation of three
theoretic companies. Assume that there are three theoretic companies that operate in the same
industry under specific macroeconomic conditions in the definite time span. Let’s name them
Company A, Company B and Company C. All companies are non-financial joint-stock large
companies from X industry.
Companies’ characteristics
There are three companies that represent different types of management in terms of internal
environment. The short description summaries the attitude of a company to the investigated
categories and Table 30 shows the specifics variables of sub-indices.
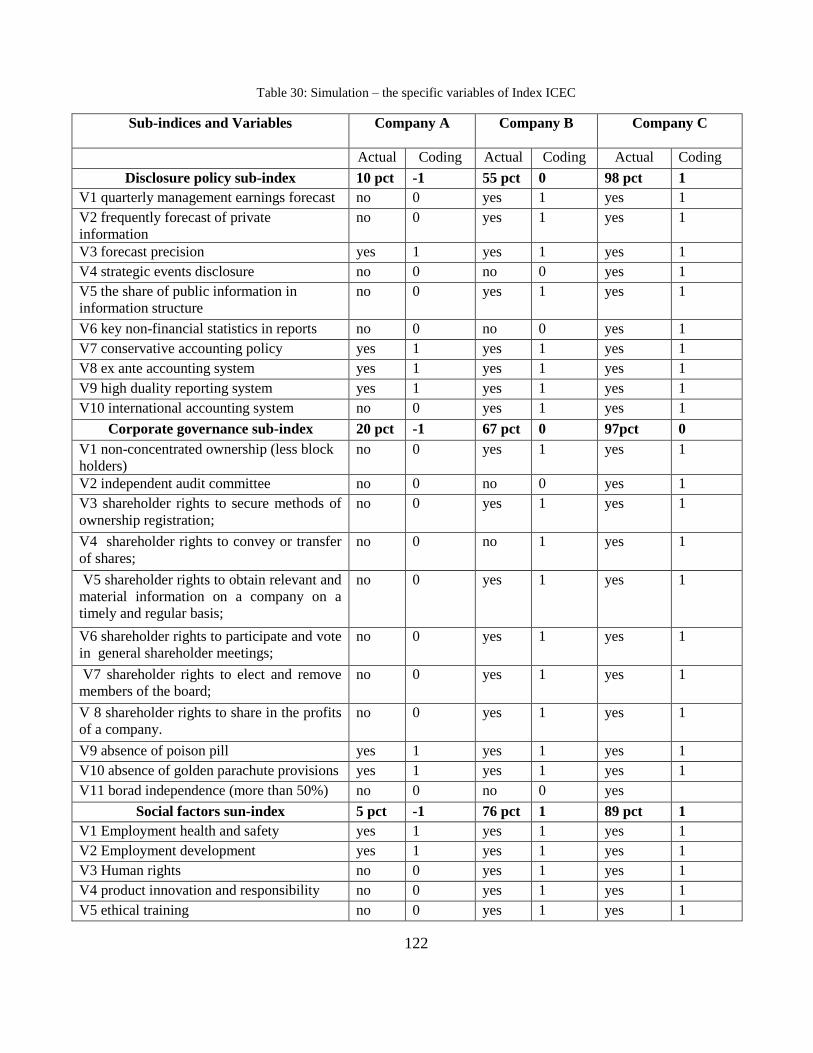
122
Table 30: Simulation – the specific variables of Index ICEC
Sub-indices and Variables Company A
Company B
Company C
Actual Coding Actual Coding Actual Coding
Disclosure policy sub-index 10 pct -1 55 pct 0 98 pct 1
V1 quarterly management earnings forecast no 0 yes 1 yes 1
V2 frequently forecast of private
information
no 0 yes 1 yes 1
V3 forecast precision yes 1 yes 1 yes 1
V4 strategic events disclosure no 0 no 0 yes 1
V5 the share of public information in
information structure
no 0 yes 1 yes 1
V6 key non-financial statistics in reports no 0 no 0 yes 1
V7 conservative accounting policy yes 1 yes 1 yes 1
V8 ex ante accounting system yes 1 yes 1 yes 1
V9 high duality reporting system yes 1 yes 1 yes 1
V10 international accounting system no 0 yes 1 yes 1
Corporate governance sub-index 20 pct -1 67 pct 0 97pct 0
V1 non-concentrated ownership (less block
holders)
no 0 yes 1 yes 1
V2 independent audit committee no 0 no 0 yes 1
V3 shareholder rights to secure methods of
ownership registration;
no 0 yes 1 yes 1
V4 shareholder rights to convey or transfer
of shares;
no 0 no 1 yes 1
V5 shareholder rights to obtain relevant and
material information on a company on a
timely and regular basis;
no 0 yes 1 yes 1
V6 shareholder rights to participate and vote
in general shareholder meetings;
no 0 yes 1 yes 1
V7 shareholder rights to elect and remove
members of the board;
no 0 yes 1 yes 1
V 8 shareholder rights to share in the profits
of a company.
no 0 yes 1 yes 1
V9 absence of poison pill yes 1 yes 1 yes 1
V10 absence of golden parachute provisions yes 1 yes 1 yes 1
V11 borad independence (more than 50%) no 0 no 0 yes
Social factors sun-index 5 pct -1 76 pct 1 89 pct 1
V1 Employment health and safety yes 1 yes 1 yes 1
V2 Employment development yes 1 yes 1 yes 1
V3 Human rights no 0 yes 1 yes 1
V4 product innovation and responsibility no 0 yes 1 yes 1
V5 ethical training no 0 yes 1 yes 1
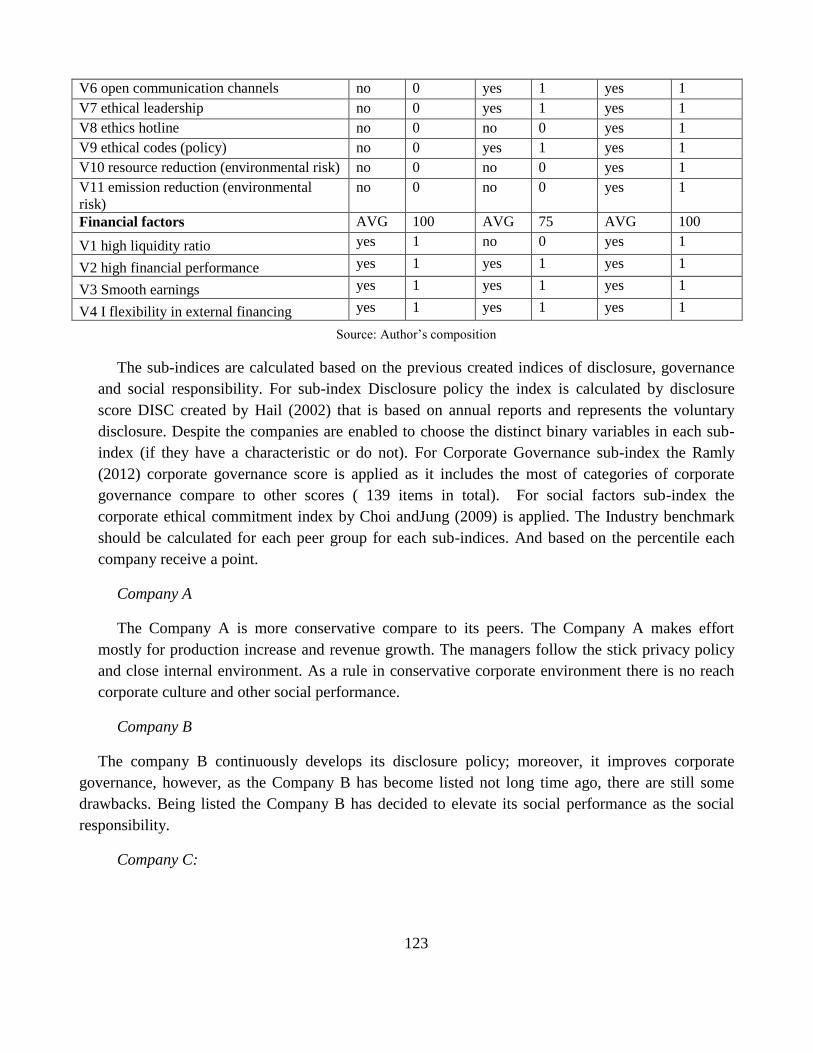
123
V6 open communication channels no 0 yes 1 yes 1
V7 ethical leadership no 0 yes 1 yes 1
V8 ethics hotline no 0 no 0 yes 1
V9 ethical codes (policy) no 0 yes 1 yes 1
V10 resource reduction (environmental risk) no 0 no 0 yes 1
V11 emission reduction (environmental
risk)
no 0 no 0 yes 1
Financial factors AVG 100 AVG 75 AVG 100
V1 high liquidity ratio yes 1 no 0 yes 1
V2 high financial performance yes 1 yes 1 yes 1
V3 Smooth earnings yes 1 yes 1 yes 1
V4 I flexibility in external financing yes 1 yes 1 yes 1
Source: Author’s composition
The sub-indices are calculated based on the previous created indices of disclosure, governance
and social responsibility. For sub-index Disclosure policy the index is calculated by disclosure
score DISC created by Hail (2002) that is based on annual reports and represents the voluntary
disclosure. Despite the companies are enabled to choose the distinct binary variables in each sub-
index (if they have a characteristic or do not). For Corporate Governance sub-index the Ramly
(2012) corporate governance score is applied as it includes the most of categories of corporate
governance compare to other scores ( 139 items in total). For social factors sub-index the
corporate ethical commitment index by Choi andJung (2009) is applied. The Industry benchmark
should be calculated for each peer group for each sub-indices. And based on the percentile each
company receive a point.
Company A
The Company A is more conservative compare to its peers. The Company A makes effort
mostly for production increase and revenue growth. The managers follow the stick privacy policy
and close internal environment. As a rule in conservative corporate environment there is no reach
corporate culture and other social performance.
Company B
The company B continuously develops its disclosure policy; moreover, it improves corporate
governance, however, as the Company B has become listed not long time ago, there are still some
drawbacks. Being listed the Company B has decided to elevate its social performance as the social
responsibility.
Company C:
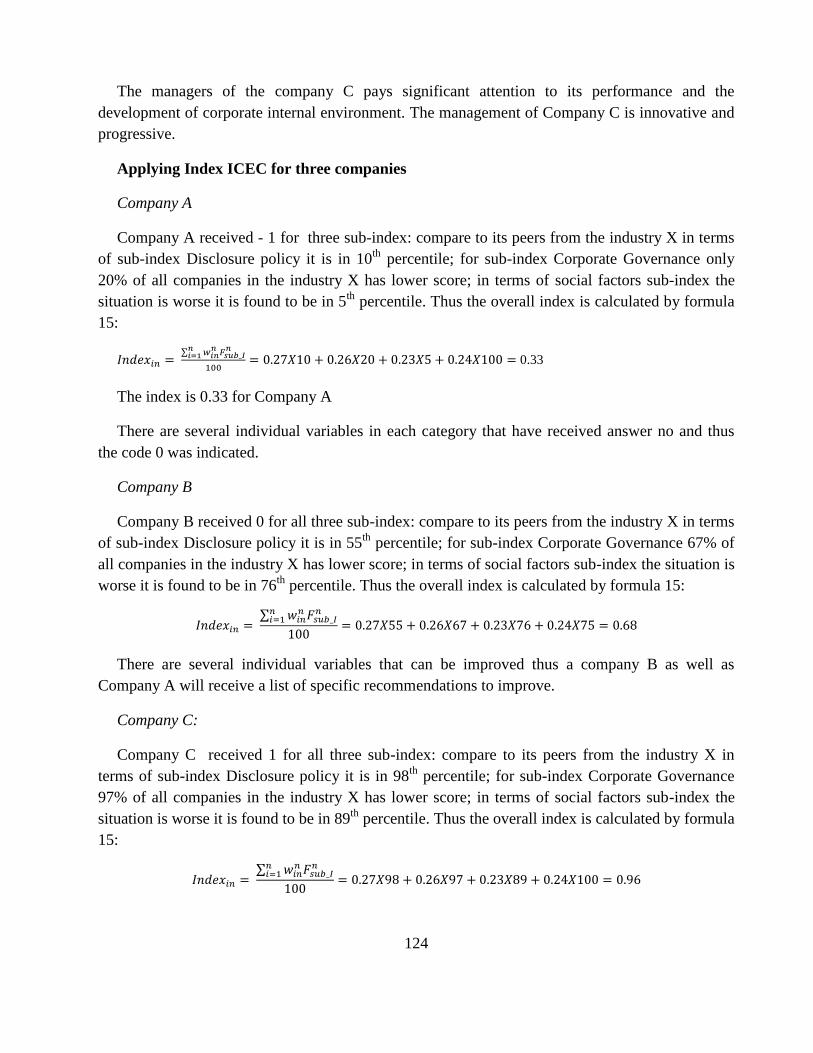
124
The managers of the company C pays significant attention to its performance and the
development of corporate internal environment. The management of Company C is innovative and
progressive.
Applying Index ICEC for three companies
Company A
Company A received - 1 for three sub-index: compare to its peers from the industry X in terms
of sub-index Disclosure policy it is in 10th
percentile; for sub-index Corporate Governance only
20% of all companies in the industry X has lower score; in terms of social factors sub-index the
situation is worse it is found to be in 5th
percentile. Thus the overall index is calculated by formula
15:
0.33
The index is 0.33 for Company A
There are several individual variables in each category that have received answer no and thus
the code 0 was indicated.
Company B
Company B received 0 for all three sub-index: compare to its peers from the industry X in terms
of sub-index Disclosure policy it is in 55th
percentile; for sub-index Corporate Governance 67% of
all companies in the industry X has lower score; in terms of social factors sub-index the situation is
worse it is found to be in 76th
percentile. Thus the overall index is calculated by formula 15:
There are several individual variables that can be improved thus a company B as well as
Company A will receive a list of specific recommendations to improve.
Company C:
Company C received 1 for all three sub-index: compare to its peers from the industry X in
terms of sub-index Disclosure policy it is in 98th
percentile; for sub-index Corporate Governance
97% of all companies in the industry X has lower score; in terms of social factors sub-index the
situation is worse it is found to be in 89th
percentile. Thus the overall index is calculated by formula
15:

125
There no individual variables that can be improved. Only the social factors sub-index can be
increased to maximum level and represent the best practice in Industry X in terms of social factors
development.
Based on the Index ICEC Company C might experience the lowest CEC among three theoretical
companies. The lowest score is received by Company A, which might have higher cost of equity
capital than Company B and C.
The external environment scenario
The companies operate at the same period of time and under the same macroeconomic conditions.
Assume that there is a financial stability thus the current external factors do not influence the CEC.
Methodology outcome: Recommendations
Company A
1 step: Recommendation to improve all three sub-indices:
2 step:
Decrease a number of block holders in ownership structure
Make quarterly earnings forecast
Make forecast more frequent with larger share of private information
Disclosure strategic events
Include non-financial statistics in reports
Adopt international accounting standards
Independent audit committee
relevant and material information on a company on a timely and regular basis
Secure methods of ownership
secure methods of ownership registration
convey or transfer of shares
secure methods of ownership registration
convey or transfer of shares
increase board independence
Human rights
product innovation and responsibility
ethical training
ethics hotline
ethical codes (policy)
resource and emission reduction
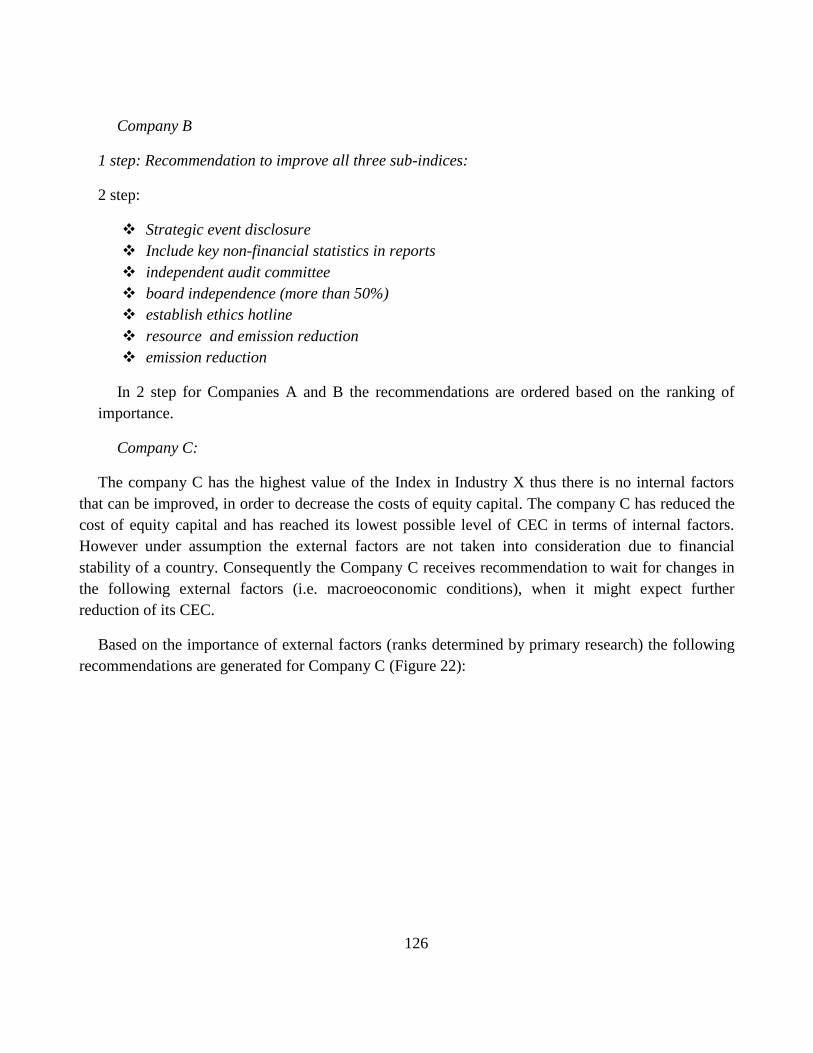
126
Company B
1 step: Recommendation to improve all three sub-indices:
2 step:
Strategic event disclosure
Include key non-financial statistics in reports
independent audit committee
board independence (more than 50%)
establish ethics hotline
resource and emission reduction
emission reduction
In 2 step for Companies A and B the recommendations are ordered based on the ranking of
importance.
Company C:
The company C has the highest value of the Index in Industry X thus there is no internal factors
that can be improved, in order to decrease the costs of equity capital. The company C has reduced the
cost of equity capital and has reached its lowest possible level of CEC in terms of internal factors.
However under assumption the external factors are not taken into consideration due to financial
stability of a country. Consequently the Company C receives recommendation to wait for changes in
the following external factors (i.e. macroeoconomic conditions), when it might expect further
reduction of its CEC.
Based on the importance of external factors (ranks determined by primary research) the following
recommendations are generated for Company C (Figure 22):
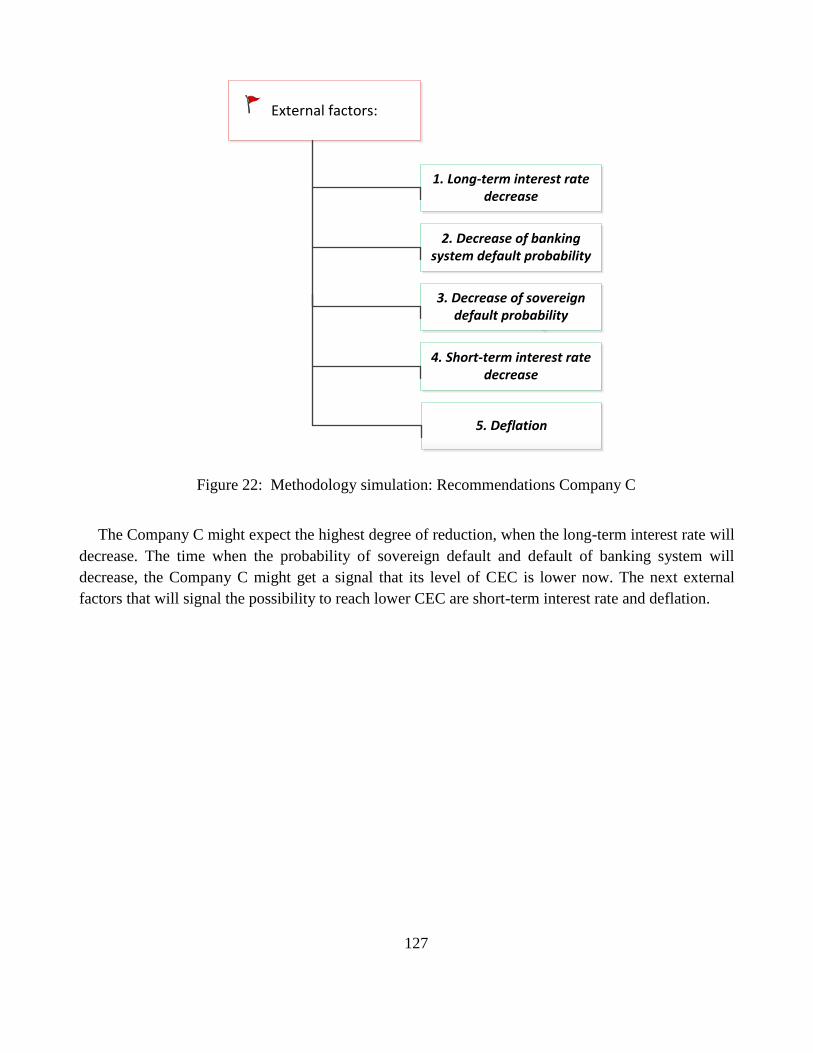
127
External factors:
1. Long-term interest rate decrease
2. Decrease of banking system default probability
3. Decrease of sovereign default probability
4. Short-term interest rate decrease
5. Deflation
Figure 22: Methodology simulation: Recommendations Company C
The Company C might expect the highest degree of reduction, when the long-term interest rate will
decrease. The time when the probability of sovereign default and default of banking system will
decrease, the Company C might get a signal that its level of CEC is lower now. The next external
factors that will signal the possibility to reach lower CEC are short-term interest rate and deflation.
128
Chapter 8 Discussion and concluding remarks
Although the influence of several factors on the cost of equity capital has been extensively studied
on the past few decades, the knowledge has been spread and has not been accumulated; moreover the
influence of internal and external factors in the Czech Republic has remained relatively unexplored.
In this work, the knowledge about the influence of internal and external factors on the cost of equity
capital has been accumulated, analysed and transformed into specific applicable methodology.
The finding of secondary research highlights the variety of internal factors influencing the costs of
equity capital, however, the information spread and is not accumulated. The companies with stronger
corporate governance have lower cost of equity capital. Corporate transparence and shareholder rights
are the essential components of strong corporate governance. By lower estimation risk and lower
agency risk strong shareholder rights and increased financial discloser lead to lower cost of equity
capital The company with weaker shareholder rights and higher transparent disclosure policy has
similar cost of equity capital as the firm with stronger shareholder rights and lower disclosure. So firm
can choose the best way to manage the equity capital by the instrumentally of combination of these
two factors. Effective corporate governance includes greater institutional ownership and stronger
outside control. So high level of audit quality leads to lower cost of equity capital. At the same time
high level financial disclosure reduce information and estimation risks, enhance market liquidity and
reduce transaction costs that in result decrease the cost of equity capital. Financial characteristics for
example profitability or asset liquidity provide lower capital expenses. However earning smoothness
doesn’t lead to the lower cost of capital as it was considered by many owners and managers.
There are a few studies regarding the influence of external factors on the stock returns. Despite of
the indirect influence of the external factors on the cost of equity capital, the impact might be very
significant. The combination of external factors represents the state of economy development, which
promotes decrease or increase of CEC.
The finding of primary research has not been previously established in Czech Republic. The
finding is partly in agreement with international previous studies on the investigated issue. The
primary findings illustrate the CFO perception and experience regarding the cost of equity capital
determinants and show the possible gap in knowledge regarding investigated issue.
In order to make finding useful and applicable the methodology is created, which support decision
making process of companies in terms of CEC management. The cost of equity capital reduction is
one of the key targets of corporate financial management. The corporate managers are more confident
on the influence of external factors, which they cannot manage than the influence of internal factors,
which they are able to improve. The methodology is based on the expert evaluation, whose knowledge
and experience reflect the specifics of Czech Republic. Therefore, the current methodology
(respectively Index ICEC) is applicable for Czech companies.
129
As a general thing, there are some research limitations. The main limitation of the current research
is secondary data availability and the confidence and sensitivity of primary data. The information
regarding internal factors (i.e. the level of disclosure, corporate governance strength and etc.) are
stored in the international databases that was collected by authoritarian institutions. There was attempt
to gather such information for Czech companies in the most relevant and widely used databases as
DATASTREAM and COMPUSTAT (which are used in the most of studies around the world on the
investigated issue). Unfortunately, the required information for the Czech Republic is missing.
Moreover the internal and external factors differ in its availability and complexity, i.e. some of the
factors are simple and easy available and others are more complex in nature and require additional
access to necessary information. Another limitation connected with the first one is the confidence and
sensitivity of gathered information by the means of survey. It is the main reason of low transparent
level among Czech companies. The financial managers are not willing to share information that might
influence their performance if it becomes public available. The fear of disclosure can be explained of
lack of knowledge regarding possible impacts. Thus, the response rate of 5% is quite valuable and
acceptable for equity research topic. However, this dissertation work makes one of the first moves to
disclosure of information regarding the cost of equity capital and its determinants.
8.2. Contributions of research: theoretical and practical
The current thesis makes original and significant contribution to science and corporate practice.
From the scientific point of view there are theoretical contribution and empirical contribution of
the current thesis:
Accumulation of worldwide knowledge on the theme of the influence of the
internal and external factors on the CEC
Collection of unique primary data based on the evidence of Czech companies
Evaluation of the gap between theory and practice on the investigated issue
From the corporate point of view there are the following contributions:
The practical tool supporting corporate decision-making process
Improvement of the CFO knowledge regarding the influence of the internal and
external factors on the cost of equity capital
8.3. Recommendations for future research
The current research is promising and future-oriented. There are several recommendations for
future research to be extended. The collection of evidence on the cost of equity capital and internal
factors values included in the aggregate index for Czech Republic environment should be conducted.
This kind of primary data will increase the opportunity of Czech scientific society to conduct
130
comprehensive research in the field of corporate finance and in the context of current research
development will support analysis to identificate the exact coefficients of influence under certain
country’s specifics. In another words elimination of limitations of current research is a first step of
future research proposition. The further future step is based on regression analysis make a forecast of
macroeoconomic conditions and possible development of internal factors, which in the end will give a
predicted cost of equity capital.
Another recommendation is to create a prototype by the means of Python programing language, in
order to make simulations and test on the real companies. This tool will give opportunity to test the
methodology on the real companies.
131
Reference 1. ABOODY, D., HUGHES, J., LIU, J. Earnings quality, insider trading and cost of capital,
Journal of accounting research, 2005, Vol. 43, No. 5, pp. 651-673.
2. ABOUCH, M., SAIDI, A., FIRANO, Z. Financial stability: Definitions, theoretical foundations
and roles of the central banks. International research journal of finance and economics, 2012.
Vol. 84, pp. 76 – 94.
3. ADAMS, R. B. What do boards do? Evidence from board committee and director compensation
data. Working paper, 2003, University of Queensland, Available at
http://ssrn.com/abstract=397401
4. AFONSO, A., JALLES, J. T. Growth and productivity: the role of government debt.
International Review of Economics and Finance, 2013, Vol. 25, pp. 384-407.
5. AGUIAR, M., AMADOR, M., FARHI, E., GOPINATH, G. Sovereign debt booms in monetary
unions. American Economic Review: Papers and Proceeding, 2014, Vol. 104, No. 5, pp. 101-
106.
6. AĞCA, Ş., CELASUN, O. Sovereign debt and corporate borrowing costs in emerging markets.
Journal of International Economics, 2012, Vol. 88, No. 1, pp. 198- 208.
7. AKTAS, N., BELLETTRE, I., COUSIN, J.B. Capital structure decisions of French very small
busness, Revue de l’assocoation francaise de finance, 2011, Vol. 32, No. 1, pp. 43-73.
8. AKRAM, Q.F., EITRHEIM, Ø.. Flexible inflation targeting and financial stability: is it enough
to stabilize inflation and output? Journal of Banking and Finance, 2008, Vol. 32, pp. 1242-
1254.
9. ALLEN, W.A., WOOD, G. Defining and achieving financial stability, Journal of Financial
Stability, 2006, Vol. 2, pp. 152-172.
10. AMBRIŠKO, R., BABECKY, J., RYŠÁNEK, J, VALENTA, V. Assessing the impact of fiscal
measures on the Czech Economy, Working Paper Series CNB, 2012, No15, pp. 1-70.
11. ANDERSON, R. C., MANSI, S. A., REEB, D. M. Board characteristics, accounting report
integrity, and the cost of debt. Journal of accounting and economics, 2004, Vol. 34, pp. 315 –
342.
12. ARMSTRONG,C. S., CORE, J. E., TAYLOR, D. J., VERRECCIA, R. E. When does
information asymmetry affect the cost of capital? Journal of accounting research, 2011, Vol.
49, No. 1, ,pp. 1 – 40.
13. ARTETA, C., HALE, G. Sovereign debt crisis and credit to the private sector. Journal of
International Economics, 2008, Vol. 74, pp. 53 – 69.
132
14. ARTIACH, T., CLARKSON, P. Conservatism, disclosure, and the cost of equity capital,
Working paper, University of Queensland, 2010, pp. 1-34 Availbale at
http://papers.ssrn.com/sol3/papers.cfm?abstract_id=1673516
15. ARTIACH, T.C., CLARKSON, P. M. Disclosure, conservatism and the cost of equity capital: a
review of the foundation literature, Journal Accounting and Finance, 2011, Vol. 51, pp. 2-49.
16. APERGIS, N., ARTIKIS, G., ELEFTHERIOU, S., SORROS, J. Accounting information and
excess stock returns: the role of the cost of capital – new evidence from US firm-level data.
Applied financial economics, 2012, Vol. 22, No. 4, pp. 321-329.
17. APERGIS, N., ARTIKIS, G., ELEFTHERIOU, S., SORROS, J. Accounting information and
the cost of capital: the effect on excess stock returns-evidence from panel data. Working paper
No 13-2010, 2010a, Department of business administration, University of Piraeus
18. APERGIS, N., ARTIKIS, G., ELEFTHERIOU, S., SORROS, J. Accounting information, the
cost of capital and excess stock returns: the role of earnings quality-evidence from panel data.
Working paper No 17-2010, 2010b, Department of business administration, University of
Piraeus
19. APERGIS, N., ARTIKIS, G., ELEFTHERIOU, S., SORROS, J. Accounting information and
cost of capital: a theoretical approach. Modern Ekonomy, Vol. 2, 2011. pp. 589-596.
20. APERGIS, N., ELEFTHERIOU, S. The role of amcroeoconomic factors in explaining the cost
of capital: evidence from a group pf emerging economies, Asian journal of fiancne and
accounting, 2012, Vol. 4. No. 1, pp. 313-329.
21. ASHBAUGH, H., COLLINS, D. W., LaFOND, R. Corporate governance and the cost of equity
capital. Working Paper, December 2004. Available at: http://dx.doi.org/10.2139/ssrn.639681
22. BAGINSKI, S. P., RAKOW, K. C. Managaement earnings forecast disclsoure policy and the
cost of equity capital, Rev Account Sud, 2012, Vol. 17, pp. 279-321.
23. BALAKRISHNAN, R., DANNINGER, S., ELEKDAG, S., TYTELL, I., The transmission of
financial stress from advanced to emerging economies. IMF Working Paper, 2009, No 09/133
24. BALIKOV, V. Z. K voprosu o projishozhdenii kategorii capital//К вопросу о происхождении
категории капитал. Siberian financial school, 2008, Vol. 1, No. 66, pp.100-101.
25. BARAD, M. W. Capturing industry risk within cost of capital analysis, Business valuation
update, 2011, Vol. 17, No. 3, pp. 1-5.
26. BARTH, M., KONCHITCHKI, Y., LANDSMAN, W. R. Cost of capital and earnings
transparency, Journal of Accounting and Economics, 2013, Vol. 55, pp. 206-224.
133
27. BARRON, O., KIM, O., LIM, S.C., STEVENS, D.E. Using analysts‘ forecasts to measure
properties of analysts‘ infroamtion enviroemnt, The accounting review, 1998, Vol. 73, pp. 421-
433.
28. BARRON, O., SHENG, X., THEVENOT, M. Information enviroment and the cost of capital: a
new approach, Working papers 2012-12, American University, 2012, pp 1-35.
29. BASU. S. The conservatism principle and the asymmetric timeliness of earnings, Journal of
accounting and economics, 1997, Vol. 24, No. 1, pp. 3-37
30. BAUDUCCO, S., BULÍŘ, A., ČIHÁK, M. Monetary policy rules with financial instability,
Czech Journal of Economics and Finance, 2011, Vol. 61, No. 6, pp. 545-565
31. BAXA, J., HORVÁTH, R., VAŠÍČEK, B. Time-varying monetary-policy rules and financial
stress: Does financial instability matter for monetary policy? Journal of financial stability, 2013,
Vol. 9, pp. 117 – 138.
32. BEAVER, W. H., RYAN, S. G. Conditional and unconditional conservatism:concepts and
modeling, Review of accounting studies, 2005, Vol. 10, pp. 269-309.
33. BHOJRAJ, S., SENGUPTA, P. Effect of corporate governance on bond ratings and yields: the
role of institutional investors and outside directors. Journal of finance, 2003,Vol. 76, No. 3, pp.
455 – 475.
34. BLUNDELL-WIGNALL, A., SLOVIK, P. A market perspective on the European sovereign
debt and banking crisis OECD Journal: Financial Market Trends, 2011, Vol. 2, pp. 9-36.
35. BLUNDELL-WIGNALL, A. Solving the financial and sovereign debt crisis in Europe. OECD
Journal: Financial Market Trends, 2012, Vol. 2, pp. 201 – 234.
36. BOLTON, P., JEANNE, O. Sovereign default risk in financially integrated economies, IMF
Economic review, 2011, Vol. 59, No. 2, pp. 162-194.
37. BORENSZTEIN, E., COWAN, K., VALENZUELA, P. Sovereign ceilings Lite? The impact of
sovereign ratings on corporate ratings in emerging market economies, IMF working paper
WP/07/75, 2007, pp. 1-34
38. BOTASON, C. A. Disclosure level and the cost of equity capital. The accounting review, 1997,
Vol. 72, No. 3, pp. 323-349.
39. BOTASON, C. A., PLUMLEE, M. A. A re-examination of disclosure level and the expected
cost of equity capital. Journal of accounting research, 2002, Vol. 40, No. 1, pp. 21-40.
40. BORIO, C., LOWE, P. Securing sustainable price stability: should credit come back from the
wilderness? BIS Working Paper No. 157, 2004.
41. BORIO, C., ZHU, H. Capital regulation, risk-taking and monetary policy: a missing link in the
transmission mechanism? Journal of financial stability, 2012, Vol. 8, pp. 236-251.
134
42. BRUNER, R. F., EADES, K. M., HARRIS, R.S., HIGGINS, R.C. Best practices in estimating
the cost of capital: survey and synthesis, Financial practice and education, 1998, Vol. 8, No. 1,
pp. 13-28.
43. BUSHMAN, R. M., PIOTROSKI, J. D., SMITH, A. J. What determines corporate
transparency? Journal of Accounting Research, 2004, Vol. 42, No. 2, pp. 207-252.
44. BYUN, H.Y., KWAK, S. K., HWANG, L. S. The implied cost of equity capital and corporate
governance practices. Asia-Pacific journal of financial studies, 2008, Vol. 37, No. 10, pp. 139 –
184.
45. CARMINES, E.G., ZELLER, R. A. Reliablity and validity assessment, 1979, Newbury Park,
CA: Sage
46. CHAN A., LIN S., STRONG N. Accounting conservatism and the cost of equity capital: UK
evidence, Managerial finance, 2009, Vol. 35, No. 4, pp. 325 – 345.
47. CHEN, K. C. W., CHEN, Y., WIE, K. C. J. Agency costs of free cash flow and the effect of
shareholder rights on the implied cost of equity capital. Journal of financial and quantitative
analysis, 2011 (a), Vol. 46, No10, pp. 171 – 207.
48. CHEN, H., CHEN, J. Z., LOBO, G. J., WAMG, Y. Effects of audit quality on eanings
managment and cost of equiyt capital: evidence from China, Contemproray Accounting
Research, 2011 (b), Vol. 28, No. 3, pp. 892-925.
49. CHEN, Z., DHALIWAL, D. S., XIE, H. Regulation fair disclosure and the cost of equity
capital, Review of Accounting Studies, 2010, Vol. 15, pp. 106-144.
50. CHEN, N. F., ROLL, R., ROSS, S.A. Economic forces and the stock market, Jounral of
business, 1986, Vol. 59, pp. 383-403.
51. CHENG A., COLLINS D., HUANG H. Shareholder rights, financial disclosure and the cost of
equity capital, Review of Quantitative Finance and Accounting, 2006, Vol. 27, pp. 175-204.
52. CLAUS, J. , THOMAS, J. Equity premium as low three procent? Evidence from analysts‘
earnings forecasts for domestic and international stock markets, Journal of finance, 2001,Vol.
56, No. 5, pp. 1629 -1666.
53. CHOI, T. Do ethical companies have lower implied cost of equity capital? Evidence from the
Korean stock market, Asian Business & Management, 2012, Vol. 11, No. 2, pp. 219-246.
54. CHOI, T., JUANG, J. Ethical commitment, financial performance and valuation: An empirical
investigation of Korean companies. Journal of Business Ethics, 2008, Vol.81, No. 2, pp. 447–
463.
135
55. CLAESSENS, S., YORTOGLU, B.B. Corpoarte governance in emerging markets: A survey,
Emerging markets review, 2013, Vol. 15, June, pp. 1-33.
56. COLLINS, D., HUANG, H. Management entrenchment and the cost of equity capital, Journal
of business research, 2011, Vol. 64, pp. 356-362.
57. COLLINS, J., HUSSEY, R. Business research: Apractical guide for undergraduate and
postgraduate students, Second edition, Palgavre Macmillan, 2003, pp. 350, ISBN 0333983254
58. COPELAND, T. E., GALAI, D. Information effects on the bid-ask spreads. The journal of
finance, 1983, Vol. 38, Vol. 5, pp. 1457 – 1469.
59. COPELAND, T., KOLLER, T., MURRIN, J. Valuation measuring and managing the value of
companies. New York: Jojn Wiley & sons, 2000, pp. 490
60. CORSETTI, G., KUESTER, K., MEIER, A., MÜLLER, G.J. Sovereign risk and belief-driven
fluctuations in the euro area. Journal of Monetary Economics, 2014, Vol. 61, pp. 53-73.
61. CROCKETT, A. The theory and practice of financial stability. De economist, 1996, Vol. 144,
No. 4, pp. 531-568.
62. CÚRDIA, V., WOODFORD, M. (2010). Conventional and Unconventional monetary policy,
Federal Reserve Bank of St. Luis Review, 2010, Vol.92, No. 4, pp. 229-64.
63. DAILAMI, M. Sovereign debt distress and corporate spill over impacts, Policy Research
Working Paper 5380, 2010, pp. 1- 26
Available at:
https://openknowledge.worldbank.org/bitstream/handle/10986/3864/WPS5380.pdf?sequence=1
64. DASKE, H. Economic benefits of adopting IFRS or US-GAAP – Have the expected cost of
equity capital really decreased? Journal of business & accounting, Vol. 33, No. 3 & 4, 2006, pp.
329-373.
65. DASKE, H., HAIL, L., LEUZ, C., VERDI, R. Mandatory IFRS reporting around the world:
early evidence on the economic consequences. Journal of accounting research, 2008, Vol. 46,
No. 5, pp. 1085 – 1142.
66. DeBOSKEY, D. G., GILLETT, P.R. The impact of multi-dimensional corporate transparency
on us firms’ credit ratings and cost of capital, Revue of Quantitative Finance and Accounting,
2013, Vol. 40, pp. 101-134.
67. DHALIWAL, D., LI, O. Z., TSANG, A., YANG, Y. G. Corporate social responsibility
disclosure and the cost of equity capital: the roles of stakeholder orientation and financial
transparency, Journal accounting and public policy, 2014, Vol. 33, pp. 328-355
136
68. DIAMOND, D., W., VERRECCHIA, R., E. Disclosure, liquidity and the cost of capital. The
Journal of Finance, Vol. 46, No. 4, 1991, pp. 1325 – 1359.
69. DONALDSON, G. Financial goals: management vs. stockholders, Harvard Business Review,
1963, Vol. 41, No. 3, pp. 116-129.
70. EASTON, P. D. PE ratios, PEG ratios, and estimating the implied expected rate of return on
equity capital. The accounting review. 2004, Vol. 79, No. 1, pp. 73 – 95.
71. EASLEY, D., O’HARA, M. Information and the cost of capital. Journal of finance, 2004, Vol.
59, No. 4, pp. 1553-1584.
72. EATON, J. Sovereign debt: A primer, The World Bank Economic Review 1993, Vol. 7, No. 2,
pp. 137-172.
73. ELLIOTT, J. W. The cost of capital and U.S. capital investment: a test of alternative concepts,
The journal of finance, 1980, Vol. 35, No. 4, pp. 981 – 999.
74. ERTUGAL, M., HEGDE, S. Board compensation practices and agency costs of debt. Journal of
corporate finance, 2008, Vol. 14, pp. 512 – 531.
75. ESPINOSA, M. , TROMBETTA, M. Disclosure interactions and the cost of equity capital:
evidence from the Spanish continuous market. Journal of business finance & accounting, 2007,
Vol. 34, No. 9 & 10, pp. 1371-1392.
76. FAMA, E, FRENCH, K. Business conditions and expected returns on stocks and bonds, Journal
of financial economics, 1989, Vol. 25, pp. 23-49.
77. FAMA, E., FRENCH, K. Common risk factors in stock and bond returns, Journal of financial
economics, 1993, Vol. 33, pp. 3-56.
78. FAMA, E., FRENCH, K. Disappearing dividends: changing firm characteristics or lower
propensity to pay? CRSP Working Paper, 2000, No. 509, pp. 1-53.
79. FAMA, E., FRENCH, K. The capital asset pricing model: theory and evidence. CRSP Working
Pape, 2003, No. 550, pp. 1-35.
80. FAWLEY, B.W., NEELY, C.J. Four stories of quantitative easing, Federal Reserve Bank of St.
Louis Review, 2013, Vol. 95, No. 1, pp. 51-88.
81. FELTMAN, G., ROBB, S., ZHANG, P. Precision in accounting information, financial leverage
and the value of equity. Journal of business finance & accounting, 2007, Vol. 34, No. 7 & 8, pp.
1099-1122.
137
82. FENG, Z-Y., WANG, M-L., HUANG, H-W. Equity financing and social responsibility: further
international evidence, The international journal of accounting, 2015, Vol. 50, No. 3, pp. 247-
280.
83. FERGUSON, R.W. Should financial stability be an explicit central bank objective? Challenges
to central banking from globalized financial systems, conference at the IMF in Washington,
D.C., 2002, September 16- 17, pp. 1-13.
84. FERNANDO, G. D., ABDEL-MEGUID, A. M., ELDER, R. J. Audit quality attributes, client
size and cost of equity capital, Review of accounting and Finance, 2010, Vol. 9, No 4, pp. 363-
381.
85. FISHER, I. The nature of capital and income, 1906 New York,Mc millan company; London,
Macmillan &Co., Ltd p.
Available at https://archive.org/details/natureofcapitali00fishuoft
86. FISGER, I. The theory of interest, 1930, New York: The Macmillan Co. 1st edition, p. 34
Available at http://www.econlib.org/library/YPDBooks/Fisher/fshToICover.html
87. FRAIT, J., KOMÁRKOVÁ, Z. Financial stability, systemic risk and macroprudental policy,
Czech National Bank, Financial Stability Report 2010/2011, 2011, pp. 96 - 110
88. FREEDMAN, C., GOODLET, C. Financial stability: What it is and why it matters,
Commentary – C.D. Howe Institute Commentary, 2007, November, Vol. 256, pp. 1-23.
89. GALE, W. G.; ORZAG, P.R. The economic effects of long-term fiscal discipline, Tax Policy
Center Discussion Paper, 2003, Vol. 8, pp. 1-61.
90. GALE, W. G.; ORZAG, P.R Deficits, interest rates, and user cost of capital: a reconsideration of
the effects of tax policy on investment, National Tax Journal, 2005, Vol. 58, No. 3, pp. 409-
426.
91. GEITZMANN, M., TROMBETTA, M. Disclosure interactions: accounting policy choice and
voluntary disclosure effects on the cost of raising outside capital. Accounting and Business
Research, 2003, Vol. 33, No. 3, pp. 187-205.
92. GEITZMANN, M., IRELAND, J. Cost of capital, strategic disclosure and accounting choice.
Journal of business finance & accounting, 2005, Vol. 32, No. 3 & 4, pp. 599 – 634.
93. GERŠL, A., HEŘMÁNEK, J. Financial stability indicators: advantages and disadvantages of
their use in the assessment of financial system stability, CNB Financial Stability Report 2006,
2007, pp. 69-79
94. GHOUL, S. E., GUEDHAMI, O., KWOK, C. C.Y., MISHRA, D. R. Does corporate social
responsibility affect the cost of capital? Journal of Banking & Finance, 2011, Vol. 35, pp. 2388-
2406.
138
95. GITMAN, L. J., MERCURIO, V. A. Cost of capital techniques used by major U.S. firms:
survey and analysis of Fortune’s 1000, Financial management, 1982, Vol. 11, No. 4, pp. 21-29.
96. GIVOLY, D., HAYN, C. The changing time-series propeties of earnings, cash flows and
accruals: has financial reporting become more conservative?, Journal of accounting and
economics, 2000, Vol. 29, pp. 287-320.
97. CODE, D., MOHANRAM, P. Inferring the cost of capital using the Ohlson-Juettner model.
Review of accounting studies, 2003, Vol. 8, pp. 399 – 431.
98. GOMES, A., GORTON, G., MADUREIRA, L. SEC regulation fair disclosure, information, and
the cost of capital. Journal of corporate finance, 2007, Vol. 13, pp. 300-334.
99. GOMPERS, P., ISHII, J. L., METRICK, A. Corporate governance and equity prices. Quarterly
journal of economics, 2003, Vol. 118, No. 1, pp. 107-155.
100. GOODHART, C.A.E., SUNIRAND, P., TSOMOCOS, D. P. The optimal monetary instrument
for prudential purposes, Journal of financial stability, 2011, Vol.7, pp. 70-77.
101. GUEDHAMI, O., MISHRA, D. Excess control, corporate governance and implied cost of
equity: international evidence, The financial review, 2009,Vol. 44, pp. 489-524.
102. HAIL, L. The impact of voluntary corporate disclosures on the ex-ante cost of capital for Swiss
firms. The European accounting review, 2002, Vol. 11, No. 4, pp. 741-773.
103. HAIL, L., Leuz, C. Cost of capital effects and changes in growth expectations around U.S.
cross-listings. Journal of financial economics, 2009, Vol. 93, pp. 428 – 454.
104. HALE, G. Bonds or loans? The effect of macroeconomic fundamentals. The Economic Journal,
2007, Vol. 17, pp. 196-215.
105. HALEY, C., SCHALL, L. Problems with the concept of the cost of capital, Journal of financial
and quantitative analysis, 1978, Vol. 13, Vol. 5, pp. 847-870.
106. HANNOUN, H. Towards a global financial stability framework, Bank for international
settlements, Speech, the 45th SEACEN Governors' Conference, Siem Reap province, Cambodia,
26-27 February 2010
107. HAMON, J., JASQUILLAT, B. Is there value-added information in liquidity and risk
premiums? European financial management, 1999, Vol. 5, No 3, pp. 369 – 393.
108. HEALY, P., PALEPU, K. Information asymmetry, corporate disclosure and the capital
markets: a review of the empirical disclosure literature, Journal of accounting and economics,
2001, Vol. 31, pp. 1-3.
139
109. HIMME, A., FISCHER, M. Drivers of the cost of capital: the joint role of non-financial
metrics, International Journal of research in marketing, 2014, Vol. 31, pp. 224-238.
110. HOBERG, G., PRABHALA, N. R., Disappearing dividends, catering and risk. The review of
financial studies, 2009, Vol. 22, No. 1, pp. 79-116.
111. HOGGARTH, G., REIS, R., SAPORTA, V. Costs of banking system instability: some
empirical evidence, Journal of banking and finance, 2002, Vol. 26, pp. 825 – 855.
112. HOPE, O. K., KANG, T., THOMAS, W. B., YOO, Y. K. Impact of excess auditor
remuneration on cost of equity capital around the world. Working paper, March 30, 2008, pp.
177 – 210. Available at: http://dx.doi.org/10.2139/ssrn.1114824
113. HOUBEN, A., KAKES, J., SCHINASI, G. Towards a framework for safeguarding financial
stability, IMF Working paper No. 04/101, 2004
114. HUANG H., WANG Q., ZHANG X. The effect of CEO ownership and shareholder rights on
cost of equity capital. Corporate Governance, 2009, Vol. 9, No 3, pp. 255-270.
115. HUANG, R., RITTER, J.R. Testing theories of capital structure and estimating the speed of
adjustment. Journal of financial and quantitative analysis, 2009, Vol. 44, No. 2, pp. 237-271.
116. HUANG, H. H., WU, S. Individual shareholderrights provisions and cost of capital,
International journal of law and management, 2010, Vol. 52, No. 6, pp. 415-428
117. HUI X., LUO W., LI M. Empirical study of the relationship between voluntary disclosure and
the cost of equity capital. Management science and engineering, 2006, pp. 1446 – 1451.
118. ILLING, M., LIU, Y., An index of financial stress for Canada, Bank of Canada Working paper
2003-14, 2003.
119. INDJEJIKIAN, R. J. Discussion of accounting information, disclosure, and the cost of capital.
Journal of accounting research, 2007, Vol. 45, No. 2, pp. 421 – 426.
120. JOPPE, M. The research process. Retrieved February 25, 1998, Available at: http://www.
yerson.ca/~mjoppe/rp.htm , 2000
121. JUNEVICIUS A., LIUTKUS, E. The EU sovereign debt crisis and “European bonds” option.
European Integration Studies, 2011, Vol. 5, pp. 125-131.
122. KARAMANOU, I., NISSIOTIS, G. P. Disclosure and the cost of capital: evidence from the
market’s reaction to firm voluntary adoption of IAS. Journal of business & accounting, 2009,
Vol. 36, No. 7, pp. 793-821.
140
123. KASHEEVA, A.V. Kvantitativnie i kolichestvennie metody issledovania v prikladnou
lingvistike, Sovremennaja lingvistika a literaturovedenie/Квантитативные и количественные
методы исследования в прикладной лингвистике, Современная лингвистика и
литературоведение, 2013, Vol. 3, No. 049, pp. 155-162
124. KIM, J. W., SHI, Y. Voluntary disclosure and the cost of equity capital: Evidence from
management earnings forecasts, Journal of Accounting and Public Policy, 2011, Vol. 30, pp.
348-366
125. KOVALEV V.V. , V.V. (JR.) KOVALEV. Corporate finance and management: notions,
algorithms and estimates: textbook . Moscow, Russia: Prospect Ltd Publishers, 2014. – 880 p.
ISBN 978-5-392-13470-0
126. KOMKOVA, ZH. L. The capital: economic and accounting aspects, The Bulletin
of Adyghe State University: Internet Scientific Journal, The Economic theory, 2011, Vol. 2, pp.
1-8
127. KOTENKO, V.P. Paradigma kak metodologia nauchnoj dejatelnosti, Bibliosfera/ Парадигма
как методология научной деятельности, Библиосфера, 2006, Vol. 3, pp. 21-25
128. KUMAR, M. S., WOO, J. Public debt and growth, IMF Working paper 10-174, 2010,
International monetary fund, pp. 1- 47
129. KYLE, A. S. Continuous auctions and insider trading. Econometrica, 1985, Vol. 53, No 6, pp.
1315- 1336.
130. LABONTE, M. Federal reserve: unconvebtional moentary policy options, CRS reports for
congress, February, 2014, pp. 1- 37
Available at: https://www.fas.org/sgp/crs/misc/R42962.pdf
131. LAMBERT, R., LEUZ, R., VERRECCHIA, R. E. Accounting information, disclosure and the
cost of capital. Journal of accounting research, 2007, Vol. 45, No. 2, pp. 385-420.
132. LANCE, C.E., BUTTS, M.M. AND MICHELS, L.C. The sources of four commonly reported
cutoff criteria: What did they really say? Organizational research methods, 2006, Vol. 9, No. 2,
pp. 202-220.
133. LANG, M. AND LUNDHOLM, R. Cross-sectional determinants of analyst ratings of corporate
disclosures, Journal of accounting research, 1993, Vol. 31, No. 2, pp. 246-271
134. LARA, J. M. G, OSMA, B. G., PENALVA, F. Accounting conservatism and corporate
governance. Review of accounting studies, 2009, Vol. 14, No. 1, pp. 161 – 201.
135. LARA, J. M. G, OSMA, B. G., PENALVA, F. Conditional conservatism and the cost of capital,
Review of accounting studies, 2011, Vol. 16, No. 2, pp. 247-271
141
136. LEE,C., AND CUMMONS, D. Alternative models for estimating the cost of equity capital for
property/casualty insurers. Review of quantitative finance and accounting, 1998, Vol. 10, pp.
235 – 267.
137. LEUZ, R. AND VERRECCHIA, R. E. The economic consequences of increased disclosure.
Journal of accounting research, 2000, Vol. 38, pp. 91 – 124.
138. LEVITT, A. Commentary: The importance of high quality accounting standards. Accounting
horizons, 1998, Vol. 12, No. 1, pp. 79-82.
139. LI, M., HUI, H. Regulation Fair Disclosure’s effects on the cost of capital: financial innovation
or policy failure. Wireless Communications, Networking and Mobile Computing, 2007,
International Conference, pp.3919-3922.
Available at:
http://ieeexplore.ieee.org/stamp/stamp.jsp?tp=&arnumber=4340744&isnumber=4339775
140. LI, G. Information quality, learning, and stock market returns. Journal of financial and
quantitative analysis, 2005, Vol. 40, No.3, pp. 595-620.
141. LI, S. Does mandatory adoption of international financial reporting standards in the European
Union reduce the cost of equity capital? The accounting review, 2010, Vol. 85, No. 2, pp. 607-
636.
142. LOPES, A. B. AND ALENCAR, R. C. Disclosure and cost of equity capital in emerging
markets: the Brazilian case. The international journal of accounting, 2010, Vol. 45, pp. 443-
464.
143. LORCA, C., SANCHEZ-BALLESTA, J. P., GARCIA-MECA, E. Board effectiveness and cost
of debt. Journal of business ethics, 2010, Vol. 100, pp. 613 – 631.
144. LUI, A. K. H., NGAI, E. W.T., LO, C. K.Y. Disruptive information technology innovations and
the cots of equity capital: the moderating effect of CEO incentives and institutional pressures,
Informationa & Management, 2016, Vol. 53, pp. 345-354
145. LY, K. Investor realtions level and cost of capital: evidence from Japanese firms, Asia-Pacific
journal of business administration, 2010, Vol. 2, No. 1, pp. 88-104
146. MACAVOY, P. AND MILLSTEIN, I. The active board of directors and its effect on the
performance of the large publicly traded corporation. Journal of applied corporate finance,
1999, Vol. 11, No 4, pp. 8-20.
142
147. MASSARI, M., RONCAGLIO, F. & ZANETTI, L. On the equivalence between the APV and
the WACC approach in a growing leverage firm. European Financial Management, 2007, Vol.
14, No. 1, pp. 152 – 162.
148. MAZZOTTA, R. AND VELTRI, S. The relationship between corporate governance and the cost
of equity capital. Evidence from the Italian stock exchange, Journal of Management &
Governance, Vol. 18, pp. 419-448
149. MCINNES J. Earnings smoothness, average returns and implied cost of equity capital. The
accounting review, 2010, Vol. 85, No 1, pp. 315-341.
150. MIKHAIL, M. B., WALTHER, B. R. AND WILLIS, R. H. Earnings surprises and the cost of
equity capital, Journal of accounting, auditing, and finance, 2004, Vol. 19, pp. 491-513
151. MILLER, D. AND FRIESEN, H. P. A Longitudinal study of the corporate life cycle,
Management science, 1984, Vol. 30, No 10, pp. 1161 – 1183.
152. MILLER, L. M. Barbarians to Bureaucrats: Corporate Life Cycle strategies. Lessons from the
rise and fall civilizations, Clarkson Potter, New York, 1989, p. 232.
153. MISHKIN, F.S. Asymmetric information and financial crisis: in historical prospect. Financial
markets and financial crises, 1991, pp. 69-108.
154. MODIGLIANII F.AND MILLER, M. H. The cost of capital, corporation finance and the theory
of investment, American Economic Review, 1958, Vol. 48, No. 3, pp. 261 – 287
155. MODIGLIANI F. AND MILLER, M. H. Corporate income taxes and the cost of capital.
American Economic Review, 1963, June.
156. MOORE, J. AND REICHERT, A. K. An analysis of the financial management techniques
currently employed by large U.S. corporations, Journal of business finance and accounting,
1983, Vol. 10, Iss. 4, pp. 623-645.
157. MYERS, S. C. The capital structure puzzle, Journal of Finance, 1984, Vol. 39, No. 3, pp. 575–
592.
158. MYERS, S.C., MAJLUF, N.S. Corporate financing and investment decisions when firms have
information that investors do not have, Journal of finanial economics, 1984, Vol. 13, pp.187-
221
159. NELSON, W.R., PERLI, R. Selected indicators of fiacnial stability, 4th joint central bank
research conference on risk measuremtn and systemic risk, Frnakfurt am Main: ECB,
November, 2005, pp. 1-30
143
160. NG, A. C., REZAEE, Z. Business sustainability perfromance and cost of e quity capital,
Journal of corporate finance, 2015, Vol. 34, pp. 128-149
161. NUNNALLY, J. Psychometric theory, (2nd edition), 1978, New York: McGraw-Hill
162. NUNNALLY, J., BERSTEIN, J.H. Psychometric theory, (3nd edition), 1978, New York:
McGraw-Hill
163. OECD, G20/OECD Principles of Corporate Governance, Report to G20 finance ministers and
central bank governors, September 2015, pp. 1-66
164. ORTIZ-MOLINA H., PHILLIPS G. Asset liquidity and the cost of capital. Working paper,
University of British Columbia and University of Maryland and National Bureau of Economic
Research, 2009
165. PARK, C., PINCUS, M. Internal versus external equity funding sources and earnings response
coefficients. Review of quantitative finance and accounting, 2001, Vol. 16, pp. 33-52.
166. PAE, J., CHOI, T. H. Corporate governance, commitment to business ethics, and firm valuation:
evidence from the Korean stock market. Journal of business ethics, 2011, Vol. 100, pp. 323 –
348.
167. PANIZZA, U.; STURZENEGGER, F.; ZETTELMEYER, J. The economics and law of
sovereign debt and default Journal of Economic Literature, 2009, Vol. 47, No. 3, pp. 651-698.
168. PIOT, C., MISSIONER-PIERA, F. Corporate governance reform and the cost of debt financing
of listed french companies. Working paper series, September, 2009, pp. 1 -43.
169. PRINZ, A., BECK, H. Fighting debt explosion in the European sovereign debt crisis,
Intereconomics, 2012, Vol. 47, No. 3, pp. 185-198.
170. PUTMAN, B. H Essential concepts necessary to consider when evaluating the efficacy of
quantitative easing. Review of financial economics, 2013, Vol. 22, pp.1-7
171. RAKOW, K.C. The effect of management earnings forecast characteristics on cost of equity
capital, Advances in accounting, incorporating advances in international accounting, Vol. 26,
2010, pp. 37-46.
172. RAMLY, Z. Impact of corporate governance quality on the cost of equity capital in an emerging
market: Evidence from Malaysian listed firms, African Journal of Business Management, 2012,
Vol. 6, No. 4, pp. 1733-1748
173. REVERTE C. Do better governed firms enjoy a lower cost of equity capital?: evidence from
Spanish firms. Corporate Governance, 2009, Vol. 9, No 2, pp. 133-145
144
174. RICHARDSON, A. J., WELKER, M. Social disclosure, financial discloure anf the cost of
equity capital, Accounting, Organizations and Society, 2001, Vol. 26, pp. 597-616
175. ROSS, S. The arbitrage theory of capital asset pricing. Journal of economic theory, 1976, Vol.
13, No. 3, pp. 341-360.
176. SABAL J. WACC or APV? Journal of business valuation and economic loss analysis, Vol. 2.
Issue 2, 2007, pp. 1-15.
177. SANDLERIS, G. 2008. Sovereign defaults: information, investment and credit, Journal of
International Economics 76: 267 – 275.
178. SCOTT, R.; MOOSA, S.; PONARUL. Government debt in the macroeconomy and finance.
Review of Business Research. 2008, Vol. 8, No. 5, pp. 198 – 202.
179. SHAH, S. Z. A., BUTT, S .A. The impact of corporate governance on the cost of equity:
empirical evidence from Pakistan listed companies. The Lahore journal of economics, 2009,
Vol. 14, No. 1, pp. 139 – 171.
180. SHARFMAN, M. P., FERNANDO, C. S. Environmental risk management and the cost of
capital, strategic management journal, 2008, Vol. 29, pp. 569-592.
181. SHENG, X., THEVENOT, M. A new measure of earnings forecast uncertainty, journal of
accounting and economics, 2012, Vol. 53, No. 1-2, pp. 21-33.
182. SHCHERBAKOV, V.A. AND PRIKHODKO, E.A. Kratkosrochnaja finansovaja politika/
Краткосрочная финансовая политика, Uchebnoje posobie/Учебное пособие, 2d edition, М:
КНОРУС, 2007, pp. 272, ISBN 5-85971-673-7
183. SHINASI, G. J. Defining financial stability. IMF Working paper, WP/04/187, 2004, pp. 1-18.
184. SILVIA, J. AND IQBAL, A. Monetary policy, fiscal policy and confidence, International
Journal of economics and finance, 2011, Vol. 3, No. 4, pp. 22-35.
185. SINGH, M., FAIRCLOTH, S., NEJADMALAYERI, A. Capital market impact of the product
marketing strategy: evidence from the relationship between advertising expenses and cost of
capital, Journal Academy of marketing science, 2005,Vol. 33, No. 4, 2005, pp. 432-444.
186. SIPKO, J., Financial stability and reform of the financial system. Creative and Knowledge
Society. 2010. Vol. 2, No. 2, pp. 58-69.
187. SNB, Financial stability report 2006, Swiss National Bank, June 2006, pp. 1-60
188. TAYLOR, J. B. Discretion versus policy rules in practice, Carnegie-Rochester Conference on
Public Policy, 1993, Vol. 39, pp. 195-214.
145
189. TITMAN, S., WESSELS, R. The determinants of capital structure choice. The journal of
finance, 1988, Vol. 43, No. 1, pp. 1 - 19.
190. TRAN, D. H. Multiple corporate governance attributes and the cost of capital – evidence from
Germany, The British Accounting Review, 2014, Vol. 4, No. 2, pp. 179-197
191. TRICHET, J-C. Unconventional monetary policy measures: principles-conditions-Raison d’être,
International Journal of Central Banking, 2013, Vol. 9, No.S1, pp. 229-250
192. UDAIBIR, S.D., PAPAPIOANNOU, M., GUILHERME, P., FAISAL, A., SURTI, J. Managing
public debt and its financial stability implications. IMF Working Paper, 2010, WP/10/280.
193. URECHE-RANGAU, L., BURIETZ, A. One crisis, two crises…the subprime crisis and the
European sovereign debt problems, Economic modeling, 2013, Vol. 35, pp. 35-44
194. USHAKOVA, T.I. The account and analysis in management of the organization capital:
Author’s summary of dissertation for Candidate of Economics degree, Yoshkar Ola, 2005
195. VAFEAS N. Board structure and the informativeness of earnings. Journal of accounting and
public policy, 2000, Vol. 19, No.2, pp. 139-160.
196. VALVI, A.C., FRAGKOS, K.C., FRANGOS, C.C. The International Monetary Fund, the World
Bank and financial stability: the case of Russian and East Asian financial crises, Journal of
economics studies and research, 2012: 1-26. Available at:
http://www.ibimapublishing.com/journals/JESR/2012/904328/a904328.html
197. VAN DEN END, J. W. Indicator and Boundaries of financial stability, DNB Working paper N
97, March 2006, pp. 1-24
198. Weisbach M. Outside directors and CEO turnover. Journal of financial economies, 1998, Vol.
20, pp. 431-460
199. YERMACK D. Higher market valuation of companies with small board of directors. Journal of
financial economies, 1996, Vol. 40, No 2, pp. 185-211.
200. YU L., WANG Y. Auditing quality and the cost of equity capital. Wireless communications,
Networking and mobile computing, 2008, pp. 1-5
201. WATTS, R. L. Conservatism ina ccounting Part I: Explanations and implications, Accounting
Horizons, 2003, Vol. 17. No. 3, pp. 207-221

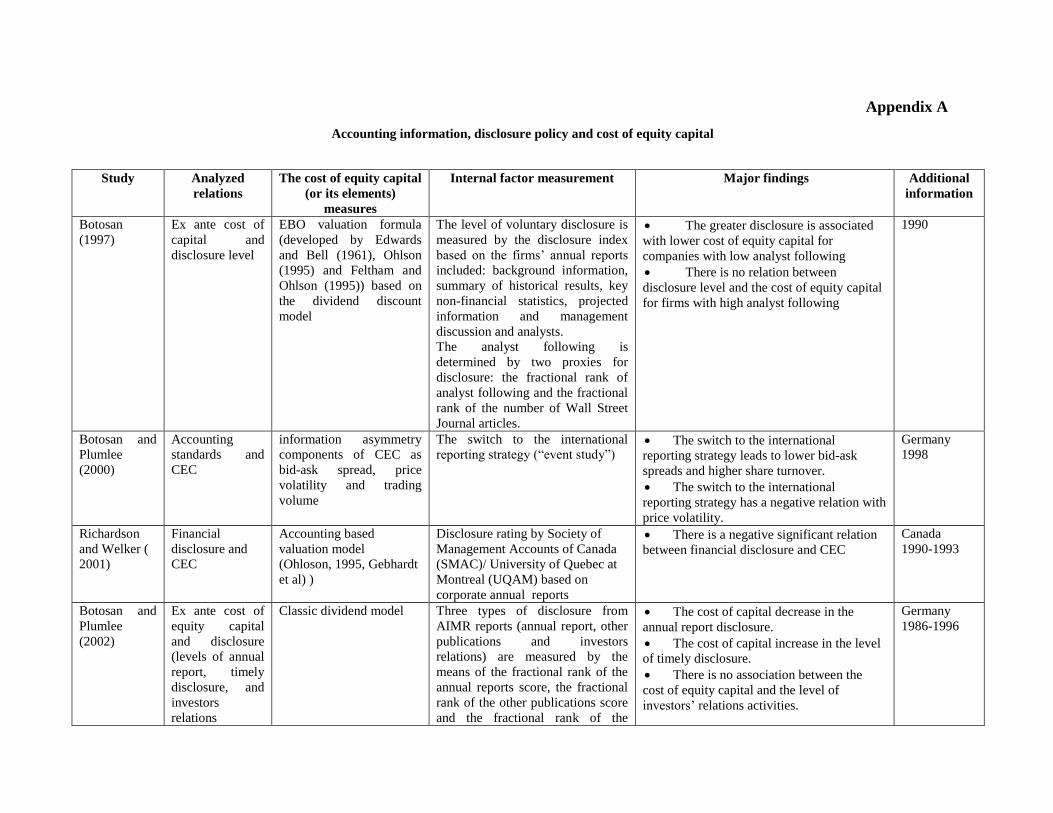
Appendix A
Accounting information, disclosure policy and cost of equity capital
Study Analyzed
relations
The cost of equity capital
(or its elements)
measures
Internal factor measurement Major findings Additional
information
Botosan
(1997)
Ex ante cost of
capital and
disclosure level
EBO valuation formula
(developed by Edwards
and Bell (1961), Ohlson
(1995) and Feltham and
Ohlson (1995)) based on
the dividend discount
model
The level of voluntary disclosure is
measured by the disclosure index
based on the firms’ annual reports
included: background information,
summary of historical results, key
non-financial statistics, projected
information and management
discussion and analysts.
The analyst following is
determined by two proxies for
disclosure: the fractional rank of
analyst following and the fractional
rank of the number of Wall Street
Journal articles.
The greater disclosure is associated
with lower cost of equity capital for
companies with low analyst following
There is no relation between
disclosure level and the cost of equity capital
for firms with high analyst following
1990
Botosan and
Plumlee
(2000)
Accounting
standards and
CEC
information asymmetry
components of CEC as
bid-ask spread, price
volatility and trading
volume
The switch to the international
reporting strategy (“event study”) The switch to the international
reporting strategy leads to lower bid-ask
spreads and higher share turnover.
The switch to the international
reporting strategy has a negative relation with
price volatility.
Germany
1998
Richardson
and Welker (
2001)
Financial
disclosure and
CEC
Accounting based
valuation model
(Ohloson, 1995, Gebhardt
et al) )
Disclosure rating by Society of
Management Accounts of Canada
(SMAC)/ University of Quebec at
Montreal (UQAM) based on
corporate annual reports
There is a negative significant relation
between financial disclosure and CEC
Canada
1990-1993
Botosan and
Plumlee
(2002)
Ex ante cost of
equity capital
and disclosure
(levels of annual
report, timely
disclosure, and
investors
relations
Classic dividend model
Three types of disclosure from
AIMR reports (annual report, other
publications and investors
relations) are measured by the
means of the fractional rank of the
annual reports score, the fractional
rank of the other publications score
and the fractional rank of the
The cost of capital decrease in the
annual report disclosure.
The cost of capital increase in the level
of timely disclosure.
There is no association between the
cost of equity capital and the level of
investors’ relations activities.
Germany
1986-1996
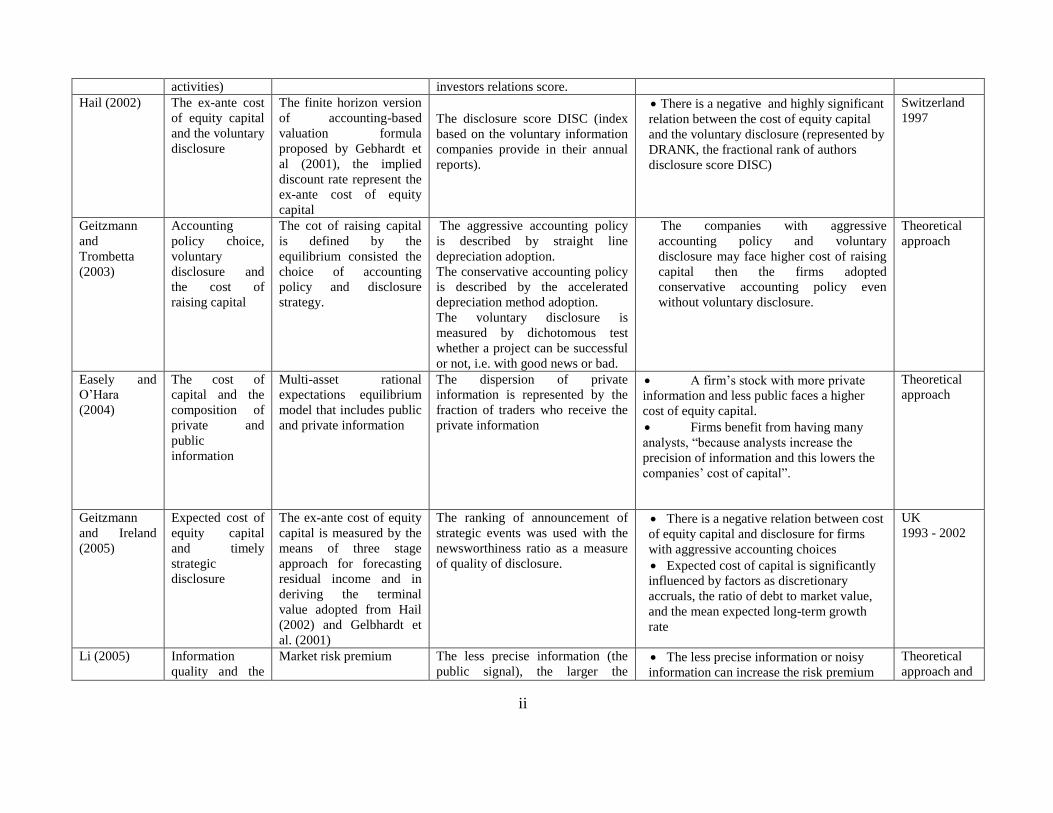
ii
activities) investors relations score.
Hail (2002) The ex-ante cost
of equity capital
and the voluntary
disclosure
The finite horizon version
of accounting-based
valuation formula
proposed by Gebhardt et
al (2001), the implied
discount rate represent the
ex-ante cost of equity
capital
The disclosure score DISC (index
based on the voluntary information
companies provide in their annual
reports).
There is a negative and highly significant
relation between the cost of equity capital
and the voluntary disclosure (represented by
DRANK, the fractional rank of authors
disclosure score DISC)
Switzerland
1997
Geitzmann
and
Trombetta
(2003)
Accounting
policy choice,
voluntary
disclosure and
the cost of
raising capital
The cot of raising capital
is defined by the
equilibrium consisted the
choice of accounting
policy and disclosure
strategy.
The aggressive accounting policy
is described by straight line
depreciation adoption.
The conservative accounting policy
is described by the accelerated
depreciation method adoption.
The voluntary disclosure is
measured by dichotomous test
whether a project can be successful
or not, i.e. with good news or bad.
The companies with aggressive
accounting policy and voluntary
disclosure may face higher cost of raising
capital then the firms adopted
conservative accounting policy even
without voluntary disclosure.
Theoretical
approach
Easely and
O’Hara
(2004)
The cost of
capital and the
composition of
private and
public
information
Multi-asset rational
expectations equilibrium
model that includes public
and private information
The dispersion of private
information is represented by the
fraction of traders who receive the
private information
A firm’s stock with more private
information and less public faces a higher
cost of equity capital.
Firms benefit from having many
analysts, “because analysts increase the
precision of information and this lowers the
companies’ cost of capital”.
Theoretical
approach
Geitzmann
and Ireland
(2005)
Expected cost of
equity capital
and timely
strategic
disclosure
The ex-ante cost of equity
capital is measured by the
means of three stage
approach for forecasting
residual income and in
deriving the terminal
value adopted from Hail
(2002) and Gelbhardt et
al. (2001)
The ranking of announcement of
strategic events was used with the
newsworthiness ratio as a measure
of quality of disclosure.
There is a negative relation between cost
of equity capital and disclosure for firms
with aggressive accounting choices
Expected cost of capital is significantly
influenced by factors as discretionary
accruals, the ratio of debt to market value,
and the mean expected long-term growth
rate
UK
1993 - 2002
Li (2005) Information
quality and the
Market risk premium The less precise information (the
public signal), the larger the The less precise information or noisy
information can increase the risk premium
Theoretical
approach and
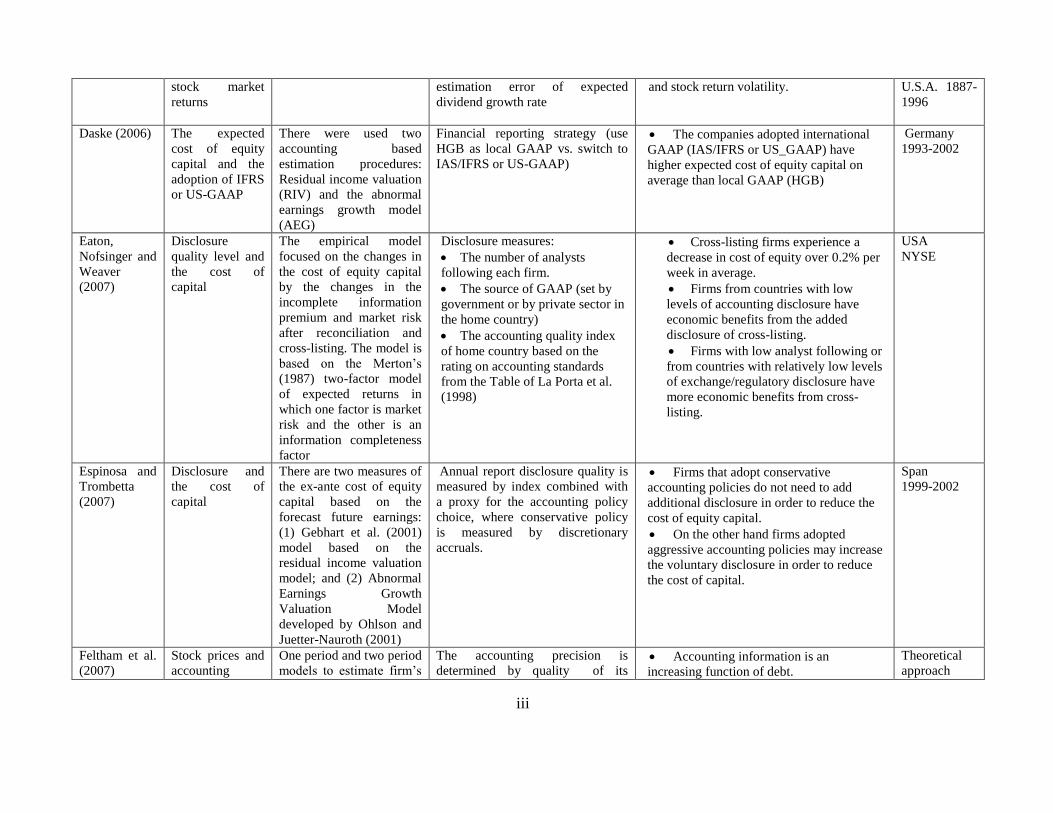
iii
stock market
returns
estimation error of expected
dividend growth rate
and stock return volatility. U.S.A. 1887-
1996
Daske (2006) The expected
cost of equity
capital and the
adoption of IFRS
or US-GAAP
There were used two
accounting based
estimation procedures:
Residual income valuation
(RIV) and the abnormal
earnings growth model
(AEG)
Financial reporting strategy (use
HGB as local GAAP vs. switch to
IAS/IFRS or US-GAAP)
The companies adopted international
GAAP (IAS/IFRS or US_GAAP) have
higher expected cost of equity capital on
average than local GAAP (HGB)
Germany
1993-2002
Eaton,
Nofsinger and
Weaver
(2007)
Disclosure
quality level and
the cost of
capital
The empirical model
focused on the changes in
the cost of equity capital
by the changes in the
incomplete information
premium and market risk
after reconciliation and
cross-listing. The model is
based on the Merton’s
(1987) two-factor model
of expected returns in
which one factor is market
risk and the other is an
information completeness
factor
Disclosure measures:
The number of analysts
following each firm.
The source of GAAP (set by
government or by private sector in
the home country)
The accounting quality index
of home country based on the
rating on accounting standards
from the Table of La Porta et al.
(1998)
Cross-listing firms experience a
decrease in cost of equity over 0.2% per
week in average.
Firms from countries with low
levels of accounting disclosure have
economic benefits from the added
disclosure of cross-listing.
Firms with low analyst following or
from countries with relatively low levels
of exchange/regulatory disclosure have
more economic benefits from cross-
listing.
USA
NYSE
Espinosa and
Trombetta
(2007)
Disclosure and
the cost of
capital
There are two measures of
the ex-ante cost of equity
capital based on the
forecast future earnings:
(1) Gebhart et al. (2001)
model based on the
residual income valuation
model; and (2) Abnormal
Earnings Growth
Valuation Model
developed by Ohlson and
Juetter-Nauroth (2001)
Annual report disclosure quality is
measured by index combined with
a proxy for the accounting policy
choice, where conservative policy
is measured by discretionary
accruals.
Firms that adopt conservative
accounting policies do not need to add
additional disclosure in order to reduce the
cost of equity capital.
On the other hand firms adopted
aggressive accounting policies may increase
the voluntary disclosure in order to reduce
the cost of capital.
Span
1999-2002
Feltham et al.
(2007)
Stock prices and
accounting
One period and two period
models to estimate firm’s
The accounting precision is
determined by quality of its Accounting information is an
increasing function of debt.
Theoretical
approach
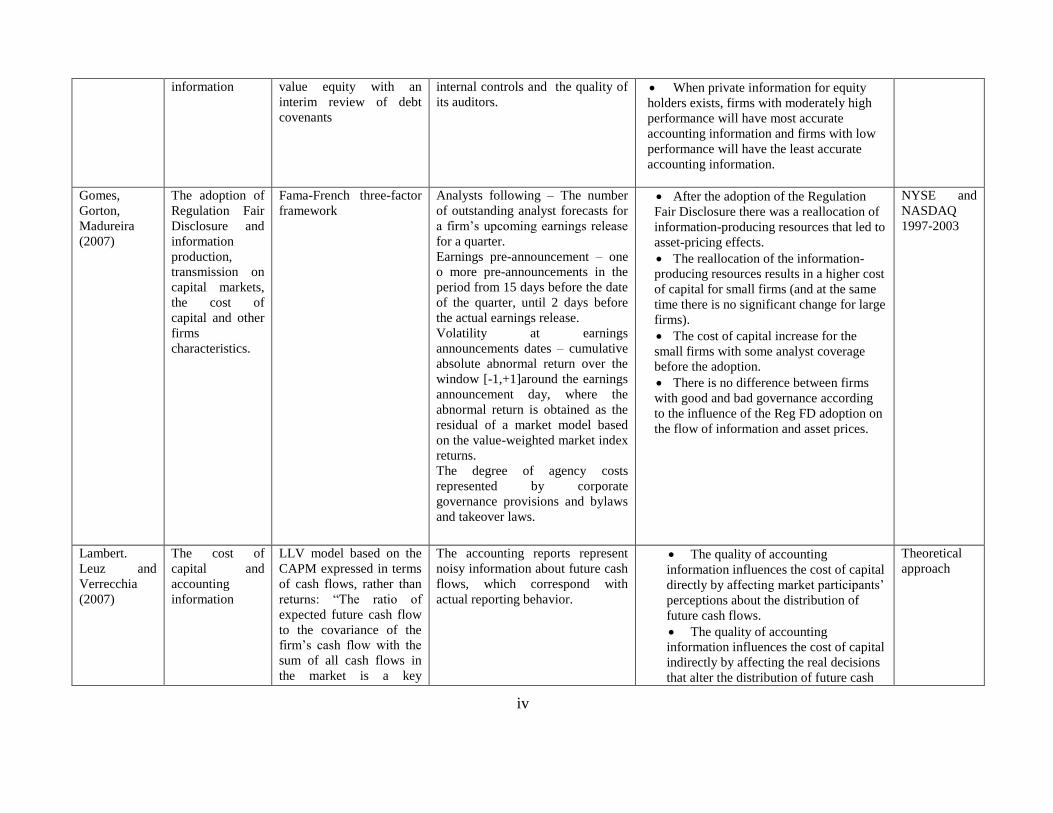
iv
information value equity with an
interim review of debt
covenants
internal controls and the quality of
its auditors. When private information for equity
holders exists, firms with moderately high
performance will have most accurate
accounting information and firms with low
performance will have the least accurate
accounting information.
Gomes,
Gorton,
Madureira
(2007)
The adoption of
Regulation Fair
Disclosure and
information
production,
transmission on
capital markets,
the cost of
capital and other
firms
characteristics.
Fama-French three-factor
framework
Analysts following – The number
of outstanding analyst forecasts for
a firm’s upcoming earnings release
for a quarter.
Earnings pre-announcement – one
o more pre-announcements in the
period from 15 days before the date
of the quarter, until 2 days before
the actual earnings release.
Volatility at earnings
announcements dates – cumulative
absolute abnormal return over the
window [-1,+1]around the earnings
announcement day, where the
abnormal return is obtained as the
residual of a market model based
on the value-weighted market index
returns.
The degree of agency costs
represented by corporate
governance provisions and bylaws
and takeover laws.
After the adoption of the Regulation
Fair Disclosure there was a reallocation of
information-producing resources that led to
asset-pricing effects.
The reallocation of the information-
producing resources results in a higher cost
of capital for small firms (and at the same
time there is no significant change for large
firms).
The cost of capital increase for the
small firms with some analyst coverage
before the adoption.
There is no difference between firms
with good and bad governance according
to the influence of the Reg FD adoption on
the flow of information and asset prices.
NYSE and
NASDAQ
1997-2003
Lambert.
Leuz and
Verrecchia
(2007)
The cost of
capital and
accounting
information
LLV model based on the
CAPM expressed in terms
of cash flows, rather than
returns: “The ratio of
expected future cash flow
to the covariance of the
firm’s cash flow with the
sum of all cash flows in
the market is a key
The accounting reports represent
noisy information about future cash
flows, which correspond with
actual reporting behavior.
The quality of accounting
information influences the cost of capital
directly by affecting market participants’
perceptions about the distribution of
future cash flows.
The quality of accounting
information influences the cost of capital
indirectly by affecting the real decisions
that alter the distribution of future cash
Theoretical
approach
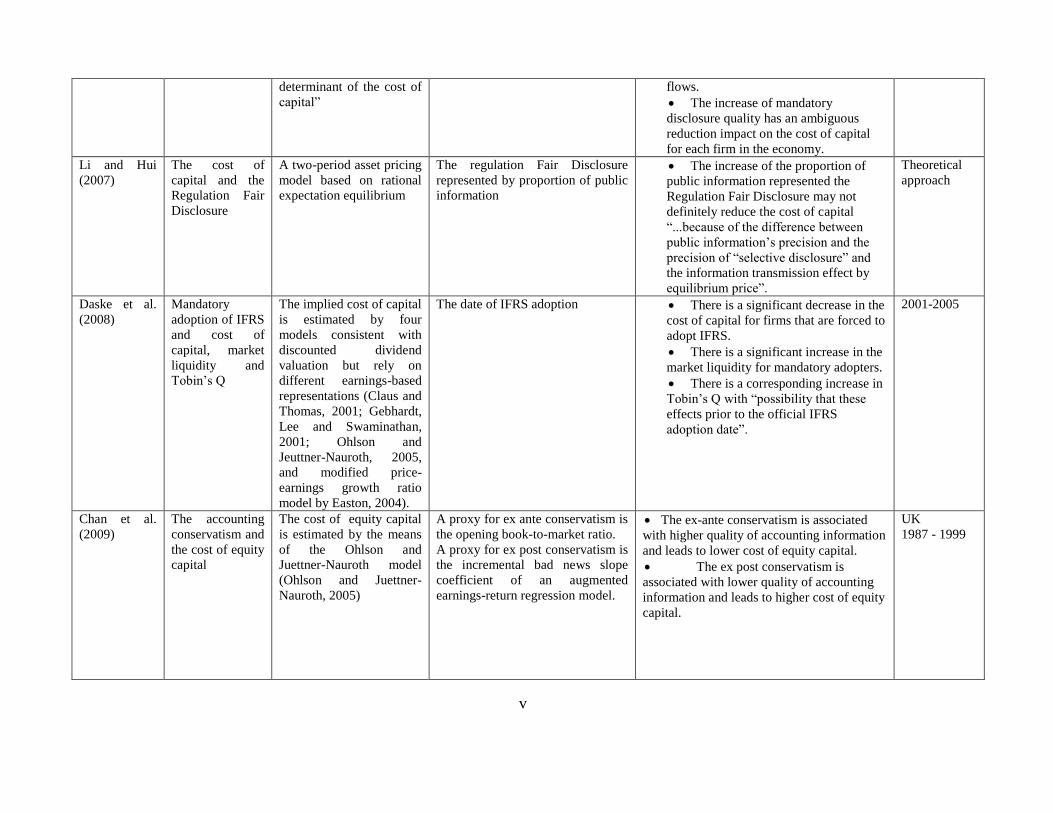
v
determinant of the cost of
capital”
flows.
The increase of mandatory
disclosure quality has an ambiguous
reduction impact on the cost of capital
for each firm in the economy.
Li and Hui
(2007)
The cost of
capital and the
Regulation Fair
Disclosure
A two-period asset pricing
model based on rational
expectation equilibrium
The regulation Fair Disclosure
represented by proportion of public
information
The increase of the proportion of
public information represented the
Regulation Fair Disclosure may not
definitely reduce the cost of capital
“...because of the difference between
public information’s precision and the
precision of “selective disclosure” and
the information transmission effect by
equilibrium price”.
Theoretical
approach
Daske et al.
(2008)
Mandatory
adoption of IFRS
and cost of
capital, market
liquidity and
Tobin’s Q
The implied cost of capital
is estimated by four
models consistent with
discounted dividend
valuation but rely on
different earnings-based
representations (Claus and
Thomas, 2001; Gebhardt,
Lee and Swaminathan,
2001; Ohlson and
Jeuttner-Nauroth, 2005,
and modified price-
earnings growth ratio
model by Easton, 2004).
The date of IFRS adoption There is a significant decrease in the
cost of capital for firms that are forced to
adopt IFRS.
There is a significant increase in the
market liquidity for mandatory adopters.
There is a corresponding increase in
Tobin’s Q with “possibility that these
effects prior to the official IFRS
adoption date”.
2001-2005
Chan et al.
(2009)
The accounting
conservatism and
the cost of equity
capital
The cost of equity capital
is estimated by the means
of the Ohlson and
Juettner-Nauroth model
(Ohlson and Juettner-
Nauroth, 2005)
A proxy for ex ante conservatism is
the opening book-to-market ratio.
A proxy for ex post conservatism is
the incremental bad news slope
coefficient of an augmented
earnings-return regression model.
The ex-ante conservatism is associated
with higher quality of accounting information
and leads to lower cost of equity capital.
The ex post conservatism is
associated with lower quality of accounting
information and leads to higher cost of equity
capital.
UK
1987 - 1999
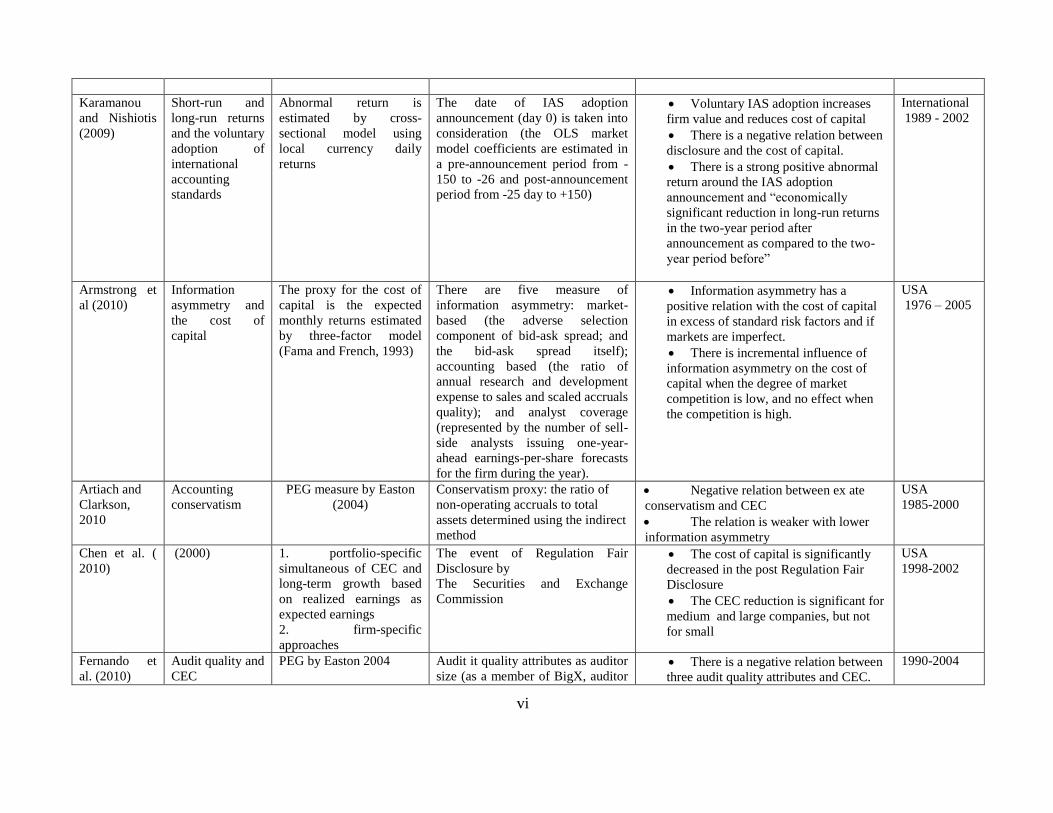
vi
Karamanou
and Nishiotis
(2009)
Short-run and
long-run returns
and the voluntary
adoption of
international
accounting
standards
Abnormal return is
estimated by cross-
sectional model using
local currency daily
returns
The date of IAS adoption
announcement (day 0) is taken into
consideration (the OLS market
model coefficients are estimated in
a pre-announcement period from -
150 to -26 and post-announcement
period from -25 day to +150)
Voluntary IAS adoption increases
firm value and reduces cost of capital
There is a negative relation between
disclosure and the cost of capital.
There is a strong positive abnormal
return around the IAS adoption
announcement and “economically
significant reduction in long-run returns
in the two-year period after
announcement as compared to the two-
year period before”
International
1989 - 2002
Armstrong et
al (2010)
Information
asymmetry and
the cost of
capital
The proxy for the cost of
capital is the expected
monthly returns estimated
by three-factor model
(Fama and French, 1993)
There are five measure of
information asymmetry: market-
based (the adverse selection
component of bid-ask spread; and
the bid-ask spread itself);
accounting based (the ratio of
annual research and development
expense to sales and scaled accruals
quality); and analyst coverage
(represented by the number of sell-
side analysts issuing one-year-
ahead earnings-per-share forecasts
for the firm during the year).
Information asymmetry has a
positive relation with the cost of capital
in excess of standard risk factors and if
markets are imperfect.
There is incremental influence of
information asymmetry on the cost of
capital when the degree of market
competition is low, and no effect when
the competition is high.
USA
1976 – 2005
Artiach and
Clarkson,
2010
Accounting
conservatism
PEG measure by Easton
(2004)
Conservatism proxy: the ratio of
non-operating accruals to total
assets determined using the indirect
method
Negative relation between ex ate
conservatism and CEC
The relation is weaker with lower
information asymmetry
USA
1985-2000
Chen et al. (
2010)
(2000) 1. portfolio-specific
simultaneous of CEC and
long-term growth based
on realized earnings as
expected earnings
2. firm-specific
approaches
The event of Regulation Fair
Disclosure by
The Securities and Exchange
Commission
The cost of capital is significantly
decreased in the post Regulation Fair
Disclosure
The CEC reduction is significant for
medium and large companies, but not
for small
USA
1998-2002
Fernando et
al. (2010)
Audit quality and
CEC
PEG by Easton 2004 Audit it quality attributes as auditor
size (as a member of BigX, auditor There is a negative relation between
three audit quality attributes and CEC.
1990-2004
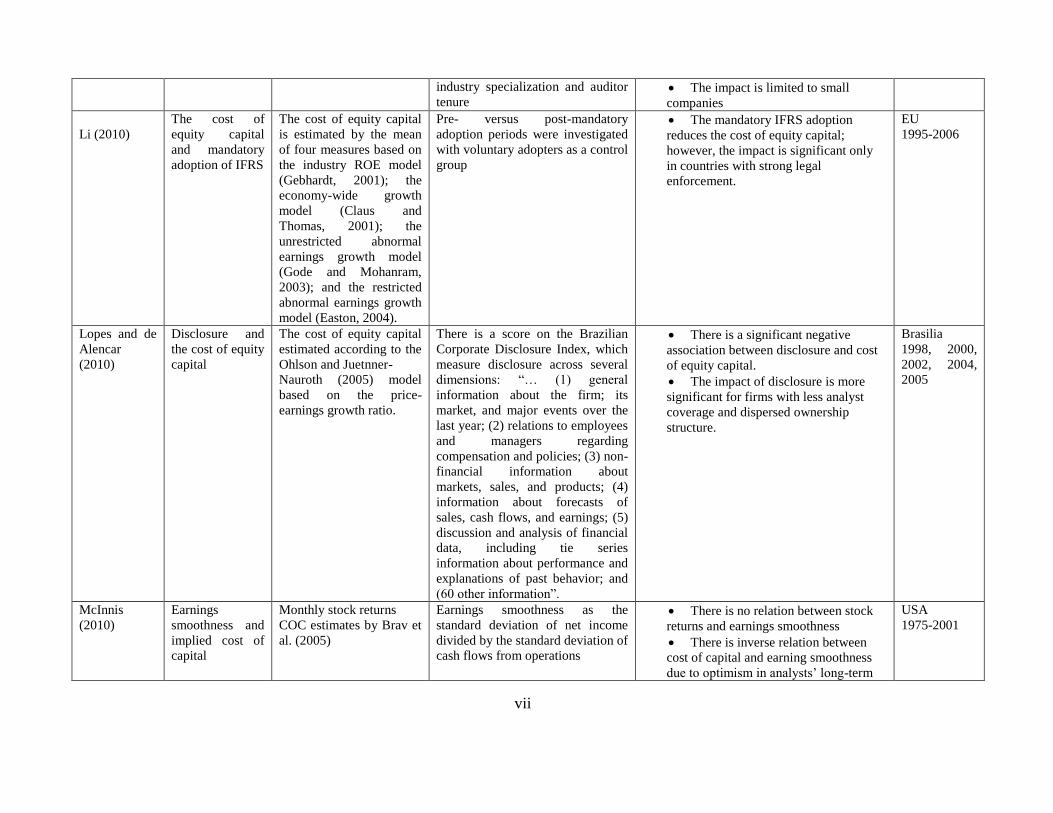
vii
industry specialization and auditor
tenure The impact is limited to small
companies
Li (2010)
The cost of
equity capital
and mandatory
adoption of IFRS
The cost of equity capital
is estimated by the mean
of four measures based on
the industry ROE model
(Gebhardt, 2001); the
economy-wide growth
model (Claus and
Thomas, 2001); the
unrestricted abnormal
earnings growth model
(Gode and Mohanram,
2003); and the restricted
abnormal earnings growth
model (Easton, 2004).
Pre- versus post-mandatory
adoption periods were investigated
with voluntary adopters as a control
group
The mandatory IFRS adoption
reduces the cost of equity capital;
however, the impact is significant only
in countries with strong legal
enforcement.
EU
1995-2006
Lopes and de
Alencar
(2010)
Disclosure and
the cost of equity
capital
The cost of equity capital
estimated according to the
Ohlson and Juetnner-
Nauroth (2005) model
based on the price-
earnings growth ratio.
There is a score on the Brazilian
Corporate Disclosure Index, which
measure disclosure across several
dimensions: “… (1) general
information about the firm; its
market, and major events over the
last year; (2) relations to employees
and managers regarding
compensation and policies; (3) non-
financial information about
markets, sales, and products; (4)
information about forecasts of
sales, cash flows, and earnings; (5)
discussion and analysis of financial
data, including tie series
information about performance and
explanations of past behavior; and
(60 other information”.
There is a significant negative
association between disclosure and cost
of equity capital.
The impact of disclosure is more
significant for firms with less analyst
coverage and dispersed ownership
structure.
Brasilia
1998, 2000,
2002, 2004,
2005
McInnis
(2010)
Earnings
smoothness and
implied cost of
capital
Monthly stock returns
COC estimates by Brav et
al. (2005)
Earnings smoothness as the
standard deviation of net income
divided by the standard deviation of
cash flows from operations
There is no relation between stock
returns and earnings smoothness
There is inverse relation between
cost of capital and earning smoothness
due to optimism in analysts’ long-term
USA
1975-2001
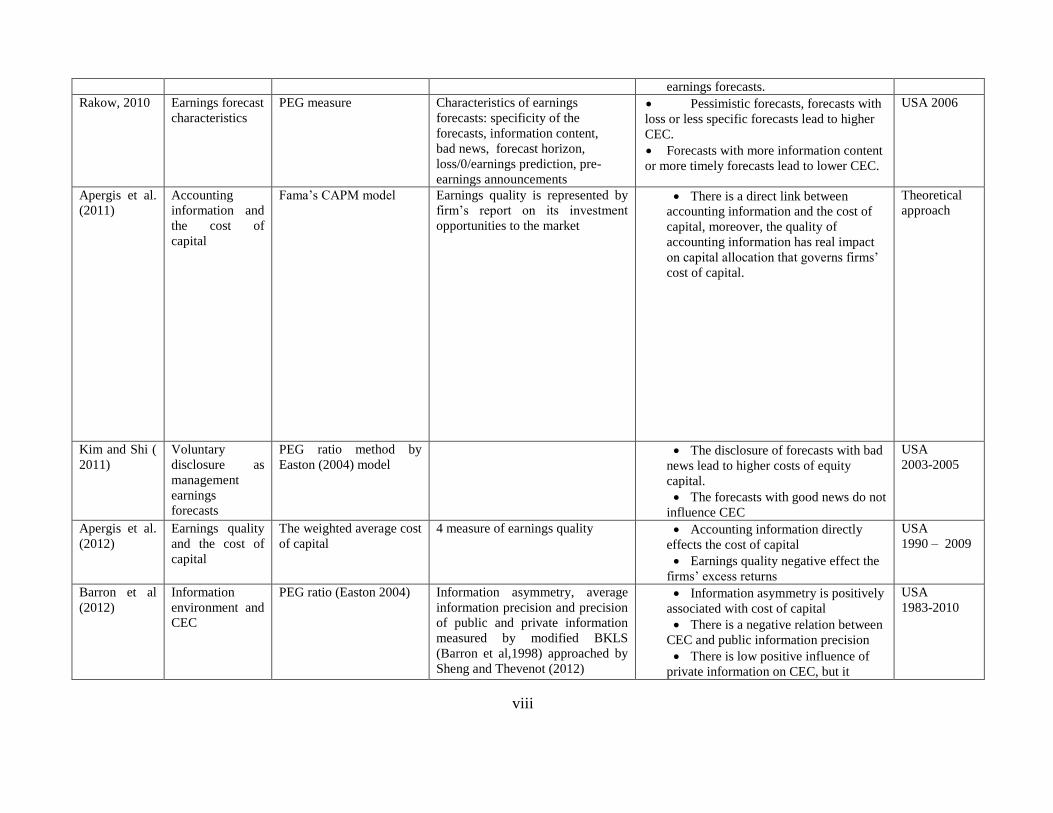
viii
earnings forecasts.
Rakow, 2010 Earnings forecast
characteristics
PEG measure Characteristics of earnings
forecasts: specificity of the
forecasts, information content,
bad news, forecast horizon,
loss/0/earnings prediction, pre-
earnings announcements
Pessimistic forecasts, forecasts with
loss or less specific forecasts lead to higher
CEC.
Forecasts with more information content
or more timely forecasts lead to lower CEC.
USA 2006
Apergis et al.
(2011)
Accounting
information and
the cost of
capital
Fama’s CAPM model Earnings quality is represented by
firm’s report on its investment
opportunities to the market
There is a direct link between
accounting information and the cost of
capital, moreover, the quality of
accounting information has real impact
on capital allocation that governs firms’
cost of capital.
Theoretical
approach
Kim and Shi (
2011)
Voluntary
disclosure as
management
earnings
forecasts
PEG ratio method by
Easton (2004) model
The disclosure of forecasts with bad
news lead to higher costs of equity
capital.
The forecasts with good news do not
influence CEC
USA
2003-2005
Apergis et al.
(2012)
Earnings quality
and the cost of
capital
The weighted average cost
of capital
4 measure of earnings quality Accounting information directly
effects the cost of capital
Earnings quality negative effect the
firms’ excess returns
USA
1990 – 2009
Barron et al
(2012)
Information
environment and
CEC
PEG ratio (Easton 2004) Information asymmetry, average
information precision and precision
of public and private information
measured by modified BKLS
(Barron et al,1998) approached by
Sheng and Thevenot (2012)
Information asymmetry is positively
associated with cost of capital
There is a negative relation between
CEC and public information precision
There is low positive influence of
private information on CEC, but it
USA
1983-2010
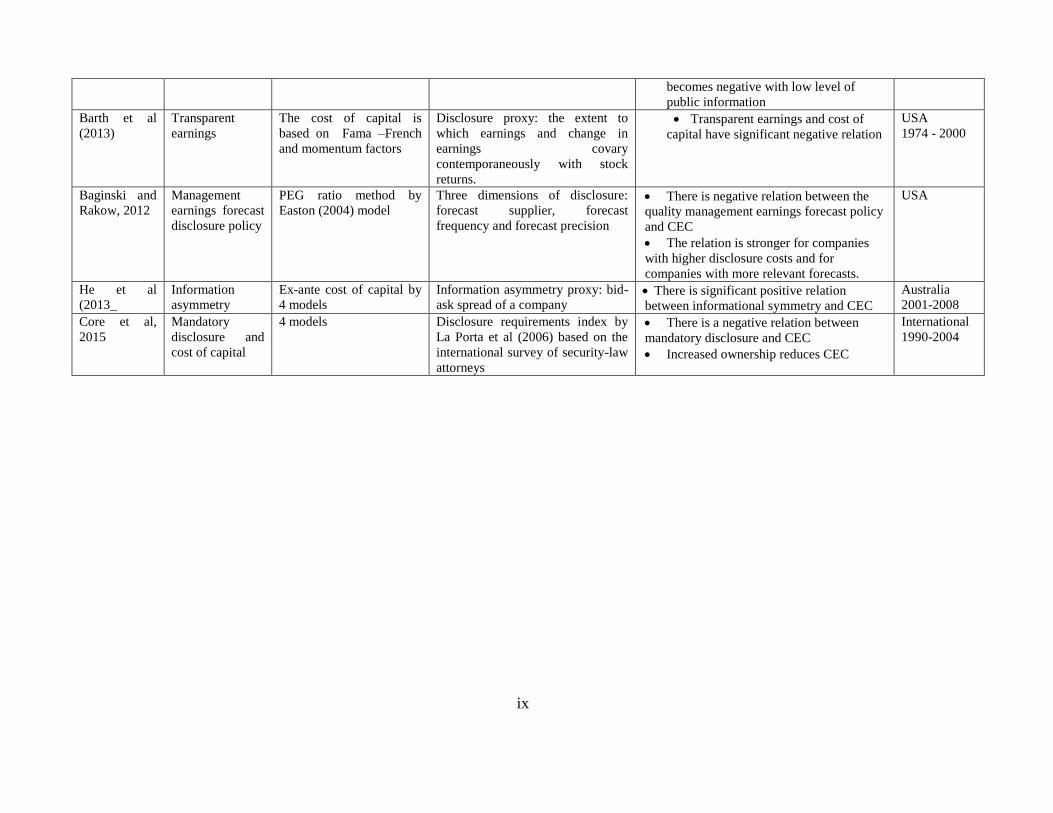
ix
becomes negative with low level of
public information
Barth et al
(2013)
Transparent
earnings
The cost of capital is
based on Fama –French
and momentum factors
Disclosure proxy: the extent to
which earnings and change in
earnings covary
contemporaneously with stock
returns.
Transparent earnings and cost of
capital have significant negative relation
USA
1974 - 2000
Baginski and
Rakow, 2012
Management
earnings forecast
disclosure policy
PEG ratio method by
Easton (2004) model
Three dimensions of disclosure:
forecast supplier, forecast
frequency and forecast precision
There is negative relation between the
quality management earnings forecast policy
and CEC
The relation is stronger for companies
with higher disclosure costs and for
companies with more relevant forecasts.
USA
He et al
(2013_
Information
asymmetry
Ex-ante cost of capital by
4 models
Information asymmetry proxy: bid-
ask spread of a company There is significant positive relation
between informational symmetry and CEC
Australia
2001-2008
Core et al,
2015
Mandatory
disclosure and
cost of capital
4 models Disclosure requirements index by
La Porta et al (2006) based on the
international survey of security-law
attorneys
There is a negative relation between
mandatory disclosure and CEC
Increased ownership reduces CEC
International
1990-2004
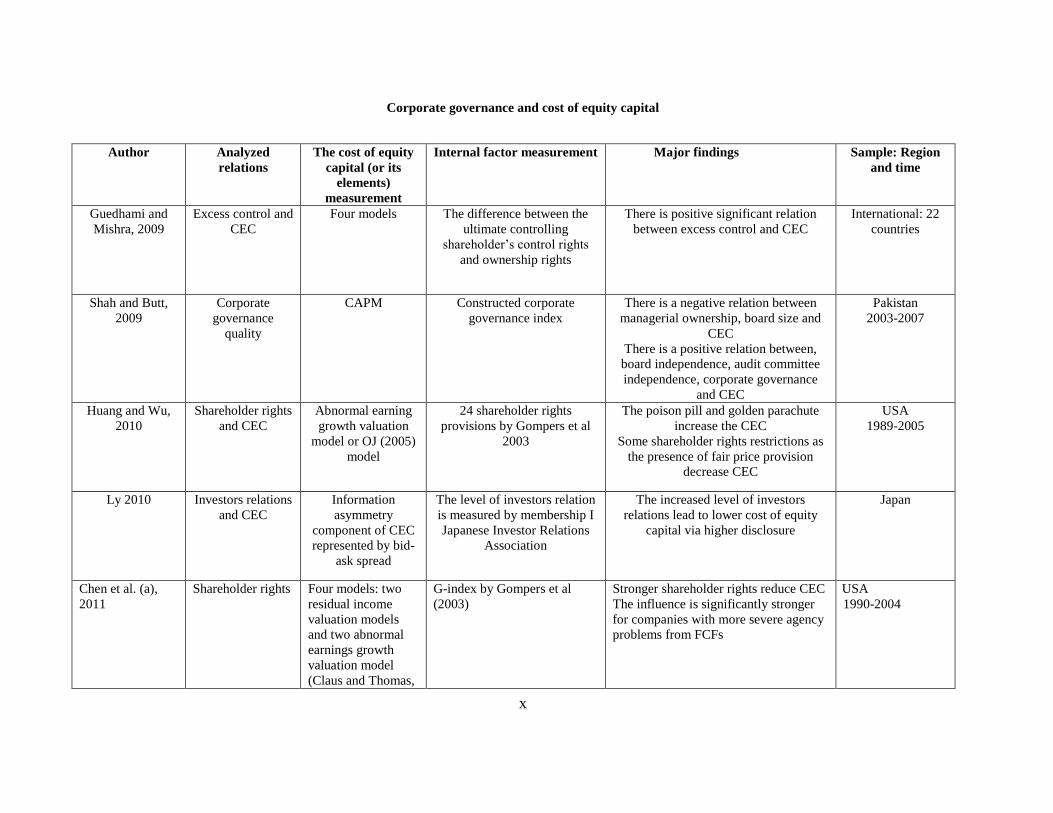
x
Corporate governance and cost of equity capital
Author Analyzed
relations
The cost of equity
capital (or its
elements)
measurement
Internal factor measurement Major findings Sample: Region
and time
Guedhami and
Mishra, 2009
Excess control and
CEC
Four models The difference between the
ultimate controlling
shareholder’s control rights
and ownership rights
There is positive significant relation
between excess control and CEC
International: 22
countries
Shah and Butt,
2009
Corporate
governance
quality
CAPM Constructed corporate
governance index
There is a negative relation between
managerial ownership, board size and
CEC
There is a positive relation between,
board independence, audit committee
independence, corporate governance
and CEC
Pakistan
2003-2007
Huang and Wu,
2010
Shareholder rights
and CEC
Abnormal earning
growth valuation
model or OJ (2005)
model
24 shareholder rights
provisions by Gompers et al
2003
The poison pill and golden parachute
increase the CEC
Some shareholder rights restrictions as
the presence of fair price provision
decrease CEC
USA
1989-2005
Ly 2010 Investors relations
and CEC
Information
asymmetry
component of CEC
represented by bid-
ask spread
The level of investors relation
is measured by membership I
Japanese Investor Relations
Association
The increased level of investors
relations lead to lower cost of equity
capital via higher disclosure
Japan
Chen et al. (a),
2011
Shareholder rights Four models: two
residual income
valuation models
and two abnormal
earnings growth
valuation model
(Claus and Thomas,
G-index by Gompers et al
(2003)
Stronger shareholder rights reduce CEC
The influence is significantly stronger
for companies with more severe agency
problems from FCFs
USA
1990-2004
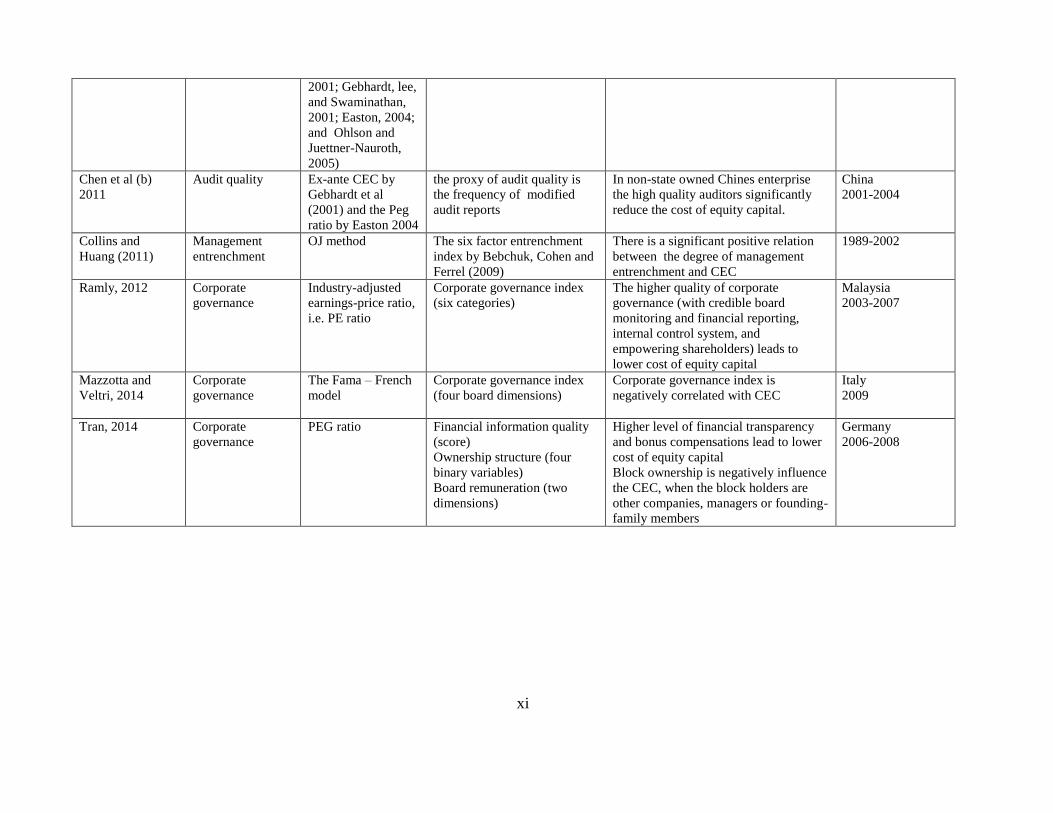
xi
2001; Gebhardt, lee,
and Swaminathan,
2001; Easton, 2004;
and Ohlson and
Juettner-Nauroth,
2005)
Chen et al (b)
2011
Audit quality Ex-ante CEC by
Gebhardt et al
(2001) and the Peg
ratio by Easton 2004
the proxy of audit quality is
the frequency of modified
audit reports
In non-state owned Chines enterprise
the high quality auditors significantly
reduce the cost of equity capital.
China
2001-2004
Collins and
Huang (2011)
Management
entrenchment
OJ method The six factor entrenchment
index by Bebchuk, Cohen and
Ferrel (2009)
There is a significant positive relation
between the degree of management
entrenchment and CEC
1989-2002
Ramly, 2012 Corporate
governance
Industry-adjusted
earnings-price ratio,
i.e. PE ratio
Corporate governance index
(six categories)
The higher quality of corporate
governance (with credible board
monitoring and financial reporting,
internal control system, and
empowering shareholders) leads to
lower cost of equity capital
Malaysia
2003-2007
Mazzotta and
Veltri, 2014
Corporate
governance
The Fama – French
model
Corporate governance index
(four board dimensions)
Corporate governance index is
negatively correlated with CEC
Italy
2009
Tran, 2014 Corporate
governance
PEG ratio Financial information quality
(score)
Ownership structure (four
binary variables)
Board remuneration (two
dimensions)
Higher level of financial transparency
and bonus compensations lead to lower
cost of equity capital
Block ownership is negatively influence
the CEC, when the block holders are
other companies, managers or founding-
family members
Germany
2006-2008
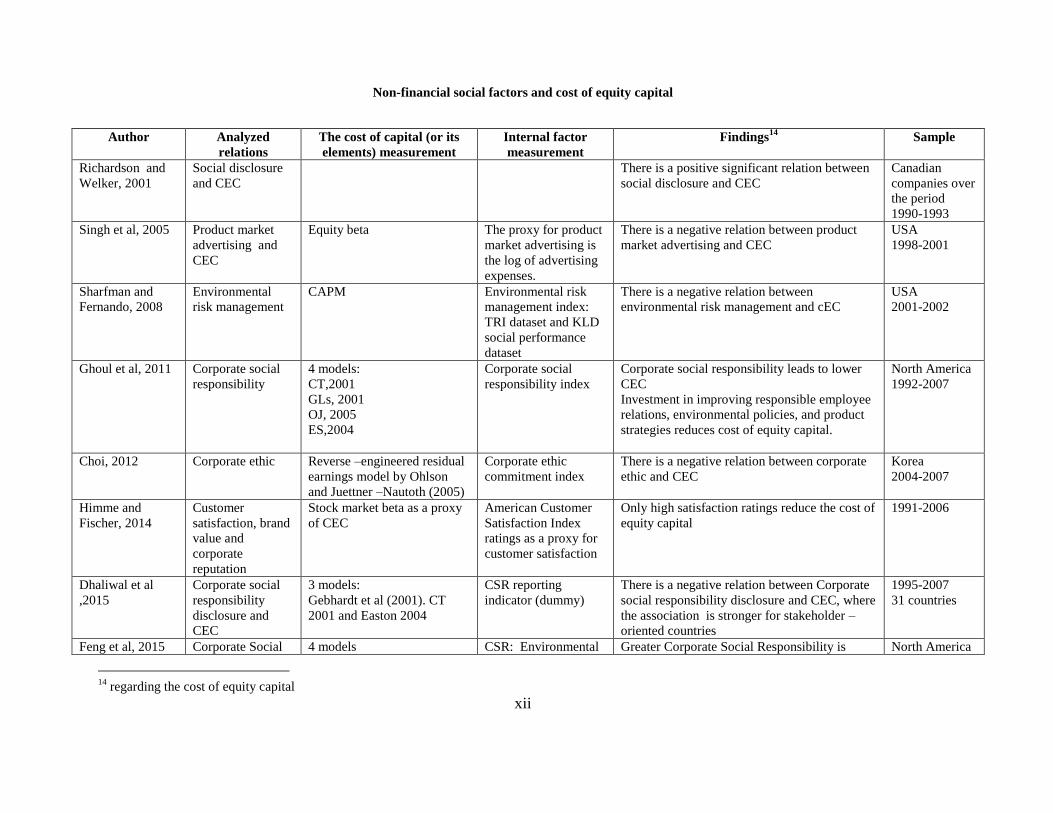
xii
Non-financial social factors and cost of equity capital
Author Analyzed
relations
The cost of capital (or its
elements) measurement
Internal factor
measurement
Findings14
Sample
Richardson and
Welker, 2001
Social disclosure
and CEC
There is a positive significant relation between
social disclosure and CEC
Canadian
companies over
the period
1990-1993
Singh et al, 2005 Product market
advertising and
CEC
Equity beta The proxy for product
market advertising is
the log of advertising
expenses.
There is a negative relation between product
market advertising and CEC
USA
1998-2001
Sharfman and
Fernando, 2008
Environmental
risk management
CAPM Environmental risk
management index:
TRI dataset and KLD
social performance
dataset
There is a negative relation between
environmental risk management and cEC
USA
2001-2002
Ghoul et al, 2011 Corporate social
responsibility
4 models:
CT,2001
GLs, 2001
OJ, 2005
ES,2004
Corporate social
responsibility index
Corporate social responsibility leads to lower
CEC
Investment in improving responsible employee
relations, environmental policies, and product
strategies reduces cost of equity capital.
North America
1992-2007
Choi, 2012 Corporate ethic Reverse –engineered residual
earnings model by Ohlson
and Juettner –Nautoth (2005)
Corporate ethic
commitment index
There is a negative relation between corporate
ethic and CEC
Korea
2004-2007
Himme and
Fischer, 2014
Customer
satisfaction, brand
value and
corporate
reputation
Stock market beta as a proxy
of CEC
American Customer
Satisfaction Index
ratings as a proxy for
customer satisfaction
Only high satisfaction ratings reduce the cost of
equity capital
1991-2006
Dhaliwal et al
,2015
Corporate social
responsibility
disclosure and
CEC
3 models:
Gebhardt et al (2001). CT
2001 and Easton 2004
CSR reporting
indicator (dummy)
There is a negative relation between Corporate
social responsibility disclosure and CEC, where
the association is stronger for stakeholder –
oriented countries
1995-2007
31 countries
Feng et al, 2015 Corporate Social 4 models CSR: Environmental Greater Corporate Social Responsibility is North America
14
regarding the cost of equity capital
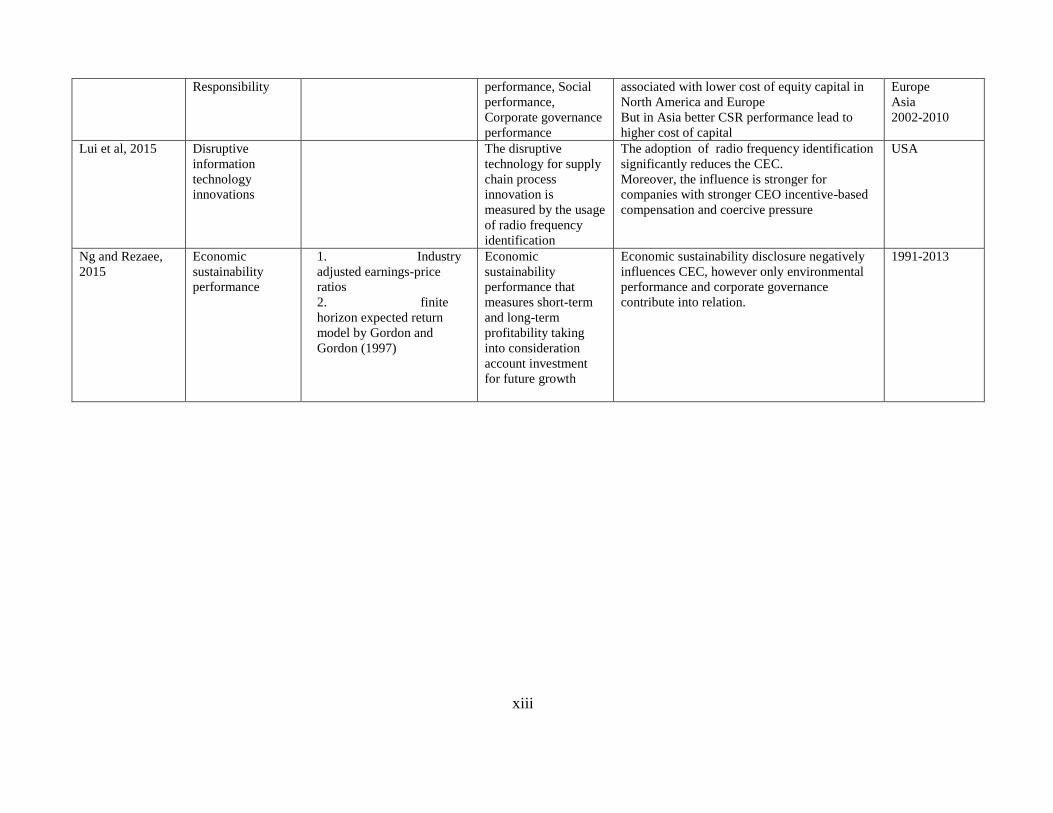
xiii
Responsibility performance, Social
performance,
Corporate governance
performance
associated with lower cost of equity capital in
North America and Europe
But in Asia better CSR performance lead to
higher cost of capital
Europe
Asia
2002-2010
Lui et al, 2015 Disruptive
information
technology
innovations
The disruptive
technology for supply
chain process
innovation is
measured by the usage
of radio frequency
identification
The adoption of radio frequency identification
significantly reduces the CEC.
Moreover, the influence is stronger for
companies with stronger CEO incentive-based
compensation and coercive pressure
USA
Ng and Rezaee,
2015
Economic
sustainability
performance
1. Industry
adjusted earnings-price
ratios
2. finite
horizon expected return
model by Gordon and
Gordon (1997)
Economic
sustainability
performance that
measures short-term
and long-term
profitability taking
into consideration
account investment
for future growth
Economic sustainability disclosure negatively
influences CEC, however only environmental
performance and corporate governance
contribute into relation.
1991-2013
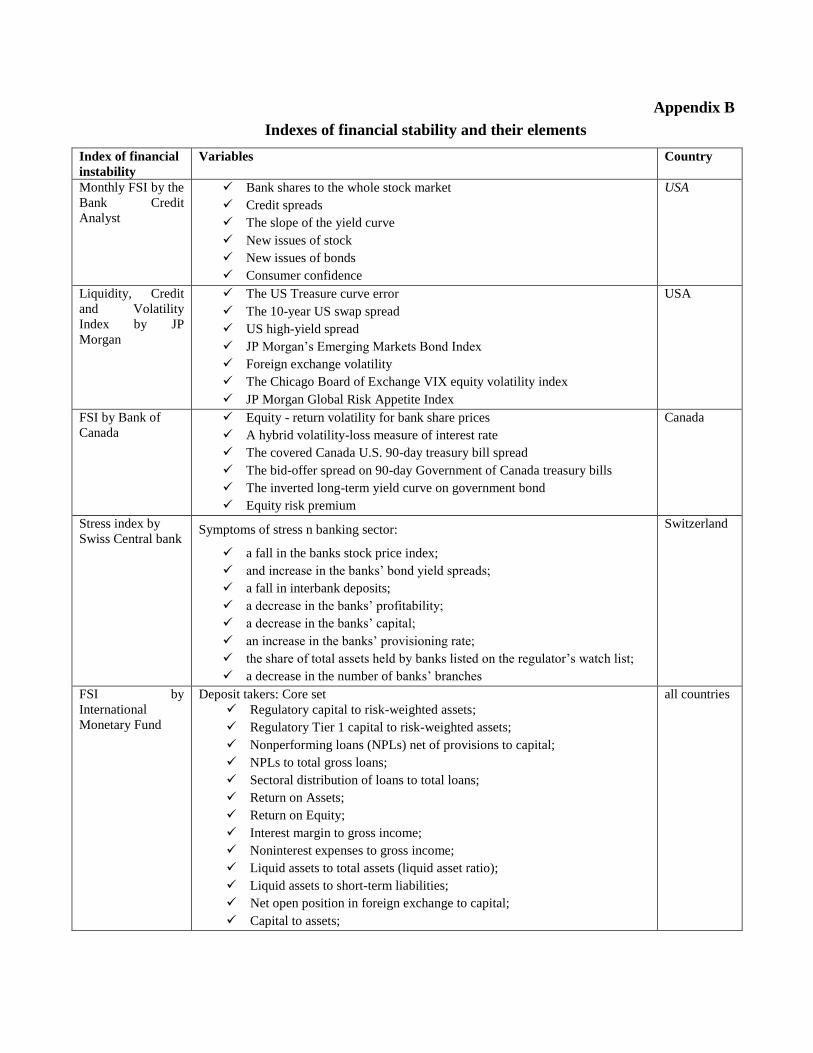
Appendix B
Indexes of financial stability and their elements
Index of financial
instability
Variables Country
Monthly FSI by the
Bank Credit
Analyst
Bank shares to the whole stock market
Credit spreads
The slope of the yield curve
New issues of stock
New issues of bonds
Consumer confidence
USA
Liquidity, Credit
and Volatility
Index by JP
Morgan
The US Treasure curve error
The 10-year US swap spread
US high-yield spread
JP Morgan’s Emerging Markets Bond Index
Foreign exchange volatility
The Chicago Board of Exchange VIX equity volatility index
JP Morgan Global Risk Appetite Index
USA
FSI by Bank of
Canada
Equity - return volatility for bank share prices
A hybrid volatility-loss measure of interest rate
The covered Canada U.S. 90-day treasury bill spread
The bid-offer spread on 90-day Government of Canada treasury bills
The inverted long-term yield curve on government bond
Equity risk premium
Canada
Stress index by
Swiss Central bank Symptoms of stress n banking sector:
a fall in the banks stock price index;
and increase in the banks’ bond yield spreads;
a fall in interbank deposits;
a decrease in the banks’ profitability;
a decrease in the banks’ capital;
an increase in the banks’ provisioning rate;
the share of total assets held by banks listed on the regulator’s watch list;
a decrease in the number of banks’ branches
Switzerland
FSI by
International
Monetary Fund
Deposit takers: Core set
Regulatory capital to risk-weighted assets;
Regulatory Tier 1 capital to risk-weighted assets;
Nonperforming loans (NPLs) net of provisions to capital;
NPLs to total gross loans;
Sectoral distribution of loans to total loans;
Return on Assets;
Return on Equity;
Interest margin to gross income;
Noninterest expenses to gross income;
Liquid assets to total assets (liquid asset ratio);
Liquid assets to short-term liabilities;
Net open position in foreign exchange to capital;
Capital to assets;
all countries
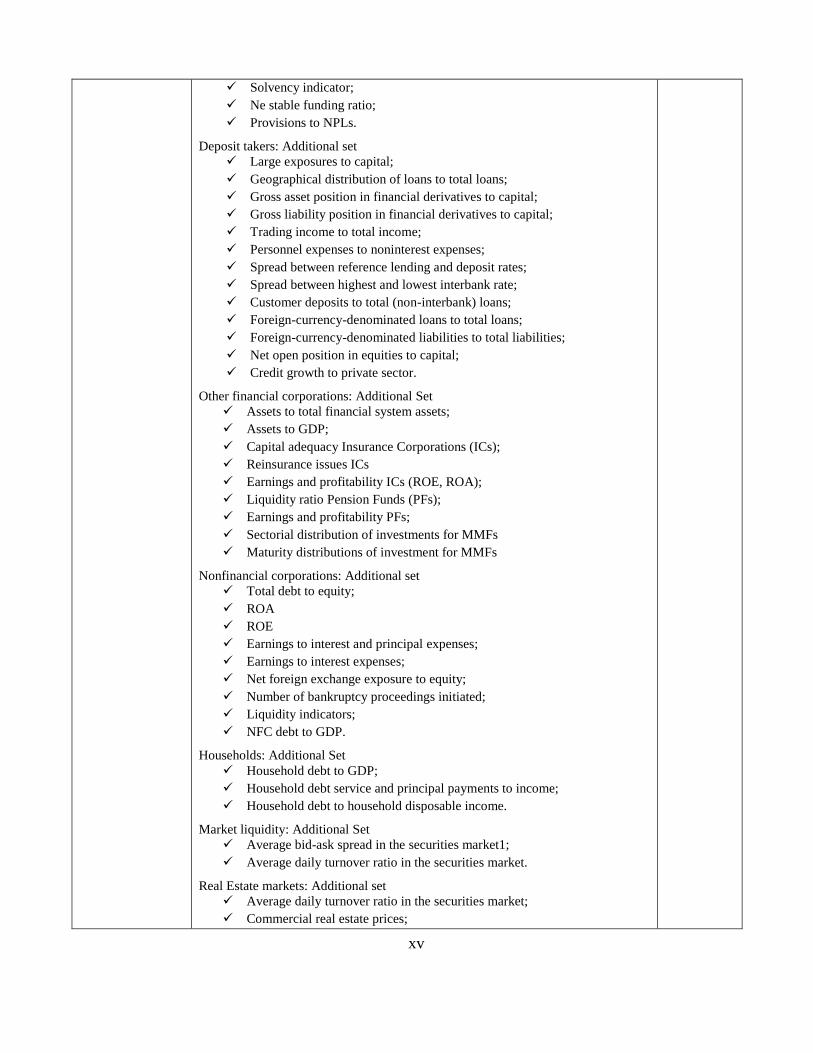
xv
Solvency indicator;
Ne stable funding ratio;
Provisions to NPLs.
Deposit takers: Additional set
Large exposures to capital;
Geographical distribution of loans to total loans;
Gross asset position in financial derivatives to capital;
Gross liability position in financial derivatives to capital;
Trading income to total income;
Personnel expenses to noninterest expenses;
Spread between reference lending and deposit rates;
Spread between highest and lowest interbank rate;
Customer deposits to total (non-interbank) loans;
Foreign-currency-denominated loans to total loans;
Foreign-currency-denominated liabilities to total liabilities;
Net open position in equities to capital;
Credit growth to private sector.
Other financial corporations: Additional Set
Assets to total financial system assets;
Assets to GDP;
Capital adequacy Insurance Corporations (ICs);
Reinsurance issues ICs
Earnings and profitability ICs (ROE, ROA);
Liquidity ratio Pension Funds (PFs);
Earnings and profitability PFs;
Sectorial distribution of investments for MMFs
Maturity distributions of investment for MMFs
Nonfinancial corporations: Additional set
Total debt to equity;
ROA
ROE
Earnings to interest and principal expenses;
Earnings to interest expenses;
Net foreign exchange exposure to equity;
Number of bankruptcy proceedings initiated;
Liquidity indicators;
NFC debt to GDP.
Households: Additional Set
Household debt to GDP;
Household debt service and principal payments to income;
Household debt to household disposable income.
Market liquidity: Additional Set
Average bid-ask spread in the securities market1;
Average daily turnover ratio in the securities market.
Real Estate markets: Additional set
Average daily turnover ratio in the securities market;
Commercial real estate prices;
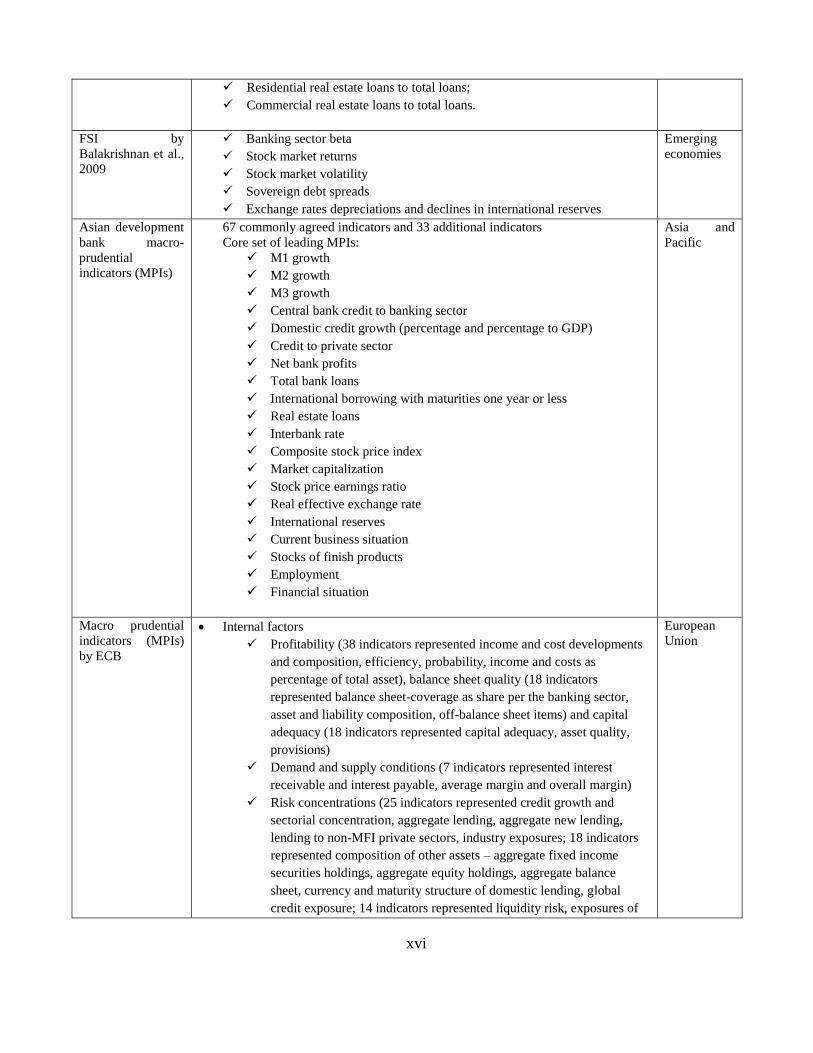
xvi
Residential real estate loans to total loans;
Commercial real estate loans to total loans.
FSI by
Balakrishnan et al.,
2009
Banking sector beta
Stock market returns
Stock market volatility
Sovereign debt spreads
Exchange rates depreciations and declines in international reserves
Emerging
economies
Asian development
bank macro-
prudential
indicators (MPIs)
67 commonly agreed indicators and 33 additional indicators
Core set of leading MPIs:
M1 growth
M2 growth
M3 growth
Central bank credit to banking sector
Domestic credit growth (percentage and percentage to GDP)
Credit to private sector
Net bank profits
Total bank loans
International borrowing with maturities one year or less
Real estate loans
Interbank rate
Composite stock price index
Market capitalization
Stock price earnings ratio
Real effective exchange rate
International reserves
Current business situation
Stocks of finish products
Employment
Financial situation
Asia and
Pacific
Macro prudential
indicators (MPIs)
by ECB
Internal factors
Profitability (38 indicators represented income and cost developments
and composition, efficiency, probability, income and costs as
percentage of total asset), balance sheet quality (18 indicators
represented balance sheet-coverage as share per the banking sector,
asset and liability composition, off-balance sheet items) and capital
adequacy (18 indicators represented capital adequacy, asset quality,
provisions)
Demand and supply conditions (7 indicators represented interest
receivable and interest payable, average margin and overall margin)
Risk concentrations (25 indicators represented credit growth and
sectorial concentration, aggregate lending, aggregate new lending,
lending to non-MFI private sectors, industry exposures; 18 indicators
represented composition of other assets – aggregate fixed income
securities holdings, aggregate equity holdings, aggregate balance
sheet, currency and maturity structure of domestic lending, global
credit exposure; 14 indicators represented liquidity risk, exposures of
European
Union
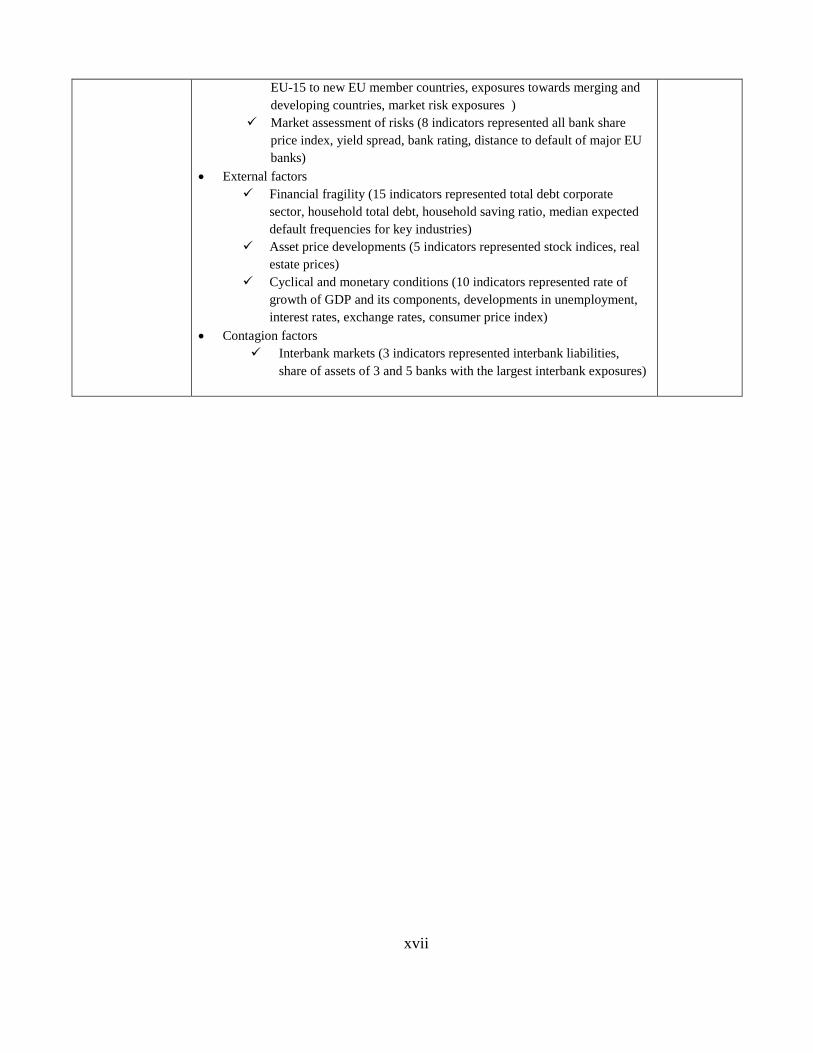
xvii
EU-15 to new EU member countries, exposures towards merging and
developing countries, market risk exposures )
Market assessment of risks (8 indicators represented all bank share
price index, yield spread, bank rating, distance to default of major EU
banks)
External factors
Financial fragility (15 indicators represented total debt corporate
sector, household total debt, household saving ratio, median expected
default frequencies for key industries)
Asset price developments (5 indicators represented stock indices, real
estate prices)
Cyclical and monetary conditions (10 indicators represented rate of
growth of GDP and its components, developments in unemployment,
interest rates, exchange rates, consumer price index)
Contagion factors
Interbank markets (3 indicators represented interbank liabilities,
share of assets of 3 and 5 banks with the largest interbank exposures)

xviii
Appendix C
Vážená paní, Vážený pane,
dovoluji si požádat finančního ředitele (CFO) Vašeho podniku, případně jinou relevantní osobu
z finančního úseku, o participaci na řešení výzkumného projektu „Vliv externích a interních faktorů
na náklady vlastního kapitálu podniku“, jehož cílem je zmapovat současnou podnikovou praxi v
oblasti nákladů vlastního kapitálu, tj. zejména používaných metod jejich odhadu, a interních a
externích faktorů ovlivňujících jejich výši. Výchozím nástrojem sběru dat je dotazník, o jehož vyplnění
Vás tímto žádám.
Vyplnění dotazníku by nemělo trvat vice než 15 minut. Zavazuji se, že data získaná v rámci
řešení výzkumného projektu ve Vaší společnosti budou zpracována anonymně a využita výhradně za
účelem naplnění výzkumných cílů. Žádný jiný způsob využití dat nepřichází v úvahu.
S výsledky výzkumu Vás seznámím prostřednictvím článků v relevantních vědeckých časopisech v
průběhu roku 2015. Byla bych Vám zavázána, pakliže byste si našla/našel čas na vyplnění dotazníku.
Příslušný dokument prosím vyplňte.
Za Vaši účast na řešení výzkumného projektu Vám předem děkuji.
S pozdravem
Ing. Natalia Mokhova
řešitel projektu
Ústav ekonomiky
Vysoké učení technické v Brně
Fakulta podnikatelská
Kolejní 2906/4
612 00 Brno
e-mail: [email protected]
TEL: 775088528
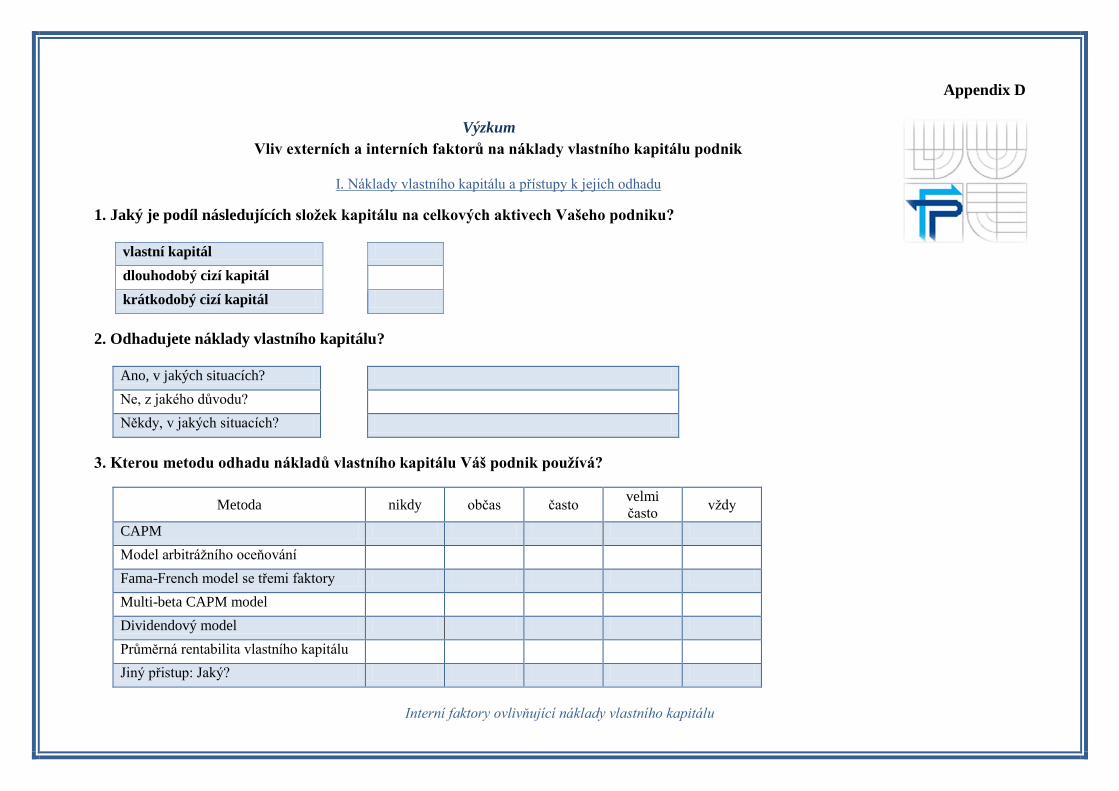
Appendix D
Výzkum
Vliv externích a interních faktorů na náklady vlastního kapitálu podnik
I. Náklady vlastního kapitálu a přístupy k jejich odhadu
1. Jaký je podíl následujících složek kapitálu na celkových aktivech Vašeho podniku?
vlastní kapitál
dlouhodobý cizí kapitál
krátkodobý cizí kapitál
2. Odhadujete náklady vlastního kapitálu?
Ano, v jakých situacích?
Ne, z jakého důvodu?
Někdy, v jakých situacích?
3. Kterou metodu odhadu nákladů vlastního kapitálu Váš podnik používá?
Metoda nikdy občas často velmi
často vždy
CAPM
Model arbitrážního oceňování
Fama-French model se třemi faktory
Multi-beta CAPM model
Dividendový model
Průměrná rentabilita vlastního kapitálu
Jiný přistup: Jaký?
Interní faktory ovlivňující náklady vlastního kapitálu
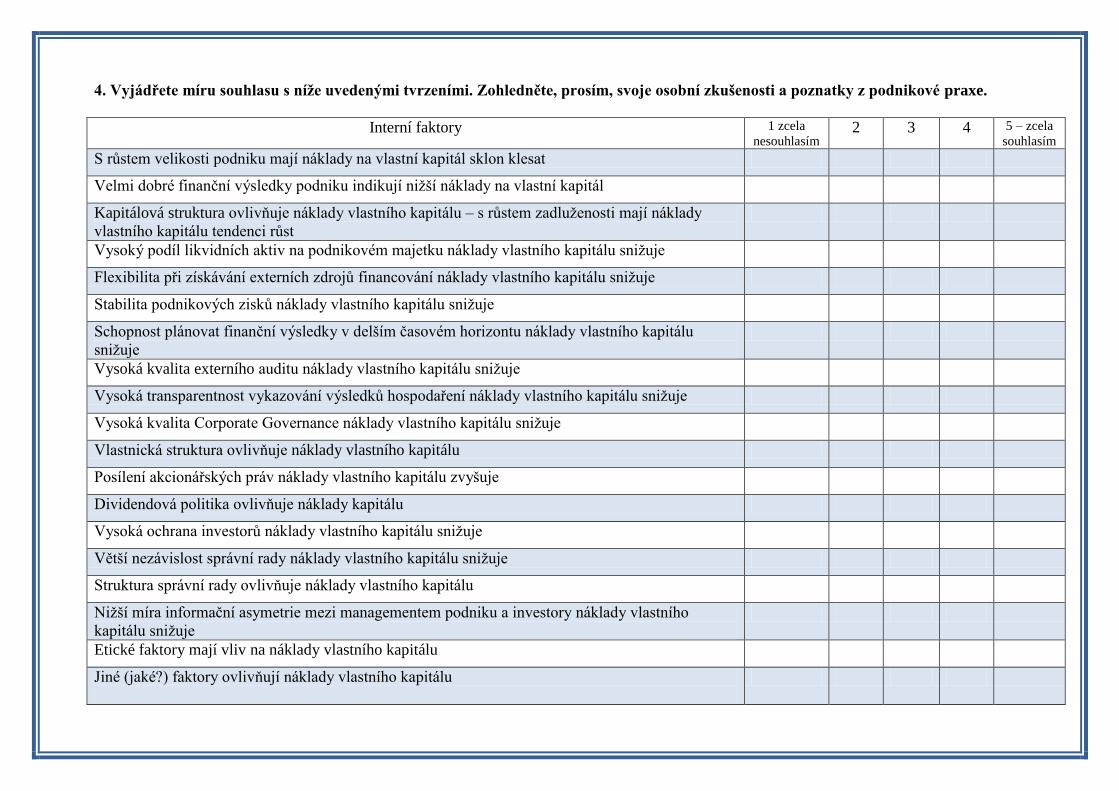
4. Vyjádřete míru souhlasu s níže uvedenými tvrzeními. Zohledněte, prosím, svoje osobní zkušenosti a poznatky z podnikové praxe.
Interní faktory 1 zcela
nesouhlasím 2 3 4 5 – zcela
souhlasím
S růstem velikosti podniku mají náklady na vlastní kapitál sklon klesat
Velmi dobré finanční výsledky podniku indikují nižší náklady na vlastní kapitál
Kapitálová struktura ovlivňuje náklady vlastního kapitálu – s růstem zadluženosti mají náklady
vlastního kapitálu tendenci růst
Vysoký podíl likvidních aktiv na podnikovém majetku náklady vlastního kapitálu snižuje
Flexibilita při získávání externích zdrojů financování náklady vlastního kapitálu snižuje
Stabilita podnikových zisků náklady vlastního kapitálu snižuje
Schopnost plánovat finanční výsledky v delším časovém horizontu náklady vlastního kapitálu
snižuje
Vysoká kvalita externího auditu náklady vlastního kapitálu snižuje
Vysoká transparentnost vykazování výsledků hospodaření náklady vlastního kapitálu snižuje
Vysoká kvalita Corporate Governance náklady vlastního kapitálu snižuje
Vlastnická struktura ovlivňuje náklady vlastního kapitálu
Posílení akcionářských práv náklady vlastního kapitálu zvyšuje
Dividendová politika ovlivňuje náklady kapitálu
Vysoká ochrana investorů náklady vlastního kapitálu snižuje
Větší nezávislost správní rady náklady vlastního kapitálu snižuje
Struktura správní rady ovlivňuje náklady vlastního kapitálu
Nižší míra informační asymetrie mezi managementem podniku a investory náklady vlastního
kapitálu snižuje
Etické faktory mají vliv na náklady vlastního kapitálu
Jiné (jaké?) faktory ovlivňují náklady vlastního kapitálu
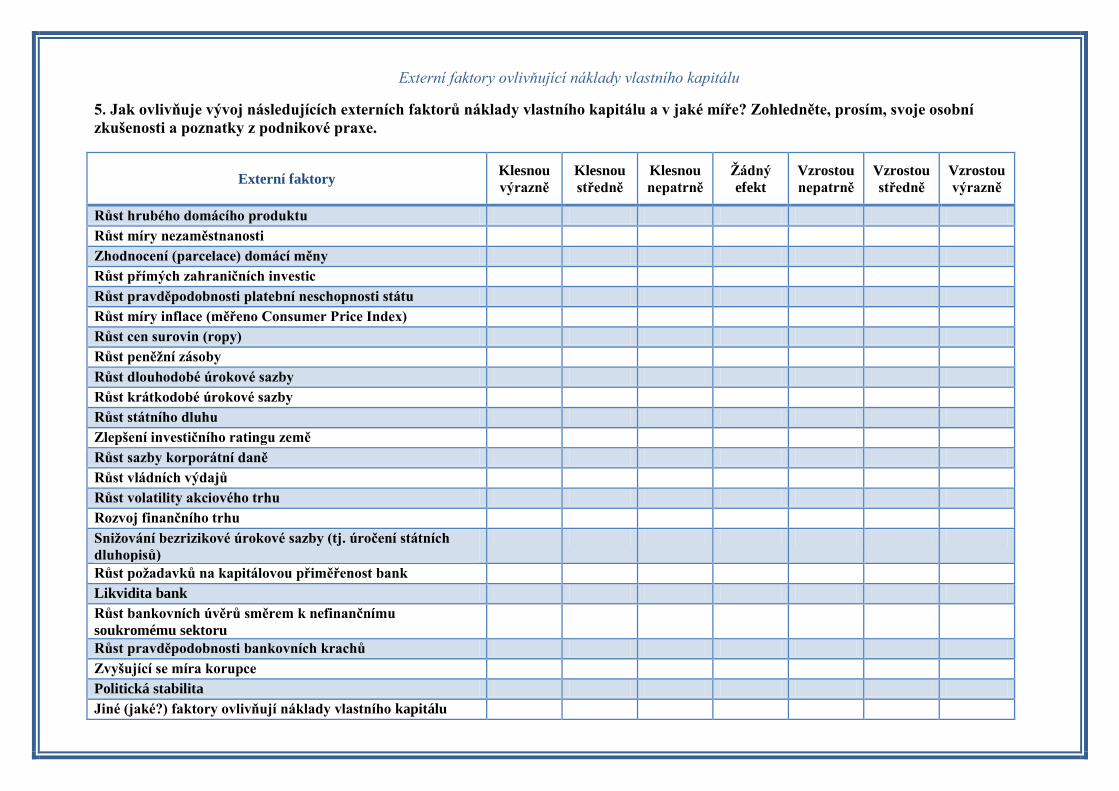
Externí faktory ovlivňující náklady vlastního kapitálu
5. Jak ovlivňuje vývoj následujících externích faktorů náklady vlastního kapitálu a v jaké míře? Zohledněte, prosím, svoje osobní
zkušenosti a poznatky z podnikové praxe.
Externí faktory
Klesnou
výrazně
Klesnou
středně
Klesnou
nepatrně
Žádný
efekt
Vzrostou
nepatrně
Vzrostou
středně
Vzrostou
výrazně
Růst hrubého domácího produktu
Růst míry nezaměstnanosti
Zhodnocení (parcelace) domácí měny
Růst přímých zahraničních investic
Růst pravděpodobnosti platební neschopnosti státu
Růst míry inflace (měřeno Consumer Price Index)
Růst cen surovin (ropy)
Růst peněžní zásoby
Růst dlouhodobé úrokové sazby
Růst krátkodobé úrokové sazby
Růst státního dluhu
Zlepšení investičního ratingu země
Růst sazby korporátní daně
Růst vládních výdajů
Růst volatility akciového trhu
Rozvoj finančního trhu
Snižování bezrizikové úrokové sazby (tj. úročení státních
dluhopisů)
Růst požadavků na kapitálovou přiměřenost bank
Likvidita bank
Růst bankovních úvěrů směrem k nefinančnímu
soukromému sektoru
Růst pravděpodobnosti bankovních krachů
Zvyšující se míra korupce
Politická stabilita
Jiné (jaké?) faktory ovlivňují náklady vlastního kapitálu
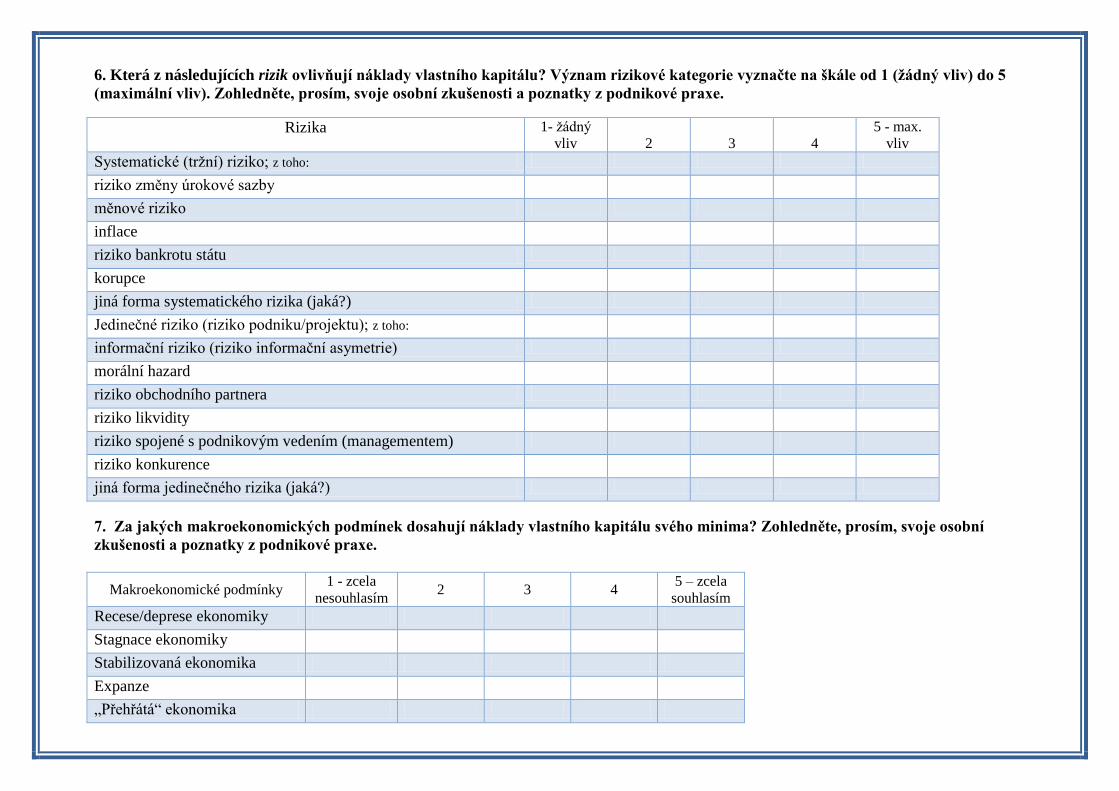
6. Která z následujících rizik ovlivňují náklady vlastního kapitálu? Význam rizikové kategorie vyznačte na škále od 1 (žádný vliv) do 5
(maximální vliv). Zohledněte, prosím, svoje osobní zkušenosti a poznatky z podnikové praxe.
Rizika 1- žádný
vliv
2
3
4
5 - max.
vliv
Systematické (tržní) riziko; z toho:
riziko změny úrokové sazby
měnové riziko
inflace
riziko bankrotu státu
korupce
jiná forma systematického rizika (jaká?)
Jedinečné riziko (riziko podniku/projektu); z toho:
informační riziko (riziko informační asymetrie)
morální hazard
riziko obchodního partnera
riziko likvidity
riziko spojené s podnikovým vedením (managementem)
riziko konkurence
jiná forma jedinečného rizika (jaká?)
7. Za jakých makroekonomických podmínek dosahují náklady vlastního kapitálu svého minima? Zohledněte, prosím, svoje osobní
zkušenosti a poznatky z podnikové praxe.
Makroekonomické podmínky 1 - zcela
nesouhlasím 2 3 4
5 – zcela
souhlasím
Recese/deprese ekonomiky
Stagnace ekonomiky
Stabilizovaná ekonomika
Expanze
„Přehřátá“ ekonomika
Charakteristika podniku
8. Jaká je velikost Vašeho podniku?
Velký (> 250 zaměstnanců)
Střední (50 - 249 zaměstnanců)
Malý (10 - 49 zaměstnanců)
Mikro (< 10 zaměstnanců)
9. Obchoduje se na kapitálovém trhu s akciemi Vaší podniku?
Ano
Ne
10. Jaký je klíčový obor podnikání Vaší podniku?
Zemědělství, lesnictví a rybářství
Těžba a dobývání
Zpracovatelský průmysl
Výroba a rozvod elektřiny, plynu, tepla a klimatizovaného
vzduchu
Zásobování vodou; činnosti související odpadními vodami,
odpady a sanacemi
Stavebnictví
Velkoobchod a maloobchod; opravy a údržba motorových
vozidel
Doprava a skladování
Ubytování, stravování a pohostinství
Informační a komunikační činnosti
Peněžnictví a pojišťovnictví
Činnosti v oblasti nemovitostí
Profesní, vědecké a technické činnosti
Administrativní a podpůrné činnosti
Veřejná správa a obrana; povinné sociální zabezpečení
Vzdělávání
Zdravotní a sociální péče
Ostatní činnosti

11. Jste exportujícím podnikem?
Ano
Ne
12. Komentář k dotazníkovému šetření:
Pěkně dekuji vám za Vaši spolupráci!
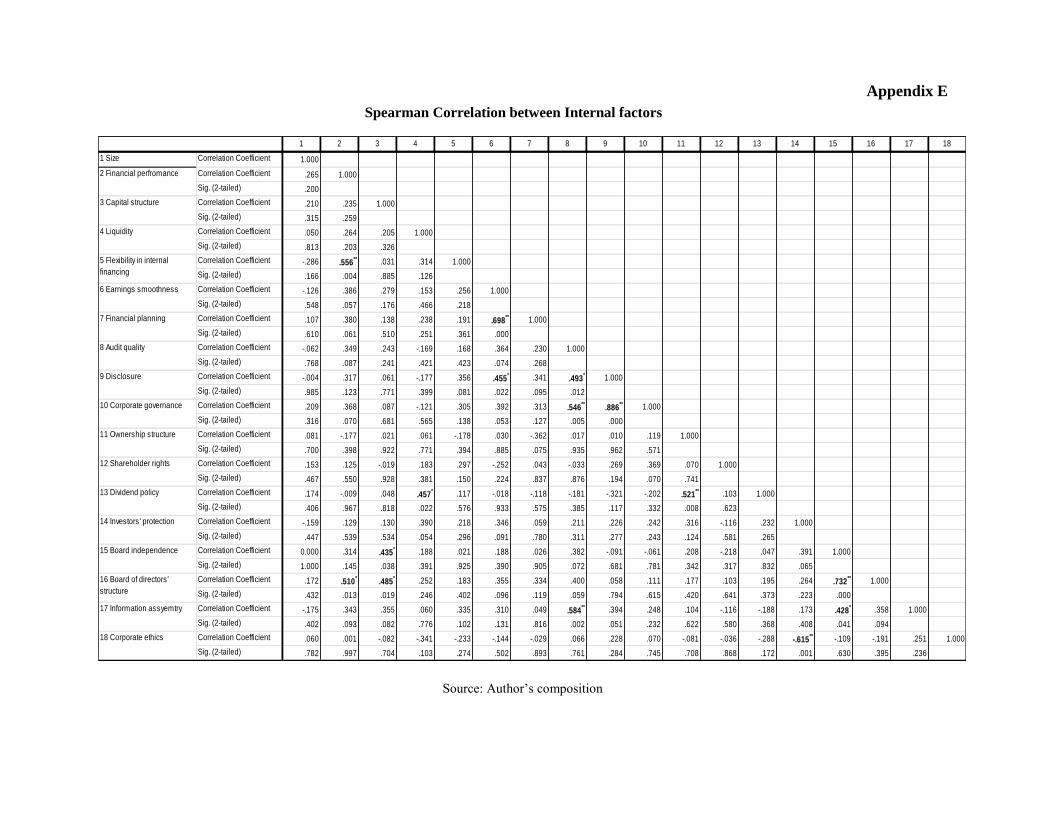
Appendix E
Spearman Correlation between Internal factors
Source: Author’s composition
1 2 3 4 5 6 7 8 9 10 11 12 13 14 15 16 17 18
1 Size Correlation Coefficient 1.000
Correlation Coefficient .265 1.000
Sig. (2-tailed) .200
Correlation Coefficient .210 .235 1.000
Sig. (2-tailed) .315 .259
Correlation Coefficient .050 .264 .205 1.000
Sig. (2-tailed) .813 .203 .326
Correlation Coefficient -.286 .556** .031 .314 1.000
Sig. (2-tailed) .166 .004 .885 .126
Correlation Coefficient -.126 .386 .279 .153 .256 1.000
Sig. (2-tailed) .548 .057 .176 .466 .218
Correlation Coefficient .107 .380 .138 .238 .191 .698** 1.000
Sig. (2-tailed) .610 .061 .510 .251 .361 .000
Correlation Coefficient -.062 .349 .243 -.169 .168 .364 .230 1.000
Sig. (2-tailed) .768 .087 .241 .421 .423 .074 .268
Correlation Coefficient -.004 .317 .061 -.177 .356 .455* .341 .493
* 1.000
Sig. (2-tailed) .985 .123 .771 .399 .081 .022 .095 .012
Correlation Coefficient .209 .368 .087 -.121 .305 .392 .313 .546**
.886** 1.000
Sig. (2-tailed) .316 .070 .681 .565 .138 .053 .127 .005 .000
Correlation Coefficient .081 -.177 .021 .061 -.178 .030 -.362 .017 .010 .119 1.000
Sig. (2-tailed) .700 .398 .922 .771 .394 .885 .075 .935 .962 .571
Correlation Coefficient .153 .125 -.019 .183 .297 -.252 .043 -.033 .269 .369 .070 1.000
Sig. (2-tailed) .467 .550 .928 .381 .150 .224 .837 .876 .194 .070 .741
Correlation Coefficient .174 -.009 .048 .457* .117 -.018 -.118 -.181 -.321 -.202 .521
** .103 1.000
Sig. (2-tailed) .406 .967 .818 .022 .576 .933 .575 .385 .117 .332 .008 .623
Correlation Coefficient -.159 .129 .130 .390 .218 .346 .059 .211 .226 .242 .316 -.116 .232 1.000
Sig. (2-tailed) .447 .539 .534 .054 .296 .091 .780 .311 .277 .243 .124 .581 .265
Correlation Coefficient 0.000 .314 .435* .188 .021 .188 .026 .382 -.091 -.061 .208 -.218 .047 .391 1.000
Sig. (2-tailed) 1.000 .145 .038 .391 .925 .390 .905 .072 .681 .781 .342 .317 .832 .065
Correlation Coefficient .172 .510*
.485* .252 .183 .355 .334 .400 .058 .111 .177 .103 .195 .264 .732
** 1.000
Sig. (2-tailed) .432 .013 .019 .246 .402 .096 .119 .059 .794 .615 .420 .641 .373 .223 .000
Correlation Coefficient -.175 .343 .355 .060 .335 .310 .049 .584** .394 .248 .104 -.116 -.188 .173 .428
* .358 1.000
Sig. (2-tailed) .402 .093 .082 .776 .102 .131 .816 .002 .051 .232 .622 .580 .368 .408 .041 .094
Correlation Coefficient .060 .001 -.082 -.341 -.233 -.144 -.029 .066 .228 .070 -.081 -.036 -.288 -.615** -.109 -.191 .251 1.000
Sig. (2-tailed) .782 .997 .704 .103 .274 .502 .893 .761 .284 .745 .708 .868 .172 .001 .630 .395 .236
14 Investors' protection
15 Board independence
16 Board of directors'
structure
17 Information assyemtry
18 Corporate ethics
13 Dividend policy
2 Financial perfromance
3 Capital structure
4 Liquidity
5 Flexibility in internal
financing
6 Earnings smoothness
7 Financial planning
8 Audit quality
9 Disclosure
10 Corporate governance
11 Ownership structure
12 Shareholder rights
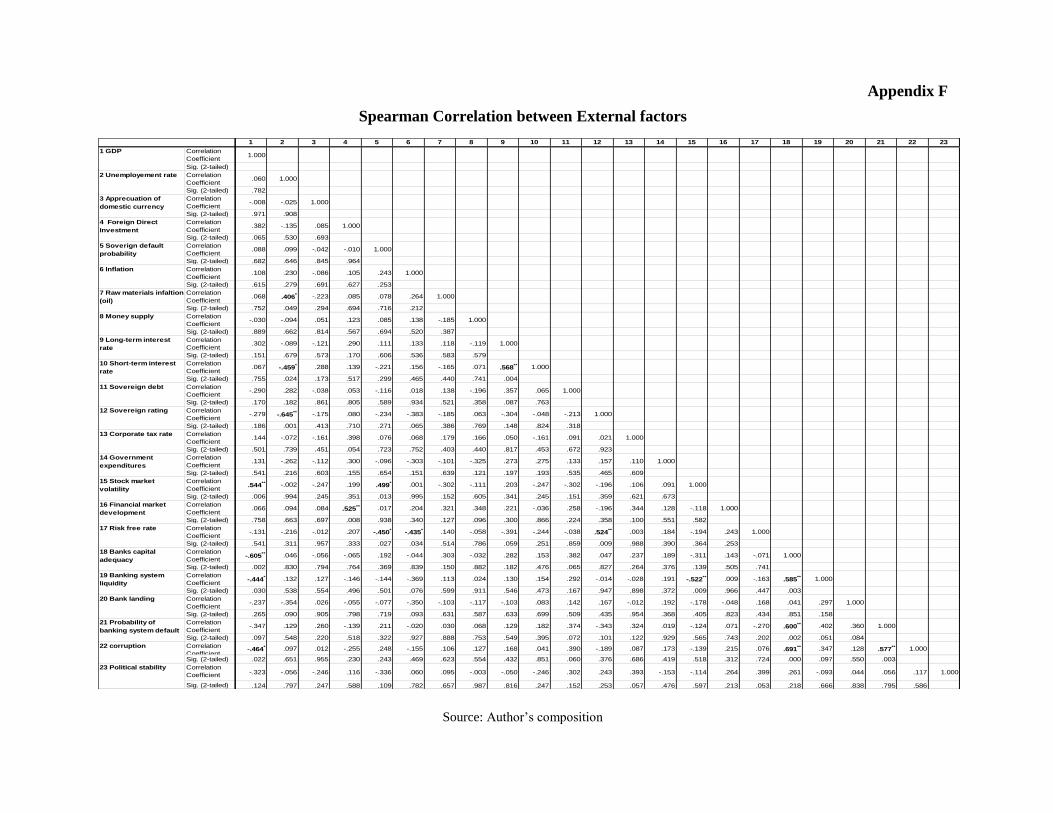
Appendix F
Spearman Correlation between External factors
Source: Author’s composition
1 2 3 4 5 6 7 8 9 10 11 12 13 14 15 16 17 18 19 20 21 22 23
Correlation
Coefficient1.000
Sig. (2-tailed)
Correlation
Coefficient.060 1.000
Sig. (2-tailed) .782
Correlation
Coefficient-.008 -.025 1.000
Sig. (2-tailed) .971 .908
Correlation
Coefficient.382 -.135 .085 1.000
Sig. (2-tailed) .065 .530 .693
Correlation
Coefficient.088 .099 -.042 -.010 1.000
Sig. (2-tailed) .682 .646 .845 .964
Correlation
Coefficient.108 .230 -.086 .105 .243 1.000
Sig. (2-tailed) .615 .279 .691 .627 .253
Correlation
Coefficient.068 .406* -.223 .085 .078 .264 1.000
Sig. (2-tailed) .752 .049 .294 .694 .716 .212
Correlation
Coefficient-.030 -.094 .051 .123 .085 .138 -.185 1.000
Sig. (2-tailed) .889 .662 .814 .567 .694 .520 .387
Correlation
Coefficient.302 -.089 -.121 .290 .111 .133 .118 -.119 1.000
Sig. (2-tailed) .151 .679 .573 .170 .606 .536 .583 .579
Correlation
Coefficient.067 -.459* .288 .139 -.221 .156 -.165 .071 .568** 1.000
Sig. (2-tailed) .755 .024 .173 .517 .299 .465 .440 .741 .004
Correlation
Coefficient-.290 .282 -.038 .053 -.116 .018 .138 -.196 .357 .065 1.000
Sig. (2-tailed) .170 .182 .861 .805 .589 .934 .521 .358 .087 .763
Correlation
Coefficient-.279 -.645** -.175 .080 -.234 -.383 -.185 .063 -.304 -.048 -.213 1.000
Sig. (2-tailed) .186 .001 .413 .710 .271 .065 .386 .769 .148 .824 .318
Correlation
Coefficient.144 -.072 -.161 .398 .076 .068 .179 .166 .050 -.161 .091 .021 1.000
Sig. (2-tailed) .501 .739 .451 .054 .723 .752 .403 .440 .817 .453 .672 .923
Correlation
Coefficient.131 -.262 -.112 .300 -.096 -.303 -.101 -.325 .273 .275 .133 .157 .110 1.000
Sig. (2-tailed) .541 .216 .603 .155 .654 .151 .639 .121 .197 .193 .535 .465 .609
Correlation
Coefficient.544** -.002 -.247 .199 .499* .001 -.302 -.111 .203 -.247 -.302 -.196 .106 .091 1.000
Sig. (2-tailed) .006 .994 .245 .351 .013 .995 .152 .605 .341 .245 .151 .359 .621 .673
Correlation
Coefficient.066 .094 .084 .525** .017 .204 .321 .348 .221 -.036 .258 -.196 .344 .128 -.118 1.000
Sig. (2-tailed) .758 .663 .697 .008 .938 .340 .127 .096 .300 .866 .224 .358 .100 .551 .582
Correlation
Coefficient-.131 -.216 -.012 .207 -.450* -.435* .140 -.058 -.391 -.244 -.038 .524** .003 .184 -.194 .243 1.000
Sig. (2-tailed) .541 .311 .957 .333 .027 .034 .514 .786 .059 .251 .859 .009 .988 .390 .364 .253
Correlation
Coefficient-.605** .046 -.056 -.065 .192 -.044 .303 -.032 .282 .153 .382 .047 .237 .189 -.311 .143 -.071 1.000
Sig. (2-tailed) .002 .830 .794 .764 .369 .839 .150 .882 .182 .476 .065 .827 .264 .376 .139 .505 .741
Correlation
Coefficient-.444* .132 .127 -.146 -.144 -.369 .113 .024 .130 .154 .292 -.014 -.028 .191 -.522** .009 -.163 .585** 1.000
Sig. (2-tailed) .030 .538 .554 .496 .501 .076 .599 .911 .546 .473 .167 .947 .898 .372 .009 .966 .447 .003
Correlation
Coefficient-.237 -.354 .026 -.055 -.077 -.350 -.103 -.117 -.103 .083 .142 .167 -.012 .192 -.178 -.048 .168 .041 .297 1.000
Sig. (2-tailed) .265 .090 .905 .798 .719 .093 .631 .587 .633 .699 .509 .435 .954 .368 .405 .823 .434 .851 .158
Correlation
Coefficient-.347 .129 .260 -.139 .211 -.020 .030 .068 .129 .182 .374 -.343 .324 .019 -.124 .071 -.270 .600** .402 .360 1.000
Sig. (2-tailed) .097 .548 .220 .518 .322 .927 .888 .753 .549 .395 .072 .101 .122 .929 .565 .743 .202 .002 .051 .084
Correlation
Coefficient-.464* .097 .012 -.255 .248 -.155 .106 .127 .168 .041 .390 -.189 .087 .173 -.139 .215 .076 .691** .347 .128 .577** 1.000
Sig. (2-tailed) .022 .651 .955 .230 .243 .469 .623 .554 .432 .851 .060 .376 .686 .419 .518 .312 .724 .000 .097 .550 .003
Correlation
Coefficient -.323 -.056 -.246 .116 -.336 .060 .095 -.003 -.050 -.246 .302 .243 .393 -.153 -.114 .264 .399 .261 -.093 .044 .056 .117 1.000
Sig. (2-tailed) .124 .797 .247 .588 .109 .782 .657 .987 .816 .247 .152 .253 .057 .476 .597 .213 .053 .218 .666 .838 .795 .586
12 Sovereign rating
13 Corporate tax rate
14 Government
expenditures
15 Stock market
volatility
16 Financial market
development
17 Risk free rate
1 GDP
2 Unemployement rate
3 Apprecuation of
domestic currency
4 Foreign Direct
Investment
5 Soverign default
probability
6 Inflation
7 Raw materials infaltion
(oil)
20 Bank landing
21 Probability of
banking system default
22 corruption
23 Political stability
18 Banks capital
adequacy
19 Banking system
liquidity
8 Money supply
9 Long-term interest
rate
10 Short-term interest
rate
11 Sovereign debt
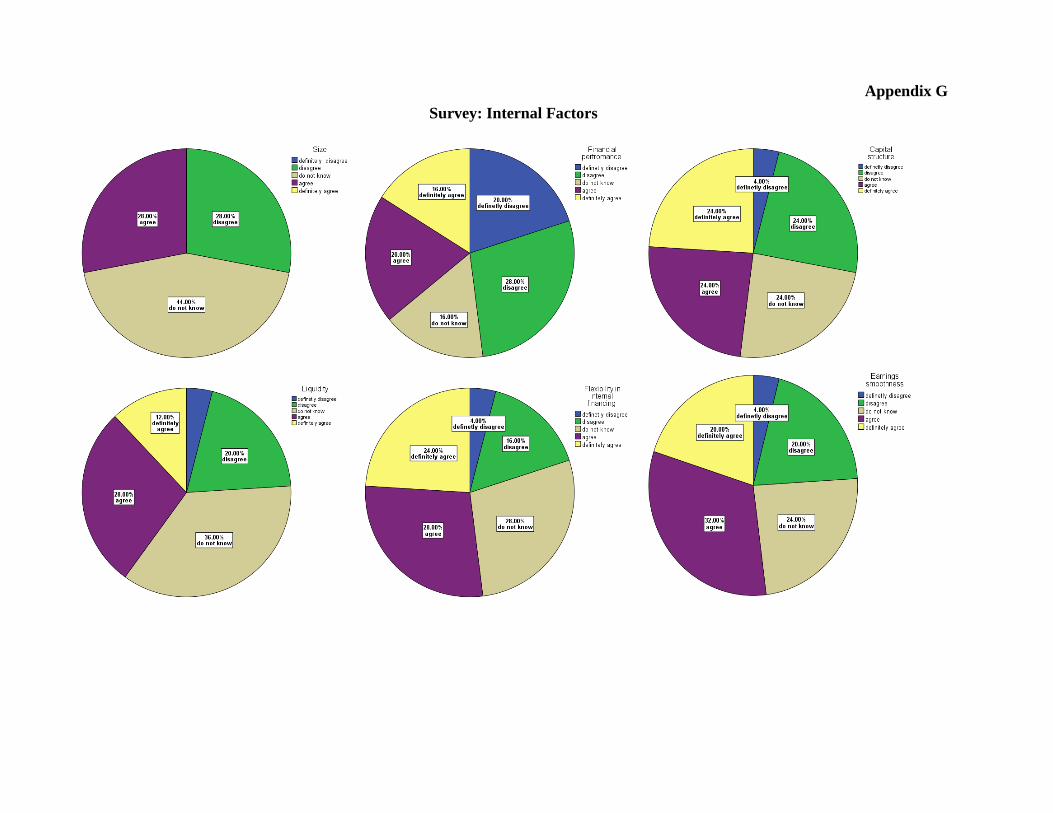
Appendix G
Survey: Internal Factors
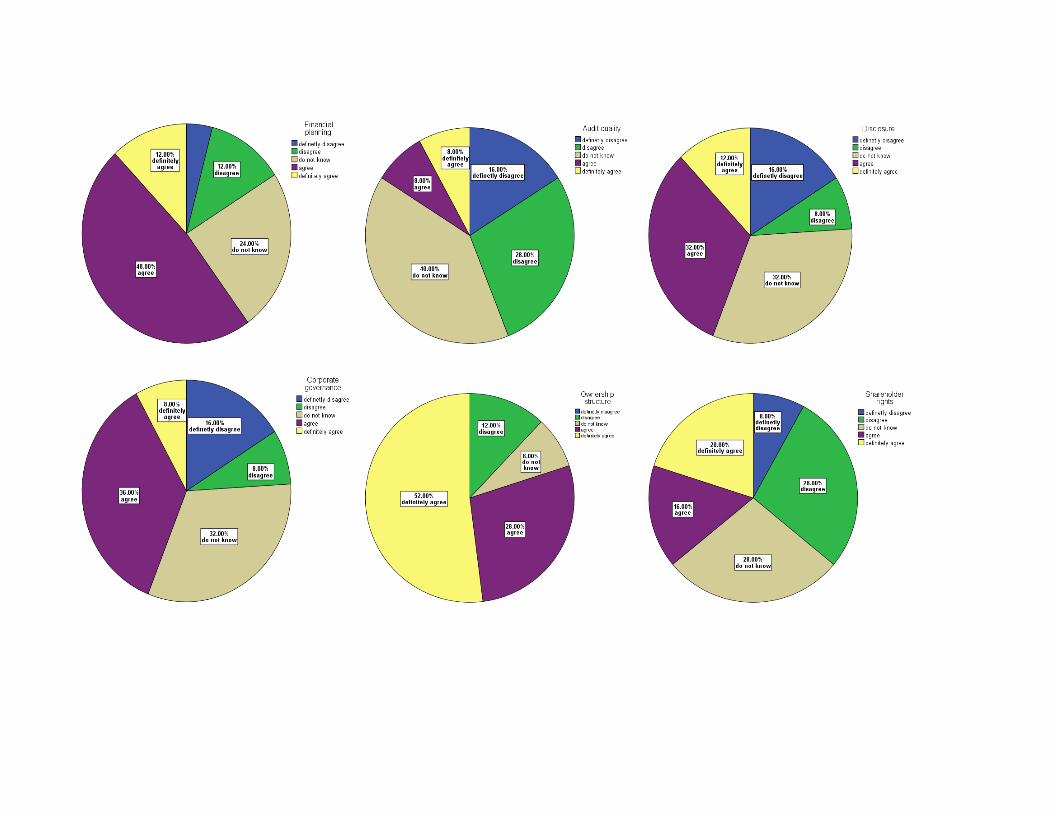
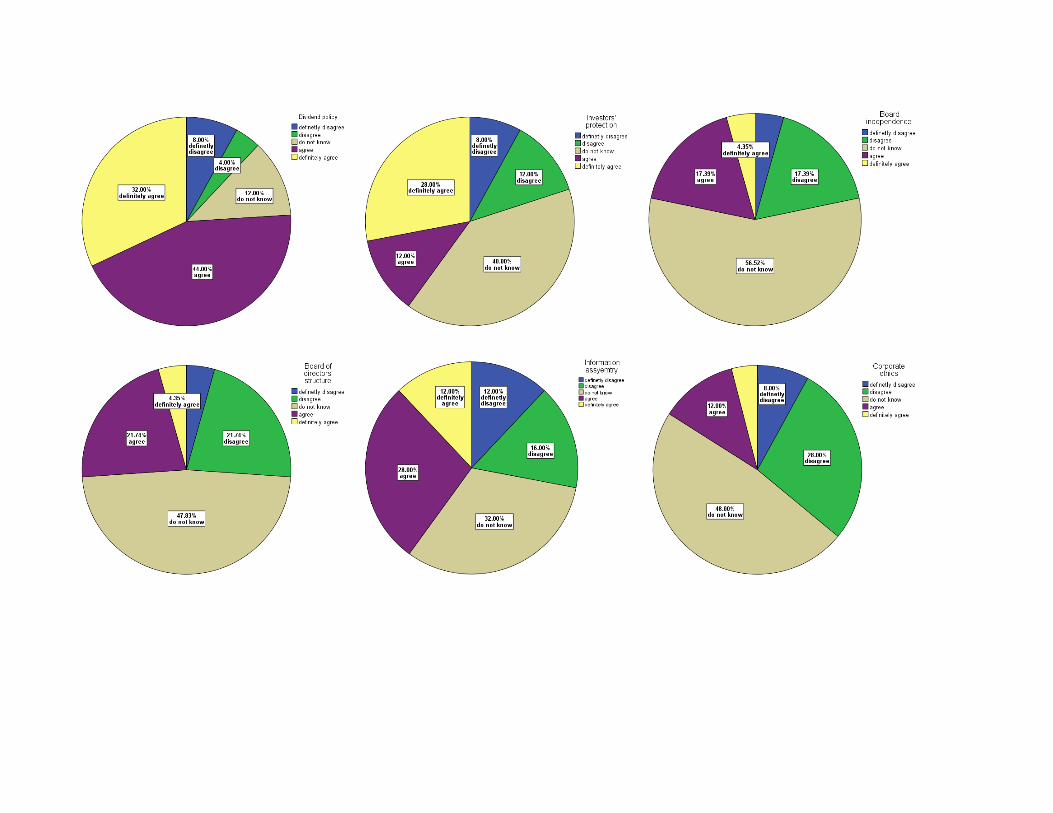
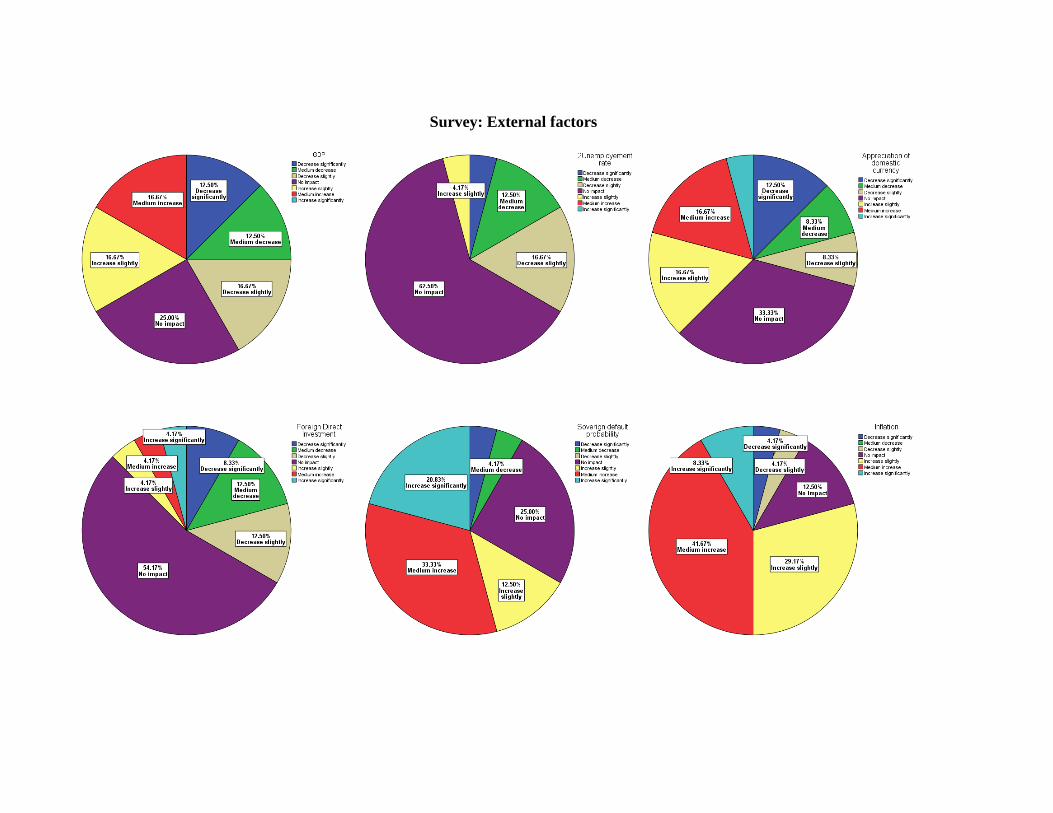
Survey: External factors
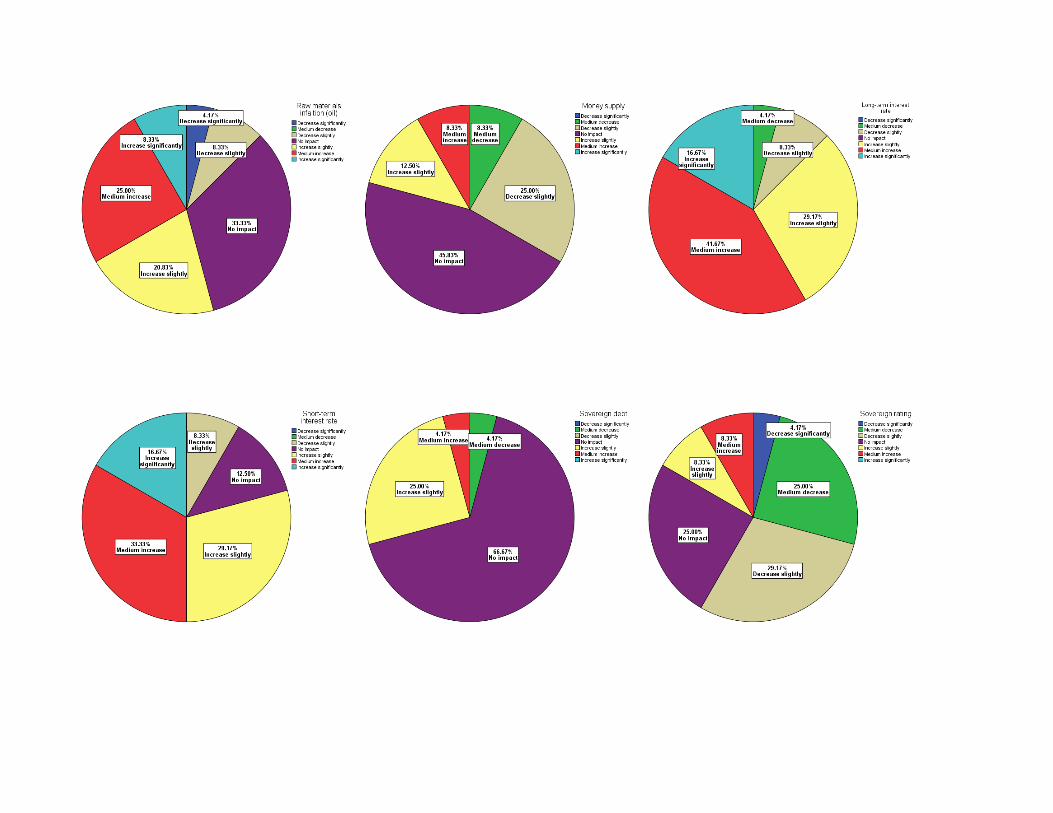
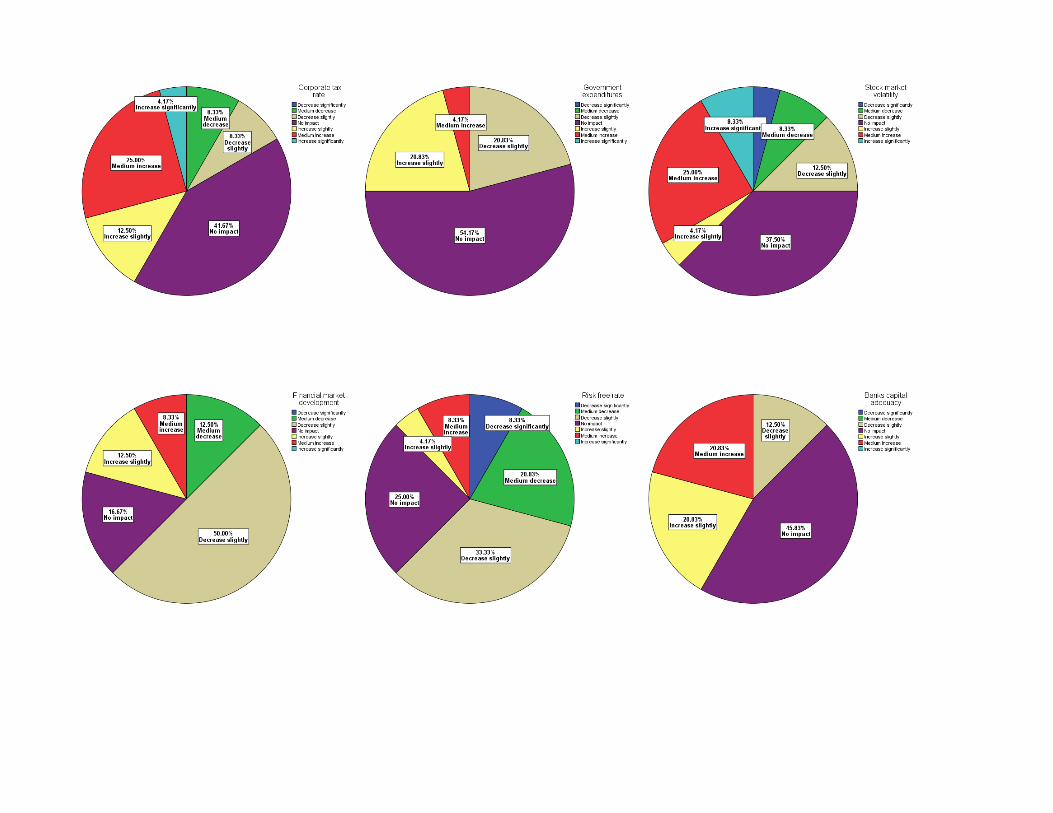
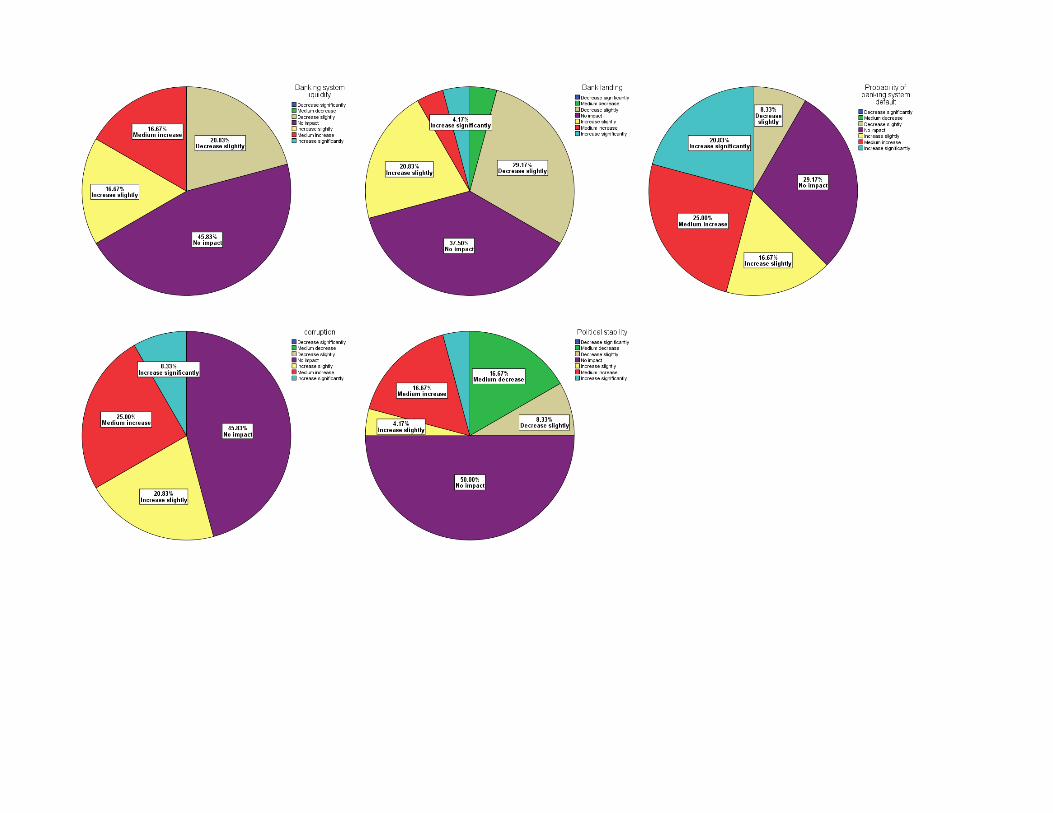
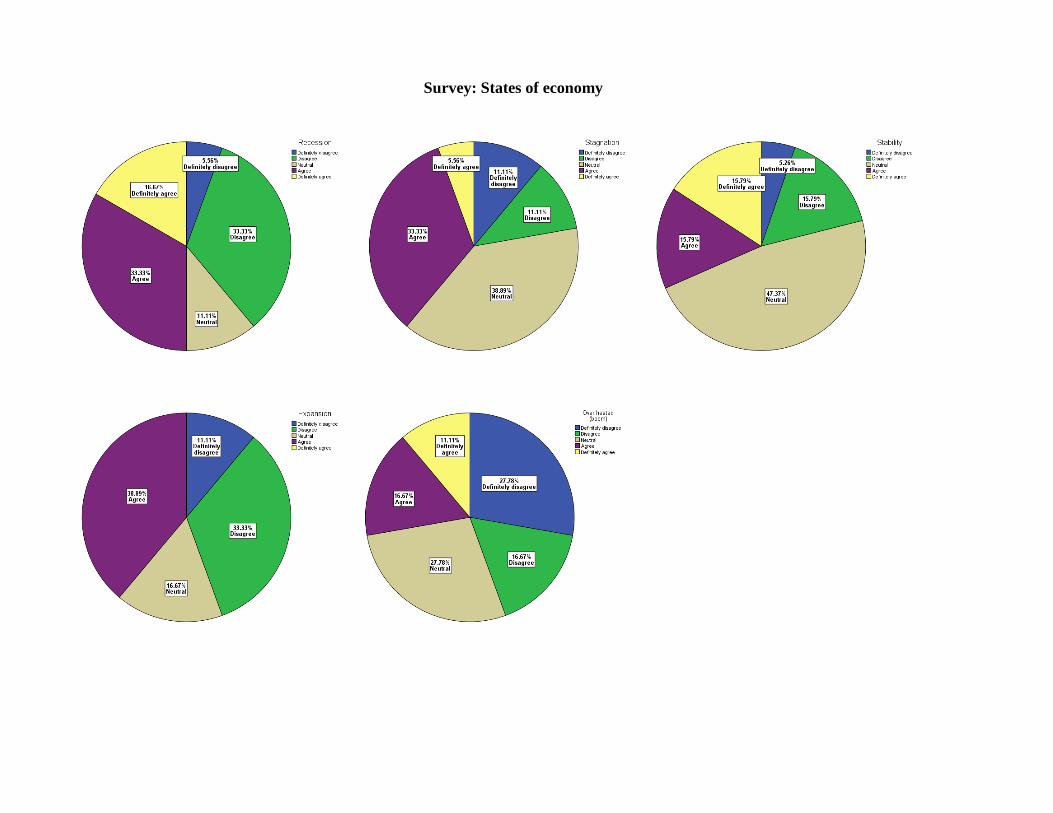
Survey: States of economy
Biography
Education
Specialist Degree
(Diploma)
2004-2009
Economics (Public finance)
Izhevsk State Technical University
Russian Federation
Specialist Degree
(Diploma)
2006-2009 Translation in professional
sphere (English)
Izhevsk State Technical University
Russian Federation
Secondary and high
level degree
1994-2004 Secondary education Lynguistic lyceoum N25,
Russian Federation
Research stays
ISC Paris (September 2011 – January 2012)
Long-term study and research stay
WU University of Business and Management, Vienna (March 2013)
Short-term research stay
Employement 02.2015 - current
Fabory Group/ Statistical analyst
Accomplishments:
conduct analysis of financial and non-financila performance
create, promote nad improve the pricing strategy of the Holding
monitor and report the financial perfromance
01.2009 - 05.2009
CSI / teacher of English
Accomplishments:
● create the teaching plan;
● teach students in groups and individually.
01.07.2008 - 31.07.2008
Ministry of Economy, Department of Investment / Internship
Accomplishments:
● write diploma thesis based on the analysis of the investment projects
01.07.2006 - 31.07.2006
Local Tax Office / Internship
Accomplishments:
● help with daily duties of the department
● assist in the documentation process
Publication list MOKHOVA, N.; ZINECKER, M. Corporate Negative Equity: The Evidence from the European
Union. Acta Universitatis Agriculturae et Silviculturae Mendelianae Brunensis, 2016, roč. 64, č. 3, s.
1021-1036. ISSN 1211-8516
MOKHOVA, N.; ZINECKER, M. Macroeconomic Factors and Corporate Capital Structure.
Procedia Social and Behavioral Sciences, 2014, roč. 110, č. January 2014, s. 530-540. ISSN: 1877-
0428.
MOKHOVA, N.; ZINECKER, M. Determinants of Capital Structure: the Evidence from the
European Union. Acta Universitatis Agriculturae et Silviculturae Mendelianae Brunensis, 2013, roč.
61, č. 7, s. 2533-2546. ISSN: 1211- 8516.
MOKHOVA, N.; ZINECKER, M. Liquidity, probability of bankruptcy and the corporate life
cycle: the evidence from Czech Republic. International Journal of Globalisation and Small Business,
2013, roč. 2013, č. 3, s. 189-208. ISSN: 1479- 3067.
MOKHOVA, N. The management of equity capital in the crisis and post- crisis periods.
Economics, Management, and Financial Markets , 2011, roč. 6, č. 1, s. 1020-1029. ISSN: 1842- 3191.
MOKHOVA, N. The cost of equity capital in the present-day condition: the impact of the global
financial crisis, Economics and management, 2011, roč. 2011, č. 16, s. 1170-1173. ISSN: 1822-
6515.
MOKHOVA, N.; ZINECKER, M. Capital structure and the country default risk: The evidence
from Visegrad group. The Macrotheme Review, 2013, roč. 2, č. 1, s. 155-179. ISSN: 1848- 4735.
MOKHOVA, N.; ZINECKER, M. The determinants of capital structure: the evidence from the
European Union. In conference proceedings Enterprise and Competitive Environment. 1. Bučovice,
Czech Republic: Martin Stříž Publishing, 2013. s. 103-103. ISBN: 978-80-87106-64- 8.
AFONINA, A.; MOKHOVA, N.; CHALUPSKÝ, V. The Relation between the Strategic
Management Tools and Techniques and Organizational Performance: a Literature Review. In Trends
in economics and management for the 21st century. Brno: Brno University of Technology, 2012. s. 1-
8. ISBN: 978-80-214-4581- 9.
MOKHOVA, N. The cost of capital in the decision making process, Modern Problems Economy,
Business and Management: Theory and Practice. Iževsk: TU Iževsk, 2011. s. 18-22. ISBN: 978-5-
7526-0520- 8.
MOKHOVA, N. The internal factors influencing the cost of equity capital, Ekonomika a
management, Muni press, 2010, s” 364-369

MOKHOVA, N. The correlation between the life cycle of the enterprise and the cost of capital,
Mezinárodni doktorandký workshop, VUT FP v Brne, 2009, s”25-30