Intermeuse: The Meuse Reconnected
80
INTERMEUSE: the Meuse reconnected Final report of IRMA/SPONGE project no. 9, December 2001. N. Geilen 1 , B. Pedroli 2 , K. van Looy 3 , L. Krebs 4 , H. Jochems 3 , S. van Rooij 2 & Th. van der Sluis 2 1 : RIZA, Arnhem, the Netherlands, 2 : ALTERRA, Wageningen, the Netherlands, 3 : Institute for Nature Conservation, Brussels, Belgium, 4 : University of Metz, France December 2001 NCR Publication 15-2001 ISSN 1568-234X RIZA ALTERRA Inst. for Nature Conservation University of Metz
Transcript of Intermeuse: The Meuse Reconnected
INTERMEUSE: the Meuse reconnected Final report of IRMA/SPONGE project no. 9, December 2001. N. Geilen1, B. Pedroli2, K. van Looy3, L. Krebs4, H. Jochems3, S. van Rooij2 & Th. van der Sluis2
1: RIZA, Arnhem, the Netherlands, 2: ALTERRA, Wageningen, the Netherlands, 3: Institute for Nature Conservation, Brussels, Belgium, 4: University of Metz, France December 2001 NCR Publication 15-2001 ISSN 1568-234X
RIZA ALTERRA Inst. for Nature Conservation
University of Metz
Preface INTERMEUSE and the IRMA-SPONGE Umbrella Program In recent years, several developments have contributed not only to an increased public interest in flood risk management issues, but also to a greater awareness of the need for improved knowledge supporting flood risk management. Important factors are: • Recent flooding events and the subsequently developed national action plans. • Socio-economic developments such as the increasing urbanisation of flood-prone areas. • Increased awareness of ecological and socio-economic effects of measures along rivers. • Increased likelihood of future changes in flood risks due to land use and climate changes. The study leading to this report aimed to fill one of the identified knowledge gaps with respect to flood risk management, and was therefore incorporated in the IRMA-SPONGE Umbrella Program. This program is financed partly by the European INTERREG Rhine-Meuse Activities (IRMA), and managed by the Netherlands Centre for River Studies (NCR). It is the largest and most comprehensive effort of its kind in Europe, bringing together more than 30 European scientific and management organisations in 13 scientific projects researching a wide range of flood risk management issues along the Rivers Rhine and Meuse. The main aim of IRMA-SPONGE is defined as: “The development of methodologies and tools to assess the impact of flood risk reduction measures and scenarios. This to support the spatial planning process in establishing alternative strategies for an optimal realisation of the hydraulic, economical and ecological functions of the Rhine and Meuse River Basins." A further important objective is to promote transboundary co-operation in flood risk management. Specific fields of interest are: • Flood risk assessment. • Efficiency of flood risk reduction measures. • Sustainable flood risk management. • Public participation in flood management issues. More detailed information on the IRMA-SPONGE Umbrella Program can be found on our website: www.irma-sponge.org. We would like to thank the authors of this report for their contribution to the program, and sincerely hope that the information presented here will help the reader to contribute to further developments in sustainable flood risk management. Ad van Os and Aljosja Hooijer (NCR Secretary and IRMA-SPONGE project manager)
Acknowledgements Belgium, France, Germany, Luxembourg and the Netherlands submitted a joint program for prevention against flooding to the European Commission, in the light of the EC’s INTERREG-IIC initiative. This program was approved in 1997 and was given the name IRMA (Interreg-IIC Rhine Meuse Activities). Within the frame of this program the project INTERMEUSE, part of the umbrella project IRMA/SPONGE which is managed by the Netherlands Centre for River studies (NCR), was carried out by the following partners: • RIZA Rijkswaterstaat, the Netherlands (main applicant); • ALTERRA, Green World Research, the Netherlands; • Institute for Nature Conservation (IN) of the Flemish Community, Belgium; • University of Metz (UM), France. The project was monitored by the ISAC representatives Prof. Dr. A. Musy and Prof. Ir. E. van Beek. Part of the work was performed by external contracted parties: Royal Haskoning (the Netherlands). Last but not least a great number of institutes, parties and persons have helped to bring the project to a good end. We like to thank them all for their efforts. Noël Geilen (RIZA) Bas Pedroli (Alterra) Kris van Looy (IN) Laurence Krebs (UM) Hans Jochems (IN) Sabine van Rooij (Alterra) Theo van der Sluis (Alterra)
Summary In the coming years decision makers are confronted with the question how to combine aims for sustainable flood protection and floodplain rehabilitation in the best possible way. Both topics deal with spatial planning aspects and dimensions of measures. On this basis an evaluation method was developed within the IRMA/SPONGE project INTERMEUSE and illustrated for (fictive) situations in the Meuse basin: • SPONGE: measures retaining water to slow down run-off to the main bed; • RETENTION: measures aiming at retention of peak discharges; • WINTERBED: measures increasing discharge capacity. The integration of flood protection and floodplain rehabilitation can be performed on two scale levels that are interrelated: global for (large parts of) a stream basin or local for a specific site. Both scale levels are elaborated within INTERMEUSE. A link with flood protection measures and/or strategies is made via changed abiotic conditions, resulting in indications on chances to link flood protection goals to ecosystem rehabilitation goals. Integration and ecological assessment on the global scale focussed on spatial aspects, elaborated on the basis of the concept of ecological network functioning. Here, habitat configurations are assessed for their potentials for the development of sustainable populations of species. Key elements in this approach are habitat size, spatial cohesion and species requirements. On a more detailed, local scale focus for ecological effect assessment of flood protection activities is on completeness of species communities in relation to local conditions, as indication for ecological quality. Within INTERMEUSE carabid beetles were chosen as indicator group for the river bed zone and meadow vegetation as indicator for the winter bed. Based on cluster analysis data correlations between species communities and environmental features were made. Combined with habitat requirements of indicator species predictive models were designed, with which future situations resulting from e.g. flood protection measures can be assessed on their potentials for the integration of river bed rehabilitation goals Based on the results of the analyses performed an integration approach was constructed that can be used in different parts of the planning cycle. Important element in this approach is the definition of the ecological minimum: the critical boundary or minimum level of habitat conditions for a potentially good ecological functioning. The approach is elaborated in a number of toolboxes and guidelines. The results of this first study show clearly that there is a good chance to combine floodplain rehabilitation aims with flood protection activities, both on a local and international scale. In practice, for both cases close co-operation of parties involved is an important prerequisite. INTERMEUSE leads to the conclusion that to achieve optimal results regarding the attuning of conservation and development of biodiversity values on one hand and flood defence measures on the other, it is recommended to aim at a balance between creating space in width and creating space in depth. Uniform solutions must be avoided, a diversity of influence of river dynamics in floodplains should be aimed at.

Contents
Preface _______________________________________________________ 2 Acknowledgements _____________________________________________ 3 Summary _____________________________________________________ 4 Contents ______________________________________________________ 5 1. Introduction_________________________________________________ 7
1.1 Background _________________________________________________________________7
1.2 Objective ___________________________________________________________________7
1.3 Outline of the report___________________________________________________________8
2. The INTERMEUSE-case_________________________________________ 9 2.1 Outline of the study ___________________________________________________________9
2.2 New concepts for flood protection ______________________________________________10
2.3 Integration of flood protection and floodplain rehabilitation __________________________12
2.4 Ecological effect variables_____________________________________________________13
3. Description of study area _____________________________________ 15 3.1 The Meuse basin ____________________________________________________________15
3.2 Description of Meuse stretches _________________________________________________17 3.2.1 Lorraine Meuse __________________________________________________________18 3.2.2 Ardennes Meuse _________________________________________________________19 3.2.3 Common Meuse _________________________________________________________20 3.2.4 Sand Meuse_____________________________________________________________20 3.2.5 Tidal Meuse_____________________________________________________________21
4. Boundary conditions for the ecological functioning of river systems _ 24 4.1 Effectiveness of flood protection measures ________________________________________24
4.2 Definition of three strategies for integrated flood protection __________________________26
4.3 Effects of the strategies on boundary conditions for ecological functioning______________ 28 5. Ecological cohesion: habitat network functioning _________________ 31
5.1 Ecological network analysis ___________________________________________________31
5.2 LARCH results for selected ecological profiles ____________________________________32
5.3 The strategies compared ______________________________________________________36
6. Ecosystem quality: river bed habitat integrity____________________ 39 6.1 Ecological quality analysis: carabid beetle communities _____________________________39
6.2 Ecological quality analysis: results ______________________________________________39
6.3 Results of multivariate analysis at global and local level _____________________________41
6.4 Conclusion _________________________________________________________________44
7. Ecosystem quality: winter bed habitat integrity __________________ 46 7.1 Ecological quality analysis: meadow vegetation communities _________________________46
7.2 Results ____________________________________________________________________50
8. Integration on a global level___________________________________ 52 8.1 Spatial planning _____________________________________________________________52
8.2 Evaluation: tools and guidelines ________________________________________________53
9. Integration on a local level ____________________________________ 54 9.1 Planning phase: guidelines ____________________________________________________54
9.1.1 Meadow vegetation _______________________________________________________54 9.1.2 Carabid beetles __________________________________________________________55
9.2 Evaluation _________________________________________________________________57
10. Discussion ________________________________________________ 58 11. Conclusions and recommendations____________________________ 62 Literature____________________________________________________ 64 Glossary _____________________________________________________ 66 Annexes _____________________________________________________ 67 Annex 1. Project organisation IRMA/SPONGE project INTERMEUSE ________________________68
Annex 2 Mapping classifications used in INTERMEUSE ___________________________________70
Publications __________________________________________________ 77 Colophon ____________________________________________________ 79
1. Introduction 1.1 Background The natural river landscapes in NW Europe have changed drastically over the last centuries due to human activities. Normalisation and regulation of the river ensured quick run off from water, ice and sediments and at the same time enhanced navigation. Dikes were raised to protect people and goods from flooding. The remaining floodplain areas are almost completely being used by agriculture and at some places gravel, sand or clay mining has been carried out. The massive flooding events of 1993 and 1995 along the river Meuse (and Rhine) proved that the presumed safety against flooding was to be reconsidered. In the past dikes were raised after (potential) flood events, now it was clear that new strategies needed to be developed as further raising of dikes was not a solution on a long term. The central theme of these new strategies was to give back the rivers some of the “room” they had lost in the past centuries. As if this wasn’t a challenge enough, spatial designs needed to integrate riverine functions as well as possible. Space in most cases is scarce and this is especially true along and around river systems. Apart from flood protection other riverine functions claim the scarce available space, like urbanisation, industry, recreation, agriculture and nature. Therefore, so-called win-win situations need to be achieved: measures being beneficial for various river-functions. Many functions, e.g. nature, could benefit from the changes that will take place to maintain safety against flooding. As a result of the above mentioned human activities the natural river landscape deteriorated. Natural features of river systems are the result of the dynamic abiotic processes. With the decline of natural habitat diversity the accompanying characteristic species vanished or were left in isolated scattered fragments of habitats. The last decades national and international programs were started aiming at the ecological rehabilitation of river systems. The guiding principle for this needs to be the (restoration of) natural river processes: in particular the hydro- and morphodynamics. With the expected large scale changes in spatial design of floodplain areas along NW European river systems resulting from flood protection measures, tuning of measures and aims for the ecological rehabilitation of river systems has become a prerequisite. The elaboration of new flood protection strategies into daily practice calls not only for new technical solutions. There is also a strong need for new concepts and accompanying tools which can help the decision-makers to explore future spatial designs for floodplain areas. Both flood protection and river rehabilitation are strongly served by an integrated approach on a river basin level. Partly as space is scarce as mentioned earlier, partly as problems cannot be solved always at the particular site in question. For both flood protection and river rehabilitation it is not enough to have enough space, also a good spatial connectivity is important, even a necessity. For flood protection this coherence is even the guiding principle for future spatial arrangement. The same stands for conservation and restoration of natural assets. Within the IRMA/SPONGE-project INTERMEUSE an attempt is made to elaborate such a concept and accompanying toolbox. The focus has been on the ecological impacts of certain flood protection strategies and measures. 1.2 Objective The main objective of the project INTERMEUSE is the development and application of a methodology for the evaluation of spatial planning alternatives for river basins, with respect to the integration of flood protection and floodplain rehabilitation. The effect assessment focuses on the ecological impacts of certain flood protection strategies and measures. The Meuse basin was chosen as study area to develop the proposed evaluation methodology and to illustrate its applicability. The proposed method can be applied in both (spatial) planning and subsequent evaluation (Figure 1.1).
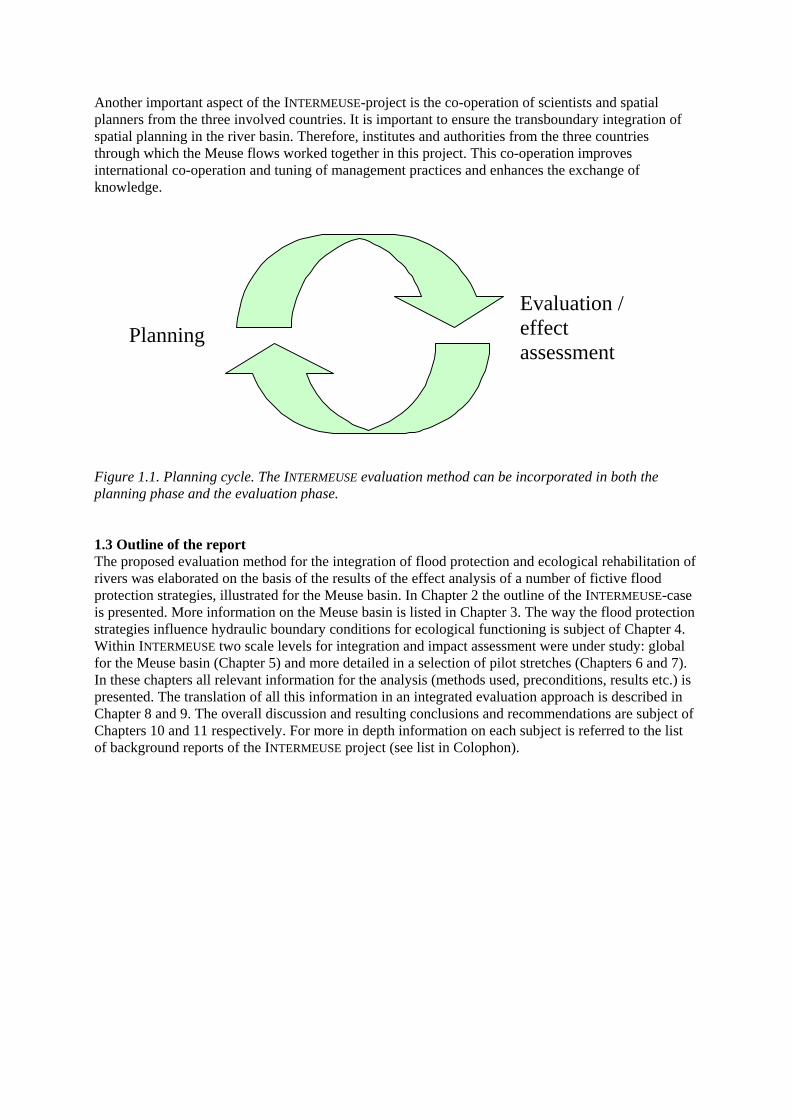
Another important aspect of the INTERMEUSE-project is the co-operation of scientists and spatial planners from the three involved countries. It is important to ensure the transboundary integration of spatial planning in the river basin. Therefore, institutes and authorities from the three countries through which the Meuse flows worked together in this project. This co-operation improves international co-operation and tuning of management practices and enhances the exchange of knowledge.
Evaluation / effect assessment
Planning
Figure 1.1. Planning cycle. The INTERMEUSE evaluation method can be incorporated in both the planning phase and the evaluation phase. 1.3 Outline of the report The proposed evaluation method for the integration of flood protection and ecological rehabilitation of rivers was elaborated on the basis of the results of the effect analysis of a number of fictive flood protection strategies, illustrated for the Meuse basin. In Chapter 2 the outline of the INTERMEUSE-case is presented. More information on the Meuse basin is listed in Chapter 3. The way the flood protection strategies influence hydraulic boundary conditions for ecological functioning is subject of Chapter 4. Within INTERMEUSE two scale levels for integration and impact assessment were under study: global for the Meuse basin (Chapter 5) and more detailed in a selection of pilot stretches (Chapters 6 and 7). In these chapters all relevant information for the analysis (methods used, preconditions, results etc.) is presented. The translation of all this information in an integrated evaluation approach is described in Chapter 8 and 9. The overall discussion and resulting conclusions and recommendations are subject of Chapters 10 and 11 respectively. For more in depth information on each subject is referred to the list of background reports of the INTERMEUSE project (see list in Colophon).
2. The INTERMEUSE-case 2.1 Outline of the study The basic theme with respect to the integration of flood protection and floodplain rehabilitation is: in order to maintain safety against flooding a certain flood protection measure (or strategy) will be carried out, resulting in changes in the abiotic environment that in turn will influence biological developments and potentials. In order to integrate the goals of both flood protection and floodplain rehabilitation knowledge on this basic theme and understanding of the interrelations is of utmost importance. This is the basis for guidelines and tools to assist decision makers, water and nature managers, spatial planners and all other parties involved in river basin management. Both flood protection and floodplain rehabilitation can be dealt with on different scale levels. On a global scale master plans and scenarios for river stretches of a whole river basin can be elaborated and assessed in order to determine the boundaries for decision making and the spatial planning process. In more detail specific measures on specific sites can be studied or elaborated. Integration of flood protection and floodplain rehabilitation therefore can be dealt with on different scale levels as well, scale levels that are strongly interrelated. Each level has its own value in the decision making process of river management and spatial planning. The scale levels and the subsequent approaches are characterised in Table 2.1, each having its own objective and requirements, specific data, toolboxes etc.. Table 2.1. Overview of the characteristics at the scale levels under study in INTERMEUSE. Aspect
Global Local
Study area catchment / basin / river stretch river bed (incl. floodplain) - same, for INTERMEUSE Meuse basin pilot stretches Flood protection function flood protection strategies flood protection measures Ecological function ecological network functioning habitat quality Ecological effect parameter landscape ecological units species (i.e. vegetation and carabid
beetle communities) / biodiversity Win-win / integration aspect
spatial aspects: spatial arrangement / cohesion
dimensions measures: interaction abiotic environment – species requirements habitats
Decision making: type of study
reconnaissance landscaping
Degree of detail global / abstract detailed / specific Output concept / scenario / strategy plan / outline / design Flood protection aims at a sustainable protection level against flooding. When studied on a global level mostly strategies representing certain flood protection measures are being assessed for their effects. These global studies are mostly performed on the level of catchments down to river stretches (with a length of several kilometres). After assessing the several possibilities, the actual measures are being studied in more detail. In general this takes place on a more local scale (length max. a couple of kilometres) as to incorporate in the best possible way the specific local conditions. Floodplain rehabilitation shows a similar division in approach. On a local scale the prevailing or future local conditions determine the ecological development and succession that can take place. The central item in INTERMEUSE for this scale is the analysis of ecological quality, linked to meadow vegetation communities and carabid beetle communities. Determining aspects are completeness of gradients linked to species habitat requirements and species communities.
On a more global scale spatial habitat aspects like area size and configuration of habitats give a good insight in the ecological potentials of a certain landscape variant. The central theme in this approach is ecological network analysis of habitat configurations. Determining aspects are area and distance between habitats related to dispersion capacity of species (indicating the spatial connectivity of habitats). 2.2 New concepts for flood protection In earlier times, flooding events or nearly flooding events resulted in an continuously raising of dikes or river regulation measures in order to keep up the safety standard against flooding and to ensure quick run-off of water during high discharges. By now it is generally accepted that further raising of dikes as protection against flooding during high river discharges is no sustainable solution. This has lead to the development of new flood management concepts. The central theme of these new concepts was to give back the rivers some of the “room” they had lost in the past centuries. In the Netherlands this concept has lead to a new policy directive “Room for the River”. The new concepts for flood protection concentrate on the following aspects: • Retaining water to slow down run-off to the main streambed; • Retention of peak discharges; • Increasing discharge capacity to ensure quick run-off of water. In INTERMEUSE these new concepts were translated to fictive flood protection strategies, each representing a specific kind of measure and aim. The role of these strategies is to define distinct options in flood protection and to assess the effects on the ecological quality of the river system by these strategies. The strategies focus on alternatives in integrated basin management to elaborate an evaluation tool for a wide range of watershed management options. It is stressed that these strategies do not claim to be future blue prints for the Meuse basin. A couple of criteria was formulated that needed to be met by the proposed flood protection strategies: • The strategies need to be relevant for river policy and management. The interpretation in terms of
different land and river management options must be clearly distinguishable. • Impacts and effects on hydraulics and ecology of the river need to be clear in the different
strategies. • Application of a strategy or measure is in line with the characteristics (e.g. geomorphological) of
a certain river stretch or local site. This resulted in the following three distinct fictive flood protection strategies that were used in INTERMEUSE, each differing in the hydrologic/hydraulic sub-processes inflicted and in the locations they should be implemented (see also Table 2.2). 1. SPONGE: set of measures implemented on the catchment level influencing the total run-off to
the river from upstream areas. This implies recovery and increment of the sponge effect (storage of water) in upstream areas and the tributaries, by means of, for example, bringing the watercourse back in its natural shape or changed land use. Within INTERMEUSE this strategy was applied on the Lorraine Meuse, the Common Meuse and the Sand Meuse. The underlying measure was defined as: development of softwood forest along selected tributaries, in zones of 25 m width at both sides of the minor bed of the tributaries.
2. RETENTION: set of measures that control the movement of the flood wave through the river,
and implemented at selected sites along the river. This implies storage of water (e.g. in reservoirs) especially during peak discharges. The main difference between SPONGE and RETENTION is that RETENTION is only effective during high discharges whereas SPONGE is effective during high and low discharges. Within INTERMEUSE this strategy was applied on the Lorraine Meuse, the Common Meuse and the Sand Meuse. The locations used correspond with existing plans or
studies. The ecological objective in these areas was defined as marshland in the Lorraine Meuse and softwood forest at the sites along the Common Meuse and the Sand Meuse.
3. WINTERBED: set of measures in the major bed of the river, e.g. floodplain enlargement and
implementation of secondary channels. This means an increase of the discharge capacity and storage of water preventing (local) flood problems. WINTERBED is based on the principle of enlargement of the river cross-section, aiming at an enlargement of the discharge capacity. It should be stated that this does not imply a decrease of the peak discharges. With WINTERBED water levels will be lowered, while the discharge may stay the same or even increases in downstream direction. Measures in the major bed have specifically a local effect. Within INTERMEUSE this strategy was applied for the whole Meuse basin. The ecological objective for WINTERBED was stated to be a mixture of side channels/open water, grassland and herbaceous vegetation.
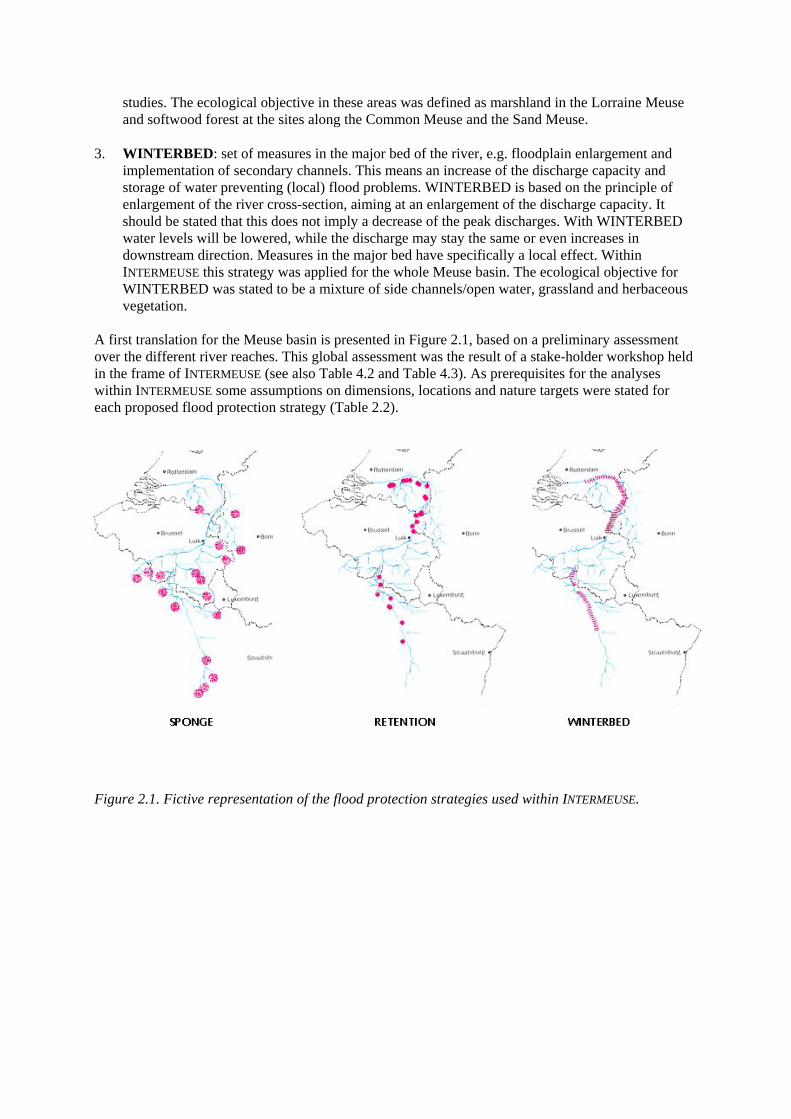
A first translation for the Meuse basin is presented in Figure 2.1, based on a preliminary assessment over the different river reaches. This global assessment was the result of a stake-holder workshop held in the frame of INTERMEUSE (see also Table 4.2 and Table 4.3). As prerequisites for the analyses within INTERMEUSE some assumptions on dimensions, locations and nature targets were stated for each proposed flood protection strategy (Table 2.2).
Figure 2.1. Fictive representation of the flood protection strategies used within INTERMEUSE.
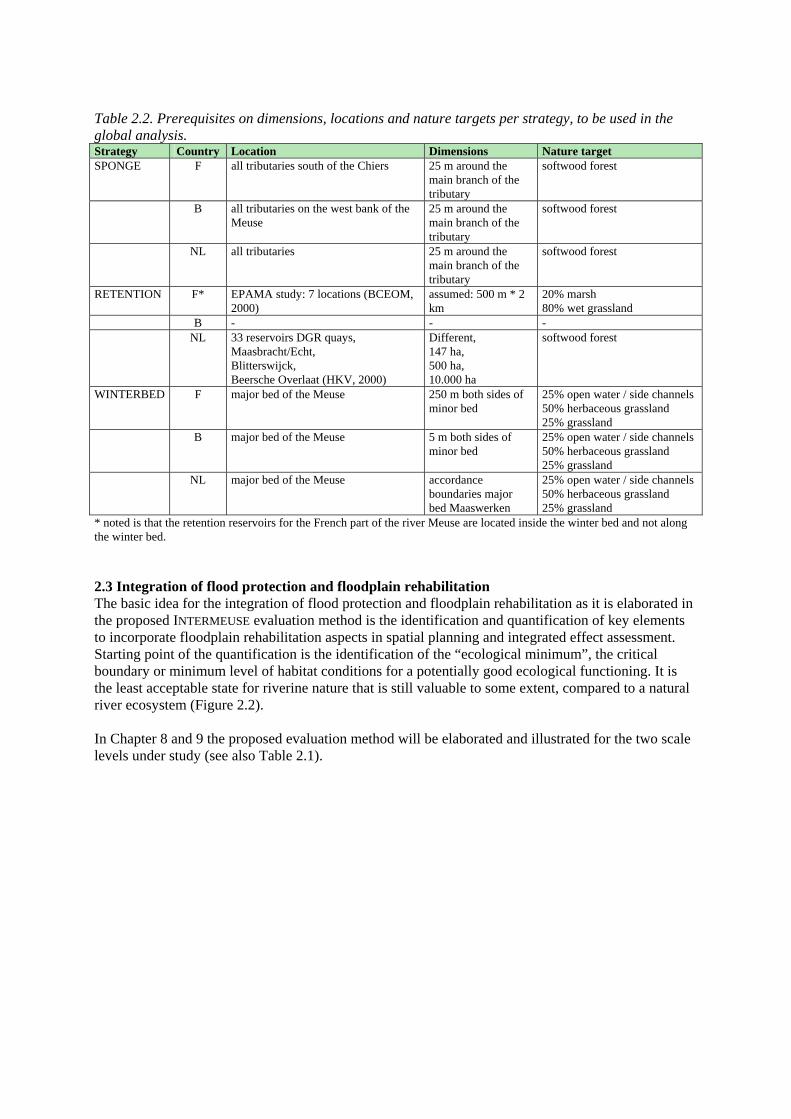
Table 2.2. Prerequisites on dimensions, locations and nature targets per strategy, to be used in the global analysis. Strategy Country Location Dimensions Nature target SPONGE F all tributaries south of the Chiers 25 m around the
main branch of the tributary
softwood forest
B all tributaries on the west bank of the Meuse
25 m around the main branch of the tributary
softwood forest
NL all tributaries 25 m around the main branch of the tributary
softwood forest
RETENTION F* EPAMA study: 7 locations (BCEOM, 2000)
assumed: 500 m * 2 km
20% marsh 80% wet grassland
B - - - NL 33 reservoirs DGR quays,
Maasbracht/Echt, Blitterswijck, Beersche Overlaat (HKV, 2000)
Different, 147 ha, 500 ha, 10.000 ha
softwood forest
WINTERBED F major bed of the Meuse 250 m both sides of minor bed
25% open water / side channels 50% herbaceous grassland 25% grassland
B major bed of the Meuse 5 m both sides of minor bed
25% open water / side channels 50% herbaceous grassland 25% grassland
NL major bed of the Meuse accordance boundaries major bed Maaswerken
25% open water / side channels 50% herbaceous grassland 25% grassland
* noted is that the retention reservoirs for the French part of the river Meuse are located inside the winter bed and not along the winter bed. 2.3 Integration of flood protection and floodplain rehabilitation The basic idea for the integration of flood protection and floodplain rehabilitation as it is elaborated in the proposed INTERMEUSE evaluation method is the identification and quantification of key elements to incorporate floodplain rehabilitation aspects in spatial planning and integrated effect assessment. Starting point of the quantification is the identification of the “ecological minimum”, the critical boundary or minimum level of habitat conditions for a potentially good ecological functioning. It is the least acceptable state for riverine nature that is still valuable to some extent, compared to a natural river ecosystem (Figure 2.2). In Chapter 8 and 9 the proposed evaluation method will be elaborated and illustrated for the two scale levels under study (see also Table 2.1).
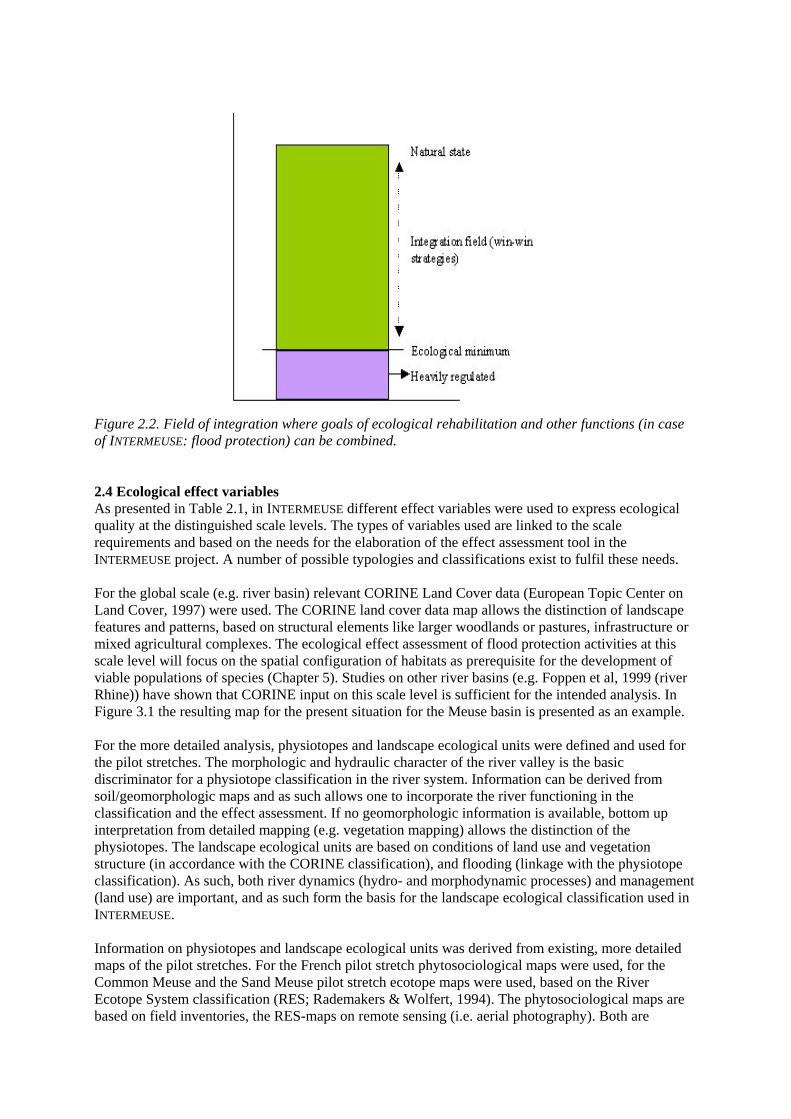
Figure 2.2. Field of integration where goals of ecological rehabilitation and other functions (in case of INTERMEUSE: flood protection) can be combined. 2.4 Ecological effect variables As presented in Table 2.1, in INTERMEUSE different effect variables were used to express ecological quality at the distinguished scale levels. The types of variables used are linked to the scale requirements and based on the needs for the elaboration of the effect assessment tool in the INTERMEUSE project. A number of possible typologies and classifications exist to fulfil these needs. For the global scale (e.g. river basin) relevant CORINE Land Cover data (European Topic Center on Land Cover, 1997) were used. The CORINE land cover data map allows the distinction of landscape features and patterns, based on structural elements like larger woodlands or pastures, infrastructure or mixed agricultural complexes. The ecological effect assessment of flood protection activities at this scale level will focus on the spatial configuration of habitats as prerequisite for the development of viable populations of species (Chapter 5). Studies on other river basins (e.g. Foppen et al, 1999 (river Rhine)) have shown that CORINE input on this scale level is sufficient for the intended analysis. In Figure 3.1 the resulting map for the present situation for the Meuse basin is presented as an example. For the more detailed analysis, physiotopes and landscape ecological units were defined and used for the pilot stretches. The morphologic and hydraulic character of the river valley is the basic discriminator for a physiotope classification in the river system. Information can be derived from soil/geomorphologic maps and as such allows one to incorporate the river functioning in the classification and the effect assessment. If no geomorphologic information is available, bottom up interpretation from detailed mapping (e.g. vegetation mapping) allows the distinction of the physiotopes. The landscape ecological units are based on conditions of land use and vegetation structure (in accordance with the CORINE classification), and flooding (linkage with the physiotope classification). As such, both river dynamics (hydro- and morphodynamic processes) and management (land use) are important, and as such form the basis for the landscape ecological classification used in INTERMEUSE. Information on physiotopes and landscape ecological units was derived from existing, more detailed maps of the pilot stretches. For the French pilot stretch phytosociological maps were used, for the Common Meuse and the Sand Meuse pilot stretch ecotope maps were used, based on the River Ecotope System classification (RES; Rademakers & Wolfert, 1994). The phytosociological maps are based on field inventories, the RES-maps on remote sensing (i.e. aerial photography). Both are

combined in a GIS with relevant information on amongst others hydrodynamics (i.e. flood duration) and land use management. The synthetic table of the different typologies used within INTERMEUSE is presented in Table 2.3 and gives information of the hierarchic structure of the typologies used and the content of the units. More information is listed in Annex 2. The typologies have strong links to river dynamic processes and land use management and as such are very suitable for the integration and effect assessment as intended within the frame of INTERMEUSE. Furthermore, the used typologies were synchronised with existing typologies used by partners within the International Rhine Commission (ICPR), the CORINE land cover project, the Habitat Directive typology and other IRMA-SPONGE projects (i.e. BIOSAFE (Nooij et al, 2001)). Table 2.3. Synthetic table of the spatial typologies used within INTERMEUSE. CORINE land cover Physiotope Landscape Ecological Unit water bodies stream course, deep bed deep river bed Sd1 deep river bed shallow river bed shallow river bed Ss1 shallow stream part side channel Ss2 connected side channel floodplain water/ flood channel Sf1 flood channel old river arm oxbow lake Sf2 shallow floodplain water lake/gravel pit Sf3 deep water marshes / peat bogs lower plain/old river arm marsh Mf1 marshland transitional woodland-scrub floodplain fringe dynamic fringe Tf1 softwood fringe levee fringe higher fringe Tl1 hardwood fringe forest floodplain forest dynamic forest Wf1 softwood forest (mixed and broadleaf) poplar plantation Wf2 poplar plant levee forest higher forest Wl1 hardwood forest coniferous forest coniferous forest coniferous forest Cl1 conifer plant pasture floodplain meadow wet meadow Pf1 wet hayfield Pf2 moist hayfield Pf3 moist pasture levee meadow dry meadow Pl1 dry hayfield Pl2 dry pasture Pl3 production grassland arable land open levee/cultures arable land Al1 arable land natural grassland floodplain mosaics natural grassland Nf1 wet grassland Nf2 moist grassland ruderals-border Nf4 wet border levee mosaics natural grassland Nl3 dry grassland ruderals-border Nl5 dry border moors, heath land higher moor/heath land moor Ml1 moor heath land Ml2 heath land beaches, sand, dunes gravel bar pioneer vegetation Bf1 gravel bar sand bar Bf2 sandy bank lee bar Bf3 silt bank eroding bank/groin Bf4 steep bank/groin dune/gravel deposit Bl5 sand bar/dune urban areas infrastructure Ul1 urbanised area legend: S: water body; M: marshland; T: transitional woodland; W: woodland; C: coniferous forest; P: pasture; N: natural grassland; A: arable land; B: bar, beach; U: urbanised, infrastructure; D: deep river part; S: shallow river part; f: floodplain part; l: levee.
3. Description of study area As stated the river Meuse was used to elaborate and illustrate the proposed evaluation method developed within the project INTERMEUSE. The analysis was performed on two scale levels: in a global way for the whole Meuse basin, in more detail for a selection of pilot stretches along the Meuse (see also Figure 3.1.): • The section Mouzay – Luzy in the Lorraine Meuse; • The Common Meuse; • The section Sambeek – Cuijk in the Sand Meuse. In this chapter a description of these study areas is presented. 3.1 The Meuse basin The Meuse originates in France about two hundred kilometres northeast of Dijon and is approximately 935 km long from the source in France to the Hollandsch Diep, part of the former Rhine-Meuse estuary, in the Netherlands. It raises some 409 metres above Dutch Ordinance Datum (m + NAP). The catchment area of the Meuse is about 36.000 km2 (Figure 3.1).
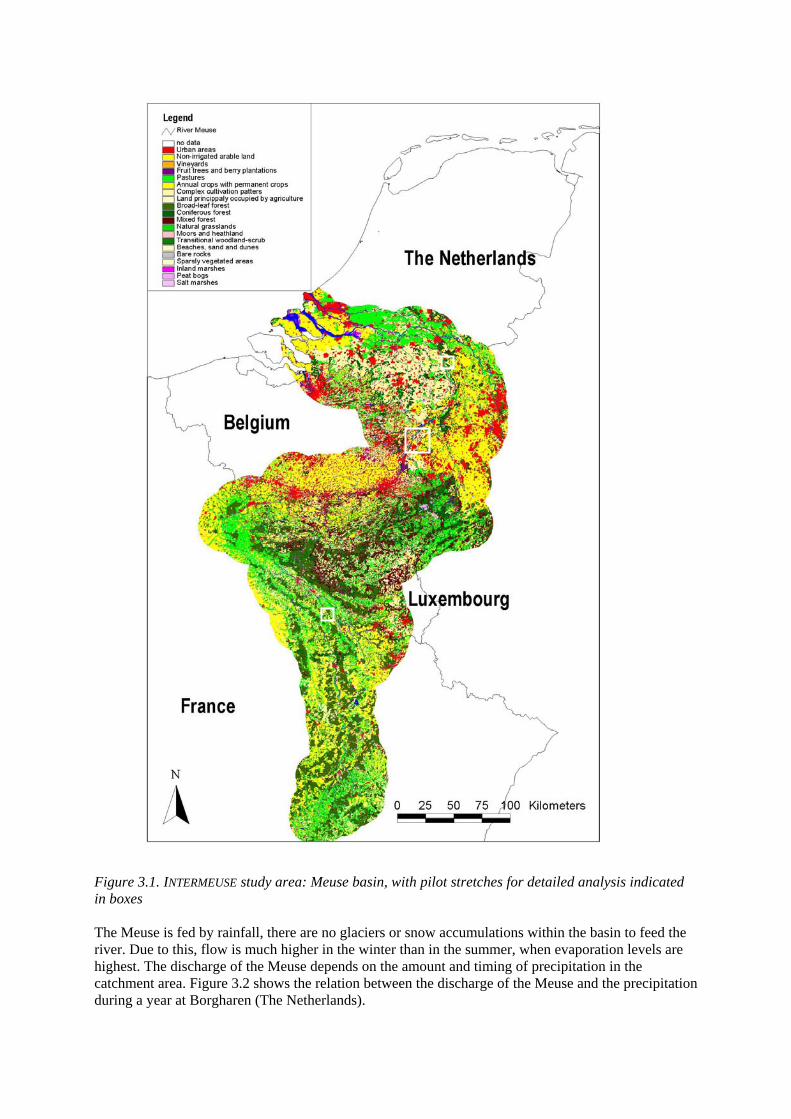
Figure 3.1. INTERMEUSE study area: Meuse basin, with pilot stretches for detailed analysis indicated in boxes The Meuse is fed by rainfall, there are no glaciers or snow accumulations within the basin to feed the river. Due to this, flow is much higher in the winter than in the summer, when evaporation levels are highest. The discharge of the Meuse depends on the amount and timing of precipitation in the catchment area. Figure 3.2 shows the relation between the discharge of the Meuse and the precipitation during a year at Borgharen (The Netherlands).
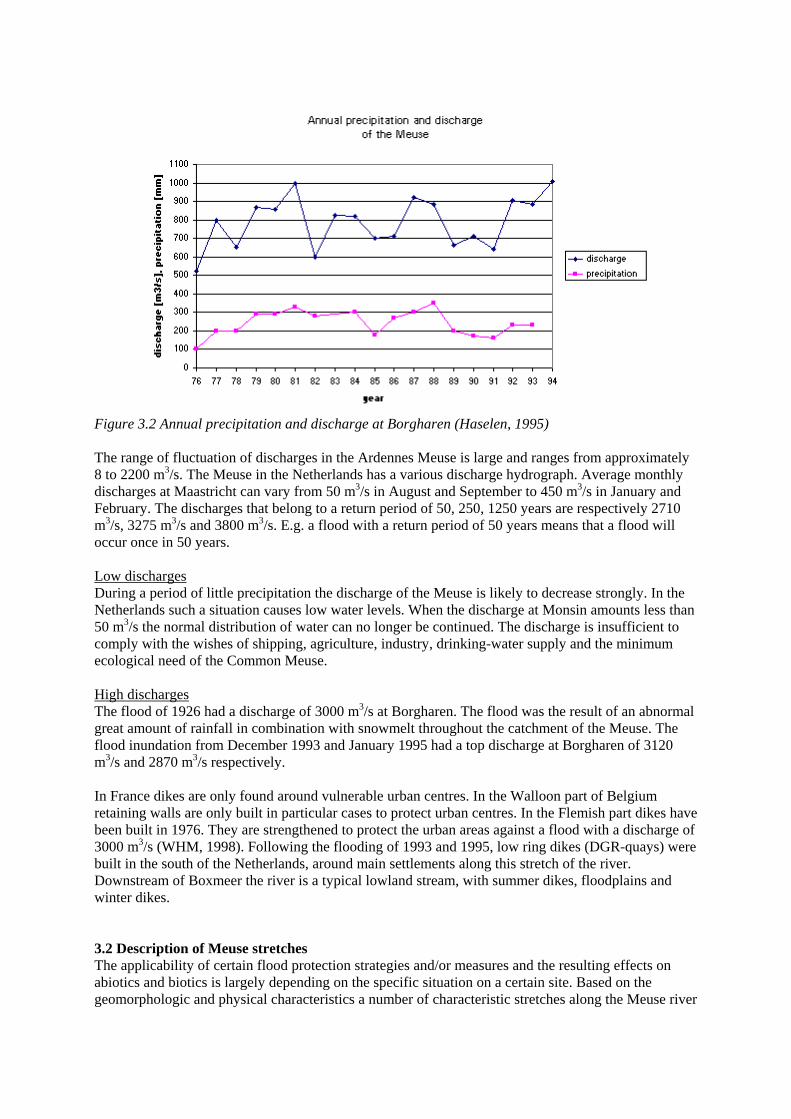
Figure 3.2 Annual precipitation and discharge at Borgharen (Haselen, 1995) The range of fluctuation of discharges in the Ardennes Meuse is large and ranges from approximately 8 to 2200 m3/s. The Meuse in the Netherlands has a various discharge hydrograph. Average monthly discharges at Maastricht can vary from 50 m3/s in August and September to 450 m3/s in January and February. The discharges that belong to a return period of 50, 250, 1250 years are respectively 2710 m3/s, 3275 m3/s and 3800 m3/s. E.g. a flood with a return period of 50 years means that a flood will occur once in 50 years. Low discharges During a period of little precipitation the discharge of the Meuse is likely to decrease strongly. In the Netherlands such a situation causes low water levels. When the discharge at Monsin amounts less than 50 m3/s the normal distribution of water can no longer be continued. The discharge is insufficient to comply with the wishes of shipping, agriculture, industry, drinking-water supply and the minimum ecological need of the Common Meuse. High discharges The flood of 1926 had a discharge of 3000 m3/s at Borgharen. The flood was the result of an abnormal great amount of rainfall in combination with snowmelt throughout the catchment of the Meuse. The flood inundation from December 1993 and January 1995 had a top discharge at Borgharen of 3120 m3/s and 2870 m3/s respectively. In France dikes are only found around vulnerable urban centres. In the Walloon part of Belgium retaining walls are only built in particular cases to protect urban centres. In the Flemish part dikes have been built in 1976. They are strengthened to protect the urban areas against a flood with a discharge of 3000 m3/s (WHM, 1998). Following the flooding of 1993 and 1995, low ring dikes (DGR-quays) were built in the south of the Netherlands, around main settlements along this stretch of the river. Downstream of Boxmeer the river is a typical lowland stream, with summer dikes, floodplains and winter dikes. 3.2 Description of Meuse stretches The applicability of certain flood protection strategies and/or measures and the resulting effects on abiotics and biotics is largely depending on the specific situation on a certain site. Based on the geomorphologic and physical characteristics a number of characteristic stretches along the Meuse river
can be distinguished (Pedroli & De Leeuw, 1997). These will be presented shortly in the following in downstream order (see also Figure 3.1). This information is also summarised in Table 3.1. 3.2.1 Lorraine Meuse The first section is the Upper reach in France (Lorraine Meuse), from the source at Pouilly-en-Bassigny to the mouth of the Chiers, one of the main tributaries. Near the source the gradient is steep but soon flattens. The basin is rather narrow compared to the wide river valley. The basin lies in an area of calcareous and permeable soils. Due to the high permeability of the limy soil, rainwater infiltrates easily into the ground. The river flows through a bed of gravel. The flow capacity in this part is minor. Between Troussey and Sedan the Meuse has the characteristic course of the Lorraine Meuse: a wide and even valley in which the canal and the Meuse are situated parallel. Regularly the canal joins the river so that the canal can be fed. Downstream of the places where the canal and the river split there are weirs in the Meuse. The discharge capacity of the minor bed is so small that with great discharges the whole valley, which can be several kilometres wide, is inundated. The water stored in that way hardly flows. The flood wave celerity is limited to 20 km a day (Berger, 1992). Off Troussey the Canal du Marne au Rhine crosses the Meuse basin and the northern branch of the Canal de l’Est forks off from the former canal. Canalisation has rendered part of the French Meuse navigable. In the upper course there are some weirs, some of which are adjustable. The average precipitation is about 800 to 900 mm a year (Pedroli & De Leeuw, 1997). The Lorraine Meuse is characterised by meadows in the wide valleys of the central and northern part of this section, the hill slopes are under broadleaf woodlands, arable lands occupy the loamy terraces and pastures are the dominant agricultural use in the upper part of the basin on the Plateau de Langres. The Lorraine Meuse is generally in a good ecological state, due to the presence of rather natural aquatic systems and floodplain meadows. Some calcareous fens, marshes and floodplain meadows have been preserved. Some rare bird species (e.g. Crex crex, Numerius arquata) and flora (Gratiola officinalis, Inula britannica, Teucrium scordium, Mentha pulegium, Triglochin palustre, Ranunculus lingua) can be found in this area. In the stretch of the Lorraine Meuse, the hydrologic gradient (river flooding and depth of the groundwater) and applied agriculture techniques, such as manure, grazing and timing of haying, influence the availability of these floodplain ecosystems (Grevilliot & Muller, 1997). The higher parts of the alluvial valley are characterised by the vegetation type Colchico-Festucetum pratensis. The parts that are regularly flooded take a large part of the alluvial plain and are occupied by the Senecioni-Oenanthetum mediae. The frequently and longer flooded parts of the valley are covered with the Gratiolo-Oenanthetum fistulosae. The marsh and wetland parts consist more of tall grasses and mostly of helophytes (Oenantho-Rorippetum amphibiae). The population density in this part of the Meuse basin is low. Important urban centres are Verdun, Sedan and Charleville-Mézières. Industrial activities are mostly in metallurgic industry, paper/cardboard and foodstuffs. Mining hardly takes place anymore. Land use in the wider catchment area is predominantly agriculture and forestry (Pedroli & De Leeuw, 1997). The Chiers is one of the large tributaries of the Meuse and has a length of approximately 144 km. The contributing area amounts to 2222 km2. The valley in the downstream part of the Chiers is very permeable due to calcareous soil. Close to its mouth there is an alluvial stratum. The southern part of the area contains many impermeable clay soils and loamy soils. In the north and the east much sandstone and limestone is found In this river stretch one of the pilot stretches for the detailed analyses was situated: the section between Mouzay and Luzy.
3.2.2 Ardennes Meuse The stretch from Sedan till Eijsden is called the Ardennes Meuse. In this stretch of the Meuse basin, the terrain is hilly and widens compared to the narrow basin in the Lorraine Meuse. There are steep side slopes and the rocky ground is impervious. As a result rainwater drains quickly from the surrounding countryside into the river. This in turn means that, if it rains heavily in the Ardennes, the Meuse in the Province of Limburg will be running high within twenty four hours. Furthermore, because the Meuse basin is relatively small, it is not uncommon to have heavy precipitation across the entire area. The annual precipitation is approximately 1000 mm. Compared to other sections of the basin this is the highest average. The river is completely regulated in this section. Ten weirs control the water level in the Ardennes Meuse. Short-cut canals often accompany the river bends. Within the river there are several small islands. The main tributaries of the Ardennes Meuse are Semois, Viroin, Lesse, Sambre and Ourthe. Many of these tributaries have reservoirs for various purposes: power generation, drinking water supply, flood protection, low flow provision and tourism. Due to canalisation the entire length of the Belgian Meuse is navigable (Pedroli & De Leeuw, 1997). The Ardennes Meuse has a narrow valley with a predominant presence of urbanised areas. The urbanised region of Wallonie falls together with the Samber-Meuse river axes. The tributaries and catchment area are dominated and bordered by large woodland complexes (partly mixed, coniferous and broadleaf) of the Ardennes, mixed agricultural use in the Famenne, intensive crops in the Condroz and the natural area of moors and woodland in the “Hautes Fagnes”. In the stretch of the Ardennes Meuse little floodplain area is available, few natural riverbanks and islands have persisted. Islands disappear more and more, and because of various modernisation measures they do not offer proper habitat conditions. In the upper part there are several islands with more or less natural banks, in the lower section only a few islands remained. Potentially islands offer a good habitat for a variety of ecosystems. Marsh type vegetation, characterised by sedge and reed, is only present at Hastière/Agimont, Hastière and Waulsort. 18 to 25 km of the riverbanks are fit as fish spawning area of which important stretches are located near Hastière/Agimont, Waulsort and Tailfer. The old branches offer good conditions for aquatic vegetation and fauna. They are important spawning areas. In the alluvial plains there is limited forest available (willow, alder, ash, elm). Some natural grassland types still exist, though they are threatened by the modern way of early haying. The meadows offer less opportunity for natural vegetation because of manure. Agricultural use of the catchment of the Ardennes Meuse is of minor importance; most of the drainage basin is forest. Forestry has lead to the cultivation of especially pine-forest. The population density is low in the southern part of this section and high in the northern part. Important urban centres are Charleroi, Namur, Liège and Visé (Pedroli & De Leeuw, 1997). The Semois springs near Arlon and has a length of 167 km. Its catchment amounts 1357 km2. The stratum has a varying permeability. Approximately 40% of the area is covered with forest. From the relations between the discharges of the Meuse at Borgharen and the Semois at Membre it appears that the Semois can supply a considerable contribution to a flood wave. The catchment area of the Viroin, confluence of the Eau Noire and Eau Blanche, is about 595 km2. The Eau Noire and the Viroin are together 57 km long. In periods of much precipitation the discharge may rise very strongly. The north of the catchment contains rocks and limestone. The southern part forms part of the Rocroi rock, with hard and impermeable Cambrian rock. The mean annual precipitation for the basin is 940 mm. The area is for 43% covered with forest. The 83 km long Lesse has a catchment area of 1314 km2 above the measuring station Gendron. In the catchment calcareous soil is found. The annual precipitation in the catchment area is 970 mm. Approximately 40% of the catchment is covered with forest. The length of the river Sambre amounts approximately 185 km. The catchment is 2863 km2 in size. The Sambre is special in being the only river that admits shipping over a greater length.
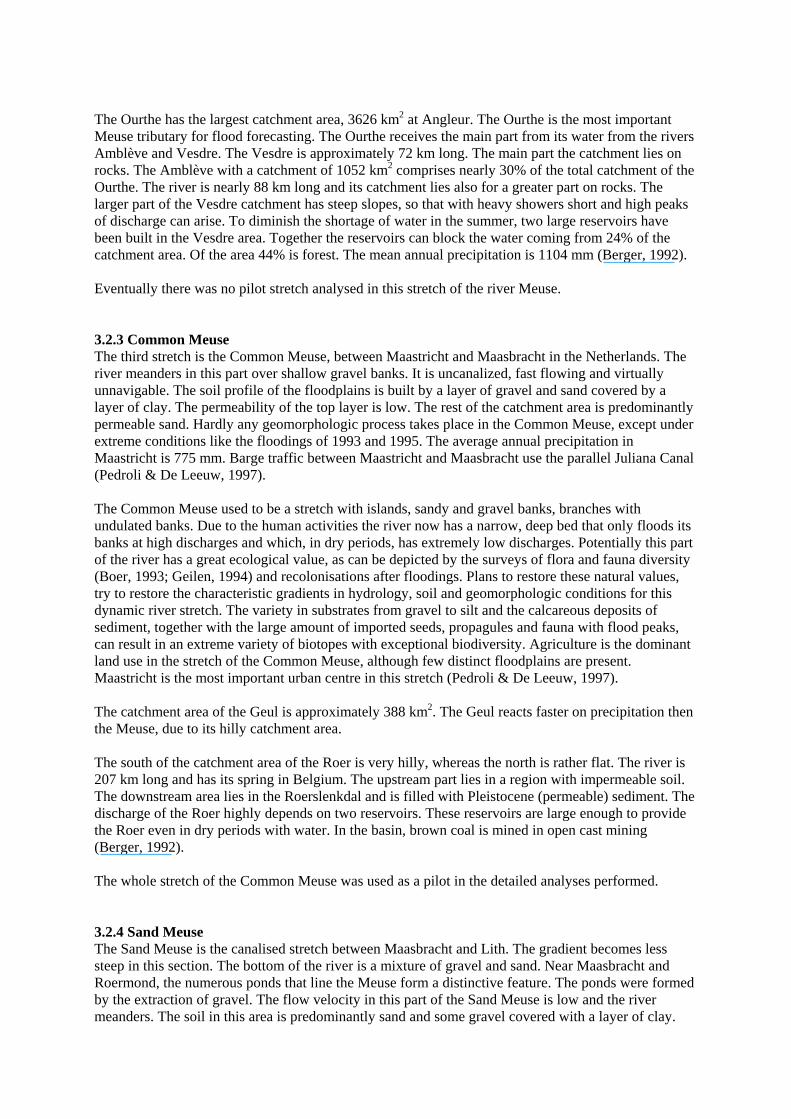
The Ourthe has the largest catchment area, 3626 km2 at Angleur. The Ourthe is the most important Meuse tributary for flood forecasting. The Ourthe receives the main part from its water from the rivers Amblève and Vesdre. The Vesdre is approximately 72 km long. The main part the catchment lies on rocks. The Amblève with a catchment of 1052 km2 comprises nearly 30% of the total catchment of the Ourthe. The river is nearly 88 km long and its catchment lies also for a greater part on rocks. The larger part of the Vesdre catchment has steep slopes, so that with heavy showers short and high peaks of discharge can arise. To diminish the shortage of water in the summer, two large reservoirs have been built in the Vesdre area. Together the reservoirs can block the water coming from 24% of the catchment area. Of the area 44% is forest. The mean annual precipitation is 1104 mm (Berger, 1992). Eventually there was no pilot stretch analysed in this stretch of the river Meuse. 3.2.3 Common Meuse The third stretch is the Common Meuse, between Maastricht and Maasbracht in the Netherlands. The river meanders in this part over shallow gravel banks. It is uncanalized, fast flowing and virtually unnavigable. The soil profile of the floodplains is built by a layer of gravel and sand covered by a layer of clay. The permeability of the top layer is low. The rest of the catchment area is predominantly permeable sand. Hardly any geomorphologic process takes place in the Common Meuse, except under extreme conditions like the floodings of 1993 and 1995. The average annual precipitation in Maastricht is 775 mm. Barge traffic between Maastricht and Maasbracht use the parallel Juliana Canal (Pedroli & De Leeuw, 1997). The Common Meuse used to be a stretch with islands, sandy and gravel banks, branches with undulated banks. Due to the human activities the river now has a narrow, deep bed that only floods its banks at high discharges and which, in dry periods, has extremely low discharges. Potentially this part of the river has a great ecological value, as can be depicted by the surveys of flora and fauna diversity (Boer, 1993; Geilen, 1994) and recolonisations after floodings. Plans to restore these natural values, try to restore the characteristic gradients in hydrology, soil and geomorphologic conditions for this dynamic river stretch. The variety in substrates from gravel to silt and the calcareous deposits of sediment, together with the large amount of imported seeds, propagules and fauna with flood peaks, can result in an extreme variety of biotopes with exceptional biodiversity. Agriculture is the dominant land use in the stretch of the Common Meuse, although few distinct floodplains are present. Maastricht is the most important urban centre in this stretch (Pedroli & De Leeuw, 1997). The catchment area of the Geul is approximately 388 km2. The Geul reacts faster on precipitation then the Meuse, due to its hilly catchment area. The south of the catchment area of the Roer is very hilly, whereas the north is rather flat. The river is 207 km long and has its spring in Belgium. The upstream part lies in a region with impermeable soil. The downstream area lies in the Roerslenkdal and is filled with Pleistocene (permeable) sediment. The discharge of the Roer highly depends on two reservoirs. These reservoirs are large enough to provide the Roer even in dry periods with water. In the basin, brown coal is mined in open cast mining (Berger, 1992). The whole stretch of the Common Meuse was used as a pilot in the detailed analyses performed. 3.2.4 Sand Meuse The Sand Meuse is the canalised stretch between Maasbracht and Lith. The gradient becomes less steep in this section. The bottom of the river is a mixture of gravel and sand. Near Maasbracht and Roermond, the numerous ponds that line the Meuse form a distinctive feature. The ponds were formed by the extraction of gravel. The flow velocity in this part of the Sand Meuse is low and the river meanders. The soil in this area is predominantly sand and some gravel covered with a layer of clay.
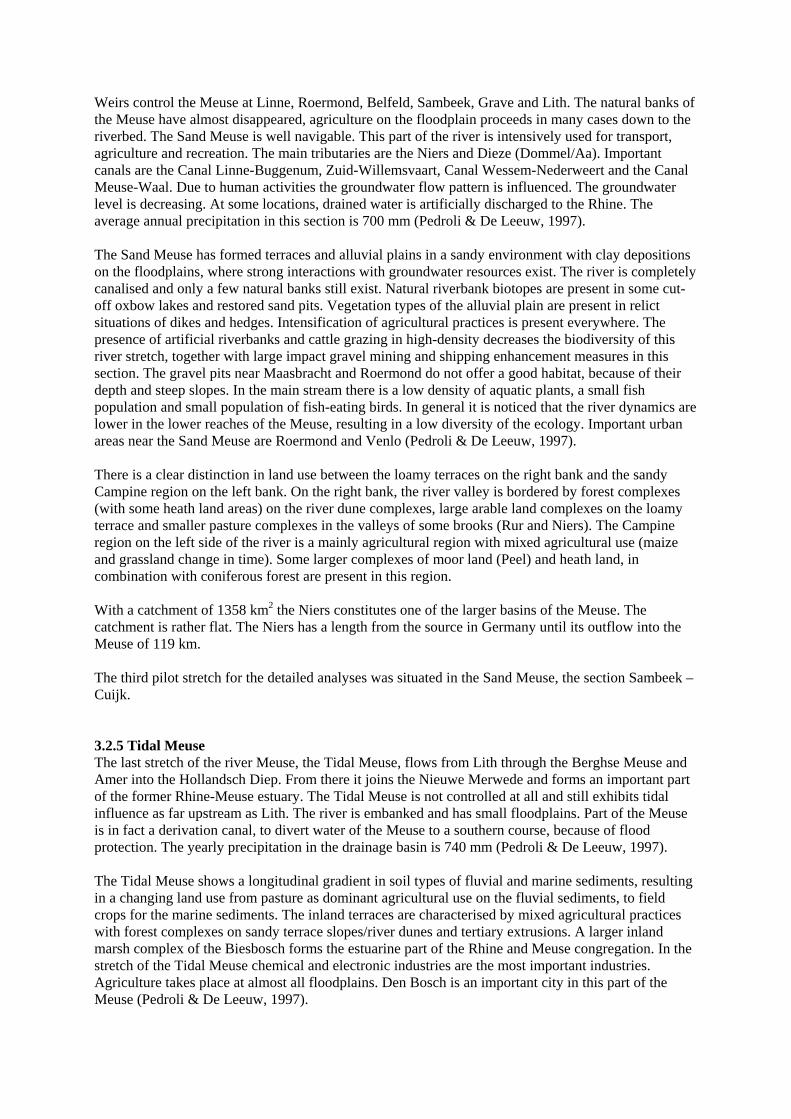
Weirs control the Meuse at Linne, Roermond, Belfeld, Sambeek, Grave and Lith. The natural banks of the Meuse have almost disappeared, agriculture on the floodplain proceeds in many cases down to the riverbed. The Sand Meuse is well navigable. This part of the river is intensively used for transport, agriculture and recreation. The main tributaries are the Niers and Dieze (Dommel/Aa). Important canals are the Canal Linne-Buggenum, Zuid-Willemsvaart, Canal Wessem-Nederweert and the Canal Meuse-Waal. Due to human activities the groundwater flow pattern is influenced. The groundwater level is decreasing. At some locations, drained water is artificially discharged to the Rhine. The average annual precipitation in this section is 700 mm (Pedroli & De Leeuw, 1997). The Sand Meuse has formed terraces and alluvial plains in a sandy environment with clay depositions on the floodplains, where strong interactions with groundwater resources exist. The river is completely canalised and only a few natural banks still exist. Natural riverbank biotopes are present in some cut-off oxbow lakes and restored sand pits. Vegetation types of the alluvial plain are present in relict situations of dikes and hedges. Intensification of agricultural practices is present everywhere. The presence of artificial riverbanks and cattle grazing in high-density decreases the biodiversity of this river stretch, together with large impact gravel mining and shipping enhancement measures in this section. The gravel pits near Maasbracht and Roermond do not offer a good habitat, because of their depth and steep slopes. In the main stream there is a low density of aquatic plants, a small fish population and small population of fish-eating birds. In general it is noticed that the river dynamics are lower in the lower reaches of the Meuse, resulting in a low diversity of the ecology. Important urban areas near the Sand Meuse are Roermond and Venlo (Pedroli & De Leeuw, 1997). There is a clear distinction in land use between the loamy terraces on the right bank and the sandy Campine region on the left bank. On the right bank, the river valley is bordered by forest complexes (with some heath land areas) on the river dune complexes, large arable land complexes on the loamy terrace and smaller pasture complexes in the valleys of some brooks (Rur and Niers). The Campine region on the left side of the river is a mainly agricultural region with mixed agricultural use (maize and grassland change in time). Some larger complexes of moor land (Peel) and heath land, in combination with coniferous forest are present in this region. With a catchment of 1358 km2 the Niers constitutes one of the larger basins of the Meuse. The catchment is rather flat. The Niers has a length from the source in Germany until its outflow into the Meuse of 119 km. The third pilot stretch for the detailed analyses was situated in the Sand Meuse, the section Sambeek – Cuijk. 3.2.5 Tidal Meuse The last stretch of the river Meuse, the Tidal Meuse, flows from Lith through the Berghse Meuse and Amer into the Hollandsch Diep. From there it joins the Nieuwe Merwede and forms an important part of the former Rhine-Meuse estuary. The Tidal Meuse is not controlled at all and still exhibits tidal influence as far upstream as Lith. The river is embanked and has small floodplains. Part of the Meuse is in fact a derivation canal, to divert water of the Meuse to a southern course, because of flood protection. The yearly precipitation in the drainage basin is 740 mm (Pedroli & De Leeuw, 1997). The Tidal Meuse shows a longitudinal gradient in soil types of fluvial and marine sediments, resulting in a changing land use from pasture as dominant agricultural use on the fluvial sediments, to field crops for the marine sediments. The inland terraces are characterised by mixed agricultural practices with forest complexes on sandy terrace slopes/river dunes and tertiary extrusions. A larger inland marsh complex of the Biesbosch forms the estuarine part of the Rhine and Meuse congregation. In the stretch of the Tidal Meuse chemical and electronic industries are the most important industries. Agriculture takes place at almost all floodplains. Den Bosch is an important city in this part of the Meuse (Pedroli & De Leeuw, 1997).

Despite the estuarine character of the Tidal Meuse, salt water is no longer entering the river itself, due to the Delta Works (Haringvliet sluices). The prevailing biotopes are fresh-water types. The main channel of the river is fixed; the flood area is also fixed by dikes. Some old river branches (Sint-Andries –Afgedamde Maas) and lower floodplain areas (Voorne, Alem) can be distinguished. In general, the present floodplain is mostly in practice as grazing land. More or less natural conditions are present over larger areas in the Biesbosch and the Haringvliet, and will be enhanced by restoration projects (e.g. Fort Sint-Andries). Two rivers, the Aa and the Dommel, which form the Dieze, discharge into the Tidal Meuse. The catchment area of the Aa is 721 km2 and of the Dommel 1742 km2 (the Belgian part included). The Dieze itself has only a length of a few kilometres.
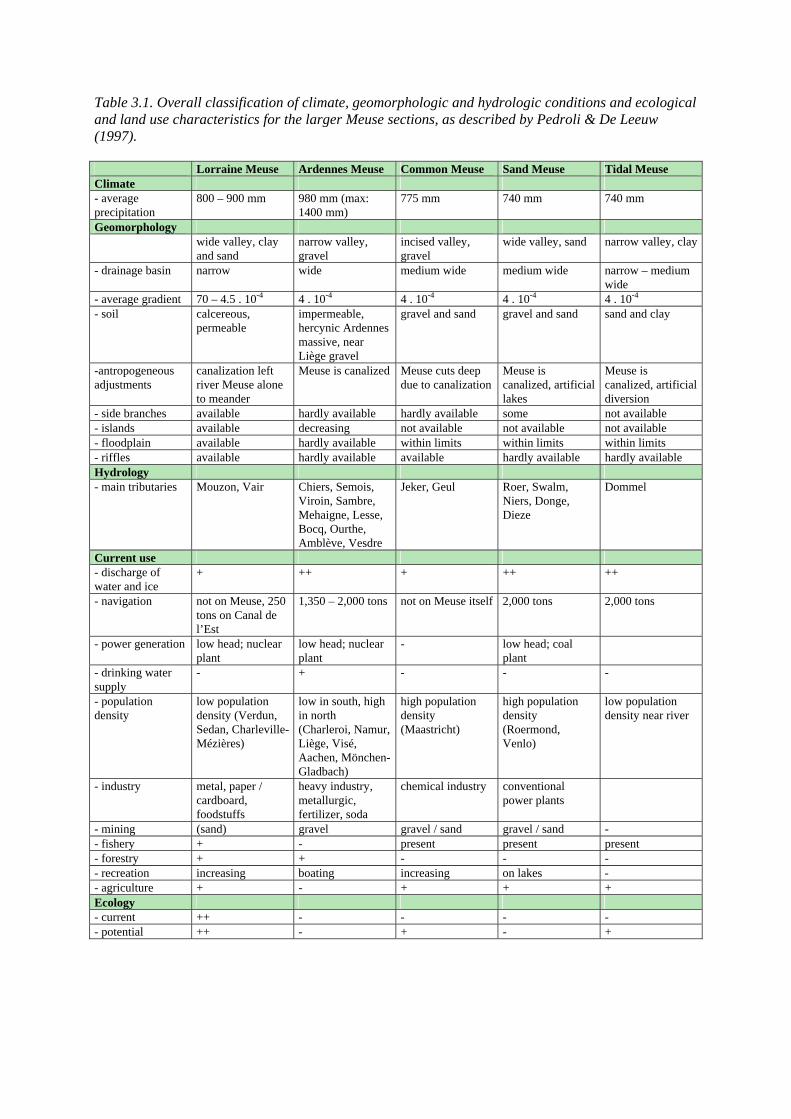
Table 3.1. Overall classification of climate, geomorphologic and hydrologic conditions and ecological and land use characteristics for the larger Meuse sections, as described by Pedroli & De Leeuw (1997). Lorraine Meuse Ardennes Meuse Common Meuse Sand Meuse Tidal Meuse Climate - average precipitation
800 – 900 mm 980 mm (max: 1400 mm)
775 mm 740 mm 740 mm
Geomorphology wide valley, clay
and sand narrow valley, gravel
incised valley, gravel
wide valley, sand narrow valley, clay
- drainage basin narrow wide medium wide medium wide narrow – medium wide
- average gradient 70 – 4.5 . 10-4 4 . 10-4 4 . 10-4 4 . 10-4 4 . 10-4
- soil calcereous, permeable
impermeable, hercynic Ardennes massive, near Liège gravel
gravel and sand gravel and sand sand and clay
-antropogeneous adjustments
canalization left river Meuse alone to meander
Meuse is canalized Meuse cuts deep due to canalization
Meuse is canalized, artificial lakes
Meuse is canalized, artificial diversion
- side branches available hardly available hardly available some not available - islands available decreasing not available not available not available - floodplain available hardly available within limits within limits within limits - riffles available hardly available available hardly available hardly available Hydrology - main tributaries Mouzon, Vair Chiers, Semois,
Viroin, Sambre, Mehaigne, Lesse, Bocq, Ourthe, Amblève, Vesdre
Jeker, Geul Roer, Swalm, Niers, Donge, Dieze
Dommel
Current use - discharge of water and ice
+ ++ + ++ ++
- navigation not on Meuse, 250 tons on Canal de l’Est
1,350 – 2,000 tons not on Meuse itself 2,000 tons 2,000 tons
- power generation low head; nuclear plant
low head; nuclear plant
- low head; coal plant
- drinking water supply
- + - - -
- population density
low population density (Verdun, Sedan, Charleville-Mézières)
low in south, high in north (Charleroi, Namur, Liège, Visé, Aachen, Mönchen-Gladbach)
high population density (Maastricht)
high population density (Roermond, Venlo)
low population density near river
- industry metal, paper / cardboard, foodstuffs
heavy industry, metallurgic, fertilizer, soda
chemical industry conventional power plants
- mining (sand) gravel gravel / sand gravel / sand - - fishery + - present present present - forestry + + - - - - recreation increasing boating increasing on lakes - - agriculture + - + + + Ecology - current ++ - - - - - potential ++ - + - +
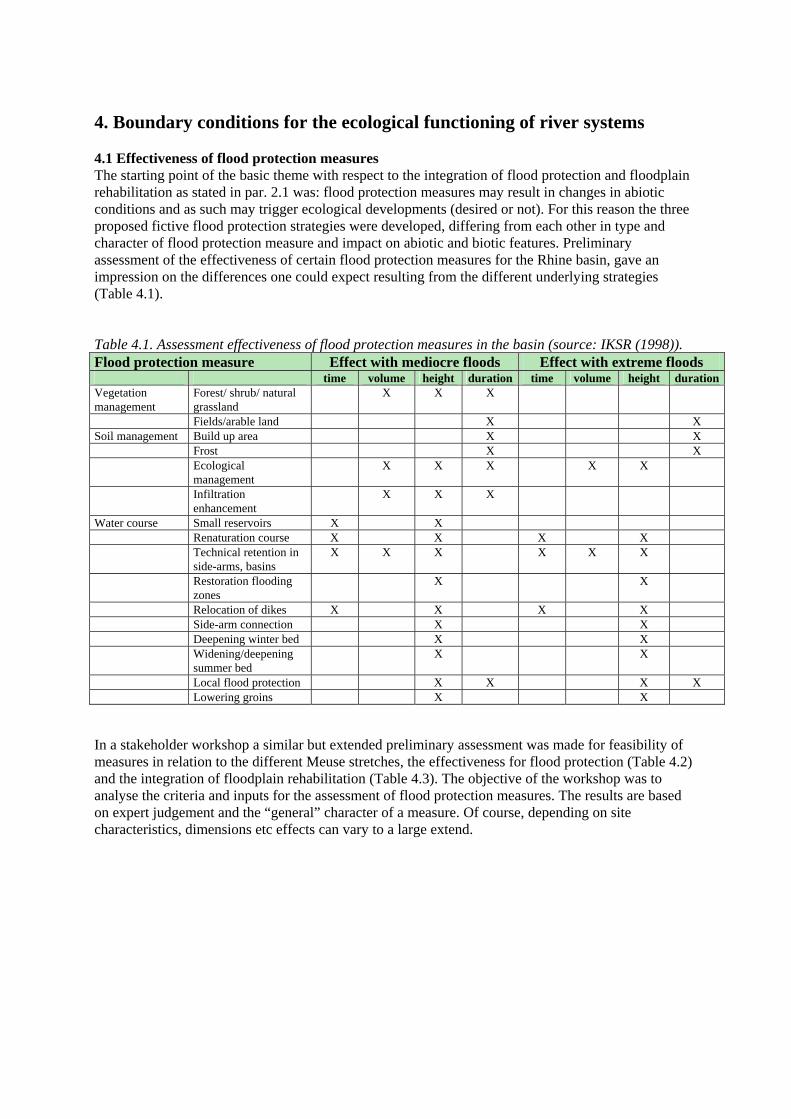
4. Boundary conditions for the ecological functioning of river systems 4.1 Effectiveness of flood protection measures The starting point of the basic theme with respect to the integration of flood protection and floodplain rehabilitation as stated in par. 2.1 was: flood protection measures may result in changes in abiotic conditions and as such may trigger ecological developments (desired or not). For this reason the three proposed fictive flood protection strategies were developed, differing from each other in type and character of flood protection measure and impact on abiotic and biotic features. Preliminary assessment of the effectiveness of certain flood protection measures for the Rhine basin, gave an impression on the differences one could expect resulting from the different underlying strategies (Table 4.1). Table 4.1. Assessment effectiveness of flood protection measures in the basin (source: IKSR (1998)). Flood protection measure Effect with mediocre floods Effect with extreme floods time volume height duration time volume height durationVegetation management
Forest/ shrub/ natural grassland
X X X
Fields/arable land X X Soil management Build up area X X Frost X X Ecological
management X X X X X
Infiltration enhancement
X X X
Water course Small reservoirs X X Renaturation course X X X X Technical retention in
side-arms, basins X X X X X X
Restoration flooding zones
X X
Relocation of dikes X X X X Side-arm connection X X Deepening winter bed X X Widening/deepening
summer bed X X
Local flood protection X X X X Lowering groins X X In a stakeholder workshop a similar but extended preliminary assessment was made for feasibility of measures in relation to the different Meuse stretches, the effectiveness for flood protection (Table 4.2) and the integration of floodplain rehabilitation (Table 4.3). The objective of the workshop was to analyse the criteria and inputs for the assessment of flood protection measures. The results are based on expert judgement and the “general” character of a measure. Of course, depending on site characteristics, dimensions etc effects can vary to a large extend.
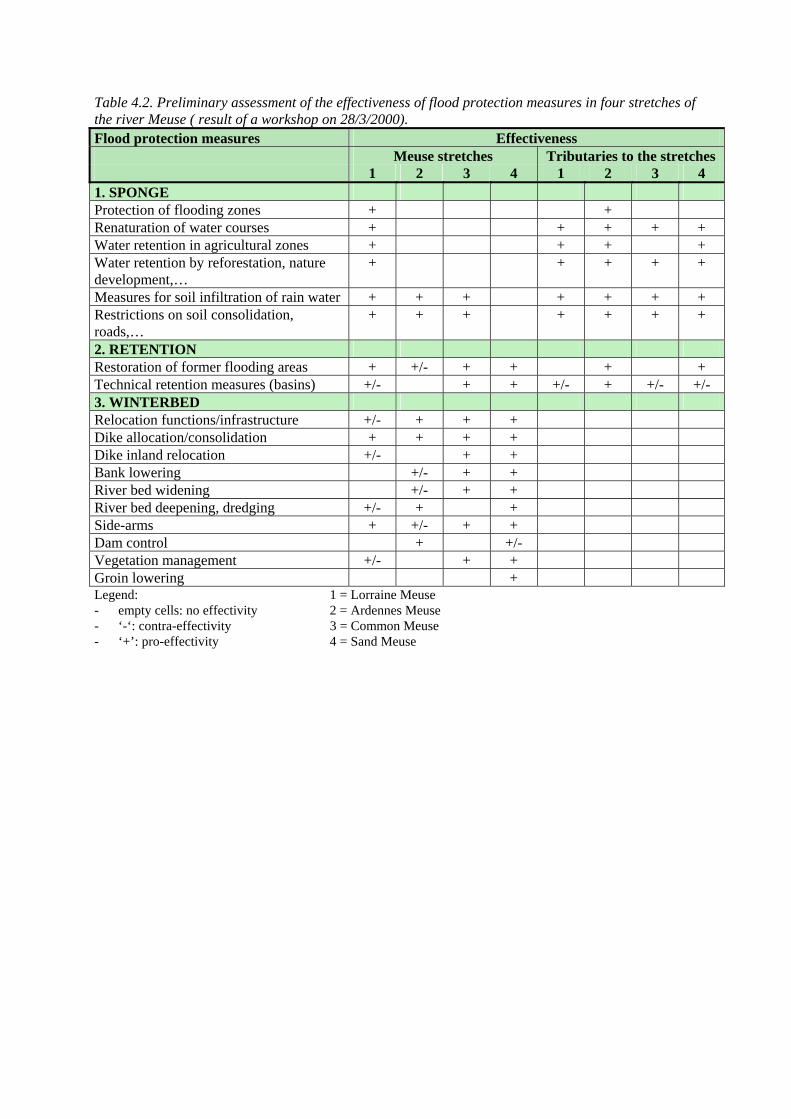
Table 4.2. Preliminary assessment of the effectiveness of flood protection measures in four stretches of the river Meuse ( result of a workshop on 28/3/2000). Flood protection measures Effectiveness Meuse stretches Tributaries to the stretches 1 2 3 4 1 2 3 4 1. SPONGE Protection of flooding zones + + Renaturation of water courses + + + + + Water retention in agricultural zones + + + + Water retention by reforestation, nature development,…
+ + + + +
Measures for soil infiltration of rain water + + + + + + + Restrictions on soil consolidation, roads,…
+ + + + + + +
2. RETENTION Restoration of former flooding areas + +/- + + + + Technical retention measures (basins) +/- + + +/- + +/- +/- 3. WINTERBED Relocation functions/infrastructure +/- + + + Dike allocation/consolidation + + + + Dike inland relocation +/- + + Bank lowering +/- + + River bed widening +/- + + River bed deepening, dredging +/- + + Side-arms + +/- + + Dam control + +/- Vegetation management +/- + + Groin lowering + Legend: 1 = Lorraine Meuse - empty cells: no effectivity 2 = Ardennes Meuse - ‘-‘: contra-effectivity 3 = Common Meuse - ‘+’: pro-effectivity 4 = Sand Meuse
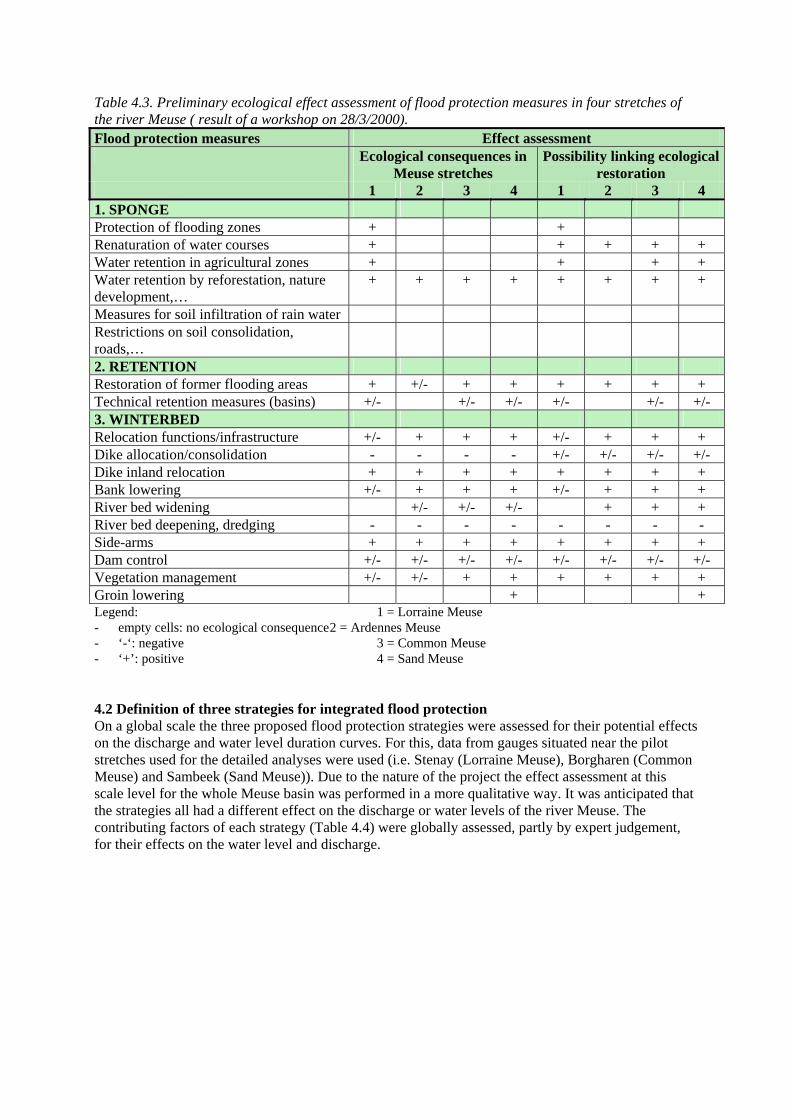
Table 4.3. Preliminary ecological effect assessment of flood protection measures in four stretches of the river Meuse ( result of a workshop on 28/3/2000). Flood protection measures Effect assessment Ecological consequences in
Meuse stretches Possibility linking ecological
restoration 1 2 3 4 1 2 3 4 1. SPONGE Protection of flooding zones + + Renaturation of water courses + + + + + Water retention in agricultural zones + + + + Water retention by reforestation, nature development,…
+ + + + + + + +
Measures for soil infiltration of rain water Restrictions on soil consolidation, roads,…
2. RETENTION Restoration of former flooding areas + +/- + + + + + + Technical retention measures (basins) +/- +/- +/- +/- +/- +/- 3. WINTERBED Relocation functions/infrastructure +/- + + + +/- + + + Dike allocation/consolidation - - - - +/- +/- +/- +/- Dike inland relocation + + + + + + + + Bank lowering +/- + + + +/- + + + River bed widening +/- +/- +/- + + + River bed deepening, dredging - - - - - - - - Side-arms + + + + + + + + Dam control +/- +/- +/- +/- +/- +/- +/- +/- Vegetation management +/- +/- + + + + + + Groin lowering + + Legend: 1 = Lorraine Meuse - empty cells: no ecological consequence 2 = Ardennes Meuse - ‘-‘: negative 3 = Common Meuse - ‘+’: positive 4 = Sand Meuse 4.2 Definition of three strategies for integrated flood protection On a global scale the three proposed flood protection strategies were assessed for their potential effects on the discharge and water level duration curves. For this, data from gauges situated near the pilot stretches used for the detailed analyses were used (i.e. Stenay (Lorraine Meuse), Borgharen (Common Meuse) and Sambeek (Sand Meuse)). Due to the nature of the project the effect assessment at this scale level for the whole Meuse basin was performed in a more qualitative way. It was anticipated that the strategies all had a different effect on the discharge or water levels of the river Meuse. The contributing factors of each strategy (Table 4.4) were globally assessed, partly by expert judgement, for their effects on the water level and discharge.
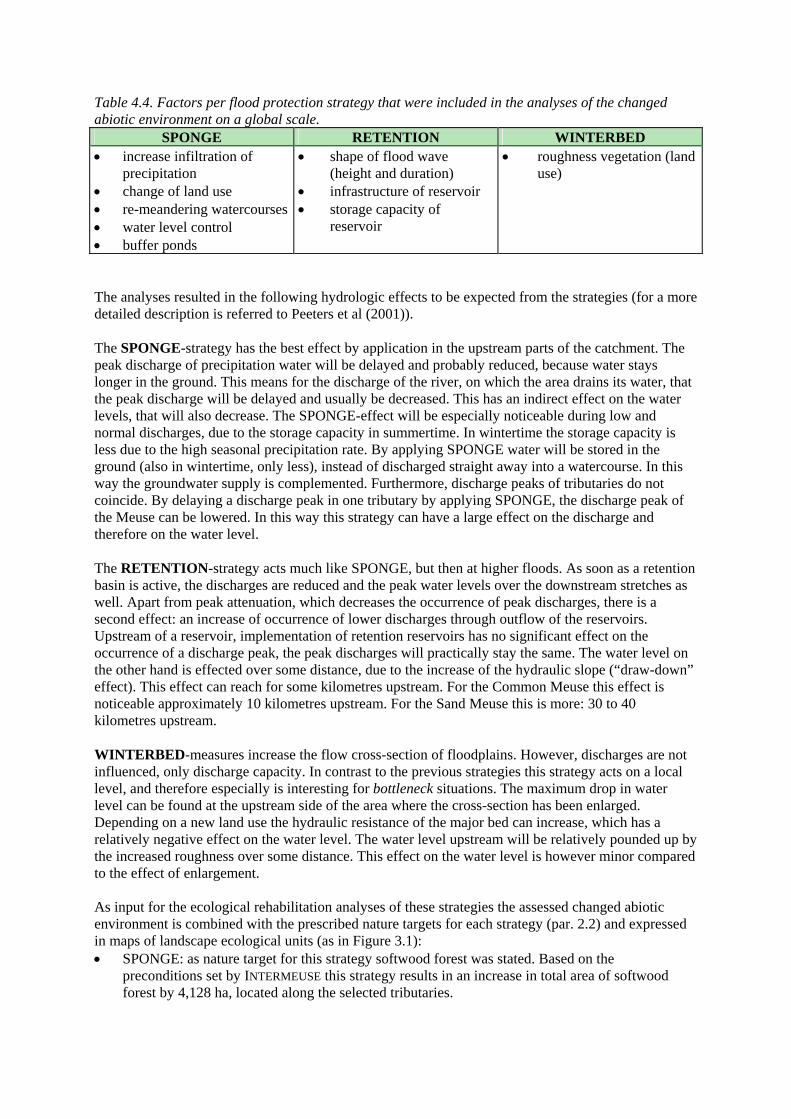
Table 4.4. Factors per flood protection strategy that were included in the analyses of the changed abiotic environment on a global scale.
SPONGE RETENTION WINTERBED • increase infiltration of
precipitation • change of land use • re-meandering watercourses • water level control • buffer ponds
• shape of flood wave (height and duration)
• infrastructure of reservoir • storage capacity of
reservoir
• roughness vegetation (land use)
The analyses resulted in the following hydrologic effects to be expected from the strategies (for a more detailed description is referred to Peeters et al (2001)). The SPONGE-strategy has the best effect by application in the upstream parts of the catchment. The peak discharge of precipitation water will be delayed and probably reduced, because water stays longer in the ground. This means for the discharge of the river, on which the area drains its water, that the peak discharge will be delayed and usually be decreased. This has an indirect effect on the water levels, that will also decrease. The SPONGE-effect will be especially noticeable during low and normal discharges, due to the storage capacity in summertime. In wintertime the storage capacity is less due to the high seasonal precipitation rate. By applying SPONGE water will be stored in the ground (also in wintertime, only less), instead of discharged straight away into a watercourse. In this way the groundwater supply is complemented. Furthermore, discharge peaks of tributaries do not coincide. By delaying a discharge peak in one tributary by applying SPONGE, the discharge peak of the Meuse can be lowered. In this way this strategy can have a large effect on the discharge and therefore on the water level. The RETENTION-strategy acts much like SPONGE, but then at higher floods. As soon as a retention basin is active, the discharges are reduced and the peak water levels over the downstream stretches as well. Apart from peak attenuation, which decreases the occurrence of peak discharges, there is a second effect: an increase of occurrence of lower discharges through outflow of the reservoirs. Upstream of a reservoir, implementation of retention reservoirs has no significant effect on the occurrence of a discharge peak, the peak discharges will practically stay the same. The water level on the other hand is effected over some distance, due to the increase of the hydraulic slope (“draw-down” effect). This effect can reach for some kilometres upstream. For the Common Meuse this effect is noticeable approximately 10 kilometres upstream. For the Sand Meuse this is more: 30 to 40 kilometres upstream. WINTERBED-measures increase the flow cross-section of floodplains. However, discharges are not influenced, only discharge capacity. In contrast to the previous strategies this strategy acts on a local level, and therefore especially is interesting for bottleneck situations. The maximum drop in water level can be found at the upstream side of the area where the cross-section has been enlarged. Depending on a new land use the hydraulic resistance of the major bed can increase, which has a relatively negative effect on the water level. The water level upstream will be relatively pounded up by the increased roughness over some distance. This effect on the water level is however minor compared to the effect of enlargement. As input for the ecological rehabilitation analyses of these strategies the assessed changed abiotic environment is combined with the prescribed nature targets for each strategy (par. 2.2) and expressed in maps of landscape ecological units (as in Figure 3.1): • SPONGE: as nature target for this strategy softwood forest was stated. Based on the
preconditions set by INTERMEUSE this strategy results in an increase in total area of softwood forest by 4,128 ha, located along the selected tributaries.
• RETENTION: as nature targets a combination of marshland and wet grassland was stated for the French part of the Meuse, and softwood forest for the Dutch part. This strategy results in these parts of the Meuse in an increase in total area of marshland, wet grassland and softwood forest of resp. 70, 279 and 16,858 ha.
• WINTERBED: as nature targets a combination of open water, herbaceous grassland and grassland was stated for the whole Meuse. Over the whole Meuse this strategy results in an increase in total area of these nature types by resp. 15,146, 30,293 and 15,146 ha.
4.3 Effects of the strategies on boundary conditions for ecological functioning In contrast to the determination of new abiotics on a global level, here changes in flood duration and water level are computed in a quantitative way, using a hydraulic model (i.e. SOBEK). Based on the characteristics of the pilot stretches one or more strategies was elaborated. Information on type and location of measures was derived from existing studies: • RETENTION for the section Mouzay – Lusy in the Lorraine Meuse. Data were obtained from
EPAMA; • WINTERBED for the Common Meuse, based on the preliminary design of the Maaswerken-
project (incorporating widening of the main channel, supplemented at some locations with floodplain lowering);
• WINTERBED for the section Sambeek – Cuijk in the Sand Meuse, based on the most environmental friendly variant of the Maaswerken-project.
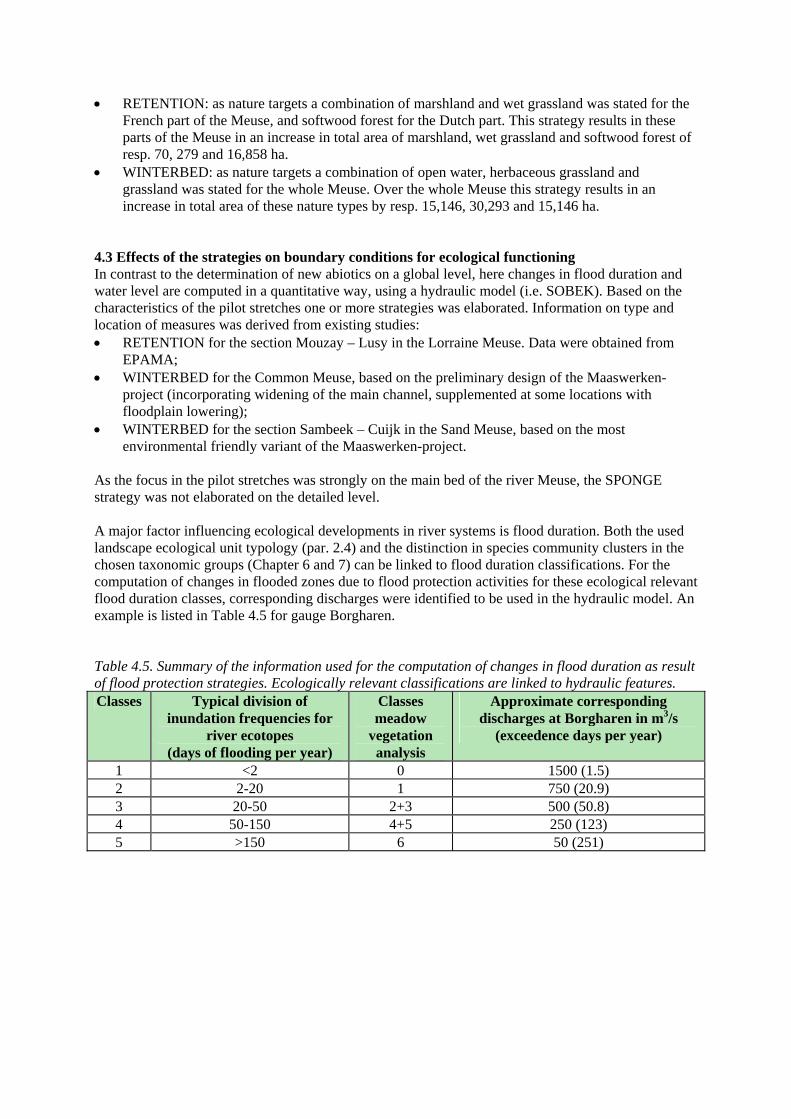
As the focus in the pilot stretches was strongly on the main bed of the river Meuse, the SPONGE strategy was not elaborated on the detailed level. A major factor influencing ecological developments in river systems is flood duration. Both the used landscape ecological unit typology (par. 2.4) and the distinction in species community clusters in the chosen taxonomic groups (Chapter 6 and 7) can be linked to flood duration classifications. For the computation of changes in flooded zones due to flood protection activities for these ecological relevant flood duration classes, corresponding discharges were identified to be used in the hydraulic model. An example is listed in Table 4.5 for gauge Borgharen. Table 4.5. Summary of the information used for the computation of changes in flood duration as result of flood protection strategies. Ecologically relevant classifications are linked to hydraulic features. Classes Typical division of
inundation frequencies for river ecotopes
(days of flooding per year)
Classes meadow
vegetation analysis
Approximate corresponding discharges at Borgharen in m3/s
(exceedence days per year)
1 <2 0 1500 (1.5) 2 2-20 1 750 (20.9) 3 20-50 2+3 500 (50.8) 4 50-150 4+5 250 (123) 5 >150 6 50 (251)
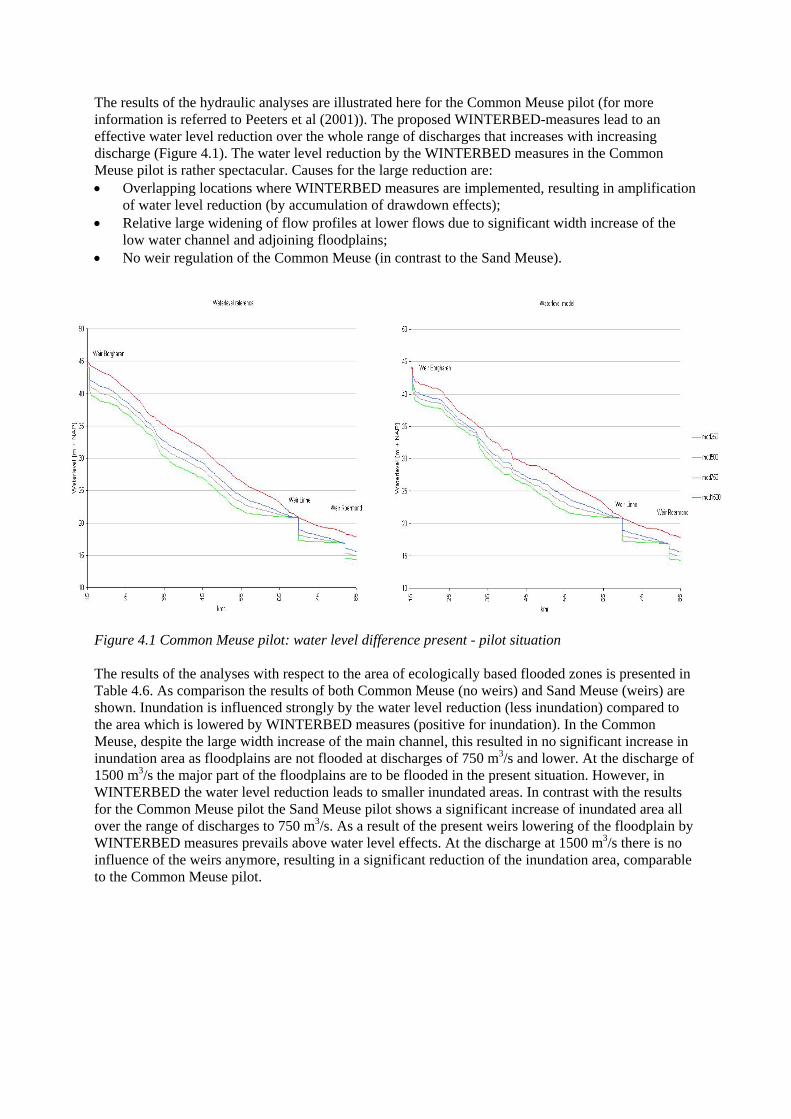
The results of the hydraulic analyses are illustrated here for the Common Meuse pilot (for more information is referred to Peeters et al (2001)). The proposed WINTERBED-measures lead to an effective water level reduction over the whole range of discharges that increases with increasing discharge (Figure 4.1). The water level reduction by the WINTERBED measures in the Common Meuse pilot is rather spectacular. Causes for the large reduction are: • Overlapping locations where WINTERBED measures are implemented, resulting in amplification
of water level reduction (by accumulation of drawdown effects); • Relative large widening of flow profiles at lower flows due to significant width increase of the
low water channel and adjoining floodplains; • No weir regulation of the Common Meuse (in contrast to the Sand Meuse).
Figure 4.1 Common Meuse pilot: water level difference present - pilot situation The results of the analyses with respect to the area of ecologically based flooded zones is presented in Table 4.6. As comparison the results of both Common Meuse (no weirs) and Sand Meuse (weirs) are shown. Inundation is influenced strongly by the water level reduction (less inundation) compared to the area which is lowered by WINTERBED measures (positive for inundation). In the Common Meuse, despite the large width increase of the main channel, this resulted in no significant increase in inundation area as floodplains are not flooded at discharges of 750 m3/s and lower. At the discharge of 1500 m3/s the major part of the floodplains are to be flooded in the present situation. However, in WINTERBED the water level reduction leads to smaller inundated areas. In contrast with the results for the Common Meuse pilot the Sand Meuse pilot shows a significant increase of inundated area all over the range of discharges to 750 m3/s. As a result of the present weirs lowering of the floodplain by WINTERBED measures prevails above water level effects. At the discharge at 1500 m3/s there is no influence of the weirs anymore, resulting in a significant reduction of the inundation area, comparable to the Common Meuse pilot.
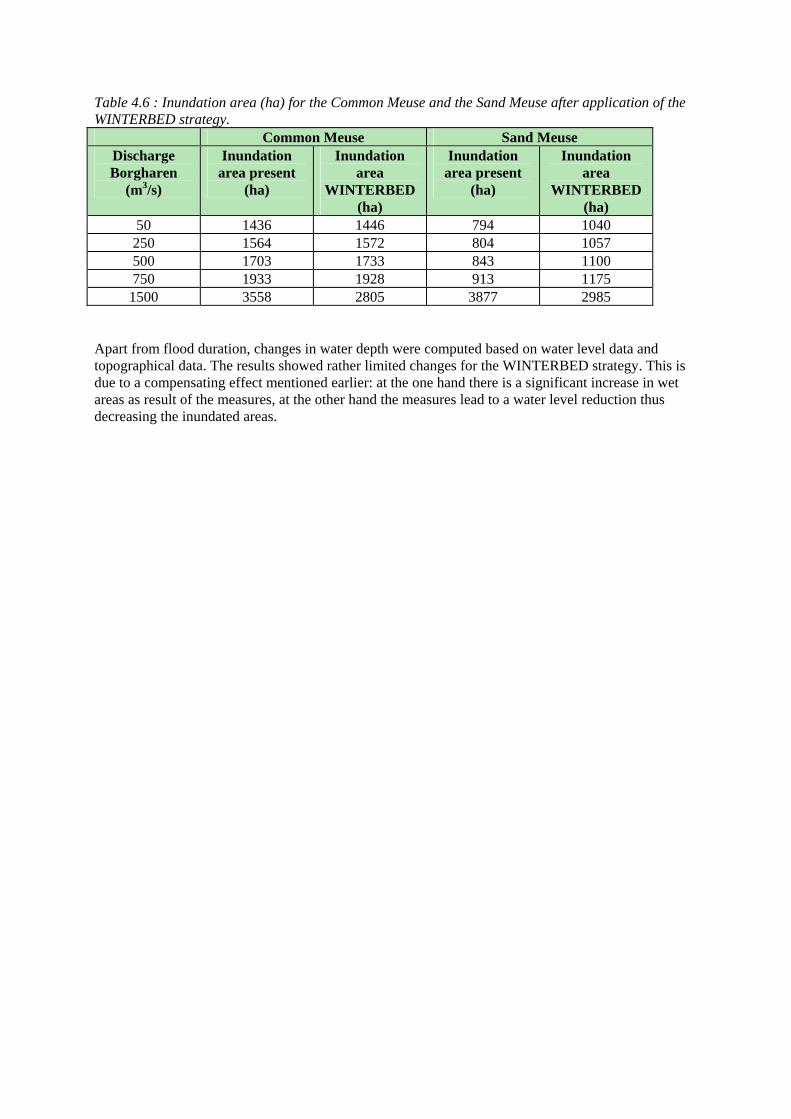
Table 4.6 : Inundation area (ha) for the Common Meuse and the Sand Meuse after application of the WINTERBED strategy.
Common Meuse Sand Meuse Discharge Borgharen
(m3/s)
Inundation area present
(ha)
Inundation area
WINTERBED (ha)
Inundation area present
(ha)
Inundation area
WINTERBED (ha)
50 1436 1446 794 1040 250 1564 1572 804 1057 500 1703 1733 843 1100 750 1933 1928 913 1175
1500 3558 2805 3877 2985 Apart from flood duration, changes in water depth were computed based on water level data and topographical data. The results showed rather limited changes for the WINTERBED strategy. This is due to a compensating effect mentioned earlier: at the one hand there is a significant increase in wet areas as result of the measures, at the other hand the measures lead to a water level reduction thus decreasing the inundated areas.
5. Ecological cohesion: habitat network functioning On a global scale, spatial planning alternatives can be assessed on potentials for biodiversity by means of a habitat network analysis. Within INTERMEUSE the model LARCH (Landscape Analysis and Rules for the Configuration of Habitat; par. 5.1) was adapted and used for the ecological impact assessment posed by the proposed flood protection strategies. The results of this analysis indicate potentials for the development of viable populations of species on the basis of the spatial habitat configuration analysed. 5.1 Ecological network analysis On the global scale the ecological rehabilitation goals and therefore the analysis focus on the spatial configuration of habitats. A number of habitats within reach of each other can form an ecological network, thus enabling species to form viable populations. This concept is based on the theory of metapopulations (Levins, 1970). For the evaluation of this ecological network functioning in the different flood protection strategies a method was developed. Key elements in this approach are: • characteristics of a species: e.g. habitat preference, home range, dispersal capacity; • the amount, shape and area of habitat patches in a landscape; • connectivity of the landscape, which defines how easily species can move to other habitat
patches. For example, roads can seriously hamper the connectivity between closely orientated habitat patches.
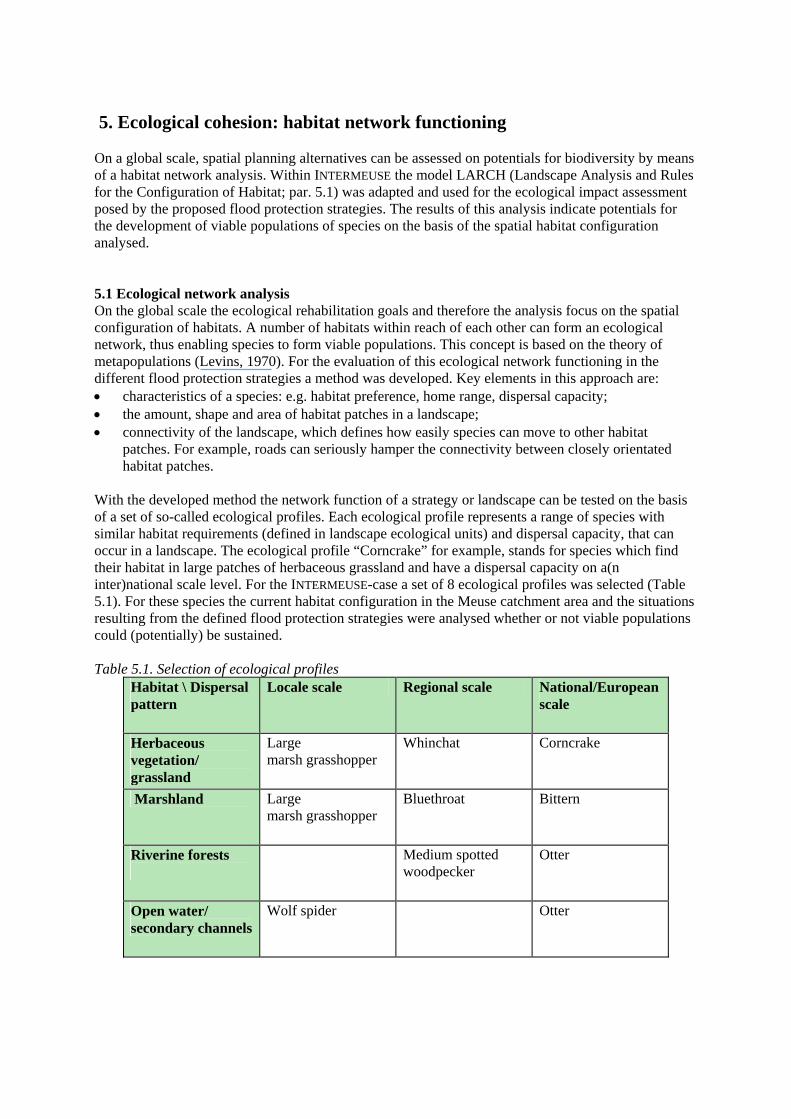
With the developed method the network function of a strategy or landscape can be tested on the basis of a set of so-called ecological profiles. Each ecological profile represents a range of species with similar habitat requirements (defined in landscape ecological units) and dispersal capacity, that can occur in a landscape. The ecological profile “Corncrake” for example, stands for species which find their habitat in large patches of herbaceous grassland and have a dispersal capacity on a(n inter)national scale level. For the INTERMEUSE-case a set of 8 ecological profiles was selected (Table 5.1). For these species the current habitat configuration in the Meuse catchment area and the situations resulting from the defined flood protection strategies were analysed whether or not viable populations could (potentially) be sustained. Table 5.1. Selection of ecological profiles
Habitat \ Dispersal pattern
Locale scale Regional scale National/European scale
Herbaceous vegetation/ grassland
Large marsh grasshopper
Whinchat Corncrake
Marshland Large marsh grasshopper
Bluethroat Bittern
Riverine forests
Medium spotted woodpecker
Otter
Open water/ secondary channels
Wolf spider
Otter
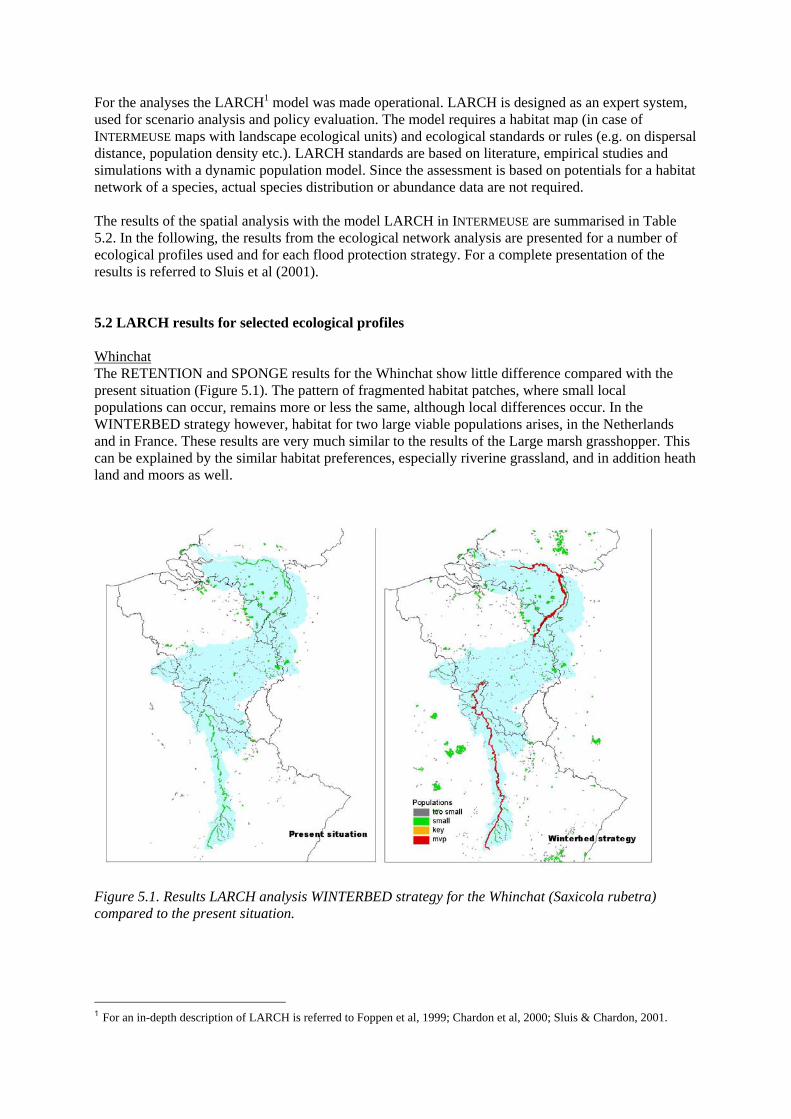
For the analyses the LARCH1 model was made operational. LARCH is designed as an expert system, used for scenario analysis and policy evaluation. The model requires a habitat map (in case of INTERMEUSE maps with landscape ecological units) and ecological standards or rules (e.g. on dispersal distance, population density etc.). LARCH standards are based on literature, empirical studies and simulations with a dynamic population model. Since the assessment is based on potentials for a habitat network of a species, actual species distribution or abundance data are not required. The results of the spatial analysis with the model LARCH in INTERMEUSE are summarised in Table 5.2. In the following, the results from the ecological network analysis are presented for a number of ecological profiles used and for each flood protection strategy. For a complete presentation of the results is referred to Sluis et al (2001). 5.2 LARCH results for selected ecological profiles Whinchat The RETENTION and SPONGE results for the Whinchat show little difference compared with the present situation (Figure 5.1). The pattern of fragmented habitat patches, where small local populations can occur, remains more or less the same, although local differences occur. In the WINTERBED strategy however, habitat for two large viable populations arises, in the Netherlands and in France. These results are very much similar to the results of the Large marsh grasshopper. This can be explained by the similar habitat preferences, especially riverine grassland, and in addition heath land and moors as well.
Figure 5.1. Results LARCH analysis WINTERBED strategy for the Whinchat (Saxicola rubetra) compared to the present situation.
1 For an in-depth description of LARCH is referred to Foppen et al, 1999; Chardon et al, 2000; Sluis & Chardon, 2001.
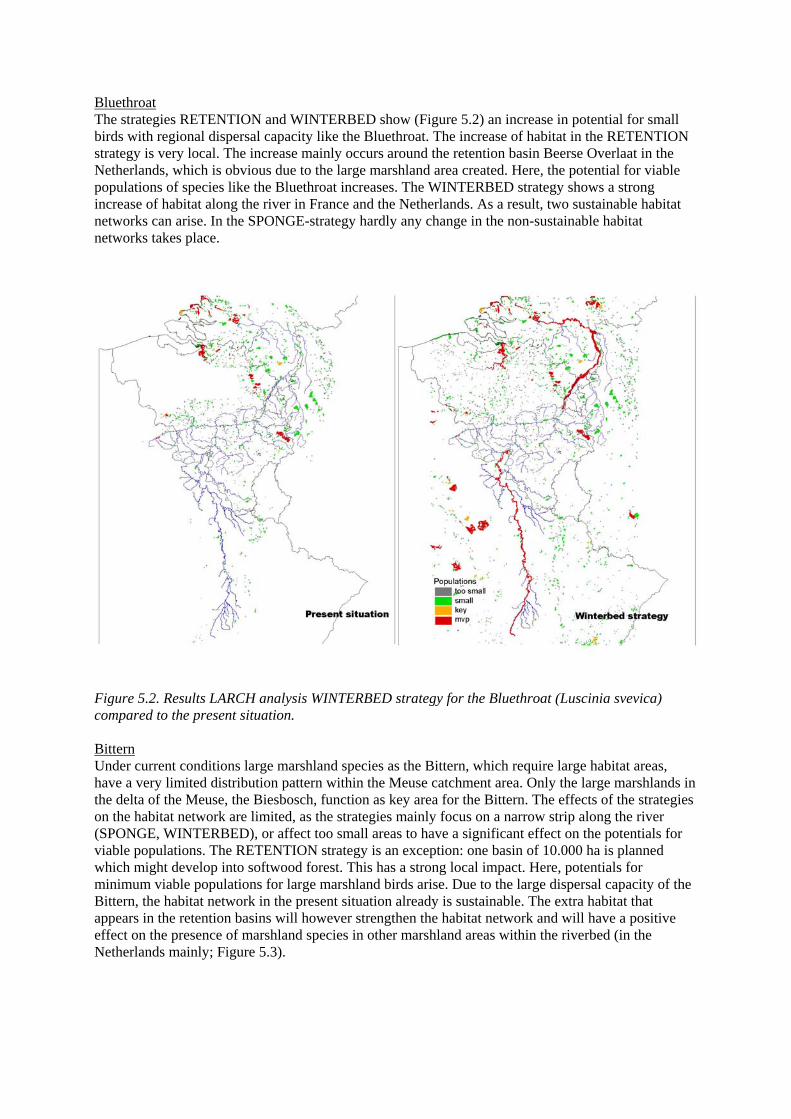
Bluethroat The strategies RETENTION and WINTERBED show (Figure 5.2) an increase in potential for small birds with regional dispersal capacity like the Bluethroat. The increase of habitat in the RETENTION strategy is very local. The increase mainly occurs around the retention basin Beerse Overlaat in the Netherlands, which is obvious due to the large marshland area created. Here, the potential for viable populations of species like the Bluethroat increases. The WINTERBED strategy shows a strong increase of habitat along the river in France and the Netherlands. As a result, two sustainable habitat networks can arise. In the SPONGE-strategy hardly any change in the non-sustainable habitat networks takes place.
Figure 5.2. Results LARCH analysis WINTERBED strategy for the Bluethroat (Luscinia svevica) compared to the present situation. Bittern Under current conditions large marshland species as the Bittern, which require large habitat areas, have a very limited distribution pattern within the Meuse catchment area. Only the large marshlands in the delta of the Meuse, the Biesbosch, function as key area for the Bittern. The effects of the strategies on the habitat network are limited, as the strategies mainly focus on a narrow strip along the river (SPONGE, WINTERBED), or affect too small areas to have a significant effect on the potentials for viable populations. The RETENTION strategy is an exception: one basin of 10.000 ha is planned which might develop into softwood forest. This has a strong local impact. Here, potentials for minimum viable populations for large marshland birds arise. Due to the large dispersal capacity of the Bittern, the habitat network in the present situation already is sustainable. The extra habitat that appears in the retention basins will however strengthen the habitat network and will have a positive effect on the presence of marshland species in other marshland areas within the riverbed (in the Netherlands mainly; Figure 5.3).
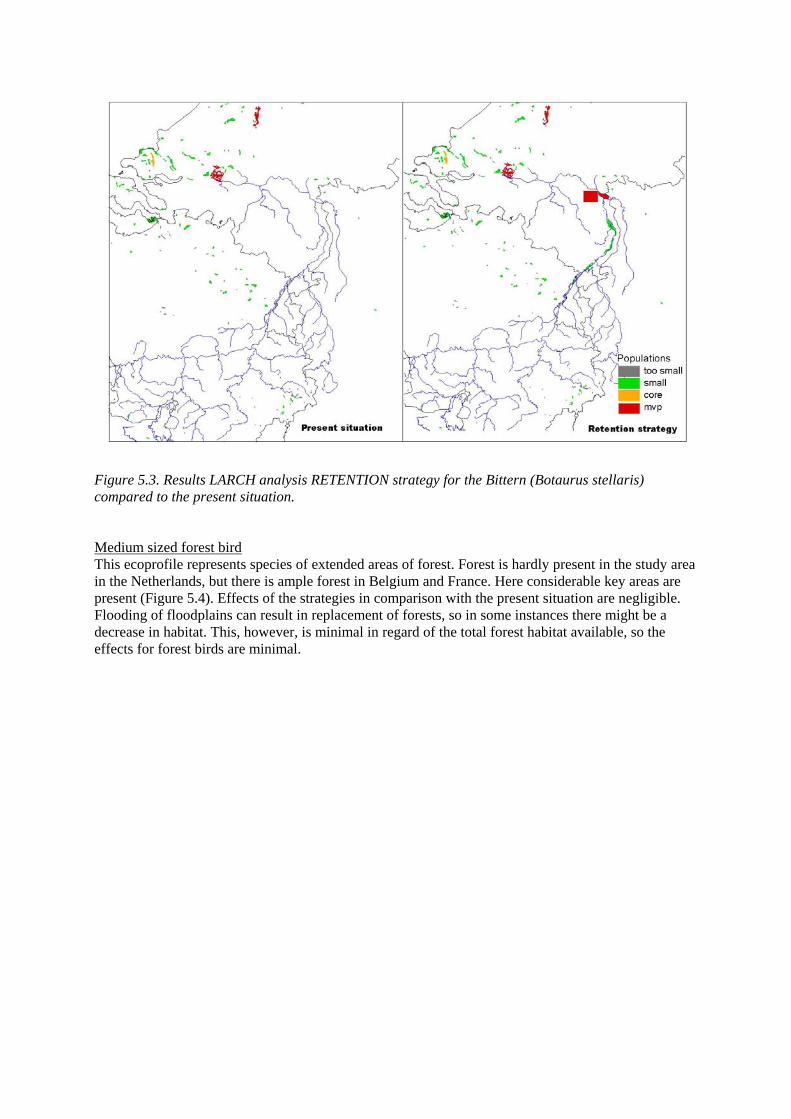
Figure 5.3. Results LARCH analysis RETENTION strategy for the Bittern (Botaurus stellaris) compared to the present situation. Medium sized forest bird This ecoprofile represents species of extended areas of forest. Forest is hardly present in the study area in the Netherlands, but there is ample forest in Belgium and France. Here considerable key areas are present (Figure 5.4). Effects of the strategies in comparison with the present situation are negligible. Flooding of floodplains can result in replacement of forests, so in some instances there might be a decrease in habitat. This, however, is minimal in regard of the total forest habitat available, so the effects for forest birds are minimal.
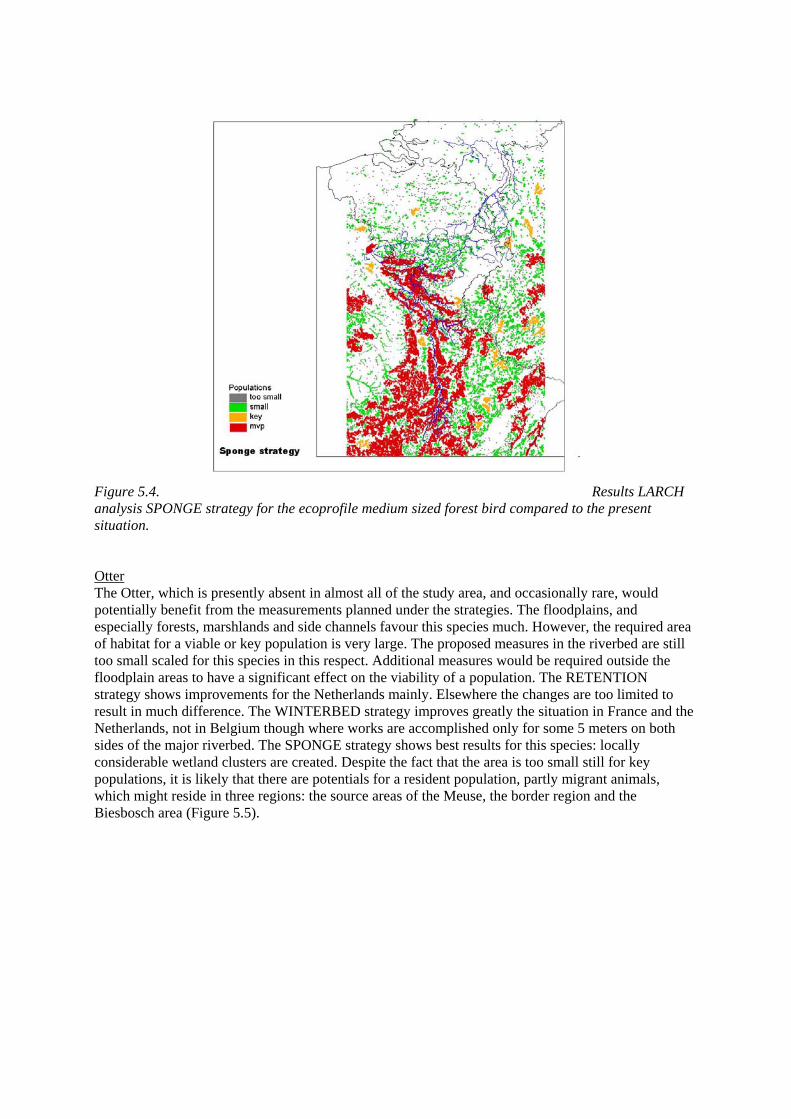
Figure 5.4. Results LARCH analysis SPONGE strategy for the ecoprofile medium sized forest bird compared to the present situation. Otter The Otter, which is presently absent in almost all of the study area, and occasionally rare, would potentially benefit from the measurements planned under the strategies. The floodplains, and especially forests, marshlands and side channels favour this species much. However, the required area of habitat for a viable or key population is very large. The proposed measures in the riverbed are still too small scaled for this species in this respect. Additional measures would be required outside the floodplain areas to have a significant effect on the viability of a population. The RETENTION strategy shows improvements for the Netherlands mainly. Elsewhere the changes are too limited to result in much difference. The WINTERBED strategy improves greatly the situation in France and the Netherlands, not in Belgium though where works are accomplished only for some 5 meters on both sides of the major riverbed. The SPONGE strategy shows best results for this species: locally considerable wetland clusters are created. Despite the fact that the area is too small still for key populations, it is likely that there are potentials for a resident population, partly migrant animals, which might reside in three regions: the source areas of the Meuse, the border region and the Biesbosch area (Figure 5.5).
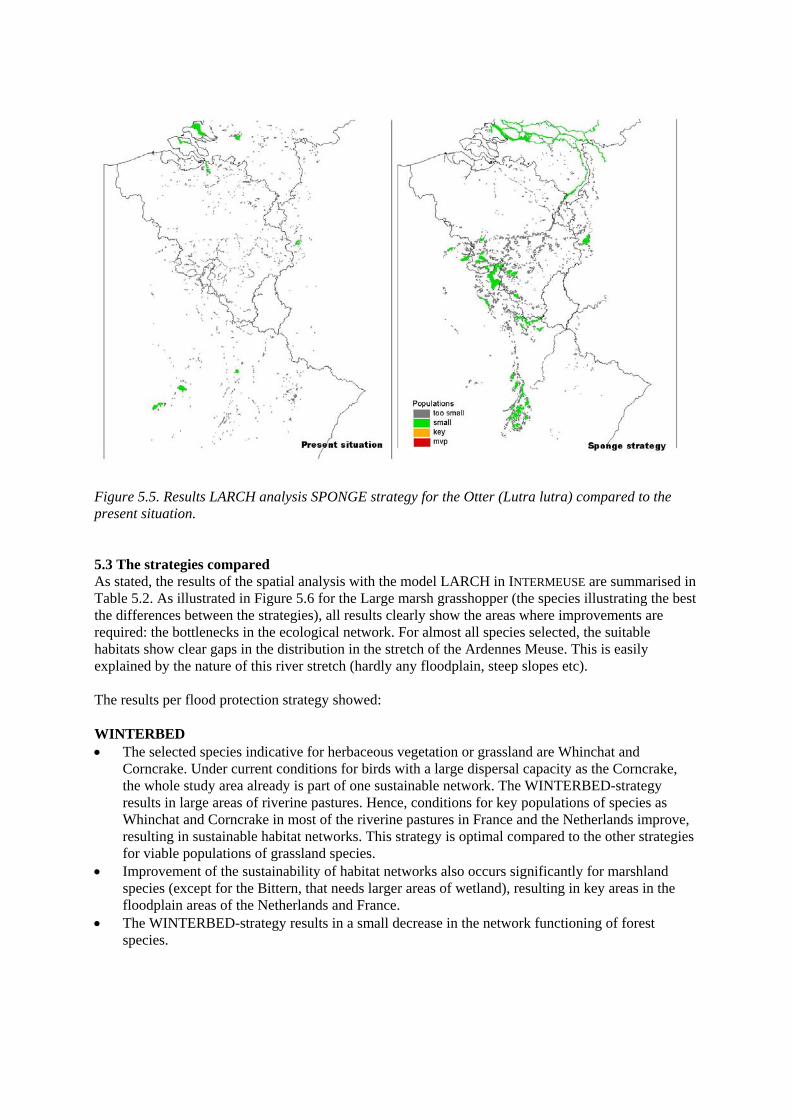
Figure 5.5. Results LARCH analysis SPONGE strategy for the Otter (Lutra lutra) compared to the present situation. 5.3 The strategies compared As stated, the results of the spatial analysis with the model LARCH in INTERMEUSE are summarised in Table 5.2. As illustrated in Figure 5.6 for the Large marsh grasshopper (the species illustrating the best the differences between the strategies), all results clearly show the areas where improvements are required: the bottlenecks in the ecological network. For almost all species selected, the suitable habitats show clear gaps in the distribution in the stretch of the Ardennes Meuse. This is easily explained by the nature of this river stretch (hardly any floodplain, steep slopes etc). The results per flood protection strategy showed: WINTERBED • The selected species indicative for herbaceous vegetation or grassland are Whinchat and
Corncrake. Under current conditions for birds with a large dispersal capacity as the Corncrake, the whole study area already is part of one sustainable network. The WINTERBED-strategy results in large areas of riverine pastures. Hence, conditions for key populations of species as Whinchat and Corncrake in most of the riverine pastures in France and the Netherlands improve, resulting in sustainable habitat networks. This strategy is optimal compared to the other strategies for viable populations of grassland species.
• Improvement of the sustainability of habitat networks also occurs significantly for marshland species (except for the Bittern, that needs larger areas of wetland), resulting in key areas in the floodplain areas of the Netherlands and France.
• The WINTERBED-strategy results in a small decrease in the network functioning of forest species.
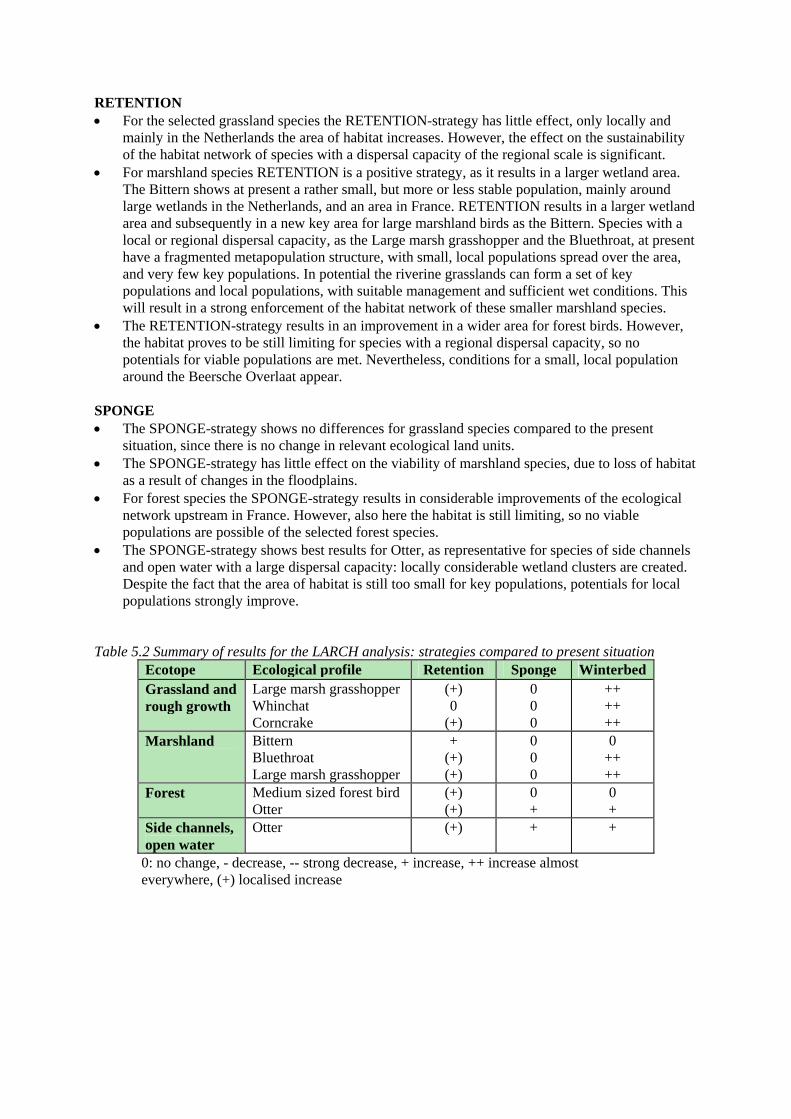
RETENTION • For the selected grassland species the RETENTION-strategy has little effect, only locally and
mainly in the Netherlands the area of habitat increases. However, the effect on the sustainability of the habitat network of species with a dispersal capacity of the regional scale is significant.
• For marshland species RETENTION is a positive strategy, as it results in a larger wetland area. The Bittern shows at present a rather small, but more or less stable population, mainly around large wetlands in the Netherlands, and an area in France. RETENTION results in a larger wetland area and subsequently in a new key area for large marshland birds as the Bittern. Species with a local or regional dispersal capacity, as the Large marsh grasshopper and the Bluethroat, at present have a fragmented metapopulation structure, with small, local populations spread over the area, and very few key populations. In potential the riverine grasslands can form a set of key populations and local populations, with suitable management and sufficient wet conditions. This will result in a strong enforcement of the habitat network of these smaller marshland species.
• The RETENTION-strategy results in an improvement in a wider area for forest birds. However, the habitat proves to be still limiting for species with a regional dispersal capacity, so no potentials for viable populations are met. Nevertheless, conditions for a small, local population around the Beersche Overlaat appear.
SPONGE • The SPONGE-strategy shows no differences for grassland species compared to the present
situation, since there is no change in relevant ecological land units. • The SPONGE-strategy has little effect on the viability of marshland species, due to loss of habitat
as a result of changes in the floodplains. • For forest species the SPONGE-strategy results in considerable improvements of the ecological
network upstream in France. However, also here the habitat is still limiting, so no viable populations are possible of the selected forest species.
• The SPONGE-strategy shows best results for Otter, as representative for species of side channels and open water with a large dispersal capacity: locally considerable wetland clusters are created. Despite the fact that the area of habitat is still too small for key populations, potentials for local populations strongly improve.
Table 5.2 Summary of results for the LARCH analysis: strategies compared to present situation
Ecotope Ecological profile Retention Sponge Winterbed Grassland and rough growth
Large marsh grasshopper Whinchat Corncrake
(+) 0
(+)
0 0 0
++ ++ ++
Marshland Bittern Bluethroat Large marsh grasshopper
+ (+) (+)
0 0 0
0 ++ ++
Forest Medium sized forest bird Otter
(+) (+)
0 +
0 +
Side channels, open water
Otter (+) + +
0: no change, - decrease, -- strong decrease, + increase, ++ increase almost everywhere, (+) localised increase
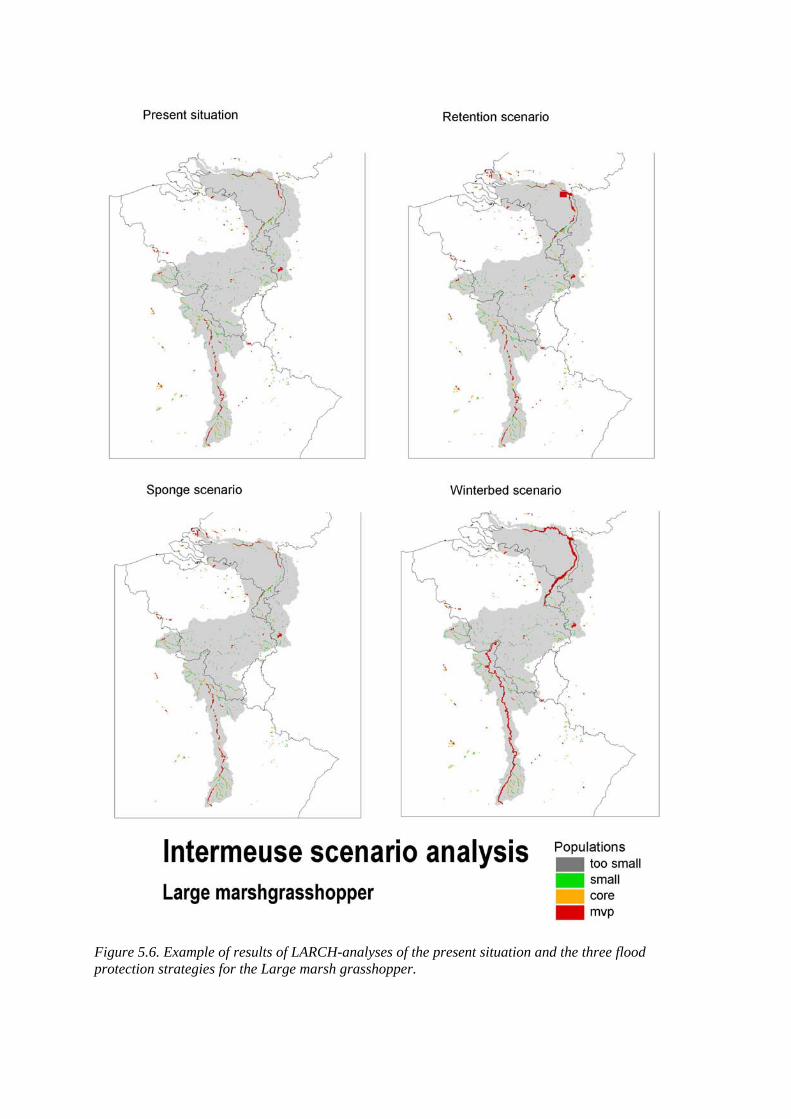
Figure 5.6. Example of results of LARCH-analyses of the present situation and the three flood protection strategies for the Large marsh grasshopper.
6. Ecosystem quality: river bed habitat integrity On a more detailed, local scale (e.g. river banks) focus for ecological effect assessment of flood protection activities is on completeness of species communities in relation to local conditions, as indication for ecological quality. Within INTERMEUSE carabid beetles were chosen as indicator group for the river bed zone for this aspect of ecological effect assessment and means for integration with flood protection. The river bed is characterised by dynamic habitats and as such direct links to flood dynamics exist (i.e. morphodynamics, water level fluctuation and flood frequencies). Based on cluster analysis of field survey data correlations between species communities and environmental features were made. Combined with habitat requirements of indicator species a predictive model was designed, with which future situations resulting from e.g. flood protection measures can be assessed on their potentials for the integration of river bed rehabilitation goals. For a complete description of this part of the INTERMEUSE activities is referred to Jochems & van Looy (2001). 6.1 Ecological quality analysis: carabid beetle communities Central theme in the analysis is linkage of characteristic species communities to distinct habitat conditions as a whole representing the number of gradients present in a river ecosystem. By doing so, information on the abiotic environment can be translated in potentials for species diversity and based on indicator species the habitat diversity can be described. Both elements are valuable information to optimise river management. For the analysis of the carabid beetle communities a similar approach as for the meadow vegetation is used (see Chapter 7). In a field survey, data were collected in the pilot stretches on carabid fauna, vegetation and abiotic river bank characteristics. In total 20 plots were sampled resulting in 4881 carabid beetles. Based on correlations between species communities and environmental features habitat-templates (“profiles”) are defined, that are grouped in three zones within the riverbank. Indicator species are identified with strong relevancy to the different habitats in the riverbed. The defined templates are linked to biotic and abiotic characteristics which enables the development of a response model that can be used for the prediction of potentials of river management activities as well as for the effect assessment. Within INTERMEUSE this was elaborated for the WINTERBED-strategy in the different pilot stretches (Table 6.1). 6.2 Ecological quality analysis: results The environmental variables in the analysis were selected to have maximum ecological relevance, while having a possible influence by flood protection measures. Table 6.1. Variables of river classification, channel morphology, hydrology and river bank habitats.
Variable Description Measurement River kilometre Distance from river source (km) Global / local Width/depth–ratio Dividing river width by mean river depth Global / local Base flow index Dividing lowest flow by mean flow Global Coefficient of variation
Dividing discharge variation by mean discharge Global
Peak frequency (summer peaks)
Number of relevant summer peaks per summer season
Global
Peak velocity Hourly or daily maximum flow increment Local Rising speed Velocity of water level rise Local Habitat diversity Number of riverbank types per station Global / local Texture D50-value of substrate (mm) Global / local Vegetation cover Percentage of soil covered by plants (%) Global / local
The clustering of the carabid beetle samples, resulted in the delineation of the habitat templates for the Meuse riverbanks (Figure 6.1).
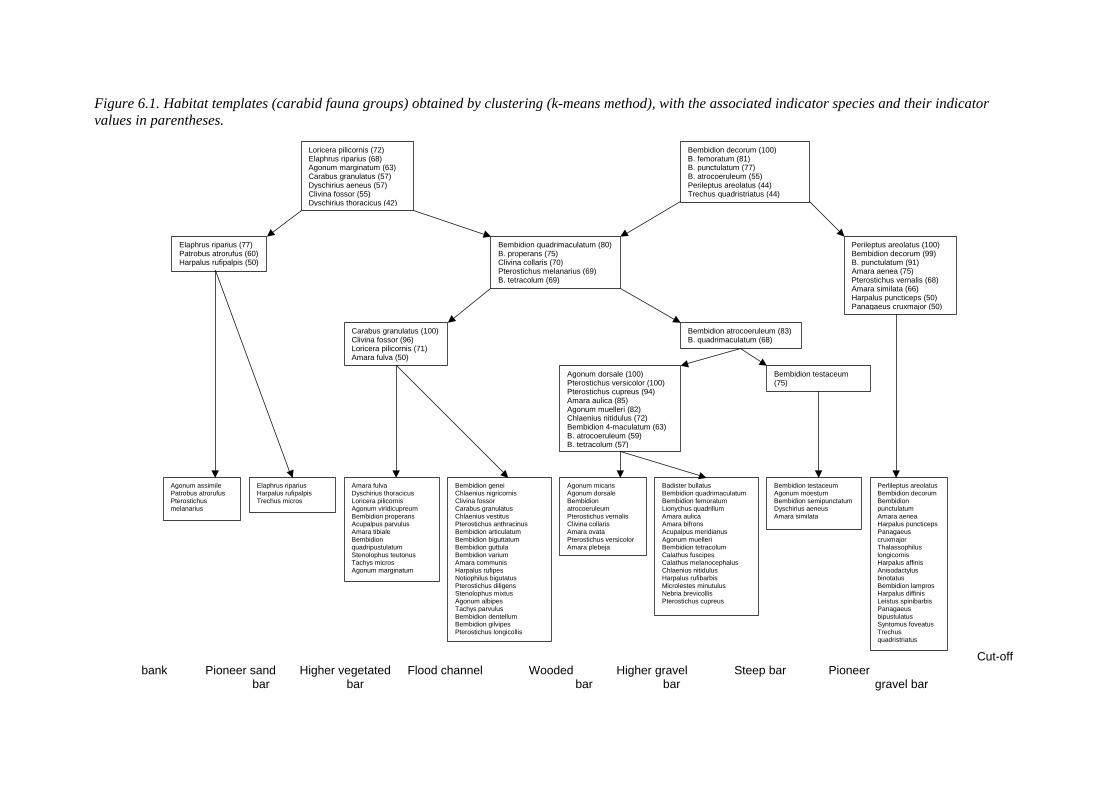
Figure 6.1. Habitat templates (carabid fauna groups) obtained by clustering (k-means method), with the associated indicator species and their indicator values in parentheses.
Cut-off
bank Pioneer sand Higher vegetated Flood channel Wooded Higher gravel Steep bar Pioneer
Loricera pilicornis (72) Elaphrus riparius (68) Agonum marginatum (63) Carabus granulatus (57) Dyschirius aeneus (57) Clivina fossor (55) Dyschirius thoracicus (42)
Bembidion decorum (100) B. femoratum (81) B. punctulatum (77) B. atrocoeruleum (55) Perileptus areolatus (44) Trechus quadristriatus (44)
Elaphrus riparius (77) Patrobus atrorufus (60) Harpalus rufipalpis (50)
Bembidion quadrimaculatum (80)B. properans (75) Clivina collaris (70) Pterostichus melanarius (69) B. tetracolum (69)
Perileptus areolatus (100) Bembidion decorum (99) B. punctulatum (91) Amara aenea (75) Pterostichus vernalis (68) Amara similata (66) Harpalus puncticeps (50) Panagaeus cruxmajor (50)
Carabus granulatus (100)Clivina fossor (96) Loricera pilicornis (71) Amara fulva (50)
Bembidion atrocoeruleum (83)B. quadrimaculatum (68)
Agonum dorsale (100) Pterostichus versicolor (100) Pterostichus cupreus (94) Amara aulica (85) Agonum muelleri (82) Chlaenius nitidulus (72) Bembidion 4-maculatum (63) B. atrocoeruleum (59) B. tetracolum (57)
Bembidion testaceum (75)
Agonum assimile Patrobus atrorufus Pterostichus melanarius
Elaphrus riparius Harpalus rufipalpis Trechus micros
Amara fulva Dyschirius thoracicus Loricera pilicornis Agonum viridicupreum Bembidion properans Acupalpus parvulus Amara tibiale Bembidion quadripustulatum Stenolophus teutonus Tachys micros Agonum marginatum
Bembidion genei Chlaenius nigricornis Clivina fossor Carabus granulatus Chlaenius vestitus Pterostichus anthracinus Bembidion articulatum Bembidion biguttatum Bembidion guttula Bembidion varium Amara communis Harpalus rufipes Notiophilus bigutatus Pterostichus diligens Stenolophus mixtus Agonum albipes Tachys parvulus Bembidion dentellum Bembidion gilvipes Pterostichus longicollis
Agonum micans Agonum dorsale Bembidion atrocoeruleum Pterostichus vernalis Clivina collaris Amara ovata Pterostichus versicolor Amara plebeja
Badister bullatus Bembidion quadrimaculatum Bembidion femoratum Lionychus quadrillum Amara aulica Amara bifrons Acupalpus meridianus Agonum muelleri Bembidion tetracolum Calathus fuscipes Calathus melanocephalus Chlaenius nitidulus Harpalus rufibarbis Microlestes minutulus Nebria brevicollis Pterostichus cupreus
Bembidion testaceum Agonum moestum Bembidion semipunctatumDyschirius aeneus Amara similata
Perlileptus areolatusBembidion decorum Bembidion punctulatum Amara aenea Harpalus puncticepsPanagaeus cruxmajor Thalassophilus longicornis Harpalus affinis Anisodactylus binotatus Bembidion lampros Harpalus diffinis Leistus spinibarbis Panagaeus bipustulatus Syntomus foveatus Trechus quadristriatus
bar bar bar bar gravel bar
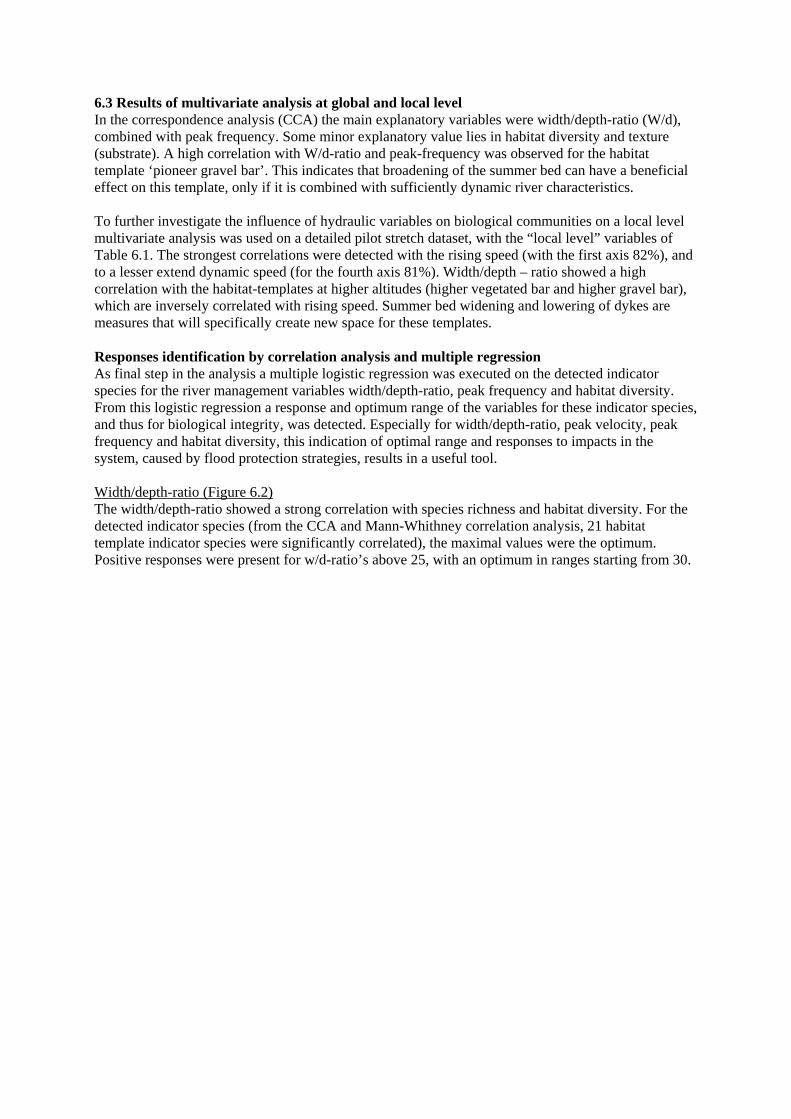
6.3 Results of multivariate analysis at global and local level In the correspondence analysis (CCA) the main explanatory variables were width/depth-ratio (W/d), combined with peak frequency. Some minor explanatory value lies in habitat diversity and texture (substrate). A high correlation with W/d-ratio and peak-frequency was observed for the habitat template ‘pioneer gravel bar’. This indicates that broadening of the summer bed can have a beneficial effect on this template, only if it is combined with sufficiently dynamic river characteristics. To further investigate the influence of hydraulic variables on biological communities on a local level multivariate analysis was used on a detailed pilot stretch dataset, with the “local level” variables of Table 6.1. The strongest correlations were detected with the rising speed (with the first axis 82%), and to a lesser extend dynamic speed (for the fourth axis 81%). Width/depth – ratio showed a high correlation with the habitat-templates at higher altitudes (higher vegetated bar and higher gravel bar), which are inversely correlated with rising speed. Summer bed widening and lowering of dykes are measures that will specifically create new space for these templates. Responses identification by correlation analysis and multiple regression As final step in the analysis a multiple logistic regression was executed on the detected indicator species for the river management variables width/depth-ratio, peak frequency and habitat diversity. From this logistic regression a response and optimum range of the variables for these indicator species, and thus for biological integrity, was detected. Especially for width/depth-ratio, peak velocity, peak frequency and habitat diversity, this indication of optimal range and responses to impacts in the system, caused by flood protection strategies, results in a useful tool. Width/depth-ratio (Figure 6.2) The width/depth-ratio showed a strong correlation with species richness and habitat diversity. For the detected indicator species (from the CCA and Mann-Whithney correlation analysis, 21 habitat template indicator species were significantly correlated), the maximal values were the optimum. Positive responses were present for w/d-ratio’s above 25, with an optimum in ranges starting from 30.
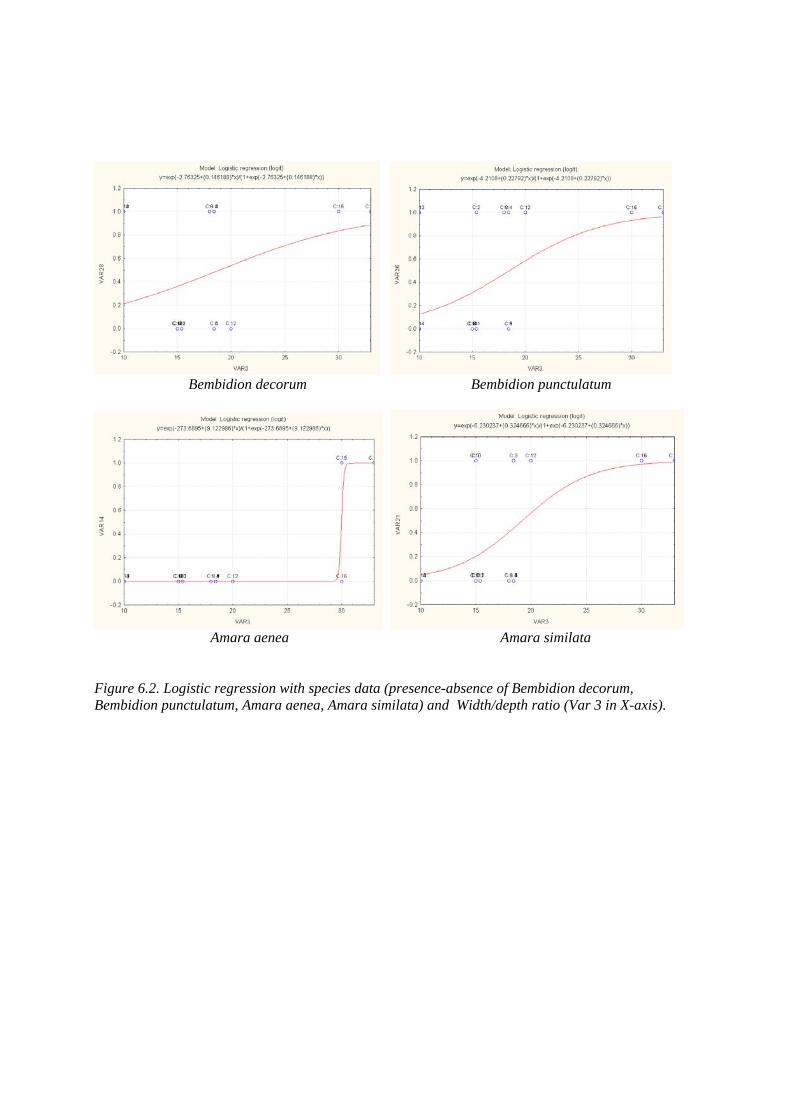
Bembidion decorum Bembidion punctulatum
Amara aenea Amara similata Figure 6.2. Logistic regression with species data (presence-absence of Bembidion decorum, Bembidion punctulatum, Amara aenea, Amara similata) and Width/depth ratio (Var 3 in X-axis).

Peak frequency (Figure 6.3) Peak frequency of the ‘middle range’ summer peaks is a variable of hydro-morphological activity, which shows a positive correlation with community and species richness in the present situation. For indicator species, optimum values were in the maximum of 9.
Amara aenea Amara similata
Figure 6.3. Logistic regression with species data (presence-absence of Amara aenea and Amara similata) and Peak frequency (Var 4 in X-axis). Habitat diversity (Figure 6.4) The habitat diversity of the plots is a variable to which the river management and the flood protection measures have a direct link. Therefore specific indicator species for the habitat diversity can be useful in the evaluation and assessment of measures and scenario’s. Optimal values are of course in the maximum of 6, but there is a good biological integrity in the system starting from habitat diversity 3. The indicator species for this variable (Amara similata and Dischyrius aeneus) are present in all the pilot stretches and give a further instrument for the evaluation of flood protection measures in the scenario building as well as in the future monitoring.
Amara similata Dyschirius aeneus Figure 6.4. Logistic regression with species data (presence-absence of Amara similata and Dyschirius aeneus) and Habitat diversity (Var 2 in X-axis).
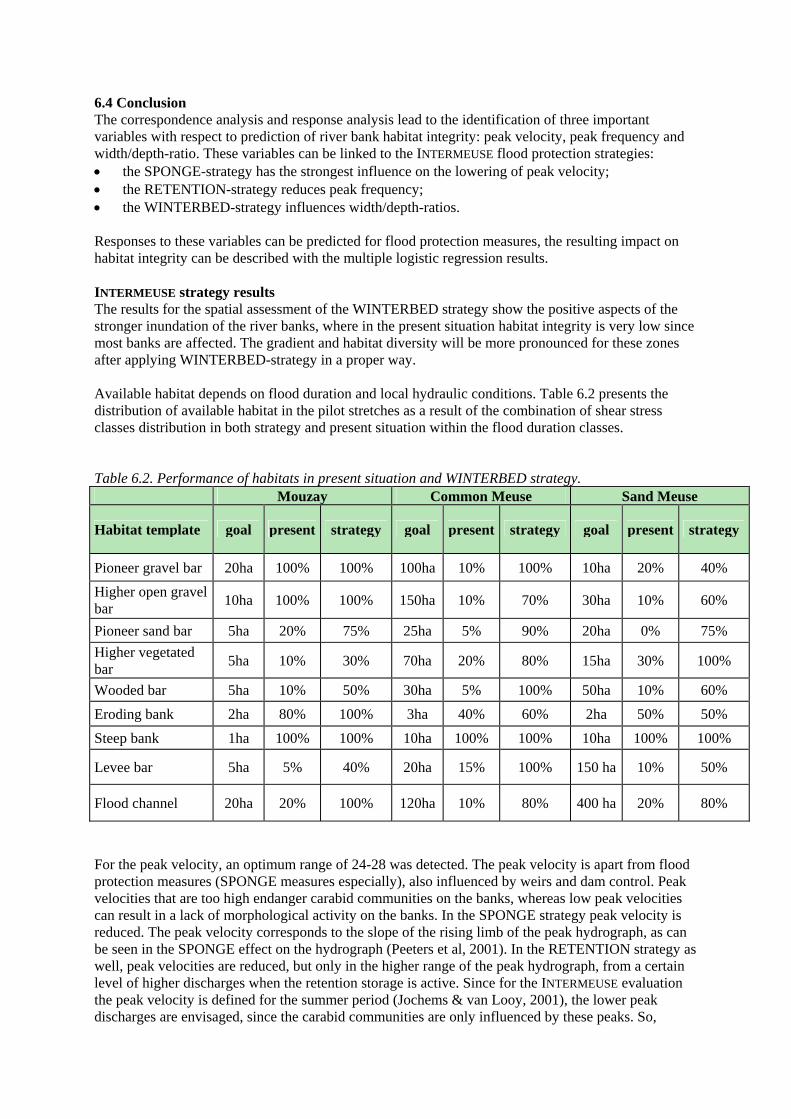
6.4 Conclusion The correspondence analysis and response analysis lead to the identification of three important variables with respect to prediction of river bank habitat integrity: peak velocity, peak frequency and width/depth-ratio. These variables can be linked to the INTERMEUSE flood protection strategies: • the SPONGE-strategy has the strongest influence on the lowering of peak velocity; • the RETENTION-strategy reduces peak frequency; • the WINTERBED-strategy influences width/depth-ratios. Responses to these variables can be predicted for flood protection measures, the resulting impact on habitat integrity can be described with the multiple logistic regression results. INTERMEUSE strategy results The results for the spatial assessment of the WINTERBED strategy show the positive aspects of the stronger inundation of the river banks, where in the present situation habitat integrity is very low since most banks are affected. The gradient and habitat diversity will be more pronounced for these zones after applying WINTERBED-strategy in a proper way. Available habitat depends on flood duration and local hydraulic conditions. Table 6.2 presents the distribution of available habitat in the pilot stretches as a result of the combination of shear stress classes distribution in both strategy and present situation within the flood duration classes. Table 6.2. Performance of habitats in present situation and WINTERBED strategy.
Mouzay Common Meuse Sand Meuse
Habitat template goal present strategy goal present strategy goal present strategy
Pioneer gravel bar 20ha 100% 100% 100ha 10% 100% 10ha 20% 40% Higher open gravel bar 10ha 100% 100% 150ha 10% 70% 30ha 10% 60%
Pioneer sand bar 5ha 20% 75% 25ha 5% 90% 20ha 0% 75% Higher vegetated bar 5ha 10% 30% 70ha 20% 80% 15ha 30% 100%
Wooded bar 5ha 10% 50% 30ha 5% 100% 50ha 10% 60%
Eroding bank 2ha 80% 100% 3ha 40% 60% 2ha 50% 50%
Steep bank 1ha 100% 100% 10ha 100% 100% 10ha 100% 100%
Levee bar 5ha 5% 40% 20ha 15% 100% 150 ha 10% 50%
Flood channel 20ha 20% 100% 120ha 10% 80% 400 ha 20% 80%
For the peak velocity, an optimum range of 24-28 was detected. The peak velocity is apart from flood protection measures (SPONGE measures especially), also influenced by weirs and dam control. Peak velocities that are too high endanger carabid communities on the banks, whereas low peak velocities can result in a lack of morphological activity on the banks. In the SPONGE strategy peak velocity is reduced. The peak velocity corresponds to the slope of the rising limb of the peak hydrograph, as can be seen in the SPONGE effect on the hydrograph (Peeters et al, 2001). In the RETENTION strategy as well, peak velocities are reduced, but only in the higher range of the peak hydrograph, from a certain level of higher discharges when the retention storage is active. Since for the INTERMEUSE evaluation the peak velocity is defined for the summer period (Jochems & van Looy, 2001), the lower peak discharges are envisaged, since the carabid communities are only influenced by these peaks. So,
RETENTION has no effect on this variable. SPONGE is effective during high and low discharges, and therefore of importance for the physical habitat integrity. For the SPONGE strategy, only a little impact on peak velocity is present (little impact on hydrograph, (Peeters et al, 2001)). The negative regression correlation of peak velocity to species richness leads to the conclusion that the SPONGE strategy has a positive effect on downstream habitat integrity. A more intensive sponge-scenario (in INTERMEUSE only three tributaries were included in SPONGE), might have an opposite effect, because of a more pronounced impact on peak velocity. Peak frequency (of middle range peaks) is a variable of hydro-morphological activity, which shows a positive correlation with community and species richness in the present situation. For indicator species, optimum values were in the maximum of 9. It should nevertheless not reach too high values, for too much disturbance endangers the communities. With the RETENTION strategy, the middle range of peak discharges could be collected in the retention basins. This would have a negative effect on community and habitat diversity (integrity). Natural fluctuation of the middle range of discharges is important for the riverbank communities. Negative impacts on the summer fluctuations by RETENTION measures (as well as weirs and damming) should be minimized. For the proposed measures in the RETENTION strategy (see par. 2.2), the reservoirs only function above the riverbank level and therefore have no effect at the location on the lower and middle range (summer) peaks. Even though there is no negative impact on the riverbank communities at the spot, downstream middle range peak frequency can be negatively influenced by these upstream measures. In the INTERMEUSE project, no quantitative predictions of these aspects were feasible, so no conclusions can be drawn yet. The width/depth-ratio also showed a correlation with species richness and habitat diversity. For the indicator species, the maximum values were the optimum. Positive responses were present for W/d ratio’s above 25. To reach this optimum, or to strive for it, an enlargement of the river bed, by bank lowering or river bed widening, is necessary. These measures are part of the WINTERBED strategy. The other two strategies have no impact on this variable. For the changes in the width/depth-ratio’s, the WINTERBED strategy is especially in the Common Meuse stretch well pronounced (performance from present to strategy for highly dynamic habitats is high). For all the pilots the WINTERBED strategy has clearly a positive effect on riverbank habitat diversity and habitat integrity.
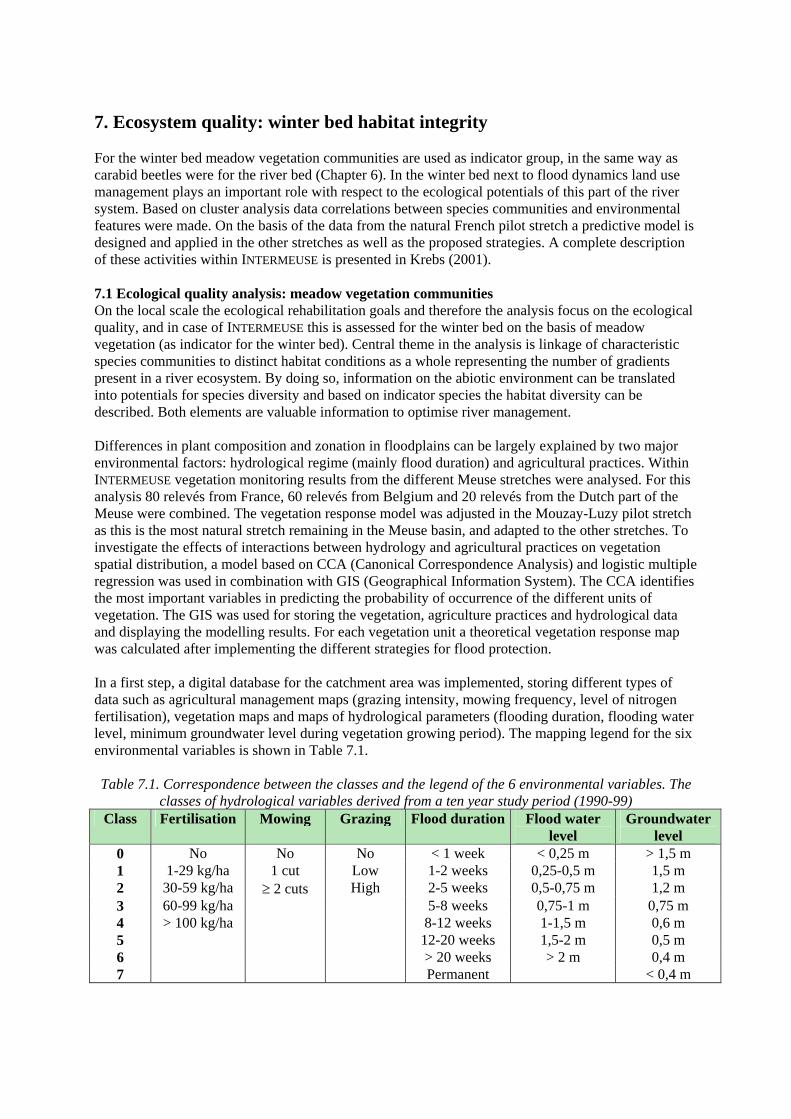
7. Ecosystem quality: winter bed habitat integrity For the winter bed meadow vegetation communities are used as indicator group, in the same way as carabid beetles were for the river bed (Chapter 6). In the winter bed next to flood dynamics land use management plays an important role with respect to the ecological potentials of this part of the river system. Based on cluster analysis data correlations between species communities and environmental features were made. On the basis of the data from the natural French pilot stretch a predictive model is designed and applied in the other stretches as well as the proposed strategies. A complete description of these activities within INTERMEUSE is presented in Krebs (2001). 7.1 Ecological quality analysis: meadow vegetation communities On the local scale the ecological rehabilitation goals and therefore the analysis focus on the ecological quality, and in case of INTERMEUSE this is assessed for the winter bed on the basis of meadow vegetation (as indicator for the winter bed). Central theme in the analysis is linkage of characteristic species communities to distinct habitat conditions as a whole representing the number of gradients present in a river ecosystem. By doing so, information on the abiotic environment can be translated into potentials for species diversity and based on indicator species the habitat diversity can be described. Both elements are valuable information to optimise river management. Differences in plant composition and zonation in floodplains can be largely explained by two major environmental factors: hydrological regime (mainly flood duration) and agricultural practices. Within INTERMEUSE vegetation monitoring results from the different Meuse stretches were analysed. For this analysis 80 relevés from France, 60 relevés from Belgium and 20 relevés from the Dutch part of the Meuse were combined. The vegetation response model was adjusted in the Mouzay-Luzy pilot stretch as this is the most natural stretch remaining in the Meuse basin, and adapted to the other stretches. To investigate the effects of interactions between hydrology and agricultural practices on vegetation spatial distribution, a model based on CCA (Canonical Correspondence Analysis) and logistic multiple regression was used in combination with GIS (Geographical Information System). The CCA identifies the most important variables in predicting the probability of occurrence of the different units of vegetation. The GIS was used for storing the vegetation, agriculture practices and hydrological data and displaying the modelling results. For each vegetation unit a theoretical vegetation response map was calculated after implementing the different strategies for flood protection. In a first step, a digital database for the catchment area was implemented, storing different types of data such as agricultural management maps (grazing intensity, mowing frequency, level of nitrogen fertilisation), vegetation maps and maps of hydrological parameters (flooding duration, flooding water level, minimum groundwater level during vegetation growing period). The mapping legend for the six environmental variables is shown in Table 7.1. Table 7.1. Correspondence between the classes and the legend of the 6 environmental variables. The
classes of hydrological variables derived from a ten year study period (1990-99) Class Fertilisation Mowing Grazing Flood duration Flood water
level Groundwater
level 0 No No No < 1 week < 0,25 m > 1,5 m 1 1-29 kg/ha 1 cut Low 1-2 weeks 0,25-0,5 m 1,5 m 2 30-59 kg/ha ≥ 2 cuts High 2-5 weeks 0,5-0,75 m 1,2 m 3 60-99 kg/ha 5-8 weeks 0,75-1 m 0,75 m 4 > 100 kg/ha 8-12 weeks 1-1,5 m 0,6 m 5 12-20 weeks 1,5-2 m 0,5 m 6 > 20 weeks > 2 m 0,4 m 7 Permanent < 0,4 m
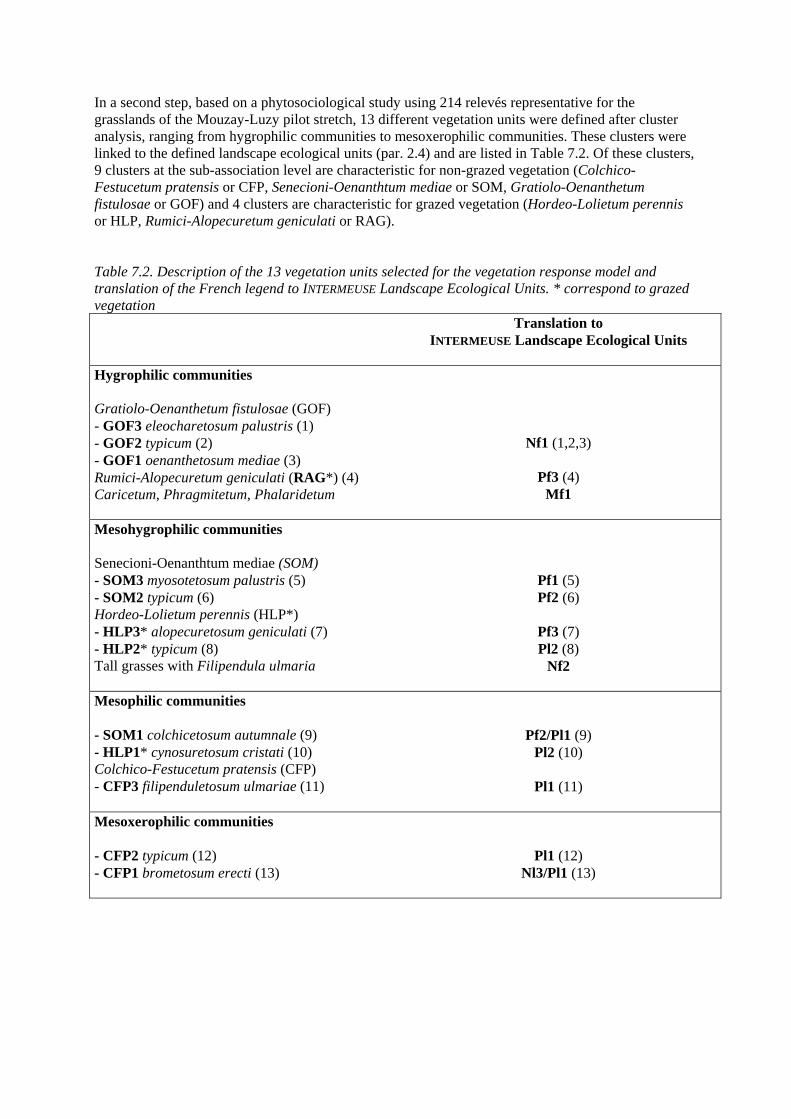
In a second step, based on a phytosociological study using 214 relevés representative for the grasslands of the Mouzay-Luzy pilot stretch, 13 different vegetation units were defined after cluster analysis, ranging from hygrophilic communities to mesoxerophilic communities. These clusters were linked to the defined landscape ecological units (par. 2.4) and are listed in Table 7.2. Of these clusters, 9 clusters at the sub-association level are characteristic for non-grazed vegetation (Colchico-Festucetum pratensis or CFP, Senecioni-Oenanthtum mediae or SOM, Gratiolo-Oenanthetum fistulosae or GOF) and 4 clusters are characteristic for grazed vegetation (Hordeo-Lolietum perennis or HLP, Rumici-Alopecuretum geniculati or RAG). Table 7.2. Description of the 13 vegetation units selected for the vegetation response model and translation of the French legend to INTERMEUSE Landscape Ecological Units. * correspond to grazed vegetation Translation to
INTERMEUSE Landscape Ecological Units
Hygrophilic communities Gratiolo-Oenanthetum fistulosae (GOF) - GOF3 eleocharetosum palustris (1) - GOF2 typicum (2) - GOF1 oenanthetosum mediae (3) Rumici-Alopecuretum geniculati (RAG*) (4) Caricetum, Phragmitetum, Phalaridetum
Nf1 (1,2,3)
Pf3 (4) Mf1
Mesohygrophilic communities Senecioni-Oenanthtum mediae (SOM) - SOM3 myosotetosum palustris (5) - SOM2 typicum (6) Hordeo-Lolietum perennis (HLP*) - HLP3* alopecuretosum geniculati (7) - HLP2* typicum (8) Tall grasses with Filipendula ulmaria
Pf1 (5) Pf2 (6)
Pf3 (7) Pl2 (8)
Nf2
Mesophilic communities - SOM1 colchicetosum autumnale (9) - HLP1* cynosuretosum cristati (10) Colchico-Festucetum pratensis (CFP) - CFP3 filipenduletosum ulmariae (11)
Pf2/Pl1 (9) Pl2 (10)
Pl1 (11)
Mesoxerophilic communities - CFP2 typicum (12) - CFP1 brometosum erecti (13)
Pl1 (12) Nl3/Pl1 (13)
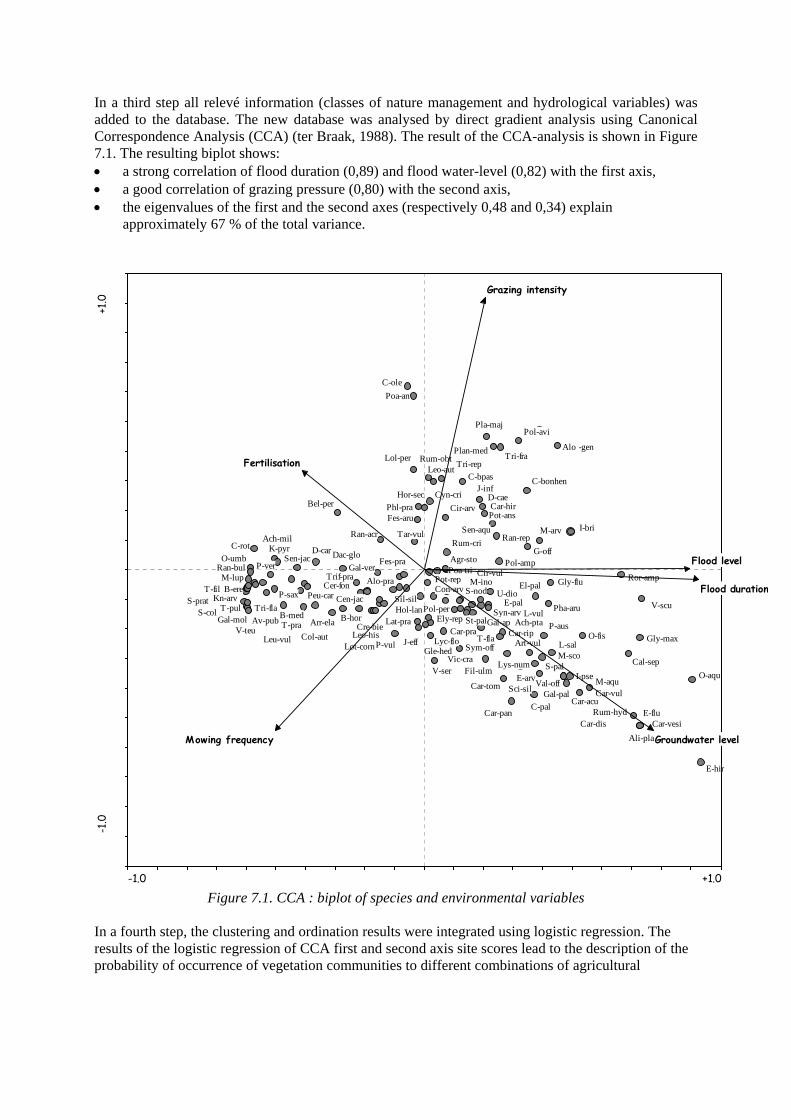
In a third step all relevé information (classes of nature management and hydrological variables) was added to the database. The new database was analysed by direct gradient analysis using Canonical Correspondence Analysis (CCA) (ter Braak, 1988). The result of the CCA-analysis is shown in Figure 7.1. The resulting biplot shows: • a strong correlation of flood duration (0,89) and flood water-level (0,82) with the first axis, • a good correlation of grazing pressure (0,80) with the second axis, • the eigenvalues of the first and the second axes (respectively 0,48 and 0,34) explain
approximately 67 % of the total variance.
E-hir
O-aqu
V-scu
Ali-plaCar-vesi
Gly-max
E-flu
Cal-sep
Ror-amp
T-pulS-col
V-teu
Kn-arv
Gal-mol
T-filS-prat
O-umbC-rot
B-ere
Rum-hyd
M-lup
O-fis
Tri-fla
Car-dis
Ran-bul
Ach-milI-bri
K-pyr
M-aqu
Car-acuCar-vul
I-pse
Av-pub
Alo -gen
P-ver
M-sco
Gly-flu
Sen-jac
Pha-aruB-med
P-ausT-pra
P-sax
S-pal
M-arv
Peu-car
Gal-pal
El-pal
E-arv
C-pal
Leu-vul
D-car
L-sal
G-off
C-bonhen
Val-off
Pol-avi
Col-aut
Car-pan
Bel-per
Lys-num
Arr-ela
Dac-glo
Sci-sil
Plan-med
Art-vul
Pol-amp
Sen-aqu
Tri-fra
Gal-ver
Pot-ans
Cer-fonU-dio
Ach-ptaL-vul
Pla-maj
Car-tom
Car-hirD-cae
T-fla
E-pal
Lot-corn
J-inf
Leo-hisCre-bie
Car-rip
Trif-pra
St-pal
Ran-repRan-acr
S-nod
B-hor
C-bpas
Syn-arvGal-ap
M-ino
Fil-ulm
P-vul
Fes-pra
Cen-jac
Rum-cri
Pol-per
O-sil
Ely-rep
Agr-sto
Cir-arv
Cir-vulAlo-pra
Sym-off
Tri-rep
Sil-sil
C-ole
Poa tri
V-ser
Poa-an
Lol-perLeo-aut
Tar-vul
Vic-cra
Lyc-flo
Fes-aru
Lat-pra
Hor-sec
Pot-rep
J-eff
Phl-pra
Car-pra
Rum-obt
Hol-lan
Con-arv
Gle-hed
Cyn-cri
-1.0 +1.0
Flood duration
Flood level
Groundwater levelMowing frequency
Fertilisation
Grazing intensity
+1.0
-1
.0
Figure 7.1. CCA : biplot of species and environmental variables In a fourth step, the clustering and ordination results were integrated using logistic regression. The results of the logistic regression of CCA first and second axis site scores lead to the description of the probability of occurrence of vegetation communities to different combinations of agricultural
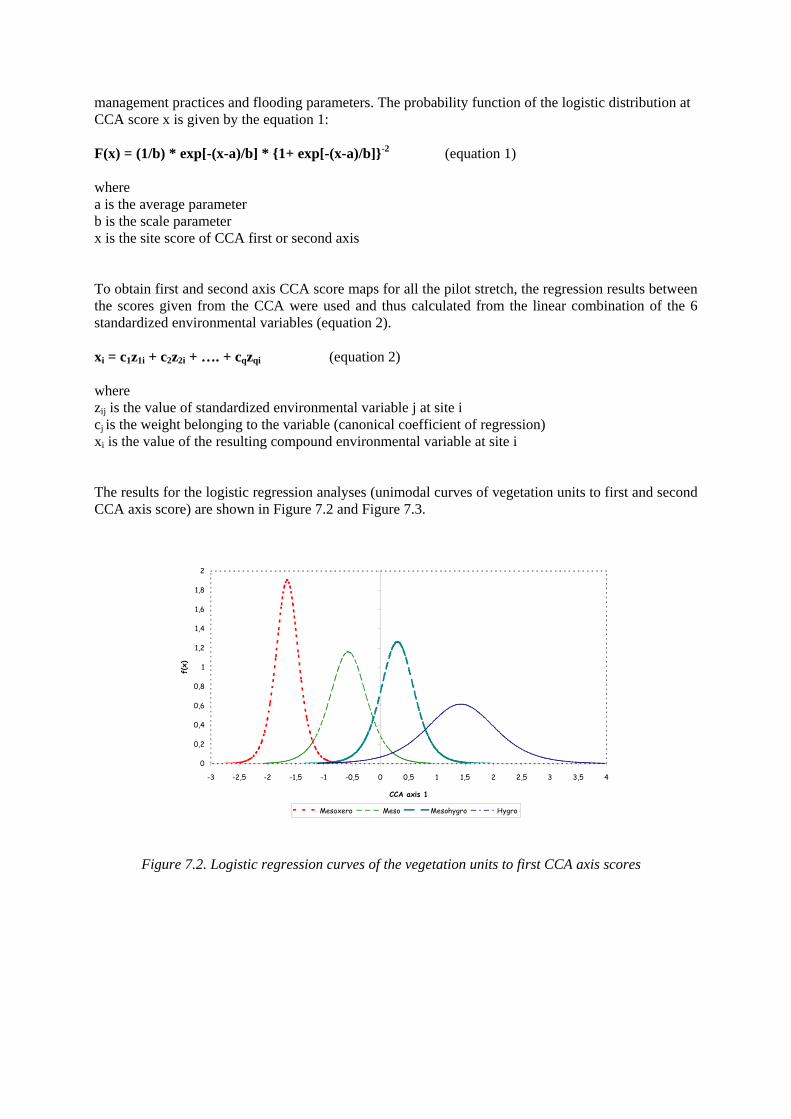
management practices and flooding parameters. The probability function of the logistic distribution at CCA score x is given by the equation 1: F(x) = (1/b) * exp[-(x-a)/b] * {1+ exp[-(x-a)/b]}-2
(equation 1) where a is the average parameter b is the scale parameter x is the site score of CCA first or second axis To obtain first and second axis CCA score maps for all the pilot stretch, the regression results between the scores given from the CCA were used and thus calculated from the linear combination of the 6 standardized environmental variables (equation 2). xi = c1z1i + c2z2i + …. + cqzqi (equation 2) where zij is the value of standardized environmental variable j at site i cj is the weight belonging to the variable (canonical coefficient of regression) xi is the value of the resulting compound environmental variable at site i The results for the logistic regression analyses (unimodal curves of vegetation units to first and second CCA axis score) are shown in Figure 7.2 and Figure 7.3.
0
0,2
0,4
0,6
0,8
1
1,2
1,4
1,6
1,8
2
-3 -2,5 -2 -1,5 -1 -0,5 0 0,5 1 1,5 2 2,5 3 3,5 4
CCA axis 1
f(x)
Mesoxero Meso Mesohygro Hygro
Figure 7.2. Logistic regression curves of the vegetation units to first CCA axis scores
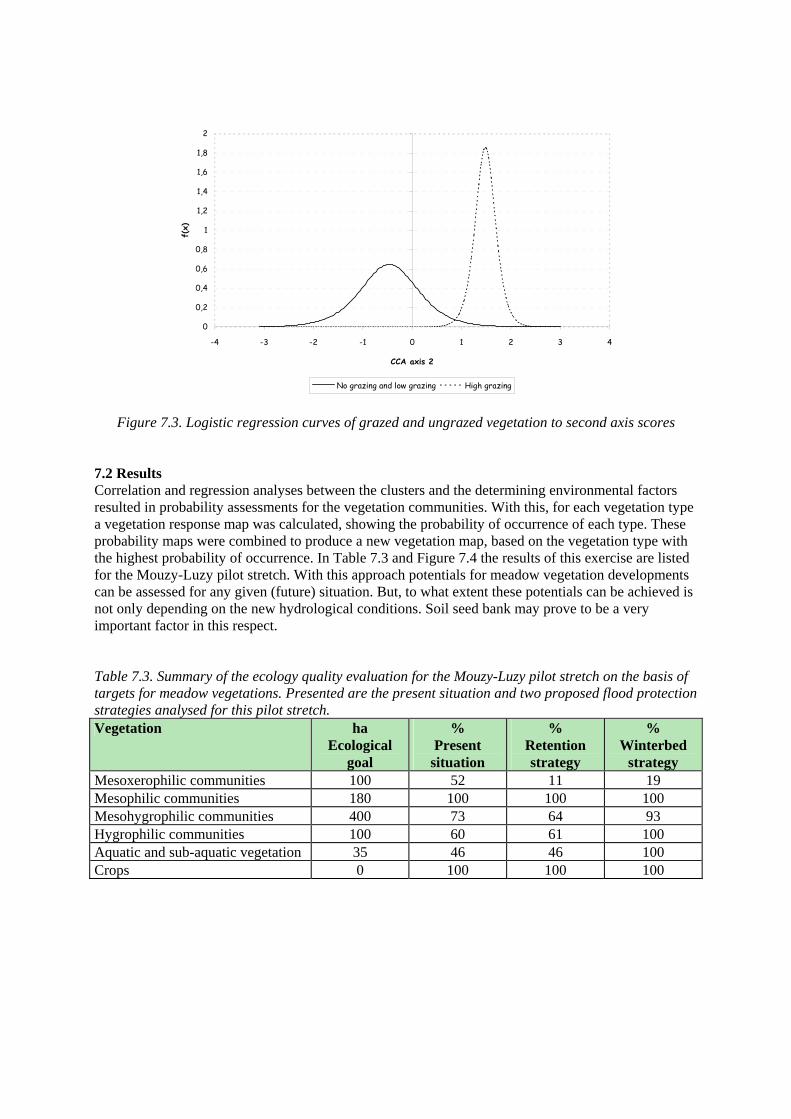
0
0,2
0,4
0,6
0,8
1
1,2
1,4
1,6
1,8
2
-4 -3 -2 -1 0 1 2 3 4
CCA axis 2
f(x)
No grazing and low grazing High grazing
Figure 7.3. Logistic regression curves of grazed and ungrazed vegetation to second axis scores 7.2 Results Correlation and regression analyses between the clusters and the determining environmental factors resulted in probability assessments for the vegetation communities. With this, for each vegetation type a vegetation response map was calculated, showing the probability of occurrence of each type. These probability maps were combined to produce a new vegetation map, based on the vegetation type with the highest probability of occurrence. In Table 7.3 and Figure 7.4 the results of this exercise are listed for the Mouzy-Luzy pilot stretch. With this approach potentials for meadow vegetation developments can be assessed for any given (future) situation. But, to what extent these potentials can be achieved is not only depending on the new hydrological conditions. Soil seed bank may prove to be a very important factor in this respect. Table 7.3. Summary of the ecology quality evaluation for the Mouzy-Luzy pilot stretch on the basis of targets for meadow vegetations. Presented are the present situation and two proposed flood protection strategies analysed for this pilot stretch. Vegetation ha
Ecological goal
% Present
situation
% Retention strategy
% Winterbed
strategy Mesoxerophilic communities 100 52 11 19 Mesophilic communities 180 100 100 100 Mesohygrophilic communities 400 73 64 93 Hygrophilic communities 100 60 61 100 Aquatic and sub-aquatic vegetation 35 46 46 100 Crops 0 100 100 100
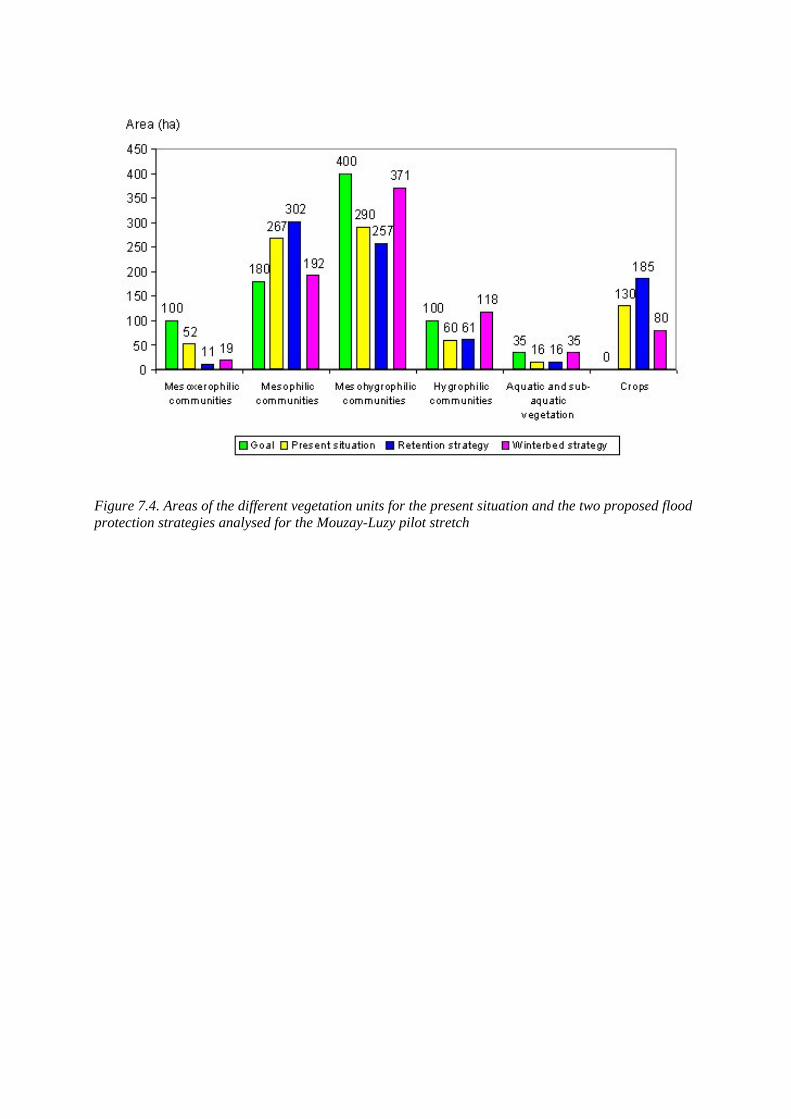
Figure 7.4. Areas of the different vegetation units for the present situation and the two proposed flood protection strategies analysed for the Mouzay-Luzy pilot stretch
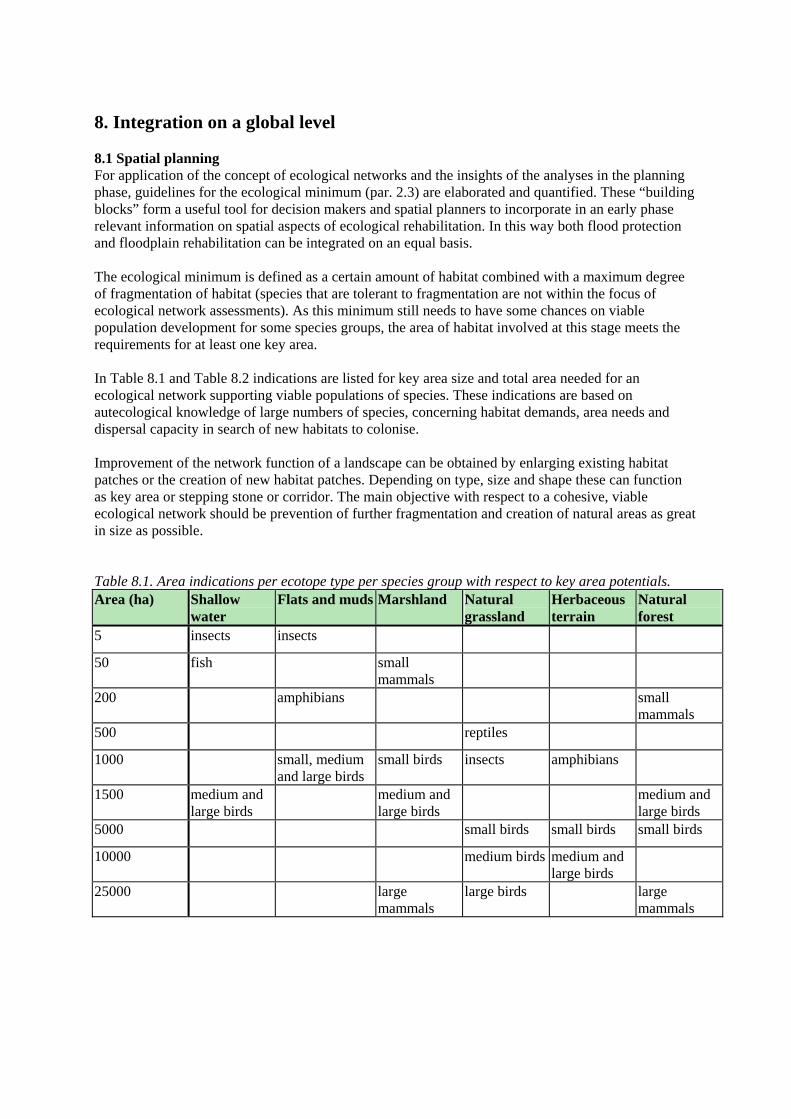
8. Integration on a global level 8.1 Spatial planning For application of the concept of ecological networks and the insights of the analyses in the planning phase, guidelines for the ecological minimum (par. 2.3) are elaborated and quantified. These “building blocks” form a useful tool for decision makers and spatial planners to incorporate in an early phase relevant information on spatial aspects of ecological rehabilitation. In this way both flood protection and floodplain rehabilitation can be integrated on an equal basis. The ecological minimum is defined as a certain amount of habitat combined with a maximum degree of fragmentation of habitat (species that are tolerant to fragmentation are not within the focus of ecological network assessments). As this minimum still needs to have some chances on viable population development for some species groups, the area of habitat involved at this stage meets the requirements for at least one key area. In Table 8.1 and Table 8.2 indications are listed for key area size and total area needed for an ecological network supporting viable populations of species. These indications are based on autecological knowledge of large numbers of species, concerning habitat demands, area needs and dispersal capacity in search of new habitats to colonise. Improvement of the network function of a landscape can be obtained by enlarging existing habitat patches or the creation of new habitat patches. Depending on type, size and shape these can function as key area or stepping stone or corridor. The main objective with respect to a cohesive, viable ecological network should be prevention of further fragmentation and creation of natural areas as great in size as possible. Table 8.1. Area indications per ecotope type per species group with respect to key area potentials. Area (ha) Shallow
water Flats and muds Marshland Natural
grassland Herbaceous terrain
Natural forest
5 insects insects
50 fish small mammals
200 amphibians small mammals
500 reptiles
1000 small, medium and large birds
small birds insects amphibians
1500 medium and large birds
medium and large birds
medium and large birds
5000 small birds small birds small birds
10000 medium birds medium and large birds
25000 large mammals
large birds large mammals
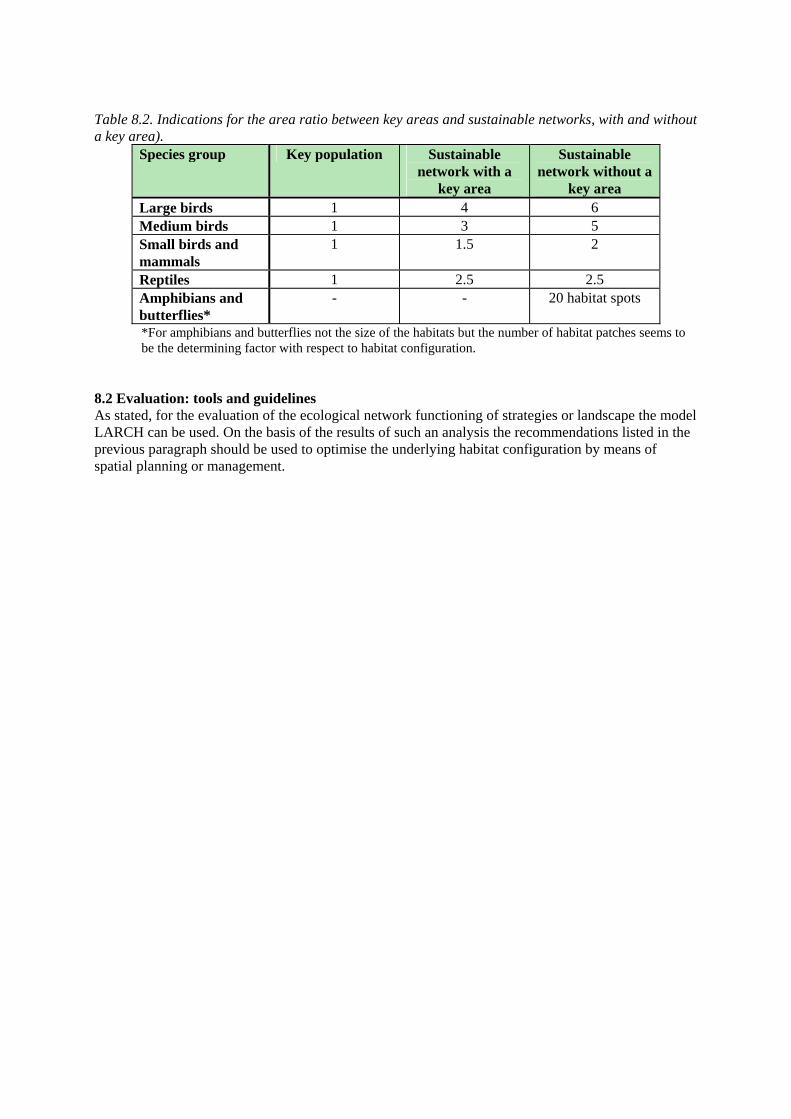
Table 8.2. Indications for the area ratio between key areas and sustainable networks, with and without a key area).
Species group Key population Sustainable network with a
key area
Sustainable network without a
key area Large birds 1 4 6 Medium birds 1 3 5 Small birds and mammals
1 1.5 2
Reptiles 1 2.5 2.5 Amphibians and butterflies*
- - 20 habitat spots
*For amphibians and butterflies not the size of the habitats but the number of habitat patches seems to be the determining factor with respect to habitat configuration.
8.2 Evaluation: tools and guidelines As stated, for the evaluation of the ecological network functioning of strategies or landscape the model LARCH can be used. On the basis of the results of such an analysis the recommendations listed in the previous paragraph should be used to optimise the underlying habitat configuration by means of spatial planning or management.
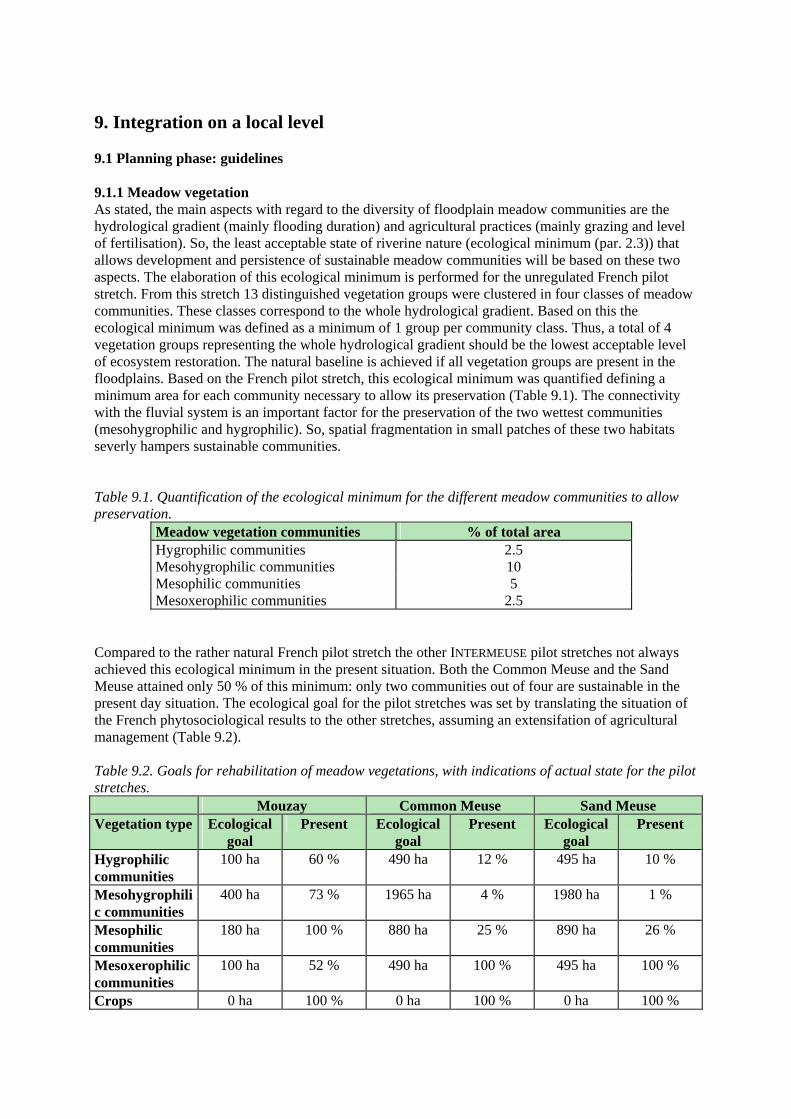
9. Integration on a local level 9.1 Planning phase: guidelines 9.1.1 Meadow vegetation As stated, the main aspects with regard to the diversity of floodplain meadow communities are the hydrological gradient (mainly flooding duration) and agricultural practices (mainly grazing and level of fertilisation). So, the least acceptable state of riverine nature (ecological minimum (par. 2.3)) that allows development and persistence of sustainable meadow communities will be based on these two aspects. The elaboration of this ecological minimum is performed for the unregulated French pilot stretch. From this stretch 13 distinguished vegetation groups were clustered in four classes of meadow communities. These classes correspond to the whole hydrological gradient. Based on this the ecological minimum was defined as a minimum of 1 group per community class. Thus, a total of 4 vegetation groups representing the whole hydrological gradient should be the lowest acceptable level of ecosystem restoration. The natural baseline is achieved if all vegetation groups are present in the floodplains. Based on the French pilot stretch, this ecological minimum was quantified defining a minimum area for each community necessary to allow its preservation (Table 9.1). The connectivity with the fluvial system is an important factor for the preservation of the two wettest communities (mesohygrophilic and hygrophilic). So, spatial fragmentation in small patches of these two habitats severly hampers sustainable communities. Table 9.1. Quantification of the ecological minimum for the different meadow communities to allow preservation.
Meadow vegetation communities % of total area Hygrophilic communities 2.5 Mesohygrophilic communities 10 Mesophilic communities 5 Mesoxerophilic communities 2.5
Compared to the rather natural French pilot stretch the other INTERMEUSE pilot stretches not always achieved this ecological minimum in the present situation. Both the Common Meuse and the Sand Meuse attained only 50 % of this minimum: only two communities out of four are sustainable in the present day situation. The ecological goal for the pilot stretches was set by translating the situation of the French phytosociological results to the other stretches, assuming an extensifation of agricultural management (Table 9.2). Table 9.2. Goals for rehabilitation of meadow vegetations, with indications of actual state for the pilot stretches. Mouzay Common Meuse Sand Meuse Vegetation type Ecological
goal Present Ecological
goal Present Ecological
goal Present
Hygrophilic communities
100 ha 60 % 490 ha 12 % 495 ha 10 %
Mesohygrophilic communities
400 ha 73 % 1965 ha 4 % 1980 ha 1 %
Mesophilic communities
180 ha 100 % 880 ha 25 % 890 ha 26 %
Mesoxerophilic communities
100 ha 52 % 490 ha 100 % 495 ha 100 %
Crops 0 ha 100 % 0 ha 100 % 0 ha 100 %
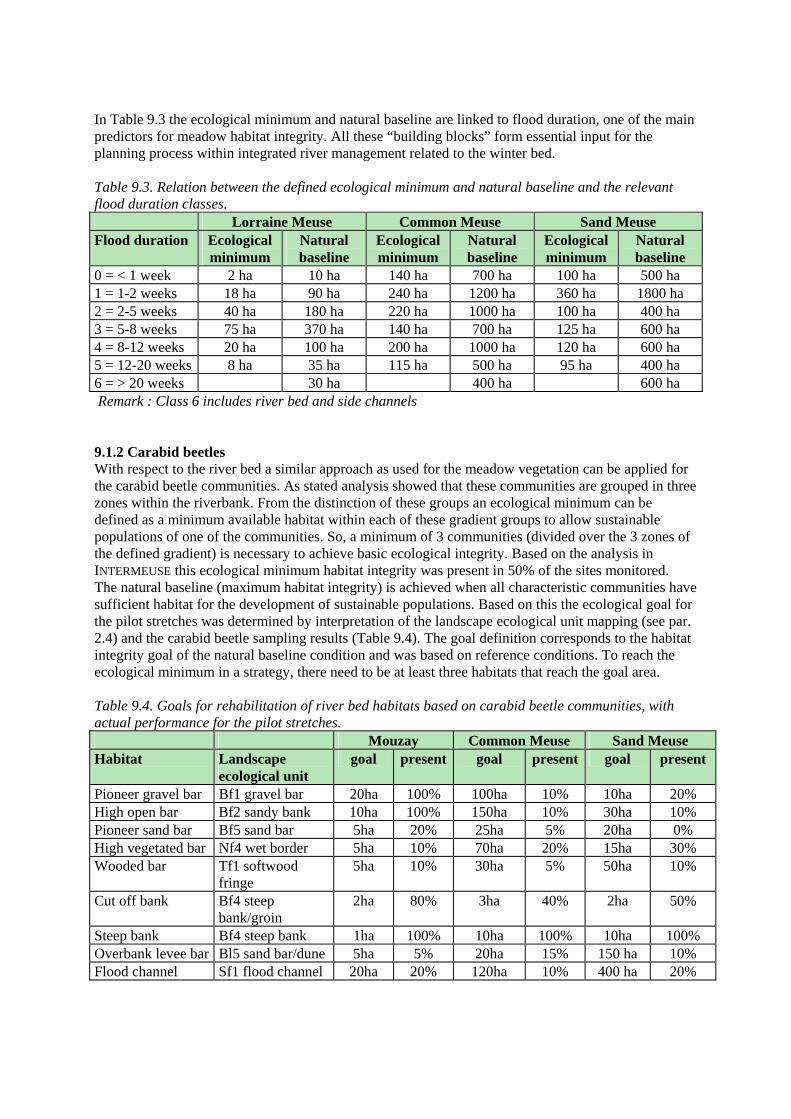
In Table 9.3 the ecological minimum and natural baseline are linked to flood duration, one of the main predictors for meadow habitat integrity. All these “building blocks” form essential input for the planning process within integrated river management related to the winter bed. Table 9.3. Relation between the defined ecological minimum and natural baseline and the relevant flood duration classes. Lorraine Meuse Common Meuse Sand Meuse Flood duration Ecological
minimum Natural baseline
Ecological minimum
Natural baseline
Ecological minimum
Natural baseline
0 = < 1 week 2 ha 10 ha 140 ha 700 ha 100 ha 500 ha 1 = 1-2 weeks 18 ha 90 ha 240 ha 1200 ha 360 ha 1800 ha 2 = 2-5 weeks 40 ha 180 ha 220 ha 1000 ha 100 ha 400 ha 3 = 5-8 weeks 75 ha 370 ha 140 ha 700 ha 125 ha 600 ha 4 = 8-12 weeks 20 ha 100 ha 200 ha 1000 ha 120 ha 600 ha 5 = 12-20 weeks 8 ha 35 ha 115 ha 500 ha 95 ha 400 ha 6 = > 20 weeks 30 ha 400 ha 600 ha Remark : Class 6 includes river bed and side channels 9.1.2 Carabid beetles With respect to the river bed a similar approach as used for the meadow vegetation can be applied for the carabid beetle communities. As stated analysis showed that these communities are grouped in three zones within the riverbank. From the distinction of these groups an ecological minimum can be defined as a minimum available habitat within each of these gradient groups to allow sustainable populations of one of the communities. So, a minimum of 3 communities (divided over the 3 zones of the defined gradient) is necessary to achieve basic ecological integrity. Based on the analysis in INTERMEUSE this ecological minimum habitat integrity was present in 50% of the sites monitored. The natural baseline (maximum habitat integrity) is achieved when all characteristic communities have sufficient habitat for the development of sustainable populations. Based on this the ecological goal for the pilot stretches was determined by interpretation of the landscape ecological unit mapping (see par. 2.4) and the carabid beetle sampling results (Table 9.4). The goal definition corresponds to the habitat integrity goal of the natural baseline condition and was based on reference conditions. To reach the ecological minimum in a strategy, there need to be at least three habitats that reach the goal area. Table 9.4. Goals for rehabilitation of river bed habitats based on carabid beetle communities, with actual performance for the pilot stretches. Mouzay Common Meuse Sand Meuse Habitat Landscape
ecological unit goal present goal present goal present
Pioneer gravel bar Bf1 gravel bar 20ha 100% 100ha 10% 10ha 20% High open bar Bf2 sandy bank 10ha 100% 150ha 10% 30ha 10% Pioneer sand bar Bf5 sand bar 5ha 20% 25ha 5% 20ha 0% High vegetated bar Nf4 wet border 5ha 10% 70ha 20% 15ha 30% Wooded bar Tf1 softwood
fringe 5ha 10% 30ha 5% 50ha 10%
Cut off bank Bf4 steep bank/groin
2ha 80% 3ha 40% 2ha 50%
Steep bank Bf4 steep bank 1ha 100% 10ha 100% 10ha 100% Overbank levee bar Bl5 sand bar/dune 5ha 5% 20ha 15% 150 ha 10% Flood channel Sf1 flood channel 20ha 20% 120ha 10% 400 ha 20%
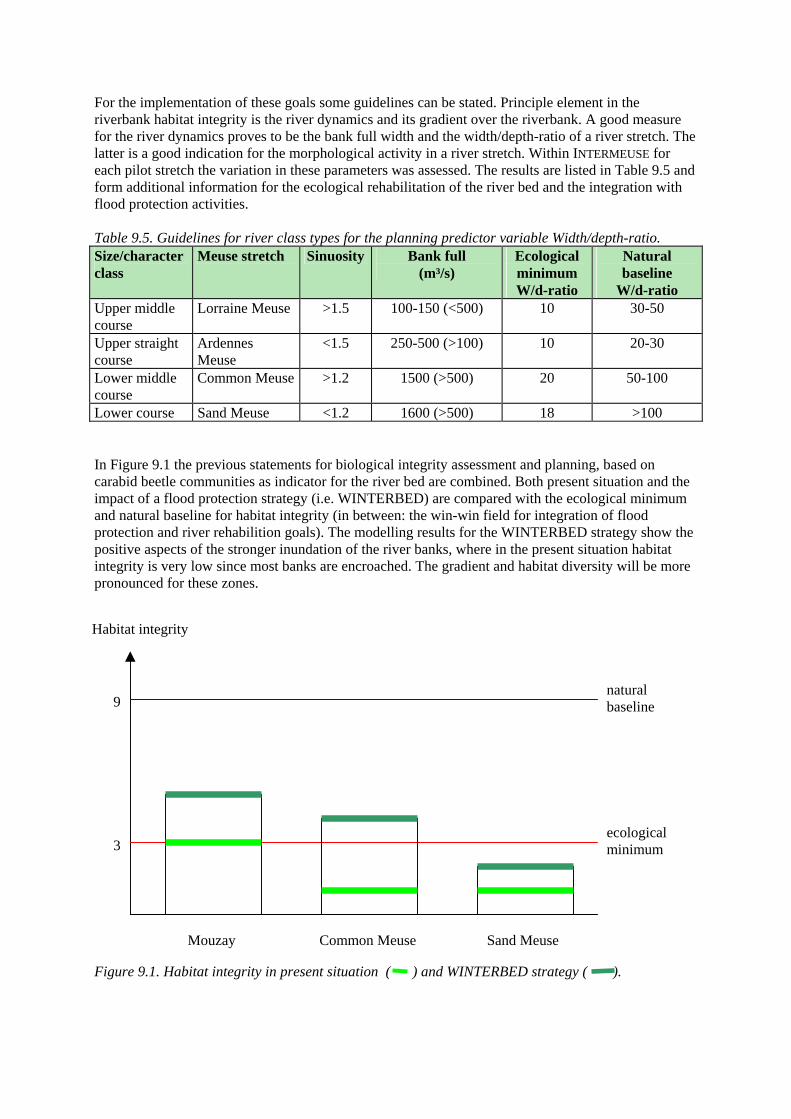
For the implementation of these goals some guidelines can be stated. Principle element in the riverbank habitat integrity is the river dynamics and its gradient over the riverbank. A good measure for the river dynamics proves to be the bank full width and the width/depth-ratio of a river stretch. The latter is a good indication for the morphological activity in a river stretch. Within INTERMEUSE for each pilot stretch the variation in these parameters was assessed. The results are listed in Table 9.5 and form additional information for the ecological rehabilitation of the river bed and the integration with flood protection activities. Table 9.5. Guidelines for river class types for the planning predictor variable Width/depth-ratio. Size/character class
Meuse stretch Sinuosity Bank full (m³/s)
Ecological minimum W/d-ratio
Natural baseline
W/d-ratio Upper middle course
Lorraine Meuse >1.5 100-150 (<500) 10 30-50
Upper straight course
Ardennes Meuse
<1.5 250-500 (>100) 10 20-30
Lower middle course
Common Meuse >1.2 1500 (>500) 20 50-100
Lower course Sand Meuse <1.2 1600 (>500) 18 >100 In Figure 9.1 the previous statements for biological integrity assessment and planning, based on carabid beetle communities as indicator for the river bed are combined. Both present situation and the impact of a flood protection strategy (i.e. WINTERBED) are compared with the ecological minimum and natural baseline for habitat integrity (in between: the win-win field for integration of flood protection and river rehabilition goals). The modelling results for the WINTERBED strategy show the positive aspects of the stronger inundation of the river banks, where in the present situation habitat integrity is very low since most banks are encroached. The gradient and habitat diversity will be more pronounced for these zones. Habitat integrity Figure 9.1. Habitat integrity in present situation ( ) and WINTERBED strategy ( ).
ecological minimum
Mouzay Common Meuse Sand Meuse
natural baseline 9
3

9.2 Evaluation The information presented in the previous paragraphs can be used in both the planning and evaluation phase: first as guidelines and target settings, second as a reference to validate assessment results and subsequent optimalisation activities. However, one should keep in mind that some quantifications only apply on the Meuse basin or even the situations used in INTERMEUSE. The concept however, especially the introduction of the ecological minimum, natural baseline and subsequent ecological goals can be applied in river basins everywhere. Based on field data and subsequent statistical analysis relations between biological and environmental features can be established to quantify the conceptual elements.
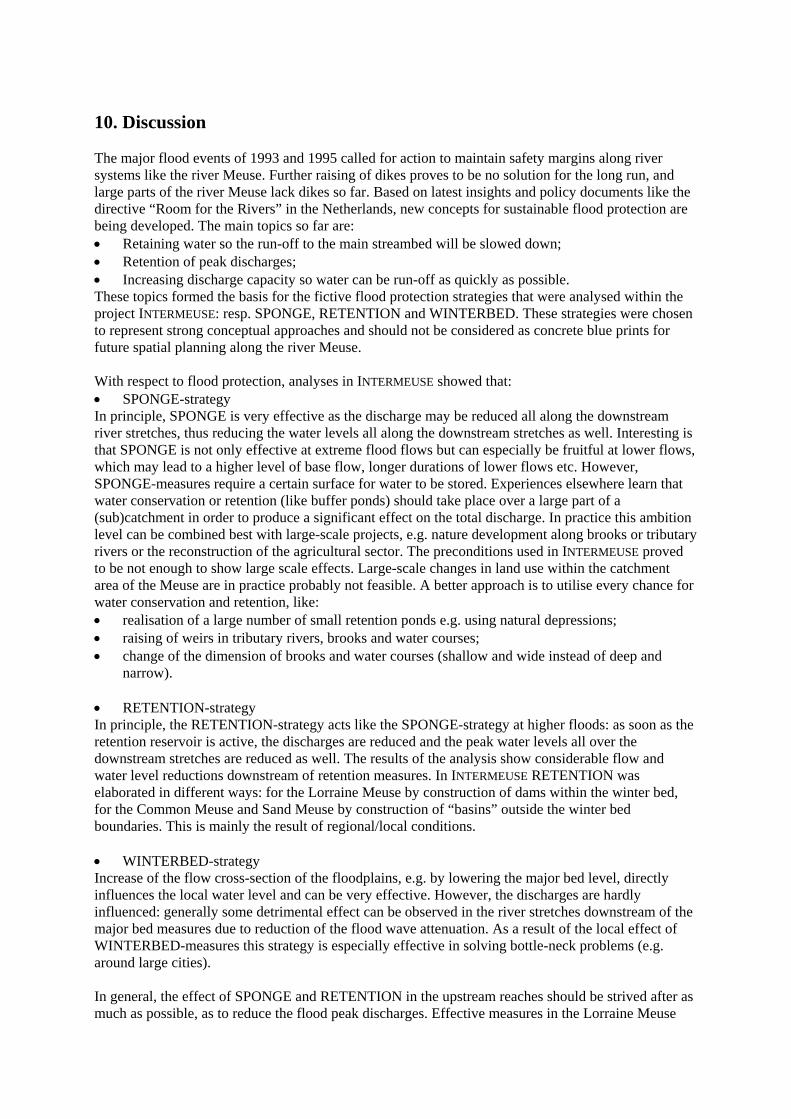
10. Discussion The major flood events of 1993 and 1995 called for action to maintain safety margins along river systems like the river Meuse. Further raising of dikes proves to be no solution for the long run, and large parts of the river Meuse lack dikes so far. Based on latest insights and policy documents like the directive “Room for the Rivers” in the Netherlands, new concepts for sustainable flood protection are being developed. The main topics so far are: • Retaining water so the run-off to the main streambed will be slowed down; • Retention of peak discharges; • Increasing discharge capacity so water can be run-off as quickly as possible. These topics formed the basis for the fictive flood protection strategies that were analysed within the project INTERMEUSE: resp. SPONGE, RETENTION and WINTERBED. These strategies were chosen to represent strong conceptual approaches and should not be considered as concrete blue prints for future spatial planning along the river Meuse. With respect to flood protection, analyses in INTERMEUSE showed that: • SPONGE-strategy In principle, SPONGE is very effective as the discharge may be reduced all along the downstream river stretches, thus reducing the water levels all along the downstream stretches as well. Interesting is that SPONGE is not only effective at extreme flood flows but can especially be fruitful at lower flows, which may lead to a higher level of base flow, longer durations of lower flows etc. However, SPONGE-measures require a certain surface for water to be stored. Experiences elsewhere learn that water conservation or retention (like buffer ponds) should take place over a large part of a (sub)catchment in order to produce a significant effect on the total discharge. In practice this ambition level can be combined best with large-scale projects, e.g. nature development along brooks or tributary rivers or the reconstruction of the agricultural sector. The preconditions used in INTERMEUSE proved to be not enough to show large scale effects. Large-scale changes in land use within the catchment area of the Meuse are in practice probably not feasible. A better approach is to utilise every chance for water conservation and retention, like: • realisation of a large number of small retention ponds e.g. using natural depressions; • raising of weirs in tributary rivers, brooks and water courses; • change of the dimension of brooks and water courses (shallow and wide instead of deep and
narrow). • RETENTION-strategy In principle, the RETENTION-strategy acts like the SPONGE-strategy at higher floods: as soon as the retention reservoir is active, the discharges are reduced and the peak water levels all over the downstream stretches are reduced as well. The results of the analysis show considerable flow and water level reductions downstream of retention measures. In INTERMEUSE RETENTION was elaborated in different ways: for the Lorraine Meuse by construction of dams within the winter bed, for the Common Meuse and Sand Meuse by construction of “basins” outside the winter bed boundaries. This is mainly the result of regional/local conditions. • WINTERBED-strategy Increase of the flow cross-section of the floodplains, e.g. by lowering the major bed level, directly influences the local water level and can be very effective. However, the discharges are hardly influenced: generally some detrimental effect can be observed in the river stretches downstream of the major bed measures due to reduction of the flood wave attenuation. As a result of the local effect of WINTERBED-measures this strategy is especially effective in solving bottle-neck problems (e.g. around large cities). In general, the effect of SPONGE and RETENTION in the upstream reaches should be strived after as much as possible, as to reduce the flood peak discharges. Effective measures in the Lorraine Meuse
are indispensable for reducing flood risk in the Ardennes region. The most effective local measures, especially in the Common and Sand Meuse, however still focus on increase of the major bed cross-section. Integration of flood protection and river rehabilitation In view of the aim of INTERMEUSE, the analysis for changed hydrodynamic conditions resulting from the proposed flood protection strategies formed a prerequisite for the ecological effect assessment and subsequent integration of flood protection and ecological river rehabilitation. The concept of integrated river management implies that the new flood protection concepts should focus on prevention of further deterioration of natural features as well and preferably lead to chances for rehabilitation of lost natural elements. The new EU Water Framework Directive will surely support this combination. The main objective of INTERMEUSE was to elaborate a method to support this integration. This was elaborated for two scale levels: for the whole river basin in a global way, and for specific stretches or local sites in more detail. For both scale levels results of the analysis show that flood protection measures can be beneficial for nature rehabilitation aspects as well. This is elaborated in conceptual approaches and practical guidelines. Integration on a global scale Important elements for both flood protection and river rehabilitation on the scale of a river basin are spatial aspects like size and cohesion between sites. Integration on the global level therefore focussed on the spatial aspects. The habitat configuration resulting from flood protection strategies was analysed for its ecological network functioning: the degree in which a configuration of habitat enables species to develop viable populations. The performed analyses in INTERMEUSE showed that for the development of persistent populations of species depending on typical river-bound habitats, the WINTERBED-strategy has the most obvious positive effects, especially in the Upper Meuse and in the Lower Meuse. However, since there are little possibilities to change the small winter bed in the Ardennes Meuse, this stretch appears to be a natural bottleneck for the migration and dispersal of species. Regulation of the river will however enhance this situation. The intention should be the creation of small stepping-stones wherever possible in this stretch. In general it is stated that, on the basis of the concept of ecological networks, given a certain situation ecological rehabilitation of river ecosystems should focus on enlargement of habitat prior to optimising habitat connectivity. One substantial area is better than a number of tiny spots (amongst others due to larger impact of interference with surroundings, disturbance etc.). Application of the formulated guidelines requires knowledge on the nature targets that are to be achieved with ecological rehabilitation of river ecosystems. These can be based on existing nature values that need to be preserved and/or strengthened, or on the degree to which natural processes are still operative (or can be made operative in the process of rehabilitation). Most important processes are hydro- and morphodynamics, as these are the driving forces for habitat development and diversity. These processes embody the characteristics of a certain river(stretch). This emphasises the statement that the distinguished scale levels, each having its own value within the river management process, are strongly interrelated. The influence of river dynamical processes is the most distinct on the local scale level. Integration on a local scale As mentioned above, important elements for both flood protection and river rehabilitation on a local scale (e.g. floodplain) are the river dynamical processes and the degree in which they still can influence the riverine landscape. In this respect gradients play an important role and as such are strongly linked to dimensions of management measures. In case of INTERMEUSE, this part of the analyses focussed on meadow vegetation and carabid beetles as indicators for habitat integrity for respectively winter bed and river bed. Floral and faunal communities in river systems are strongly related to river dynamical processes for the development of habitat diversity (as prerequisite for
species diversity). As such there is a direct link to the type and dimensions of possible flood protection measures. The general guideline for embedding riverine habitats in the flood protection measures, refers to the bed form and the gradients present in the river system. As river bed and winter bed are separate parts within the hydrodynamical gradient, conclusions to the impact of certain flood protection measures can differ. In natural river stretches this distinction between river bed and winter bed is of no importance. However, in regulated stretches this may lead to conflicts: favouring dynamic river bed habitats by lowering of floodplains or widening of the river bed can have negative effects on the less dynamic winter bed habitats. The decision how to decide in such matters can and will not be addressed here, as in practice mostly other factors or functions are involved. But the presented toolboxes and guidelines can play a role in this decision making process. With respect to the river bed, analysis of the flood protection strategies used in INTERMEUSE lead to the following statements: • SPONGE measures can best be situated adjacent to the actual river bed. Even in small upstream
parts of tributaries modified bank structures can already improve the water retention capacity considerably. Implementation of SPONGE at these sites also has a positive effect on the development of natural bank forms and the desired habitat integrity. Secondly, SPONGE measures may have, to a certain level, a positive effect downstream: peak velocities nowadays are way above the natural conditions. Yet, a too strong decrease in peak fluxes would have a negative effect on the morphological processes necessary for the habitat integrity.
• Depending on the type of RETENTION measure the same recommendations as made for SPONGE are in place: the inclusion of riverbanks in the measures can result in an increase of habitat integrity. The effect of peak reduction should be focussed on the highest and lowest peaks. In these ranges the distortion of natural flow regime is the most pronounced. The peak frequency of the intermediate range of peak fluxes is responsible for the morphological activity and as such for the development of the characteristic river bank habitats.
• WINTERBED measures should be planned in a integrated manner: the combination of bed widening, bank lowering and flood channel restoration, restores the dynamic gradient in the riverbank zone and is therefore beneficial for the overall habitat integrity. The choice for only one of the measures (e.g. bank lowering) will resort effect in only one of the riverbank gradient zones and as such is not in line with the proposed interpretation of the ecological minimum (par. 9.1.2).
For the habitat integrity of the winter bed the same statements are applicable to a large extent. However, based on the meadow vegetation analyses another general remark needs to be made. The integration of flood protection and river rehabilitation is a good approach in strongly regulated river stretches. As this is the case in large parts of NW-European rivers this integration can lead to multi-beneficial solutions in river management. However, in natural river stretches any change in abiotic conditions resulting from a flood protection measure can lead to serious impacts on existing natural values. This brings up the question of how to combine flood protection strategies and quality preservation of natural ecosystems? In these river stretches focus is on nature preservation and less on rehabilitation. Based on the analyses for the Mouzay pilot stretch, which can be characterised as a natural river stretch, it is stated that flood protection measures should be promoted preferably in more degraded areas as rehabilitation of lost values after implementation may never result in the natural baseline which is available now. The guidelines and toolboxes presented by INTERMEUSE can be very useful in both the planning process and evaluation. Other IRMA/SPONGE projects that surely have an additional value in this respect are the projects “BIOSAFE” (Nooij et al, 2001), which deals with policy and legislation based impact assessment of flood protection measures on biodiversity in floodplains, and additional guidelines for the ecologically sound embedding of flood protection measures with respect to physical habitat integrity as stated in the project “Guidelines for rehabilitation of floodplains” (Wolters et al, 2001) and the project “Living with floods” (Vis et al, 2001). As absolute figures may not be applicable

in other situations, the indicative value is important as well. In any case with the IRMA/SPONGE project INTERMEUSE, a first attempt was made for a new integrative concept with respect to flood protection and floodplain rehabilitation, together with guidelines and tools for implementation. With the description of the ecological minimum and natural baseline the field of integration is made clear. The results of the analyses of the fictive flood protection strategies can be helpful in the elaboration of more concrete scenario’s which will be combinations of the proposed fictive strategies. On this basis combinations can be made that incorporate the good elements of the different strategies in such a comprehensive way that the total scenario is better than the sum of the individual measures. Hopefully this will contribute to the translation of the theoretically defined win-win opportunities between flood protection and river rehabilitation into daily practice. Of course, not all questions of the daily practice can be met, but together with other tools (both existing and in development) the toolbox for integrated water management is getting more and more complete.
11. Conclusions and recommendations Conclusions • Integration of flood protection goals and river rehabilitation goals can well be established. In
regulated river systems flood protection measures can have a positive effect on achieving river rehabilitation goals. In natural river stretches combinations may be less favourable as nature preservation can be a major goal.
• As flood protection strategy SPONGE and RETENTION should be implemented as much as
possible in the upstream reaches of a river basin, as to reduce the flood peak discharges. WINTERBED-measures, that increase discharge capacity, are the most effective on a local basis.
• On a global level river rehabilitation should focus on enlargement of habitats and the creation of
cohesive networks of habitats. On a local level the focus should be on the habitat diversity linked to gradients in the river system.
• Development of persistent populations of key species depending on typical river-bound habitats
is served the best with the WINTERBED-strategy, especially in the Upper Meuse and in the Lower Meuse. The SPONGE-strategy especially improves the situation for wetland species. The RETENTION-strategy might improve the situation for marshland species with large home range (e.g. Bittern). Considerable areas of habitat are developed under this strategy.
• Based on the network analysis the Ardennes Meuse seems to be a natural bottle neck, due the
physical characteristics of this river stretch. However, river regulation will have enhanced this situation. With the creation of stepping stones this situation can strongly be improved.
• In the current situation the Dutch meadow vegetations are poorly developed and intensively used
by agriculture. Restoration of the hydrological gradient would result in an increase in moist and wet meadows. This implies a change in land use and consequently an increase of meadow biodiversity. However, the restoration of meadow vegetations in such heavily regulated river stretches might be hampered by the lack of an effective soil seed bank. This was not studied in INTERMEUSE.
• Win-win situations for flood protection and floodplain rehabilitation are theoretically possible. In
practice the involved costs may pose the major problem for actual implementation. Recommendations • The analysis in INTERMEUSE revealed that hydraulic modelling is not fully equipped for the
questions resulting from the integration of flood protection and river rehabilitation. This is the result of the focus on high flood events, little interaction with ecologists on hydraulic boundary conditions for ecological functioning, different scale levels (time and space) etc.. In the future this problem should be solved to make integrated river management applicable in daily practice.
• In this study existing data and studies were used as much as possible. Sometimes this resulted in
non-compatible datasets. Due to the time and capacity in this project it was not possible to solve these problems in a proper way. In most cases pragmatic solutions were used. Compatibility of data sets remains a point of attention.
• The analysis of the new abiotic situation on a global level was performed in a qualitative way,
due to the lack of sufficient good data for the whole Meuse basin. However, if data are available it should be possible to perform a quantitative analysis (see remarks in Peeters et al, 2001).

• The value of the promising evaluation method developed here should be tested in other river systems and with more complete data.
• Co-operation between institutes from different countries is very informative and inspiring.
However, in many cases requests for data, information etc. were obstructed by unwilling parties of which some are stakeholders. To increase the potentials of co-operation, it is crucial to pay due attention to obtaining commitment of stakeholders.
Literature BCEOM, 2000. Etude de modélisation des crues de la Meuse. EPAMA. Berger, H.E.J., 1992. Flow forecasting for the river Meuse. Thesis, TU Delft. Boer, D. de, 1992. Vegetaties in het oevermilieu van de Grensmaas. I Veldopnamen en verwerking
van gegevens. Report of the project “Ecological Rehabilitation of the River Meuse”. EHM nr. 4-1992. Institute for Inland Water Management and Waste water Treatment (RIZA) and Directorate Limburg (in Dutch, summary in English and French).
Chardon, J.P., R.P.B. Foppen & N. Geilen, 2000. LARCH-RIVER, a method to assess the functioning
of rivers as ecological networks. European Water Management 3 (6): 35-43. European Topic Center on Land Cover, 1997. CORINE Land Cover. European Topic Centre on Land
Cover, Sweden. Foppen, R., N. Geilen & Th. van der Sluis, 1999. Towards a coherent habitat network for the Rhine.
IBN-DLO, RIZA. IBN-research report 99/1. ISSN 0928-6896. Grevilliot, F. & S. Muller, 1997. Les phytocenoses prairiales et palustres de la plaine alluviale de la
Meuse française. Relations avec les facteurs ecologiques et agronomiques. Application à la cartographie des ecotopes. Workshop Maas Ecotopenkaart / Carte des Ecotopes de la Meuse, Liège 23 - 25 april 1997.
Geilen, N., 1994. Ontwikkelingsmogelijkheden voor zachthoutooibos in het zomerbed van de
Grensmaas. Report of the project “Ecological Rehabilitation of the River Meuse”. EHM nr. 26-1994. Institute for Inland Water Management and Waste water Treatment (RIZA) and Directorate Limburg (in Dutch, summary in English and French).
Haselen, C.O.G. van, 1995. Sedimentatie van zwevende stof in het zomer- en winterbed van de Maas
tussen Eijsden en Keizersveer. HKV, 2000. Verkenning Verruiming Maas, deel 1: hoofdrapport. VVM-rapport no. 5. IKSR, 1998. Flood Action Plan Rhine. IKSR, Koblenz. Jochems, H. & K. van Looy, 2001. Method and instruments for physical habitat evaluation in spatial
planning alternatives, based on carabid beetle communities. Intermeuse-report No. 7 Krebs, L., 2001. Development and testing of methods and instruments on analysing floodplain
vegetation dynamics. Intermeuse-report No. 6 Levins, R. 1970. Extinction. In: M. Gerstenhaber (ed.). Some mathematical problems in biology.
American Mathematical Society, Providence: 77-107.
Nooij, R.J.W. de, D. Alard, G. de Blust, N. Geilen, B. Goldschmidt,. V. Huesing, H.J.R. Lenders, R.S.E.W. Leuven, K. Lotterman, S. Muller, P.H. Nienhuis and I. Poudevigne, 2001. Development and application of BIO-SAFE, a policy and legislation based model for the assessment of impacts of flood prevention measures on biodiversity in river basins. NCR publication 11-2001.
Pedroli, B. & A. de Leeuw, 1997. The Meuse, artery of nature? Draft of a systems description. WLO- congress “Landscape-Ecology, things to do”. Amsterdam, 6 – 10 October 1997. Workshop 1 “Meuse, artery of nature” Maastricht, 7 – 9 October 1997. Delft Hydraulics.
Peeters, H., O. Scholl & G.J. Akkerman, 2001. Determination of the modified abiotic situation in the
Meuse Basin after flood protection measures. Intermeuse-report No. 5. Royal Haskoning ordered by RIZA. In commission of IRMA, part of IRMA/SPONGE and governed by NCR.
Petts, G.E., I. Maddock, M. Bickerton & A.J.D. Ferguson, 1995. Linking hydrology and ecology: the
scientific basis for river management. In: The ecological basis for river management. Eds. D.M. Harper & A.J.D. Ferguson. Wiley & Sons.
Rademakers, J.G.M. & H.P. Wolfert, 1994. Het Rivier-Ecotopen-Stelsel. Publications and reports of
the project “Ecological Rehabilitation of the rivers Rhine and Meuse” No. 61-1994. RIZA, Lelystad.
Sluis, Th. van der, & J.P. Chardon, 2001. How to define European ecological networks. Proceedings
Ecosystems and Sustainable Development ECOSUD III, Alicante, Spain. Ed. Y. Villacampa, C.A. Brebbia, J-L. Usó, pp. 119-128, Wessex Institute of Technology, Southampton, UK.
Sluis, T. van der, S.A.M. van Rooij & N. Geilen, 2001. Meuse-Econet, ecological networks
in flood protection scenario’s: a case study for the Meuse. Intermeuse-report No. 8 Ter Braak, C.J.F. 1988. CANOCO- a fortran program for canonical community ordination by (partial)
(detrended)(canonical) correspondance analysis, principal components and redundancy analysis (version 2.1). Updated in 1990 (version 3.1). Agricultural Mathematics Group, Ministry of Agriculture and Fisheries, Wageningen, The Netherlands.
Vis, M., F. Klijn & M. van Buuren, 2001. Living with floods: resilience strategies for flood
management and multiple land use in the river Rhine basin. NCR-publ. 10-2001. WHM, 1998. Flood Action Plan Meuse. WHM, Namur. Wolters, H.A., M. Platteeuw & M.M. Schoor, 2001. Guidelines for rehabilitation of floodplains,
ecology and safety combined. NCR-publ. 09-2001.

Glossary Ecological network: a series of physically separated habitat patches for a population of a
particular species or a set of species with similar requirements that exchanges individuals by dispersal.
Ecological profile: An ecological profile is defined by dispersal capacity and area requirements of a species. Each ecological profile represents a range of species with similar traits (dispersal capacity and area requirements) that can occur in a landscape. Viability standards for an ecological profile are derived from standards of a representative species which belongs to this ecological profile.
Ecotope: a physically limited landscape ecological unit, whose composition and development are determined by abiotic, biotic and anthropogenic aspects. Ecotopes are more or less homogeneous units on the scale of the landscape, identifiable by their similarities and differences in geomorphologic and hydrological characteristics and characterised by a vegetation structure that is linked to the mentioned abiotic conditions in combination with land use.
Carrying capacity: the maximum population of a species that a specific ecosystem can support indefinitely without deterioration of the character and quality of the resource, i.e., vegetation or soil.
Key population: a relatively large, local population in a network, which is persistent under the condition of one immigrant per generation.
Key patch: a patch with a carrying capacity large enough to sustain a key population. Local population: small population of at least one pair, in one habitat patch, or more habitat patches
within the home-range of a species. A local population on its own is not large enough to be sustainable.
Metapopulation: a set of populations in a habitat network, connected by inter-patch dispersal. Minimum viable population (MVP): a population with a probability of 95% to survive 100
years under the assumption of zero immigration. Viable population: a population with a probability of at least 95% to survive 100 years. Ecological minimum: Critical boundary or minimum level of habitat conditions for a potentially good
ecological functioning.

Annexes
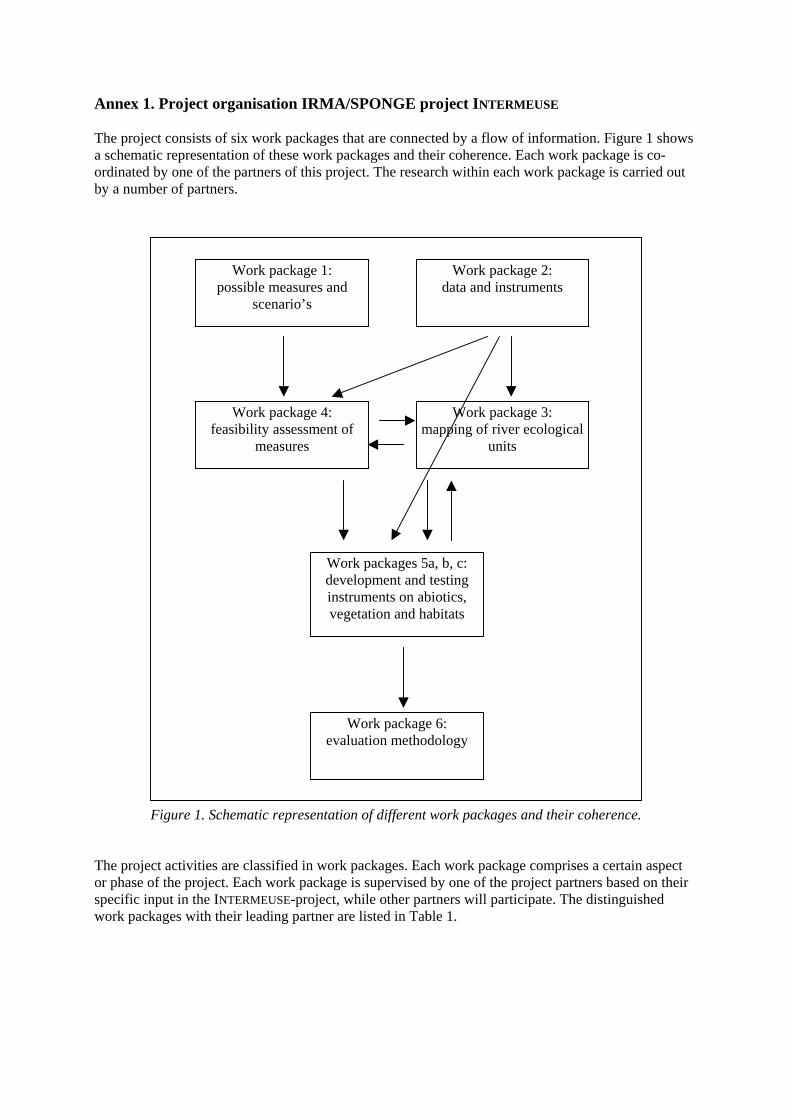
Annex 1. Project organisation IRMA/SPONGE project INTERMEUSE The project consists of six work packages that are connected by a flow of information. Figure 1 shows a schematic representation of these work packages and their coherence. Each work package is co-ordinated by one of the partners of this project. The research within each work package is carried out by a number of partners.
Work package 1: possible measures and
scenario’s
Work package 2: data and instruments
Work package 3: mapping of river ecological
units
Work package 4: feasibility assessment of
measures
Work packages 5a, b, c: development and testing instruments on abiotics, vegetation and habitats
Work package 6: evaluation methodology
Figure 1. Schematic representation of different work packages and their coherence. The project activities are classified in work packages. Each work package comprises a certain aspect or phase of the project. Each work package is supervised by one of the project partners based on their specific input in the INTERMEUSE-project, while other partners will participate. The distinguished work packages with their leading partner are listed in Table 1.
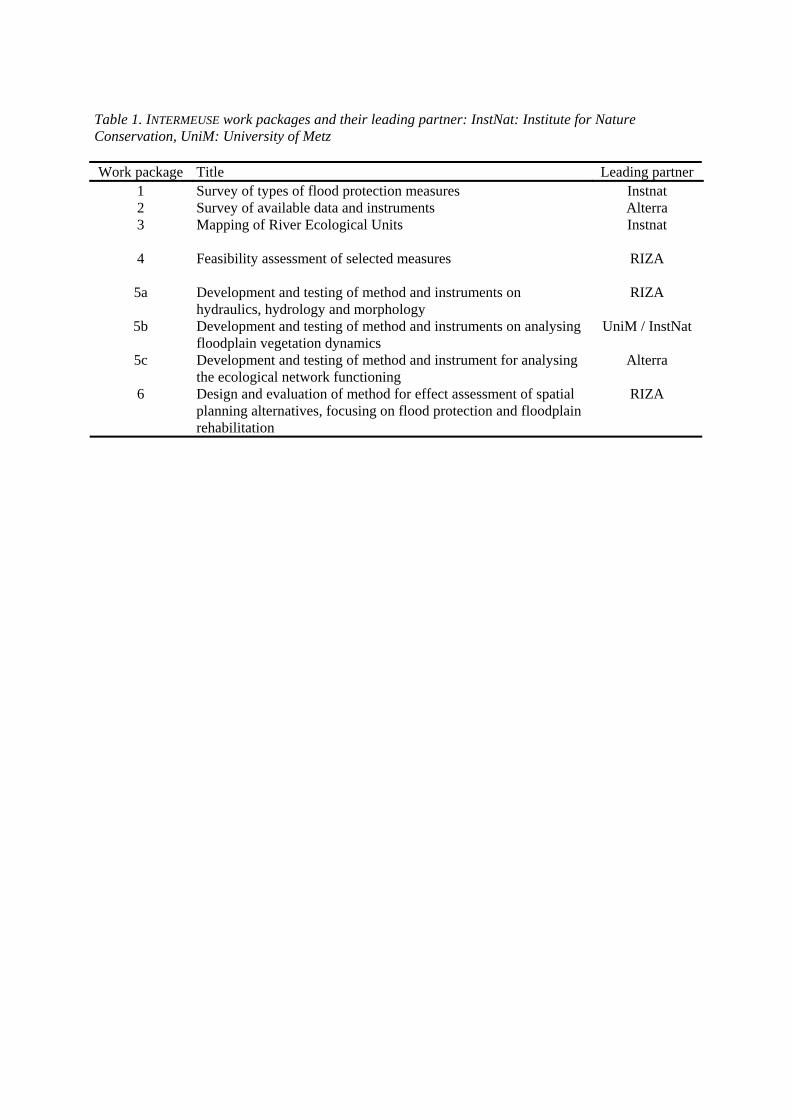
Table 1. INTERMEUSE work packages and their leading partner: InstNat: Institute for Nature Conservation, UniM: University of Metz Work package Title Leading partner
1 Survey of types of flood protection measures Instnat 2 Survey of available data and instruments Alterra 3 Mapping of River Ecological Units
Instnat
4 Feasibility assessment of selected measures
RIZA
5a Development and testing of method and instruments on hydraulics, hydrology and morphology
RIZA
5b Development and testing of method and instruments on analysing floodplain vegetation dynamics
UniM / InstNat
5c Development and testing of method and instrument for analysing the ecological network functioning
Alterra
6 Design and evaluation of method for effect assessment of spatial planning alternatives, focusing on flood protection and floodplain rehabilitation
RIZA
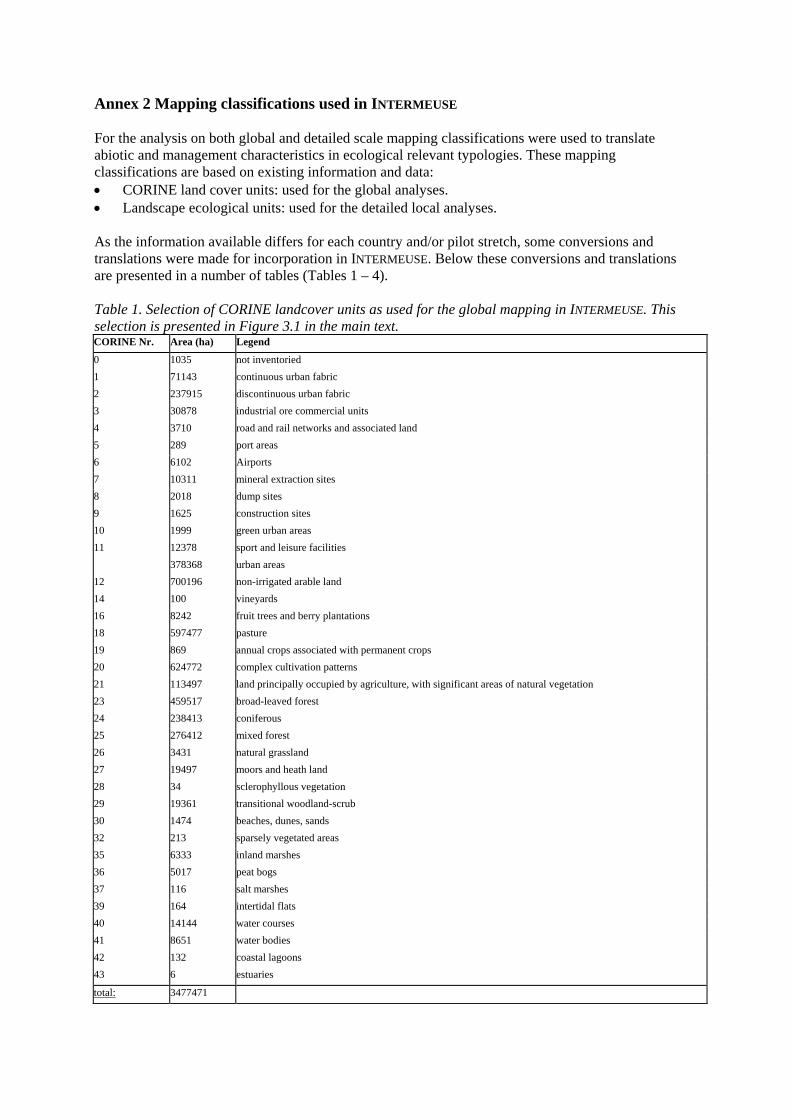
Annex 2 Mapping classifications used in INTERMEUSE For the analysis on both global and detailed scale mapping classifications were used to translate abiotic and management characteristics in ecological relevant typologies. These mapping classifications are based on existing information and data: • CORINE land cover units: used for the global analyses. • Landscape ecological units: used for the detailed local analyses. As the information available differs for each country and/or pilot stretch, some conversions and translations were made for incorporation in INTERMEUSE. Below these conversions and translations are presented in a number of tables (Tables 1 – 4). Table 1. Selection of CORINE landcover units as used for the global mapping in INTERMEUSE. This selection is presented in Figure 3.1 in the main text. CORINE Nr. Area (ha) Legend
0 1035 not inventoried 1 71143 continuous urban fabric 2 237915 discontinuous urban fabric 3 30878 industrial ore commercial units 4 3710 road and rail networks and associated land 5 289 port areas 6 6102 Airports 7 10311 mineral extraction sites 8 2018 dump sites 9 1625 construction sites 10 1999 green urban areas 11 12378 sport and leisure facilities 378368 urban areas 12 700196 non-irrigated arable land 14 100 vineyards 16 8242 fruit trees and berry plantations 18 597477 pasture 19 869 annual crops associated with permanent crops 20 624772 complex cultivation patterns 21 113497 land principally occupied by agriculture, with significant areas of natural vegetation 23 459517 broad-leaved forest 24 238413 coniferous 25 276412 mixed forest 26 3431 natural grassland 27 19497 moors and heath land 28 34 sclerophyllous vegetation 29 19361 transitional woodland-scrub 30 1474 beaches, dunes, sands 32 213 sparsely vegetated areas 35 6333 inland marshes 36 5017 peat bogs 37 116 salt marshes 39 164 intertidal flats 40 14144 water courses 41 8651 water bodies 42 132 coastal lagoons 43 6 estuaries
total: 3477471
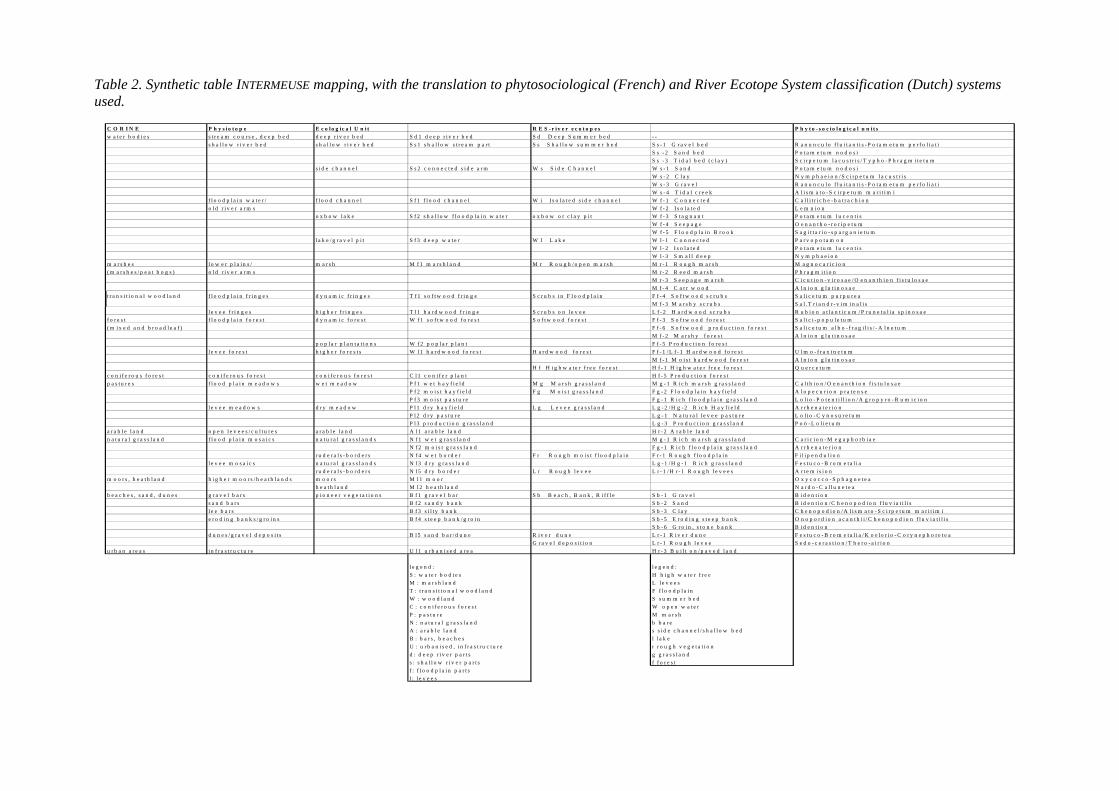
Table 2. Synthetic table INTERMEUSE mapping, with the translation to phytosociological (French) and River Ecotope System classification (Dutch) systems used.
C O R I N E P h y s i o t o p e E c o lo g i c a l U n i t R E S - r i v e r e c o t o p e s P h y t o - s o c io l o g i c a l u n i t sw a t e r b o d i e s s t r e a m c o u r s e , d e e p b e d d e e p r i v e r b e d S d 1 d e e p r i v e r b e d S d D e e p S u m m e r b e d - -
s h a l l o w r i v e r b e d s h a l l o w r i v e r b e d S s 1 s h a l l o w s t r e a m p a r t S s S h a l l o w s u m m e r b e d S s - 1 G r a v e l b e d R a n u n c u l o f l u i t a n t i s - P o t a m e t u m p e r f o l i a t iS s - 2 S a n d b e d P o t a m e t u m n o d o s iS s - 3 T i d a l b e d ( c l a y ) S c i r p e t u m l a c u s t r i s / T y p h o - P h r a g m i t e t u m
s i d e c h a n n e l S s 2 c o n n e c t e d s i d e a r m W s S i d e C h a n n e l W s - 1 S a n d P o t a m e t u m n o d o s iW s - 2 C l a y N y m p h a e i o n / S c i r p e t u m l a c u s t r i sW s - 3 G r a v e l R a n u n c u l o f l u i t a n t i s - P o t a m e t u m p e r f o l i a t iW s - 4 T i d a l c r e e k A l i s m a t o - S c i r p e t u m m a r i t i m i
f l o o d p l a i n w a t e r / f l o o d c h a n n e l S f 1 f l o o d c h a n n e l W i I s o l a t e d s i d e c h a n n e l W f - 1 C o n n e c t e d C a l l i t r i c h e - b a t r a c h i o no l d r i v e r a r m s W f - 2 I s o l a t e d L e m n i o n
o x b o w l a k e S f 2 s h a l l o w f l o o d p l a i n w a t e r o x b o w o r c l a y p i t W f - 3 S t a g n a n t P o t a m e t u m l u c e n t i sW f - 4 S e e p a g e O e n a n t h o - r o r i p e t u mW f - 5 F l o o d p l a i n B r o o k S a g i t t a r i o - s p a r g a n i e t u m
l a k e / g r a v e l p i t S f 3 d e e p w a t e r W l L a k e W l - 1 C o n n e c t e d P a r v o p o t a m o nW l - 2 I s o l a t e d P o t a m e t u m l u c e n t i sW l - 3 S m a l l d e e p N y m p h a e i o n
m a r s h e s l o w e r p l a i n s / m a r s h M f 1 m a r s h l a n d M r R o u g h / o p e n m a r s h M r - 1 R o u g h m a r s h M a g n o c a r i c i o n( m a r s h e s / p e a t b o g s ) o l d r i v e r a r m s M r - 2 R e e d m a r s h P h r a g m i t i o n
M r - 3 S e e p a g e m a r s h C i c u t i o n - v i r o s a e / O e n a n t h i o n f i s t u l o s a eM f - 4 C a r r w o o d A l n i o n g l u t i n o s a e
t r a n s i t i o n a l w o o d l a n d f l o o d p l a i n f r i n g e s d y n a m i c f r i n g e s T f 1 s o f t w o o d f r i n g e S c r u b s i n F l o o d p l a i n F f - 4 S o f t w o o d s c r u b s S a l i c e t u m p u r p u r e aM f - 3 M a r s h y s c r u b s S a l . T r i a n d r - v i m i n a l i s
l e v e e f r i n g e s h i g h e r f r i n g e s T l 1 h a r d w o o d f r i n g e S c r u b s o n l e v e e L f - 2 H a r d w o o d s c r u b s R u b i o n a t l a n t i c u m / P r u n e t a l i a s p i n o s a ef o r e s t f l o o d p l a i n f o r e s t d y n a m i c f o r e s t W f 1 s o f t w o o d f o r e s t S o f t w o o d f o r e s t F f - 3 S o f t w o o d f o r e s t S a l i c i - p o p u l e t u m( m i x e d a n d b r o a d l e a f ) F f - 6 S o f t w o o d p r o d u c t i o n f o r e s t S a l i c e t u m a l b o - f r a g i l i s / - A l n e t u m
M f - 2 M a r s h y f o r e s t A l n i o n g l u t i n o s a ep o p l a r p l a n t a t i o n s W f 2 p o p l a r p l a n t F f - 5 P r o d u c t i o n f o r e s t
l e v e e f o r e s t h i g h e r f o r e s t s W l 1 h a r d w o o d f o r e s t H a r d w o o d f o r e s t F f - 1 / L f - 1 H a r d w o o d f o r e s t U l m o - f r a x i n e t u mM f - 1 M o i s t h a r d w o o d f o r e s t A l n i o n g l u t i n o s a e
H f H i g h w a t e r f r e e f o r e s t H f - 1 H i g h w a t e r f r e e f o r e s t Q u e r c e t u mc o n i f e r o u s f o r e s t c o n i f e r o u s f o r e s t c o n i f e r o u s f o r e s t C l 1 c o n i f e r p l a n t H f - 5 P r o d u c t i o n f o r e s tp a s t u r e s f l o o d p l a i n m e a d o w s w e t m e a d o w P f 1 w e t h a y f i e l d M g M a r s h g r a s s l a n d M g - 1 R i c h m a r s h g r a s s l a n d C a l t h i o n / O e n a n t h i o n f i s t u l o s a e
P f 2 m o i s t h a y f i e l d F g M o i s t g r a s s l a n d F g - 2 F l o o d p l a i n h a y f i e l d A l o p e c u r i o n p r a t e n s eP f 3 m o i s t p a s t u r e F g - 1 R i c h f l o o d p l a i n g r a s s l a n d L o l i o - P o t e n t i l l i o n / A g r o p y r o - R u m i c i o n
l e v e e m e a d o w s d r y m e a d o w P l 1 d r y h a y f i e l d L g L e v e e g r a s s l a n d L g - 2 / H g - 2 R i c h H a y f i e l d A r r h e n a t e r i o nP l 2 d r y p a s t u r e L g - 1 N a t u r a l l e v e e p a s t u r e L o l i o - C y n o s u r e t u mP l 3 p r o d u c t i o n g r a s s l a n d L g - 3 P r o d u c t i o n g r a s s l a n d P o ö - L o l i e t u m
a r a b l e l a n d o p e n l e v e e s / c u l t u r e s a r a b l e l a n d A l 1 a r a b l e l a n d H r - 2 A r a b l e l a n dn a t u r a l g r a s s l a n d f l o o d p l a i n m o s a i c s n a t u r a l g r a s s l a n d s N f 1 w e t g r a s s l a n d M g - 1 R i c h m a r s h g r a s s l a n d C a r i c i o n - M e g a p h o r b i a e
N f 2 m o i s t g r a s s l a n d F g - 1 R i c h f l o o d p l a i n g r a s s l a n d A r r h e n a t e r i o nr u d e r a l s - b o r d e r s N f 4 w e t b o r d e r F r R o u g h m o i s t f l o o d p l a i n F r - 1 R o u g h f l o o d p l a i n F i l i p e n d u l i o n
l e v e e m o s a i c s n a t u r a l g r a s s l a n d s N l 3 d r y g r a s s l a n d L g - 1 / H g - 1 R i c h g r a s s l a n d F e s t u c o - B r o m e t a l i ar u d e r a l s - b o r d e r s N l 5 d r y b o r d e r L r R o u g h l e v e e L r - 1 / H r - 1 R o u g h l e v e e s A r t e m i s i o n
m o o r s , h e a t h l a n d h i g h e r m o o r s / h e a t h l a n d s m o o r s M l 1 m o o r O x y c o c c o - S p h a g n e t e ah e a t h l a n d M l 2 h e a t h l a n d N a r d o - C a l l u n e t e a
b e a c h e s , s a n d , d u n e s g r a v e l b a r s p i o n e e r v e g e t a t i o n s B f 1 g r a v e l b a r S b B e a c h , B a n k , R i f f l e S b - 1 G r a v e l B i d e n t i o ns a n d b a r s B f 2 s a n d y b a n k S b - 2 S a n d B i d e n t i o n / C h e n o p o d i o n f l u v i a t i l i sl e e b a r s B f 3 s i l t y b a n k S b - 3 C l a y C h e n o p o d i o n / A l i s m a t o - S c i r p e t u m m a r i t i m ie r o d i n g b a n k s / g r o i n s B f 4 s t e e p b a n k / g r o i n S b - 5 E r o d i n g s t e e p b a n k O n o p o r d i o n a c a n t h i i / C h e n o p o d i o n f l u v i a t i l i s
S b - 6 G r o i n , s t o n e b a n k B i d e n t i o nd u n e s / g r a v e l d e p o s i t s B l 5 s a n d b a r / d u n e R i v e r d u n e L r - 1 R i v e r d u n e F e s t u c o - B r o m e t a l i a / K o e l e r i o - C o r y n e p h o r e t e a
G r a v e l d e p o s i t i o n L r - 1 R o u g h l e v e e S e d o - c e r a s t i o n / T h e r o - a i r i o nu r b a n a r e a s i n f r a s t r u c t u r e U l 1 u r b a n i s e d a r e a H r - 3 B u i l t o n / p a v e d l a n d
l e g e n d : l e g e n d :S : w a t e r b o d i e s H h i g h w a t e r f r e eM : m a r s h l a n d L l e v e e sT : t r a n s i t i o n a l w o o d l a n d F f l o o d p l a i nW : w o o d l a n d S s u m m e r b e dC : c o n i f e r o u s f o r e s t W o p e n w a t e rP : p a s t u r e M m a r s hN : n a t u r a l g r a s s l a n d b b a r eA : a r a b l e l a n d s s i d e c h a n n e l / s h a l l o w b e dB : b a r s , b e a c h e s l l a k eU : u r b a n i s e d , i n f r a s t r u c t u r e r r o u g h v e g e t a t i o nd : d e e p r i v e r p a r t s g g r a s s l a n ds : s h a l l o w r i v e r p a r t s f f o r e s tf : f l o o d p l a i n p a r t sl : l e v e e s
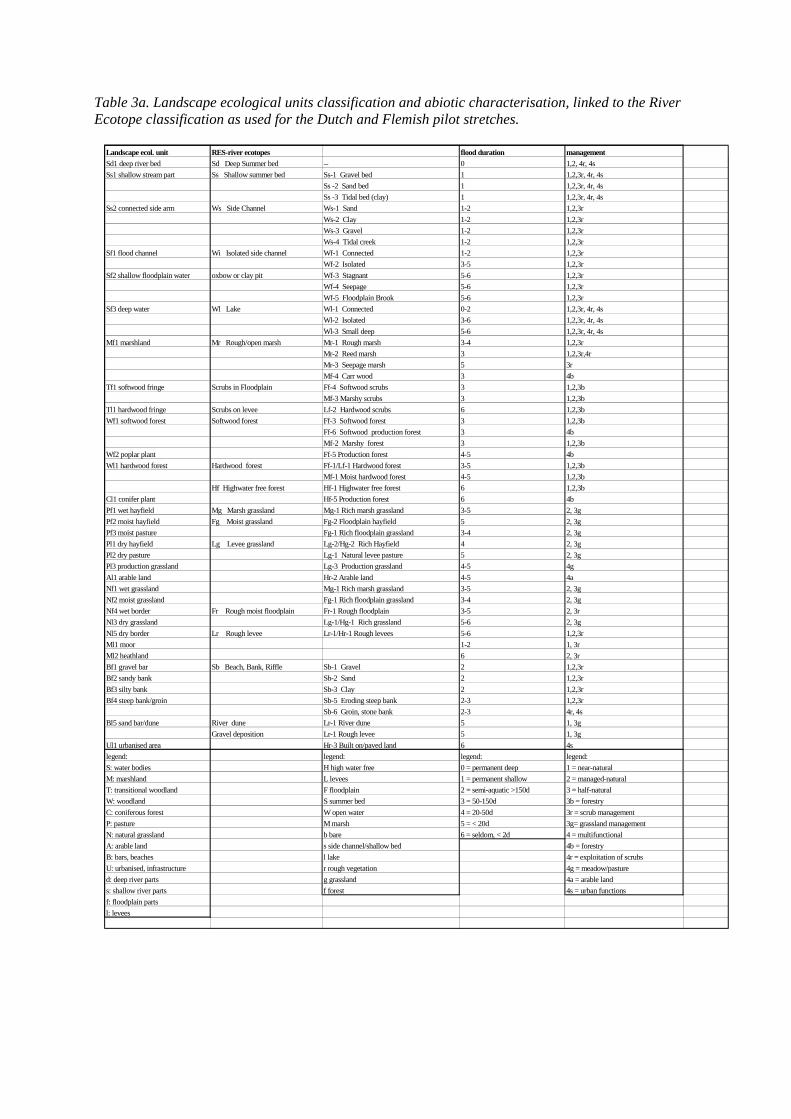
Table 3a. Landscape ecological units classification and abiotic characterisation, linked to the River Ecotope classification as used for the Dutch and Flemish pilot stretches.
Landscape ecol. unit RES-river ecotopes flood duration managementSd1 deep river bed Sd Deep Summer bed -- 0 1,2, 4r, 4s Ss1 shallow stream part Ss Shallow summer bed Ss-1 Gravel bed 1 1,2,3r, 4r, 4s
Ss -2 Sand bed 1 1,2,3r, 4r, 4s Ss -3 Tidal bed (clay) 1 1,2,3r, 4r, 4s
Ss2 connected side arm Ws Side Channel Ws-1 Sand 1-2 1,2,3rWs-2 Clay 1-2 1,2,3rWs-3 Gravel 1-2 1,2,3rWs-4 Tidal creek 1-2 1,2,3r
Sf1 flood channel Wi Isolated side channel Wf-1 Connected 1-2 1,2,3rWf-2 Isolated 3-5 1,2,3r
Sf2 shallow floodplain water oxbow or clay pit Wf-3 Stagnant 5-6 1,2,3rWf-4 Seepage 5-6 1,2,3rWf-5 Floodplain Brook 5-6 1,2,3r
Sf3 deep water Wl Lake Wl-1 Connected 0-2 1,2,3r, 4r, 4s Wl-2 Isolated 3-6 1,2,3r, 4r, 4s Wl-3 Small deep 5-6 1,2,3r, 4r, 4s
Mf1 marshland Mr Rough/open marsh Mr-1 Rough marsh 3-4 1,2,3rMr-2 Reed marsh 3 1,2,3r,4rMr-3 Seepage marsh 5 3rMf-4 Carr wood 3 4b
Tf1 softwood fringe Scrubs in Floodplain Ff-4 Softwood scrubs 3 1,2,3bMf-3 Marshy scrubs 3 1,2,3b
Tl1 hardwood fringe Scrubs on levee Lf-2 Hardwood scrubs 6 1,2,3bWf1 softwood forest Softwood forest Ff-3 Softwood forest 3 1,2,3b
Ff-6 Softwood production forest 3 4bMf-2 Marshy forest 3 1,2,3b
Wf2 poplar plant Ff-5 Production forest 4-5 4bWl1 hardwood forest Hardwood forest Ff-1/Lf-1 Hardwood forest 3-5 1,2,3b
Mf-1 Moist hardwood forest 4-5 1,2,3bHf Highwater free forest Hf-1 Highwater free forest 6 1,2,3b
Cl1 conifer plant Hf-5 Production forest 6 4bPf1 wet hayfield Mg Marsh grassland Mg-1 Rich marsh grassland 3-5 2, 3gPf2 moist hayfield Fg Moist grassland Fg-2 Floodplain hayfield 5 2, 3gPf3 moist pasture Fg-1 Rich floodplain grassland 3-4 2, 3gPl1 dry hayfield Lg Levee grassland Lg-2/Hg-2 Rich Hayfield 4 2, 3gPl2 dry pasture Lg-1 Natural levee pasture 5 2, 3gPl3 production grassland Lg-3 Production grassland 4-5 4gAl1 arable land Hr-2 Arable land 4-5 4aNf1 wet grassland Mg-1 Rich marsh grassland 3-5 2, 3gNf2 moist grassland Fg-1 Rich floodplain grassland 3-4 2, 3gNf4 wet border Fr Rough moist floodplain Fr-1 Rough floodplain 3-5 2, 3rNl3 dry grassland Lg-1/Hg-1 Rich grassland 5-6 2, 3gNl5 dry border Lr Rough levee Lr-1/Hr-1 Rough levees 5-6 1,2,3rMl1 moor 1-2 1, 3rMl2 heathland 6 2, 3rBf1 gravel bar Sb Beach, Bank, Riffle Sb-1 Gravel 2 1,2,3rBf2 sandy bank Sb-2 Sand 2 1,2,3rBf3 silty bank Sb-3 Clay 2 1,2,3rBf4 steep bank/groin Sb-5 Eroding steep bank 2-3 1,2,3r
Sb-6 Groin, stone bank 2-3 4r, 4sBl5 sand bar/dune River dune Lr-1 River dune 5 1, 3g
Gravel deposition Lr-1 Rough levee 5 1, 3gUl1 urbanised area Hr-3 Built on/paved land 6 4slegend: legend: legend: legend:S: water bodies H high water free 0 = permanent deep 1 = near-naturalM: marshland L levees 1 = permanent shallow 2 = managed-naturalT: transitional woodland F floodplain 2 = semi-aquatic >150d 3 = half-naturalW: woodland S summer bed 3 = 50-150d 3b = forestry C: coniferous forest W open water 4 = 20-50d 3r = scrub managementP: pasture M marsh 5 = < 20d 3g= grassland managementN: natural grassland b bare 6 = seldom, < 2d 4 = multifunctional A: arable land s side channel/shallow bed 4b = forestryB: bars, beaches l lake 4r = exploitation of scrubsU: urbanised, infrastructure r rough vegetation 4g = meadow/pastured: deep river parts g grassland 4a = arable lands: shallow river parts f forest 4s = urban functionsf: floodplain partsl: levees
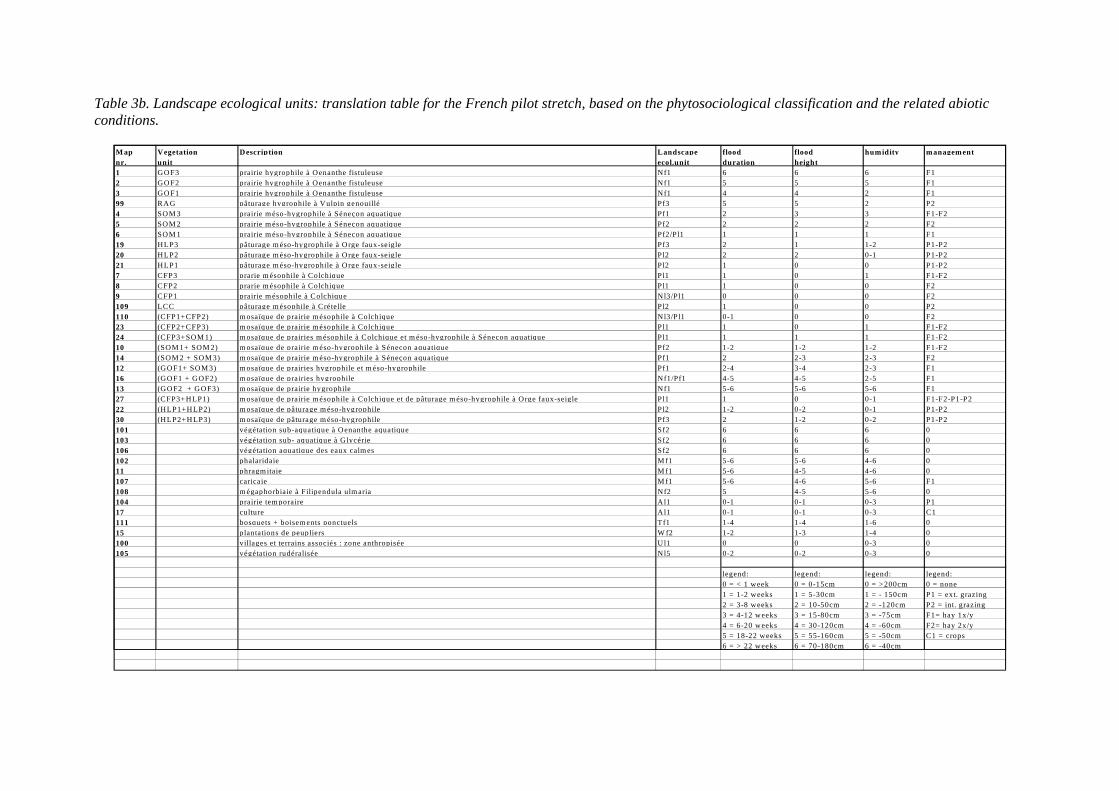
Table 3b. Landscape ecological units: translation table for the French pilot stretch, based on the phytosociological classification and the related abiotic conditions.
M ap Vegetation Description Landscape flood flood hum idity m anagem entnr. unit ecol.unit duration height1 GOF3 prairie hygrophile à Oenanthe fistuleuse Nf1 6 6 6 F12 GOF2 prairie hygrophile à Oenanthe fistuleuse Nf1 5 5 5 F13 GOF1 prairie hygrophile à Oenanthe fistuleuse Nf1 4 4 2 F199 RAG pâturage hygrophile à Vulpin genouillé Pf3 5 5 2 P24 SOM 3 prairie m éso-hygrophile à Séneçon aquatique Pf1 2 3 3 F1-F25 SOM 2 prairie m éso-hygrophile à Séneçon aquatique Pf2 2 2 2 F26 SOM 1 prairie m éso-hygrophile à Séneçon aquatique Pf2/Pl1 1 1 1 F1 19 HLP3 pâturage m éso-hygrophile à Orge faux-seigle Pf3 2 1 1-2 P1-P220 HLP2 pâturage m éso-hygrophile à Orge faux-seigle Pl2 2 2 0-1 P1-P221 HLP1 pâturage m éso-hygrophile à Orge faux-seigle Pl2 1 0 0 P1-P27 CFP3 prarie m ésophile à Colchique Pl1 1 0 1 F1-F28 CFP2 prarie m ésophile à Colchique Pl1 1 0 0 F29 CFP1 prairie m ésophile à Colchique Nl3/Pl1 0 0 0 F2109 LCC pâturage m ésophile à Crételle Pl2 1 0 0 P2110 (CFP1+CFP2) m osaïque de prairie m ésophile à Colchique Nl3/Pl1 0-1 0 0 F223 (CFP2+CFP3) m osaïque de prairie m ésophile à Colchique Pl1 1 0 1 F1-F224 (CFP3+SOM 1) m osaïque de prairies m ésophile à Colchique et m éso-hygrophile à Séneçon aquatique Pl1 1 1 1 F1-F210 (SOM 1+ SOM 2) m osaïque de prairie m éso-hygrophile à Séneçon aquatique Pf2 1-2 1-2 1-2 F1-F214 (SOM 2 + SOM 3) m osaïque de prairie m éso-hygrophile à Séneçon aquatique Pf1 2 2-3 2-3 F212 (GOF1+ SOM 3) m osaïque de prairies hygrophile et m éso-hygrophile Pf1 2-4 3-4 2-3 F116 (GOF1 + GOF2) m osaïque de prairies hygrophile Nf1/Pf1 4-5 4-5 2-5 F113 (GOF2 + GOF3) m osaïque de prairie hygrophile Nf1 5-6 5-6 5-6 F127 (CFP3+HLP1) m osaïque de prairie m ésophile à Colchique et de pâturage m éso-hygrophile à Orge faux-seigle Pl1 1 0 0-1 F1-F2-P1-P222 (HLP1+HLP2) m osaïque de pâturage m éso-hygrophile Pl2 1-2 0-2 0-1 P1-P230 (HLP2+HLP3) m osaïque de pâturage m éso-hygrophile Pf3 2 1-2 0-2 P1-P2101 végétation sub-aquatique à Oenanthe aquatique Sf2 6 6 6 0103 végétation sub- aquatique à G lycérie Sf2 6 6 6 0106 végétation aquatique des eaux calm es Sf2 6 6 6 0102 phalaridaie M f1 5-6 5-6 4-6 011 phragm itaie M f1 5-6 4-5 4-6 0107 cariçaie M f1 5-6 4-6 5-6 F1108 m égaphorbiaie à Filipendula ulm aria Nf2 5 4-5 5-6 0104 prairie tem poraire Al1 0-1 0-1 0-3 P1 17 culture Al1 0-1 0-1 0-3 C1111 bosquets + boisem ents ponctuels Tf1 1-4 1-4 1-6 015 plantations de peupliers W f2 1-2 1-3 1-4 0100 villages et terrains associés : zone anthropisée Ul1 0 0 0-3 0105 végétation rudéralisée Nl5 0-2 0-2 0-3 0
legend: legend: legend: legend:0 = < 1 week 0 = 0-15cm 0 = >200cm 0 = none1 = 1-2 weeks 1 = 5-30cm 1 = - 150cm P1 = ext. grazing2 = 3-8 weeks 2 = 10-50cm 2 = -120cm P2 = int. grazing3 = 4-12 weeks 3 = 15-80cm 3 = -75cm F1= hay 1x/y4 = 6-20 weeks 4 = 30-120cm 4 = -60cm F2= hay 2x/y5 = 18-22 weeks 5 = 55-160cm 5 = -50cm C1 = crops6 = > 22 weeks 6 = 70-180cm 6 = -40cm
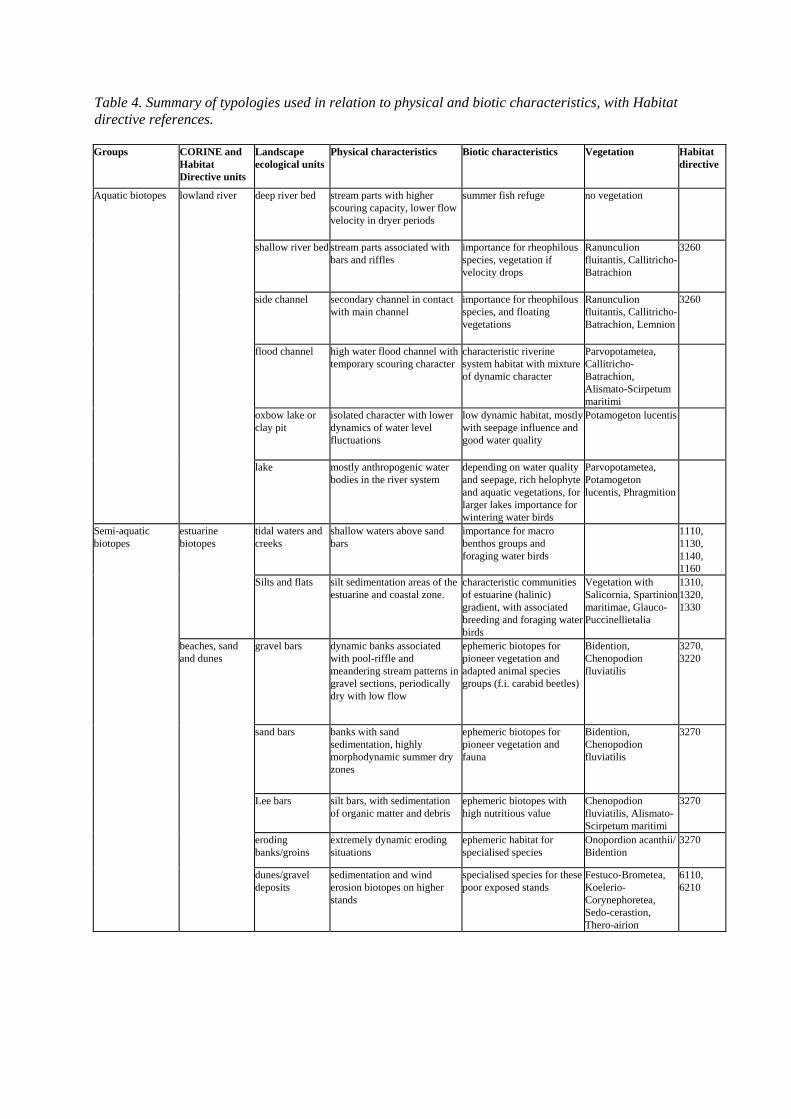
Table 4. Summary of typologies used in relation to physical and biotic characteristics, with Habitat directive references. Groups CORINE and
Habitat Directive units
Landscape ecological units
Physical characteristics Biotic characteristics Vegetation Habitat directive
Aquatic biotopes lowland river deep river bed stream parts with higher scouring capacity, lower flow velocity in dryer periods
summer fish refuge no vegetation
shallow river bed stream parts associated with bars and riffles
importance for rheophilous species, vegetation if velocity drops
Ranunculion fluitantis, Callitricho-Batrachion
3260
side channel secondary channel in contact with main channel
importance for rheophilous species, and floating vegetations
Ranunculion fluitantis, Callitricho-Batrachion, Lemnion
3260
flood channel high water flood channel with temporary scouring character
characteristic riverine system habitat with mixture of dynamic character
Parvopotametea, Callitricho-Batrachion, Alismato-Scirpetum maritimi
oxbow lake or clay pit
isolated character with lower dynamics of water level fluctuations
low dynamic habitat, mostly with seepage influence and good water quality
Potamogeton lucentis
lake mostly anthropogenic water bodies in the river system
depending on water quality and seepage, rich helophyte and aquatic vegetations, for larger lakes importance for wintering water birds
Parvopotametea, Potamogeton lucentis, Phragmition
Semi-aquatic biotopes
estuarine biotopes
tidal waters and creeks
shallow waters above sand bars
importance for macro benthos groups and foraging water birds
1110, 1130, 1140, 1160
Silts and flats silt sedimentation areas of the estuarine and coastal zone.
characteristic communities of estuarine (halinic) gradient, with associated breeding and foraging water birds
Vegetation with Salicornia, Spartinion maritimae, Glauco-Puccinellietalia
1310, 1320, 1330
beaches, sand and dunes
gravel bars dynamic banks associated with pool-riffle and meandering stream patterns in gravel sections, periodically dry with low flow
ephemeric biotopes for pioneer vegetation and adapted animal species groups (f.i. carabid beetles)
Bidention, Chenopodion fluviatilis
3270, 3220
sand bars banks with sand sedimentation, highly morphodynamic summer dry zones
ephemeric biotopes for pioneer vegetation and fauna
Bidention, Chenopodion fluviatilis
3270
Lee bars silt bars, with sedimentation of organic matter and debris
ephemeric biotopes with high nutritious value
Chenopodion fluviatilis, Alismato-Scirpetum maritimi
3270
eroding banks/groins
extremely dynamic eroding situations
ephemeric habitat for specialised species
Onopordion acanthii/ Bidention
3270
dunes/gravel deposits
sedimentation and wind erosion biotopes on higher stands
specialised species for these poor exposed stands
Festuco-Brometea, Koelerio-Corynephoretea, Sedo-cerastion, Thero-airion
6110, 6210
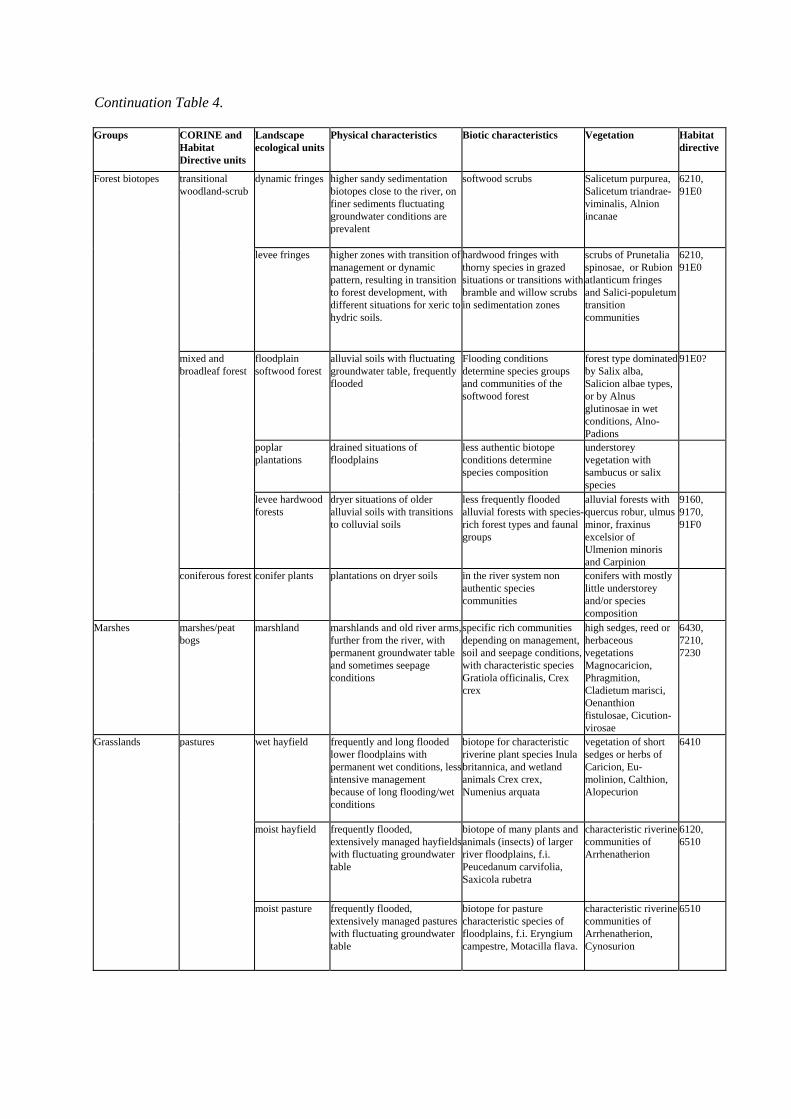
Continuation Table 4. Groups CORINE and
Habitat Directive units
Landscape ecological units
Physical characteristics Biotic characteristics Vegetation Habitat directive
Forest biotopes transitional woodland-scrub
dynamic fringes higher sandy sedimentation biotopes close to the river, on finer sediments fluctuating groundwater conditions are prevalent
softwood scrubs Salicetum purpurea, Salicetum triandrae-viminalis, Alnion incanae
6210, 91E0
levee fringes higher zones with transition of management or dynamic pattern, resulting in transition to forest development, with different situations for xeric to hydric soils.
hardwood fringes with thorny species in grazed situations or transitions with bramble and willow scrubs in sedimentation zones
scrubs of Prunetalia spinosae, or Rubion atlanticum fringes and Salici-populetum transition communities
6210, 91E0
mixed and broadleaf forest
floodplain softwood forest
alluvial soils with fluctuating groundwater table, frequently flooded
Flooding conditions determine species groups and communities of the softwood forest
forest type dominated by Salix alba, Salicion albae types, or by Alnus glutinosae in wet conditions, Alno-Padions
91E0?
poplar plantations
drained situations of floodplains
less authentic biotope conditions determine species composition
understorey vegetation with sambucus or salix species
levee hardwood forests
dryer situations of older alluvial soils with transitions to colluvial soils
less frequently flooded alluvial forests with species-rich forest types and faunal groups
alluvial forests with quercus robur, ulmus minor, fraxinus excelsior of Ulmenion minoris and Carpinion
9160, 9170, 91F0
coniferous forest conifer plants plantations on dryer soils in the river system non authentic species communities
conifers with mostly little understorey and/or species composition
Marshes marshes/peat bogs
marshland marshlands and old river arms, further from the river, with permanent groundwater table and sometimes seepage conditions
specific rich communities depending on management, soil and seepage conditions, with characteristic species Gratiola officinalis, Crex crex
high sedges, reed or herbaceous vegetations Magnocaricion, Phragmition, Cladietum marisci, Oenanthion fistulosae, Cicution-virosae
6430, 7210, 7230
Grasslands pastures wet hayfield frequently and long flooded lower floodplains with permanent wet conditions, less intensive management because of long flooding/wet conditions
biotope for characteristic riverine plant species Inula britannica, and wetland animals Crex crex, Numenius arquata
vegetation of short sedges or herbs of Caricion, Eu-molinion, Calthion, Alopecurion
6410
moist hayfield frequently flooded, extensively managed hayfields with fluctuating groundwater table
biotope of many plants and animals (insects) of larger river floodplains, f.i. Peucedanum carvifolia, Saxicola rubetra
characteristic riverine communities of Arrhenatherion
6120, 6510
moist pasture frequently flooded, extensively managed pastures with fluctuating groundwater table
biotope for pasture characteristic species of floodplains, f.i. Eryngium campestre, Motacilla flava.
characteristic riverine communities of Arrhenatherion, Cynosurion
6510
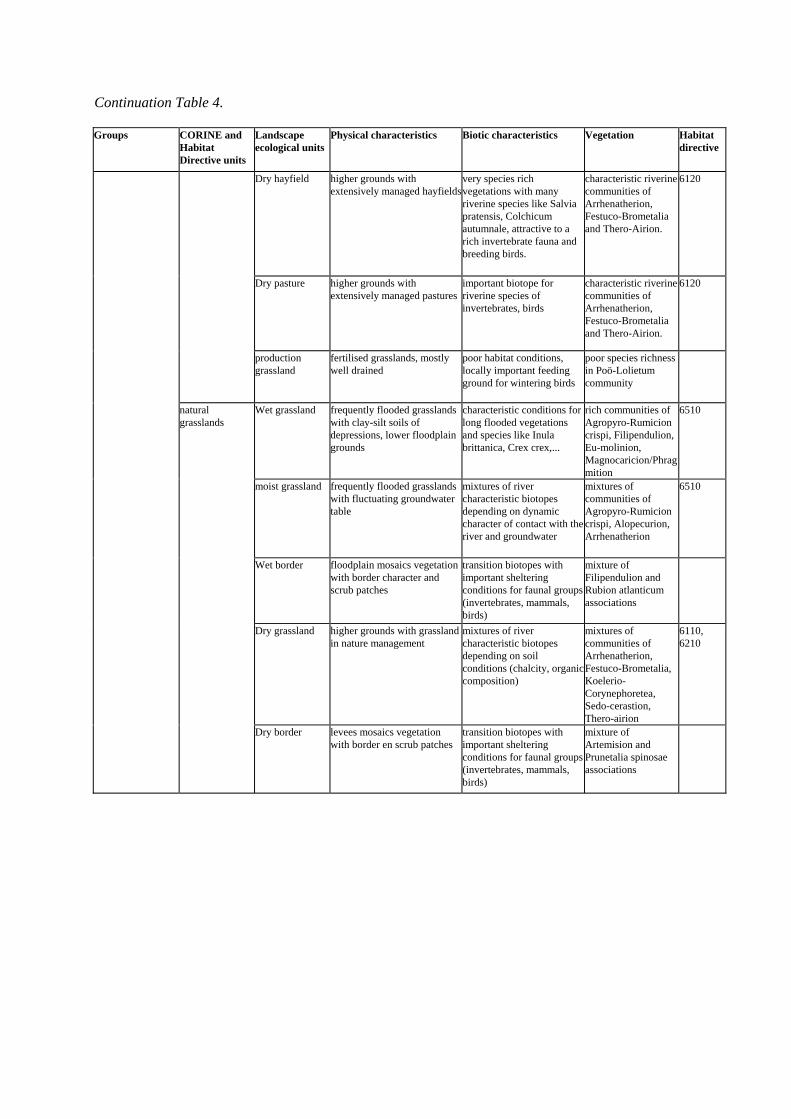
Continuation Table 4. Groups CORINE and
Habitat Directive units
Landscape ecological units
Physical characteristics Biotic characteristics Vegetation Habitat directive
Dry hayfield higher grounds with extensively managed hayfields
very species rich vegetations with many riverine species like Salvia pratensis, Colchicum autumnale, attractive to a rich invertebrate fauna and breeding birds.
characteristic riverine communities of Arrhenatherion, Festuco-Brometalia and Thero-Airion.
6120
Dry pasture higher grounds with extensively managed pastures
important biotope for riverine species of invertebrates, birds
characteristic riverine communities of Arrhenatherion, Festuco-Brometalia and Thero-Airion.
6120
production grassland
fertilised grasslands, mostly well drained
poor habitat conditions, locally important feeding ground for wintering birds
poor species richness in Poö-Lolietum community
natural grasslands
Wet grassland frequently flooded grasslands with clay-silt soils of depressions, lower floodplain grounds
characteristic conditions for long flooded vegetations and species like Inula brittanica, Crex crex,...
rich communities of Agropyro-Rumicion crispi, Filipendulion, Eu-molinion, Magnocaricion/Phragmition
6510
moist grassland frequently flooded grasslands with fluctuating groundwater table
mixtures of river characteristic biotopes depending on dynamic character of contact with the river and groundwater
mixtures of communities of Agropyro-Rumicion crispi, Alopecurion, Arrhenatherion
6510
Wet border floodplain mosaics vegetation with border character and scrub patches
transition biotopes with important sheltering conditions for faunal groups (invertebrates, mammals, birds)
mixture of Filipendulion and Rubion atlanticum associations
Dry grassland higher grounds with grassland in nature management
mixtures of river characteristic biotopes depending on soil conditions (chalcity, organic composition)
mixtures of communities of Arrhenatherion, Festuco-Brometalia, Koelerio-Corynephoretea, Sedo-cerastion, Thero-airion
6110, 6210
Dry border levees mosaics vegetation with border en scrub patches
transition biotopes with important sheltering conditions for faunal groups (invertebrates, mammals, birds)
mixture of Artemision and Prunetalia spinosae associations
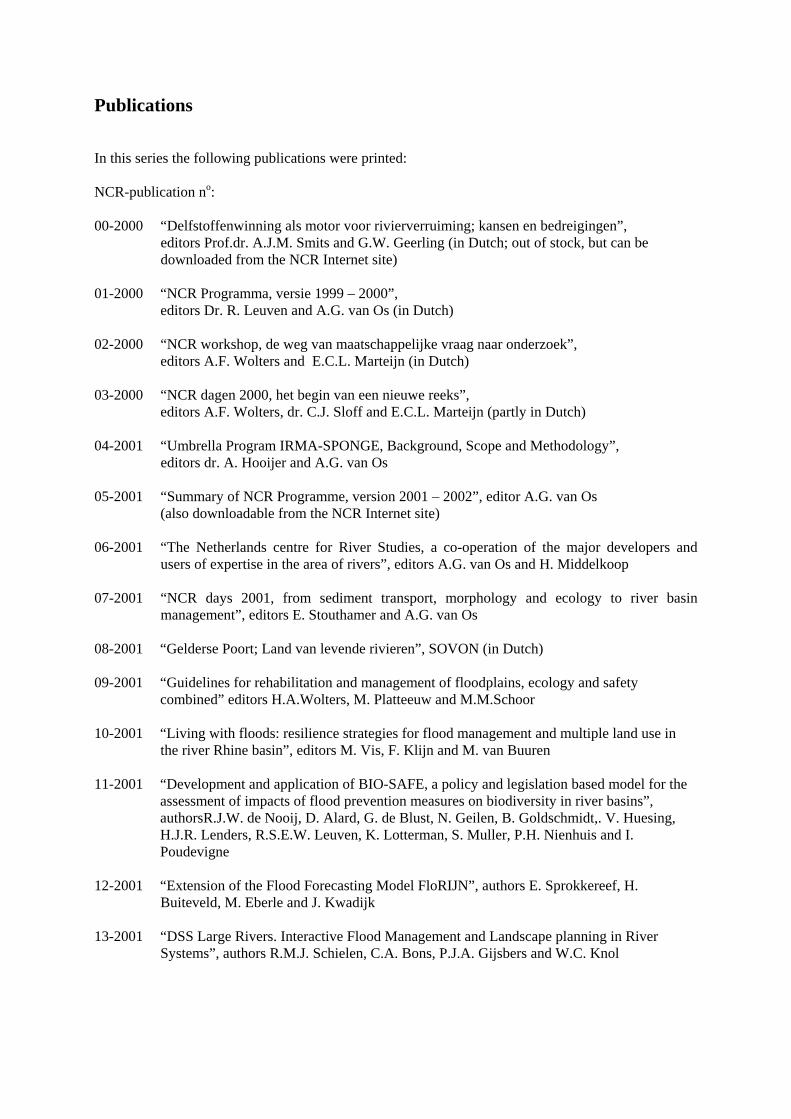
Publications In this series the following publications were printed: NCR-publication no: 00-2000 “Delfstoffenwinning als motor voor rivierverruiming; kansen en bedreigingen”,
editors Prof.dr. A.J.M. Smits and G.W. Geerling (in Dutch; out of stock, but can be downloaded from the NCR Internet site)
01-2000 “NCR Programma, versie 1999 – 2000”, editors Dr. R. Leuven and A.G. van Os (in Dutch) 02-2000 “NCR workshop, de weg van maatschappelijke vraag naar onderzoek”, editors A.F. Wolters and E.C.L. Marteijn (in Dutch) 03-2000 “NCR dagen 2000, het begin van een nieuwe reeks”, editors A.F. Wolters, dr. C.J. Sloff and E.C.L. Marteijn (partly in Dutch) 04-2001 “Umbrella Program IRMA-SPONGE, Background, Scope and Methodology”,
editors dr. A. Hooijer and A.G. van Os 05-2001 “Summary of NCR Programme, version 2001 – 2002”, editor A.G. van Os (also downloadable from the NCR Internet site) 06-2001 “The Netherlands centre for River Studies, a co-operation of the major developers and
users of expertise in the area of rivers”, editors A.G. van Os and H. Middelkoop 07-2001 “NCR days 2001, from sediment transport, morphology and ecology to river basin
management”, editors E. Stouthamer and A.G. van Os 08-2001 “Gelderse Poort; Land van levende rivieren”, SOVON (in Dutch) 09-2001 “Guidelines for rehabilitation and management of floodplains, ecology and safety
combined” editors H.A.Wolters, M. Platteeuw and M.M.Schoor 10-2001 “Living with floods: resilience strategies for flood management and multiple land use in the river Rhine basin”, editors M. Vis, F. Klijn and M. van Buuren 11-2001 “Development and application of BIO-SAFE, a policy and legislation based model for the
assessment of impacts of flood prevention measures on biodiversity in river basins”, authorsR.J.W. de Nooij, D. Alard, G. de Blust, N. Geilen, B. Goldschmidt,. V. Huesing, H.J.R. Lenders, R.S.E.W. Leuven, K. Lotterman, S. Muller, P.H. Nienhuis and I. Poudevigne
12-2001 “Extension of the Flood Forecasting Model FloRIJN”, authors E. Sprokkereef, H. Buiteveld, M. Eberle and J. Kwadijk 13-2001 “DSS Large Rivers. Interactive Flood Management and Landscape planning in River Systems”, authors R.M.J. Schielen, C.A. Bons, P.J.A. Gijsbers and W.C. Knol

14-2001 ‘Cyclic floodplain rejuvenation: a new strategy based on floodplain measures for both
flood risk management and enhancement of the biodiversity of the river Rhine’, editor H. Duel
15-2001 “INTERMEUSE: the Meuse reconnected”, authors N. Geilen, B. Pedroli, K. van Looij,
L.Krebs, H. Jochems, S. van Rooij and Th. van der Sluis
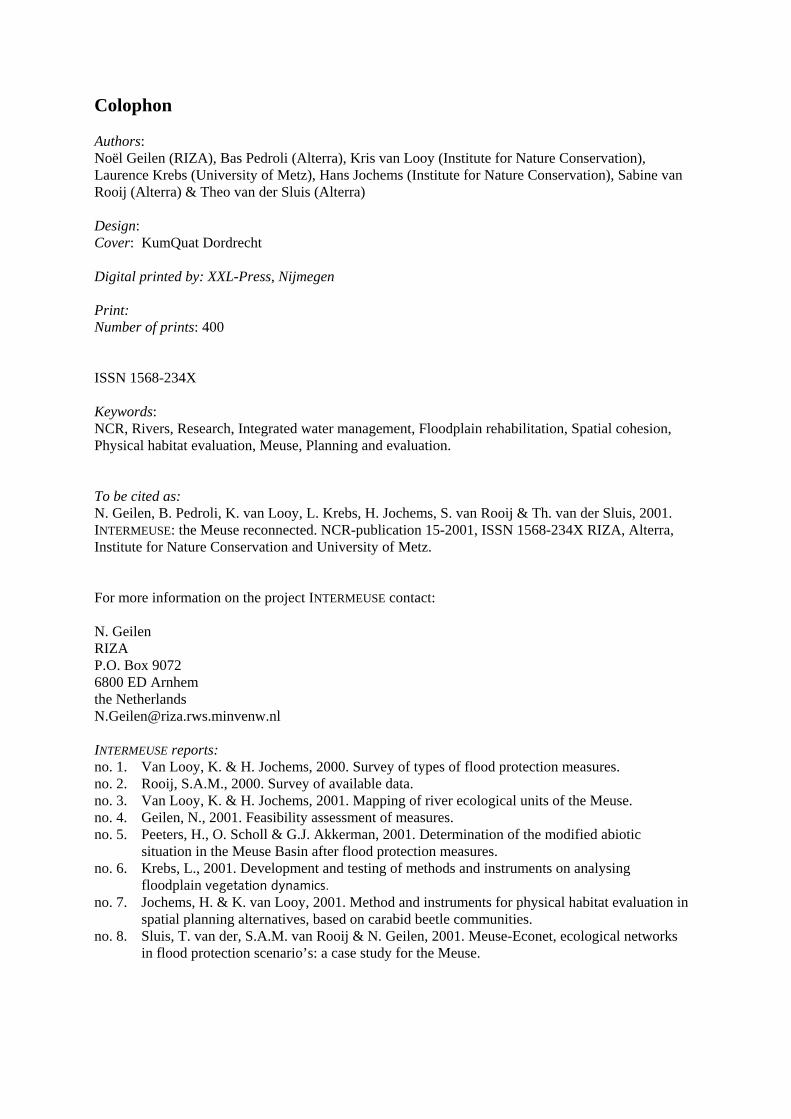
Colophon Authors: Noël Geilen (RIZA), Bas Pedroli (Alterra), Kris van Looy (Institute for Nature Conservation), Laurence Krebs (University of Metz), Hans Jochems (Institute for Nature Conservation), Sabine van Rooij (Alterra) & Theo van der Sluis (Alterra) Design: Cover: KumQuat Dordrecht Digital printed by: XXL-Press, Nijmegen Print: Number of prints: 400 ISSN 1568-234X Keywords: NCR, Rivers, Research, Integrated water management, Floodplain rehabilitation, Spatial cohesion, Physical habitat evaluation, Meuse, Planning and evaluation. To be cited as: N. Geilen, B. Pedroli, K. van Looy, L. Krebs, H. Jochems, S. van Rooij & Th. van der Sluis, 2001. INTERMEUSE: the Meuse reconnected. NCR-publication 15-2001, ISSN 1568-234X RIZA, Alterra, Institute for Nature Conservation and University of Metz. For more information on the project INTERMEUSE contact: N. Geilen RIZA P.O. Box 9072 6800 ED Arnhem the Netherlands [email protected] INTERMEUSE reports: no. 1. Van Looy, K. & H. Jochems, 2000. Survey of types of flood protection measures. no. 2. Rooij, S.A.M., 2000. Survey of available data. no. 3. Van Looy, K. & H. Jochems, 2001. Mapping of river ecological units of the Meuse. no. 4. Geilen, N., 2001. Feasibility assessment of measures. no. 5. Peeters, H., O. Scholl & G.J. Akkerman, 2001. Determination of the modified abiotic
situation in the Meuse Basin after flood protection measures. no. 6. Krebs, L., 2001. Development and testing of methods and instruments on analysing
floodplain vegetation dynamics. no. 7. Jochems, H. & K. van Looy, 2001. Method and instruments for physical habitat evaluation in
spatial planning alternatives, based on carabid beetle communities. no. 8. Sluis, T. van der, S.A.M. van Rooij & N. Geilen, 2001. Meuse-Econet, ecological networks
in flood protection scenario’s: a case study for the Meuse.
The Netherlands Centre for River Studies
(NCR) is a collaboration of the major
developers and users of expertise in the
Netherlands in the area of rivers, viz. the
universities of Delft, Utrecht, Nijmegen
and Twente, IHE, ALTERRA, TNO-NITG,
RIZA and WL | Delft Hydraulics.
NCR’s goal is to build a joint knowledge
base on rivers in the Netherlands
and to promote co-operation between the
most important scientific institutes in the
field of river studies in the Netherlands.
This co-operation will also strengthen the
national and international position of
Dutch scientific research and education.
NCR’s address:
NCR, c/o WL | Delft Hydraulics
P.O.Box 177
2600 MH Delft
the Netherlands
[t] +31 15 2858577
[f] +31 15 2858582
[I] http://www.ncr-web.org
ISSN 1568-234X