A case study from the Callovo-Oxfordian formation, Meuse ...
49
HAL Id: hal-00193369 https://hal.archives-ouvertes.fr/hal-00193369 Submitted on 3 Dec 2007 HAL is a multi-disciplinary open access archive for the deposit and dissemination of sci- entific research documents, whether they are pub- lished or not. The documents may come from teaching and research institutions in France or abroad, or from public or private research centers. L’archive ouverte pluridisciplinaire HAL, est destinée au dépôt et à la diffusion de documents scientifiques de niveau recherche, publiés ou non, émanant des établissements d’enseignement et de recherche français ou étrangers, des laboratoires publics ou privés. Experimental investigation of the interaction of clays with high pH solutions: A case study from the Callovo-Oxfordian formation, Meuse - Haute Marne underground laboratory (France) Francis Claret, Andreas Bauer, Thorsten Schäfer, Lise Griffault, Bruno Lanson To cite this version: Francis Claret, Andreas Bauer, Thorsten Schäfer, Lise Griffault, Bruno Lanson. Experimental inves- tigation of the interaction of clays with high pH solutions: A case study from the Callovo-Oxfordian formation, Meuse - Haute Marne underground laboratory (France). Clays and Clay Minerals, Clay Minerals Society, 2002, 50 (5), pp.633-646. 10.1346/CCMN.2004.0520501. hal-00193369
-
Upload
khangminh22 -
Category
Documents
-
view
0 -
download
0
Transcript of A case study from the Callovo-Oxfordian formation, Meuse ...

HAL Id: hal-00193369https://hal.archives-ouvertes.fr/hal-00193369
Submitted on 3 Dec 2007
HAL is a multi-disciplinary open accessarchive for the deposit and dissemination of sci-entific research documents, whether they are pub-lished or not. The documents may come fromteaching and research institutions in France orabroad, or from public or private research centers.
L’archive ouverte pluridisciplinaire HAL, estdestinée au dépôt et à la diffusion de documentsscientifiques de niveau recherche, publiés ou non,émanant des établissements d’enseignement et derecherche français ou étrangers, des laboratoirespublics ou privés.
Experimental investigation of the interaction of clayswith high pH solutions: A case study from the
Callovo-Oxfordian formation, Meuse - Haute Marneunderground laboratory (France)
Francis Claret, Andreas Bauer, Thorsten Schäfer, Lise Griffault, Bruno Lanson
To cite this version:Francis Claret, Andreas Bauer, Thorsten Schäfer, Lise Griffault, Bruno Lanson. Experimental inves-tigation of the interaction of clays with high pH solutions: A case study from the Callovo-Oxfordianformation, Meuse - Haute Marne underground laboratory (France). Clays and Clay Minerals, ClayMinerals Society, 2002, 50 (5), pp.633-646. 10.1346/CCMN.2004.0520501. hal-00193369

1
Experimental investigation of the interaction of clays with high pH solutions:
A case study from the Callovo-Oxfordian formation, Meuse - Haute Marne
underground laboratory (France)
Francis Claret1,2, Andreas Bauer3, Thorsten Schäfer3, Lise Griffault2, Bruno Lanson1,*
1 Environmental Geochemistry Group, LGIT - Maison des Géosciences, University J.
Fourier – CNRS, BP 53, 38041Grenoble cedex 9, France
2 ANDRA, Parc de Croix Blanche, 1-7 rue Jean Monnet, 92298 Châtenay-Malabry
Cedex, France
3 Forschungszentum Karlsruhe, Institut für Nukleare Entsorgung, PO Box 3640, D-
76021 Karlsruhe, Germany
* Corresponding author : [email protected]

2
ABSTRACT
The impact of alkaline solutions (pH = 13.2) on the clay mineralogy of the Callovo-
Oxfordian formation hosting the French underground laboratory for nuclear waste disposal
investigation (Meuse-Haute Marne site) has been studied experimentally. Initially, each of
the four samples selected as representative of the mineralogical transition in this Callovo-
Oxfordian formation consist of a mixture of three main clay phases: discrete illite, discrete
smectite and a randomly interstratified mixed layered mineral (MLM) containing about
65% of non expandable layers. Clay separates were altered in batch reactors at 60°C using
high solution:solid ratios. Mineralogy of this clay fraction, and solution chemistry were
monitored as a function of reaction time. In addition, the interactions between organic
matter and clay particles were investigated using scanning transmission X-ray microscopy
(STXM).
The clay mineralogy is little affected even though the pH is still high after 1 year
reaction time. The only significant mineralogical evolution is the partial dissolution of the
discrete smectite component leading to the formation of a new randomly interstratified
illite-expandable MLM. Additional mineralogical transformations lead, for one sample, to
the dissolution of micro-crystalline quartz and, for another sample, to the crystallization of
a tobermorite-like phase. The low reactivity of clay minerals may be attributed to the
presence of organic matter in the samples. In their initial state, all outer surfaces of clay
particles are indeed covered with organic matter. After one year reaction time, STXM
studies showed the basal surfaces of clay particles are devoid of organic matter but their
edges, which are the most reactive sites, are still protected.

3
INTRODUCTION
Nuclear waste disposal in deep geological formation is currently under investigation
in several countries. Based on the law from December 31st 1991, France is conducting
research in a clay-rich formation the "Callovo Oxfordian argilite" in the Meuse - Haute
Marne site (MHM - Eastern Paris basin). An underground laboratory will soon be
operational allowing investigation of the confinement properties of this host formation.
However, disposal in such deep environments implies technical solutions so that waste is
stored in a safe way preventing harmful effects to the population. In particular, concrete is
often thought of as a civil engineering material in such deep storage facilities or as a
component of the waste package, especially for intermediate-level long-lived waste (ILLW
- "B type" according to the French nuclear waste classification).
However, the water-induced alteration of concrete generates alkali-rich high pH
(12.5-13.6) solutions (Anderson et al., 1989; Lunden and Andersson, 1989), whose release
to the surrounding media has been modeled (Jeffries et al., 1988; Haworth et al., 1989;
Berner, 1990; Reardon, 1990; Vieillard and Rassineux, 1992). Such modeling shows that
solution composition is first controlled by the release of NaOH and KOH leading to very
high solution pH (pH > 13). In a second step, solution composition is controlled by
portlandite (Ca(OH)2 - pH 12), and finally by calcium-silicate-hydrate (CSH) phases (pH
9-10).
As a consequence, numerous investigations have been conducted on the stability of
clays in such high pH conditions (Mohnot et al., 1987; Carroll-Webb and Walther, 1988;
Carroll and Walther, 1990; Chermak, 1992, 1993; Eberl et al., 1993; Huang, 1993; Bauer
and Berger, 1998; Bauer et al., 1998; Bauer and Velde, 1999; Cama et al., 2000; Taubald et
al., 2000; Huertas et al., 2001). These studies consistently indicate that the clay minerals
described in the Callovo-Oxfordian formation of the MHM site (smectite, illite, and mixed-

4
layer illite smectite - Bouchet and Rassineux, 1997; Claret, 2001) would react when in
contact with high-pH alkali-rich solutions. For example, recent high pH experimental
investigations on smectite-type minerals indicated a fast montmorillonite-to-beideillite
transformation (Rassineux et al., 2001). On the other hand, the bulk mineralogy of the
formation offers a good buffering capacity, especially with the presence of silicates such as
quartz (~20 %wt) and of carbonates. Similar studies on natural formations such as in the
Maqarin analog site depict an alteration halo restricted to a few mm thick along a
conducting fracture (Cassagnabere et al., 2001).
The main objective of this study was to investigate the specific behavior of the
natural clay mineral assemblages from the Callovo-Oxfordian formation in the MHM site
when in contact with Ca-Na-K rich solutions at high pH (>13). The experimental work was
conducted on < 2 µm clay separates. These reactive size fractions have been
hydrothermally altered in closed systems from 1 day to 1 year periods of time. Fluids and
solids were recovered and analyzed. The present article reports in detail the results of this
experimental work.
MATERIALS
Starting materials
The French underground laboratory will be located in Bure (eastern Paris Basin) at
the limit between the Haute-Marne and Meuse departments. This laboratory will be hosted
in the Callovo-Oxfordian formation whose burial depth ranges from 422-552 m in the
exploration drill hole EST 104. This clay formation is a hard shale containing 40-45% clay
minerals, and about 50% of calcite. Bouchet and Rassineux (1997) showed that this clay
formation included a mineralogical transition from smectitic "R0" mixed layered minerals
(MLM) at the top of the formation to more illitic "R1" MLM in its deeper section. In the

5
sampled well EST 104, four core samples were selected at 447, 490, 494, and 516 m below
ground level as being representative of the whole mineralogical sequence covered by the
clay formation. Two "R0" samples were chosen, the first one with a high smectite content
(~65%) and the other one with about 50% smectite in the "R0". These I-S compositions
were estimated from Inoue's method (Inoue et al., 1989). Another two samples were
selected in the "R1" part of the drillhole, the first one with about 60% illite, and the other
one with about 70% illite. These compositions were estimated from X-ray diffraction
patterns using the criteria defined by Velde et al. (1986). Their chemical composition can
be found in Bouchet and Rassineux (1997), and additional analyses of sulfur and carbon in
the starting material were performed using a LECO-125 C/S analyzer. The total organic
matter (TOC) and the sulphur concentration in the initial solids are given in Table 1, the
organic matter having been described exhaustively by Faure et al. (1999). Because, organic
matter is known to react with alkali solutions, particular attention was consequently paid to
this component.
Before extracting the < 2 µm size fraction by centrifugation, carbonates were
removed using the acetic acid-acetate buffer method described in Moore and Reynolds
(1989), but organic matter was not removed before size fractionation. Clays were finally
Ca-saturated. The mineralogy of these clay samples was investigated in detail by X-ray
diffraction (XRD - Claret (2001)) and scanning electron microscopy (SEM). All four clay
samples consist of a mixture of three main phases: discrete illite, discrete smectite and a
randomly interstratified mixed layer mineral (MLM) containing about 65 % of non
expandable illite layers (Table 2; Claret, 2001). As a function of burial depth, relative
proportion of smectite decreases from 20 to 2 % whereas that of discrete illite increases
from 15 to 25 %. The relative amount of the MLM phase (65 %), as well as its
composition, remains unchanged throughout the depth profile (Table 2; Claret, 2001). As a
consequence the mineralogical transition initially described, as for a diagenetic series, by a

6
progressive illitization of I-S MLMs, rather corresponds to the progressive removal of
discrete smectite with increasing depth together with the progressive increase of a discrete
illite component.
Small amounts of kaolinite, chlorite and/or quartz may also exist in the different
samples, sample 447 showing the highest concentration of quartz, which is detectable even
in the ≤ 0.2 µm size fraction.
Starting solution
The single young fluid (SYF) chemical composition is typical for solutions resulting
from the initial stages of cement alteration (Nagra, 1995). The starting solutions were
prepared from analytical reagent grade KOH, NaOH, and Ca(OH)2 salts. The solution
composition and the initial pH are given in Table 3.
EQ 3 (Wolery, 1983) calculations were performed to determine the distribution of
aqueous species in solution in the absence of CO2. At the initial pH, the solution is slightly
oversaturated with respect to portlandite (log Q/K = 0.407). The starting solutions were
nevertheless clear and showed no evidence of precipitation with time, when not exposed to
air.
Experimental set-up and sample preparation
Clay samples weighing 0.5 g were added to 10 [liquid/solid ratio (L/S) = 20] and
40 ml (L/S = 80) of SYF solution. Batch experiments were performed for up to 12 months
at 60°C in Savilex containers. The temperature control was precise to ±2°C and accurate to
±4°C. The bottles were shaken twice a week. The containers were removed at specific
intervals, quenched in cold water (25°C), and opened. After the experiments, the reacted
material and the solution were separated by centrifugation. The supernatant suspensions
were filtered through a 0.45 µm filter before analysis.

7
The solids were then washed six times with bidistilled water (Milli-Q / 18.2
MΩ.cm-1) water. After each washing step the solid was separated by centrifugation and
resuspended in 50 ml Milli-Q water. In a next step the clays were re-suspended in 50 ml
1 M SrCl2 solution to ensure the presence of two water layers in the expandable interlayers.
To promote complete cation exchange, the suspensions were stored for 4 hours at 50°C.
Following the cation exchange clays were dialysed in tubes prepared by boiling in distilled
water for one day with repeated changes of the water to remove any excess of organic
material from the tubes.
METHODS
X-ray diffraction
Oriented slides were prepared by pipetting a slurry of the Sr-saturated samples on a
glass side and drying it at 40°C for a few hours to obtain an air-dried (AD) preparation.
Ethylene glycol (EG) solvation was achieved by exposing the oriented clay slides to
ethylene glycol vapor at 70°C for 12 hours. XRD patterns were recorded with a Bruker
D5000 diffractometer using a 0.04° step size and a 6s counting time per step. Divergence
slit, the two Soller slits, antiscatter slit, and resolution slit were 0.5°, 2.3°, 2.3°, 0.5° and
0.06°, respectively.
To characterize the structural modification undergone by the reacted clay samples,
their structure was determined using the multi-specimen fitting procedure described by
Sakharov et al. (1999). This method, which may be used to describe complex polyphasic
clay parageneses, requires the recording of XRD patterns of each sample after different
treatments (e.g. Sr-saturated in AD and EG solvated states). For each XRD pattern,
structural parameters such as the composition of the MLM phases (proportions of the
different layer types), their stacking mode (Reichweit parameter R, junction probabilities),

8
and an estimate of their relative proportions are adjusted to fit the experimental XRD
pattern (Sakharov et al., 1999; Claret, 2001). Because the different treatments may change
the thickness and scattering power (nature, amount, and position of interlayer species) of
the swelling interlayers but not the distribution of the different 2:1 layer types, a consistent
structural model is obtained for one sample when the structural parameters obtained from
all XRD patterns of the same sample coincide.
To fit the experimental XRD patterns, the program of Drits and Sakharov (1976) was
used over the 2–50° 2θ CuKα range. Instrumental and experimental factors such as
horizontal and vertical beam divergences, goniometer radius, dimensions and thickness of
the samples were measured and introduced. Sigmastar value was set to 12 and the mass
absorption coefficient (µ*) to 45, as recommended by Moore and Reynolds (1989). Z
coordinates of atoms proposed by Moore and Reynolds (1989) were used for all 2:1 layer
types. The d(001) values used for simulations are given in Table 4. The content of K in illite
interlayers was set to 0.75 atoms per O10(OH)2. The lognormal thickness distributions of
coherent scattering domain sizes (CSDS) were characterized by the mean and maximum
CSDS (Drits et al., 1997).
Scanning electron microscopy / Scanning transition X-ray microscopy
Scanning electron microscope (SEM) micrographs of untreated and reacted materials
were taken to identify minor components which may not be detected by XRD and to
determine the relative stability of the different reaction products. These micrographs were
obtained using a JEOL GSM-6100 instrument equipped with an KEVEX energy dispersive
detector.
Scanning transmission X-ray microscopy (STXM) investigations were performed at
the beamline X1-A of the National Synchrotron Light Source (Brookhaven National
Laboratory) operated by the State University of New York at Stony Brook. The principle

9
of the method is described in detail in Jacobsen et al. (1991) and Zhang et al. (1994).
Sample preparation was performed by squeezing 1 µL of aqueous colloid suspensions
between Si3N4 windows, using a wet cell assembly to maintain the hydration state
(Neuhäusler et al., 1999). Initial clay samples (≤ 2 µm size fraction) were kept in
suspension in deionized water, whereas reacted samples were kept in suspension in reacted
SYF.
The Fresnel zone plate used for these measurements had a diameter of 160 µm and a
outermost zone width of 45 nm giving a theoretical lateral resolution of 55 nm (Rayleigh
criterion), at a focal length of 1.7 mm (Spector et al., 1997). The exit and entrance slit set-
up was chosen to obtain an energy resolution ∆eV of 0.1 eV at the C K-edge (Winn et al.,
1996). Energy calibration of the spherical grating monochromator was performed by using
the photon energy of the CO2 gas adsorption band at 290.74 eV (Ma et al., 1991;
Hitchcock and Mancini, 1994).
STXM images of clay suspensions were recorded at the carbon K-edge and
potassium L-edge. STXM measurements yield information on the product of sample
thickness (d) and of its mass absorption coefficient µ(E) through the relation Abs(E) =
µ(E)*d = ln[I0(E)/I(E)] in which I0(E) is the incident flux on the sample and I(E) the flux
measured behind the sample at the energy E. I0(E) is obtained from regions free of particles
or from XANES spectra measured without sample. Low resolution image stacks can be
measured as a function of energy.
High resolution images were collected at selected energies below and above carbon
(Ebelow = 280 eV, Eabove = Σ(285-290 eV)) and potassium (Ebelow = Σ(280-290 eV), Eabove =
297.3 eV) edges. Ratio images were subsequently calculated giving to each pixel the
corresponding -log()E(Abs)E(Abs
below
above ) ratio to visualize the distribution of potassium and

10
carbon, that is to image the association between clay and organic matter in untreated and
reacted samples (Figure 1).
In addition, X-ray absorption near-edge structure (XANES) spectra were extracted
from low resolution image stacks in the 280-310 eV range after a careful stack alignment
(Jacobsen et al., 2000). In the XANES spectra clay minerals are identified using the X-ray
absorption of structural interlayer potassium, and more precisely the absorption band
double feature at 297.3 eV (L3-edge) and 300 eV (L2-edge). These energy values are
shifted by 3 eV as compared to the values tabulated for K by Henke et al. (1993), because
potassium is present as K+ in these interlayers.
For XANES comparison, all spectra were corrected for the baseline and normalized
to the absorption intensity of the K L3-edge energy (297.3 eV).
Determination of solution composition
pH was measured using a Orion 525A pH-meter calibrated with 5 standard solutions
(pH 7, 9, 10, 11, 13). Because pH measurement of high pH solutions is always critical,
each measured value was checked against a pH 13 standard. A maximal drift of ± 0.1 pH
unit was observed during pH measurements.
Concentrations of dissolved Si, Al, Na, K, Ca and Fe were determined for all
samples on a Plasma 400 ICP-AES (Perkin Elmer) after appropriate dilution. The sulfate
concentrations were determined using a DX-300 Ion chromatograph. The dissolved
organic carbon (DOC) was measured using a Shimadzu TOC-5000, after appropriate
dilution, and pH adjustment with concentrated HCl (pH 2-3).
To determine the size distribution of released colloidal material, the reacted solutions
were passed through polyethersulfone membranes of nominal molecular weight cut off
ranging from 103 to 106 Dalton (MicrosepTM Microconcentrators). Each filter was washed
15 times with Milli-Q water before use.

11
EXPERIMENTAL RESULTS
Solutions
All reacted solutions showed a change in color during the experiment. This change
was not the same for the different samples, and was most intense for sample 447. For this
sample, the solution was dark brownish after 74 days and opaque at the end of the
experiment (L/S = 20). Filtration through a 0.45µm filter for solution analysis purpose did
not modify this strong coloration. Even after ultra-filtration through a 103 Dalton filter (∼
1 nm) the solution still showed a dark brownish color, which is induced by colloidal
organic material.
Dissolved organic carbon and sulfate. A similar evolution of DOC and sulfate
concentrations was observed for all samples (Table 5). With increasing reaction time, the
positive slope of these concentration curves decreased, maximum DOC concentration (270
mg/L) being obtained for sample 447 (L/S = 20) at the end of the experiment (350 days).
DOC was the dominant species in solution for the two L/S ratios except for sample 516 for
which the solution is dominated by sulfate for the two L/S ratios. Maximum sulfate
concentration (240 mg/L) was found in sample 516 (L/S 20) after 350 days (Table 5).
To determine the size distribution of this colloidal organic material as a function of
reaction time, reacted solutions were filtered through polyethersulfone membranes, and
DOC was measured in the filtrate and compared with the initial DOC in solution. The
evolution of this size distribution as a function of time was the same for all four samples,
the average size of the organic material decreasing with increasing reaction time,
independently of L/S ratio (Figure 2). For example, in sample 516 (L/S = 80) about 50%
and 80% of the initial DOC was present in the filtrate of a 1000 Dalton Filter after 74 and
350 days reaction times, respectively (Figure 2).

12
Si and Al. The evolution of Si and Al concentrations with time was different for sample
447 when compared to the other three samples (Table 5). For sample 447, the initial
increase of [Si] was followed by a decrease in the slope of the concentration curve for both
L/S ratios. However, the slope was still positive after one year and no steady state
concentration was reached. For this sample, [Al] decreased after the initial increase to
reach the same final [Al] for the two L/S ratios (6 mg/L). For the other three samples (490,
494, and 516), the evolution of Si and Al concentrations showed the same trend for both
L/S ratios, the positive slope of the concentration curve decreasing with increasing time.
Typical values were about 150-300 and 50-200 mg/l for Si and Al, respectively (Table 5).
In addition, one may note (Table 5) a decrease of [Si] at the end of the experiment for
sample 490 (L/S = 20).
Al and Si concentrations in solution were not correlated with the presence of organic
material as shown on Figure 3. In this figure, one may note that for sample 516 (L/S = 80,
350 days) Al, and Si concentrations were constant whatever the filter cut off was. On the
contrary, DOC concentration decreased with this parameter to indicate that Al and Si are
present as aqueous species, rather than sorbed on organic colloids.
Na, K, Ca, Mg and Fe concentrations. After the initial fast decrease, [Na] and [K] were
constant (about 1400 and 5000 mg/l, respectively) throughout the experiment for the two
L/S ratios (Table 5). In all experiments, Ca, Mg, and Fe concentrations were below the
detection limit.
Evolution of pH. Contrasting pH evolutions as a function of time were observed for the
different samples (Table 5). In samples 490, 494, and 516 pH was constant throughout the
experiment for both L/S ratios, whereas in sample 447 pH decreased to 12.2 (L/S = 20) and
to 12.9 (L/S = 80) at the end of the experiment (350 days).

13
Solids
SEM. SEM analysis of sample 447 showed a strong dissolution of quartz in this initially
quartz-rich sample. In all samples a small number of very fine blocky crystals can be
found. These appear to be randomly distributed and to have a mixed Ca, Mg hydroxide
composition. In most samples limited precipitation of fibrous to honeycomb-textured
CaAlSi-hydroxide phases (CASH) was also observed. Finally, rare occurrences of newly
formed portlandite and brucite also appeared in most samples. Apart from the limited
presence of these newly formed phases, no significant textural modification was observed
in the reacted clay samples.
X-ray diffraction. XRD patterns obtained from reaction products are very similar to those
of the initial raw materials, and in most cases no significant dissolution or neoformation
was detected. Kaolinite and chlorite, whose proportions increase with depth in the
sequence, showed no tendency to react during the experiments, whereas quartz disappeared
in sample 447 for both L/S ratios. No significant modification of the clay mineralogy could
be detected for samples 447 and 516 (Figure 4). On the contrary, a significant
neoformation was observed for sample 494 (L/S = 20), the new phase being characterized
by a rational series of basal reflections (d001 = 11.45 Å) which may be observed for the 74
and 350 days reaction times experiments (L/S = 80 - Figure 5). The saturation of this
sample with different cations, its solvation with EG or its complete dehydration under
secondary vacuum (10-5 Torr) did not alter its XRD pattern (Figure 6). Even though it was
possible to reproduce the set of peak positions using a 2:1 layer with d001 = 11.45 Å, it was
impossible to obtain a correct distribution of intensities between these reflections whatever
the occupancy of the interlayer space. These reflections are more likely related to a newly
formed tobermorite-like phase (11 Å variety) which is reminiscent of the CASH phases

14
observed using SEM.
A detailed study of XRD patterns recorded for sample 490 showed a continuous
decrease of the smectite contribution at 17.3 Å with increasing reaction time, and the
presence of a new peak at about 12.0 Å in the EG pattern (Figure 7). These modifications
were more obvious for L/S = 80. In this case, the diffraction maximum at 12.0 Å is
probably related to a phase different from that described for sample 494, because the series
of reflections was not rational and because the contribution of this phase to the diffracted
intensity varied as a function of sample state (cation saturation, EG solvation).
Application of the multi-specimen method indicates that after one year the reacted
material is composed of 5 different phases. In addition to illite, chlorite and kaolinite which
were initially present, two randomly interstratified MLM phases are also present. The first
one with a 70% illite content and a R = 0 ordering (random interstratification), is similar to
the MLM phase present in the starting material (Claret, 2001). Fitting both AD and EG Sr-
saturated patterns it was possible to estimate a 50% illite content for the other randomly
interstratified MLM phase (Figure 8). In addition, the multi-specimen method confirmed
the assumed disappearance of the initial smectite phase with reaction time.
Spectromicroscopic results. Spectroscopic investigation of untreated clay suspensions
systematically showed the coexistence of potassium and carbon in the same area (Figure
9). To investigate these ubiquitous associations between potassium in clay minerals and
carbon from organic matter, a detailed STXM study was carried out on sample 447
because the experimental alteration of this sample lead to high DOC concentration in
solution (Table 5). The absorption of the unaltered sample 447 was measured at the
potassium L3 edge (297.3 eV), above the carbon edge (Figure 10a). Dark gray values
(regions 1-3) indicate a high combined absorption of potassium and carbon, showing large
aggregates of clay-sized particles (~ 1µm). The comparison of the ratio images of K

15
(Figure 10b) and C (Figure 10c) distributions provided a qualitative information of the
relative K and C contents, light gray values indicating high K or C content. The presence
of high K-concentrations over the absorbing domains (regions 1-3) allowed their
identification as K-rich phyllosilicates, such as the MLM containing ~65% of non
expandable layers which makes up most of the clay-size fraction in all samples.
Furthermore, these ratio images confirmed the association of organic material with these
clays deduced from the XANES spectra (Figure 9). As shown by the similar distributions
of K (Figure 10b) and C (Figure 10 c), organic material covered clay plate surfaces, clay
particle edges as well as inter-particle contacts for this unreacted sample. After reaction of
sample 447 (350 days, L/S = 20), the contrast of the K ratio image (Figures 10e) is not as
good as for the unreacted sample (Figure 10b). The concentration of this sample is very
high and does not always allow a clear identification of the K contribution to the high
global absorption (regions 4, 7). However, such an identification is possible in the low-
absorption zones (regions 6, 8) of the reacted sample image. Furthermore, the unreacted
sample was put in suspension in deionized water and, as a consequence, contained K only
in the solid fraction. By contrast, both liquid and solid components of the reacted sample
suspension in reacted SYF contain potassium, thus lowering the contrast (region 5).
However, the identification of the large absorbing domains as K-rich phyllosilicates is
beyond doubt. In turn, the C ratio image of this reacted sample 447 (Figure 10f) showed a
global depletion in the C content, and more especially a reduced amount of C on basal
surfaces of clay particles whereas high C contents were still observed on particle edges and
at inter-particle contacts (lighter gray values outlining regions 4 and 7). In particular, one
may note that in the lower left corner of the reacted sample image (region 8) the K
distribution is homogeneous (Figure 10e) whereas additional details (particle edges ?) are
visible on the C ratio image (Figure 10f).

16
Further investigation of the C (1s) absorption edge for untreated sample 447 showed
characteristic features of aromatic carbon at 285 eV and 289 eV, carboxylic groups at 289
eV and a broad shoulder between 287-288 eV (Table 6, Figure 9), which may be attributed
either to a resonance of aromatic carbon bond to oxygen or to methyl and methylene
groups of aliphatic carbon (Cody et al., 1995). The XANES spectrum (Figure 9) of reacted
sample 447 (350 days in SYF; L/S 20) showed equivalent features with comparable
intensities of absorption bands at 285 eV (aromatic carbon bonded to either proton or
carbon) and at 289 eV (aromatic and/or aliphatic carboxylic acids).
After normalization to the K L3-edge intensity, the continuum step of C-absorption
(i.e. the plateau after the absorption edge) decreased after one year reaction time to indicate
that a lower amount of organic material is associated with clay particles. However, this
apparent decrease may be overestimated because of the different potassium concentrations
in initial and reacted samples.
DISCUSSION
Mineralogical evolution
The main goal of this experimental investigation was to determine the effect of basic
solutions which might result from the initial alteration of concrete on the crystal-chemistry
of typical clays from the geological environment of future French Meuse - Haute Marne
underground laboratory. Such alteration of clays under low-to-moderate temperature and
high-pH conditions was described previously by Eberl et al. (1993), Bauer and Berger
(1998) and Bauer and Velde (1999). During their smectite alteration experiments, Bauer
and Velde (1999) observed an initial decrease in the smectite CSDS followed by a decrease
of the clay expandability via illite-smectite (I-S) MLM phases, that is illitization, in
agreement with Eberl et al. (1993).

17
Accordingly, in our experiments, XRD pattern modeling indicates that a limited
proportion of smectite transforms into a randomly interstratified MLM containing about
50% of illite layers after one year (L/S = 80). Indeed, XRD shows that in reacted sample
490 the amount of smectite, which was initially about 10% (Claret, 2001), decreases with
reaction time simultaneously with the neoformation of this MLM phase (Figures 7 and 8).
On the other hand, no precipitation of this MLM phase or dissolution of smectite is
observed in reacted samples 447 and 494 even though they initially contain discrete
smectite. The contrasting scattering powers of the various phases present in the clay
fraction may account for this apparent inconsistency as the presence of phases with high
scattering powers in these samples could conceal the likely presence of a MLM phase
similar to that identified in sample 490. For example, the presence of newly formed
11.45 Å tobermorite-like phase in sample 494 or the overwhelming intensity of smectite in
sample 447 can impede the characterization of such a MLM phase. The very high
scattering amplitude of the smectite phase also hinders its possible decreasing amount with
increasing reaction time if the initial discrete smectite is not strongly depleted as in sample
490.
The very high pH conditions of the experiments were found to be compatible with
the neoformation of tobermorite-like phases in sample 494 (L/S = 80 - 74 days to 1 year
terms) as these phases are usually formed under similar conditions during the binding
process of Portland cements (Taylor, 1992). SEM data indicate that this phase is present as
traces in all altered samples although XRD detected its presence only in sample 494. At
present there is no consistent explanation for the higher proportion of this tobermorite-like
phase in altered sample 494.
In conclusion, except for the unusual precipitation of this tobermorite-like phase, the
observed mineralogical evolution of clay minerals, and especially that of the discrete
smectite phase is compatible with earlier experiments (Eberl et al., 1993; Bauer and Velde,

18
1999) and leads to the formation of randomly interstratified MLM phases. However, one
may note that the observed evolution is very limited and affects only the discrete smectite
phase, leaving all other clay phases unaltered. In particular, the randomly interstratified
MLM containing about 65% of illite layers which makes up most of the clay-size fraction
(Claret, 2001) and the discrete illite phase seem unaltered in all experiments. In addition,
the discrete smectite phase is only partly affected, as its decreasing proportion could be
observed only for sample 490 which initially contained about 10% of this phase (Table 2).
This decrease was undetectable for sample 447 which initially contained about 20% of
discrete smectite, likely because of the high scattering amplitude of this phase. On the
contrary evolutions described in the literature affect entirely the smectite phase (Eberl et
al., 1993; Bauer and Velde, 1999). The origin of such a limited reactivity of clay phases
when in contact with alkaline solutions will be discussed below.
Evolution of solution chemistry
Except for sample 447 for which the observed pH drop was induced by the
dissolution of micro-crystalline quartz , solution pH did not change significantly
throughout the experiments. Consistently with the limited mineralogical evolution of clays,
this steady pH indicates that there is no significant fluid-clay reaction as a pH drop is
expected as a result of clay-fluid interaction because of the speciation of Al3+ and Si4+.
Chermak (1992) measured such a drop, from 12.91 down to 6.68, of the quenched pH in
his batch experiments with fine grained Opalinus Shale (35 days - 200°C). Decarreau
(1999) also observed such a pH drop in the experiments conducted with samples from the
Callovo-Oxfordian formation in alkaline solution. After one week, depending on starting
solution, pH decreased from 12.6 to 7.0 or from 13.5 to 10 as a result of the OH-
consumption. One may note that in these experiments the limited liquid : solid ratio (3:1)
enhanced this pH drop. Bauer and Berger (1998) observed the same evolution of solution

19
pH in his batch experiments at 35°C and 80°C for kaolinite and smectite for initial KOH
concentrations below 0.1 M.
The limited reactivity of clays is confirmed by the rather low Si and Al
concentrations measured in solution. The only high [Si] value (4134mg/L), which was
measured for sample 447, results from the dissolution of micro-crystalline quartz. All other
measured values are similar, or lower, to that measured by Bauer and Berger (1998) in
KOH 0.1 M solution (initial in situ pH 11.47 at 80°C).
The initial interlayer cation (Ca2+) is likely to have been rapidly exchanged for K+ at
the beginning of the reaction as shown by the initial drop of [K+] in solution. Liberated Ca,
as well as that introduced in the initial SYF solution are not retrieved in solution, and
probably precipitated as CASH or tobermorite-like phases, which were observed by SEM.
This hypothesis is supported by the systematic dissolution of calcite traces in reacted
sample 494 in which the tobermorite-like phase was observed (not shown).
Influence of organic matter
The measured increase of DOC concentration with reaction time indicates that the
organic material is much more affected than clays by alkaline solutions. Such a behavior
was expected as treatment with basic NaOCl solutions, for example, is recommended to
remove organic material from clay samples (Moore and Reynolds, 1989). With increasing
reaction time, organic matter in solution is gradually decomposed as shown by the
evolution of DOC size distribution (Figure 2).
STXM investigations indicate that the organic material is preferentially released
from the basal surfaces of clay particles whereas the edges of these particles are still
covered after one year. As will be discussed below, it is likely that this specific reactivity
of the organic clay coverage is responsible for the observed limited alteration of clay
minerals in the present high pH experiments. This hypothesis is supported by the strong

20
dissolution features observed with SEM on mineral species which were not initially
covered by organics such as quartz.
Because of the preferential desorption of the organic material from their basal
surfaces, an important proportion of clay particle surface area is accessible to alkaline
solution after several months of reaction. However, in spite of this increased direct contact
surface between the clay minerals and the solution, the evolution of these minerals remains
very limited. Bauer and Berger (1998) explained contrasting reactivity observed between
kaolinite and smectite in high molar KOH solutions at 35° and 80°C by structural
considerations and emphasized the main role of crystal edges. The essential role played by
crystal edges in the alteration process of clay minerals may also account for the low
alteration rate observed in our experiments, as access to these edges is blocked by organic
material throughout the experiments as shown by STXM investigations.
The dominant influence of edge surface sites on the dissolution rate has also been
demonstrated for biotite based on macroscopic experiments conducted at low pH (Turpault
and Trotignon, 1994). Consistently, Bosbach et al. (2000) observed that the proton-
promoted dissolution of hectorite particles takes place exclusively at the crystal edges, the
basal surfaces being completely unreactive on the experiment time scale. Furthermore,
crystal edges are readily blocked by the presence of organic material as demonstrated by
Chin and Mills (1991). The latter authors clearly showed that the presence in solution of
humic acids from soils (50 mg L-1) inhibit kaolinite dissolution, and hypothesized that
large humic acid molecules bind to multiple surface Al sites preventing the adsorption of
both H+ and small organic ligands. Such a passivation of the reactive clay edges by organic
material coverage was demonstrated by Taubald et al. (2000) who showed that chlorite
which is unstable under oxidizing conditions showed no tendency to react during their
experiment.

21
CONCLUSION
The effect of alkaline solutions on clay mineralogy was experimentally investigated
at 60°C as a function of time to mimic the effect of a pH plume resulting from the
alteration of cements on the clay formation hosting the future French underground
laboratory. From the three clay phases initially present, that is discrete smectite, discrete
illite, and a randomly interstratified MLM phase containing about 65% of illite layers, only
the former one was shown to transform. The evolution of discrete smectite to a randomly
interstratified MLM phase containing about 50% of illite layers is consistent with earlier
comparable experiments (Eberl et al., 1993; Bauer and Velde, 1999). The neoformation of
a tobermorite-like phase was the only additional significant mineralogical evolution.
Coverage of clay mineral outer surfaces, and more especially of the crystal edges,
may be responsible for the very limited character of the observed mineralogical
transformation by blocking the access of the alkaline solution to these most reactive sites.
After 1 year reaction time, bonding of organic ligands to crystal edges is still effective
whereas basal surfaces appear to be free of the initial organic coverage. As a result,
aqueous concentration of DOC is high but does not promote clay mineral dissolution by
complexing Al or Si. The average size of this colloidal organic material tends to decrease
with increasing reaction progress.
At lower pH values than those used in this study (∼7-8 e.g.) such as those resulting
form the pH buffering by carbonates, such humic material may influence the sorption of
metal ions, and more especially that of actinides. Their complexation both in solution and
on solid surfaces by forming ternary surface complexes (Schmeide et al., 2000) will be an
essential parameter for their fate.

22
ACKNOWLEDGEMENTS
The results presented in the present article were collected during a Ph.D. thesis
granted by Andra (French National Agency for Nuclear Waste Disposal). Andra is thanked
for permission to publish this manuscript. BL and FC acknowledge financial support from
Andra. Spectromicroscopic data was collected using the X-1A STXM developed by the
group of Janos Kirz and Chris Jacobsen at SUNY Stony Brook, with support from the
Office of Biological and Environmental Research, U.S. DoE under contract DE-FG02-
89ER60858, and from the NSF under grant DBI-9605045. The zone plates were developed
by Steve Spector and Chris Jacobsen of Stony Brook and Don Tennant of Lucent
Technologies Bell Labs with support from the NSF under grant ECS-9510499.
REFERENCES
Anderson, K., Allard, B., Bengtsson, M. and Magnusson, B. (1989) Chemical composition
of cement pore waters. Cement and Concrete Research, 19, 327-332.
Bauer, A. and Berger, G. (1998) Kaolinite and smectite dissolution rate in high molar KOH
solutions at 35°C and 80°C. Applied Geochemistry, 13, 905-916.
Bauer, A. and Velde, B. (1999) Smectite transformation in high molar KOH solutions.
Clay Minerals, 34, 259-273.
Bauer, A., Velde, B., and Berger, G. (1998) Kaolinite transformation in high molar KOH
solutions. Applied Geochemistry, 13, 619-629.
Berner, U. (1990) A thermodynamic description of the evolution of porewater chemistry
and uranium speciation during the degradation of cement. Nagra NTB, Report 90-12,
Baden, Switzerland.

23
Bosbach, D., Charlet, L., Bickmore, B. and Hochella, M.F. (2000) The dissolution of
hectorite: In-situ, real-time observations using atomic force microscopy. American
Mineralogist, 85, 1209-1216.
Bouchet, A. and Rassineux, F. (1997) Echantillons d'argiles du forage EST 104 : Etude
minéralogique approfondie. Andra, Report DR-P-0ERM-98-007A, Chatenay-Malabry,
France, 107 pp.
Cama, J., Ganor, J., Ayora, C. and Lasaga, C.A. (2000) Smectite dissolution kinetics at 80
degrees C and pH 8.8. Geochimica et Cosmochimica Acta, 64, 2701-2717.
Carroll, S.A. and Walther, J.V. (1990) Kaolinite dissolution at 25°, 60° and 80°C.
American Journal of Science, 290, 797-810.
Carroll-Webb, S.A. and Walther, J.V. (1988) A surface complex reaction model for the
pH-dependence of corundum and kaolinite dissolution. Geochimica et Cosmochimica
Acta, 52, 2609-2623.
Cassagnabere, A., Parneix, J.C., Sammartino, S., Griffault, L., Maeder, U. and
Milodowski, T. (2001) Mineralogical evolution of bitumimous marl adjacent to an
alkaline water conducting feature at the Maqarin analogue site. Pp. 367-370 in: Water-
Rock Interaction (R. Cidu, editor). Balkema, Liss, Tokyo.
Chermak, J.A. (1992) Low temperature experimental investigation of the effect of high pH
NaOH solutions on the Opalinus shale, Switzerland. Clays and Clay Minerals, 40, 650-
658.
Chermak, J.A. (1993) Low temperature experimental investigation of the effect of high pH
KOH solutions on the Opalinus shale, Switzerland. Clays and Clay Minerals, 41, 365-
372.
Chin, P.F. and Mills, G.L. (1991) Kinetics and mechanisms of kaolinite dissolution : effect
of organic ligands. Chemical Geology, 90, 307-317.

24
Claret, F. (2001) Caractérisation structurale des transitions minéralogiques dans les
formations argileuses : Contrôles et implications géochimiques des processus
d'illitisation. Cas particulier d'une perturbation alcaline dans le Callovo-Oxfordien
Laboratoire souterrain Meuse-Haute-Marne. Ph.D. thesis, Université Joseph Fourrier,
Grenoble, France, 174pp.
Cody, G.D., Botto, R.E., Ade, H., Behal, S., Disko, M. and Wirick, S. (1995) Inner-Shell
Spectroscopy and imaging of a subbituminous coal: In-situ analysis of organic and
inorganic microstructure using C(1s)-, Ca(2p)-, and Cl(2s)-NEXAFS. Energy and
Fuels, 9, 525-533.
Decarreau, A. (1999) Etude expérimentale des réactions entre argiles de sites de stockage
français et eaux cimentaires. Andra, Report D-RP-1UPT-99-001, Chatenay-Malabry,
France, 38 pp.
Drits, V.A. and Sakharov, B.A. (1976) X-Ray structure analysis of mixed-layer minerals.
Dokl. Akad. Nauk SSSR, Moscow, 256 pp.
Drits, V.A., Srodon, J. and Eberl, D.D. (1997) XRD measurement of mean crystallite
tickness of illite and illite/smectite: Reappraisal of the Kubler index and the Scherrer
equation. Clays and Clays Minerals, 45, 461-475.
Eberl, D.D., Velde, B. and Mc Cormick, T. (1993) Synthesis of illite-smectite from
smectite at Earth surface temperatures and high pH. Clay Minerals, 28, 49-60.
Faure, P., Landais, P. and Griffault, L. (1999) Behavior of organic matter from Callovian
shales during low-temperature air oxidation. Fuel, 78, 1515-1525.
Francis, J.T. and Hitchcock, A.P. (1992) Inner-shell spectroscopy of p-benzoquinone,
hydroquinone, and phenol: Distiguishing quinoid and benzenoid structures. Journal of
Physical Chemistry, 96, 6598-6610

25
Haworth, A., Sharland, S.M. and Tweed, C.J. (1989) Modeling of the degradation of
cement in a nuclear waste repository. Material Research Society Symposium
Proceedings, 127, 447-454.
Henke, B.L., Gullikson, E.M. and Davis, J.C. (1993) X-ray interactions: Photoabsorption,
scattering, transmission, and reflection at E=50-30000 eV, Z=1-92. Atomic Data and
Nuclear Data Tables, 54, 181-342.
Hitchcock, A.P. and Mancini, D.C. (1994) Bibliography and database of inner-shell
excitation spectra of gas phase atoms and molecules. Journal of Electron Spectroscopy
and Related Phenomena, 67, 1-132.
Hitchcock, A.P., Newbury, D.C., Ishii, I., Stöhr, J., Horsley, J.A., Redwing, R.D., Johnson,
A.L. and Sette, F. (1986) Carbon K-shell excitation of gaseous and condensed cyclic
hydrocarbons: C3H6, C4H8, C5H8, C5H10, C6H10, C6H12, and C8H8. Journal of Chemical
Physics, 85, 4849-4862.
Hitchcock, A.P., Urquart, S.G. and Rightor, E.G. (1992) Inner shell spectroscopy of
benzaldehyde, terephthalaldehyde, ethyl benzoate, terephthaloyl chloride, and
phosgene: Models for core excitation of poly (ethylene terephathalate). Journal of
Physical Chemistry, 96, 8736-8750.
Huang, W.L. (1993) The formation of illitic clays from kaolinite in KOH solution from
225°C to 350°C. Clays and Clay Minerals, 41, 645-654.
Huertas, F.J., Caballero, E., de Cisneros, C.J., Huertas, F. and Linares, J. (2001) Kinetics
of montmorillonite dissolution in granitic solutions. Applied Geochemistry, 16, 397-407.
Inoue, A., Bouchet, A., Velde, B. and Meunier, A. (1989) Convenient technique for
estimating smectite layer percentage in randomly interstratified illite/smectite minerals.
Clays and Clay Minerals, 37, 227-234.

26
Ishii, I. and Hitchcock, A.P. (1987) A quantitative experimental study of the core excited
electronic states of foramide, formic acid, and formyl fluoride. Journal of Chemical
Physics, 87, 830-839.
Jacobsen, C., Williams, S., Anderson, E., Browne, M.T., Buckley, C.J., Kern, D., Kirz, J.,
Rivers, M. and Zhang, X. (1991) Diffraction-limited imaging in a scanning transmission
x-ray microscope. Optics Communications, 86, 351--364.
Jacobsen, C., Wirick, S., Flynn, G. and Zimba, C. (2000) Soft X-ray spectroscopy with
sub-100nm spatial resolution. Journal of Microscopy, 197, 173-184.
Jeffries, N.L., Tweed, C.J. and Wisbey, S.J. (1988) The effects of changes in pH in a clay
surrounding a cementitious repository. Material Research Society Symposium
Proceedings, 112, 43-52.
Lunden, I. and Andersson, K. (1989) Modelling the mixing of cement pore water and
groundwater using the PHREEQC code. Material Research Society Symposium
Proceedings, 127, 949-956.
Ma, Y., Chen, C.T., Meigs, G., Randall, K. and Sette, F. (1991) High-resolution K-shell
photoabsorption measurements of simple molecules. Physical Review A, 44, 1848-1858.
Mohnot, S.M., Bae, J.H. and Foley, W.L. (1987) A study of alkali/mineral reactions. SPE
Reservoir Engineering, 653-663.
Moore, D.M. & Reynolds, R.C., Jr (1989) X-ray diffraction and the identification and
analysis of clay minerals. Oxford University Press, Oxford & New York, 322 pp.
Nagra (1995) Column experiments : Results of experiments and Modelling. Nagra NTB,
Report 95-70, Baden, Switzerland.
Neuhäusler, U., Abend, S., Jacobsen, C. and Lagaly, G. (1999) Soft X-Ray
spectromicroscopy on solid-stabilized emulsions. Colloid Polymer Science, 277, 719-
726.

27
Rassineux, F., Griffault, L., Meunier, A., Berger, G., Petit, S., Viellard, P., Zellagui, R. and
Munoz, M. (2001) Expandability-layer stacking relationship during experimental
alteration of a Wyoming bentonite in pH 13.5 solutions at 35 and 60°C. Clay Minerals,
36,197-210.
Reardon, E.J. (1990) An ion interaction model for the determination of chemical
equilibrium in cement /water systems. Cement and Concrete Research, 20, 175-192.
Robin, M.B., Ishii, I., McLaren, R. and Hitchcock, A.P. (1988) Fluorination effects on the
inner shell spectra of unsaturated molecules. Journal of Electron Spectroscopy and
Related Phenomena, 47, 53-92.
Sakharov, B.A., Lindgreen, H., Salyn, A. and Drits, V.A. (1999) Determination of illite-
smectite structures using multispecimen X-ray diffraction profile fitting. Clays and
Clays Minerals, 47, 555-566.
Schmeide, K., Pompe, S., Bubner, M., Heise, K.H., Bernhard, G. and Nitsche, H. (2000)
Uranium(VI) sorption onto phyllite and selected minerals in the presence of humic acid.
Radiochimica Acta, 88, 723-728.
Spector, S., Jacobsen, C. and Tennant, D. (1997) Process optimization for production of
sub-20 nm soft X-ray zone plates. Journal of Vacuum Science and Technology B, 15,
2872-2876.
Taubald, H., Bauer, A., Schafer, T., Geckeis, H., Satir, M. and Kim, J.I. (2000)
Experimental investigation of the effect of high-pH solutions on the Opalinus Shale and
the Hammerschmiede Smectite. Clay Minerals, 35, 515-524.
Taylor, H.F.W. (1992) Tobermorite, jennite, and cement gel. Zeitschrift für
Kristallographie, 202, 41-50.
Turpault, M.P. and Trotignon, L. (1994) The dissolution of biotite single crystals in dilute
HNO3 at 24°C: Evidence of an anisotropic corrosion process of micas in acidic
solutions. Geochimica et Cosmochimica Acta, 58, 2671-2775.

28
Velde, B., Suzuki, T. and Nicot, E. (1986) Pressure-Temperature-Composition of
illite/smectite mixed-layer minerals: Niger delta mudstones and other examples. Clays
and Clay Minerals, 34, 435-441.
Viellard, P. and Rassineux, F. (1992) Thermodynamic and geochimical modelling of the
alteration of two cement matrices. Applied Geochemistry, 1, 125-136.
Winn, B., Ade, H., Buckley, C., Howells, M., Hulbert, S., Jacobsen, C., Kirz, J., McNulty,
I., Miao, J., Oversluizen, T., Pogorelsky, I. and Wirick, S. (1996) X1A: second
generation undulator beamlines serving soft x-ray spectromicroscopy experiments at the
NSLS. Reviews of Scientific Instruments, 67, 1-4.
Wolery, T.J. (1983) EQ3NR a computer program for geochimical aqueous speciation-
solubility calculations: User's guide and documentation. Lawrence Livermore National
Laboratory UCRL-53414, Livermore, CA, USA, 202 pp.
Zhang, X., Ade, H., Jacobsen, C., Kirz, J., Lindaas, S., Williams, S. and Wirick, S. (1994)
Micro-XANES: chemical contrast in the scanning transmission x-ray microscope.
Nuclear Instruments and Methods in Physics Research A, 347, 431-435.

29
Table 1. Total organic carbon (TOC) and sulfur content (in weight percent) of the initial
clay samples.
Sample TOC Sulphur
447 1.32 0.2439
490 1.31 0.2133
494 1.32 0.135
516 1.36 0.2596
Table 2. Mineralogical composition of the clay size fraction (< 2 µm) of the initial clay
samples as determined by Claret (2001) from experimental XRD profile fitting using
the multi-specimen technique (Sakharov et al., 1999). Data derived from the
characterization of the Ca-saturated and EG solvated samples. %Sm indicates the
relative proportion of expandable layers in randomly interstratified mixed-layer
minerals (MLM). Ab. indicates the relative proportion of the various phases in the clay
fraction.
Sample Smectite MLM Illite Kaolinite Chlorite
%Sm Ab. %Sm Ab. %Sm Ab. Ab. Ab.
447 100 20 65 65 5 15 0 0
490 100 13 65 66 5 20 0 1
494 100 2 65 74 5 19 4 1
516 100 2 65 63 5 23 9 2

30
Table 3. Composition of the Solid Young Fluid (SYF) and the initial solution pH.
NaOH 2.606 g/l
KOH 9.033 g/l
Ca(OH)2 0.166 g/l
PH 13.22
Table 4. d spacings (d001) of the different layer types used for the calculation of mixed
layer mineral XRD patterns.
Illite Smectite 2 layers Smectite 1 layerEthylene glycol
solvated 9.98 Å 16.65-16.7 Å 12.9-13.3 Å
Air dried state 9.98 Å 14.8-15 Å 12.5-12.8 Å

31
Table 5. Concentration of the different aqueous species as a function of time.
Reaction time(days)
pH Si(mg/L)
Al(mg/L)
Na(mg/L)
K(mg/L)
DOC(mg/L)
Sulfate(mg/L)
Sample 447 L/S 201 13.17 53.7 14.4 1433.6 4632.0 30.3 29.53 13.15 193.6 12.5 1452.7 4416.0 46.9 52.86 13.21 348.5 9.4 1402.0 4113.0 67.2 79.29 13.16 500.0 7.6 1426.7 4186.0 80.3 92.0
16 13.13 1101.0 5.8 1411.0 4138.0 101.9 92.430 13.09 1512.6 5.7 1408.4 4148.0 132.8 100.374 12.97 2139.0 5.4 1498.0 4489.0 170.1 132.0
145 12.56 2720.8 5.3 1466.6 4645.8 229.1 145.5350 12.25 4134.5 6.2 1472.0 4427.0 269.5 181.4
Sample 490 L/S 202 13.21 53.0 14.8 1452.7 4289.0 27.3 27.34 13.21 79.7 24.6 1405.1 3995.0 36.6 36.89 13.18 99.2 32.9 1448.0 4226.0 76.8 59.4
16 13.17 139.4 41.1 1436.2 4190.0 110.5 80.430 13.13 158.1 46.2 1451.0 4148.0 131.8 120.474 13.1 215.0 54.8 1499.5 4289.0 139.6 145.0
145 13.06 334.2 48.4 1498.0 4268.4 147.8 192.0350 13.04 269.5 49.4 1492.4 4057.6 150.9 195.1
Sample 494 L/S 201 13.19 33.2 11.6 1494.5 4603.0 15.3 13.93 13.2 62.0 23.2 1422.3 4450.0 20.0 18.46 13.21 86.3 33.5 1422.0 4330.0 34.0 23.49 13.2 100.2 42.7 1428.8 4254.0 42.8 28.2
16 13.19 136.9 48.2 1422.6 4267.0 73.6 36.630 13.19 142.3 57.7 1439.6 4326.0 92.1 54.774 13.18 144.2 73.1 1484.1 4356.0 110.4 78.0
145 13.08 195.7 73.8 1457.6 4425.8 134.2 79.4350 13.04 223.7 76.2 1418.0 4286.2 180.1 81.7
Sample 516 L/S 201 13.22 31.2 21.0 1417.8 4913.0 21.1 22.63 13.19 46.6 29.6 1435.7 5156.0 23.1 41.36 13.22 70.4 50.2 1462.1 4157.0 60.9 68.09 13.25 82.2 65.7 1469.3 4378.0 48.0 99.1
16 13.22 93.4 92.5 1447.3 4404.0 76.2 118.230 13.22 118.6 114.1 1481.0 4480.0 99.1 149.974 13.2 159.4 148.8 1497.0 4789.0 101.0 201.0
150 13.09 176.9 162.0 1498.0 4662.0 113.4 219.9350 13.05 141.4 191.8 1491.6 5083.8 119.5 239.9
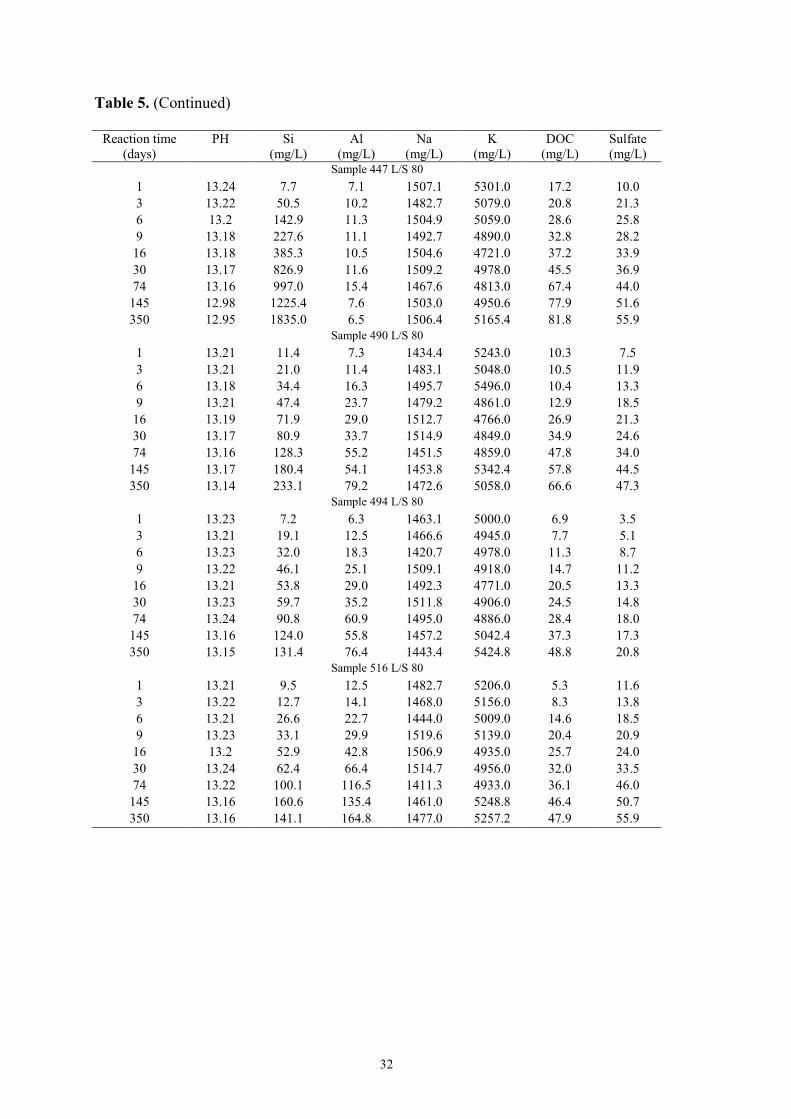
32
Table 5. (Continued)
Reaction time(days)
PH Si(mg/L)
Al(mg/L)
Na(mg/L)
K(mg/L)
DOC(mg/L)
Sulfate(mg/L)
Sample 447 L/S 801 13.24 7.7 7.1 1507.1 5301.0 17.2 10.03 13.22 50.5 10.2 1482.7 5079.0 20.8 21.36 13.2 142.9 11.3 1504.9 5059.0 28.6 25.89 13.18 227.6 11.1 1492.7 4890.0 32.8 28.2
16 13.18 385.3 10.5 1504.6 4721.0 37.2 33.930 13.17 826.9 11.6 1509.2 4978.0 45.5 36.974 13.16 997.0 15.4 1467.6 4813.0 67.4 44.0
145 12.98 1225.4 7.6 1503.0 4950.6 77.9 51.6350 12.95 1835.0 6.5 1506.4 5165.4 81.8 55.9
Sample 490 L/S 801 13.21 11.4 7.3 1434.4 5243.0 10.3 7.53 13.21 21.0 11.4 1483.1 5048.0 10.5 11.96 13.18 34.4 16.3 1495.7 5496.0 10.4 13.39 13.21 47.4 23.7 1479.2 4861.0 12.9 18.5
16 13.19 71.9 29.0 1512.7 4766.0 26.9 21.330 13.17 80.9 33.7 1514.9 4849.0 34.9 24.674 13.16 128.3 55.2 1451.5 4859.0 47.8 34.0
145 13.17 180.4 54.1 1453.8 5342.4 57.8 44.5350 13.14 233.1 79.2 1472.6 5058.0 66.6 47.3
Sample 494 L/S 801 13.23 7.2 6.3 1463.1 5000.0 6.9 3.53 13.21 19.1 12.5 1466.6 4945.0 7.7 5.16 13.23 32.0 18.3 1420.7 4978.0 11.3 8.79 13.22 46.1 25.1 1509.1 4918.0 14.7 11.2
16 13.21 53.8 29.0 1492.3 4771.0 20.5 13.330 13.23 59.7 35.2 1511.8 4906.0 24.5 14.874 13.24 90.8 60.9 1495.0 4886.0 28.4 18.0
145 13.16 124.0 55.8 1457.2 5042.4 37.3 17.3350 13.15 131.4 76.4 1443.4 5424.8 48.8 20.8
Sample 516 L/S 801 13.21 9.5 12.5 1482.7 5206.0 5.3 11.63 13.22 12.7 14.1 1468.0 5156.0 8.3 13.86 13.21 26.6 22.7 1444.0 5009.0 14.6 18.59 13.23 33.1 29.9 1519.6 5139.0 20.4 20.9
16 13.2 52.9 42.8 1506.9 4935.0 25.7 24.030 13.24 62.4 66.4 1514.7 4956.0 32.0 33.574 13.22 100.1 116.5 1411.3 4933.0 36.1 46.0
145 13.16 160.6 135.4 1461.0 5248.8 46.4 50.7350 13.16 141.1 164.8 1477.0 5257.2 47.9 55.9

33
Table 6. Assignment of energy bands to block building groups of organic matter.
Energy [eV] Transition (s) Functional group
285 1s-π* Carom.-C, Carom.-Ha
287 1s-π* Carom.-OHa,b
288 1s-3p/σC-H* CH2, CH3c
289 1s-π*
1s-2π*
C=O, COOH,COORc,d,e
Carom.-H, Carom.-Cb
290 1s-4p CH2, CH3c
291 1s-2π* Carom.-OHe
297 LIII Potassiumf
300 LII Potassiumf
Note: a(Hitchcock et al., 1992); b(Francis and Hitchcock,
1992) c(Hitchcock et al., 1986);d(Ishii and
Hitchcock, 1987); e(Robin et al., 1988); f(Henke
et al., 1993)

34
FIGURE CAPTION
Figure 1 – Absorption of a smectite suspension in organic-containing solution. The image
collected at Ebelow illustrates the very limited absorption of this dilute suspension of
thin smectite particles. The ratio-image -log()E(Abs)E(Abs
below
above ) permits to localize
specifically organic functional groups absorbing, in this case, at 285 eV.
Figure 2 – Evolution of the dissolved organic carbon (DOC) size distribution as a function
of time for sample 516 (L/S = 80). Open and solid triangles show the DOC size
distribution after 74 days and 1 year reaction times, respectively.
Figure 3 – Distribution of aqueous species as a function of time for sample 516 after 1
year reaction time (L/S = 80). Si, Al, and DOC are shown as open squares, solid
circles, and solid triangles, respectively.
Figure 4 – XRD patterns of sample 447 as a function of reaction time (L/S =80 - Sr-
saturation and ethylene glycol solvation). Positions of the diffraction maxima are
indexed. Quartz (qz) and calcite (Cal) impurities are labeled.
Figure 5 – XRD patterns of sample 494 as a function of reaction time (L/S =80 - Sr-
saturation and ethylene glycol solvation). Positions of the diffraction maxima are
indexed. Quartz (qz) and calcite (Cal) impurities are labeled. The rational series of
reflections associated with the newly formed tobermorite-like phase are shown as
dashed lines.
Figure 6 – XRD patterns of sample 494 as a function of sample preparation (L/S =80 - 1
year). Positions of the diffraction maxima are indexed, and the reflections attributed to
the tobermorite-like phase are shown as dashed lines. a) Na-saturation and deep
vacuum conditions (10-5 torr) during data collection to ensure complete dehydration of
expandable interlayers. b) Na-saturation and air-dried (AD) state c) Mg-saturation and
AD state. d) Sr-saturation and AD state e) Sr-saturation and ethylene glycol solvation.

35
Figure 7 – XRD patterns of sample 490 as a function of reaction time (L/S =80 - Sr-
saturation and ethylene glycol solvation). Positions of the diffraction maxima are
indexed, and Quartz (qz) impurities are labeled. The position of the smectite
contribution is shown as an irregular dashed line.
Figure 8 – Mineralogical characterization of sample 490 (L/S =80 - 1 year) using the
multi-specimen method described by (Sakharov et al., 1999). Experimental XRD
patterns are shown as crosses, whereas calculated patterns are shown as solid lines. a)
Sr-saturation and ethylene glycol (EG) solvation. Contributions of the initial MLM
phase with about 70% of illite layers and of the newly formed MLM phase with about
50% of illite layers are shown as solid and gray lines, respectively. The position of the
latter contribution is shown as a dashed line. I, K, and C labels indicate the position of
diffraction lines for illite, kaolinite, and chlorite, respectively. b) Sr-saturation and
ethylene glycol (EG) solvation. Optimum fit to the experimental data is shown as a
solid line. In addition to the two contributions from MLM phases shown on Figure 8a,
this calculated pattern includes that of discrete illite, kaolinite, and chlorite. Na-
saturation and ethylene glycol (EG) solvation. c) Sr-saturation and air dried state.
Optimum fit to the experimental data is shown as a solid line. The contributions to the
diffracted intensity are similar to that in Figure 8b.
Figure 9 – XANES spectra recorded at the carbon K-edge on unreacted sample 447 (solid
line), and on sample 447 after one year reaction time (dashed line). Intensity is
normalized to the L3 absorption band of K at 297.3 eV. Additional peak at 300 eV
corresponds to the L2 absorption band of K (Henke et al., 1993).
Figure 10 – Scanning transmission X-ray microscopy images of unreacted sample 447 (a,
b, and c) and of sample 447 after 1 year reaction with the simple young fluid (L/S = 80
- d, e, and f). The two sets of images are topped by a labeled sketch of the images for
descriptive purposes (see text). Images 10a and 10d were taken at 297.3 eV, dark gray

36
values indicating a high combined absorption by carbon and K. Images 10b and 10e
are ratio images to visualize the distribution of potassium (Ebelow = Σ(280-290 eV),
Eabove = 297.3 eV). Images 10c and 10f are ratio images to visualize the distribution of
carbon (Ebelow = 280 eV, Eabove = Σ(285-290 eV). Light gray values in ratio images
indicate high K (b, and e) /C (c and f) contents (see text).

Abs(Ebelow)
Abs(Eabove)
-Log(Abs(Eabove)/Abs(Ebelow))
Claret et al., Fig.1

Claret et al., Fig.2
100%
40
50
60
70
80
90
100
1.E+03 1.E+04 1.E+05 1.E+06
Filter cut off (Dalton)
Fra
ctio
n o
f D
OC
in t
he
filt
rate
(%
)

Claret et al., Fig.3
100%
80
85
90
95
100
1.E+03 1.E+04 1.E+05 1.E+06
Filter cut off (Dalton)
Fra
ctio
n o
f aq
ueo
us
spec
ies
in f
iltra
te (
%)

Claret et al., Fig.4
1 day
1 year
17.1 Å
10.00 Å
7.14 Å5.00 Å
qz
qz + clay phases
Cal qzqz qz 2.00 Å
0 5 10 15 20 25 30 35 40 45 50
Position 2θ Cu Kα

Claret et al., Fig.5
5.00 Å
10.00 Å
7.14 ÅCal
qz 2.00 Å
11.45 Å 2.29 Å5.72 Å 2.86 Å3.82 Å
14.2 Å
4.72 Å
0 5 10 15 20 25 30 35 40 45 50
Position 2θ Cu Kα
1 day
1 year

Claret et al., Fig.6
14.2 Å
10.00 Å
7.14 Å 5.00 Å
2 8 14 20
Position 2θ Cu Kα
11.45 Å
a
b
c
d
e

Claret et al., Fig.7
1 day
16 days
74 days
1 year
Smectite contribution
14.2 Å10.00 Å
7.14 Åqz5.00 Å
4.70 Å
0 5 10 15 20 25 30
Position 2θ Cu Kα
17.3 Å

Claret et al., Fig.8a
0 5 10 15 20 25 30 35 40 45 50
Position 2θ cu Kα
C
I
K/C
I
ICK/C
I

Claret et al., Fig.8b
0 5 10 15 20 25 30 35 40 45 50
Position 2θ Cu Kα

Claret et al., Fig.8c
0 5 10 15 20 25 30 35 40 45 50
Position 2θ Cu Kα

Claret et al., Fig. 9
280 285 290 295 300 305
norm
. abs
orpt
ion
[a.u
.]
eV

1
3
2
4
8
Claret et al., Fig. 10
5
7
6