Intergenerational class mobility and political preferences between 1970 and 1986 in the Netherlands
18
28 INTERGENERATIONAL CLASS MOBILITY AND POLITICAL PREFERENCES BETWEEN 1970 AND 1986 IN THE NETHERLANDS PAUL NIEUWBEERTA AND NAN DIRK DE GRAAF* 1 Introduction It is common knowledge that a person in a low class position has a higher chance of having a left-wing political preference than someone in a high class position. There are several labels for this phenomenon and they differ in accordance with the assumed mechanism behind the relationship between class and political preference. Well-known labels are class-based voting (Lipset, 1960, Parkin, 1981), democratic class struggle (Korpi, 1983), and status polarization (Campbell et al., 1960). In the Netherlands as well, there is a clear relation between someone's socio-economic class position and his/her political preference (Lijphart, 1974). Despite this knowledge, hardly any Dutch research focusses on this rela- tion. Due to the impact of The American Voter (Campbell et aI., 1960), most explanations used in the past three decades have been psychologically oriented and mainly made use of attitudes and values to explain voting behaviour. According to Van Deth (1986), this has hardly led to any signifi- cant hnprovement. In other countties, a great deal of research has been done on the relation between class position and political preference (e.g. Heath et al., 1985, 1991; Sainsburry, 1990). Before one decides to drop class as a social phenomenon explaining political preferences in the Netherlands, one has to investigate the explana- tory power class actually has. In order to understand the relation between class position and political preference, one has to consider that individuals who belong to a certain class do not form a homogeneous group. Within each class, a distinction can be drawn between those who, compared with their parents, climbed up ordown the social ladder (the intergenerationally mobile) and those who did not exhibit any such behaviour at all (the intergeneration- ally immobile). Previous research has shown that intergenerational mobility affects the relation between social class and political preference (Lipset. 1960). The implication is that in order to understand the relation between social class and political preference, one also has to take into account the effect of social mobility.
-
Upload
independent -
Category
Documents
-
view
0 -
download
0
Transcript of Intergenerational class mobility and political preferences between 1970 and 1986 in the Netherlands

28
INTERGENERATIONAL CLASS MOBILITY ANDPOLITICAL PREFERENCES BETWEEN 1970 AND 1986IN THE NETHERLANDS
PAUL NIEUWBEERTA AND NAN DIRK DE GRAAF*
1 Introduction
It is common knowledge that a person in a low class position has a higherchance ofhaving a left-wing political preference than someone in a high classposition. There are several labels for this phenomenon and they differ inaccordance with the assumed mechanism behind the relationship betweenclass and political preference. Well-known labels are class-based voting(Lipset, 1960, Parkin, 1981), democratic class struggle (Korpi, 1983), andstatus polarization (Campbell et al., 1960). In the Netherlands as well, thereis a clear relation between someone' s socio-economic class position andhis/her political preference (Lijphart, 1974).
Despite this knowledge, hardly any Dutch research focusses on this relation. Due to the impact of The American Voter (Campbell et aI., 1960), mostexplanations used in the past three decades have been psychologicallyoriented and mainly made use of attitudes and values to explain votingbehaviour. According to Van Deth (1986), this has hardly led to any significant hnprovement. In other countties, a great deal of research has been doneon the relation between class position and political preference (e.g. Heath etal., 1985, 1991; Sainsburry, 1990).
Before one decides to drop class as a social phenomenon explainingpolitical preferences in the Netherlands, one has to investigate the explanatory power class actually has. In order to understand the relation betweenclass position and political preference, one has to consider that individualswho belong to a certain class do not form a homogeneous group. Within eachclass, a distinction can be drawn between those who, compared with theirparents, climbed up ordown the social ladder (the intergenerationally mobile)and those who did not exhibit any such behaviour at all (the intergenerationally immobile). Previous research has shown that intergenerational mobilityaffects the relation between social class and political preference (Lipset.1960). The implication is that in order to understand the relation betweensocial class and political preference, one also has to take into account theeffect of social mobility.

29
There are numerous empirical studies that investigate the impact of socialmobility on voting behaviour (cf. Upset & Zetterberg, 1956; Upset &Bendix, 1959; Barber, 1970; Abramson, 1972). However, De GraMand Ultee(1990) held that none ofthese studies cameup with hypotheses about mobilityeffects that are accurate enough to be tested properly on the basis of astatistical model. Turner (1992) argued that this field of research is notempirically well developed either. Furthermore the conventional methods oftesting for mobility effects have not been adequate (Sobel, 1981).
The general question posed in this article is: what are the effects ofintergenerational social mobility on political preference in the Netherlands?To come np with answers to this question, it is important to determinepeople's class position as well and unequivocally as possible. Since it is quiteoften difficult to determine what the class position is of women (cf. Erikson& Goldthorpe, 1992b; De GraM and Heath, 1992), including them in theanalyses could lead to indistinguishable causes of the mobility effects encountered. For this reason, we decided to restrict our analyses to men only!.
Before we address our research question, we will devote more attention tothe relation between class and political preference.
2 Class and political preference
In order to gain better insight into the consequences of intergenerational classmobility for political preference, we will first discuss two main theories forthe explanation of individual voting behaviour.
The first theory is the instrumental theory (Downs, 1957). The basic ideahere is that voting behaviour is rational and has an economic purpose. Peopleknow which side their bread is buttered on. They can benefit from voting fora party that has political goals nearest to their own economic interests. Apolitical party can be used as an instrument to serve their interests. With theseassumptions, we can explain the relation between class position and votingbehaviour. People within a certain class are in the same economic and socialposition and have the same interests. Consequently, people within a certainclass will vote for the same party, i.e. the party that serves their interests best.
The second theory, referred to by Heath et al. (1985: 9) as the"expressivetheory, perceives voting as a social rather than an economic act. The assump~
tion is that one's political attitudes and preferences are influenced by thepeople one associates with. With this theory as well, it is easy to explain therelation between class position and political preference. In most cases, aperson associates with persons with the same class position. They are raisedby them, live in the same area, attend the same school and work together ascolleagues. Consequently, they will vote as their fellow class memberstraditionally vote.

30
These two theories are totally different with respect to their initial assumptions. However, in their predictions on the relation between class and politicalpreference, they are not contradictory, but complementary (Heath 1985: 9).To phrase the complementary nature of these two theories: People can votefor the same party because of their mutual interests and because they areinfluenced by each other. We might add to this that associating with personsfrom the same class makes people more conscious of their interests and moreaware of which party serves their interests best.
3 Mobility and political preference
From the above theories, wc can deduce predictions with regard to the effectsof intergenerational class mobility on political'preference. As we will argue,these theories lead to the same hypotheses.
When people leave their fathers' class and move to another class, theyacquire other interests. Their political preference, according to the instrumental theory, changes in the direction of the usual political preference of theirclass of destination. Furthermore, due to this mobility they also change theirsocial surroundings. They increasingly associate with members of their newattained class. These members, according to the expressive theory, influencethe political preference of the new aIlivals in their class. They also make itclear what the political interests of the members of this class are and whichpolitical party best serves these interests. Therefore, both the instrumentaland the expressive theory predict that the political preference of intergenerationally mobile people will change in the direction of the usual norms andvalues within their class of destination. In other words, the political preference of intergenerationally mobile persons will lie somewhere betweenwhat is usual in their class of origin and what is usual in their class ofdestination.
This latter prediction, however, lacks precision as to whether the politicalpreference of mobile people is closer to what is usual in their class ofdestination or to what is usual in their class of origin. On the basis of theinstrumental theory, one would predict that the politicalpreference ofmobilepeople will be closer tothe usual political preference within their class ofdestination than within their class oforigin. The obvious explanation is thatpeople's economic interest is with their current class. TIlis is what De Graafand Ultee (1990) called the economic hypothesis and it is our first hypothesis.
Yet, we have to recognize as well that some people OIljy recently arrivedin their class of destination and others years ago. It is likely that the longerthey are members of their destination class, the more influenced they will beby their class of destination in comparison with their class of origin. They

31
will also be more aware of what the interests of their destination class are.Our acculturation hypothesis therefore states that the longer one is amember ofthe destination class, the smaller the relative impact is ofthe classof origin in comparison with the class ofdestination. This hypothesis is inline with Elau's 'pattern of acculturation' (1956). One's attitudes and conceptions slowly adapt to the class of destination.
The acculturation hypothesis is a logical consequence of the instrumentalas well as the expressive theory. If someone leavesltis father's class, he willobviously acquire different interests. It is rather implausible that this personshould immediately be fully aware ofwhat ltis new interests are, since it takestime to gather information. Furthermore, in cases where people are intergenerationally mobile, it is quite unlikely that they would not have any contactwhatsoever with their class of origin. Social networks change slowly. Thelonger people are a member of their destination class, the more contact theyhave with members of that class.
An important question is whether the adaptation to a new class requiresthe same amount of time for all intergenerationallymobile people. Lipset(1960) assumed that upwardly mobile persons adapt more quickly to theirdestination class than downwardly mobile people. The underlying idea is thatpeople in general prefer to adopt a more prestigious identity, and thusmaximize their status. Furthermore, upwardly mobile people tend to associatewith members oftheir new attained class more often than downwardly mobilepeople do. Therefore, upwardly mobile people are more open to the normsand values of their attained class and acknowledge their new interests morequickly. Consequently, downwardly mobile people will orient themselvesmore to their origin class. whereas upwardly mobile people will orientthemselves more to their destination class. We label this hypothesis the statnsmaximization hypothesi~. Similar statements have been made by Lipset(1960: 240, 267-273), Parkin (1981: 51, 54), and Thorburn (1979). Asempirical evidence for it, they presented data from the United States andEngland. Some researchers, like Butler and Stokes (1969) and Abramson(1972), have challenged these findings. De Graaf & Ultee (1990) similarlyfailed to find such an effect in the Netherlands.
Aside from the distinction between upwardly and downwardly mobile, atime distinction can be drawn. According to the modernisation theory (Blau& Duncan, 1967), important developments in the stratification process haveoccurred. Characteristics ascribed by birth have become less important andcharacteristics acltieved by people themselves have become more important.Both these developments are thought to have led to individualisation inmodem societies. If these trends indeed occur, then people's class of destination has become more relevant and their class of origin less relevant forthe prediction of their political preference. We therefore formulate the
32
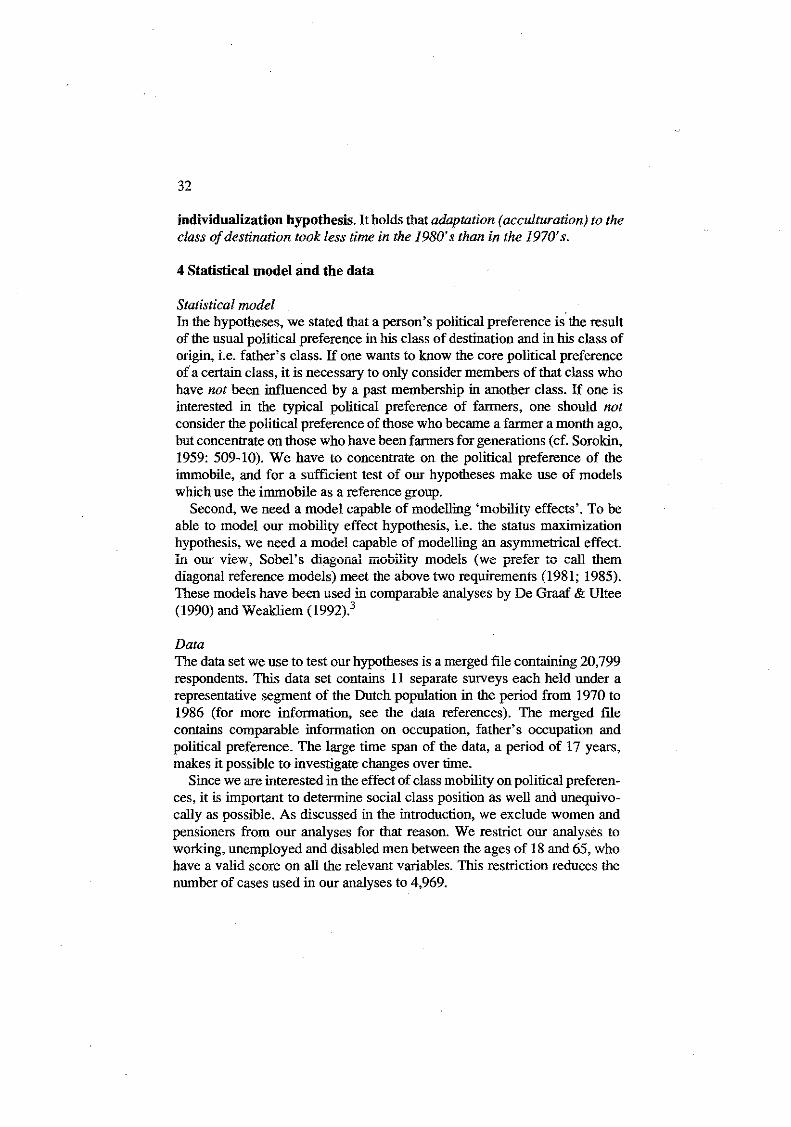
individualization hypothesis. It holds that adaptation (acculturation) to theclass ofdestination took less time in the 1980's than in the 1970's.
4 Statistical model and the data
Statistical rrwdelIn the hypotheses, we stated that a person's political preference is the resultof the usual political preference io his class of destination and io his class oforigin, Le. father's class. If one wants to know the cOre political preferenceofa certaio class, it is necessary to ouly consider members of that class whohave not been influenced by a past membership io another class. If one isioterested io the typical political preference of farmers, one should notconsider the political preference of those who became a farmer a month ago,but concentrate on those who have been farmers for generations (cf. Sorokin,1959: 509-10). We have to concentrate on the political preference of theimmobile, and for a sufficient test of our hypotheses make use of modelswhich use the immobile as a reference group.
Second, we need a model capable of modelliog 'mobility effects'. To beable to model our mobility effect hypothesis, Le. the status maximizationhypothesis, we need a model capable of modelliog an asymmetrical effect.In our view, Sobel's diagonal mobility models (we prefer to call t.~em
diagonal reference models) meet the above two requirements (1981; 1985).These models have been used io comparable analyses by De Graaf & Ultee(1990) and Weakliem (1992).3
DataThe data set we use to test our hypotheses is a merged file containing 20,799respondents. This data set contaios 11 separate surveys each held under arepresentative segment of the Dutch population io the period from 1970 to1986 (for more information, see the data references). The merged filecontaios comparable information on occupation, father's occupation andpolitical preference. The large time span of the data, a period of 17 years,makes it possible to investigate changes over time.
Sioce we are ioterested io the effect of class mobility on political preferences, it is important to determine social class position as well and unequivocally as possible. As discussed in the introduction, we exclude women andpensioners from our analyses for that reason. We restrict our analyses toworking, unemployed and disabled men between the ages of 18 and 65, whohave a valid score on all the relevant variables. This restriction reduces thenumber of cases used io our analyses to 4,969.

33
Political preferenceOur dependent variable, political preference, is measured as follows: peopleare asked to name the national political party they would vote for if therewere a national election tomorrow, or the party they voted for at the mostrecent national election, or the national political party that currently has theirpreference4. Subsequently, all the political parties are given a score on aleft-right scale5• Ingeneral a more left-wing position on this scale is perceivedas a preference for social change in the direction of greater social equality,whereas a right-wing position indicates a preference against such changes(Lipset, 1960: 1135).
In the literature, various procedures are applied to place political partieson a left-right scale. One way is to score political parties with respect to theirparty manifestos and electoral programs. A second way is to place politicalparties on the basis of the characteristics of their voters. A third way is tohave experts place parties on a left-right scale. A fourth way is to ask votersto place parties on a left-right scale. The strategy for the last procedure is tocalculate the average score, which is then used as the position on the left-rightscale of that particular party (cf. Van der Eijk and Niemoller, 1983).
In this article, we choose the last option. One advantage of this option isthat it pertains to subjective matters. The present-day political party policydoes not necessarily adaquately represent tl'ie content of its electoral progranunes. Furthermore it is known that in general people do not know all theissue positions of a political party. They choose on the basis of a party'simage, instead of its electoral progranune, policy or a place imputed byexperts. An additional advantage of the procedure chosen is that these dataare not just available for a single point in time, but for several points in time.So, if (according to potential voters) political parties have changed theirposition on the left-right scale, this is assimilated in the scale suggested.
Social ClassThe respondents' and their fathers' social class are classified according to theEGP--class scheme (Erikson & Goldthorpe, 1992). We chose this classscheme, because it proved to be useful in intergenerational mobility research(Ganzeboom et al., 1989). The full EGP-class scheme distinguishes 10classes. To classify respondents into these 10 EGP-classes, information isneeded on their occupation, self-employment status and supervision6
. Because of limitations in the data, i.e. in some surveys detailed information onself-employment and supervision is lacking, we are forced to use a collapsedversion of the EGP-schema. In our analyses, we distinguish the following sixclasses (Roman numerals indicate original EGP-classes):1 Service class: professionals, administrators and managers; higher-grade
technicians; supervisors of non-manual workers (l+1I)

34
2 Routine non-manual workers: routine non-manual employees in administration and commerce; sales personnel; other rank-and-file service workers (Ill)
3 Petty bourgeoisie: small proprietors and artisans, etc. with and withoutemployees (IVa+IVb)
4 Farmers: farmers and smallholders and other self-employed workers inprimary production (IVc)
5 Skilled and non-skilled manual workers: lower-grade technicians; supervisors of manual workers; skilled manual workers; serni- and unskilledmanual workers (not in agriculture, etc.) (V+VI+VlIa)
6 Agricultural labourers: agricultural and other workers in primary production (VIIb).
The unemployed and the disabled are classified according to their lastoccupation.
Period in destination classIn the surveys, no exact information is available on how long respondentshave been in their destination class. As a proxy variable, we take therespondents' age. Ifpeople change their class, they do so at a relatively earlystage of their occuparional career. We know that after the age of 35, peopleseldom challge their class position (Goldthorpe, 1980: 69-71). Therefore, wefeel confident about talcing the respondents' age as an indicator for the lengthof the period in the class ofdestination7
. This variable has codes ranging from0(= 18 years old, our youngest respondents) to 47 (= 65 years old, our oldestrespondents).
Other variablesAlthough the impact of social class mobi!ity is our main theoretical concern,we also. take into account the impact of other relevant variables. If wehypothesize that people adjust to the norms and values of their group, theyare also influenced by people in their group who have the same religion. Ourgeneral assumption is that people not only adjust to groups with the sameclass interest, but also to groups based on religion, groups of the samegeneration, and groups that live in the sarue political climate. Therefore weinclude dummy variables in our models for each of these groups. Churchmembership is divided into five groups: Catholic, Dutch Reformed Protestant, Calvinist, other denominations and no religion. We also define five agegroups: 18-25,26-35,36-45,46-55 and 56 years and older. Furthermore wecontrol for the political climate in each period by including a dummy for yearof interview into our models. In the analyses, respondents who are non-religious, 18-25 years of age_and interviewed in the year 1970 are the referencecategory.

35
5 Results: Class and political preference
Before testing our hypotheses, we first analyze the consequences of intergenerational mobility on political preference. The mobility table is presentedin Table I. The EGP-classification is a nominal variable. Consequently, it ishard to distinguish between upward and downward mobility. In Table I,however, we ordered the classes according to their prestige8
• Using thisinformation, we can conclude that 38.2 per cent of the population is upwardlymobile, 19.6 per cent downwardly mobile, and 42.2 per cent is immobile.These results correspond with the results of Ganzeboom et al. (1987),although they used other surveys9.
Table 1 Mean left-right placement ofrespondents by own and father's class (between brackets:number of respondents).
Father's class\ Service Routine Petty Fann= Manual Agri- TotolOwn Class aa" non~man_ Bourw workers cultural
workers geoisie workers
Service class 6.1 (575) 6.0 (172) 5.9 (26) 5.8 (5) 5.3 (147) 5.8 (4) 5.9 (929)
Rout. non-manual 5.9 (214) 5.7 (125) 6.4 (11) 4.4 (3) 5.0 (104) 2.7 (1) 5.6 (458)
Pett"f bm:rgeoisie 6.3 (226) 6.0 (125) 7-0 (146) 7.6 (ll) 5.5 (189) 7.3 (2) 6.2 (699)
Fmn= 6.4 (157) 6.6 (66) 7.0 (34) 7.3 (212) 6.1 0.37) 7.0 (42) 6.7 (748)
Manual workers 5.4 (456) 5.5 (323) 5.8 (61) 5.3 (10) 4.8 (1021) 6.4 (19) 5.1 (1890)
Agric. workers 6.0 (44) 5.6 (29) 6.2 (12) 6.8 (10) 5.2 (132) 6.4 (18) 5.6 (245)
Total 5.9 (1672) 5.8 (840) 6.6 (290) 7.2 (251) 5.1 (1830) 6.6 (86) 5.7 (4969)
In Table I, the average political preference is presented for each intergenerational category. We can·conclude that class has a clear non-linear relationwith political preference. The petty bourgeoisie and farmers are by far themost right-wing.
A closer look at Table I demonstrates that intergenerational mobilitydiminishes the differences in political preference among social classes. Forexample, the difference between the average political preference of theservice class (5.9) and that of all manual workers (5.1) is 0.8. However, if welook at the usual political preference of these groups, i.e. the preference ofthe intergenerationally immobile, we notice a bigger difference, viz. 1.3(=6.1-4.8). Similar conclusions can be drawn for the other classes. This showsthat intergenerational mobility causes a decrease in the 'democratic classstruggle' (Korpi, 1983).
36
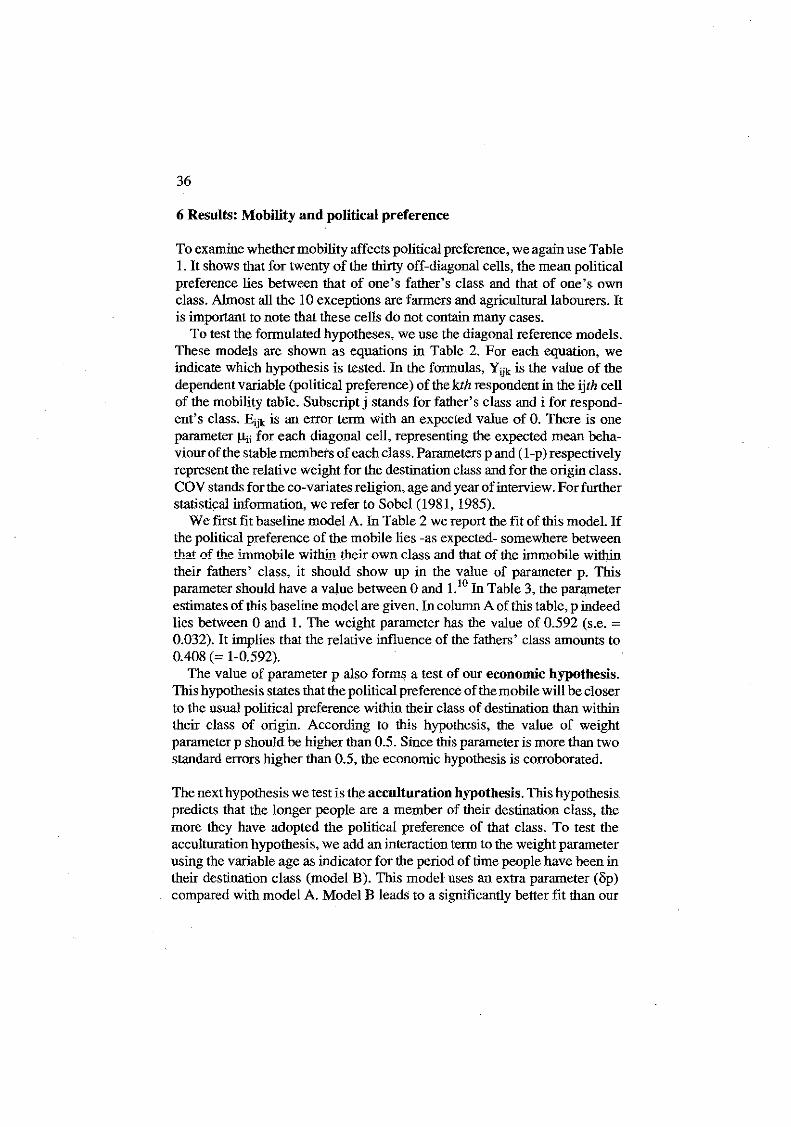
6 Results: Mobility and political preference
To examine whether mobility affects political preference, we again use Table1. It shows that for twenty of the thirty off-diagonal cells, the mean politicalpreference lies between that of one's father's class and that of one's ownclass. Almost all the 10 exceptions are farmers and agricultural labourers. Itis important to note that these cells do not contain many cases.
To test the formulated hypotheses, we use the diagonal reference models.These models are shown as equations in Table 2. For each equation, weindicate which hypothesis is tested. In the fonnnlas, Yijk is the value of thedependent variable (political preference) of the kth respondent in the ijth cellof the mobility table. Subscript j stands for father's class and i for respondent's class. E;jk is an error term with an expected value of O. There is oneparameter Ilii for each diagonal cell, representing the expected mean behaviour of the stable members ofeach class. Parameters p and (I-p) respectivelyrepresent the relative weight for the destination class and for the origin class.COY stands for the co-variates religion, age and year ofinterview. For furtherstatistical infonnation, we refer to Sobel (1981, 1985).
We first fit baseline model A. In Table 2 we report the fit of this model. Ifthe political preference of the mobile lies -as expected- somewhere betweenthat of the inuuobile withi..n t-heir own class and that of the immobile withintheir fathers' class, it should show up in the value of parameter p. Thisparameter should have a value between 0 and 1.10 In Table 3, the parameterestimates of this baseline model are given. In column A of this table, p indeedlies between 0 and 1. The weight parameter has the value of 0.592 (s.e. =0.032). It implies that the relative influence of the fathers' class amounts to0.408 (= 1-0.592).
The value of parameter p also fonns a test of our economic hypothesis.This hypothesis states that the political preference ofthe mobile will be closerto the usual political preference within their class of destination than withintheir class of origin. According to this hypothesis, the value of weightparameter p should be higher than 0.5. Since this parameter is more than twostandard errors higher than 0.5, the economic hypothesis is corroborated.
The next hypothesis we test is the acculturation hypothesis. This hypothesispredicts that the longer people are a member of their destination class, themore they have adopted the political preference of that class. To test theacculturation hypothesis, we add an interaction term to the weight parameterusing the variable age as indicator for the period of time people have been intheir destination class (model B). This model uses an extra parameter (op)compared with model A. Model B leads to a significantly better fit than our

37
Table 2 Nested diagonal reference models for the relative influence ofrespondent's class and.fu.I!wy£JIiIv JWJ~Y,ngljt.iJ;;jJ,w.t:Wn-"" .;;p.JW:p1l!W.furJ.!W6'iJw, .l/!'J'dllW}'&1JTdsurvey (N; 4969).
Model
A. Baseline modelYijk ; P"l'ii + (I-p)*l'ii
+COV +E;jkB. Acculturation model
Yijk ; (P + op"age)"l'ti +«(l-p) - lip"age)"l'ii+COV +E;jk
C. Status maximization modelYijk ; (P + opl *age + op2*down)*l'ii +
«(l-p) - lipI"age - lip2*dowo)"l'jj+COV + Eijk
D. Status maximization modelYijk ; (p + lipI *age + 8p2*down*age)*l'ti +
«(l-p) - opl*age- 8p2*dowo"age)*l'ii+COV +E;'k
E. status maximization m~elYijk ; (p + lipI*age + op2*down +
Op3*down*age)*J..lii +«(l-p) - opl*age - op2*downlip3*down*age)*l'jj+COV +Eijk
F. Individualization modelYijk ; (p + lipI*age + op2*1980's)*l'ii +
«(l-p) - lipI"age - op2*1980's)*l'jj+ COV+E;'k
G. Individualization mod~lYijk ; (p + opl *age + op2*1980's*age)*llti +
«(l-p) - lipI*age- 8p2*1980's*age)*l'ii+COV +E;jk
H. Individualization modelYijk ; (p + opl *age + op2*1980's +
op3*1980's*age)*l'ii +«(l-p) - lipl*age - 02*1980'slip3*1980's*age)*l'jj+COV + Eijk
RMS
3.21559
3.20799
3.20809
3.20835
3.20866
3.20800
3.20857
3.20762
df
24
25
26
26
27
26
26
27
baseline model A (-2ln(L) = 11,8, df= 1)11. We therefore prefer model B tomodel A and corroborate the acculturation hypothesis.
The parameter estimates of model B are presented in Table 3. Theseestimates give detailed information about the time the acculturation processtakes. For the youngest mobile respondents, aged 18, the age variable has thevalue of zero (age is coded 0 to 47). Parameter p implies that 18-year-oldrespondents weight theirownclass by 0.381 (p) and theirorigin class by 0.641(l-p). In other words, for young people socialization has a strong impact: the

38
impact of the class of origin is almost twice as big as the impact of the classof destination. But the acculturation effect considerably changes this picturefor the older mobile. Each year older they are, the impact of the class oforigindecreases and the impact of the class of destination increases by 0.009 (llp).lhis implies that after the age of about 30, people's own class becomes moreinfluential compared with their fathers' class. The oldest respondents are 65(coded as 47). For them, the relative weight of the own class is 0.804 (0.381+ 47*0.009=0.804) and that of their class of origin is 0.196 (0.619 -
Table 3 Parameter estimates (s.e.) ofthe baseline model (model A) and the acculturation model(model B).
Destination weigbt (p)Effect of age on weigbt (lip)
Model ABaseline model
0.592 (0.032)
ModelBAcculturation model
0.381 (0.066)0.009 (0.003)
Mean political preference of immobile respondents:I. Service class 5.115 (0.120)2. Rontine non-manual 4.832 (0.135)3. Peny Bourgeoisie 5.577 (0.153)4. Farmers 5.885 (0.154)5. Manual workers 3.875 (0.112)6. Agricultural workers 4.842 (0.231)
5.111 (0.120)4.809 (0.137)5.531 (0.151)5.828 (0.153)3.848 (0.112)4.821 (0.232)
Effects of co-variates on political preference:Religion:
No religionCatholicDutch ReformedCalvinistOther religion
Age:18-1526-3536-4546-5556+
Year:1970197119741976197719791981198219851986
o1.543 (0.062)1.089 (0.077)2.180 (0.094)1.200 (0.159)
o0.031 (0.089)0.295 (0.092)0.261 (0.096)0.187 (0.104)
o0.237 (0.126)
-0.366 (0.126)-0.129 (0.112)-0.199 (0.085)-0.269 (0.137)-0.321 (0.110)0.130 (0.112)
-0.306 (0.130)-0.154 (0.116)
o1.548 (0.062)1.090 (0.077)2.183 (0.094)1.201 (0.159)
o0.039 (0.089)0.309 (0.092)0.290 (0.096)0.239 (0.105)
o0.240 (0.126)
-0.358 (0.127)-0.120 (0.112)-0.187 (0.085)-0.268 (0.136)-0.315 (0.110)0.136 (0.112)
-0.295 (0.130)-0.156 (0.116)

39
47*0.009=0.196). Yet, even for the oldest respondents, the class of originstill has a significant impact
We can come up with several explanations for this finding. First of all, thisresult indicates that although people left their old class a long time ago, theyare probably still in contact with some people from that old class and theyare still influenced by them. It may also indicate that political socializationduring adolescence is so strong that even at a very old age, the influence ofthe political preference acqnired during childhood never vanishes. Anotherpossible explanation of this outcome is that it is incorrect to take age as aproxy for the number of years people have been in their new class. Althoughmost people will have taken their last mobility step at a young age, there arealways some persons who became mobile at a relatively late age. However,these numbers are likely to be very small (Goldthorpe, 1980).
The acculturation hypothesis assumes that the acculturation pattern is thesame for the upwardly mobile as for the downwardly mobile. One mightwonder whether this is a legitimate assumption. For this reason, we formulated the status maximization hypothesis in the theoretical section. Aninitial interpretation of this hypothesis reads that the upwardly mobile whohave just arrived in their class of destination instantly adjust more than thedownWardly mobile who have just arrived in their class of destination. Totest this interpretation, we include a dummy labelled 'down' in model C. Thisdummy takes the value of 1 for the downwardly mobile and the value of 0for the immobile and the upwardly mobile. A second interpretation of thestatus maximization hypothesis is that the rate of the acculturation processdiffers among the upwardly and the downwardly mobile. Since the upwardlymobile gain status, they will adoptfaster to their class of destination than thedownwardly mobile. We can test this second interpretation by adding asecond order interaction term between the variables 'down' and 'age'. Thisis done in model D. A third interpretation is that the first two interpretationsare simultaneously valid. This interpretation is expressed in model E.
The models representing the alternative interpretations of the statusmaximization hypothesis are presented Table 2. The results show that theresidual mean square (RMS) of models C, D and E is even larger than ofmodel B. Consequently, we have to reject all the alternative interpretationsof the status maximization hypothesis. The conclusion, therefore, is that untilthis stage of testing, model B still gives the best representation of our data,i.e. the upwardly and the downwardly mobile have the same acculturationpattern.
The next step is to test the individualization hypothesis. This hypothesisstates that for the mobile the acculturation process, i.e. the adaptation to thepolitical preferences of their destination class, took less time in the 1980's

40
than in the 1970's. This hypothesis also leaves two distinct interpretationsopen. The first interpretation is that people who became mobile in the 1980'sinstantly adjusted more to their new class than those in the 1970's. The secondinterpretation is that the mobile in the 1980's adjusted more quickly to theirnew class than the mobile in the 1970's. It means that the influence ofhavingbeen in the new class for an extra year was greater in the 1980's than in the1970's. Obviously, these two interpretations are not mutually exclusive andcan be simultaneously valid.
The two interpretations of the individualizing hypothesis are analogous tothose of the status maximization hypothesis. To test the interpretations of theindividualizing hypothesis, we can therefore use the design of the statusmaximization models. In these models, we exchange the dummy variable'down' for a dmnmy for the '1980's', which takes the value of0 for the years1970 till 1980 and the value of 1 for the years 1981 till 1986. These differentinterpretations are expressed as models F, G and H in Table 2. Model F isanalogous to model C, model G to model D and model H to model E.
If, as expected, people adjusted more rapidly to the political preference oftheir new class in the 1980's, model F, G and H should yield a significantlybetter fit than model B. However, Table 2 shows that models F and G havean even larger residual mean square than model B. Model H does have asmaller residual mean square. but the difference with. model B is not significant (-2ln(L) =0,6; df =2). Therefore, we have to reject the individUalizinghypothesis.
Our general conclusion, therefore, is that of all our nested models, theacculturation model B leads to the best fit. In other words, there is a gradualprocess of acculturation, which is the same for the upwardly and the downwardly mobile.
7 Conclusion and discussion
For almost three decades, indicators of attitudes and value orientations havebeen used to explain political behaviour and political preferences. As a result,especially within Dutch research, the classical explanation, which takessocial class position as its point of departure, more or less disappeared. Inthis article, we employed 11 national representative data sets, representingthe Netherlands in the period 1970-198612
• With these data, we have shownthat in the Netherlands as well, soci:il class is still to be considered animportant predictor. Between the separate classes, there are considerabledifferences in the mean political preference. Especially if we look at peoplewho are intergenerationally immobile.
In this article, we adressed the following question: What are the effects of
41
intergenerational social mobility on political preference? To answer thisquestion, we formulated and tested four hypotheses. The economic hypothesis claims that the political preference of the mobile is closer to the usualpolitical preference of their class of destination than of their class of origin.This hypothesis has been corroborated by our analyses. Our acculturationhypothesis is more informative. It states that there is also a process ofacculturation. The longer one is a member of a new class, the more one'spoliticalpreferences coincide with the political preferences ofthose who havealready been in this class for two generations. This idea has been confirmedby our analyses. People who are young and mobile, assuming they recentlyarrived in their new class, have a political preference nearer to that which isusual in their fathers' class than to the usual political preference of their ownclass. Ouly from the age of 30 onwards does one's own class becomerelatively more influential than one's father's class. Nevertheless, one'sfather's class -even for the oldest mobile people- does not lose its impactentirely.
One hypothesis we had to reject was the status maximization hypothesis.This hypothesis states that the adaptation process takes less time for theupwardly mobile than for the downwardly mobile. The empirical tests showthat the adaptation to a new class is not dissimilar for the upwardly and thedownwardly mobile. We also had to reject the individualization hypothesis,which states that the acculturation process took less time in the 1980's thanin the 1970's. We found no indication for an increasing effect over time ofthe destination class.
The main conclusion of this article is that social class still matters. Evenfor mobile people, the class oforgin has a significant impact on their politicalpreferences. Furthermore, it takes a certain amount of time to adapt to theclass of destination. The age at which the class of destination becomesrelatively more important than the class of origin is about 30.
The study presented in this article, however, ouly focused on the Netherlands. In the near future hope to conduct similar analyses using data fromother countries as well. An international comparison would make it possibleto discover whether there is a similar acculturation proces in other countries.Furthermore, we want to investigate the extent to which differences in thestrength of the relation between social class and political preference can beexplained by differences in the mobility rates among countries and changesin the mobility rates within countries over time.
Notes
* Both authors are associated with the Department of Sociology at the University ofNijmegen, the Netherlands. A Dutch version of this article was published in Mens en
42
Maatschappij, 67 (1992) pp. 255-272. We would like to thank Wout Vltee, Jan van Dethen Harry Ganzeboom for their comments on earlier versions of this article.
1. Since women constitute half the voting population, it is hard to justify this exclusion. Inthe near future we plan to include women (also housewives). For this purpose. however,we have to apply a different design than the models presented here.
2. We would like to add that this hypothesis is not just the prediction that political preferencewill be a weighted average between origin and destination. The literature on socialmobility and political preference often suggests that political preference is not just aweighted average between class of origin and class of destination, but that due 10 the'shock of mobility' (comparable to the often assumed status inconsistency effect),mobility has an extra independent effect. Turner et at. (1992) label this the effect ofmobility per se. The literature that elaborates on such mobility hypotheses, however, israther vague and lacks precision. This can be illustrated by the recent work of Kelley(1992), whicb states that mubile persons 'may not be fully at home, nor fully excepted,in either class; This might lead to alienation and anomie, and perhaps to disenchantmentwith the social order and support for radical change. Or it might lead to extremism of theLeft or the Right, according to the historical circumstance Thus there are manyreasons to think that there is something more to social mobility than merely class of originand present class position, that there is something to the experience of mobility per se'(1992: 32; the italics are ours). We feel that our status maximization hypothesis is a morespecific hypothesis on mobility effects.
3. Applications in other fields ofresearch are Sorenson (1990; 1991), De Graaf(l99I) andDe Graaf and Heath (1992).
4. Survey questions used (see for exact questions the original codebooks):* Which party would you vote for if there were national elections today/tomorrow?* Which party did you vote for in the last national elections?* Which political national party has your preference?In this article we use the phrase 'political preference' for all these measUIeS. At first itseems like a rather wide variety of dependent variables, but they are of course stronglyconnected. We would like to stress that for the test of our hypotheses, it is not so relevantwhether we predict voting behaviour or political preference.
5. The left-rigbt scores are taken from: Van derEijk and Niemiiller (1983: 249), Van Dethand Horstman (1989) and the National Election Study 1989 dataset (own calculations).
6. The coding of the respondents into the EGP scheme takes two steps. First the originaloccupation codes are recoded into the International Standard Classification of Occupationcodes (ILO, 1968). Second, these ISCO codes are translated into EGP scores through theGanzeboom, Luijkx and Treiman (1989) recoding schema.
7. In the Netherlands in May 1992 anew data collection was started under the supervisionofW,C. Ultee and H.B.G. Ganzeboom. These data contain occupational career data andwill thus enable us to test whether we are conect in assuming that age is an appropriateindicator for the period someone is a member of his class of destination.
8. Prestige acconting to Sixma & Vltee (1983): Class I: 69; Oass 2: 43; Class 3: 42; Class4: 35; Class 5:31; Oass 6: 27.
9. Although we used more surveys than Ganzeboom et al. (1987), we were not able to useall their surveys, since some of them lack information on church membership and politicalptef~rence.
10. It is of importance to note that we did not constrain the weight parameter p to lie in the0-1 interval_ The reason for applying an unconstrained model is the possibility that thediagonal reference model does represent the data in an appropriate way. Yet, in all themodels presented in this paper. the weight parameters lie in the 0-1 interval. For amethodological comparison between Sobers diagonal reference model and the mainstream square additive model, see Hendrickx et aI. (1993).
11. The compwson between two nested models is done by means of the Likelihood Ratio L(= (crt!cr,J ), where crfis the maximnm likelihoodesthnalor ofcrf (= sqnare root of RMS

43
(Residual Mean Square)) in the more general model, 0". (= Square Root ofRMS) is themaximum likelihood estimator of on in !pe nested model, and N is the sample size.Because -2ln(L) has an asymptotic CHI (r) distribution. where r is the number ofadditional independent parameters in the general model, the Likelihood Ratio can be usedfor comparing the two models (Sobel, 1985: 705).
12. We investigated the influence ofpossible 'outlier' datasets. The analyses were carried outeleven times, each time leaving out one of the surveys. The parameter estimates turnedout to be very robust. All of the eleven analyses produced almost the same results.
Literature
Abramson, P.R. (1972) Intergenerational social mObility and partisan choice, AmuicanPolitical Science Review, 66: 1291-1294.
Barber, J.A. (1970) Social mobility and voting behavior, Chicago, University of ChicagoPress.
Blau, P.M. (1956) Social mobility and interpersonal relations, American Sociological Review,21: 290-295.
Blan, P.M.. O.D. Duncan (1967) The American occupational structure, New York. Free Press.Butler. D.E., D.E. Stokes (1969) Political change in Britain: Forces shaping electoral choice,
London, MacMillan.Campbell, A., P.E. Converse, W.E. Miller nod D.E. Stokes (1960) The American voter, New
York, Wiley.De Graaf, N.D. (1991) Distinction by consumption in Czechoslovakia, Hungary, nod the
Netherlands. European Sociological Review, 7: 267-290.De Graaf, N.D., H.B.G. Ganzeboom (1990) Cultuurdeelname en opleiding; eeo analyse van
statusgroep-effecten met diagonale referentiemodellen (Cultural participation and education: An analysis of status group effects with diagonal reference models), Mens enMaatschappij, 65: 219-244.
De Graaf, N.D., W. Ultee (1990) Individual preferences, social mobility and electoraloutcomes, Electoral Studies, 9: 109-132.
De Graaf, N.D., A. Heath (1992) Hnsbands' and Wives' Voting Behaviour in Britain:Class-dependent Mutual Influence of Spouses, Acta Sociologica, 35: 311-322.
Deth, J.W. van (1986), Political science as a no-risk policy: The American voter andcontemporary voting research, Acta Politica, 21: 185-199.
Deth, J.W. van, R. Horstman (1989), Dutch parliamentary election studies data source book1971-1986, Amsterdam, Steinmetz ArchivelSwidoc.
Downs. A. (1957) An economic theory ofdemocracy. New York, Harper and Row.Eijk, C. van der, B. Niemoller (1983), Electoral change in the Netherlands, Amsterdam.Erikson, R.. J.H. Go1dthorpe (1992), The constantflux, Oxford, Oxford University Press.Ganzeboom, H.B.G., R. Lnijkx, J. Dessens, P. De Graaf, N.D. De Graaf, W. Jansen nod W.
Ultee (1987), Intergenerationele klassenmobiliteit in Nederland tussen 1970 en 1985(lntergenerational class mobility in the Netherlands from 1970 to 1985). Mens en Maatschappij,62: 17-43.
Ganzeboom, HB.G, R Luijkx and D.l Treiman (1989) Intergenerational class mobility incomparative perspective, Research in Social Stratification and Mobility, 8: 3-84.
Goldthorpe, J.R. (1980) Social mobility and class structure in modern Britain, Oxford,Clarendon Press.
Heath, A., R. Jowell and J. Curtice (1985) How Britain votes. Oxford, Pergamon Press.Heath, A., J. Curtice, R. Jowell, G. Evans, J. Field and S. Witherspoon (1991) Understanding
political change, the British voter 1964-1987, Oxford. Pergamon Press.Hendrickx J., N.D. De Graaf, J. Lammers nod W. Ultee (1993) 'Models for starns inconsist
ency and mObility: a comparison ofthe approaches by Hope and Sobel with the mainstre_amsquare additive model', Quality and Quantity, (forthcoming).

44
International Labour Office (1968), International standard classification of occupations1968, revised edition, Geneva, International Labour Office, 1968.
Korp~ W. (1983) The derrwcratic class struggle, London, Routledge and Kegan Panl.Lijphart, A. (1974) The Netherlands: continuity and change in voting behavior, In: R. Rose,
Electoral Behavior: A comparative handbook, New York, Free Press: 227-268.Lipset, S.M., IL Zetterberg (1956) A theory of social mobility, Transactions of the Third
World Congress ofSociology, 3: 155-177.Lipset, S.M., R. Bendix (1959) Social mobility in industrial society, Berkeley and Los
Angeles, University of California Press.Upset, S.M. (1960) Political man, The social bases o/politics, London, Heinemann Educa
tional Books Ltd..Nieuwbeerta, P., N.D. De Graaf (1992) Intergenerationele klassenmobiliteit en politieke
voorkeur in Nederland tussen 1970 en 1986 CIntergenerational class mobility and politicalpreferences between 1970 and 1986 in the Netherlands), Mens en Maatschappij, 67:255-272.
Pariein, F. (1981), Class, inequality and political order: social stratification in capitalist andcommunist societies, London, Paladin.
Sainsburry, D. (1990) Party strategies and the electoral trade-off of class-based parties,European Journal ofPolitical Research 29-50.
Sixma, H., W.C. Vlree (1983) Een beroepsprestigescbaal voor Nederland in de jaren.l3Chtig(An occupational prestige scaleforthe Netherlands in theeighties),Mens en Maatschappij,58: 63-77.
Sobel, M.E. (1981) Diagonal mobility models: a substantively motivated class of designs forthe analysis of mobility effects, American Sociological Review, 46: 893-906.
Sobel, M.E., (1985) Social mobility and fertility revisited: some new models for the analysisof the mobility effects hypothesis. American Sociological Review, 50: 699-712.
Sorenson, A.M. (1990) Husbands' and wives' characteristics and fertility decisions: adiagonalmobility model, Demography, 26: 125-135.
Sorenson, A.M. (1991) The measurement of parental influence, assessing the relative effectsof father and mother, Sociological Methods and Research, 19: 511-535.
Sorokin, P.A. (1959) Social and cultural mobility, Glencoe, Free Press.Thorburn, P. (1979) Class and mobility: the political preferences of men in England and
Wales, Michigan.Turner, F.e. (1992) Social mobility and political attitudes, comparative perspectives, New
Brunswick, Transaction Publishers.Weakliem, D.L. (1992) Does social mobility affect political behavior?, The European Socio
logical Review, 8: 153-165.
Data references (Between brackets: P-number Steinmetz Data Archive, Amsterdam, TheNetherlands)
Barnes, S.H., M. Kaase, et al., Political Action: an eight nation study, 1973-1976 (1974).(1'0780).
Allerbeck, K, et al., Political action II, 1979. (1'0823).CBS (Centraal Bureau voorde Statistiek), Life Situation Survey, Netherlands 1977. (1'0328).Felling, A., J. Peters and 0; Schreuder. Religion in Dutch Society 1985, documentation on
religious and secular attitudes in 1985. (PI012).Hermkens, P., P. Van Wijngaarden, Criteria/or justification a/income differences, Nether
lands 1976. (1'0653).Hennks, F.M., M. Kent Jennings, et aI., Dutch Election Study, 1970-1973,1970. (1'0136).Molleman, R.. G. Irwin, Political participation in The Netherlands. 1971. (Obtained from
original investigators).

45
Van der Eijk, C.B., B. Niemoller and A.T.J. Eggen, Dutch Parliamentary Election Study,1981. (P03S0).
Van der Eijk, C.B., M.J. Koopman and B. Niemoller, Dutch Parliamentary Election Study,1982. (P0633A).
Van derEijk, C.B.• G.A. Irwin and B. Niemoller, Dutch Parliamentary Election Study, 1986.(P0866A).
Werkgroep Nationaal Kiezersonderzoek, Dutch Parliamentary Election Study. 1977.(P03S4).