ON THE RELATIONSHIP BETWEEN IRANIAN EFL TEACHERS' PERFECTIONISM AND THEIR REFLECTIVITY
Upload
independentCategory
view
2download
0
Interaction between Lipid Monolayers and Poloxamer 188: An X-RayReflectivity and Diffraction Study
Guohui Wu,* Jaroslaw Majewski,y Canay Ege,* Kristian Kjaer,z Markus Jan Weygand,z and Ka Yee C. Lee**Department of Chemistry, the Institute for Biophysical Dynamics and the James Franck Institute, the University of Chicago, Chicago,Illinois; yManuel Lujan Jr. Neutron Scattering Center, Los Alamos National Laboratory, Los Alamos, New Mexico;and zMaterials Research Department, Risø National Laboratory, Roskilde, Denmark
ABSTRACT The mechanism by which poloxamer 188 (P188) seals a damaged cell membrane is examined using the lipidmonolayer as a model system. X-ray reflectivity and grazing-incidence x-ray diffraction results show that at low nominal lipiddensity, P188, by physically occupying the available area and phase separating from the lipids, forces the lipid molecules topack tightly and restore the barrier function of the membrane. Upon compression to bilayer equivalent pressure, P188 issqueezed out from the lipid monolayer, allowing a graceful exit of P188 when the membrane integrity is restored.
INTRODUCTION
In victims of electrical shock or lightning injury, altered mem-
brane properties in response to strong electric field exposure
appear to be directly relevant to tissue injury mechanisms.
Electrical injuries to cell membrane can result in the fol-
lowing events: thermal burns secondary to Joule heating
(1–3), permeabilization of cell membranes (4), and/or
denaturation of macromolecules such as proteins (5). Elec-
troporation (suggesting actual pore formation) and electro-
permeabilization (likely due to the loss of the innate lipid
packing density) are the two terms commonly used to de-
scribe the biophysical process of enhanced membrane
permeability due to electric field-driven reorganization of
lipids in the lipid bilayer by supraphysiologic electric fields
(6–8). Contemporary electroporation theory indicates that
polar water molecules are pulled by Kelvin polarization
stress into transient defects in the lipid packing order within
a bilayer, leading to quasistable or stable pore formation
(9–12).
A break in the integrity of the plasma membrane imme-
diately compromises its essential role as a barrier, thereby
severely affecting its control over the exchange of materials
between the cell and its surrounding environment, which
eventually causes cell death. Sealing of permeabilized cell
membranes is therefore of vital importance to medical treat-
ment of electrical shock victims.
The successful restoration of membrane transport proper-
ties through surfactant poloxamer 188 was first demonstrated
in 1992 (2). Poloxamer 188 (P188, mol wt ¼ 8400 g/mol), a
member of a triblock copolymer family called poloxamers,
or pluronics, has the structure of poly(ethylene oxide)-poly
(propylene oxide)-poly(ethylene oxide) (PEO-PPO-PEO,
with 80 wt % PEO content), and has a firmly established
medical safety record since 1957. As a result of its amphi-
philic nature, P188 has the capability to interact with a cell
membrane and is found to alleviate as well as reverse
damages caused by electrical trauma. It was demonstrated
that P188 can seal cells against loss of carboxyfluorescein
dye after electroporation (2,13–18). In the intervening years,
P188 has been determined as a successful sealing agent for
various permeabilized cells, such as skeletal muscle tissue
after heat shock and intense irradiation (19,20), red blood
cell from sickle cell disease (21), etc. Although these results
show that P188 is effective in restoring damaged cell mem-
branes, the underlying mechanisms have barely been studied
until recently (22).
Besides being used as a sealing agent, poloxamers have
also received much attention during the past decade for their
application in drug delivery. It is known that liposomes (used
as drug carriers) can be modified with poloxamers to prolong
their circulation time in the blood stream as well as to prevent
their flocculation, fusion, or binding (13–18). Although the
mode of interaction between poloxamer and liposome has
been hypothesized, it remains poorly understood.
Recently there have been studies to measure the ability
of poloxamers to interact with model membranes (22,23),
however, no effort has yet been made to elucidate the lipid/
poloxamer interaction at the molecular level, which is critical
in improving the design of poloxamers for medical applica-
tions. To gain insight into the mechanisms of interaction
between poloxamer and damaged membrane, we have used a
Langmuir lipid monolayer at the air-water interface as a
model system and have performed a series of x-ray reflection
(XR) and grazing incidence x-ray diffraction (GIXD) ex-
periments to gain information at the molecular level.
The Langmuir lipid monolayer serves as a good model for
the outer leaflet of the cell membrane. By controlling the
surface area available for the lipid monolayer, the intact
membrane (with tightly packed lipid molecules at the bilayer
Submitted September 3, 2004, and accepted for publication June 27, 2005.
Address reprint requests to Ka Yee C. Lee, Dept. of Chemistry, the Institute
for Biophysical Dynamics and the James Franck Institute, the University of
Chicago, 5735 S. Ellis Ave., Chicago, IL 60637. E-mail: kayeelee@
uchicago.edu.
� 2005 by the Biophysical Society
0006-3495/05/11/3159/15 $2.00 doi: 10.1529/biophysj.104.052290
Biophysical Journal Volume 89 November 2005 3159–3173 3159
equivalent pressure of 30–35 mN/m (24,25), as well as the
disrupted portion of the membrane post-trauma (with low
lipid density) can be effectively mimicked. The low-density
lipid film at the air-water interface represents the hydropho-
bic-aqueous environment that the poloxamer sees on a
damaged membrane. Such a hydrophobic-aqueous environ-
ment can be found both at the highly curved lipid portion that
constitutes the pore, and in the portion of the membrane that
has enhanced permeability due to a reduction in lipid density.
Both sites have enhanced exposure of the lipid hydrocarbon
tail to the aqueous environment, into which the poloxamer,
being amphiphilic in nature, can possibly insert.
X-ray beams from intense and well collimated synchro-
tron sources have been used as a molecular probe for direct
structural information on the organization of amphiphilic
molecules at the air-water interface (26–29). Our earlier
work has demonstrated that XR and GIXD can help gain
insight into the interaction between lipid and poloxamer (30).
Here we report detailed structural parameters for pure lipid
and lipid/P188 monolayers at different surface pressures. To
the best of our knowledge, these studies are the first complete
in situ investigations providing quantitative information on
the insertion of P188 into lipid monolayers, as well as the
effect of P188 on the packing of lipid molecules. Our data
also help to pinpoint the location of P188 in the lipid matrix.
MATERIALS AND METHODS
Materials
1,2-Dipalmitoyl-sn-glycero-3-phosphocholine (DPPC) and 1,2-dipalmitoyl-
sn-glycero-3-[phospho-rac-(1-glycerol)] (DPPG) were purchased in pow-
dered form from Avanti Polar Lipids (Alabaster, AL) and used without
further purification. Monolayer spreading solutions were prepared by
dissolving the solid lipid in either pure chloroform (for DPPC) or 9:1 v/v
chloroform-methanol (for DPPG) to obtain a concentration of 0.5 mg/ml.
Throughout the experiments, ultrapure water (resistivity $18 MV cm)
obtained from aMilli-Q UV Plus system (Millipore, Bedford, MA) was used
as the subphase.
P188 solution of 200 mg/ml was prepared by adding poloxamer (BASF,
Parisippany, NJ) and ultrapure water to a vial containing a magnetic stir bar,
and then left to mix on a stirplate for 0.5 h to ensure complete dissolution. The
poloxamer solution was kept at 4�C before use, and made fresh every 2 weeks.
Experimental configuration
Surface-pressure area (Langmuir) isotherms were obtained with a home-built
Langmuir trough equipped with a Wilhelmy plate (31). In a typical isotherm
experiment, the lipid molecules dissolved in chloroform were deposited at low
surface density at the air-water interface, leaving an initial surface pressure of
0 mN/m. The solvent was allowed to evaporate for 5–15 min. P188 was then
injected into the subphase by inserting a syringe through the air-water interface,
and the final P188 concentration was 50 mM in the subphase. All experiments
were performed at 30�C. For isotherm measurements the compression was
achieved with two barriers moving at a rate of 6.3 mm2/s. Depending on the
initial amount of material deposited at the interface, this translates to a lipid
molecular area reduction rate between 0.04 and 0.06 A2�s�1.
Experiments were also performed at a synchrotron source. All x-ray
scattering experiments were carried out at the BW1 (undulator) beam line at
HASYLAB (Hamburg, Germany) using a dedicated liquid surface
diffractometer (29,32–34) with an incident x-ray wavelength of l ; 1.3 A.
A thermostated trough equipped with a Wilhelmy balance for measuring the
surface pressure (p) and a barrier for changing the surface area was mounted
on the diffractometer.
Two types of x-ray scattering experiments were performed. The first set
of experiments, referred to as pretreatment experiments in our previous work
(22), was designed to study the pure lipid monolayer, as well as the inter-
action between P188 and lipid in a mixed film. The second set of experi-
ments, aimed at studying the structure of P188 at the air-water interface, was
performed in a manner similar to the first but with no lipid present. For both
sets of experiments, after the sample was prepared but before x-ray data were
collected at least 40 min were allowed for the trough enclosure to be flushed
with helium to reduce the scattering background and to minimize beam
damage during x-ray scans; x-ray data were collected afterward.
Both XR and GIXD were carried out to obtain out-of-plane as well as in-
plane electron density distribution information on these samples. X-ray
scattering theory and the liquid diffractometer used here have been described
previously (26–29). The reflectivity data were analyzed using a kinematical
approach (26,35). The electron density r(z), which is laterally averaged over
both the ordered and disordered parts in the footprint of the beam, can be
modeled by a stack of homogeneous slabs (‘‘boxes’’) with each having
a constant electron density and thickness. The interfaces between boxes are
smoothed with a Gaussian function of standard deviation s to account for
roughness at the boundary due to thermally excited capillary waves and
atomic roughness of the interface (36,37).
The GIXD intensity resulting from a powder of 2-D crystallites may be
represented by its projection onto the qxy axis to yield Bragg peaks or onto
the qz axis to yield Bragg rods, where qxy and qz are the horizontal and
vertical components of the scattering vector q, respectively (26,35,38). The
intensity distribution along a Bragg rod can be analyzed to infer the direction
and magnitude of the molecular tilt in the crystalline part of the monolayer.
In this work we model the lipid tail by a cylinder of constant electron dis-
tribution with adjustable parameters being the tilt angle of the cylinder from
the vertical, the lateral tilt direction, the length of the cylinder, Lc (i.e., the
length of the part of the molecule that scatters coherently), and the vertical
root mean-square displacement, sz (Debye-Waller factor), in the crystallites.
The horizontal positions of the Bragg peaks (qxy) allow for the determination
of the spacings d ¼ 2p=qxy for the 2-D lattice of the alkyl chains. The width
of Bragg peaks, corrected for the instrumental resolution, gives the finite
size of the crystalline domains in the direction of the reciprocal scattering
vector qxy (the 2-D crystalline coherence length Lxy) (39).
The dimensions of the footprint of the incoming x-ray beam on the liquid
surface were;23 50 mm2. As a precaution against beam damage, in GIXD
the trough was translated by 0.025 mm horizontally across the x-ray beam, in
the direction along the barrier compression at every step of the qxy scan; in
XR, the sample was completely renewed by occasional translation of the full
2-mm width of the beam. Remeasuring part of the reflectivity curve before
and after translation afforded a check of the reproducibility.
RESULTS
Isotherm
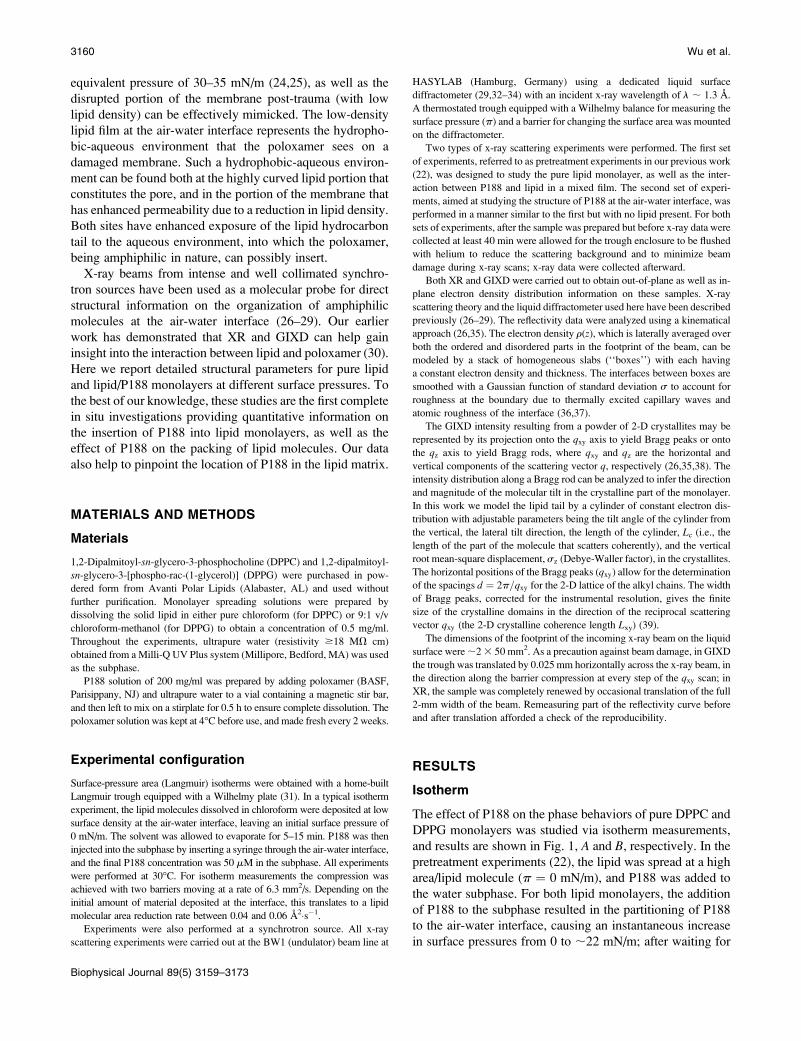
The effect of P188 on the phase behaviors of pure DPPC and
DPPG monolayers was studied via isotherm measurements,
and results are shown in Fig. 1, A and B, respectively. In the
pretreatment experiments (22), the lipid was spread at a high
area/lipid molecule (p ¼ 0 mN/m), and P188 was added to
the water subphase. For both lipid monolayers, the addition
of P188 to the subphase resulted in the partitioning of P188
to the air-water interface, causing an instantaneous increase
in surface pressures from 0 to ;22 mN/m; after waiting for
3160 Wu et al.
Biophysical Journal 89(5) 3159–3173
40 min to simulate conditions at the synchrotron source,
the surface pressure further rose to 26 mN/m. Under this
condition, fluorescence microscopy revealed surface hetero-
geneities at the length scale as large as;15 mm as discussed
in Appendix A. The lipid/poloxamer system was then com-
pressed until collapse. Fig. 1, A and B, shows that as the
DPPC monolayer was compressed to 36 mN/m and beyond,
or DPPG to 38 mN/m and beyond, the isotherms of the
poloxamer-pretreated monolayers reverted to those of the
pure lipids and the surface heterogeneities were eliminated,
suggesting that P188 is eliminated from the system. Although
the isotherms provide macroscopic information on the lipid-
poloxamer interaction as a function of surface pressure, XR
and GIXD experiments are needed to provide details at the
molecular level regarding the fate of the poloxamer at high
surface pressures, and to pinpoint the location of the poloxamer
in the lipid matrix as well as the subsequent effect on lipid
ordering upon P188 insertion.
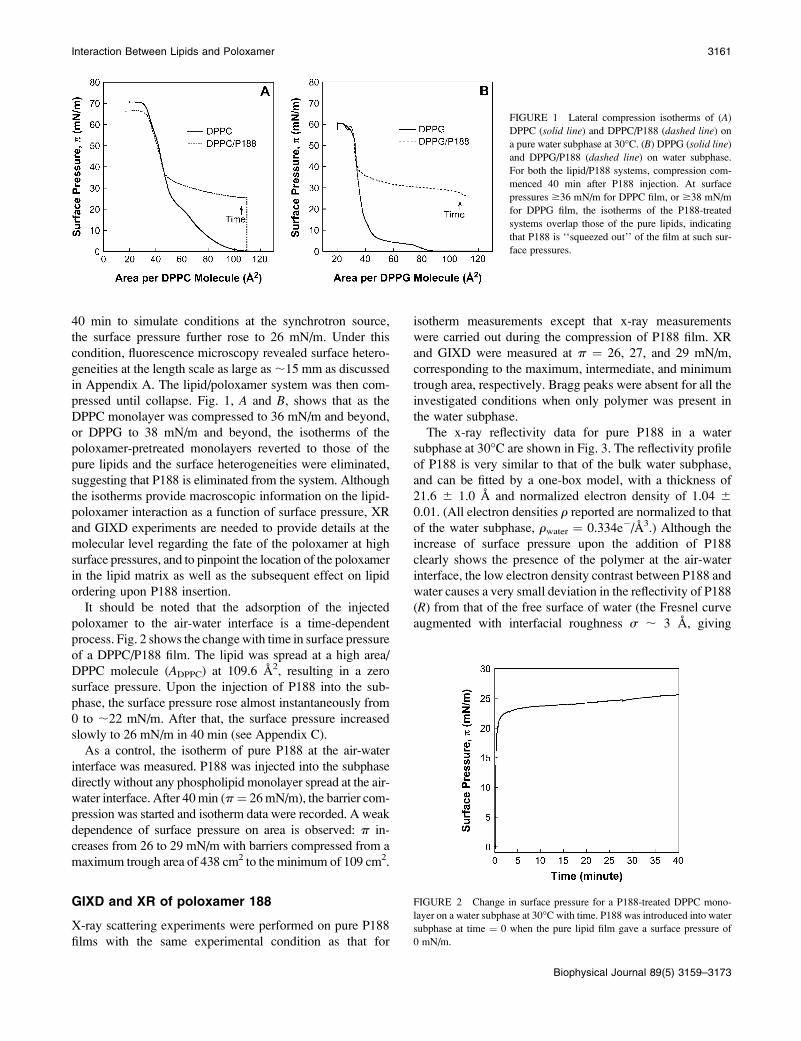
It should be noted that the adsorption of the injected
poloxamer to the air-water interface is a time-dependent
process. Fig. 2 shows the changewith time in surface pressure
of a DPPC/P188 film. The lipid was spread at a high area/
DPPC molecule (ADPPC) at 109.6 A2, resulting in a zero
surface pressure. Upon the injection of P188 into the sub-
phase, the surface pressure rose almost instantaneously from
0 to ;22 mN/m. After that, the surface pressure increased
slowly to 26 mN/m in 40 min (see Appendix C).
As a control, the isotherm of pure P188 at the air-water
interface was measured. P188 was injected into the subphase
directly without any phospholipid monolayer spread at the air-
water interface. After 40min (p¼ 26mN/m), the barrier com-
pression was started and isotherm data were recorded. A weak
dependence of surface pressure on area is observed: p in-
creases from 26 to 29 mN/m with barriers compressed from a
maximum trough area of 438 cm2 to the minimum of 109 cm2.
GIXD and XR of poloxamer 188
X-ray scattering experiments were performed on pure P188
films with the same experimental condition as that for
isotherm measurements except that x-ray measurements
were carried out during the compression of P188 film. XR
and GIXD were measured at p ¼ 26, 27, and 29 mN/m,
corresponding to the maximum, intermediate, and minimum
trough area, respectively. Bragg peaks were absent for all the
investigated conditions when only polymer was present in
the water subphase.
The x-ray reflectivity data for pure P188 in a water
subphase at 30�C are shown in Fig. 3. The reflectivity profile
of P188 is very similar to that of the bulk water subphase,
and can be fitted by a one-box model, with a thickness of
21.6 6 1.0 A and normalized electron density of 1.04 6
0.01. (All electron densities r reported are normalized to that
of the water subphase, rwater ¼ 0.334e�/A3.) Although the
increase of surface pressure upon the addition of P188
clearly shows the presence of the polymer at the air-water
interface, the low electron density contrast between P188 and
water causes a very small deviation in the reflectivity of P188
(R) from that of the free surface of water (the Fresnel curve
augmented with interfacial roughness s ; 3 A, giving
FIGURE 1 Lateral compression isotherms of (A)
DPPC (solid line) and DPPC/P188 (dashed line) on
a pure water subphase at 30�C. (B) DPPG (solid line)and DPPG/P188 (dashed line) on water subphase.
For both the lipid/P188 systems, compression com-
menced 40 min after P188 injection. At surface
pressures $36 mN/m for DPPC film, or $38 mN/m
for DPPG film, the isotherms of the P188-treated
systems overlap those of the pure lipids, indicating
that P188 is ‘‘squeezed out’’ of the film at such sur-
face pressures.
FIGURE 2 Change in surface pressure for a P188-treated DPPC mono-
layer on a water subphase at 30�C with time. P188 was introduced into water
subphase at time ¼ 0 when the pure lipid film gave a surface pressure of
0 mN/m.
Interaction Between Lipids and Poloxamer 3161
Biophysical Journal 89(5) 3159–3173
a reflectivity RF e�q2zs
2
). The low contrast is seen in the fitted
parameter rP188/rH2O ¼ 1.04 6 0.01. The fitting results also
show that the P188-water interface (s ¼ 7.9 6 1.0 A) is
much rougher than the air-P188 interface (s ¼ 3.06 0.1 A ).
Such roughness precludes the observation of any fringe
corresponding to ;22 A thick P188 layer in the XR data.
Grazing-incidence x-ray diffraction
Pure DPPC
GIXD measurements provide in-plane structural information
on the crystalline, diffracting portion of the monolayer. Fig.
4, A and B, shows Bragg peaks for a pure DPPC and P188-
treated DPPC monolayer, respectively, at various areas/lipid
molecule. The structural parameters are summarized in Table
1. In Fig. 4 A, a pure DPPC monolayer at ADPPC ¼ 63 A2
exhibits no Bragg peak, indicating the lack of any lipid
ordering. Compression to ADPPC ¼ 58 A2 results in a simi-
larly flat profile, though some features (still within the noise
level) are becoming discernable.
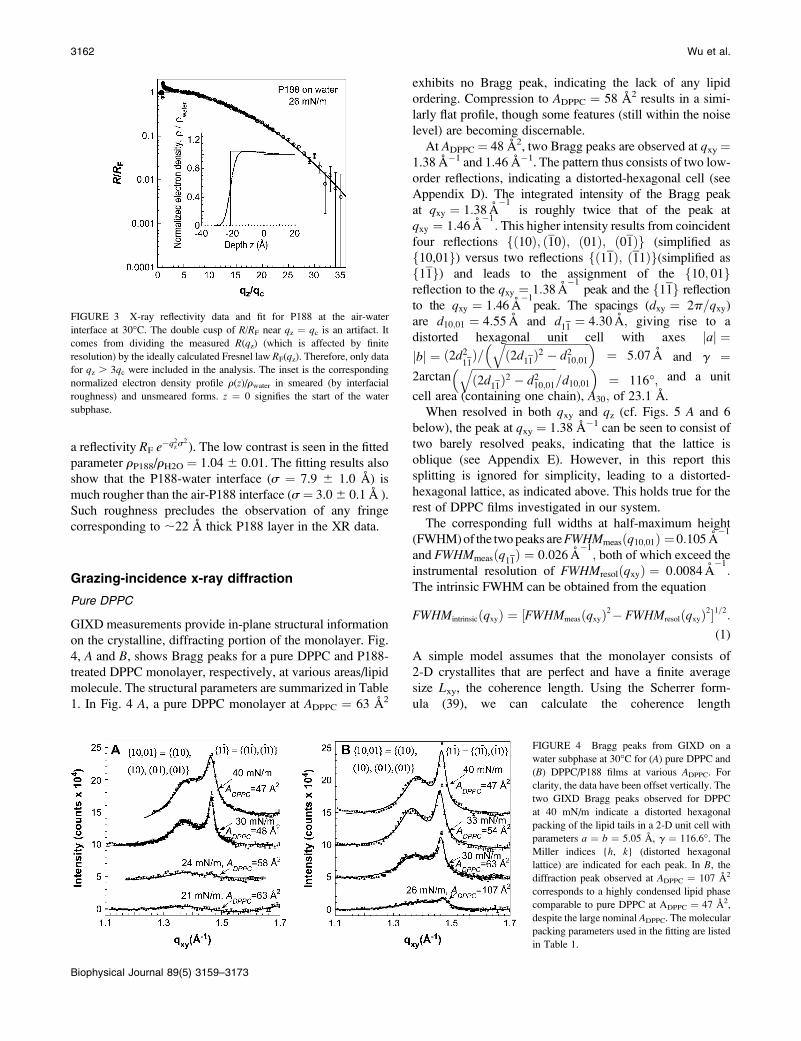
At ADPPC ¼ 48 A2, two Bragg peaks are observed at qxy ¼1.38 A�1 and 1.46 A�1. The pattern thus consists of two low-
order reflections, indicating a distorted-hexagonal cell (see
Appendix D). The integrated intensity of the Bragg peak
at qxy ¼ 1:38 A�1
is roughly twice that of the peak at
qxy ¼ 1:46 A�1: This higher intensity results from coincident
four reflections fð10Þ; ð10Þ; ð01Þ; ð01Þg (simplified as
f10,01g) versus two reflections fð11Þ; ð11Þg(simplified as
f11g) and leads to the assignment of the f10; 01greflection to the qxy ¼ 1:38 A
�1peak and the f11g reflection
to the qxy ¼ 1:46 A�1peak. The spacings (dxy ¼ 2p=qxy)
are d10;01 ¼ 4:55 A and d11 ¼ 4:30 A; giving rise to a
distorted hexagonal unit cell with axes jaj ¼jbj ¼ ð2d2
11Þ=
ffiffiffiffiffiffiffiffiffiffiffiffiffiffiffiffiffiffiffiffiffiffiffiffiffiffiffiffiffiffiffið2d11Þ2 � d210;01
q� �¼ 5:07 A and g ¼
2arctanffiffiffiffiffiffiffiffiffiffiffiffiffiffiffiffiffiffiffiffiffiffiffiffiffiffiffiffiffiffiffið2d11Þ2 � d210;01
q=d10;01
� �¼ 116�; and a unit
cell area (containing one chain), A30; of 23.1 A.
When resolved in both qxy and qz (cf. Figs. 5 A and 6
below), the peak at qxy ¼ 1.38 A�1 can be seen to consist of
two barely resolved peaks, indicating that the lattice is
oblique (see Appendix E). However, in this report this
splitting is ignored for simplicity, leading to a distorted-
hexagonal lattice, as indicated above. This holds true for the
rest of DPPC films investigated in our system.
The corresponding full widths at half-maximum height
(FWHM)of the twopeaks areFWHMmeasðq10;01Þ ¼ 0:105 A�1
and FWHMmeasðq11Þ ¼ 0:026 A�1; both of which exceed the
instrumental resolution of FWHMresolðqxyÞ ¼ 0:0084 A�1:
The intrinsic FWHM can be obtained from the equation
FWHMintrinsicðqxyÞ ¼ ½FWHMmeasðqxyÞ2� FWHMresolðqxyÞ2�1=2:(1)
A simple model assumes that the monolayer consists of
2-D crystallites that are perfect and have a finite average
size Lxy, the coherence length. Using the Scherrer form-
ula (39), we can calculate the coherence length
FIGURE 3 X-ray reflectivity data and fit for P188 at the air-water
interface at 30�C. The double cusp of R/RF near qz ¼ qc is an artifact. It
comes from dividing the measured R(qz) (which is affected by finite
resolution) by the ideally calculated Fresnel law RF(qz). Therefore, only datafor qz . 3qc were included in the analysis. The inset is the corresponding
normalized electron density profile r(z)/rwater in smeared (by interfacial
roughness) and unsmeared forms. z ¼ 0 signifies the start of the water
subphase.
FIGURE 4 Bragg peaks from GIXD on a
water subphase at 30�C for (A) pure DPPC and
(B) DPPC/P188 films at various ADPPC. For
clarity, the data have been offset vertically. The
two GIXD Bragg peaks observed for DPPC
at 40 mN/m indicate a distorted hexagonal
packing of the lipid tails in a 2-D unit cell with
parameters a ¼ b ¼ 5.05 A, g ¼ 116.6�. TheMiller indices {h, k} (distorted hexagonal
lattice) are indicated for each peak. In B, thediffraction peak observed at ADPPC ¼ 107 A2
corresponds to a highly condensed lipid phase
comparable to pure DPPC at ADPPC ¼ 47 A2,
despite the large nominal ADPPC. The molecular
packing parameters used in the fitting are listed
in Table 1.
3162 Wu et al.
Biophysical Journal 89(5) 3159–3173
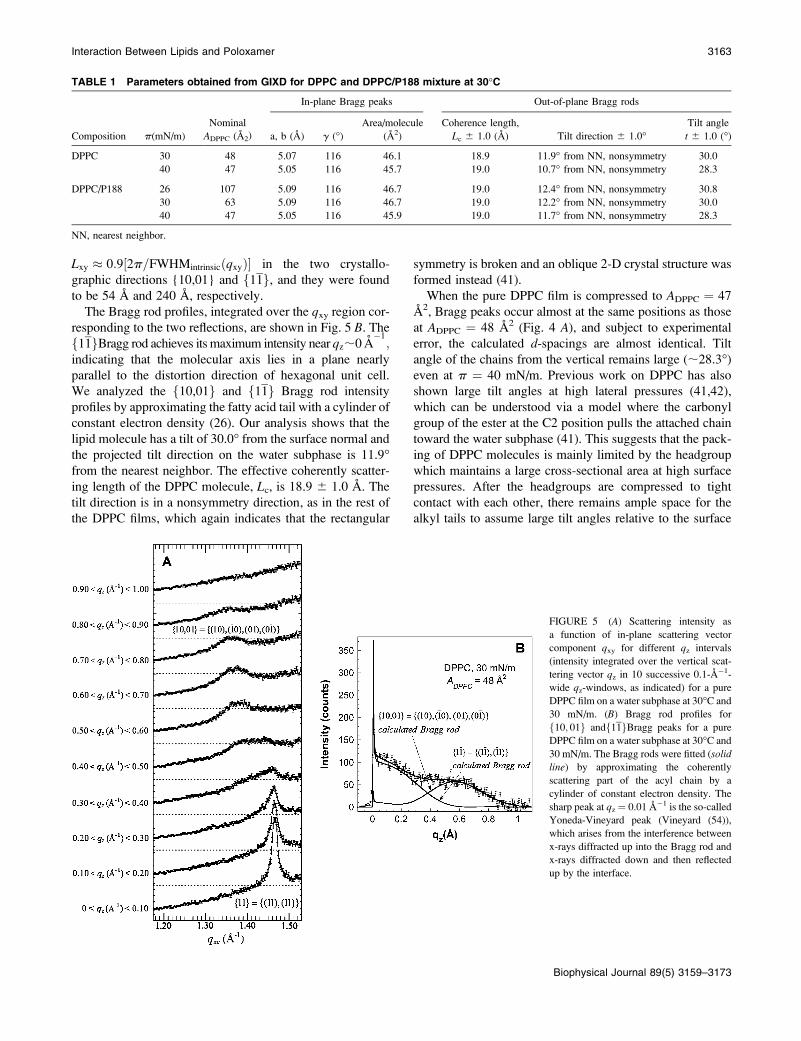
Lxy � 0:9½2p=FWHMintrinsicðqxyÞ� in the two crystallo-
graphic directions {10,01} and f11g, and they were found
to be 54 A and 240 A, respectively.
The Bragg rod profiles, integrated over the qxy region cor-responding to the two reflections, are shown in Fig. 5 B. Thef11gBragg rod achieves its maximum intensity near qz;0 A
�1;
indicating that the molecular axis lies in a plane nearly
parallel to the distortion direction of hexagonal unit cell.
We analyzed the f10,01g and f11g Bragg rod intensity
profiles by approximating the fatty acid tail with a cylinder of
constant electron density (26). Our analysis shows that the
lipid molecule has a tilt of 30.0� from the surface normal and
the projected tilt direction on the water subphase is 11.9�from the nearest neighbor. The effective coherently scatter-
ing length of the DPPC molecule, Lc, is 18.9 6 1.0 A. The
tilt direction is in a nonsymmetry direction, as in the rest of
the DPPC films, which again indicates that the rectangular
symmetry is broken and an oblique 2-D crystal structure was
formed instead (41).
When the pure DPPC film is compressed to ADPPC ¼ 47
A2, Bragg peaks occur almost at the same positions as those
at ADPPC ¼ 48 A2 (Fig. 4 A), and subject to experimental
error, the calculated d-spacings are almost identical. Tilt
angle of the chains from the vertical remains large (;28.3�)even at p ¼ 40 mN/m. Previous work on DPPC has also
shown large tilt angles at high lateral pressures (41,42),
which can be understood via a model where the carbonyl
group of the ester at the C2 position pulls the attached chain
toward the water subphase (41). This suggests that the pack-
ing of DPPC molecules is mainly limited by the headgroup
which maintains a large cross-sectional area at high surface
pressures. After the headgroups are compressed to tight
contact with each other, there remains ample space for the
alkyl tails to assume large tilt angles relative to the surface
TABLE 1 Parameters obtained from GIXD for DPPC and DPPC/P188 mixture at 30�C
Nominal
ADPPC (A2)
In-plane Bragg peaks Out-of-plane Bragg rods
Composition p(mN/m) a, b (A) g (�)Area/molecule
(A2)
Coherence length,
Lc 6 1.0 (A) Tilt direction 6 1.0�Tilt angle
t 6 1.0 (�)
DPPC 30 48 5.07 116 46.1 18.9 11.9� from NN, nonsymmetry 30.0
40 47 5.05 116 45.7 19.0 10.7� from NN, nonsymmetry 28.3
DPPC/P188 26 107 5.09 116 46.7 19.0 12.4� from NN, nonsymmetry 30.8
30 63 5.09 116 46.7 19.0 12.2� from NN, nonsymmetry 30.0
40 47 5.05 116 45.9 19.0 11.7� from NN, nonsymmetry 28.3
NN, nearest neighbor.
FIGURE 5 (A) Scattering intensity as
a function of in-plane scattering vector
component qxy for different qz intervals
(intensity integrated over the vertical scat-
tering vector qz in 10 successive 0.1-A�1-
wide qz-windows, as indicated) for a pure
DPPC film on a water subphase at 30�C and
30 mN/m. (B) Bragg rod profiles for
f10; 01g andf11gBragg peaks for a pure
DPPC film on a water subphase at 30�C and
30 mN/m. The Bragg rods were fitted (solidline) by approximating the coherently
scattering part of the acyl chain by a
cylinder of constant electron density. The
sharp peak at qz ¼ 0.01 A�1 is the so-called
Yoneda-Vineyard peak (Vineyard (54)),
which arises from the interference between
x-rays diffracted up into the Bragg rod and
x-rays diffracted down and then reflected
up by the interface.
Interaction Between Lipids and Poloxamer 3163
Biophysical Journal 89(5) 3159–3173
normal, and the size of unit cell of the alkyl chain cannot
decrease further due to the limitation of headgroup packing.
DPPC/P188 film
The Bragg peaks obtained for the P188-treated DPPC film at
different surface pressures are shown in Fig. 4 B. Uponspreading, the nominal area for DPPC is ADPPC ¼ 107 A2. At
such a large area/molecule and in the absence of P188, the
DPPC film is expected to be in the gas/liquid expanded
coexistence phase, with the surface pressure at 0 mN/m and
with no Bragg peak present. Upon the introduction of P188 in
the subphase, the surface pressure rose from 0 to 26 mN/m
without any compression, and two distinct Bragg peaks are
observed at qxy ¼ 1:37 A�1
and qxy ¼ 1:46 A�1: The calcu-
lated d-spacings are 4.59 A and 4.30 A, which are identical to
those found in Bragg peaks obtained from a pure DPPC
monolayer at a much lower ADPPC. The occurrence of
precisely two Bragg peaks resulting from the f10,01g and
f11g reflections indicates a distorted hexagonal unit cell withaxes jaj ¼ jbj ¼ 5:09 A; g ¼ 116�; and an interfacial area/
molecule of 46.7 A2. Since the size of the unit cell obtained for
DPPC/P188 film is almost identical to that found for pure
DPPC at ADPPC¼ 46.1 A2, coupled to the fact that pure P188
does not form ordered structure, Bragg peaks in the DPPC/
188 film have to come from the DPPC crystals, and P188 does
not interfere with the packing of the orderedDPPCmolecules.
Instead, P188 is incorporated in the disordered phase of
the monolayer. The observed Bragg peaks at a large area/
DPPC molecule can only be explained in one way: P188,
phase-separated fromDPPC, physically occupies a portion of
the available surface area, and the smaller area left for the lipid
forces DPPC molecules to form a condensed phase.
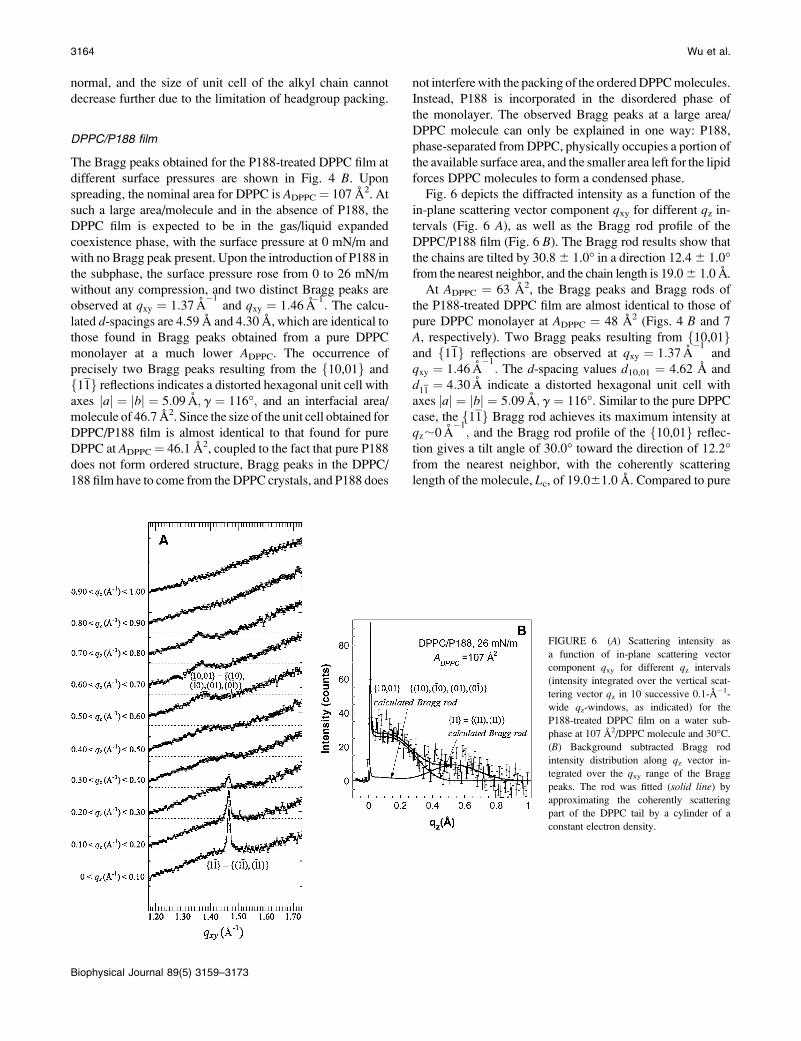
Fig. 6 depicts the diffracted intensity as a function of the
in-plane scattering vector component qxy for different qz in-tervals (Fig. 6 A), as well as the Bragg rod profile of the
DPPC/P188 film (Fig. 6 B). The Bragg rod results show that
the chains are tilted by 30.86 1.0� in a direction 12.46 1.0�from the nearest neighbor, and the chain length is 19.06 1.0 A.
At ADPPC ¼ 63 A2, the Bragg peaks and Bragg rods of
the P188-treated DPPC film are almost identical to those of
pure DPPC monolayer at ADPPC ¼ 48 A2 (Figs. 4 B and 7
A, respectively). Two Bragg peaks resulting from f10,01gand f11g reflections are observed at qxy ¼ 1:37 A
�1and
qxy ¼ 1:46 A�1: The d-spacing values d10,01 ¼ 4.62 A and
d11 ¼ 4:30 A indicate a distorted hexagonal unit cell with
axes jaj ¼ jbj ¼ 5:09 A; g ¼ 116�: Similar to the pure DPPC
case, the f11g Bragg rod achieves its maximum intensity at
qz;0 A�1; and the Bragg rod profile of the f10,01g reflec-
tion gives a tilt angle of 30.0� toward the direction of 12.2�from the nearest neighbor, with the coherently scattering
length of the molecule, Lc, of 19.061.0 A. Compared to pure
FIGURE 6 (A) Scattering intensity as
a function of in-plane scattering vector
component qxy for different qz intervals
(intensity integrated over the vertical scat-
tering vector qz in 10 successive 0.1-A�1-
wide qz-windows, as indicated) for the
P188-treated DPPC film on a water sub-
phase at 107 A2/DPPC molecule and 30�C.(B) Background subtracted Bragg rod
intensity distribution along qz vector in-
tegrated over the qxy range of the Bragg
peaks. The rod was fitted (solid line) by
approximating the coherently scattering
part of the DPPC tail by a cylinder of a
constant electron density.
3164 Wu et al.
Biophysical Journal 89(5) 3159–3173
DPPC, these results again confirmed that P188 does not
affect the lipid packing of the condensed phase. The unit cell
and the molecular tilt found in the condensed phase of DPPC
are preserved in this mixed system, suggesting that P188 is
completely excluded from the condensed region of the film.
For our particular scan, the integrated intensity observed
for the Bragg peaks of DPPC/P188 film at ADPPC¼ 107 A2 is
;12% of that at ADPPC ¼ 47 A2. According to fluorescence
microscopy (22), at ADPPC ¼ 47 A2, the DPPC/P188 film is
mainly composed of condensed phase. Because GIXD is
sensitive only to the ordered phase, this decrease in scat-
tering intensity suggests that an ordered phase in DPPC/P188
film at ADPPC ¼ 107 A2 occupies ;12% relative to that at
ADPPC ¼ 47 A2. It should be noted that the area coverage
reported here for DPPC only reflects the distribution of the
portion of the film scanned by the x-ray beam; the actual
number could fluctuate depending on the heterogeneity of
the film. Nonetheless, at ADPPC ¼ 107 A2 there is a sub-
stantial increase in the area occupied by the condensed
DPPC domains in the presence (;12%) of P188 compared to
the absence (0%) of P188.
For the DPPC/ P188 monolayer, at ADPPC¼ 47 A2 (Figs. 4
B and 7 B), the integrated intensities observed with and
without P188 are the same, indicating that both films have
a similar amount of ordered phase. The in-plane coherence
lengths of DPPC crystallites in pure DPPC and DPPC/P188
films at ADPPC ¼ 47 A2 are also almost identical
(L10;01; 40 A; L11 ; 200 A). This suggests that at low area/
molecule (or high lipid density), P188 no longer stays in the
lipid film. This finding corroborates our isotherm data
indicating that at high surface pressures (p. 36 mN=m),
the phase behavior of the DPPC/P188 system reverts back to
the pure DPPC.
DPPG and DPPG/P188
Similar phenomena related to tightening the packing of the
lipid molecules have also been observed for DPPG. When
the area/DPPG molecule (ADPPG) is 84 A2, pure DPPG
monolayer is in the liquid-expanded phase, and no Bragg
peak is observed (see Fig. 8 A). With P188 in the subphase at
the same nominal ADPPG ¼ 84 A2, one f1, 0g in-plane Braggpeak (in our notation, f1,0g indicates six coinciding reflec-
tions fh,kg¼f(1,0), (0,1), (1,1), (1,0), (0,1), (1,1)g) is ob-
served at qxy ¼ 1:49 A�1
(Fig. 8 B), indicating the existence
of 2-D crystallites with a hexagonal unit cell: a ¼ b ¼4:83 A; g ¼ 120�; and A ¼ 20:2 A
2per tail. Comparing this
Bragg peak with that of pure DPPG at ADPPG¼ 39 A2 (Fig. 8
A, Table 2), the dimensions of this unit cell of DPPG/P188
film at ADPPG ¼ 84 A2 are almost identical to those of the
FIGURE 7 Bragg rod profiles for Bragg rods
in the f10,01g and f11g directions for a DPPC/P188 film on a water subphase at (A) ADPPC ¼63 A2 and (B) ADPPC ¼ 47 A2, both at 30�C.The rods were fitted (solid line) by approxi-
mating the coherently scattering part of the
alkyl chain by a cylinder of constant electron
density.
FIGURE 8 Bragg peaks at different pack-
ing densities from GIXD on a water subphase
at 30�C of (A) pure DPPG and (B) DPPG/
P188 films. For clarity, the data have been
offset vertically.
Interaction Between Lipids and Poloxamer 3165
Biophysical Journal 89(5) 3159–3173
pure DPPG monolayer at ADPPG ¼ 39 A2, again demon-
strating that P188 does not interfere with the packing of
ordered lipid molecules. Similarly, identical lattice param-
eters for DPPG are obtained in the absence and presence of
P188 at even lower ADPPG (see Table 2).
A finite size of the crystalline domain leads to the broad-
ening of Bragg peaks. The coherence lengths Lxy calculatedfrom the FWHM of Bragg peaks are listed in Table 2, along
with the orientation of these straight alkyl chains (chain
length Lc, tilt direction, and tilt angle). There is a pronounceddecrease in the coherence length Lxy of the DPPG/P188 film
compared to that of pure DPPG. Comparing the intensities of
Bragg peaks at 30 mN/m, the intensity of the DPPG/P188
peak is 66.4% of that of pure DPPG; this is due to the
presence of P188 in the footprint and smaller coherence
length of crystallites in the DPPG/P188 film.
X-ray reflectivity
Pure DPPC
XR measurements were carried out for both DPPC (Fig. 9)
and P188-pretreated DPPC monolayers below and above the
‘‘squeeze-out pressure’’, the surface pressure beyond which
isotherms of pure DPPC and P188/DPPC superimpose. The
pure lipid monolayers were fitted with the simplest two-box
model (see Table 3, Fig. 9): one for the headgroup region and
one for the tail region, with only one root-mean-square
(roughness) parameter to smear out the interfaces. During
the refinement and model fitting the number of electrons in
the tail region was fixed to 242 (value calculated from the
chemical formula for DPPC) and the area/molecule was fixed
to the measured value to reduce the number of fitting pa-
rameters.
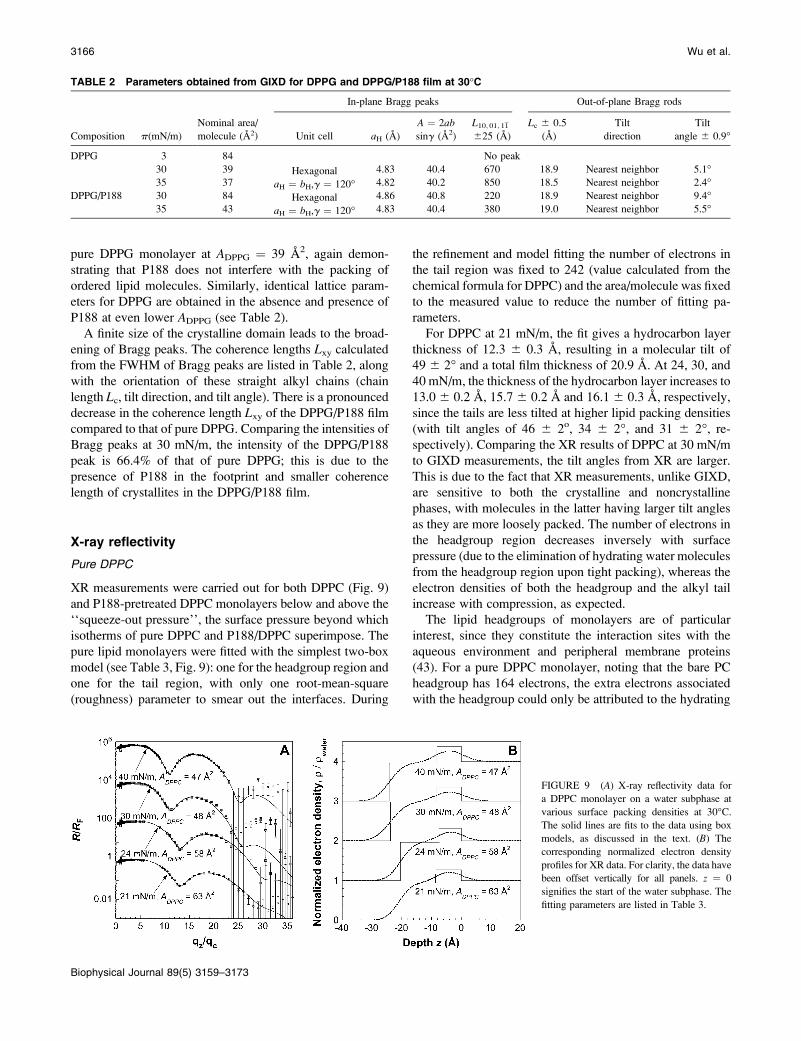
For DPPC at 21 mN/m, the fit gives a hydrocarbon layer
thickness of 12.3 6 0.3 A, resulting in a molecular tilt of
49 6 2� and a total film thickness of 20.9 A. At 24, 30, and
40 mN/m, the thickness of the hydrocarbon layer increases to
13.0 6 0.2 A, 15.7 6 0.2 A and 16.1 6 0.3 A, respectively,
since the tails are less tilted at higher lipid packing densities
(with tilt angles of 46 6 2o, 34 6 2�, and 31 6 2�, re-spectively). Comparing the XR results of DPPC at 30 mN/m
to GIXD measurements, the tilt angles from XR are larger.
This is due to the fact that XR measurements, unlike GIXD,
are sensitive to both the crystalline and noncrystalline
phases, with molecules in the latter having larger tilt angles
as they are more loosely packed. The number of electrons in
the headgroup region decreases inversely with surface
pressure (due to the elimination of hydrating water molecules
from the headgroup region upon tight packing), whereas the
electron densities of both the headgroup and the alkyl tail
increase with compression, as expected.
The lipid headgroups of monolayers are of particular
interest, since they constitute the interaction sites with the
aqueous environment and peripheral membrane proteins
(43). For a pure DPPC monolayer, noting that the bare PC
headgroup has 164 electrons, the extra electrons associated
with the headgroup could only be attributed to the hydrating
TABLE 2 Parameters obtained from GIXD for DPPG and DPPG/P188 film at 30�C
Nominal area/
molecule (A2)
In-plane Bragg peaks Out-of-plane Bragg rods
Composition p(mN/m) Unit cell aH (A)
A ¼ 2ab
sing (A2)
L10; 01; 11625 (A)
Lc 6 0.5
(A)
Tilt
direction
Tilt
angle 6 0.9�
DPPG 3 84 No peak
30 39 Hexagonal
aH ¼ bH,g ¼ 120�4.83 40.4 670 18.9 Nearest neighbor 5.1�
35 37 4.82 40.2 850 18.5 Nearest neighbor 2.4�DPPG/P188 30 84 Hexagonal
aH ¼ bH,g ¼ 120�4.86 40.8 220 18.9 Nearest neighbor 9.4�
35 43 4.83 40.4 380 19.0 Nearest neighbor 5.5�
FIGURE 9 (A) X-ray reflectivity data for
a DPPC monolayer on a water subphase at
various surface packing densities at 30�C.The solid lines are fits to the data using box
models, as discussed in the text. (B) The
corresponding normalized electron density
profiles for XR data. For clarity, the data have
been offset vertically for all panels. z ¼ 0
signifies the start of the water subphase. The
fitting parameters are listed in Table 3.
3166 Wu et al.
Biophysical Journal 89(5) 3159–3173
water molecules. The number of water molecules in the
hydration shell of each headgroup (Nwater) is listed in Table
3. From the fitted thickness of the headgroup box, as well as
the area/molecule from the isotherm, the total volume of the
headgroup region is known. If it is assumed that the partial
volumes are additive, then the bare headgroup volume
(Vo,head) can be calculated, and the value is listed in Table 3.
For the component volume of each water molecule, the bulk
value Vw ¼ 30.0 A3 has been used. It is worth noting that the
calculated bare headgroup volumes from different surface
pressures turn out to be almost constant, and agree well with
reported values (44,45), within the error range of a few A3.
We further note that M. Schalke analyzed reflectivity data
for DPPC at 22�C (46), accounting for the lipid headgroup in
terms of its three components (glycerol backbone, phos-
phate, and choline) described by partly overlapping volume-
restricted distribution functions along the z axis (43,47).
With additional information from FTIR and neutron reflecti-
vity, a similar pressure dependence of headgroup hydration
has been found.
DPPC/P188
p ¼ 26mN=m; precompression at ADPPC ¼ 107 A2
Strong corroborative evidence for phase separation of P188
from DPPC molecules can be found from the heterogeneity
of the DPPC/P188 film observed with XR. For DPPC/P188
on pure water at
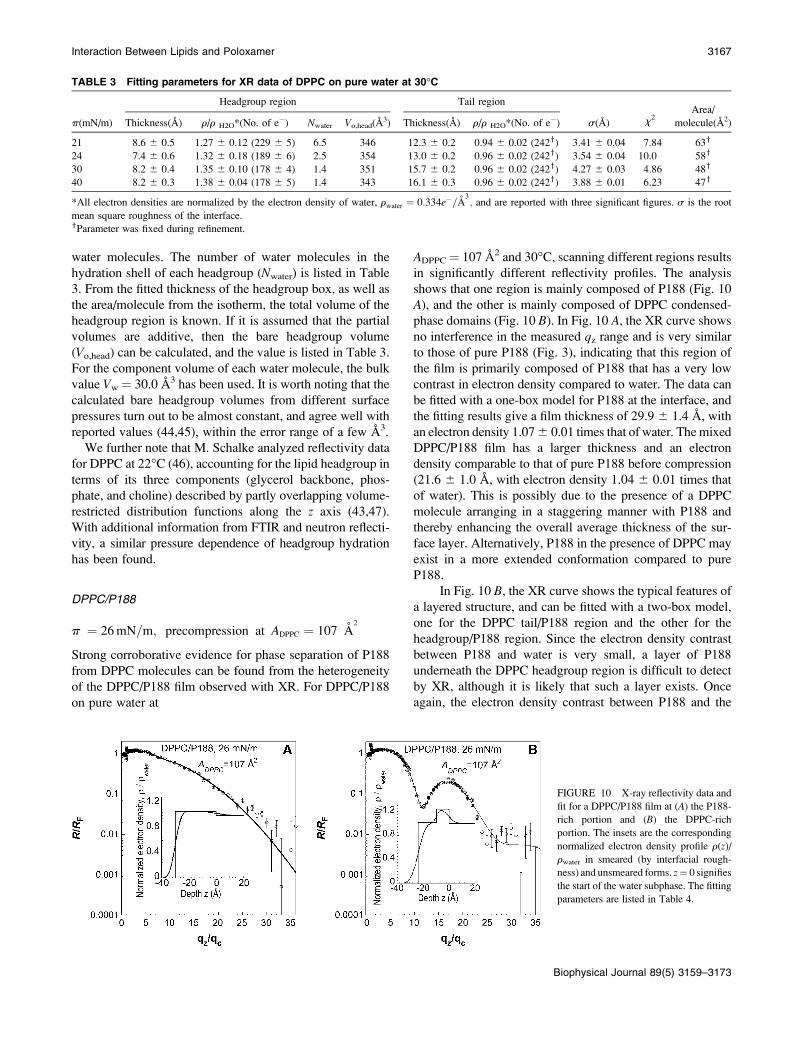
ADPPC ¼ 107 A2 and 30�C, scanning different regions resultsin significantly different reflectivity profiles. The analysis
shows that one region is mainly composed of P188 (Fig. 10
A), and the other is mainly composed of DPPC condensed-
phase domains (Fig. 10 B). In Fig. 10 A, the XR curve shows
no interference in the measured qz range and is very similar
to those of pure P188 (Fig. 3), indicating that this region of
the film is primarily composed of P188 that has a very low
contrast in electron density compared to water. The data can
be fitted with a one-box model for P188 at the interface, and
the fitting results give a film thickness of 29.9 6 1.4 A, with
an electron density 1.076 0.01 times that of water. The mixed
DPPC/P188 film has a larger thickness and an electron
density comparable to that of pure P188 before compression
(21.6 6 1.0 A, with electron density 1.04 6 0.01 times that
of water). This is possibly due to the presence of a DPPC
molecule arranging in a staggering manner with P188 and
thereby enhancing the overall average thickness of the sur-
face layer. Alternatively, P188 in the presence of DPPC may
exist in a more extended conformation compared to pure
P188.
In Fig. 10 B, the XR curve shows the typical features of
a layered structure, and can be fitted with a two-box model,
one for the DPPC tail/P188 region and the other for the
headgroup/P188 region. Since the electron density contrast
between P188 and water is very small, a layer of P188
underneath the DPPC headgroup region is difficult to detect
by XR, although it is likely that such a layer exists. Once
again, the electron density contrast between P188 and the
TABLE 3 Fitting parameters for XR data of DPPC on pure water at 30�C
p(mN/m)
Headgroup region Tail region
s(A) x2Area/
molecule(A2)Thickness(A) r/r H2O*(No. of e�) Nwater Vo,head(A
3) Thickness(A) r/r H2O*(No. of e�)
21 8.6 6 0.5 1.27 6 0.12 (229 6 5) 6.5 346 12.3 6 0.2 0.94 6 0.02 (242y) 3.41 6 0.04 7.84 63y
24 7.4 6 0.6 1.32 6 0.18 (189 6 6) 2.5 354 13.0 6 0.2 0.96 6 0.02 (242y) 3.54 6 0.04 10.0 58y
30 8.2 6 0.4 1.35 6 0.10 (178 6 4) 1.4 351 15.7 6 0.2 0.96 6 0.02 (242y) 4.27 6 0.03 4.86 48y
40 8.2 6 0.3 1.38 6 0.04 (178 6 5) 1.4 343 16.1 6 0.3 0.96 6 0.02 (242y) 3.88 6 0.01 6.23 47y
*All electron densities are normalized by the electron density of water, rwater ¼ 0:334e�=A3; and are reported with three significant figures. s is the root
mean square roughness of the interface.yParameter was fixed during refinement.
FIGURE 10 X-ray reflectivity data and
fit for a DPPC/P188 film at (A) the P188-rich portion and (B) the DPPC-rich
portion. The insets are the corresponding
normalized electron density profile r(z)/
rwater in smeared (by interfacial rough-
ness) and unsmeared forms. z¼ 0 signifies
the start of the water subphase. The fitting
parameters are listed in Table 4.
Interaction Between Lipids and Poloxamer 3167
Biophysical Journal 89(5) 3159–3173
alkyl tail is small, whereas the contrast between P188 and the
DPPC headgroup is significant. The existence of P188 in the
DPPC layer can therefore be confirmed by the reduction of
the electron density for the headgroup region of pure DPPC
at a similar surface pressure.
The fit results for the mixed system are presented in Table
4. Results presented here are obtained by using the simplest
possible model. We can fit the high qz range more precisely by
including more parameters (e.g., different roughness on differ-
ent interfaces). We have attempted such fittings with higher
precision, but they do not give us any new information as far
as the electron density and the box thickness are concerned.
When the x-ray beam falls within either region, a normal
XR curve is obtained, as shown in Fig. 10. However, when
the x-ray beam crosses the boundary of the two regions, poor
overlaps in the reflectivity curve were observed (data not
shown) when part of the qz range was remeasured before and
after beam translation. Poor overlaps have been observed
when the beam was moved from a P188-rich region (similar
to Fig. 10 A) to a lipid-rich region (similar to Fig. 10 B), aswell as in the opposite direction. Since changes in both di-
rections have been observed, beam damage can be excluded
as the potential cause for such poor overlaps, as it only alters
the intrinsic feature of the XR curve to that of a bare water
interface but can never induce lipid features, as observed in
half of our cases showing poor overlaps. Furthermore, XR
data measured on the same surface positions are reproducible.
Our analysis suggests that P188 inserts all the way to the
end of the DPPC tail group. Despite attempts to divide the
tail region into two boxes, least-square fitting always reverts
back to parameters corresponding to only one box for the tail
region. Although the electron density contrast between DPPC
tail and poloxamer is low, neutron reflectivity experiments
with specific site deuteration to afford better contrast are cur-
rently underway to elucidate the extent of poloxamer inser-
tion into the tail region.
p ¼ 33mN=m
At 33mN/m the film remains heterogeneous, giving either
lipid-rich or lipid-poor featured XR curves (see Table 4)
depending on the location of the x-ray beam. To illustrate
surface hererogeneity, two XR curves (not shown here but
similar to Fig. 10 B) representing the two regions of the film
were collected and analyzed. Similar to the case of 26 mN/m,
the fitting parameters calculated from P188 surface coverage,
which is estimated from the expansion of ADPPC in DPPC/
P188 film compared to that of pure DPPC, serve as good
starting points for fitting these XR data, and the resulting
fitting parameters are listed in Table 4. Results from fitting
indicate that the P188 content corresponds to 15% and 29%,
respectively.
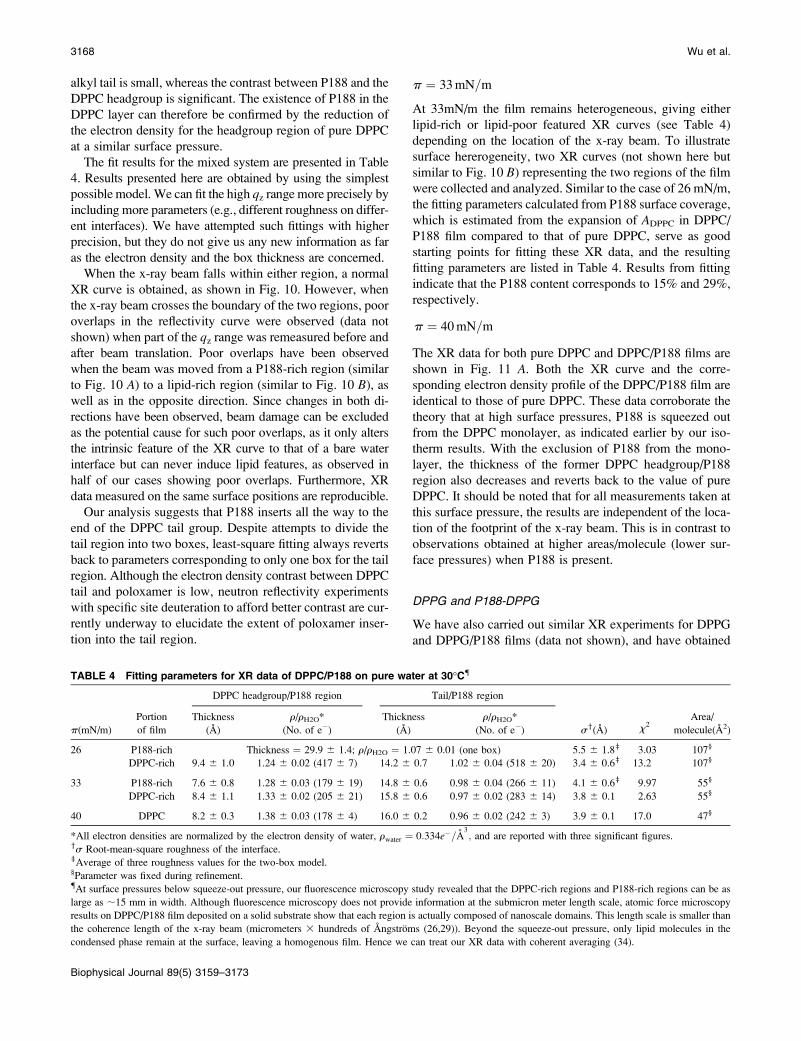
p ¼ 40mN=m
The XR data for both pure DPPC and DPPC/P188 films are
shown in Fig. 11 A. Both the XR curve and the corre-
sponding electron density profile of the DPPC/P188 film are
identical to those of pure DPPC. These data corroborate the
theory that at high surface pressures, P188 is squeezed out
from the DPPC monolayer, as indicated earlier by our iso-
therm results. With the exclusion of P188 from the mono-
layer, the thickness of the former DPPC headgroup/P188
region also decreases and reverts back to the value of pure
DPPC. It should be noted that for all measurements taken at
this surface pressure, the results are independent of the loca-
tion of the footprint of the x-ray beam. This is in contrast to
observations obtained at higher areas/molecule (lower sur-
face pressures) when P188 is present.
DPPG and P188-DPPG
We have also carried out similar XR experiments for DPPG
and DPPG/P188 films (data not shown), and have obtained
TABLE 4 Fitting parameters for XR data of DPPC/P188 on pure water at 30�C{
p(mN/m)
Portion
of film
DPPC headgroup/P188 region Tail/P188 region
sy(A) x2Area/
molecule(A2)
Thickness
(A)
r/rH2O*
(No. of e�)
Thickness
(A)
r/rH2O*
(No. of e�)
26 P188-rich Thickness ¼ 29.9 6 1.4; r/rH2O ¼ 1.07 6 0.01 (one box) 5.5 6 1.8z 3.03 107§
DPPC-rich 9.4 6 1.0 1.24 6 0.02 (417 6 7) 14.2 6 0.7 1.02 6 0.04 (518 6 20) 3.4 6 0.6z 13.2 107§
33 P188-rich 7.6 6 0.8 1.28 6 0.03 (179 6 19) 14.8 6 0.6 0.98 6 0.04 (266 6 11) 4.1 6 0.6z 9.97 55§
DPPC-rich 8.4 6 1.1 1.33 6 0.02 (205 6 21) 15.8 6 0.6 0.97 6 0.02 (283 6 14) 3.8 6 0.1 2.63 55§
40 DPPC 8.2 6 0.3 1.38 6 0.03 (178 6 4) 16.0 6 0.2 0.96 6 0.02 (242 6 3) 3.9 6 0.1 17.0 47§
*All electron densities are normalized by the electron density of water, rwater ¼ 0:334e�=A3; and are reported with three significant figures.
ys Root-mean-square roughness of the interface.zAverage of three roughness values for the two-box model.§Parameter was fixed during refinement.{At surface pressures below squeeze-out pressure, our fluorescence microscopy study revealed that the DPPC-rich regions and P188-rich regions can be as
large as ;15 mm in width. Although fluorescence microscopy does not provide information at the submicron meter length scale, atomic force microscopy
results on DPPC/P188 film deposited on a solid substrate show that each region is actually composed of nanoscale domains. This length scale is smaller than
the coherence length of the x-ray beam (micrometers 3 hundreds of Angstroms (26,29)). Beyond the squeeze-out pressure, only lipid molecules in the
condensed phase remain at the surface, leaving a homogenous film. Hence we can treat our XR data with coherent averaging (34).
3168 Wu et al.
Biophysical Journal 89(5) 3159–3173
similar results as in the DPPC case. At low surface pressures
(p, 38 mN/m) P188 remains inserted into the DPPG mono-
layer. The presence of the poloxamer results in similar
surface heterogeneities to those observed for DPPC, giving
rise to DPPG-rich and P188-rich regions in the surface film.
Such heterogeneities are reflected by the different XR pro-
files observed at a given surface pressure (data not shown).
At high surface pressure (p . 38 mN/m), P188 is squeezed
out from the tail portion of DPPG monolayer. Although
DPPC and DPPG have different headgroup charges, our
observation shows that P188 insertion is not influenced by
electrostatics. This should not be surprising, as P188 is a
nonionic surfactant.
DISCUSSION
Our isotherm results demonstrate that P188 is a highly
surface-active copolymer. With the presence of a lipid film at
the air-water interface at 0 mN/m and 30�C, the injection of
P188 into the subphase at a final concentration of 50 mM
reduces the surface tension and increases the surface pressure
from 0 to 26 mN/m in 40 min. The surface pressure changes
sharply in the first few minutes after P188 injection; after 10
min, the change becomes gradual and slow. After 40 min,
XR scans on P188 over time (with a 2-h gap) show small
differences that are within the error range (data not shown).
All x-ray scattering data presented here were taken at least
40 min after helium flushing, at which point the adsorption
of P188 to the air-water interface is so slow that any residual
change in the film structure over time can hardly be detected
by XR. It is likely that the slow P188 adsorption into lipid
monolayer slightly changes the occupancy of lipid-rich re-
gions. Besides, there might also be a conformational change
of P188 at the interface.
XR and GIXD measurements have been used to provide
molecular-level information for the insertion of P188 into the
DPPC and DPPG monolayers at the air-water interface. They
both agree well with the postulate that P188 interacts with
structurally disrupted membrane portions, and is effectively
excluded from the once-damaged portion when the lipid pack-
ing density of a normal membrane has been reestablished.
Recently, the squeezing-out of Gemini surfactants with anti-
HIV activity from the phospholipid monolayer upon com-
pression has also been reported (48).
It is clear from our GIXD data that P188 does not affect
the molecular packing of the ordered phase of DPPC, sug-
gesting that P188 is completely excluded from the ordered
portion of the monolayer. Our findings also indicate that
P188 and DPPC do not mix well with each other. Such
demixing has been observed to occur almost instantaneously
upon P188 adsorption to the lipid film via fluorescence
microscopy (data not shown). Clear evidence of phase sep-
aration between P188 and the ordered lipid phase is provided
by GIXD measurements taken ;40 min after the introduc-
tion of the poloxamer.
The presence of P188 at the interface acts to force lipid
molecules to pack more tightly, and the amount of P188
incorporated into the DPPC film is likely to be controlled by
the surface free energy. When the surface pressure of DPPC
monolayer is low (,36 mN/m), P188 adsorbs to the air-water
interface and physically occupies a portion of the available
area, causing the subsequent formation of 2-D crystallites
of DPPC molecules. When the surface pressure is increased
to .36 mN/m, the close contact between P188 and DPPC
becomes unfavorable and P188 is entirely squeezed out from
the DPPC tail region. In the context of membrane sealing, the
insertion of poloxamer into a low-density lipid film at the
air/water interface helps elucidate the mechanism by which
the poloxamer seals damaged membranes in living cells. In
effect, the low-density lipid film in our model system mimics
the hydrophobic-aqueous environment found both at the
highly curved lipid portion that constitutes the pore on a
damaged membrane, and in the portion of the membrane
that has enhanced permeability due to a reduction in lipid
density. Just as in our model system, both of these sites in
a damaged membrane have an enhanced exposure of the
lipid hydrocarbon tail to the aqueous environment, into
which the poloxamer inserts. Such an insertion results in the
FIGURE 11 (A) X-ray reflectivity data
for DPPC and DPPC/P188 films on a water
subphase at ADPPC ¼ 47 A2. The solid lines
are fits to the data using the box models
discussed in the text. (B) The corresponding
normalized electron density profiles for the
XR data. z ¼ 0 signifies the start of the
water subphase. For clarity, the data have
been offset vertically. The fitting param-
eters are listed in Table 4.
Interaction Between Lipids and Poloxamer 3169
Biophysical Journal 89(5) 3159–3173
tightening of the lipid packing, as demonstrated in our GIXD
results. This, along with the fact that the PEO portion of the
polymer remains situated in the aqueous phase with a certain
radius of gyration, helps restore the barrier function of the
damaged membrane and reduces its permeability. Even when
a pore exists on the membrane surface, we do not expect the
poloxamer’s sealing action to be brought about by its inser-
tion into the water-water interface. Rather, by inserting into
the highly curved regions around the pore, the poloxamer can
help bring lipids on different sides of the pore together and
displace water molecules out of the pore region, thus elimi-
nating the pore formation and restoring the barrier function.
Phase separation in lipid/poloxamer systems has pre-
viously been inferred (49). Differential scanning calorimetry
(DSC) has shown that the liposomal bilayer’s main phase
transition endotherm broadens with a shoulder at high polo-
xamer concentration, indicating the presence of two distinct
entities. Moreover, the decrease in mean liposome radius
implies the possible existence of mixed micelles. Nonethe-
less the DSC and size analysis results only indirectly point to
a separation between poloxamer-rich and poloxamer-poor
phases. DPPC ordering by P188 and the surface inhomoge-
neity observed here unambiguously confirm such phase sep-
aration. In the context of membrane sealing, P188 insertion
increases the lipid packing density, which in turn helps arrest
leakage, as observed in damaged cells (2,50). Although
the presence of P188 would increase the lipid packing
density, we do not expect the lipids to attain the gel state in
real membranes due to the large fraction of unsaturated lipids
present.
The incapability of P188 to remain in the system at high
surface pressures can be beneficial in terms of its application
as a membrane sealant. After electroporation, cells may ac-
tivate a self-healing process, restoring the structural integrity
of the lipid bilayer of the cell membrane. As the cell heals
and the lipid packing of the membrane is restored, our data
suggests that there is a mechanism through which P188 exits
the membrane.
The selective insertion of P188 into low- over high-
density lipid film helps to clarify some of the earlier findings
on the interaction between poloxamers and different lipid
bilayers. It has been suggested (51) that poloxamers asso-
ciate with relatively fluid eggPC bilayers, resulting in an
increased particle size caused by the projection of PEO
groups from the liposome surface. This was not observed
when poloxamers were added to gel state DSPC liposomes
(52). It has also been found by DSC (49) that phospholipid
bilayer pretransition enthalpy was reduced when poloxamers
interacted with the liquid-crystalline state, but not gel-state
liposomes. These findings can now be understood in terms of
lipid ordering tuning poloxamer insertion, where loose
packing in the fluid bilayer promotes insertion whereas tight
packing in the gel state inhibits insertion. Moreover, our data
suggest that poloxamer interacts with liposomes via pen-
etration into liquid crystalline state bilayers rather than
adsorption onto liposome surfaces. Previous work has also
reported similar results for peptide-lipid interactions with
monolayer and bilayer models (53). Although our monolayer
work can help shed light on bilayer studies, differences may
exist in the conformation and orientation of the interacting
poloxamer.
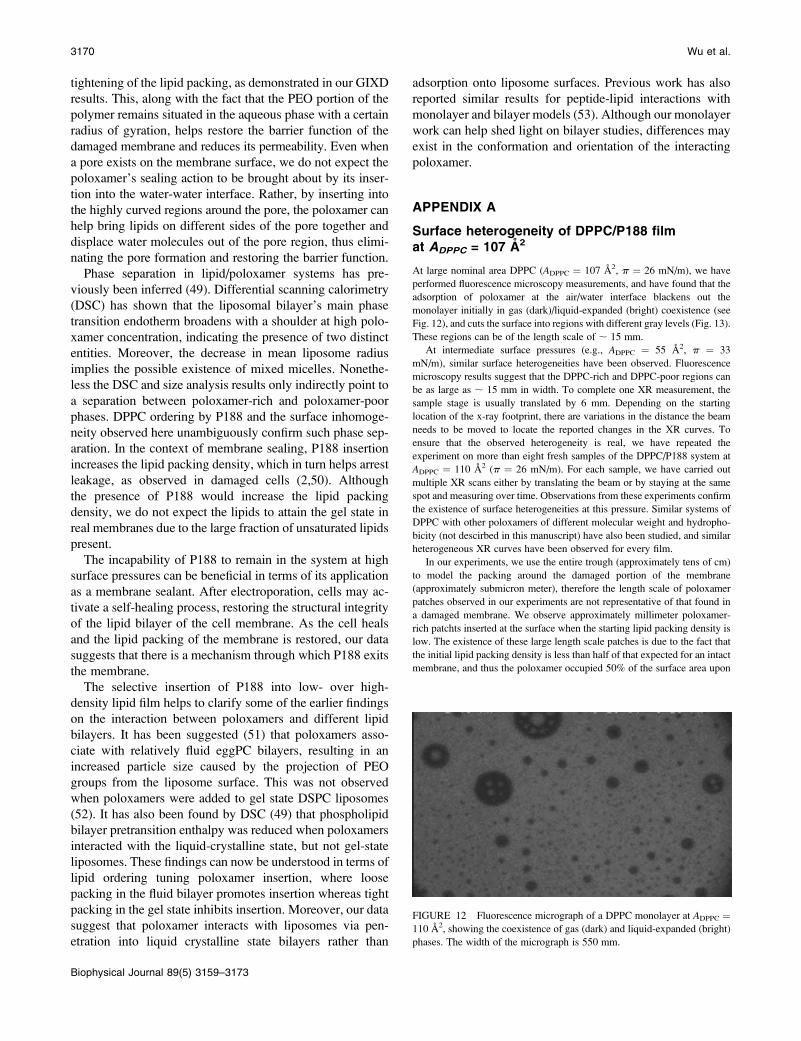
APPENDIX A
Surface heterogeneity of DPPC/P188 filmat ADPPC = 107 A2
At large nominal area DPPC (ADPPC ¼ 107 A2, p ¼ 26 mN/m), we have
performed fluorescence microscopy measurements, and have found that the
adsorption of poloxamer at the air/water interface blackens out the
monolayer initially in gas (dark)/liquid-expanded (bright) coexistence (see
Fig. 12), and cuts the surface into regions with different gray levels (Fig. 13).
These regions can be of the length scale of ; 15 mm.
At intermediate surface pressures (e.g., ADPPC ¼ 55 A2, p ¼ 33
mN/m), similar surface heterogeneities have been observed. Fluorescence
microscopy results suggest that the DPPC-rich and DPPC-poor regions can
be as large as ; 15 mm in width. To complete one XR measurement, the
sample stage is usually translated by 6 mm. Depending on the starting
location of the x-ray footprint, there are variations in the distance the beam
needs to be moved to locate the reported changes in the XR curves. To
ensure that the observed heterogeneity is real, we have repeated the
experiment on more than eight fresh samples of the DPPC/P188 system at
ADPPC ¼ 110 A2 (p ¼ 26 mN/m). For each sample, we have carried out
multiple XR scans either by translating the beam or by staying at the same
spot and measuring over time. Observations from these experiments confirm
the existence of surface heterogeneities at this pressure. Similar systems of
DPPC with other poloxamers of different molecular weight and hydropho-
bicity (not descirbed in this manuscript) have also been studied, and similar
heterogeneous XR curves have been observed for every film.
In our experiments, we use the entire trough (approximately tens of cm)
to model the packing around the damaged portion of the membrane
(approximately submicron meter), therefore the length scale of poloxamer
patches observed in our experiments are not representative of that found in
a damaged membrane. We observe approximately millimeter poloxamer-
rich patchts inserted at the surface when the starting lipid packing density is
low. The existence of these large length scale patches is due to the fact that
the initial lipid packing density is less than half of that expected for an intact
membrane, and thus the poloxamer occupied 50% of the surface area upon
FIGURE 12 Fluorescence micrograph of a DPPC monolayer at ADPPC ¼110 A2, showing the coexistence of gas (dark) and liquid-expanded (bright)
phases. The width of the micrograph is 550 mm.
3170 Wu et al.
Biophysical Journal 89(5) 3159–3173
insertion for ADPPC ¼ 107 A2 (the coverage of inserted poloxamer decreases
as the degree of integrity loss decreases). Although the surface occupancy of
the poloxamer in our model system should reflect that found in the damaged
membrane of the cell, the physical length scale of the poloxamer patches
does not have any bearing on the actual system.
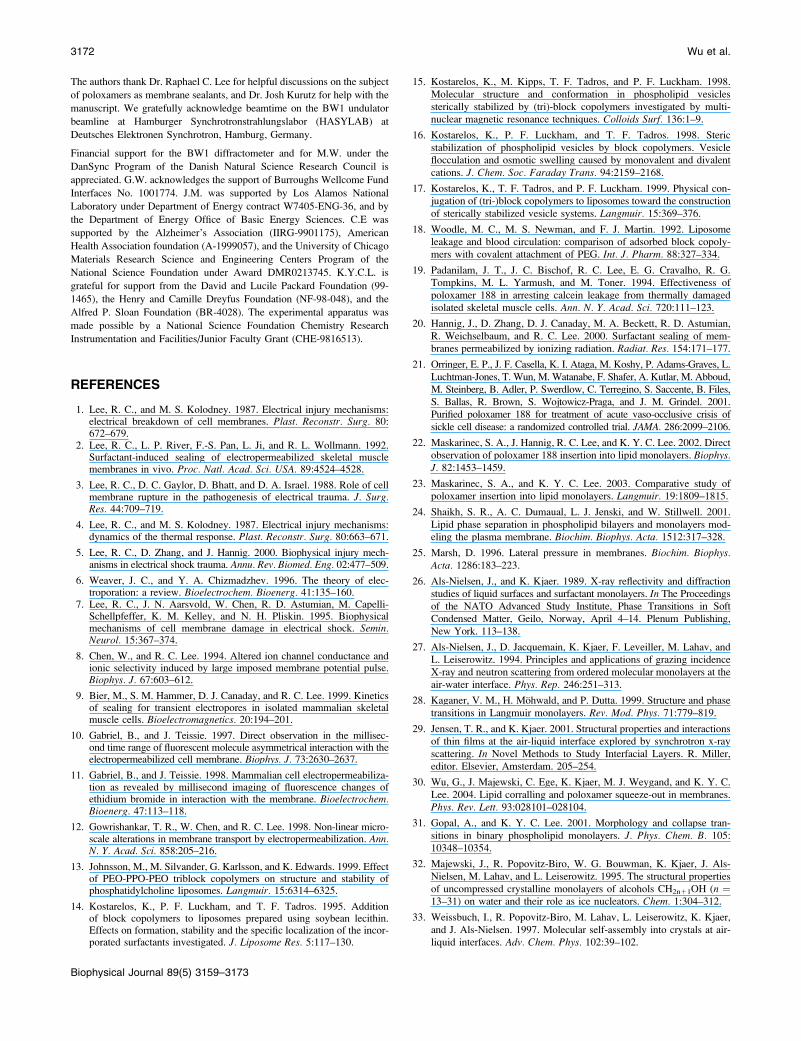
APPENDIX B
Monitoring the beam damage
In the XR measurements of DPPC/P188 films at relatively low surface
pressures, we have obtained different XR data when we move the footprint
of the x-ray beam to different regions of the film. Beam damage could be a
plausible cause for the observed behavior. To verify that the observed
differences of the XR profiles were not caused by beam damage, we have
measured XR as a function of time without moving the x-ray beam. If beam
damage was indeed the culprit, identical result could not be achievable. Fig.
14 shows that two XR curves taken 2 h apart. Close examination indicates
that the two curves are basically identical up to qz/qc¼ 25. Since the intensity
minima at qz/qc � 10 greatly deviate from the Fresnel curve, they constitute
the most sensitive location to reflect possible beam damages. The fact that
these minima are identical excludes the possibility that there is any beam
damage in the two curves taken 2 h apart.
The slight difference observed here can be due to a time effect intrinsic to
the system. The fitting results show that the parameters for the thickness and
electron density are identical for the two cases with only the roughness for
the interfaces being different. (For the first measurement, the roughness is
3.87 A, and after 2 h it increases to;4.76 A.) As discussed earlier, the P188
is squeezed out from the DPPC film upon compression. One possible
explanation for the increase in roughness with time is that P188, upon
squeeze-out (where the relatively hydrophobic PPO portion becomes
excluded from the alkyl chain region), rearranges under the headgroup
and undergoes conformational changes with time.
APPENDIX C
All initial pressures reported in this study are ;4 mN/m higher than in our
previous published results (22). This is due to the fact that the pressures were
recorded 5 min after P188 injection in previous experiments (22), whereas
data reported here were taken 40 min after injection to match the waiting
time needed in x-ray experiments for He flushing. A similar difference is
also found in the squeeze-out pressure reported below.
APPENDIX D
The distorted-hexagonal lattice (a ¼ b, g 6¼ 120�) can be thought of as
arising through the distortion of a hexagonal lattice in a symmetry direction.
It can also be described as a centered rectangular lattice (40): ar ¼2a cosðg=2Þ; br ¼ 2a sinðg=2Þ; andgr ¼ 90�: If a hexagonal lattice is
distorted in a nonsymmetry direction, an oblique lattice results.
APPENDIX E
Three Bragg peaks were observed by Brezesinski et al. (41) for DPPC at
30 mN/m, but at 15�C, qxy ¼ 1.351, 1.382, and 1.459 A�1 indicating an
oblique lattice, albeit with two peaks at qxy ¼ 1.351, 1.382 A�1 barely
resolved. Also, the tilt direction was deduced to be in a nonsymmetry
direction, again indicating that the centered-rectangular symmetry was
broken.
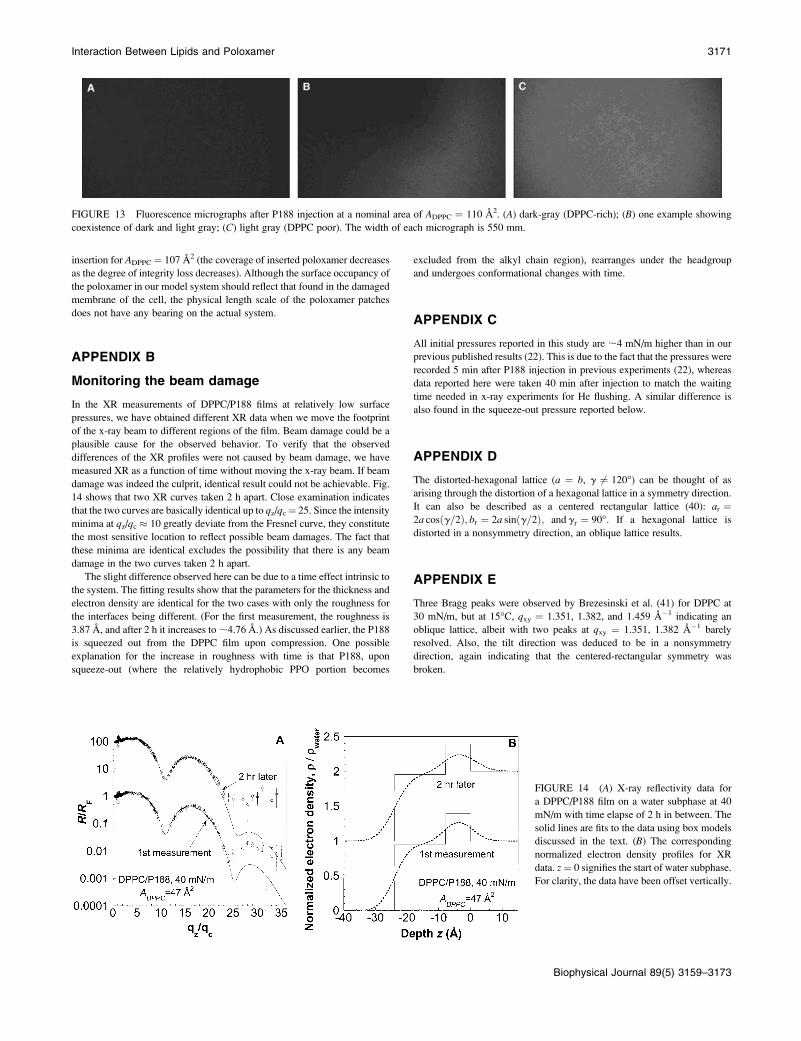
FIGURE 13 Fluorescence micrographs after P188 injection at a nominal area of ADPPC ¼ 110 A2. (A) dark-gray (DPPC-rich); (B) one example showing
coexistence of dark and light gray; (C) light gray (DPPC poor). The width of each micrograph is 550 mm.
FIGURE 14 (A) X-ray reflectivity data for
a DPPC/P188 film on a water subphase at 40
mN/m with time elapse of 2 h in between. The
solid lines are fits to the data using box models
discussed in the text. (B) The corresponding
normalized electron density profiles for XR
data. z¼ 0 signifies the start of water subphase.
For clarity, the data have been offset vertically.
Interaction Between Lipids and Poloxamer 3171
Biophysical Journal 89(5) 3159–3173
The authors thank Dr. Raphael C. Lee for helpful discussions on the subject
of poloxamers as membrane sealants, and Dr. Josh Kurutz for help with the
manuscript. We gratefully acknowledge beamtime on the BW1 undulator
beamline at Hamburger Synchrotronstrahlungslabor (HASYLAB) at
Deutsches Elektronen Synchrotron, Hamburg, Germany.
Financial support for the BW1 diffractometer and for M.W. under the
DanSync Program of the Danish Natural Science Research Council is
appreciated. G.W. acknowledges the support of Burroughs Wellcome Fund
Interfaces No. 1001774. J.M. was supported by Los Alamos National
Laboratory under Department of Energy contract W7405-ENG-36, and by
the Department of Energy Office of Basic Energy Sciences. C.E was
supported by the Alzheimer’s Association (IIRG-9901175), American
Health Association foundation (A-1999057), and the University of Chicago
Materials Research Science and Engineering Centers Program of the
National Science Foundation under Award DMR0213745. K.Y.C.L. is
grateful for support from the David and Lucile Packard Foundation (99-
1465), the Henry and Camille Dreyfus Foundation (NF-98-048), and the
Alfred P. Sloan Foundation (BR-4028). The experimental apparatus was
made possible by a National Science Foundation Chemistry Research
Instrumentation and Facilities/Junior Faculty Grant (CHE-9816513).
REFERENCES
1. Lee, R. C., and M. S. Kolodney. 1987. Electrical injury mechanisms:electrical breakdown of cell membranes. Plast. Reconstr. Surg. 80:672–679.
2. Lee, R. C., L. P. River, F.-S. Pan, L. Ji, and R. L. Wollmann. 1992.Surfactant-induced sealing of electropermeabilized skeletal musclemembranes in vivo. Proc. Natl. Acad. Sci. USA. 89:4524–4528.
3. Lee, R. C., D. C. Gaylor, D. Bhatt, and D. A. Israel. 1988. Role of cellmembrane rupture in the pathogenesis of electrical trauma. J. Surg.Res. 44:709–719.
4. Lee, R. C., and M. S. Kolodney. 1987. Electrical injury mechanisms:dynamics of the thermal response. Plast. Reconstr. Surg. 80:663–671.
5. Lee, R. C., D. Zhang, and J. Hannig. 2000. Biophysical injury mech-anisms in electrical shock trauma. Annu. Rev. Biomed. Eng. 02:477–509.
6. Weaver, J. C., and Y. A. Chizmadzhev. 1996. The theory of elec-troporation: a review. Bioelectrochem. Bioenerg. 41:135–160.
7. Lee, R. C., J. N. Aarsvold, W. Chen, R. D. Astumian, M. Capelli-Schellpfeffer, K. M. Kelley, and N. H. Pliskin. 1995. Biophysicalmechanisms of cell membrane damage in electrical shock. Semin.Neurol. 15:367–374.
8. Chen, W., and R. C. Lee. 1994. Altered ion channel conductance andionic selectivity induced by large imposed membrane potential pulse.Biophys. J. 67:603–612.
9. Bier, M., S. M. Hammer, D. J. Canaday, and R. C. Lee. 1999. Kineticsof sealing for transient electropores in isolated mammalian skeletalmuscle cells. Bioelectromagnetics. 20:194–201.
10. Gabriel, B., and J. Teissie. 1997. Direct observation in the millisec-ond time range of fluorescent molecule asymmetrical interaction with theelectropermeabilized cell membrane. Biophys. J. 73:2630–2637.
11. Gabriel, B., and J. Teissie. 1998. Mammalian cell electropermeabiliza-tion as revealed by millisecond imaging of fluorescence changes ofethidium bromide in interaction with the membrane. Bioelectrochem.Bioenerg. 47:113–118.
12. Gowrishankar, T. R., W. Chen, and R. C. Lee. 1998. Non-linear micro-scale alterations in membrane transport by electropermeabilization. Ann.N. Y. Acad. Sci. 858:205–216.
13. Johnsson, M., M. Silvander, G. Karlsson, and K. Edwards. 1999. Effectof PEO-PPO-PEO triblock copolymers on structure and stability ofphosphatidylcholine liposomes. Langmuir. 15:6314–6325.
14. Kostarelos, K., P. F. Luckham, and T. F. Tadros. 1995. Additionof block copolymers to liposomes prepared using soybean lecithin.Effects on formation, stability and the specific localization of the incor-porated surfactants investigated. J. Liposome Res. 5:117–130.
15. Kostarelos, K., M. Kipps, T. F. Tadros, and P. F. Luckham. 1998.
Molecular structure and conformation in phospholipid vesicles
sterically stabilized by (tri)-block copolymers investigated by multi-
nuclear magnetic resonance techniques. Colloids Surf. 136:1–9.
16. Kostarelos, K., P. F. Luckham, and T. F. Tadros. 1998. Steric
stabilization of phospholipid vesicles by block copolymers. Vesicle
flocculation and osmotic swelling caused by monovalent and divalent
cations. J. Chem. Soc. Faraday Trans. 94:2159–2168.
17. Kostarelos, K., T. F. Tadros, and P. F. Luckham. 1999. Physical con-
jugation of (tri-)block copolymers to liposomes toward the construction
of sterically stabilized vesicle systems. Langmuir. 15:369–376.
18. Woodle, M. C., M. S. Newman, and F. J. Martin. 1992. Liposome
leakage and blood circulation: comparison of adsorbed block copoly-
mers with covalent attachment of PEG. Int. J. Pharm. 88:327–334.
19. Padanilam, J. T., J. C. Bischof, R. C. Lee, E. G. Cravalho, R. G.
Tompkins, M. L. Yarmush, and M. Toner. 1994. Effectiveness of
poloxamer 188 in arresting calcein leakage from thermally damaged
isolated skeletal muscle cells. Ann. N. Y. Acad. Sci. 720:111–123.
20. Hannig, J., D. Zhang, D. J. Canaday, M. A. Beckett, R. D. Astumian,
R. Weichselbaum, and R. C. Lee. 2000. Surfactant sealing of mem-
branes permeabilized by ionizing radiation. Radiat. Res. 154:171–177.
21. Orringer, E. P., J. F. Casella, K. I. Ataga, M. Koshy, P. Adams-Graves, L.
Luchtman-Jones, T. Wun, M. Watanabe, F. Shafer, A. Kutlar, M. Abboud,
M. Steinberg, B. Adler, P. Swerdlow, C. Terregino, S. Saccente, B. Files,
S. Ballas, R. Brown, S. Wojtowicz-Praga, and J. M. Grindel. 2001.
Purified poloxamer 188 for treatment of acute vaso-occlusive crisis of
sickle cell disease: a randomized controlled trial. JAMA. 286:2099–2106.
22. Maskarinec, S. A., J. Hannig, R. C. Lee, and K. Y. C. Lee. 2002. Direct
observation of poloxamer 188 insertion into lipid monolayers. Biophys.J. 82:1453–1459.
23. Maskarinec, S. A., and K. Y. C. Lee. 2003. Comparative study of
poloxamer insertion into lipid monolayers. Langmuir. 19:1809–1815.
24. Shaikh, S. R., A. C. Dumaual, L. J. Jenski, and W. Stillwell. 2001.
Lipid phase separation in phospholipid bilayers and monolayers mod-
eling the plasma membrane. Biochim. Biophys. Acta. 1512:317–328.
25. Marsh, D. 1996. Lateral pressure in membranes. Biochim. Biophys.Acta. 1286:183–223.
26. Als-Nielsen, J., and K. Kjaer. 1989. X-ray reflectivity and diffraction
studies of liquid surfaces and surfactant monolayers. In The Proceedingsof the NATO Advanced Study Institute, Phase Transitions in Soft
Condensed Matter, Geilo, Norway, April 4–14. Plenum Publishing,
New York. 113–138.
27. Als-Nielsen, J., D. Jacquemain, K. Kjaer, F. Leveiller, M. Lahav, and
L. Leiserowitz. 1994. Principles and applications of grazing incidence
X-ray and neutron scattering from ordered molecular monolayers at the
air-water interface. Phys. Rep. 246:251–313.
28. Kaganer, V. M., H. Mohwald, and P. Dutta. 1999. Structure and phase
transitions in Langmuir monolayers. Rev. Mod. Phys. 71:779–819.
29. Jensen, T. R., and K. Kjaer. 2001. Structural properties and interactions
of thin films at the air-liquid interface explored by synchrotron x-ray
scattering. In Novel Methods to Study Interfacial Layers. R. Miller,
editor. Elsevier, Amsterdam. 205–254.
30. Wu, G., J. Majewski, C. Ege, K. Kjaer, M. J. Weygand, and K. Y. C.
Lee. 2004. Lipid corralling and poloxamer squeeze-out in membranes.
Phys. Rev. Lett. 93:028101–028104.
31. Gopal, A., and K. Y. C. Lee. 2001. Morphology and collapse tran-
sitions in binary phospholipid monolayers. J. Phys. Chem. B. 105:10348–10354.
32. Majewski, J., R. Popovitz-Biro, W. G. Bouwman, K. Kjaer, J. Als-
Nielsen, M. Lahav, and L. Leiserowitz. 1995. The structural properties
of uncompressed crystalline monolayers of alcohols CH2n11OH (n ¼13–31) on water and their role as ice nucleators. Chem. 1:304–312.
33. Weissbuch, I., R. Popovitz-Biro, M. Lahav, L. Leiserowitz, K. Kjaer,
and J. Als-Nielsen. 1997. Molecular self-assembly into crystals at air-
liquid interfaces. Adv. Chem. Phys. 102:39–102.
3172 Wu et al.
Biophysical Journal 89(5) 3159–3173
34. Lee, K. Y. C., J. Majewski, T. L. Kuhl, P. B. Howes, K. Kjaer, M. M.
Lipp, A. J. Waring, J. A. Zasadzinski, and G. S. Smith. 2001. Syn-
chrotron x-ray study of lung surfactant-specific protein SP-B in lipid
monolayers. Biophys. J. 81:572–585.
35. Kjaer, K. 1994. Some simple ideas on x-ray reflection and grazing-
incidence diffraction from thin surfactant films. Physica B (Amster-dam). 198:100–109.
36. Braslau, A., M. Deutsch, P. S. Pershan, A. H. Weiss, J. Als-Nielsen,
and J. Bohr. 1985. Surface roughness of water measured by x-ray reflec-
tivity. Phys. Rev. Lett. 54:114–117.
37. Pershan, P. S. 1990. Structure of surfaces and interfaces as studied
using synchrotron radiation. Faraday Discuss. Chem. Soc. 89:231–245,248–250,255.
38. Jensen, T. R., K. Balashev, T. Bjornholm, and K. Kjaer. 2001. Novel
methods for studying lipids and lipases and their mutual interaction at
interfaces. Part II. Surface sensitive synchrotron X-ray scattering.
Biochimie. 83:399–408.
39. Guinier, A. 1963. X-ray Diffraction: Freeman, San Francisco.
40. Hahn, T., editor. 1987. International Tables for Crystallography.
Reidel, Dordrecht, The Netherlands.
41. Brezesinski, G., A. Dietrich, B. Struth, C. Bohm, W. G. Bouwman,
K. Kjaer, and H. Mohwald. 1995. Influence of ether linkages on
the structure of double-chain phospholipid monolayers. Chem. Phys.Lipids. 76:145–157.
42. Lee, K. Y. C., A. Gopal, A. Von Nahmen, J. A. Zasadzinski,
J. Majewski, G. S. Smith, P. B. Howes, and K. Kjaer. 2002.
Influence of palmitic acid and hexadecanol on the phase transition
temperature and molecular packing of dipalmitoylphosphatidyl-
choline monolayers at the air-water interface. J. Chem. Phys. 116:774–783.
43. Schalke, M., P. Kruger, M. Weygand, and M. Losche. 2000. Sub-
molecular organization of DMPA in surface monolayers beyond the
two-layer model. Biochim. Biophys. Acta. 1446:113–126.
44. Armen, R. S., O. D. Uitto, and S. E. Feller. 1998. Phospholipidcomponent volumes: determination and application to bilayer structurecalculations. Biophys. J. 75:734–744.
45. Nagle, J. F., and M. C. Wiener. 1988. Structure of fully hydratedbilayer dispersions. Biochim. Biophys. Acta. 942:1–10.
46. Schalke, M. 2000. Konformation und Hydratation von Phospholipidenin Oberflachenmonoschichten: Rontgenreflexion und IR-SpektroskopiePh.D. thesis. Universitat Leipzig, Leipzig, Germany.
47. Vaknin, D., P. Kruger, and M. Losche. 2003. Anomalous X-rayreflectivity characterization of ion distribution at biomimetic mem-branes. Phys. Rev. Lett. 90:178102.
48. Brun, A., G. Brezesinski, H. Mohwald, M. Blanzat, E. Perez, and I.Rico-Lattes. 2003. Interaction between phospholipids and new Geminicatanionic surfactants having anti-HIV activity. Colloids Surf. A. 228:3–16.
49. Castile, J. D., K. M. G. Taylor, and G. Buckton. 2001. The influence ofincubation temperature and surfactant concentration on the interactionbetween dimyristoylphosphatidylcholine liposomes and poloxamersurfactants. Int. J. Pharm. 221:197–209.
50. Lee, R. C., A. Myerov, and C. P. Maloney. 1994. Promising therapy forcell membrane damage. Ann. N. Y. Acad. Sci. 720:239–245.
51. Jamshaid, M., S. J. Farr, P. Kearney, and I. W. Kellaway. 1988.Poloxamer sorption on liposomes: comparison with polystyrene latexand influence on solute efflux. Int. J. Pharm. 48:125–131.
52. Moghimi, S. M., C. J. H. Porter, L. Illum, and S. S. Davis. 1991. Theeffect of poloxamer-407 on liposome stability and targeting to bonemarrow: comparison with polystyrene microspheres. Int. J. Pharm. 68:121–126.
53. Silvestro, L., and P. H. Axelsen. 1998. Infrared spectroscopy ofsupported lipid monolayer, bilayer and multibilayer membranes. Chem.Phys. Lipids. 96:69–80.
54. Vineyard, G. H. 1982. Grazing-incidence diffraction and the distorted-wave approximation for the study of surfaces. Phys. Rev. B. 26:4146–4159.
Interaction Between Lipids and Poloxamer 3173
Biophysical Journal 89(5) 3159–3173
Copyright © 2022 FDOKUMEN


![[with H. Stilke] Spätmittelalterliche "Komforen" aus Emden und ihre niederländischen Parallelen. Nachrichten aus Niedersachsens Urgeschichte 61 (1992), 173-188.](https://static.fdokumen.com/doc/165x107/631baae73e8acd9977058960/with-h-stilke-spaetmittelalterliche-komforen-aus-emden-und-ihre-niederlaendischen.jpg)