UML; Students' Information Management System - Atlantis Press
International Journal of Scientific & Engineering Research, Volume 6, Issue 5, May-2015 203 ISSN 2229-5518
IJSER © 2015 http://www.ijser.org
Intelligent process optimization into Holonic Manufacturing Systems using TAGUCHI approach and UML Modeling Language
Mostapha EL JAI1,2, Iatimad AKHRIF3, Taoufik ABIDINE1, Nassouradine MOUSSA DJOUMA1, Brahim HERROU2, Hussain BENAZZA1, Mohammed EL HAMMOUMI2
1Ecole Nationale Supérieure d’Arts et Métiers de Meknès, Moulay Ismail University, Meknes, Maroc 2Industrial Techniques Laboratory, Sciences and Techniques Faculty, Sidi Mohamed Ben Abdellah University, Fez, Morocco
3Geoscience and Environment Laboratory, Sciences and Techniques Faculty, Sidi Mohamed Ben Abdellah University, Fez, Mo-rocco
Email: [email protected]
Abstract— In this paper we are interested to the quality control, as one of the operational parties in the global quality management, and to its relation with the process parameters optimization. The feature here is the integration of dynamism and autonomy, given by the holonic approach especially in HMS (Holonic manufacturing Systems), into the step of process parameters optimization, by exploiting the data coming from the quality control steps. An integrated model, described by UML diagrams, is presented, grouping the operational side of the quality control, the ‘dynamical’ design of experiments (using TAGUCHI approach) and the statistical analysis (ANOVA) which is necessary for a good decision making into industrial entities. Index Terms— Holonic Manufacturing Systems (HMS), Holonic Paradigm, quality control, Analysis Of Variance (ANOVA), TAGUCHI Approach, DOE (Design of Experiments), UML Diagrams.
—————————— ——————————
1 INTRODUCTION ost industrial researches working on holonic notion or paradigm, as the Holonic Manufacturing systems (HMS), focus especially on production and manufactur-
ing methods; and the holonic manufacturing paradigm was developed in the framework of the Intelligent Manufacturing Systems (IMS) program as results of this interest H. (Van Brussel et al. (1998), Pujo (2009)).
As it is known, several enterprise functions exist apart the production function, maintenance, quality management, stock management, etc (Javel (2003)). So, starting from this reality, and taking into account the important contribution of holonic paradigm in the new industrial thinking (independence, flexi-bility, autonomy, etc.), we try to integrate other functions of the enterprise in the holonic approach.
In a previous article (El jai et al. (2013)), we have proposed to integrate FMEA analysis in the holonic paradigm, by studying the generic aspect of this risk analysis method and modeling it using the Unified Modeling Language (UML) dedicated to object oriented modeling.
Thus, we have developed a new generic risk analysis ap-proach by combining the holonic philosophy to static risk analysis approaches; and it could be generalized for other methods (El jai et al. (2013)).
In this paper, we are interested by the quality control as a party of the general quality management function linked to the process optimization which exploits the experience data coming from the historic of the production.
The integration of automated method of process parameters optimization will be as easy as possible since the control quali-ty operations and optimization routines calculation will be
described, in an integrated model using holonic approach and UML modeling language.
The modeling concerns especially: • Quality control procedure: including the data saving,
the system architecture (physical and informatics), • Measurement of the performance process optimiza-
tion (the optimal choice of parameter values), • Optimization procedure using the TAGUCHI Design
Of Experiments (DOE). Since the model accomplished, the transformation of the
UML models to a comprehensive programming language will be easy, since the UML does not depend in any of the pro-gramming languages.
The proposed procedures could be integrated within intelli-gent machines, designated as Resource Holon in PROSA archi-tecture (H. Van Brussel et al. (1998)), or in very high level pro-cess optimization software.
2 PROBLEMATIC AND POSITIONNING REALTED TO HOLONIC MANUFACTURING SYSTEMS
The principal idea of this paper is to present the contribution of the introduction of dynamic entities, intelligent, autono-mous and collaborative. Known as holons, process optimiza-tion could be realized systematically or conditionally, depend-ing on the need of the installation or if a change of the behav-iour of the production system occurs; we mean here quality objectives and indicators as control chart tools.
These entities could be the machines its-selves or the in-formative agents which are corresponding to (El jai et al.
M IJSER

International Journal of Scientific & Engineering Research, Volume 6, Issue 5, May-2015 204 ISSN 2229-5518
IJSER © 2015 http://www.ijser.org
(2013)). The notion of the Holon was introduced for the first time by
Professor Koestler (1969), where he described the Holon as an identifiable part, of a system which, has a unique identity, but which can be composed by other subcomponents.
In this paper, we are not defining the HMS system as it has to be done, but just giving general information on it to not weigh more the article. For deeper details, the reader can refer to the references (H. Van Brussel et al. (1998), Pujo (2009) and Koestler (1969)).
Future manufacturing systems need to cope with frequent changes and disturbances. As such, their control requires con-stant adaptation and high flexibility. Holonic manufacturing is a highly distributed control paradigm that promises to handle these problems successfully. It is based on the concept of au-tonomous co-operating agents, called ‘holons’ (H. Van Brussel et al. (1998)).
Several architectures were proposed to formalize the holonic paradigm into production context. Pujo presents a large over-view on so related architectures and their utilization in differ-ent intelligent systems (Pujo (2009)).
H. Van Brussel et al. (1998) presents the essential of the PROSA (Product, Resource, Order, Staff Architecture) archi-tecture where there is three principal holons that can describe and act into a HMS system, Product holon, resource holon and order holon. It is possible that a support (Staff) holon could be introduced to help in some tasks defined in advance.
The feature in this study is the use of the holonic paradigm to create a kind of infinite optimization loop into the quality and process optimization methods.
As we note in several studies we guide in different type of industries, due to the time insufficiency and lot of manage-ment and technical tasks, the engineers tend to search to modi-fy or optimize the process parameters where there is a notable deviation from the production characteristics deviation; but in several cases where a great percentage of products is defec-tive, generating big quality costs.
So we denote from here that the industry is in the need of a kind of dynamic and autonomous aspect in this party of the quality management.
In general, the autonomy, intelligence and flexibility are giv-en only for the production systems. Maintenance, risk analysis (El jai et al. (2013)) and quality management are not, at least until now, integrated into the new intelligent managing sys-tems as the HMS or the Multi-agents systems.
In another hand, some interesting optimization method, like the Design Of Experiment, especially by the TAGUCHI ap-proach, could be included in a simple manner in the calcula-tion modules and informative party IResource of a holon. The reader can refer to our previous work (El jai et al. (2013)), where we propose by UML models the internal architecture of the resource holons (the intelligent machines) composed by material party MResource and informative one IResource and their interactions whit other internal and external components.
In this perspective, the objective of this article is to give more dynamics especially in the process optimization steps exploit-ing the experience return coming from the quality control.
3 QUALITY CONTROL PROCEDURE AND THE DESIGN OF EXPERIMENTS (DOE)
Quality control measurement is considered as operative ac-tions of quality management that permits the return of the production data to the optimization and management higher levels.
The resulting process and production policies will be chosen depending on the quality data furnished by this experiences return.
In this paper, we propose to integrate the design of experi-ments into quality control procedures, while the human and computer resources will be used as well; and we will enforced the production to proceed with a preliminary fixed parameters which are proposed by our optimization model.
Since the statistical analysis of the outputs gives good indica-tors values, the inputs values will be adopted until another activating action (bad outputs values, process service orders, etc).
Figure 1 shows, by a simplified algorithm, the approach de-scribed above.
Each step in the figure has to be developed apart with its own method and tools.
3.1 Control chart After collecting the production data, the control charts per-
mit to evaluate the eventual variations due to the extraordi-nary causes like exceeds of degradations or bad input values.
If no exception has been denoted, the production continues with the previous values of the input parameters; and if an extraordinary variation or values of the output process pa-rameters are clearly calculated or plotted in the control chart, the experiments plan and input modification procedures are launched.
IJSER

International Journal of Scientific & Engineering Research, Volume 6, Issue 5, May-2015 205 ISSN 2229-5518
IJSER © 2015 http://www.ijser.org
Fig. 1. Simplified process optimization control 3.2 Ishikawa Diagram
The Ishikawa diagram permits to determine the possible fac-tors that could be affect the response of a system (output val-ues).
Thus, if necessary, this analysis is highly approved in the earlier steps of parameters study.
But also if a greater deviation is marked in the response of the system (outputs), is will be beneficial to return to the re-sults of the previous Ishikawa diagrams to evaluate other pa-rameters neglected in some steps of statistical/ANOVA analy-sis.
3.3 Experiments plan and the DOE Design of Experiments (DOE) is a structured, organized
method that is used to determine the relationship between the different factors affecting a process and the output of that pro-cess. In short, it is a technique to discover the cause and effect relationship (F. Ming (2009)).
The application of the DOE is used in the context of systemic approach, considering the system as a black box as shown as the figure 2.
The choice of the number and levels (permitted values) of the inputs in an experience is the fundamental problem in the design of the experiments (DOE). We try to realize a minimum of experiences and, in the same time, reduce the influence of the experimental error on the mathematical model which will serves for decision making.
The aim is reached by considering the mathematical and statistical properties linking the response (output) to the fac-tors (input).
Fig. 2. General model of a process or a system reported by
Montgomery (2001)
Where there are no constraints on the domain definition of the subject (input and output domains), some classical plans exist which have excellent statistical qualities and permit to model the responses in the best conditions.
Where some constraints exist, it is a must to build typical plans by searching the best experimental points (input values) giving good statistical qualities and robust response models (Goupy (2006)).
Two methods are generally applied to adopt the experiments plan to follow (F. Ming (2009)):
• Full factorial design – In this case the experimental plan is designed in order to account for the effects in-
duced by each single variable and all the possible in-teractions between them;
• Fractional factorial design – The full factorial plan can be reduced when the effect of single variable and/or higher order interactions can be neglected. The large advantage of fractional factorial design is the reduc-tion of the number of experiments needed for the op-timization. Nevertheless, in order to be able to neglect some of the parameters/interactions, the order of magnitude of their effects on the system must be known in advance.
3.3.1 Fractional Orthogonal plans (TAGUCHI stand-ard tables)
The fractional orthogonal plan is a part of the full factorial plan chosen, with relevance, in order to test a greater number of factors. This kind of plans is elaborated for a minimum of experiences and permits to deduce the average of the effect of each factor with reasonable precision (Karam (2004)).
TAGUCHI proposed orthogonal tables where each column represents the effects levels (values) which we desire to ana-lyse (Constant (1989)).
The most utilized tables are (see the references Constant (1989) and Pillet (1997) for more details):
L8(27), L16(215), L32(231), L12(211) for the factors having two levels,
L9(34), L27(313) for three levels, L18(21x37), L36(211x312) for different levels. Among the contributions of Dr. TAGUCHI was the introduc-
tion of the hardness or the possibility of the modification of the parameters, which is modelled by three types of points or circles (factors or parameters); a black one, a wight one and another wight circle with a black point in its centre.
The affectation of the columns to the factors and interaction is made according to this logic.
Figure 3 shows an example of TAGUCHI graphs, related to TAGUCHI tables, where the columns (presented by numbers) are affected to both the factors (points or circle) and interac-tions (lines).
We have changed a little the figure 3 from its original form by varying the type of points. In Constant (1989), only the black points/circles are reported, we have changed it for fac-tor A and D for more explanation.
Fig. 3. A graph of TAGUCHI of 4 factors and 3 interactions
(Constant (1989)) 3.3.2 Exrnal factors and robustness
IJSER

International Journal of Scientific & Engineering Research, Volume 6, Issue 5, May-2015 206 ISSN 2229-5518
IJSER © 2015 http://www.ijser.org
In our opinion, the most fascinating feature in the approach of Dr. TAGUCHI is that his approach essays to optimize or research the optimal parameters values whatever are the un-controllable parameters (see section 2.4.b)).
Thus, these uncontrollable parameters, in a practice point of view, are the parameters that are very difficult to modify or that the management would not want to modify for technical or financial considerations; some noises are included in this category.
Constant (1989) report that the originality of the TAGUCHI approach recommend to not proceed to the experiments repe-tition randomly, but to plan these repetitions according to some parameters taken part of the in the product processing or in during its utilization. This plan has to be ingenious ac-cording to two points (Constant (1989)):
• It will permit to test also the influence of the external factors and their interaction with the pro-cess/system and its parameters. • It will permit to test the process parameters
in a larger scale of products use, expressed by the lev-els (values) of external factors (noise), so the customer satisfaction will be ensure as well.
Hence, to design this kind of experiments plan, it is suffi-cient, starting from the orthogonal input plan, to cross be-tween it and another orthogonal plan corresponding to the external factors (uncontrollable factors, noises, etc.) (Constant (1989), Pillet (1997)).
Figure 4 presents an example of crossed plan presenting the principal plan (L8(27)) and the external factors plan (L4(23)).
Fig. 4. Example of a crossed plan (L8(27)x L4(23)) (Constant
(1989))
The Analysis of variance comes after to analysis the experi-ments data and gives the necessary indicators to control the process.
3.4 Analysis of Variance and TAGUCHI optimization approach 3.4.1 Effect of the factors
The ANOVA permits to measure the effect of each input pa-rameter on the outputs and also the interdependencies of the inputs related to the system output evolution.
The most interesting in this analysis is that these evaluations are made at each level of the factors, and permits to see really the deviation of the response (output) according to these lev-els.
The levels correspond to the premising values designed by the experiments plan.
In this step, ANOVA diagrams (factors effect and interac-tions, error dispersion, etc.) and indicators (R-square, Fisher test, etc.) are used for this purpose.
As it is shown in figure 1, the results of ANOVA are used for the both steps:
• experiments plan elaboration: where it allows to pre-estimate the probably factors (input parameters) able to have important effect on the outputs.
• optimization process: where the different diagrams and the Signal/Noise (S/N) ratio.
• TAGUCHI approach: using Signal Noise (S/N) ratio and the corresponding plots for an efficient decision making.
3.4.2 TAGUCHI approach and the Signal Noise ra-tio (Constant (1989))
The S/N ratio is used in order to maximize the robustness of the system (response) face to noise.
TAGUCHI identifies the noise by the residual deviation of a variable (Y) for every kind of nature (shown on figure 5), and names the S/N ratio as the following transforms:
• If we are searching a target value
Where s² is the estimation of the residual deviation for each essay
• If we are looking for a minimum (y → 0) (ideal target)
• If we are looking for a maximum (1/y → 0) (ideal tar-
get)
Where n is the number of repetitions In all cases, the ration has to be maximized.
Fig. 5. Different natures considered of the variables grouped
by Wahdame (2006)
IJSER

International Journal of Scientific & Engineering Research, Volume 6, Issue 5, May-2015 207 ISSN 2229-5518
IJSER © 2015 http://www.ijser.org
To summarize this section, we say that in the past, the exper-imentation was analytical (we tried to see if a factor A influ-ences the response Y). But now, it becomes synthetic; we can-not see the effects, it is the calculation or the graphs which permit to see generally if there is an effect or not.
Determining the significant parameters is the only way to control the complexity of the phenomens, to make it more in-telligible and “win” on the hazardous aspect; the essential is to reduce the deviation around the target.
4 UML MODELING By its 9 diagrams, the Unified Modeling Language (UML)
permits to model the most aspects of a system; but the using of diagrams depends on the level of analysis of a system. For example, in this study, we are not interesting by the descrip-tion of the system objects state (state diagram).
The main objective is to present the architecture (given by class diagram) to implement into process optimization soft-ware or within intelligent machines (Resource Holons), the mechanism of analysis, the interactions and dynamics be-tween the entities (given by the sequence diagram).
In a previous article (El jai et al. (2013)), we have used this language to propose an original integrated model of risk anal-ysis method into the holonic paradigm, where we adopted the PROSA architecture (H. Van Brussel et al. (1998), Pujo (2009)) as the framework/philosophy to create the dynamic, intelli-gent and autonomous agents or objects of our system.
We adopt so the PROSA architecture in order to organize the proposed UML models to standardize our reflections on the subject.
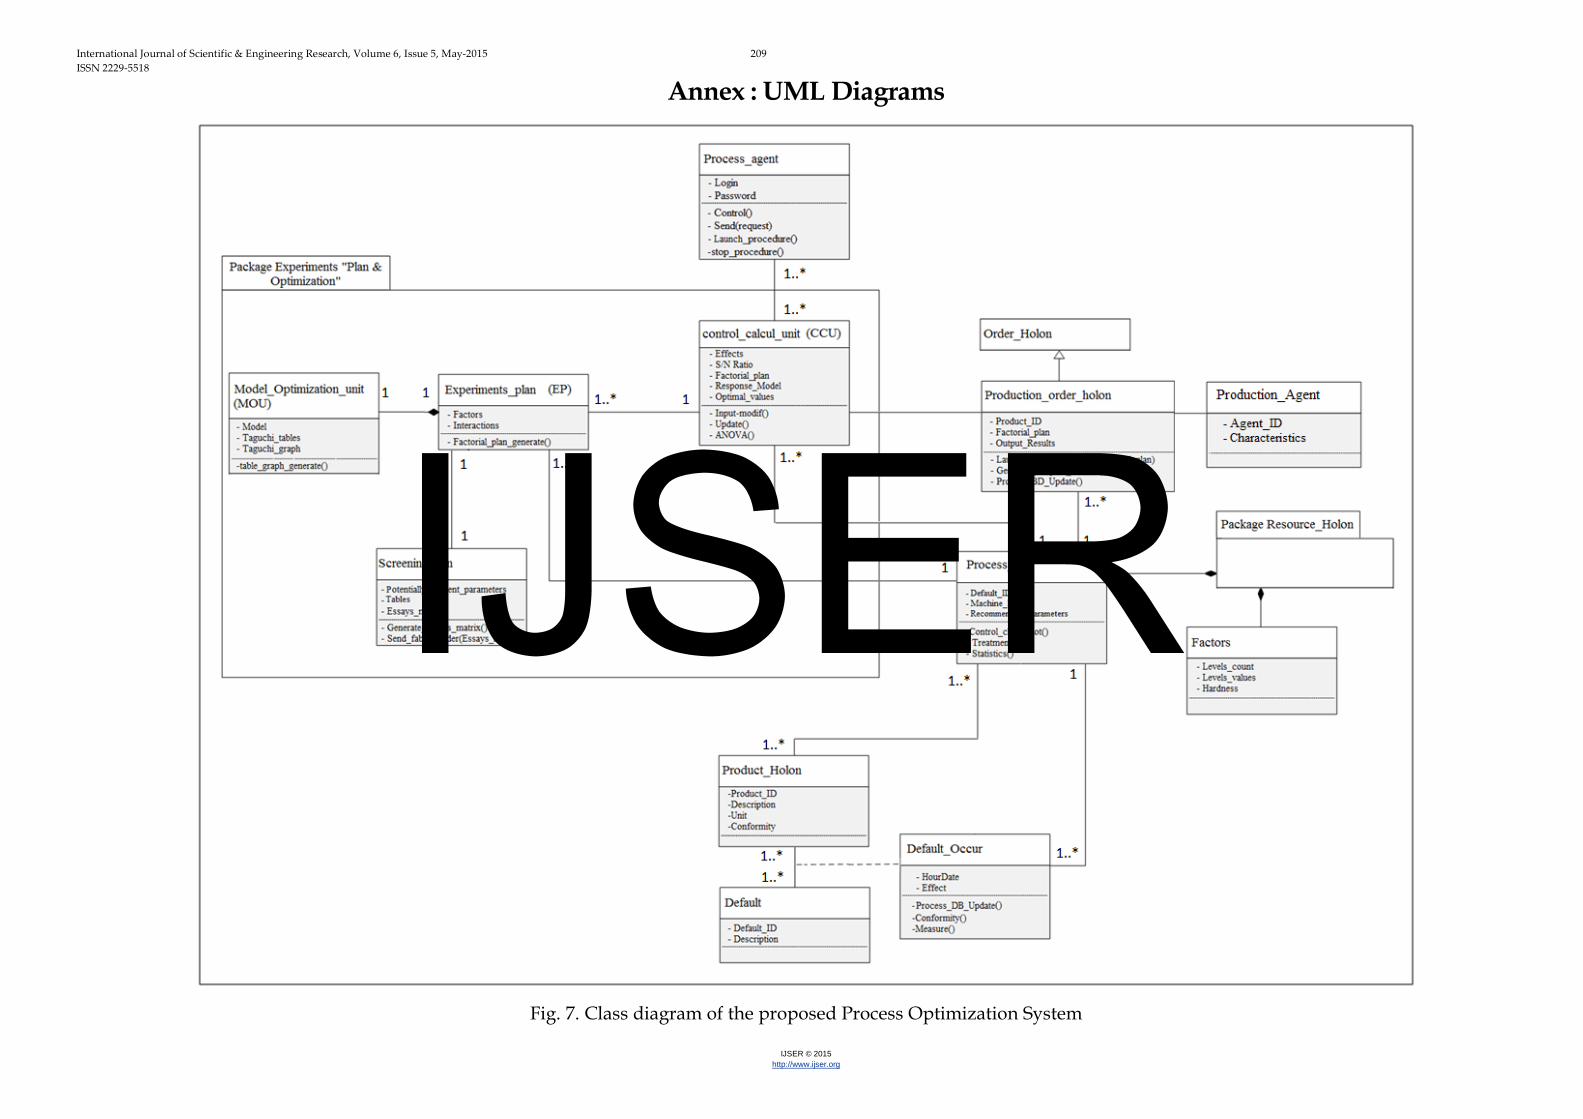
Only for the organization of the paper, we decided to put the figures 7, 8 and 9 in the annex “UML Diagrams”, which could be printed on A3 format for a best reading. We have choosen this format (A3) to visualize the designation of our objects, methods, etc.
4.1 Static view (system architecture) The static view corresponds to the class diagrams by which
we present the architecture of the proposed method (intelli-gent process optimization by TAGUCHI approach).
Figure 7 shows the proposed model integrating the basis of the PROSA architecture, composed by the Product Holon (all information related to the products), Resource Holon (ma-chines), Order Holon (production, maintenance orders) and Staff (support) Holons.
• Optimization package (entity) The optimization package, shown in the figure 7, could exist
into the Staff Holon or could be included into the ACE module of the Holon Resource (see figure 7).
ACE means Ambient Control Entity, which stocks all meth-ods that are responsible of the calculation, optimization and interactions with other holons or exterior milieu.
In the previous article El jai et al. (2013), the dynamic FMEA (Failure Mode Effect and Analysis) was a part of the ACE enti-ty. We have clearly indicated this relation for the relevance of the subject, where it was original to proceed to this kind of analysis (dynamic risk analysis) using the holonic paradigm.
• Resource Holon {MResource and IResource}
Figure 8 reports the architecture proposed previously in the article (El jai et al. (2013)), showing, for more details, the con-stitution of the Resource holon composed especially by the material part (MResource) and the Informative one (IRe-source).
The right party of the figure corresponds to the description of Resource Holon (or to its UML package description). This architecture was developed especially for the dynamic FMAE analysis. So some modifications have to be introduced in to link with the subject of this current study.
• Process Database The process database (process_DB), of figure 7, which stores
quality control data, is a part of the performance database (DBPerf) of figure 7 symbolized with the composition link.
We have not mentioned the multiplicities around the “Re-source Holon” package because it has to be mentioned when linking between classes and not between a class and a pack-age.
For example the process database (Process_DB of figure 7) will be linked to Performance database (DBPerf) of the ma-chine (Resource Holon) and factors.
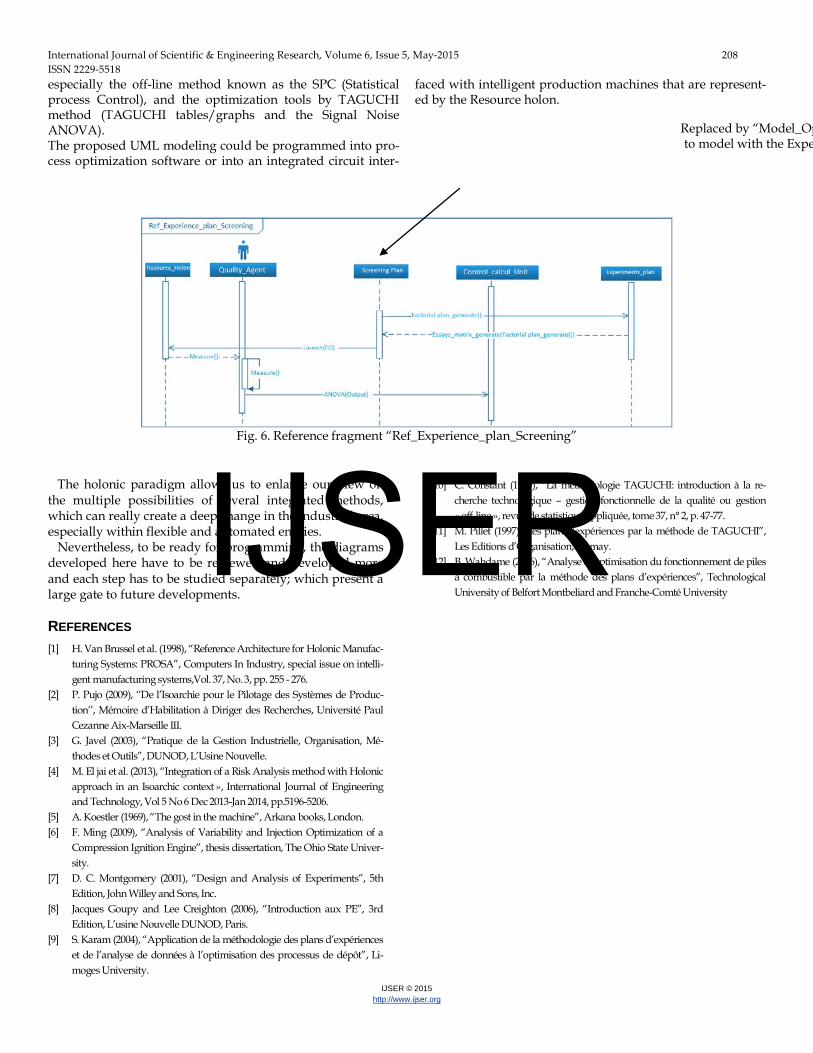
4.2 Dynamic view (Interaction The sequence diagram allows the expressing of the interac-tions between the entities, external or internal. Thus, we will describe so the dynamics related to solicitations of the different objects of the system. The diagram constitutes a preliminary one used to show in a global view what happens according to the algorithm of figure 1. Some routines are repeated in the sequence diagrams, espe-cially in the steps of screening and experiments plan. So, this repetition is expressed by the “Ref_Experience_plan” refer-ence fragments. Due to the little difference between the two steps, one uses the object (class) “screening_plan” and the other fragment uses the object (class) “Model_Optimization_Unit”, the same frag-ment has to be included according to this description. Thus, two reference fragments are adopted; “Ref_Experience_plan_Screening” (figure 6) and “Ref_Experience_plan_Modelization” used the model of fig-ure 9. Theses fragments, presented in figure 6, corresponds to the following actions:
• the research of the experiments tables of TAGUCHI according to the factors and the corresponding levels,
• the launching of the “Fabrication Order (FO)” related to the experiments,
• Measurement by the quality control operators, • And ANOVA analysis to determine the most signifi-
cant parameters according to screening step. The figure 9 presents the preliminary sequence diagram pro-posed as dynamic process optimization. Each reference fragment, procedures and routines proposed are presented in simplified forms in order to be as near as pos-sible to the algorithms of figure 1.
5 CONCLUSION The feature of this study is the proposition of a dynamic and integrated method, which links between the quality control,
IJSER
International Journal of Scientific & Engineering Research, Volume 6, Issue 5, May-2015 208 ISSN 2229-5518
IJSER © 2015 http://www.ijser.org
especially the off-line method known as the SPC (Statistical process Control), and the optimization tools by TAGUCHI method (TAGUCHI tables/graphs and the Signal Noise ANOVA). The proposed UML modeling could be programmed into pro-cess optimization software or into an integrated circuit inter-
faced with intelligent production machines that are represent-ed by the Resource holon.
Fig. 6. Reference fragment “Ref_Experience_plan_Screening” The holonic paradigm allows us to enlarge our view on
the multiple possibilities of several integrated methods, which can really create a deep change in the industrial area, especially within flexible and automated entities.
Nevertheless, to be ready for programming, the diagrams developed here have to be reviewed and developed more and each step has to be studied separately; which present a large gate to future developments.
REFERENCES [1] H. Van Brussel et al. (1998), “Reference Architecture for Holonic Manufac-
turing Systems: PROSA”, Computers In Industry, special issue on intelli-gent manufacturing systems,Vol. 37, No. 3, pp. 255 - 276.
[2] P. Pujo (2009), ‘‘De l’Isoarchie pour le Pilotage des Systèmes de Produc-tion’’, Mémoire d’Habilitation à Diriger des Recherches, Université Paul Cezanne Aix-Marseille III.
[3] G. Javel (2003), “Pratique de la Gestion Industrielle, Organisation, Mé-thodes et Outils”, DUNOD, L’Usine Nouvelle.
[4] M. El jai et al. (2013), “Integration of a Risk Analysis method with Holonic approach in an Isoarchic context », International Journal of Engineering and Technology, Vol 5 No 6 Dec 2013-Jan 2014, pp.5196-5206.
[5] A. Koestler (1969), “The gost in the machine”, Arkana books, London. [6] F. Ming (2009), “Analysis of Variability and Injection Optimization of a
Compression Ignition Engine”, thesis dissertation, The Ohio State Univer-sity.
[7] D. C. Montgomery (2001), “Design and Analysis of Experiments”, 5th Edition, John Willey and Sons, Inc.
[8] Jacques Goupy and Lee Creighton (2006), “Introduction aux PE”, 3rd Edition, L’usine Nouvelle DUNOD, Paris.
[9] S. Karam (2004), “Application de la méthodologie des plans d’expériences et de l’analyse de données à l’optimisation des processus de dépôt”, Li-moges University.
[10] C. Constant (1989), “La méthodologie TAGUCHI: introduction à la re-cherche technologique – gestion fonctionnelle de la qualité ou gestion « off-line », revue de statistique appliquée, tome 37, n° 2, p. 47-77.
[11] M. Pillet (1997), “les plan d’expériences par la méthode de TAGUCHI”, Les Editions d’Organisation, 1st may.
[12] B. Wahdame (2006), “Analyse et optimisation du fonctionnement de piles à combustible par la méthode des plans d’expériences”, Technological University of Belfort Montbeliard and Franche-Comté University
Replaced by “Model_Op to model with the Expe
IJSER
International Journal of Scientific & Engineering Research, Volume 6, Issue 5, May-2015 209 ISSN 2229-5518
IJSER © 2015 http://www.ijser.org
Annex : UML Diagrams
Fig. 7. Class diagram of the proposed Process Optimization System
IJSER

International Journal of Scientific & Engineering Research, Volume 6, Issue 5, May-2015 210 ISSN 2229-5518
IJSER © 2015 http://www.ijser.org
Fig. 8. Preliminary Class Diagram for Risk analysis (El jai et al. (2013))
IJSER

International Journal of Scientific & Engineering Research, Volume 6, Issue 5, May-2015 211 ISSN 2229-5518
IJSER © 2015 http://www.ijser.org
Fig.9. Preilminary sequence diagram of the dynamic process optimization
IJSER
Copyright © 2022 FDOKUMEN