Integration of Molecular Profiling and Chemical Imaging to Elucidate Fibroblast-Microenvironment...
13
Integration of Molecular Profiling and Chemical Imaging to Elucidate Fibroblast-Microenvironment Impact on Cancer Cell Phenotype and Endocrine Resistance in Breast Cancer Sarah E. Holton 1,2. , Anna Bergamaschi 3. , Benita S. Katzenellenbogen 3,4 , Rohit Bhargava 1,2,4,5 * 1 Department of Bioengineering, University of Illinois at Urbana-Champaign, Urbana, Illinois, United States of America, 2 Beckman Institute for Advanced Science and Technology, University of Illinois at Urbana-Champaign, Urbana, Illinois, United States of America, 3 Departments of Molecular and Integrative Physiology, Cell and Developmental Biology, University of Illinois at Urbana-Champaign, Urbana, Illinois, United States of America, 4 University of Illinois Cancer Center, University of Illinois at Urbana-Champaign, Urbana, Illinois, United States of America, 5 Departments of Mechanical Science and Engineering, Electrical and Computer Engineering, and Chemical and Biomolecular Engineering, University of Illinois at Urbana-Champaign, Urbana, Illinois, United States of America Abstract The tumor microenvironment is known to play a key role in altering the properties and behavior of nearby cancer cells. Its influence on resistance to endocrine therapy and cancer relapse, however, is poorly understood. Here we investigate the interaction of mammary fibroblasts and estrogen receptor-positive breast cancer cells in three-dimensional culture models in order to characterize gene expression, cellular changes, and the secreted protein factors involved in the cellular cross-talk. We show that fibroblasts, which are the predominant cell type found in the stroma adjacent to the cancer cells in a tumor, induce an epithelial-to-mesenchymal transition in the cancer cells, leading to hormone-independent growth, a more invasive phenotype, and resistance to endocrine therapy. Here, we applied a label-free chemical imaging modality, Fourier transform infrared (FT-IR) spectroscopic imaging, to identify cells that had transitioned to hormone-independent growth. Both the molecular and chemical profiles identified here were translated from cell culture to patient samples: a secreted protein signature was used to stratify patient populations based on gene expression and FT-IR was used to characterize breast tumor patient biopsies. Our findings underscore the role of mammary fibroblasts in promoting aggressiveness and endocrine therapy resistance in ER-positive breast cancers and highlight the utility of FT-IR for the further characterization of breast cancer samples. Citation: Holton SE, Bergamaschi A, Katzenellenbogen BS, Bhargava R (2014) Integration of Molecular Profiling and Chemical Imaging to Elucidate Fibroblast- Microenvironment Impact on Cancer Cell Phenotype and Endocrine Resistance in Breast Cancer. PLoS ONE 9(5): e96878. doi:10.1371/journal.pone.0096878 Editor: Abdelilah Aboussekhra, King Faisal Specialist Hospital & Research center, Saudi Arabia Received February 13, 2014; Accepted April 12, 2014; Published May 9, 2014 Copyright: ß 2014 Holton et al. This is an open-access article distributed under the terms of the Creative Commons Attribution License, which permits unrestricted use, distribution, and reproduction in any medium, provided the original author and source are credited. Funding: This study was funded by the National Institutes of Health via grant numbers R01CA138882 and R01EB009745. The funders had no role in study design, data collection and analysis, decision to publish, or preparation of the manuscript. Competing Interests: The authors have declared that no competing interests exist. * E-mail: [email protected] . These authors contributed equally to this work. Introduction More than 70% of breast cancers diagnosed in the US are estrogen receptor positive (ER + ) [1,2]. ER + tumors generally have more favorable prognoses compared to other subtypes and can be treated with targeted endocrine therapies such as tamoxifen [3]. Though many ER + patients initially respond favorably to targeted therapy, up to 30% of treated cancers recur [3,4]. For patients with recurrent disease, the five-year survival rate drops to 20%, with a median survival of 12–24 months [5]. Therefore, it would be advantageous to identify at the time of initial diagnosis the patients who will not respond to endocrine therapy in the long- term so that their care can be managed differently. The factors underlying recurrence arising from endocrine resistance are not fully understood, but it is increasingly appreciated that the microenvironment of the tumor cells can play a critical role in impacting the behavior of the cancer cells [6,7]. To understand the molecular factors driving endocrine resis- tance and tumor recurrence, we utilized three-dimensional cell co- culture models and studied them using molecular profiling and chemical imaging. We hypothesized that normal fibroblasts serve at the frontline of heterotypic interactions experienced by cancer cells because they are the first cell type encountered by dysplastic epithelium. Further, fibroblasts are encountered in the microen- vironment during every stage of disease progression. The microenvironment is emerging as a new target for cancer therapies [8]. It is now clear that three-dimensional (3D) cultures represent a more realistic model for tumors [9,10], and excellent 3D tumor models have been proposed [11,12]. However, 3D co-cultures to study heterotypic interactions are less widely used [13,14]. Hence, we developed and employed a series of 3D co-culture systems to investigate the impact of fibroblasts on tumor cell phenotype and response to endocrine therapy. Fibroblasts are the most abundant cell type in the breast stroma and while they play a role in the endocrine regulation of normal breast differentiation, it is not well PLOS ONE | www.plosone.org 1 May 2014 | Volume 9 | Issue 5 | e96878
Transcript of Integration of Molecular Profiling and Chemical Imaging to Elucidate Fibroblast-Microenvironment...
Integration of Molecular Profiling and Chemical Imagingto Elucidate Fibroblast-Microenvironment Impact onCancer Cell Phenotype and Endocrine Resistance inBreast CancerSarah E. Holton1,2., Anna Bergamaschi3., Benita S. Katzenellenbogen3,4, Rohit Bhargava1,2,4,5*
1 Department of Bioengineering, University of Illinois at Urbana-Champaign, Urbana, Illinois, United States of America, 2 Beckman Institute for Advanced Science and
Technology, University of Illinois at Urbana-Champaign, Urbana, Illinois, United States of America, 3 Departments of Molecular and Integrative Physiology, Cell and
Developmental Biology, University of Illinois at Urbana-Champaign, Urbana, Illinois, United States of America, 4 University of Illinois Cancer Center, University of Illinois at
Urbana-Champaign, Urbana, Illinois, United States of America, 5 Departments of Mechanical Science and Engineering, Electrical and Computer Engineering, and Chemical
and Biomolecular Engineering, University of Illinois at Urbana-Champaign, Urbana, Illinois, United States of America
Abstract
The tumor microenvironment is known to play a key role in altering the properties and behavior of nearby cancer cells. Itsinfluence on resistance to endocrine therapy and cancer relapse, however, is poorly understood. Here we investigate theinteraction of mammary fibroblasts and estrogen receptor-positive breast cancer cells in three-dimensional culture modelsin order to characterize gene expression, cellular changes, and the secreted protein factors involved in the cellular cross-talk.We show that fibroblasts, which are the predominant cell type found in the stroma adjacent to the cancer cells in a tumor,induce an epithelial-to-mesenchymal transition in the cancer cells, leading to hormone-independent growth, a moreinvasive phenotype, and resistance to endocrine therapy. Here, we applied a label-free chemical imaging modality, Fouriertransform infrared (FT-IR) spectroscopic imaging, to identify cells that had transitioned to hormone-independent growth.Both the molecular and chemical profiles identified here were translated from cell culture to patient samples: a secretedprotein signature was used to stratify patient populations based on gene expression and FT-IR was used to characterizebreast tumor patient biopsies. Our findings underscore the role of mammary fibroblasts in promoting aggressiveness andendocrine therapy resistance in ER-positive breast cancers and highlight the utility of FT-IR for the further characterization ofbreast cancer samples.
Citation: Holton SE, Bergamaschi A, Katzenellenbogen BS, Bhargava R (2014) Integration of Molecular Profiling and Chemical Imaging to Elucidate Fibroblast-Microenvironment Impact on Cancer Cell Phenotype and Endocrine Resistance in Breast Cancer. PLoS ONE 9(5): e96878. doi:10.1371/journal.pone.0096878
Editor: Abdelilah Aboussekhra, King Faisal Specialist Hospital & Research center, Saudi Arabia
Received February 13, 2014; Accepted April 12, 2014; Published May 9, 2014
Copyright: � 2014 Holton et al. This is an open-access article distributed under the terms of the Creative Commons Attribution License, which permitsunrestricted use, distribution, and reproduction in any medium, provided the original author and source are credited.
Funding: This study was funded by the National Institutes of Health via grant numbers R01CA138882 and R01EB009745. The funders had no role in study design,data collection and analysis, decision to publish, or preparation of the manuscript.
Competing Interests: The authors have declared that no competing interests exist.
* E-mail: [email protected]
. These authors contributed equally to this work.
Introduction
More than 70% of breast cancers diagnosed in the US are
estrogen receptor positive (ER+) [1,2]. ER+ tumors generally have
more favorable prognoses compared to other subtypes and can be
treated with targeted endocrine therapies such as tamoxifen [3].
Though many ER+ patients initially respond favorably to targeted
therapy, up to 30% of treated cancers recur [3,4]. For patients
with recurrent disease, the five-year survival rate drops to 20%,
with a median survival of 12–24 months [5]. Therefore, it would
be advantageous to identify at the time of initial diagnosis the
patients who will not respond to endocrine therapy in the long-
term so that their care can be managed differently. The factors
underlying recurrence arising from endocrine resistance are not
fully understood, but it is increasingly appreciated that the
microenvironment of the tumor cells can play a critical role in
impacting the behavior of the cancer cells [6,7].
To understand the molecular factors driving endocrine resis-
tance and tumor recurrence, we utilized three-dimensional cell co-
culture models and studied them using molecular profiling and
chemical imaging. We hypothesized that normal fibroblasts serve
at the frontline of heterotypic interactions experienced by cancer
cells because they are the first cell type encountered by dysplastic
epithelium. Further, fibroblasts are encountered in the microen-
vironment during every stage of disease progression. The
microenvironment is emerging as a new target for cancer therapies
[8]. It is now clear that three-dimensional (3D) cultures represent a
more realistic model for tumors [9,10], and excellent 3D tumor
models have been proposed [11,12]. However, 3D co-cultures to
study heterotypic interactions are less widely used [13,14]. Hence,
we developed and employed a series of 3D co-culture systems to
investigate the impact of fibroblasts on tumor cell phenotype and
response to endocrine therapy. Fibroblasts are the most abundant
cell type in the breast stroma and while they play a role in the
endocrine regulation of normal breast differentiation, it is not well
PLOS ONE | www.plosone.org 1 May 2014 | Volume 9 | Issue 5 | e96878
understood how they affect the response of breast cancer cells to
targeted endocrine therapy. In order to characterize the influences
of cancer cell-stromal interactions on therapeutic response, we
profiled the conditioned medium of the co-culture and defined a
molecular interaction signature (iSig). The iSig provides mecha-
nistic insight into tumor progression and the dynamics of cancer
cell behavior by identifying specific secreted proteins involved in
cancer cell-stromal cross-talk. When we separated breast cancer
patient microarray data based on iSig expression levels, we were
able to predict patient outcome that was comparable to available
gene expression profiling methods.
Although uncovering genomic and proteomic dynamics of
tumor behavior are crucial for understanding the pathophysiology
of cancer, imaging techniques remain a gold standard of
determining diagnosis and prognosis in many solid tumors,
including breast cancer. Here, we used Fourier Transform
infrared (FT-IR) spectroscopic imaging [15] for rapid and label-
free profiling of co-culture samples, integrating molecular infor-
mation about cellular phenotypes with microscopy. As opposed to
antibody-based imaging approaches such as immunohistochemis-
try (IHC) or immunofluorescence, emerging chemical imaging
technologies use spectroscopy to provide functional and molecular
information within cells and tissues without staining or the
requirement for a priori knowledge of molecular transformations.
By visualizing the chemistry inherent within a sample, cell activity
changes and disease states in vitro [16,17] and cell types within
complex tissues [18–20] can be monitored. Although a number of
studies have reported the development of high performance
imaging, rapid data processing and classification algorithms, as
well as applications to histologic analyses of tissues [21–24], few
studies have related spectral data to underlying molecular
transformations.
In this study, we have monitored changes in gene expression
and cell phenotype associated with cancer cell-fibroblast interac-
tions and identified chemical changes with FT-IR spectroscopy in
a ‘‘bottom up’’ approach to identify specific cellular contributions
of the microenvironment on cancer cell behavior and response to
endocrine therapy. The first part of this study reports the step-
wise, validated development of a 3D co-culture model that put
molecular conclusions in a spatial context. Next, we focus on
molecular transformations and describe a secreted protein
interaction signature that effectively predicts clinical outcomes in
patient tumor samples. Finally, we develop the chemical imaging
signature of the underlying genomic states in endocrine-responsive
breast cancer. Together, these highlight a pivotal role for
mammary fibroblasts located in the tumor cell microenvironment
in determining the phenotypic properties of ER+ breast cancer
cells and their sensitivity or resistance to endocrine therapy.
Further, we show how chemical imaging may be used to rapidly
identify these cellular phenotypes in heterogeneous samples.
Results
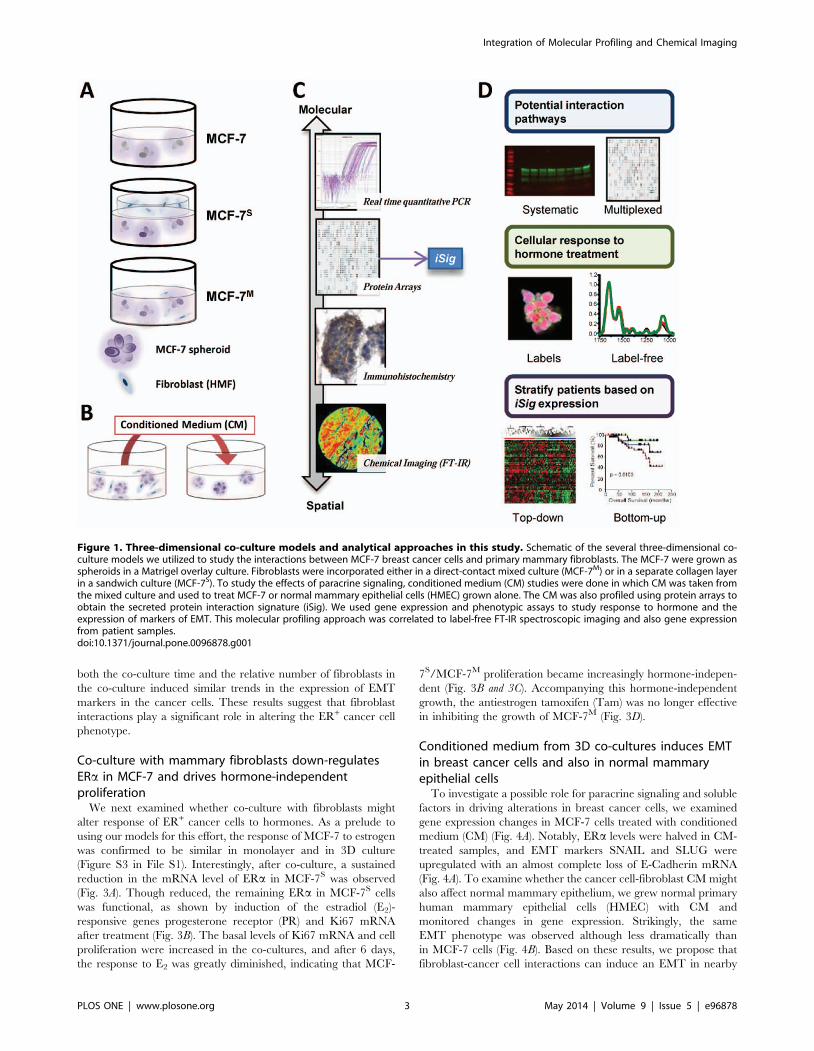
3D culture systems were engineered to examine cancercell-mammary fibroblast interactions
In order to study the interactions between ER+ breast cancer
cells and mammary fibroblasts, we utilized four 3D culture models,
shown schematically in Figure 1A and 1B. We used a number of
approaches to translate these findings to human disease states
(Fig. 1C and 1D). The breast cancer model was comprised of ER+
MCF-7 breast cancer cells grown on Matrigel to form 3D spheroid
structures, denoted hereon simply as MCF-7. Primary human
mammary fibroblasts (HMF), isolated from normal breast tissue,
were commercially obtained. Several co-culture geometries were
used in order to systematically characterize the mechanism by
which tumor-adjacent stromal fibroblasts exert influence over
cancer cell growth. An indirect co-culture, the ‘sandwich’ (MCF-
7S), represents the compartmentalization of cancer cells and
fibroblast-rich stroma, as may be observed in locally confined
tumors. Because the fibroblasts are grown in a separate collagen
layer, the two cell types are able to communicate continuously via
molecular diffusion of soluble factors while remaining in their
respective layers [16]. After a prescribed co-culture time, the layers
are easily separated, and molecular analyses can be performed
without any cell crossover. The direct, or ‘mixed’, co-culture
(MCF-7M), consists of both MCF-7 and fibroblasts grown together
on Matrigel, allowing for cell-cell interactions arising from direct
contact. To understand the transient influence of soluble factors on
cancer cell phenotypes, a conditioned medium (CM) culture was
employed which consists of medium from MCF-7M added to the
MCF-7 cells. This medium was subsequently analyzed to identify
the secreted factors that characterize cancer cell-fibroblast
interactions in this model system. These models were used to
comprehensively interrogate the differential fibroblast-cancer cell
interactions that influence cancer cell behavior and resistance to
therapy.
Fibroblasts induce an epithelial-to-mesenchymaltransition (EMT) in breast cancer cells
We observed that co-culture with HMF induced an epithelial-
to-mesenchymal transition (EMT) in MCF-7 breast cancer cells.
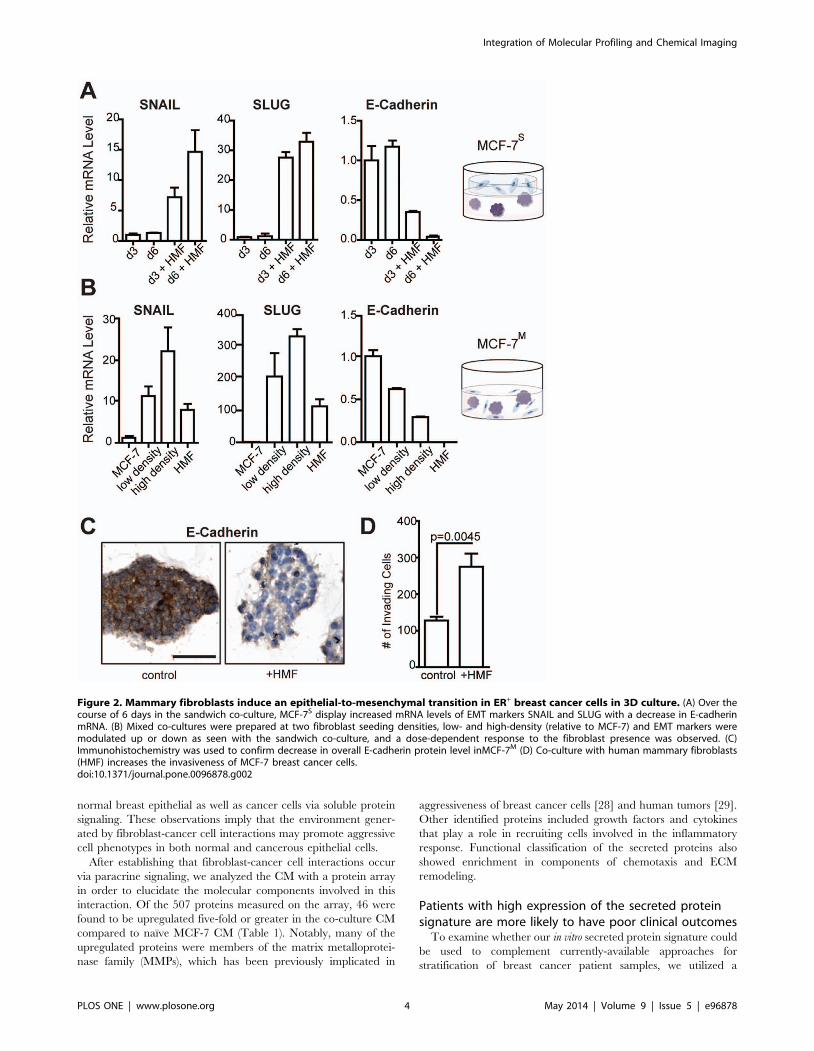
The cells grown in the MCF-7S model displayed increased levels of
SNAIL (7-fold) and SLUG (25-fold) mRNA as well as a 4-fold
decrease of E-Cadherin mRNA (Fig. 2A), all characteristic of the
mesenchymal cell phenotype after undergoing EMT [25]. The
effects observed at 3 days were sustained at longer times,
indicating that the induced EMT phenotype was not transient.
This phenotype was accompanied by an increase in mRNA levels
for growth factors, including amphiregulin (Figure S1 in File S1),
which is often associated with a loss of ER and increased
inflammatory signaling in breast cancers [26,27].
To confirm that the phenotypic changes observed in MCF-7S
were due to fibroblast signaling and not dependent on the
sandwich geometry, we also used the MCF-7M culture. Similar to
MCF-7 and MCF-7S, cells still grew as spheroids in the MCF-7M
model, with fibroblasts growing at spheroid perimeters but not
within them (Figure S2 in File S1). MCF-7M were grown at two
seeding compositions, one with a fibroblast:cancer cell ratios of 1:5
(indicating a ‘low density’ of fibroblasts) and one with a ratio of 1:3
(a ‘high density’ of fibroblasts). In the MCF-7M cultures, SNAIL
and SLUG were expressed at much higher levels and E-cadherin
levels were decreased 2-fold or more compared to MCF-7S
cultures (Fig. 2B). A density-dependent effect on expression level of
these genes was observed between the low and high fibroblast
ratios. Because the mRNA levels shown represent a mixture of the
cancer cells and fibroblasts, mRNA levels for these markers from
HMF grown alone are also displayed. Basal levels of SNAIL and
SLUG in HMF are higher than found in MCF-7 cells, but this is
only approximately 30% the level observed in the co-culture,
suggesting that regulation of the EMT phenotype is synergistic and
not dominated by one cell type. Reduction in E-cadherin at the
mRNA level was also confirmed at the protein level by
immunohistochemistry (Fig. 2C).
To demonstrate that the presence of HMF also altered the
behavior of cancer cells, MCF-7 grown in a Transwell co-culture
with HMF were found to be significantly (p = 0.0045) more
invasive compared to MCF-7 alone (Fig. 2D). Comparing the
mixed and sandwich culture models, we observed that increasing
Integration of Molecular Profiling and Chemical Imaging
PLOS ONE | www.plosone.org 2 May 2014 | Volume 9 | Issue 5 | e96878
both the co-culture time and the relative number of fibroblasts in
the co-culture induced similar trends in the expression of EMT
markers in the cancer cells. These results suggest that fibroblast
interactions play a significant role in altering the ER+ cancer cell
phenotype.
Co-culture with mammary fibroblasts down-regulatesERa in MCF-7 and drives hormone-independentproliferation
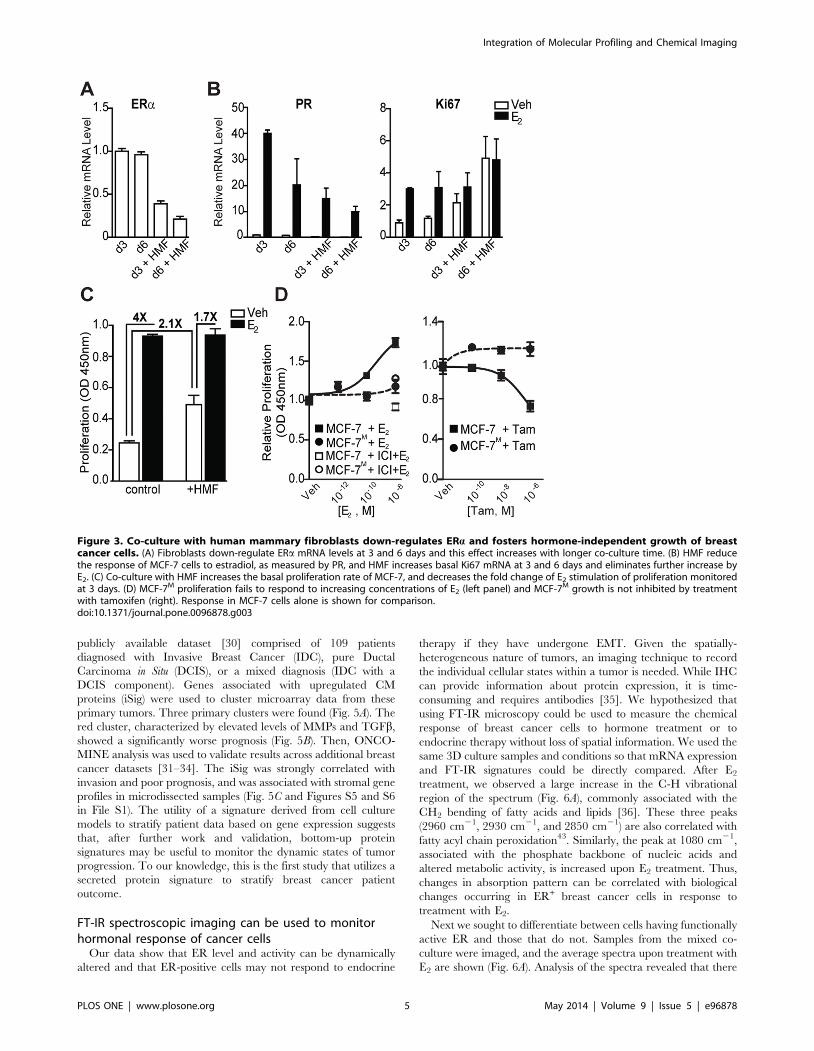
We next examined whether co-culture with fibroblasts might
alter response of ER+ cancer cells to hormones. As a prelude to
using our models for this effort, the response of MCF-7 to estrogen
was confirmed to be similar in monolayer and in 3D culture
(Figure S3 in File S1). Interestingly, after co-culture, a sustained
reduction in the mRNA level of ERa in MCF-7S was observed
(Fig. 3A). Though reduced, the remaining ERa in MCF-7S cells
was functional, as shown by induction of the estradiol (E2)-
responsive genes progesterone receptor (PR) and Ki67 mRNA
after treatment (Fig. 3B). The basal levels of Ki67 mRNA and cell
proliferation were increased in the co-cultures, and after 6 days,
the response to E2 was greatly diminished, indicating that MCF-
7S/MCF-7M proliferation became increasingly hormone-indepen-
dent (Fig. 3B and 3C). Accompanying this hormone-independent
growth, the antiestrogen tamoxifen (Tam) was no longer effective
in inhibiting the growth of MCF-7M (Fig. 3D).
Conditioned medium from 3D co-cultures induces EMTin breast cancer cells and also in normal mammaryepithelial cells
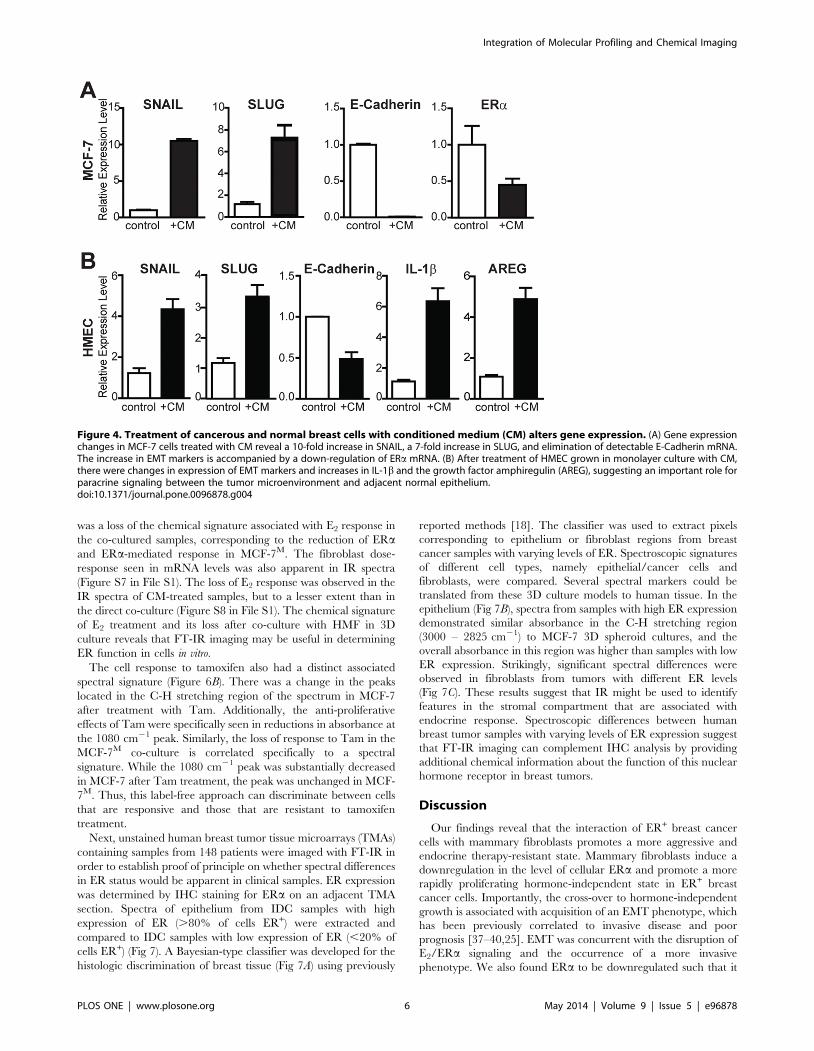
To investigate a possible role for paracrine signaling and soluble
factors in driving alterations in breast cancer cells, we examined
gene expression changes in MCF-7 cells treated with conditioned
medium (CM) (Fig. 4A). Notably, ERa levels were halved in CM-
treated samples, and EMT markers SNAIL and SLUG were
upregulated with an almost complete loss of E-Cadherin mRNA
(Fig. 4A). To examine whether the cancer cell-fibroblast CM might
also affect normal mammary epithelium, we grew normal primary
human mammary epithelial cells (HMEC) with CM and
monitored changes in gene expression. Strikingly, the same
EMT phenotype was observed although less dramatically than
in MCF-7 cells (Fig. 4B). Based on these results, we propose that
fibroblast-cancer cell interactions can induce an EMT in nearby
Figure 1. Three-dimensional co-culture models and analytical approaches in this study. Schematic of the several three-dimensional co-culture models we utilized to study the interactions between MCF-7 breast cancer cells and primary mammary fibroblasts. The MCF-7 were grown asspheroids in a Matrigel overlay culture. Fibroblasts were incorporated either in a direct-contact mixed culture (MCF-7M) or in a separate collagen layerin a sandwich culture (MCF-7S). To study the effects of paracrine signaling, conditioned medium (CM) studies were done in which CM was taken fromthe mixed culture and used to treat MCF-7 or normal mammary epithelial cells (HMEC) grown alone. The CM was also profiled using protein arrays toobtain the secreted protein interaction signature (iSig). We used gene expression and phenotypic assays to study response to hormone and theexpression of markers of EMT. This molecular profiling approach was correlated to label-free FT-IR spectroscopic imaging and also gene expressionfrom patient samples.doi:10.1371/journal.pone.0096878.g001
Integration of Molecular Profiling and Chemical Imaging
PLOS ONE | www.plosone.org 3 May 2014 | Volume 9 | Issue 5 | e96878
normal breast epithelial as well as cancer cells via soluble protein
signaling. These observations imply that the environment gener-
ated by fibroblast-cancer cell interactions may promote aggressive
cell phenotypes in both normal and cancerous epithelial cells.
After establishing that fibroblast-cancer cell interactions occur
via paracrine signaling, we analyzed the CM with a protein array
in order to elucidate the molecular components involved in this
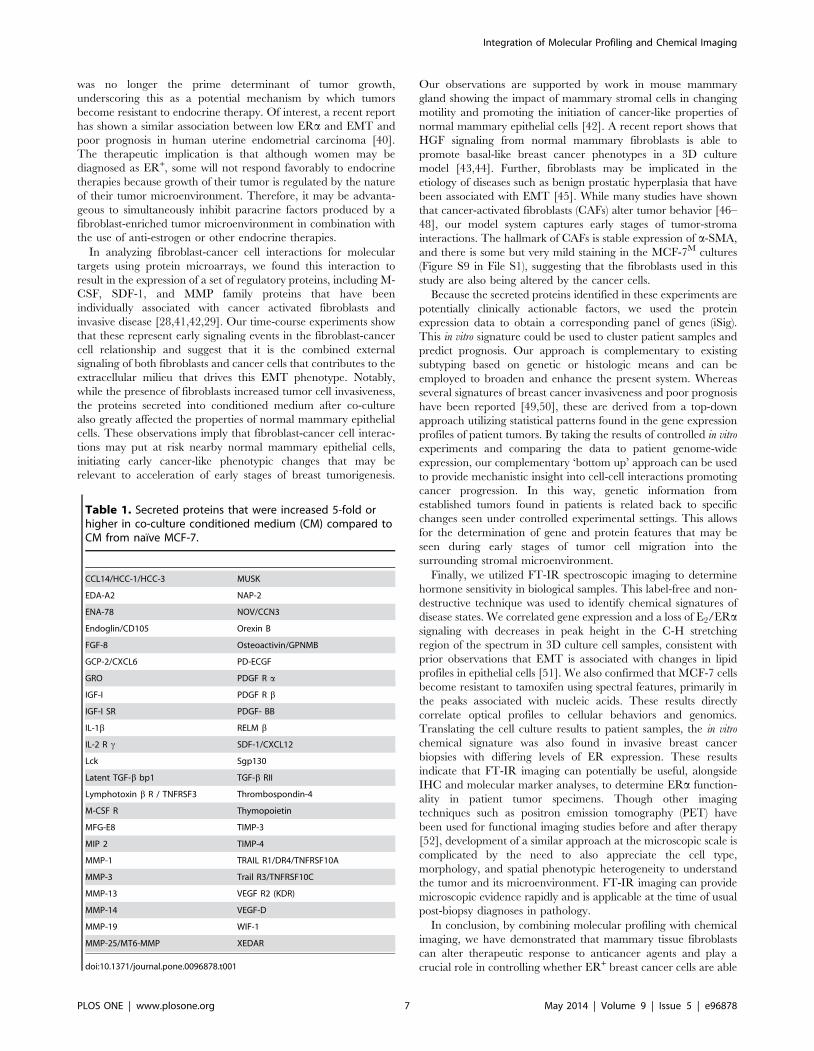
interaction. Of the 507 proteins measured on the array, 46 were
found to be upregulated five-fold or greater in the co-culture CM
compared to naı̈ve MCF-7 CM (Table 1). Notably, many of the
upregulated proteins were members of the matrix metalloprotei-
nase family (MMPs), which has been previously implicated in
aggressiveness of breast cancer cells [28] and human tumors [29].
Other identified proteins included growth factors and cytokines
that play a role in recruiting cells involved in the inflammatory
response. Functional classification of the secreted proteins also
showed enrichment in components of chemotaxis and ECM
remodeling.
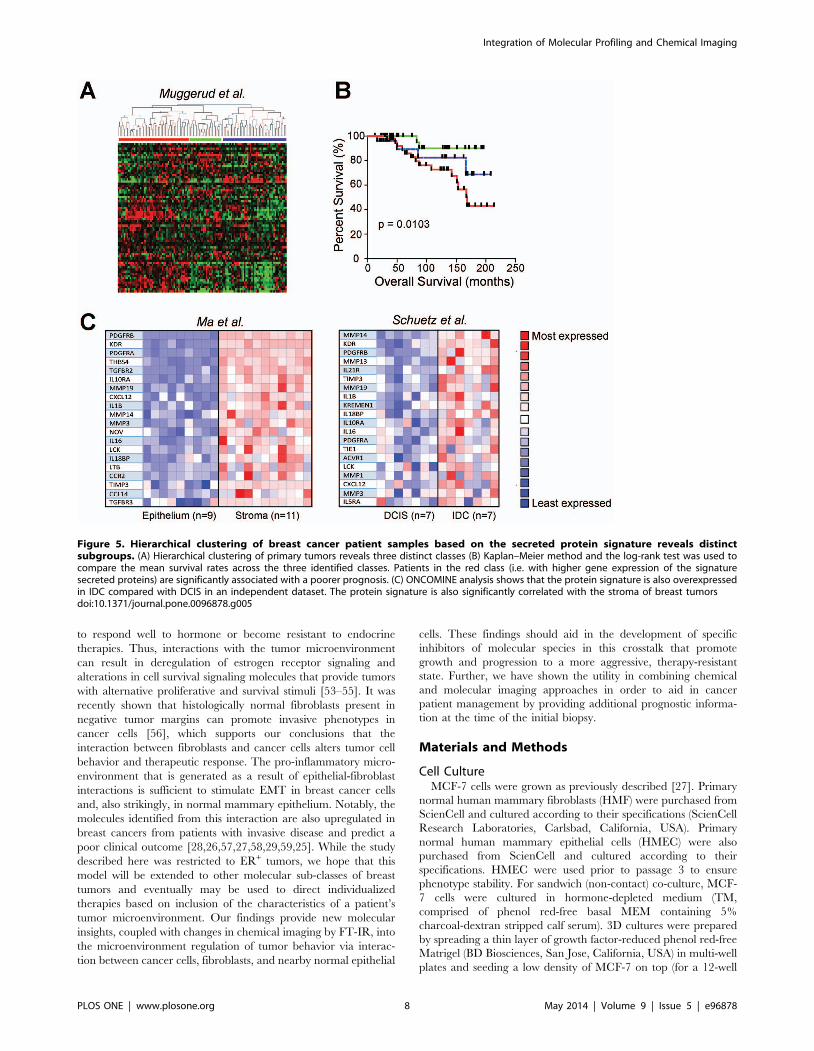
Patients with high expression of the secreted proteinsignature are more likely to have poor clinical outcomes
To examine whether our in vitro secreted protein signature could
be used to complement currently-available approaches for
stratification of breast cancer patient samples, we utilized a
Figure 2. Mammary fibroblasts induce an epithelial-to-mesenchymal transition in ER+ breast cancer cells in 3D culture. (A) Over thecourse of 6 days in the sandwich co-culture, MCF-7S display increased mRNA levels of EMT markers SNAIL and SLUG with a decrease in E-cadherinmRNA. (B) Mixed co-cultures were prepared at two fibroblast seeding densities, low- and high-density (relative to MCF-7) and EMT markers weremodulated up or down as seen with the sandwich co-culture, and a dose-dependent response to the fibroblast presence was observed. (C)Immunohistochemistry was used to confirm decrease in overall E-cadherin protein level inMCF-7M (D) Co-culture with human mammary fibroblasts(HMF) increases the invasiveness of MCF-7 breast cancer cells.doi:10.1371/journal.pone.0096878.g002
Integration of Molecular Profiling and Chemical Imaging
PLOS ONE | www.plosone.org 4 May 2014 | Volume 9 | Issue 5 | e96878
publicly available dataset [30] comprised of 109 patients
diagnosed with Invasive Breast Cancer (IDC), pure Ductal
Carcinoma in Situ (DCIS), or a mixed diagnosis (IDC with a
DCIS component). Genes associated with upregulated CM
proteins (iSig) were used to cluster microarray data from these
primary tumors. Three primary clusters were found (Fig. 5A). The
red cluster, characterized by elevated levels of MMPs and TGFb,
showed a significantly worse prognosis (Fig. 5B). Then, ONCO-
MINE analysis was used to validate results across additional breast
cancer datasets [31–34]. The iSig was strongly correlated with
invasion and poor prognosis, and was associated with stromal gene
profiles in microdissected samples (Fig. 5C and Figures S5 and S6
in File S1). The utility of a signature derived from cell culture
models to stratify patient data based on gene expression suggests
that, after further work and validation, bottom-up protein
signatures may be useful to monitor the dynamic states of tumor
progression. To our knowledge, this is the first study that utilizes a
secreted protein signature to stratify breast cancer patient
outcome.
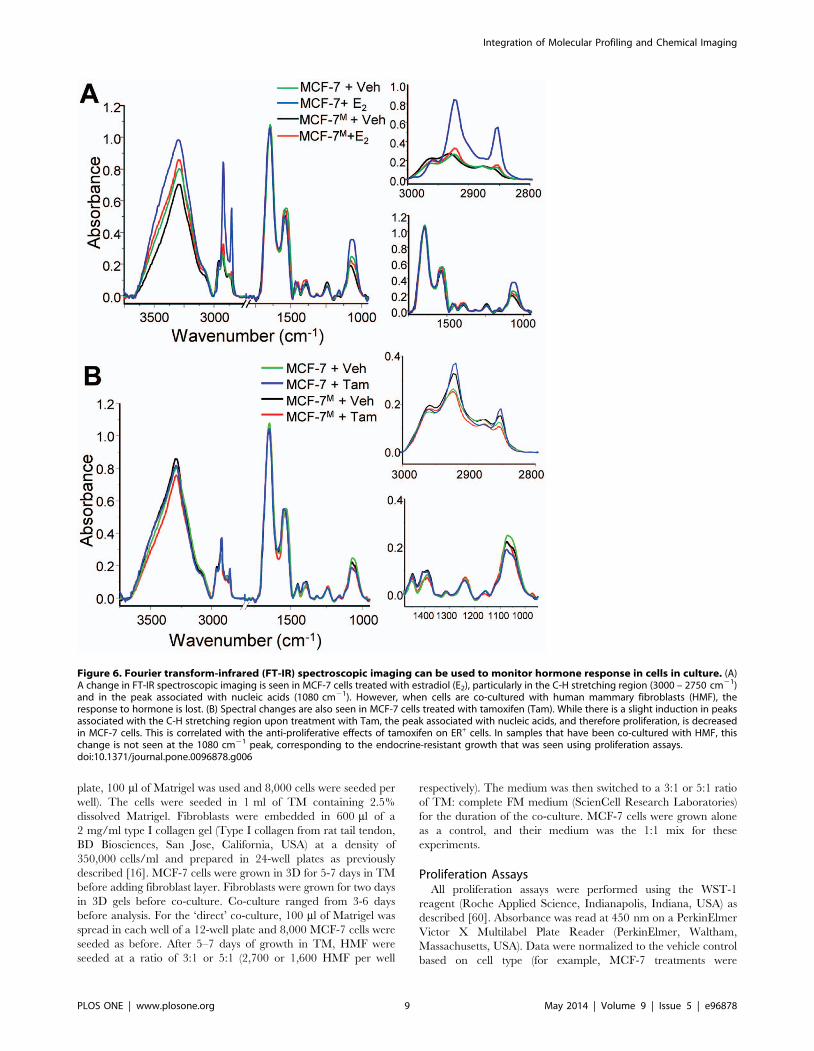
FT-IR spectroscopic imaging can be used to monitorhormonal response of cancer cells
Our data show that ER level and activity can be dynamically
altered and that ER-positive cells may not respond to endocrine
therapy if they have undergone EMT. Given the spatially-
heterogeneous nature of tumors, an imaging technique to record
the individual cellular states within a tumor is needed. While IHC
can provide information about protein expression, it is time-
consuming and requires antibodies [35]. We hypothesized that
using FT-IR microscopy could be used to measure the chemical
response of breast cancer cells to hormone treatment or to
endocrine therapy without loss of spatial information. We used the
same 3D culture samples and conditions so that mRNA expression
and FT-IR signatures could be directly compared. After E2
treatment, we observed a large increase in the C-H vibrational
region of the spectrum (Fig. 6A), commonly associated with the
CH2 bending of fatty acids and lipids [36]. These three peaks
(2960 cm21, 2930 cm21, and 2850 cm21) are also correlated with
fatty acyl chain peroxidation43. Similarly, the peak at 1080 cm21,
associated with the phosphate backbone of nucleic acids and
altered metabolic activity, is increased upon E2 treatment. Thus,
changes in absorption pattern can be correlated with biological
changes occurring in ER+ breast cancer cells in response to
treatment with E2.
Next we sought to differentiate between cells having functionally
active ER and those that do not. Samples from the mixed co-
culture were imaged, and the average spectra upon treatment with
E2 are shown (Fig. 6A). Analysis of the spectra revealed that there
Figure 3. Co-culture with human mammary fibroblasts down-regulates ERa and fosters hormone-independent growth of breastcancer cells. (A) Fibroblasts down-regulate ERa mRNA levels at 3 and 6 days and this effect increases with longer co-culture time. (B) HMF reducethe response of MCF-7 cells to estradiol, as measured by PR, and HMF increases basal Ki67 mRNA at 3 and 6 days and eliminates further increase byE2. (C) Co-culture with HMF increases the basal proliferation rate of MCF-7, and decreases the fold change of E2 stimulation of proliferation monitoredat 3 days. (D) MCF-7M proliferation fails to respond to increasing concentrations of E2 (left panel) and MCF-7M growth is not inhibited by treatmentwith tamoxifen (right). Response in MCF-7 cells alone is shown for comparison.doi:10.1371/journal.pone.0096878.g003
Integration of Molecular Profiling and Chemical Imaging
PLOS ONE | www.plosone.org 5 May 2014 | Volume 9 | Issue 5 | e96878
was a loss of the chemical signature associated with E2 response in
the co-cultured samples, corresponding to the reduction of ERaand ERa-mediated response in MCF-7M. The fibroblast dose-
response seen in mRNA levels was also apparent in IR spectra
(Figure S7 in File S1). The loss of E2 response was observed in the
IR spectra of CM-treated samples, but to a lesser extent than in
the direct co-culture (Figure S8 in File S1). The chemical signature
of E2 treatment and its loss after co-culture with HMF in 3D
culture reveals that FT-IR imaging may be useful in determining
ER function in cells in vitro.
The cell response to tamoxifen also had a distinct associated
spectral signature (Figure 6B). There was a change in the peaks
located in the C-H stretching region of the spectrum in MCF-7
after treatment with Tam. Additionally, the anti-proliferative
effects of Tam were specifically seen in reductions in absorbance at
the 1080 cm21 peak. Similarly, the loss of response to Tam in the
MCF-7M co-culture is correlated specifically to a spectral
signature. While the 1080 cm21 peak was substantially decreased
in MCF-7 after Tam treatment, the peak was unchanged in MCF-
7M. Thus, this label-free approach can discriminate between cells
that are responsive and those that are resistant to tamoxifen
treatment.
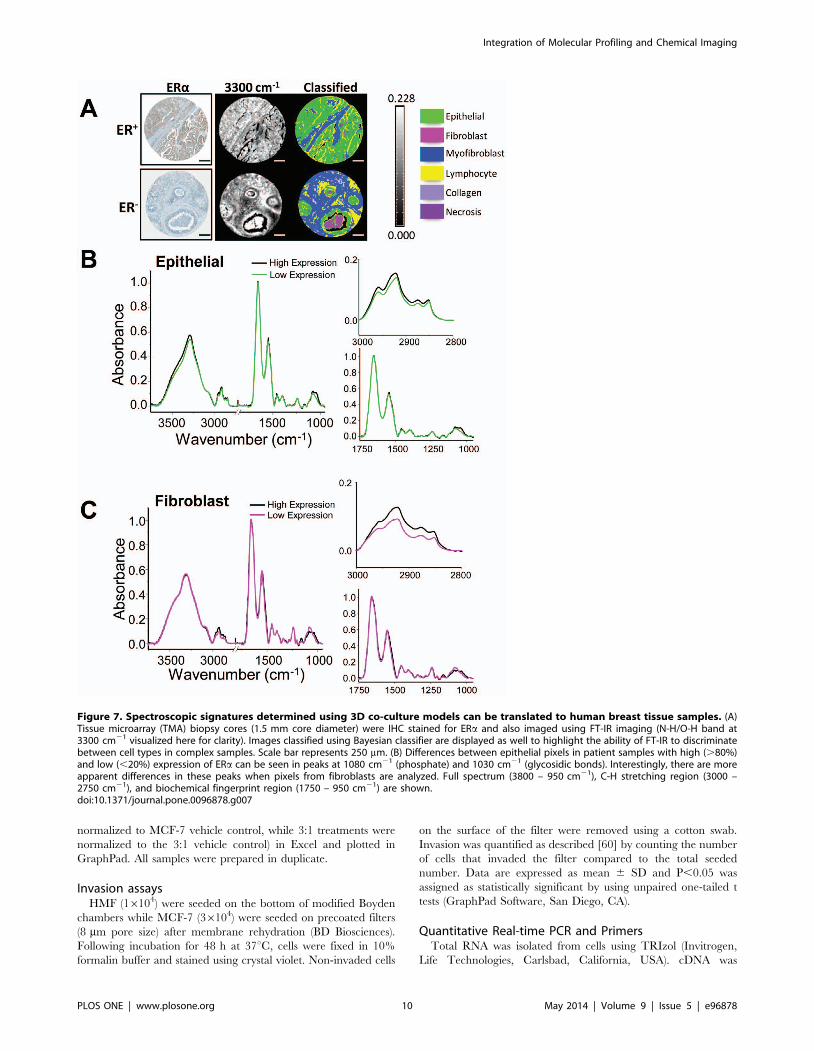
Next, unstained human breast tumor tissue microarrays (TMAs)
containing samples from 148 patients were imaged with FT-IR in
order to establish proof of principle on whether spectral differences
in ER status would be apparent in clinical samples. ER expression
was determined by IHC staining for ERa on an adjacent TMA
section. Spectra of epithelium from IDC samples with high
expression of ER (.80% of cells ER+) were extracted and
compared to IDC samples with low expression of ER (,20% of
cells ER+) (Fig 7). A Bayesian-type classifier was developed for the
histologic discrimination of breast tissue (Fig 7A) using previously
reported methods [18]. The classifier was used to extract pixels
corresponding to epithelium or fibroblast regions from breast
cancer samples with varying levels of ER. Spectroscopic signatures
of different cell types, namely epithelial/cancer cells and
fibroblasts, were compared. Several spectral markers could be
translated from these 3D culture models to human tissue. In the
epithelium (Fig 7B), spectra from samples with high ER expression
demonstrated similar absorbance in the C-H stretching region
(3000 – 2825 cm21) to MCF-7 3D spheroid cultures, and the
overall absorbance in this region was higher than samples with low
ER expression. Strikingly, significant spectral differences were
observed in fibroblasts from tumors with different ER levels
(Fig 7C). These results suggest that IR might be used to identify
features in the stromal compartment that are associated with
endocrine response. Spectroscopic differences between human
breast tumor samples with varying levels of ER expression suggest
that FT-IR imaging can complement IHC analysis by providing
additional chemical information about the function of this nuclear
hormone receptor in breast tumors.
Discussion
Our findings reveal that the interaction of ER+ breast cancer
cells with mammary fibroblasts promotes a more aggressive and
endocrine therapy-resistant state. Mammary fibroblasts induce a
downregulation in the level of cellular ERa and promote a more
rapidly proliferating hormone-independent state in ER+ breast
cancer cells. Importantly, the cross-over to hormone-independent
growth is associated with acquisition of an EMT phenotype, which
has been previously correlated to invasive disease and poor
prognosis [37–40,25]. EMT was concurrent with the disruption of
E2/ERa signaling and the occurrence of a more invasive
phenotype. We also found ERa to be downregulated such that it
Figure 4. Treatment of cancerous and normal breast cells with conditioned medium (CM) alters gene expression. (A) Gene expressionchanges in MCF-7 cells treated with CM reveal a 10-fold increase in SNAIL, a 7-fold increase in SLUG, and elimination of detectable E-Cadherin mRNA.The increase in EMT markers is accompanied by a down-regulation of ERa mRNA. (B) After treatment of HMEC grown in monolayer culture with CM,there were changes in expression of EMT markers and increases in IL-1b and the growth factor amphiregulin (AREG), suggesting an important role forparacrine signaling between the tumor microenvironment and adjacent normal epithelium.doi:10.1371/journal.pone.0096878.g004
Integration of Molecular Profiling and Chemical Imaging
PLOS ONE | www.plosone.org 6 May 2014 | Volume 9 | Issue 5 | e96878
was no longer the prime determinant of tumor growth,
underscoring this as a potential mechanism by which tumors
become resistant to endocrine therapy. Of interest, a recent report
has shown a similar association between low ERa and EMT and
poor prognosis in human uterine endometrial carcinoma [40].
The therapeutic implication is that although women may be
diagnosed as ER+, some will not respond favorably to endocrine
therapies because growth of their tumor is regulated by the nature
of their tumor microenvironment. Therefore, it may be advanta-
geous to simultaneously inhibit paracrine factors produced by a
fibroblast-enriched tumor microenvironment in combination with
the use of anti-estrogen or other endocrine therapies.
In analyzing fibroblast-cancer cell interactions for molecular
targets using protein microarrays, we found this interaction to
result in the expression of a set of regulatory proteins, including M-
CSF, SDF-1, and MMP family proteins that have been
individually associated with cancer activated fibroblasts and
invasive disease [28,41,42,29]. Our time-course experiments show
that these represent early signaling events in the fibroblast-cancer
cell relationship and suggest that it is the combined external
signaling of both fibroblasts and cancer cells that contributes to the
extracellular milieu that drives this EMT phenotype. Notably,
while the presence of fibroblasts increased tumor cell invasiveness,
the proteins secreted into conditioned medium after co-culture
also greatly affected the properties of normal mammary epithelial
cells. These observations imply that fibroblast-cancer cell interac-
tions may put at risk nearby normal mammary epithelial cells,
initiating early cancer-like phenotypic changes that may be
relevant to acceleration of early stages of breast tumorigenesis.
Our observations are supported by work in mouse mammary
gland showing the impact of mammary stromal cells in changing
motility and promoting the initiation of cancer-like properties of
normal mammary epithelial cells [42]. A recent report shows that
HGF signaling from normal mammary fibroblasts is able to
promote basal-like breast cancer phenotypes in a 3D culture
model [43,44]. Further, fibroblasts may be implicated in the
etiology of diseases such as benign prostatic hyperplasia that have
been associated with EMT [45]. While many studies have shown
that cancer-activated fibroblasts (CAFs) alter tumor behavior [46–
48], our model system captures early stages of tumor-stroma
interactions. The hallmark of CAFs is stable expression of a-SMA,
and there is some but very mild staining in the MCF-7M cultures
(Figure S9 in File S1), suggesting that the fibroblasts used in this
study are also being altered by the cancer cells.
Because the secreted proteins identified in these experiments are
potentially clinically actionable factors, we used the protein
expression data to obtain a corresponding panel of genes (iSig).
This in vitro signature could be used to cluster patient samples and
predict prognosis. Our approach is complementary to existing
subtyping based on genetic or histologic means and can be
employed to broaden and enhance the present system. Whereas
several signatures of breast cancer invasiveness and poor prognosis
have been reported [49,50], these are derived from a top-down
approach utilizing statistical patterns found in the gene expression
profiles of patient tumors. By taking the results of controlled in vitro
experiments and comparing the data to patient genome-wide
expression, our complementary ‘bottom up’ approach can be used
to provide mechanistic insight into cell-cell interactions promoting
cancer progression. In this way, genetic information from
established tumors found in patients is related back to specific
changes seen under controlled experimental settings. This allows
for the determination of gene and protein features that may be
seen during early stages of tumor cell migration into the
surrounding stromal microenvironment.
Finally, we utilized FT-IR spectroscopic imaging to determine
hormone sensitivity in biological samples. This label-free and non-
destructive technique was used to identify chemical signatures of
disease states. We correlated gene expression and a loss of E2/ERasignaling with decreases in peak height in the C-H stretching
region of the spectrum in 3D culture cell samples, consistent with
prior observations that EMT is associated with changes in lipid
profiles in epithelial cells [51]. We also confirmed that MCF-7 cells
become resistant to tamoxifen using spectral features, primarily in
the peaks associated with nucleic acids. These results directly
correlate optical profiles to cellular behaviors and genomics.
Translating the cell culture results to patient samples, the in vitro
chemical signature was also found in invasive breast cancer
biopsies with differing levels of ER expression. These results
indicate that FT-IR imaging can potentially be useful, alongside
IHC and molecular marker analyses, to determine ERa function-
ality in patient tumor specimens. Though other imaging
techniques such as positron emission tomography (PET) have
been used for functional imaging studies before and after therapy
[52], development of a similar approach at the microscopic scale is
complicated by the need to also appreciate the cell type,
morphology, and spatial phenotypic heterogeneity to understand
the tumor and its microenvironment. FT-IR imaging can provide
microscopic evidence rapidly and is applicable at the time of usual
post-biopsy diagnoses in pathology.
In conclusion, by combining molecular profiling with chemical
imaging, we have demonstrated that mammary tissue fibroblasts
can alter therapeutic response to anticancer agents and play a
crucial role in controlling whether ER+ breast cancer cells are able
Table 1. Secreted proteins that were increased 5-fold orhigher in co-culture conditioned medium (CM) compared toCM from naı̈ve MCF-7.
CCL14/HCC-1/HCC-3 MUSK
EDA-A2 NAP-2
ENA-78 NOV/CCN3
Endoglin/CD105 Orexin B
FGF-8 Osteoactivin/GPNMB
GCP-2/CXCL6 PD-ECGF
GRO PDGF R a
IGF-I PDGF R b
IGF-I SR PDGF- BB
IL-1b RELM b
IL-2 R c SDF-1/CXCL12
Lck Sgp130
Latent TGF-b bp1 TGF-b RII
Lymphotoxin b R / TNFRSF3 Thrombospondin-4
M-CSF R Thymopoietin
MFG-E8 TIMP-3
MIP 2 TIMP-4
MMP-1 TRAIL R1/DR4/TNFRSF10A
MMP-3 Trail R3/TNFRSF10C
MMP-13 VEGF R2 (KDR)
MMP-14 VEGF-D
MMP-19 WIF-1
MMP-25/MT6-MMP XEDAR
doi:10.1371/journal.pone.0096878.t001
Integration of Molecular Profiling and Chemical Imaging
PLOS ONE | www.plosone.org 7 May 2014 | Volume 9 | Issue 5 | e96878
to respond well to hormone or become resistant to endocrine
therapies. Thus, interactions with the tumor microenvironment
can result in deregulation of estrogen receptor signaling and
alterations in cell survival signaling molecules that provide tumors
with alternative proliferative and survival stimuli [53–55]. It was
recently shown that histologically normal fibroblasts present in
negative tumor margins can promote invasive phenotypes in
cancer cells [56], which supports our conclusions that the
interaction between fibroblasts and cancer cells alters tumor cell
behavior and therapeutic response. The pro-inflammatory micro-
environment that is generated as a result of epithelial-fibroblast
interactions is sufficient to stimulate EMT in breast cancer cells
and, also strikingly, in normal mammary epithelium. Notably, the
molecules identified from this interaction are also upregulated in
breast cancers from patients with invasive disease and predict a
poor clinical outcome [28,26,57,27,58,29,59,25]. While the study
described here was restricted to ER+ tumors, we hope that this
model will be extended to other molecular sub-classes of breast
tumors and eventually may be used to direct individualized
therapies based on inclusion of the characteristics of a patient’s
tumor microenvironment. Our findings provide new molecular
insights, coupled with changes in chemical imaging by FT-IR, into
the microenvironment regulation of tumor behavior via interac-
tion between cancer cells, fibroblasts, and nearby normal epithelial
cells. These findings should aid in the development of specific
inhibitors of molecular species in this crosstalk that promote
growth and progression to a more aggressive, therapy-resistant
state. Further, we have shown the utility in combining chemical
and molecular imaging approaches in order to aid in cancer
patient management by providing additional prognostic informa-
tion at the time of the initial biopsy.
Materials and Methods
Cell CultureMCF-7 cells were grown as previously described [27]. Primary
normal human mammary fibroblasts (HMF) were purchased from
ScienCell and cultured according to their specifications (ScienCell
Research Laboratories, Carlsbad, California, USA). Primary
normal human mammary epithelial cells (HMEC) were also
purchased from ScienCell and cultured according to their
specifications. HMEC were used prior to passage 3 to ensure
phenotype stability. For sandwich (non-contact) co-culture, MCF-
7 cells were cultured in hormone-depleted medium (TM,
comprised of phenol red-free basal MEM containing 5%
charcoal-dextran stripped calf serum). 3D cultures were prepared
by spreading a thin layer of growth factor-reduced phenol red-free
Matrigel (BD Biosciences, San Jose, California, USA) in multi-well
plates and seeding a low density of MCF-7 on top (for a 12-well
Figure 5. Hierarchical clustering of breast cancer patient samples based on the secreted protein signature reveals distinctsubgroups. (A) Hierarchical clustering of primary tumors reveals three distinct classes (B) Kaplan–Meier method and the log-rank test was used tocompare the mean survival rates across the three identified classes. Patients in the red class (i.e. with higher gene expression of the signaturesecreted proteins) are significantly associated with a poorer prognosis. (C) ONCOMINE analysis shows that the protein signature is also overexpressedin IDC compared with DCIS in an independent dataset. The protein signature is also significantly correlated with the stroma of breast tumorsdoi:10.1371/journal.pone.0096878.g005
Integration of Molecular Profiling and Chemical Imaging
PLOS ONE | www.plosone.org 8 May 2014 | Volume 9 | Issue 5 | e96878
plate, 100 ml of Matrigel was used and 8,000 cells were seeded per
well). The cells were seeded in 1 ml of TM containing 2.5%
dissolved Matrigel. Fibroblasts were embedded in 600 ml of a
2 mg/ml type I collagen gel (Type I collagen from rat tail tendon,
BD Biosciences, San Jose, California, USA) at a density of
350,000 cells/ml and prepared in 24-well plates as previously
described [16]. MCF-7 cells were grown in 3D for 5-7 days in TM
before adding fibroblast layer. Fibroblasts were grown for two days
in 3D gels before co-culture. Co-culture ranged from 3-6 days
before analysis. For the ‘direct’ co-culture, 100 ml of Matrigel was
spread in each well of a 12-well plate and 8,000 MCF-7 cells were
seeded as before. After 5–7 days of growth in TM, HMF were
seeded at a ratio of 3:1 or 5:1 (2,700 or 1,600 HMF per well
respectively). The medium was then switched to a 3:1 or 5:1 ratio
of TM: complete FM medium (ScienCell Research Laboratories)
for the duration of the co-culture. MCF-7 cells were grown alone
as a control, and their medium was the 1:1 mix for these
experiments.
Proliferation AssaysAll proliferation assays were performed using the WST-1
reagent (Roche Applied Science, Indianapolis, Indiana, USA) as
described [60]. Absorbance was read at 450 nm on a PerkinElmer
Victor X Multilabel Plate Reader (PerkinElmer, Waltham,
Massachusetts, USA). Data were normalized to the vehicle control
based on cell type (for example, MCF-7 treatments were
Figure 6. Fourier transform-infrared (FT-IR) spectroscopic imaging can be used to monitor hormone response in cells in culture. (A)A change in FT-IR spectroscopic imaging is seen in MCF-7 cells treated with estradiol (E2), particularly in the C-H stretching region (3000 – 2750 cm21)and in the peak associated with nucleic acids (1080 cm21). However, when cells are co-cultured with human mammary fibroblasts (HMF), theresponse to hormone is lost. (B) Spectral changes are also seen in MCF-7 cells treated with tamoxifen (Tam). While there is a slight induction in peaksassociated with the C-H stretching region upon treatment with Tam, the peak associated with nucleic acids, and therefore proliferation, is decreasedin MCF-7 cells. This is correlated with the anti-proliferative effects of tamoxifen on ER+ cells. In samples that have been co-cultured with HMF, thischange is not seen at the 1080 cm21 peak, corresponding to the endocrine-resistant growth that was seen using proliferation assays.doi:10.1371/journal.pone.0096878.g006
Integration of Molecular Profiling and Chemical Imaging
PLOS ONE | www.plosone.org 9 May 2014 | Volume 9 | Issue 5 | e96878
normalized to MCF-7 vehicle control, while 3:1 treatments were
normalized to the 3:1 vehicle control) in Excel and plotted in
GraphPad. All samples were prepared in duplicate.
Invasion assaysHMF (16104) were seeded on the bottom of modified Boyden
chambers while MCF-7 (36104) were seeded on precoated filters
(8 mm pore size) after membrane rehydration (BD Biosciences).
Following incubation for 48 h at 37uC, cells were fixed in 10%
formalin buffer and stained using crystal violet. Non-invaded cells
on the surface of the filter were removed using a cotton swab.
Invasion was quantified as described [60] by counting the number
of cells that invaded the filter compared to the total seeded
number. Data are expressed as mean 6 SD and P,0.05 was
assigned as statistically significant by using unpaired one-tailed t
tests (GraphPad Software, San Diego, CA).
Quantitative Real-time PCR and PrimersTotal RNA was isolated from cells using TRIzol (Invitrogen,
Life Technologies, Carlsbad, California, USA). cDNA was
Figure 7. Spectroscopic signatures determined using 3D co-culture models can be translated to human breast tissue samples. (A)Tissue microarray (TMA) biopsy cores (1.5 mm core diameter) were IHC stained for ERa and also imaged using FT-IR imaging (N-H/O-H band at3300 cm21 visualized here for clarity). Images classified using Bayesian classifier are displayed as well to highlight the ability of FT-IR to discriminatebetween cell types in complex samples. Scale bar represents 250 mm. (B) Differences between epithelial pixels in patient samples with high (.80%)and low (,20%) expression of ERa can be seen in peaks at 1080 cm21 (phosphate) and 1030 cm21 (glycosidic bonds). Interestingly, there are moreapparent differences in these peaks when pixels from fibroblasts are analyzed. Full spectrum (3800 – 950 cm21), C-H stretching region (3000 –2750 cm21), and biochemical fingerprint region (1750 – 950 cm21) are shown.doi:10.1371/journal.pone.0096878.g007
Integration of Molecular Profiling and Chemical Imaging
PLOS ONE | www.plosone.org 10 May 2014 | Volume 9 | Issue 5 | e96878
prepared by reverse transcription with M-MuLV Reverse
Transcriptase (New England Biolabs Inc, Ipswich, Massachusetts,
USA). mRNA expression was measured using quantitative real-
time PCR on a high-throughput ABI Prism 7900HT real-time
instrument (Applied Biosystems, Life Technologies, Carlsbad,
California, USA) using SYBR Green PCR Master Mix (Applied
Biosystems) as described previously [61].
ImmunohistochemistryFor both immunohistochemistry and FT-IR imaging analysis,
samples were fixed in freshly-prepared 4% paraformaldehyde for
1 h, mounted in Histogel (Thermo Fisher Scientific Inc.,
Waltham, Massachusetts, USA), and then paraffin-embedded.
For paraffin embedding, samples mounted in Histogel were
dehydrated with serial ethanol washes (50%, 70%, 80%, 95%,
100%, 100% for 3 h each) followed by three 2 h clearing steps in
xylenes, and finally four 1 h paraffin infiltration steps (ParaPlast
Plus, Sigma-Aldrich, St. Louis, Missouri, USA).
For IHC, samples were sectioned at 10 mm onto poly-L-lysine
coated slides (Thermo Fisher Scientific, Waltham, Massachusetts,
USA). Once dry, slides were deparaffinized (263 min xylene,
163 min 1:1 xylene/100% ethanol, 263 min 100% ethanol,
163 min 95% ethanol, 163 min 70% ethanol, 163 min 50%
ethanol, cold tap water). Antigen retrieval was performed by
boiling the samples in the microwave for 15 min in 10 mM
sodium citrate buffer (pH 6.0). Slides were blocked in Tris-
buffered saline (TBS) containing 10% FBS overnight at 4uC.
Primary antibody was added in TBS containing 1% BSA for one
hour at room temperature. The remainder of the protocol was
performed as specified using a HRP/DAB detection kit (EXPOSE
Mouse and Rabbit Specific HRP/DAB Detection IHC kit,
Abcam, Cambridge, Massachusetts, USA). E-cadherin antibody
was used at a dilution of 1:400 (E-cadherin 24E10 Rabbit mAb,
Cell Signaling Technology, Danvers, Massachusetts, USA). a-
SMA antibody was used at a dilution of 1:200 (a-SMA clone 1A4,
Dako Denmark A/S, Glostrup, Denmark).
Antibody Arrays and Classification of the ProteinSignature
Antibody Array was from RayBiotech, Inc. (L-Series 507:
RayBio Label-based Human Antibody Array 1-Membrane). Array
analyzes 507 human proteins simultaneously in two samples to
examine differential expression. Conditioned medium was ob-
tained from mixed (direct contact) co-cultures after 3 days and this
was compared with conditioned medium from MCF-7 cells grown
in 3D for the same length of time. Samples were prepared
according to the manufacturer’s specifications. Protein array
membrane was imaged with an Image Quant LAS 4010
Luminescent image analyzer (GE Healthcare, Waukesha, Wis-
consin, USA). GO and pathway classifications of the protein
signature were conducted using web-based DAVID Bioinformatics
Resources database (Figure S4 in File S1) [62] and MetaCore
(Thomson Reuters, New York, NY, USA).
FT-IR Imaging and Image ClassificationFor cell culture samples, paraffin embedded samples were
sectioned at 5 mm onto MirrIR IR-reflective glass slides (Kevley
Technologies, Chesterland, Ohio, USA). Once dry, samples were
deparaffinized in hexanes for 24 h and then dried before imaging.
All tissue was commercially-obtained (BR961 and BR1003 Breast
Tissue Microarrays, US Biomax, Inc., Rockville, Maryland, USA).
Unstained sections were placed on barium fluoride substrates
(International Crystal Laboratories, Garfield, New Jersey, USA),
deparaffinized in hexanes for 24 hours, and completely dried
before imaging. Adjacent sections of the arrays were stained for
morphology (Hematoxylin and Eosin) and for ERa expression
(IHC). For FT-IR imaging, a PerkinElmer Spotlight 400
(PerkinElmer, Waltham, Massachusetts, USA) equipped with a
thermal source and a raster-scanning linear array detector was
used with a Germanium ATR imaging accessory. An NB medium
apodization was applied, a 1 cm s21 mirror speed was used for
acquisition, and zeropadding was not used. Background scans
were taken at 8 cm21 spectral resolution. 1506150 mm images
were collected at 8 cm21 spectral resolution with 16 scans per
pixel and a 1.5661.56 mm pixel size. Data were atmospheric- and
ATR-corrected on the Spotlight, and further processing was done
using ENVI-IDL. A minimum noise fraction (MNF) algorithm was
applied on all images in ENVI-IDL [63] to reduce noise in the
data. Two regions were imaged per sample, and samples were
prepared in duplicate (for a total of 4 data sets per condition).
Because each image represented a combination of cells, Matrigel,
and Histogel, a Bayesian-type classifier was developed as
previously described [18] that labeled spectral contributions from
cells within the image. Briefly, 10–15 images of ‘pure Matrigel’,
‘pure Histogel’, and samples containing Histogel, Matrigel, and
cells were imaged. Several thousand pixels were identified and
manually labeled as coming from one of three classes: Matrigel,
Histogel, and cells. A three-class Bayesian-type classifier was
developed using this training set and was subsequently validated
on an independent set of samples. This allowed us to extract pixels
from the image that corresponded to cells rather than extracellular
matrix or embedding compounds. All spectra displayed here
represent the average spectra from the epithelial cells present in
the sample. Once spectra were classified and extracted, a baseline
correction was applied and spectra were further normalized to the
Amide I peak (1656 cm21) for comparison. Spectra were plotted
using OriginPro software. Similar approaches to FT-IR imaging
and classification have been described in the literature
[22,18,64,65,20,66–68].
Data Analysis of MicroarraysA publicly-available microarray dataset was downloaded from
GEO (GSE26304) and included 31 pure DCIS patients, 36 IDC
patients, and 42 patients with ‘Mixed’ histology [30]. Data were
transformed into GeneSpring GX 7.3 and chips and genes were
median normalized and median polished. Hierarchical clustering
of the genes matching the 46-protein secreted signature was
performed and displayed using Eisen Cluster and TreeView
software for analysis and visualization. Kaplan–Meier method and
the log-rank test was used to compare the mean survival rates
across the groups identified by hierarchical clustering.The 46-
protein signature was uploaded in ONCOMINE (Compendia
Bioscience, Ann Arbor, MI), using the following filters: odds ratio
.2, and P-value ,0.001, epithelial versus stroma or invasive
cancer versus ductal-carcinoma in situ and cancer type (breast
cancer). The Oncomine database was also used for visualization of
significantly associated datasets.
Supporting Information
File S1 Figures S1-S9. Figure S1. Amphiregulin mRNA
expression is increased in MCF-7 breast cancer cells in the
sandwich co-culture (MCF-7S). Figure S2. Light microscopy image
showing fibroblasts recruited to MCF-7 spheroids after 3 and 5
days in culture. Figure S3. Comparison of morphology and
response to E2 in 2D and 3D MCF-7 models. (A) Micrograph of
MCF-7 cells grown in 2D and 3D culture. (B) Response of MCF-7
Integration of Molecular Profiling and Chemical Imaging
PLOS ONE | www.plosone.org 11 May 2014 | Volume 9 | Issue 5 | e96878
cells to E2 stimulation is similar in 2D and 3D cultures as
monitored by induction of E2 response genes progesterone
receptor (PR) and Ki67. Figure S4. Table of DAVID pathway
association based on iSig. Figure S5. Table of ONCOMINE
dataset patient characteristics. Figure S6. Expression of iSig is
correlated with breast cancer stromal expression. Figure S7. FT-
IR signature of E2 response of MCF-7 cells is based on fibroblast
density. Figure S8. FT-IR signature of E2 response of MCF-7 cells
is affected by treatment with CM. Figure S9. Fibroblasts recruited
to the outside of MCF-7 spheroids display mild a-SMA staining.
(PPTX)
Acknowledgments
The authors thank Dr. Michael Walsh for helpful advice, and for collecting
and processing TMA FT-IR imaging data.
Author Contributions
Conceived and designed the experiments: SEH AB BSK RB. Performed
the experiments: SEH AB. Analyzed the data: SEH AB BSK RB.
Contributed reagents/materials/analysis tools: SEH AB BSK RB. Wrote
the paper: SEH AB BSK RB.
References
1. Clark GM, Osborne CK, McGuire WL (1984) Correlations between estrogen
receptor, progesterone receptor, and patient characteristics in human breast
cancer. J Clin Oncol 2 (10):1102–1109
2. Harvey JM, Clark GM, Osborne CK, Allred DC (1999) Estrogen receptor status
by immunohistochemistry is superior to the ligand-binding assay for predicting
response to adjuvant endocrine therapy in breast cancer. J Clin Oncol 17
(5):1474–1481
3. Tamoxifen for early breast cancer: an overview of the randomised trials. Early
Breast Cancer Trialists’ Collaborative Group (1998). Lancet 351 (9114):1451–
1467
4. Effects of chemotherapy and hormonal therapy for early breast cancer on
recurrence and 15-year survival: an overview of the randomised trials (2005).
Lancet 365 (9472):1687–1717. doi:10.1016/S0140-6736(05)66544-0
5. Gonzalez-Angulo AM, Morales-Vasquez F, Hortobagyi GN (2007) Overview of
resistance to systemic therapy in patients with breast cancer. Adv Exp Med Biol
608:1–22
6. Musgrove EA, Sutherland RL (2009) Biological determinants of endocrine
resistance in breast cancer. Nat Rev Cancer 9 (9):631–643. doi:10.1038/nrc2713
7. Osborne CK, Schiff R (2011) Mechanisms of endocrine resistance in breast
cancer. Annu Rev Med 62:233-247. doi:10.1146/annurev-med-070909-182917
8. Fang H, Declerck YA (2013) Targeting the tumor microenvironment: from
understanding pathways to effective clinical trials. Cancer research 73 (16):4965–
4977. doi:10.1158/0008-5472.CAN-13-0661
9. Fischbach C, Chen R, Matsumoto T, Schmelzle T, Brugge JS, et al. (2007)
Engineering tumors with 3D scaffolds. Nat Methods 4 (10):855–860.
doi:nmeth1085 [pii] 10.1038/nmeth1085
10. Muranen T, Selfors LM, Worster DT, Iwanicki MP, Song L, et al. (2012)
Inhibition of PI3K/mTOR leads to adaptive resistance in matrix-attached
cancer cells. Cancer cell 21 (2):227–239. doi:10.1016/j.ccr.2011.12.024
11. Debnath J, Muthuswamy SK, Brugge JS (2003) Morphogenesis and oncogenesis
of MCF-10A mammary epithelial acini grown in three-dimensional basement
membrane cultures. Methods 30 (3):256–268
12. Nelson CM, Inman JL, Bissell MJ (2008) Three-dimensional lithographically
defined organotypic tissue arrays for quantitative analysis of morphogenesis and
neoplastic progression. Nat Protoc 3 (4):674–678. doi:nprot.2008.35 [pii]
10.1038/nprot.2008.35
13. Bauer M, Su G, Beebe DJ, Friedl A (2010) 3D microchannel co-culture: method
and biological validation. Integr Biol (Camb) 2 (7–8):371–378. doi:10.1039/
c0ib00001a
14. Kimlin LC, Casagrande G, Virador VM (2013) In vitro three-dimensional (3D)
models in cancer research: an update. Mol Carcinog 52 (3):167–182.
doi:10.1002/mc.21844
15. Bhargava R (2012) Infrared spectroscopic imaging: the next generation. Appl
Spectrosc 66 (10):1091–1120. doi:10.1366/12-06801
16. Holton SE, Walsh MJ, Kajdacsy-Balla A, Bhargava R (2011) Label-free
characterization of cancer-activated fibroblasts using infrared spectroscopic
imaging. Biophys J 101 (6):1513–1521. doi:10.1016/j.bpj.2011.07.055
17. Mourant JR, Yamada YR, Carpenter S, Dominique LR, Freyer JP (2003) FTIR
spectroscopy demonstrates biochemical differences in mammalian cell cultures
at different growth stages. Biophys J 85 (3):1938–1947. doi:10.1016/S0006–
3495(03)74621-9
18. Fernandez DC, Bhargava R, Hewitt SM, Levin IW (2005) Infrared
spectroscopic imaging for histopathologic recognition. Nat Biotechnol 23
(4):469–474. doi:10.1038/nbt1080
19. Gazi E, Harvey TJ, Brown MD, Lockyer NP, Gardner P, et al. (2009) A FTIR
microspectroscopic study of the uptake and metabolism of isotopically labelled
fatty acids by metastatic prostate cancer. Vibrational Spectroscopy 50 (1):99–
105. doi:http://dx.doi.org/10.1016/j.vibspec.2008.09.006
20. Walsh MJ, Fellous TG, Hammiche A, Lin WR, Fullwood NJ, et al. (2008)
Fourier transform infrared microspectroscopy identifies symmetric PO(2)(-)
modifications as a marker of the putative stem cell region of human intestinal
crypts. Stem Cells 26 (1):108–118. doi:10.1634/stemcells.2007–0196
21. Bhargava R (2007) Towards a practical Fourier transform infrared chemical
imaging protocol for cancer histopathology. Anal Bioanal Chem 389 (4):1155–
1169. doi:10.1007/s00216-007-1511-9
22. Bhargava R, Fernandez DC, Hewitt SM, Levin IW (2006) High throughput
assessment of cells and tissues: Bayesian classification of spectral metrics frominfrared vibrational spectroscopic imaging data. Biochim Biophys Acta 1758
(7):830–845. doi:10.1016/j.bbamem.2006.05.007
23. Reddy RK, Walsh MJ, Schulmerich MV, Carney PS, Bhargava R (2013) High-
definition infrared spectroscopic imaging. Appl Spectrosc 67 (1):93–105.doi:10.1366/11-06568
24. Steiner G, Shaw RA, Choo-Smith L-Pi, Steller W, Shapoval L, et al. (2002)Detection and grading of human gliomas by FTIR spectroscopy and a genetic
classification algorithm. Proc SPIE 4614, Biomedical Vibrational SpectroscopyII 4614:127–133. doi:10.1117/12.460789
25. Yang J, Weinberg RA (2008) Epithelial-mesenchymal transition: at thecrossroads of development and tumor metastasis. Dev Cell 14 (6):818–829.
doi:S1534-5807(08)00209-8 [pii] 10.1016/j.devcel.2008.05.009
26. Ma L, de Roquancourt A, Bertheau P, Chevret S, Millot G, et al. (2001)
Expression of amphiregulin and epidermal growth factor receptor in humanbreast cancer: analysis of autocriny and stromal-epithelial interactions. The
Journal of pathology 194 (4):413–419
27. Stossi F, Madak-Erdogan Z, Katzenellenbogen BS (2012) Macrophage-elicited
loss of estrogen receptor-alpha in breast cancer cells via involvement of MAPK
and c-Jun at the ESR1 genomic locus. Oncogene 31 (14):1825–1834.doi:onc2011370 [pii] 10.1038/onc.2011.370
28. Balduyck M, Zerimech F, Gouyer V, Lemaire R, Hemon B, et al. (2000) Specific
expression of matrix metalloproteinases 1, 3, 9 and 13 associated with
invasiveness of breast cancer cells in vitro. Clin Exp Metastasis 18 (2):171–178
29. Vizoso FJ, Gonzalez LO, Corte MD, Rodriguez JC, Vazquez J, et al. (2007)
Study of matrix metalloproteinases and their inhibitors in breast cancer.Br J Cancer 96 (6):903–911. doi:10.1038/sj.bjc.6603666
30. Muggerud AA, Hallett M, Johnsen H, Kleivi K, Zhou W, et al. (2010) Molecular
diversity in ductal carcinoma in situ (DCIS) and early invasive breast cancer.
Mol Oncol 4 (4):357–368. doi:10.1016/j.molonc.2010.06.007
31. Boersma BJ, Reimers M, Yi M, Ludwig JA, Luke BT, et al. (2008) A stromalgene signature associated with inflammatory breast cancer. Int J Cancer 122
(6):1324–1332. doi:10.1002/ijc.23237
32. Ma XJ, Dahiya S, Richardson E, Erlander M, Sgroi DC (2009) Gene expression
profiling of the tumor microenvironment during breast cancer progression.
Breast cancer research: BCR 11 (1):R7. doi:bcr2222 [pii] 10.1186/bcr2222
33. Rhodes DR, Yu J, Shanker K, Deshpande N, Varambally R, et al. (2004)ONCOMINE: a cancer microarray database and integrated data-mining
platform. Neoplasia 6 (1):1–6
34. Schuetz CS, Bonin M, Clare SE, Nieselt K, Sotlar K, et al. (2006) Progression-
specific genes identified by expression profiling of matched ductal carcinomas in
situ and invasive breast tumors, combining laser capture microdissection andoligonucleotide microarray analysis. Cancer research 66 (10):5278–5286.
doi:66/10/5278 [pii] 10.1158/0008-5472.CAN-05-4610
35. Bhargava R, Dabbs DJ (2007) Use of immunohistochemistry in diagnosis of
breast epithelial lesions. Adv Anat Pathol 14 (2):93–107. doi:10.1097/PAP.0b013e31803244d5 00125480-200703000-00003 [pii]
36. Casal HL, Mantsch HH (1984) Polymorphic phase behaviour of phospholipidmembranes studied by infrared spectroscopy. Biochim Biophys Acta 779
(4):381–401
37. Cardamone MD, Bardella C, Gutierrez A, Di Croce L, Rosenfeld MG, et al.
(2009) ERalpha as ligand-independent activator of CDH-1 regulates determi-nation and maintenance of epithelial morphology in breast cancer cells.
Proceedings of the National Academy of Sciences of the United States ofAmerica 106 (18):7420–7425. doi:10.1073/pnas.0903033106
38. Taube JH, Herschkowitz JI, Komurov K, Zhou AY, Gupta S, et al. (2010) Coreepithelial-to-mesenchymal transition interactome gene-expression signature is
associated with claudin-low and metaplastic breast cancer subtypes. Proceedingsof the National Academy of Sciences of the United States of America 107
(35):15449–15454. doi:10.1073/pnas.1004900107
39. Tse JC, Kalluri R (2007) Mechanisms of metastasis: epithelial-to-mesenchymal
transition and contribution of tumor microenvironment. J Cell Biochem 101
(4):816–829. doi:10.1002/jcb.21215
40. Wik E, Raeder MB, Krakstad C, Trovik J, Birkeland E, et al. (2013) Lack ofestrogen receptor-alpha is associated with epithelial-mesenchymal transition and
Integration of Molecular Profiling and Chemical Imaging
PLOS ONE | www.plosone.org 12 May 2014 | Volume 9 | Issue 5 | e96878
PI3K alterations in endometrial carcinoma. Clin Cancer Res 19 (5):1094–1105.
doi:10.1158/1078-0432.CCR-12-303941. Jahkola T, Toivonen T, Nordling S, von Smitten K, Virtanen I (1998)
Expression of tenascin-C in intraductal carcinoma of human breast: relationship
to invasion. Eur J Cancer 34 (11):1687–169242. Kojima Y, Acar A, Eaton EN, Mellody KT, Scheel C, et al. (2010) Autocrine
TGF-beta and stromal cell-derived factor-1 (SDF-1) signaling drives theevolution of tumor-promoting mammary stromal myofibroblasts. Proceedings
of the National Academy of Sciences of the United States of America 107
(46):20009–20014. doi:10.1073/pnas.101380510743. Casbas-Hernandez P, D’Arcy M, Roman-Perez E, Brauer HA, McNaughton K,
et al. (2013) Role of HGF in epithelial-stromal cell interactions duringprogression from benign breast disease to ductal carcinoma in situ. Breast
cancer research: BCR 15 (5):R82. doi:10.1186/bcr347644. Casbas-Hernandez P, Fleming JM, Troester MA (2011) Gene expression
analysis of in vitro cocultures to study interactions between breast epithelium
and stroma. Journal of biomedicine & biotechnology 2011:520987. doi:10.1155/2011/520987
45. Alonso-Magdalena P, Brossner C, Reiner A, Cheng G, Sugiyama N, et al. (2009)A role for epithelial-mesenchymal transition in the etiology of benign prostatic
hyperplasia. Proceedings of the National Academy of Sciences of the United
States of America 106 (8):2859–2863. doi:10.1073/pnas.081266610646. Elenbaas B, Weinberg RA (2001) Heterotypic signaling between epithelial tumor
cells and fibroblasts in carcinoma formation. Experimental cell research 264(1):169–184. doi:10.1006/excr.2000.5133
47. Olumi AF, Grossfeld GD, Hayward SW, Carroll PR, Tlsty TD, et al. (1999)Carcinoma-associated fibroblasts direct tumor progression of initiated human
prostatic epithelium. Cancer research 59 (19):5002–5011
48. Ronnov-Jessen L, Petersen OW, Bissell MJ (1996) Cellular changes involved inconversion of normal to malignant breast: importance of the stromal reaction.
Physiological reviews 76 (1):69–12549. Filipits M, Rudas M, Jakesz R, Dubsky P, Fitzal F, et al. (2011) A new molecular
predictor of distant recurrence in ER-positive, HER2-negative breast cancer
adds independent information to conventional clinical risk factors. Clin CancerRes 17 (18):6012–6020. doi:10.1158/1078-0432.CCR-11-0926
50. Ma XJ, Wang Z, Ryan PD, Isakoff SJ, Barmettler A, et al. (2004) A two-geneexpression ratio predicts clinical outcome in breast cancer patients treated with
tamoxifen. Cancer cell 5 (6):607–616. doi:10.1016/j.ccr.2004.05.01551. Sampaio JL, Gerl MJ, Klose C, Ejsing CS, Beug H, et al. (2011) Membrane
lipidome of an epithelial cell line. Proceedings of the National Academy of
Sciences of the United States of America 108 (5):1903–1907. doi:10.1073/pnas.1019267108
52. Dehdashti F, Mortimer JE, Trinkaus K, Naughton MJ, Ellis M, et al. (2009)PET-based estradiol challenge as a predictive biomarker of response to
endocrine therapy in women with estrogen-receptor-positive breast cancer.
Breast Cancer Res Treat 113 (3):509–517. doi:10.1007/s10549-008-9953-053. Hutcheson IR, Knowlden JM, Madden TA, Barrow D, Gee JM, et al. (2003)
Oestrogen receptor-mediated modulation of the EGFR/MAPK pathway intamoxifen-resistant MCF-7 cells. Breast Cancer Res Treat 81 (1):81–93.
doi:10.1023/A:102548490838054. Iorio MV, Ferracin M, Liu CG, Veronese A, Spizzo R, et al. (2005) MicroRNA
gene expression deregulation in human breast cancer. Cancer research 65
(16):7065–7070. doi:10.1158/0008-5472.CAN-05-1783
55. McCubrey JA, Steelman LS, Abrams SL, Lee JT, Chang F, et al. (2006) Roles of
the RAF/MEK/ERK and PI3K/PTEN/AKT pathways in malignant trans-
formation and drug resistance. Adv Enzyme Regul 46:249–279. doi:10.1016/
j.advenzreg.2006.01.004
56. Al-Rakan MA, Colak D, Hendrayani SF, Al-Bakheet A, Al-Mohanna FH, et al.
(2013) Breast stromal fibroblasts from histologically normal surgical margins are
pro-carcinogenic. The Journal of pathology. doi:10.1002/path.4256
57. Pontiggia O, Sampayo R, Raffo D, Motter A, Xu R, et al. (2012) The tumor
microenvironment modulates tamoxifen resistance in breast cancer: a role for
soluble stromal factors and fibronectin through beta1 integrin. Breast Cancer
Res Treat 133 (2):459–471. doi:10.1007/s10549-011-1766-x
58. Tang R, Beuvon F, Ojeda M, Mosseri V, Pouillart P, et al. (1992) M-CSF
(monocyte colony stimulating factor) and M-CSF receptor expression by breast
tumour cells: M-CSF mediated recruitment of tumour infiltrating monocytes?
J Cell Biochem 50 (4):350–356. doi:10.1002/jcb.240500403
59. Ward A, Balwierz A, Zhang JD, Kublbeck M, Pawitan Y, et al. (2013) Re-
expression of microRNA-375 reverses both tamoxifen resistance and accompa-
nying EMT-like properties in breast cancer. Oncogene 32 (9):1173–1182.
doi:onc2012128 [pii] 10.1038/onc.2012.128
60. Bergamaschi A, Christensen BL, Katzenellenbogen BS (2011) Reversal of
endocrine resistance in breast cancer: interrelationships among 14-3-3zeta,
FOXM1, and a gene signature associated with mitosis. Breast cancer research:
BCR 13 (3):R70. doi:10.1186/bcr2913
61. Frasor J, Chang EC, Komm B, Lin CY, Vega VB, et al. (2006) Gene expression
preferentially regulated by tamoxifen in breast cancer cells and correlations with
clinical outcome. Cancer research 66 (14):7334–7340. doi:10.1158/0008-
5472.CAN-05-4269
62. Dennis G, Jr., Sherman BT, Hosack DA, Yang J, Gao W, et al. (2003) DAVID:
Database for Annotation, Visualization, and Integrated Discovery. Genome
biology 4 (5):P3
63. Reddy RK, Bhargava R (2010) Accurate histopathology from low signal-to-noise
ratio spectroscopic imaging data. Analyst 135 (11):2818–2825. doi:10.1039/
c0an00350f
64. Gazi E, Dwyer J, Gardner P, Ghanbari-Siahkali A, Wade AP, et al. (2003)
Applications of Fourier transform infrared microspectroscopy in studies of
benign prostate and prostate cancer. A pilot study. The Journal of pathology 201
(1):99–108. doi:10.1002/path.1421
65. Keith FN, Reddy RK, Bhargava R Practical protocols for fast histopathology by
Fourier transform infrared spectroscopic imaging. In, 2008. pp 685306-685306-
685310
66. Walsh MJ, Hammiche A, Fellous TG, Nicholson JM, Cotte M, et al. (2009)
Tracking the cell hierarchy in the human intestine using biochemical signatures
derived by mid-infrared microspectroscopy. Stem cell research 3 (1):15–27.
doi:10.1016/j.scr.2009.02.003
67. Walsh MJ, Kajdacsy-Balla A, Holton SE, Bhargava R (2012) Attenuated total
reflectance Fourier-transform infrared spectroscopic imaging for breast histopa-
thology. Vibrational Spectroscopy 60:23–28. doi:10.1016/j.vibspec.2012.01.010
68. Wood BR, Chiriboga L, Yee H, Quinn MA, McNaughton D, et al. (2004)
Fourier transform infrared (FTIR) spectral mapping of the cervical transforma-
tion zone, and dysplastic squamous epithelium. Gynecologic oncology 93 (1):59–
68. doi:10.1016/j.ygyno.2003.12.028
Integration of Molecular Profiling and Chemical Imaging
PLOS ONE | www.plosone.org 13 May 2014 | Volume 9 | Issue 5 | e96878