.. ~"'''., jv::.",mo - Batangas Medical Center Official Website
Upload
lpubatangasCategory
view
0download
0
Asia Pacific Journal of Multidisciplinary Research | Vol. 1, No. 1 | December 2013 _____________________________________________________________________________________________
105 ISSN 2350 – 7756 www.apjmr.com
TI-NSPIRE CX Graphing Calculator: Enhancing Students’ Performance in
Mathematics Learning
Nor’ain Mohd. Tajudin1 & Noraini Idris
2
1 Mathematics Department, Faculty of Science and Mathematics
2 Deputy Vice Chancellor‟s Office (Research & Innovation)
Sultan Idris Education University
35900 Tanjong Malim, Perak
MALAYSIA
ABSTRACT
Graphing calculators have become one of the most widely adopted
technologies in mathematics education that have a powerful potential to help
students master important mathematical concepts because they provide specific
functionalities that are valuable for mathematics learning. The objective of this
study is to compare the effect between the TI-Nspire CX graphing calculator (GC)
strategy group and conventional instructional (CI) strategy group on students’
performance in learning Straight Lines and Statistics topics. This study employed
the quasi-experimental nonequivalent control-group pretest posttest design. The
samples of the study are two intact Form Four classes from four selected
secondary schools in Perak and Selangor. For each school, one of the classes
served as the experimental group (GC strategy group) while the other class
served as the control group (CI strategy group). The total number of students in
the sample is 96 in the control group and 111 in the experimental group.There
are two instruments used in this study namely The Straight Lines and Statistics
Achievement Tests to assess students’ performance on the Straight Lines and
Statistics topics. Statistical inferences tests such as the independent t-test and
ANCOVA were used to analyze the data. The results showed that students in the
experimental group from all schools had significantly better scores in both tests
than those from the control group. Integrating the use of TI-Nspire graphing
calculators can be beneficial for students as this instructional strategy has proven
to improve students’ performance. Furthermore, TI-Nspire has the potential to be
a tool in promoting higher level mathematical thinking that encompasses
mathematical problems solving, reasoning and mathematical exploration.
Keywords: TI-Nspire graphing calculator strategy, Conventional Instructional
strategy, Students‟ performance, Straight Lines and Statistics topics
I. INTRODUCTION
The increased use of technology and the
changing demands of the workplace have
changed the nature of mathematics instructions
since the last few years. There is a need to
develop students that can survive in today‟s
society of technology. This requires highly
skilled workers; able to apply their
mathematical knowledge which includes and

Asia Pacific Journal of Multidisciplinary Research | Vol. 1, No. 1 | December 2013 _____________________________________________________________________________________________
106 ISSN 2350 – 7756 www.apjmr.com
goes beyond the simple skills of solving
complex problems. Indeed, the National
Council of Teachers of Mathematics (NCTM)
(1989) reflects a shift in the changing
importance of thinking and problem solving in
school. The vision of the recommendation by
the NCTM (2000) is learning mathematics
with understanding it. In fact, this learning
environment is the ultimate goal of many
research and implementation efforts in
mathematics education (Hiebert & Carpenter
1992). According to Hiebert and Carpenter
(1992), students who learn mathematics with
understanding will retain what they learn and
transfer it to novel situation. Thus, parallel
with the growing influence of technological
advancement, there is a need for a curriculum
that can develop the mathematical power of
students. This involves a shift from a
curriculum dominated by memorization of
isolated facts and procedures to one that
emphasizes on conceptual understanding and
mathematical problem solving.
ICT development should provide an added
value to the teaching strategies, because many
studies have showed the effectiveness of ICT
in enhancing teaching and learning process
(Johnson 2004; Noraini 2006, Noraini & Chew
Cheng Meng, 2011; Nor‟ain, Rohani, Wan
Zah & Mohd Majid 2009, 2011). With the
advent of ICT development incentives in
education through the Education Development
2001-2010 (Ministry of Education, 2001), the
level of development of the Malaysian
education should accordingly recorded an
increase and be on the right track towards
producing a generation of high-skilled by the
year 2020. However, reports of student‟s
achievement in the Trends in International
Mathematics and Science Study (TIMSS)(
Mullis, Martin, Robitaille & Foy 2009; Mullis,
Martin, Foy & Arora 2012) showed a decline
in the results. TIMSS analysis found that the
achievement still lags that of Malaysia Asian
Nations partners such as Japan, Hong Kong,
Korea, Taipei and Singapore. Malaysia's
ranking fell from 10th (2003), down to the
20th (2007) and recently (2011) continues to
decrease to number 26. This report describes
the existence of shortcomings in managing the
development of mathematics education at the
school level in Malaysia. Our students were
also found to be able to use basic mathematical
knowledge in straightforward situations,
however they are not capable of solving more
complex problems, as well as having a low
level of reasoning.
TIMSS reports (Mullis, Martin, Robitaille
& Foy 2009; Mullis, Martin, Foy & Arora
2012) also showed teachers in Malaysia
normally prefer teacher-centered approach
namely the 'chalk-and-talk" in the explaining
and elaboration of the principles, theories,
definitions and concepts. It also demonstrated
that they adopt a passive lecture teaching style
with textbooks as the primary source in their
teaching practices. Students too still make the
teacher as dominant learning center. In
addition, recently research by AKEPT
(Ministry of Education, 2013) found that 50%
of the teachers observed failed to deliver their
lessons effectively, particularly to inculcate
higher order thinking skills. This report seems
to show science and mathematics teachers in
Malaysia are not creative and less able to
implement quality teaching in order to
maximize student learning. In fact it seems
that the ICT planned initiatives over the past
decade failed to achieve its goals and increase
student success. Despite years of educational
development and innovations, it would seem
that a lot more needs to be done to improve the
mathematics performance among Malaysian
secondary school students. New instructional
methods or techniques should be attempted if
improvements are to be forthcoming.
The use of graphing calculators in teaching
and learning enable various kinds of guided
explorations to be undertaken. For example,
students can investigate the effects of changing
parameters of a function on the shape of its
graph. They can also explore the relationships
Asia Pacific Journal of Multidisciplinary Research | Vol. 1, No. 1 | December 2013 _____________________________________________________________________________________________
107 ISSN 2350 – 7756 www.apjmr.com
between gradients of pairs of lines and the
lines themselves. These activities would have
been too difficult to attempt without
technology. Exploratory activity in
mathematics may facilitate an active approach
to learning as opposed to a passive approach
where students just sit back passively listening
to the teacher. This creates an enthusiastic
learning environment. This clearly shows the
application of constructivist learning
environment.
Graphing calculators offer a method of
performing computations and algebraic
manipulations that is more efficient and
precise than paper-and-pencil method alone.
Examples include finding the solutions of
simultaneous equations or determine the
equation of a straight line that is passing
through two points. The mathematical
concepts underpinning those procedures are
rich and important for understanding.
However, students often seem to put more
effort in calculation and correspondingly less
to making sense of the problems. Both
attention to concepts and skill would be
desirable in mathematics learning. Rather than
just development of mechanical and
computational skills, graphing calculators also
allow for cultivation of analytical adeptness
and proficiency in complex thought process.
Problems representing real-world situation and
data with complicated numbers can also be
addressed. This would offer new opportunities
for students to encounter mathematical ideas
not in the curriculum at present. With
appropriate use of graphing calculator,
students can avoid time-consuming, tedious
procedures and devote a great deal of time
concentrating on understanding concepts,
developing higher order thinking skills, and
learning relevant applications. In addition to
paper-and-pencil, mental and estimation skills,
the graphing calculator assists student to
execute the procedures necessary to
understand and apply mathematics.
There is strong support from mathematics
educators and professional mathematics
organizations for increasing the use of the
graphing calculator in mathematics learning.
As this technology is commonplace in
classroom, the impact of this usage on the
students‟ understanding of mathematical
concepts within a particular course must be
considered. Kastberg and Leatheam (2005) in
reporting a research studies on the use of
graphing calculator up to this time, argue that
the maximum potential for this technology has
not been explored. Those studies provide a
starting point for more efforts to better
understand the methods to effectively use the
technology in the classroom. Thus, further
rigorous research is needed. This study
directly responds to the need for empirical
evidence regarding the effects of integrating
the use of graphing calculator, specifically the
TI-Nspire CX graphing calculator in
mathematics instruction at the Malaysian
secondary school level. Specifically, this study
seeks to compare the effect between the GC
strategy group and conventional instructional
(CI) strategy group on students‟ performance
in learning Straight Lines and Statistics topics.
This study is designed to test the following
hypothesis: There is no significant difference
in the mean test performance in the learning of
Straight Lines and Statistics topics between the
GC strategy group and CI strategy group.
II. MATERIALS AND METHOD
This study employed the quasi-
experimental nonequivalent control-group
pretest posttest design. Figure 1 shows the
diagrammatic representation of the
nonequivalent control-group pretest posttest
design. An X indicates an experimental
treatment, and a “dash” indicates no
experimental treatment. The O1s indicate the
measurements made during the pretest while
the O2s indicate the measurements made
during the posttest. A pre test and post test was
Asia Pacific Journal of Multidisciplinary Research | Vol. 1, No. 1 | December 2013 _____________________________________________________________________________________________
108 ISSN 2350 – 7756 www.apjmr.com
administered to both the control and
experimental groups. The experimental group
underwent an intervention where they learnt
mathematics using the TI-Nspire CX graphing
calculator for four weeks while the control
group on the other hand learnt mathematics
using conventional learning method.
Group Pretest Treatment
Posttest
Experimental O1 X O2
Control O1 - O2
Figure 1
Research Design of the Study
The samples of the study are two intact
Form Four classes from two secondary schools
in Perak and Selangor. These classes were
selected by the teachers as the students are at
the same level of achievement based on their
previous school examination results. For each
school, one of the classes served as the
experimental group (GC strategy group) while
the other class served as the control group (CI
strategy group). The total number of students
in the sample is 96 in the control group and
111 in the experimental group from the four
public secondary schools.
There are two instruments used in this
study as follows to assess students‟
performance on the Straight Lines and
Statistics topics:
i. The Straight Lines Achievement
Test (SLAT), and
ii. The Statistics Achievement Test
(SAT)
The SLAT and SAT tests are designed by
the researcher to measure students‟
performance on the Straight Lines and
Statistics topics. Initially, a test specification
table for both SLAT and SAT is prepared by
the researcher incorporating the different
levels of ability or achievement according to
Blooms Taxonomy (Bloom, 1989).
Furthermore, it was constructed based on the
Form Four Malaysian mathematics syllabus
and the Form Four Malaysian mathematics
textbooks. It was a systematic formal test,
using a paper-and-pencil procedure and it
produced numerical scores. All the questions
are submitted to the validators for content
validation. The reliability index of Cronbach‟s
coefficient alpha for both instruments was
determined to be 0.70. Thus, the reliability of
both tests was considered sufficiently
acceptable.
The data collection instruments for this
study were in the form of pretest and post-test.
The teachers in the four schools were provided
with the TI-Nspire CX graphic calculators and
teaching modules for the topics Statistics and
Straight Lines. They were briefed on how to
use the teaching modules as well as administer
the various data collection instruments. The
students were divided into two groups, control
group and experimental group. Before the
treatment which involved the use of graphic
calculators was administered onto the
experimental group, the teachers administered
the Straight Lines and Statistics Achievement
Test to assess students‟ performance on the
Straight Lines and Statistics topics to both
control and experimental groups. Lessons
using the graphic calculators were videotaped.
Upon completion of the treatment, the teachers
once again administered the Straight Lines and
Statistics Achievement Test to assess students‟
performance on the Straight Lines and
Statistics topics. This provided the researchers
with post-test data.
The data collected from the research
instruments was analyzed quantitatively to
answer the research questions. Data obtained
from the pre test and post test of Straight Lines
Achievement (SLAT) and Statistics
Achievement Test (SAT). Exploratory were
analyzed using the descriptive and inferential
statistics. The statistical analysis software
SPSS was utilised to calculate the mean and
standard deviation of the scores from the

Asia Pacific Journal of Multidisciplinary Research | Vol. 1, No. 1 | December 2013 _____________________________________________________________________________________________
109 ISSN 2350 – 7756 www.apjmr.com
control and experimental groups of each
participating school. In this study, firstly, the
independent mean t-test was conducted on the
SLAT and SAT scores to determine if the
difference between the experimental group and
the control group of each participating schools
prior to the intervention is significant or not
significant.
If the tests show that the difference
between the two groups prior to the treatment
is not significant, then the independent mean t-
test will be conducted on the scores of the post
– SLAT and SAT tests of each participating
schools to determine whether the difference
between the experimental group and the
control group after the treatment is significant
or not significant. If the tests show that the
difference between the two groups prior to the
treatment are significant, then the ANCOVA
test will be conducted on the scores of the post
– SLAT and SAT tests of each participating
schools to determine whether the difference
between the experimental group and the
control group after the treatment is significant
or not significant. The ANCOVA is used in
this case as it will make correction to the
difference that existed between the
experimental and control groups prior to
treatment so that the difference observed
between the experimental and control groups
after treatment is only due to the treatment and
not because of the difference that existed
between the two groups earlier. The use of the
ANCOVA will also enable the study to
determine whether the difference between the
experimental and control groups after the
treatment is significant or not significant.
III. RESULTS
Students‟ achievement was measured by
the overall test performance in the Straight
Line Achievement Test (SLAT) and Statistics
Achievement Test (SAT). Both tests were
systematic formal tests, using a paper-and-
pencil procedure and it produced numerical
scores. The total test performance for the
SLAT was 30, meanwhile the total test
performance for the SAT was 34. The test was
conducted in the four sample schools twice,
firstly as a pretest before the study and again
as a posttest at the end of the study. The results
are tabulated in Table 1 to 7.
TABLE 1
School A, Perak
Mean, Standard Deviation and t-Values for Both Groups
Test Group N Mean s.d t-value p-value
Straight Line
Achievement
(SLAT)
Pretest Experimental 25
25
4.16
1.80
2.66
2.29 2.264 .002 Control
Statistics
Achievement
(SAT)
Pretest Experimental 25
25
10.08
15.44
4.56
4.29 -4.278 .000 Control
Table 1 shows the means and standard
deviations for pre-SLAT and SAT test for both
experimental and control groups for School A,
Perak. The results show that in pre- SLAT test,
the control group had a mean score of 1.80
(standard deviation = 2.29) and the
experimental group had a mean of 4.16
(standard deviation = 2.66). The computed t-
value between the pretests of the control and
experimental group is 2.264 at p =.002.
Hypothesis testing shows that this value is
significant at p < 0.05. This means that the
Asia Pacific Journal of Multidisciplinary Research | Vol. 1, No. 1 | December 2013 _____________________________________________________________________________________________
110 ISSN 2350 – 7756 www.apjmr.com
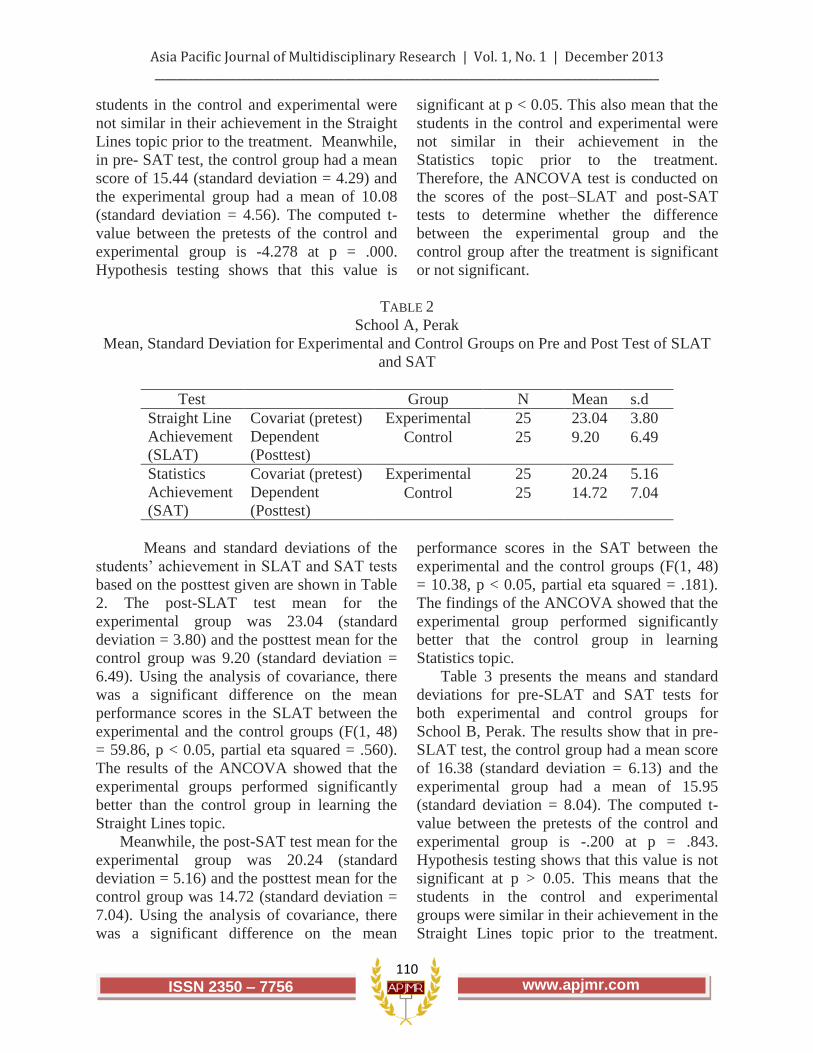
students in the control and experimental were
not similar in their achievement in the Straight
Lines topic prior to the treatment. Meanwhile,
in pre- SAT test, the control group had a mean
score of 15.44 (standard deviation = 4.29) and
the experimental group had a mean of 10.08
(standard deviation = 4.56). The computed t-
value between the pretests of the control and
experimental group is -4.278 at p = .000.
Hypothesis testing shows that this value is
significant at p < 0.05. This also mean that the
students in the control and experimental were
not similar in their achievement in the
Statistics topic prior to the treatment.
Therefore, the ANCOVA test is conducted on
the scores of the post–SLAT and post-SAT
tests to determine whether the difference
between the experimental group and the
control group after the treatment is significant
or not significant.
TABLE 2
School A, Perak
Mean, Standard Deviation for Experimental and Control Groups on Pre and Post Test of SLAT
and SAT
Test Group N Mean s.d
Straight Line
Achievement
(SLAT)
Covariat (pretest)
Dependent
(Posttest)
Experimental 25 23.04 3.80
Control 25 9.20 6.49
Statistics
Achievement
(SAT)
Covariat (pretest)
Dependent
(Posttest)
Experimental 25 20.24 5.16
Control 25 14.72 7.04
Means and standard deviations of the
students‟ achievement in SLAT and SAT tests
based on the posttest given are shown in Table
2. The post-SLAT test mean for the
experimental group was 23.04 (standard
deviation = 3.80) and the posttest mean for the
control group was 9.20 (standard deviation =
6.49). Using the analysis of covariance, there
was a significant difference on the mean
performance scores in the SLAT between the
experimental and the control groups (F(1, 48)
= 59.86, p < 0.05, partial eta squared = .560).
The results of the ANCOVA showed that the
experimental groups performed significantly
better than the control group in learning the
Straight Lines topic.
Meanwhile, the post-SAT test mean for the
experimental group was 20.24 (standard
deviation = 5.16) and the posttest mean for the
control group was 14.72 (standard deviation =
7.04). Using the analysis of covariance, there
was a significant difference on the mean
performance scores in the SAT between the
experimental and the control groups (F(1, 48)
= 10.38, p < 0.05, partial eta squared = .181).
The findings of the ANCOVA showed that the
experimental group performed significantly
better that the control group in learning
Statistics topic.
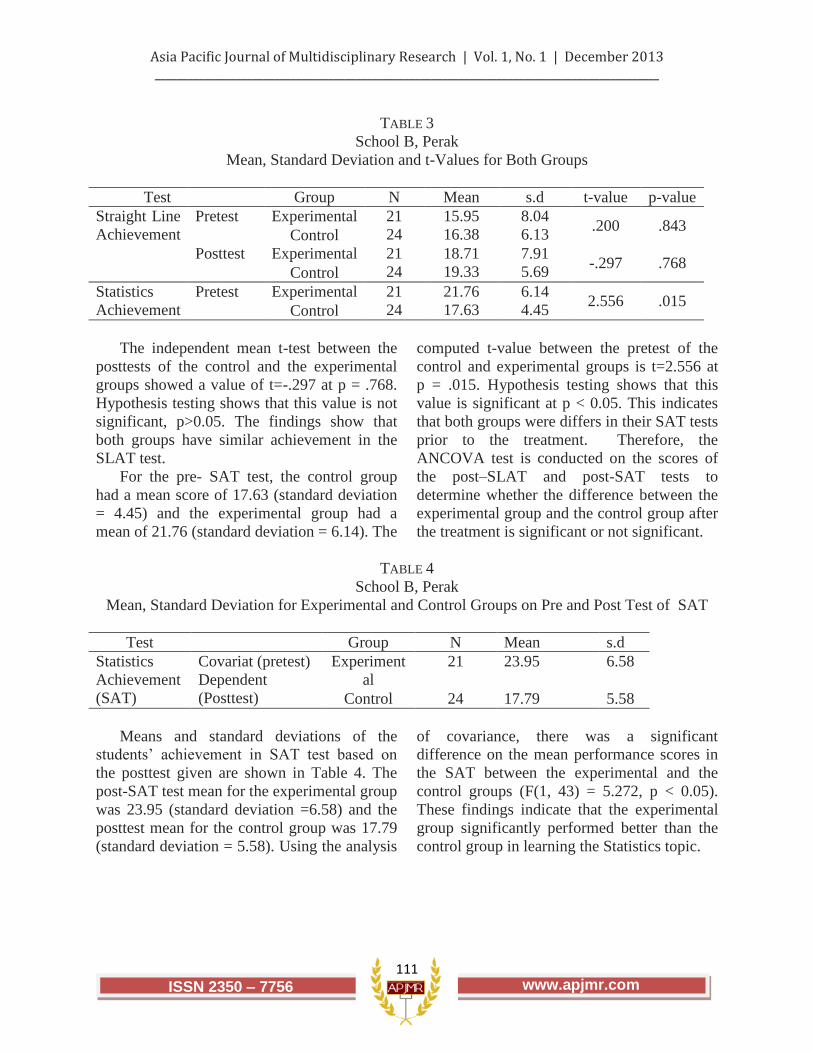
Table 3 presents the means and standard
deviations for pre-SLAT and SAT tests for
both experimental and control groups for
School B, Perak. The results show that in pre-
SLAT test, the control group had a mean score
of 16.38 (standard deviation = 6.13) and the
experimental group had a mean of 15.95
(standard deviation = 8.04). The computed t-
value between the pretests of the control and
experimental group is -.200 at p = .843.
Hypothesis testing shows that this value is not
significant at p > 0.05. This means that the
students in the control and experimental
groups were similar in their achievement in the
Straight Lines topic prior to the treatment.
Asia Pacific Journal of Multidisciplinary Research | Vol. 1, No. 1 | December 2013 _____________________________________________________________________________________________
111 ISSN 2350 – 7756 www.apjmr.com
TABLE 3
School B, Perak
Mean, Standard Deviation and t-Values for Both Groups
Test Group N Mean s.d t-value p-value
Straight Line
Achievement
Pretest Experimental 21
24
15.95
16.38
8.04
6.13 .200 .843
Control
Posttest Experimental 21
24
18.71
19.33
7.91
5.69 -.297 .768
Control
Statistics
Achievement
Pretest Experimental 21
24
21.76
17.63
6.14
4.45 2.556 .015
Control
The independent mean t-test between the
posttests of the control and the experimental
groups showed a value of t=-.297 at p = .768.
Hypothesis testing shows that this value is not
significant, p>0.05. The findings show that
both groups have similar achievement in the
SLAT test.
For the pre- SAT test, the control group
had a mean score of 17.63 (standard deviation
= 4.45) and the experimental group had a
mean of 21.76 (standard deviation = 6.14). The
computed t-value between the pretest of the
control and experimental groups is t=2.556 at
p = .015. Hypothesis testing shows that this
value is significant at p < 0.05. This indicates
that both groups were differs in their SAT tests
prior to the treatment. Therefore, the
ANCOVA test is conducted on the scores of
the post–SLAT and post-SAT tests to
determine whether the difference between the
experimental group and the control group after
the treatment is significant or not significant.
TABLE 4
School B, Perak
Mean, Standard Deviation for Experimental and Control Groups on Pre and Post Test of SAT
Test Group N Mean s.d
Statistics
Achievement
(SAT)
Covariat (pretest)
Dependent
(Posttest)
Experiment
al
21 23.95 6.58
Control 24 17.79 5.58
Means and standard deviations of the
students‟ achievement in SAT test based on
the posttest given are shown in Table 4. The
post-SAT test mean for the experimental group
was 23.95 (standard deviation =6.58) and the
posttest mean for the control group was 17.79
(standard deviation = 5.58). Using the analysis
of covariance, there was a significant
difference on the mean performance scores in
the SAT between the experimental and the
control groups (F(1, 43) = 5.272, p < 0.05).
These findings indicate that the experimental
group significantly performed better than the
control group in learning the Statistics topic.
Asia Pacific Journal of Multidisciplinary Research | Vol. 1, No. 1 | December 2013 _____________________________________________________________________________________________
112 ISSN 2350 – 7756 www.apjmr.com
TABLE 5
School C, Federal Territory of Kuala Lumpur
Mean, Standard Deviation and t-Values for Both Groups
Test Group N Mean s.d t-value p-value
Straight Line
Achievement
(SLAT)
Pretest Experimental 14
17
13.14
4.06
6.49
2.30
4.984
0.000 Control
Statistics
Achievement
(SAT)
Pretest Experimental 19
21
7.89
9.62
3.60
4.24 -1.379 .176 Control
Posttest Experimental 19
21
14.32
15.33
8.27
7.86 -.399 .692
Control
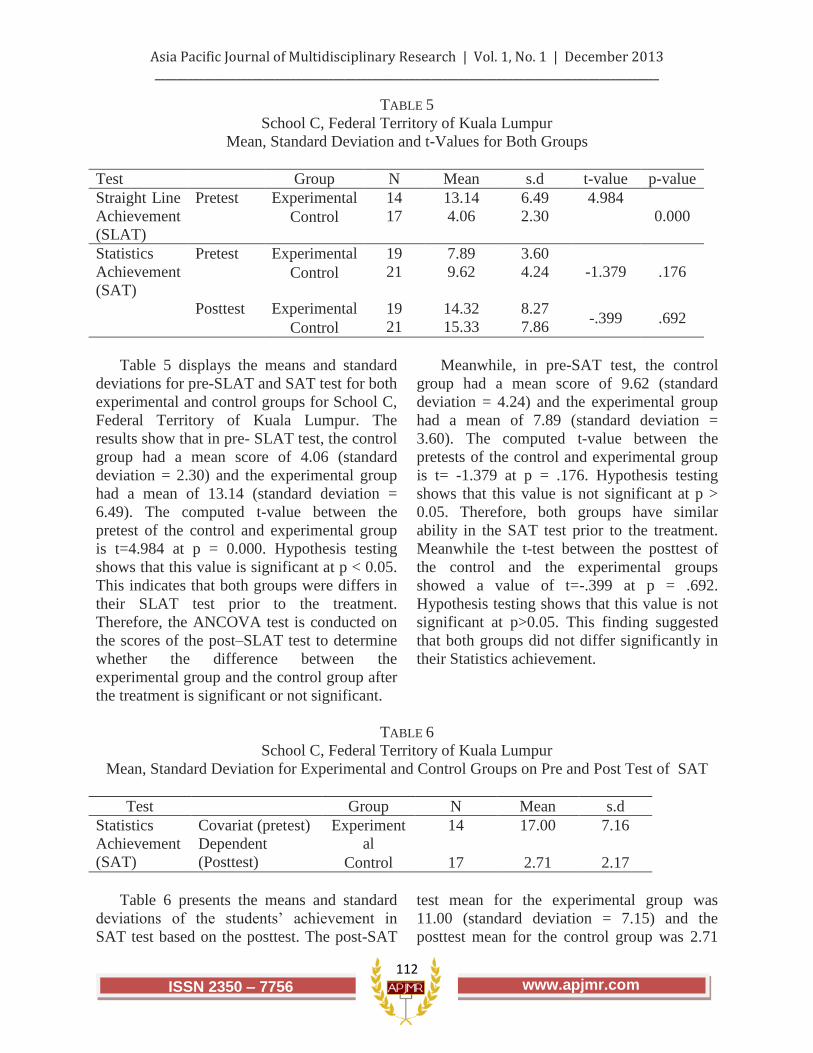
Table 5 displays the means and standard
deviations for pre-SLAT and SAT test for both
experimental and control groups for School C,
Federal Territory of Kuala Lumpur. The
results show that in pre- SLAT test, the control
group had a mean score of 4.06 (standard
deviation = 2.30) and the experimental group
had a mean of 13.14 (standard deviation =
6.49). The computed t-value between the
pretest of the control and experimental group
is t=4.984 at p = 0.000. Hypothesis testing
shows that this value is significant at p < 0.05.
This indicates that both groups were differs in
their SLAT test prior to the treatment.
Therefore, the ANCOVA test is conducted on
the scores of the post–SLAT test to determine
whether the difference between the
experimental group and the control group after
the treatment is significant or not significant.
Meanwhile, in pre-SAT test, the control
group had a mean score of 9.62 (standard
deviation = 4.24) and the experimental group
had a mean of 7.89 (standard deviation =
3.60). The computed t-value between the
pretests of the control and experimental group
is t= -1.379 at p = .176. Hypothesis testing
shows that this value is not significant at p >
0.05. Therefore, both groups have similar
ability in the SAT test prior to the treatment.
Meanwhile the t-test between the posttest of
the control and the experimental groups
showed a value of t=-.399 at p = .692.
Hypothesis testing shows that this value is not
significant at p>0.05. This finding suggested
that both groups did not differ significantly in
their Statistics achievement.
TABLE 6
School C, Federal Territory of Kuala Lumpur
Mean, Standard Deviation for Experimental and Control Groups on Pre and Post Test of SAT
Test Group N Mean s.d
Statistics
Achievement
(SAT)
Covariat (pretest)
Dependent
(Posttest)
Experiment
al
14 17.00 7.16
Control 17 2.71 2.17
Table 6 presents the means and standard
deviations of the students‟ achievement in
SAT test based on the posttest. The post-SAT
test mean for the experimental group was
11.00 (standard deviation = 7.15) and the
posttest mean for the control group was 2.71
Asia Pacific Journal of Multidisciplinary Research | Vol. 1, No. 1 | December 2013 _____________________________________________________________________________________________
113 ISSN 2350 – 7756 www.apjmr.com
(standard deviation = 2.17). Using the analysis
of covariance, there was no significant
difference on the mean performance scores in
the SLAT between the experimental and the
control groups (F(1, 28) =47.40, p <0.05,
partial eta squared=.629 ). This finding
indicated that statistically there was a
significant difference in Straight Lines
achievement between the experimental and the
control groups where the experimental group
significantly performed better than the control
group in learning the Straight Lines topic.
TABLE 7
School D, Selangor
Mean, Standard Deviation and t-Values for Both Groups
Test Group N Mean s.d t-value p-value
Statistics
Achievement
Pretest Experimental 15
15
4.53
3.13
3.00
5.66 .847 .404 Control
Posttest Experimental 15
15
10.53
3.13
4.07
5.66 4.114 .000
Control
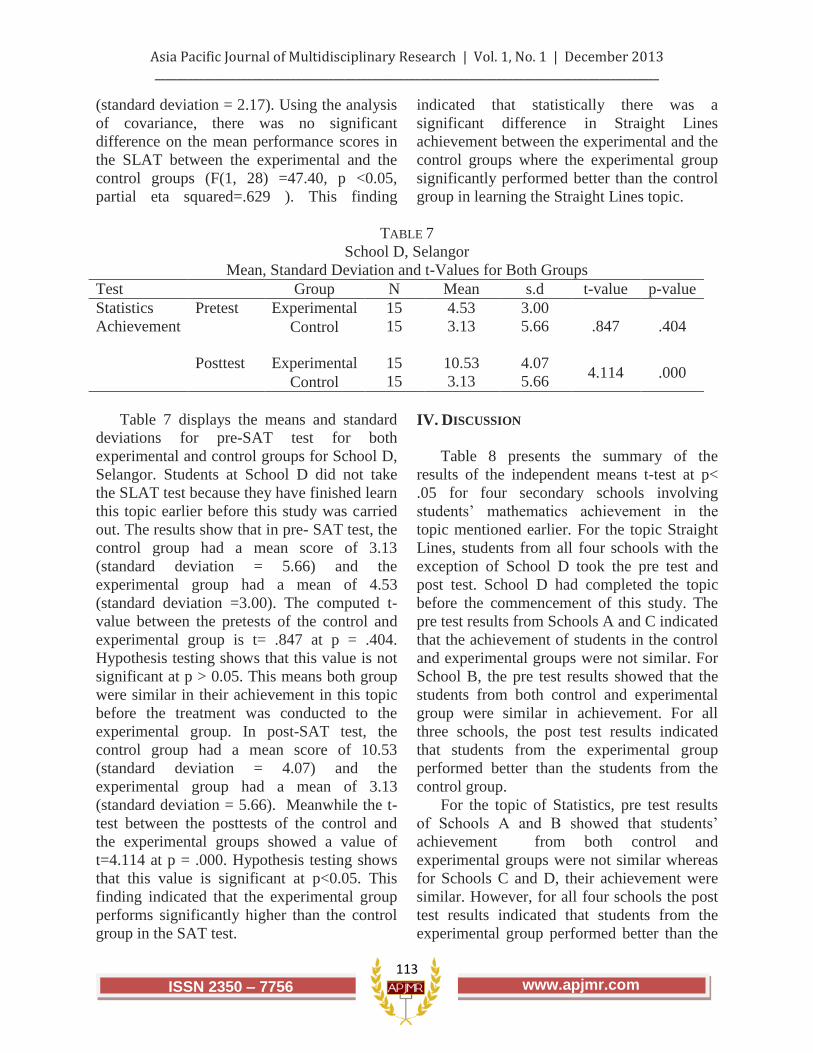
Table 7 displays the means and standard
deviations for pre-SAT test for both
experimental and control groups for School D,
Selangor. Students at School D did not take
the SLAT test because they have finished learn
this topic earlier before this study was carried
out. The results show that in pre- SAT test, the
control group had a mean score of 3.13
(standard deviation = 5.66) and the
experimental group had a mean of 4.53
(standard deviation =3.00). The computed t-
value between the pretests of the control and
experimental group is t= .847 at p = .404.
Hypothesis testing shows that this value is not
significant at p > 0.05. This means both group
were similar in their achievement in this topic
before the treatment was conducted to the
experimental group. In post-SAT test, the
control group had a mean score of 10.53
(standard deviation = 4.07) and the
experimental group had a mean of 3.13
(standard deviation = 5.66). Meanwhile the t-
test between the posttests of the control and
the experimental groups showed a value of
t=4.114 at p = .000. Hypothesis testing shows
that this value is significant at p<0.05. This
finding indicated that the experimental group
performs significantly higher than the control
group in the SAT test.
IV. DISCUSSION
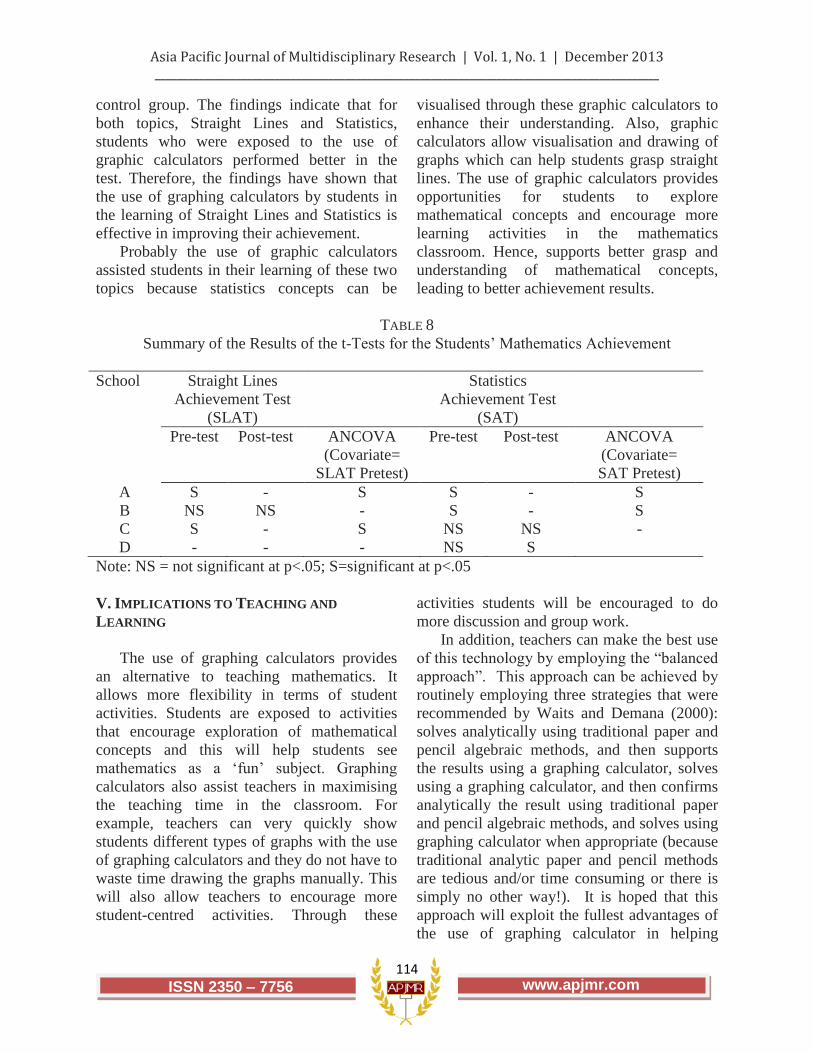
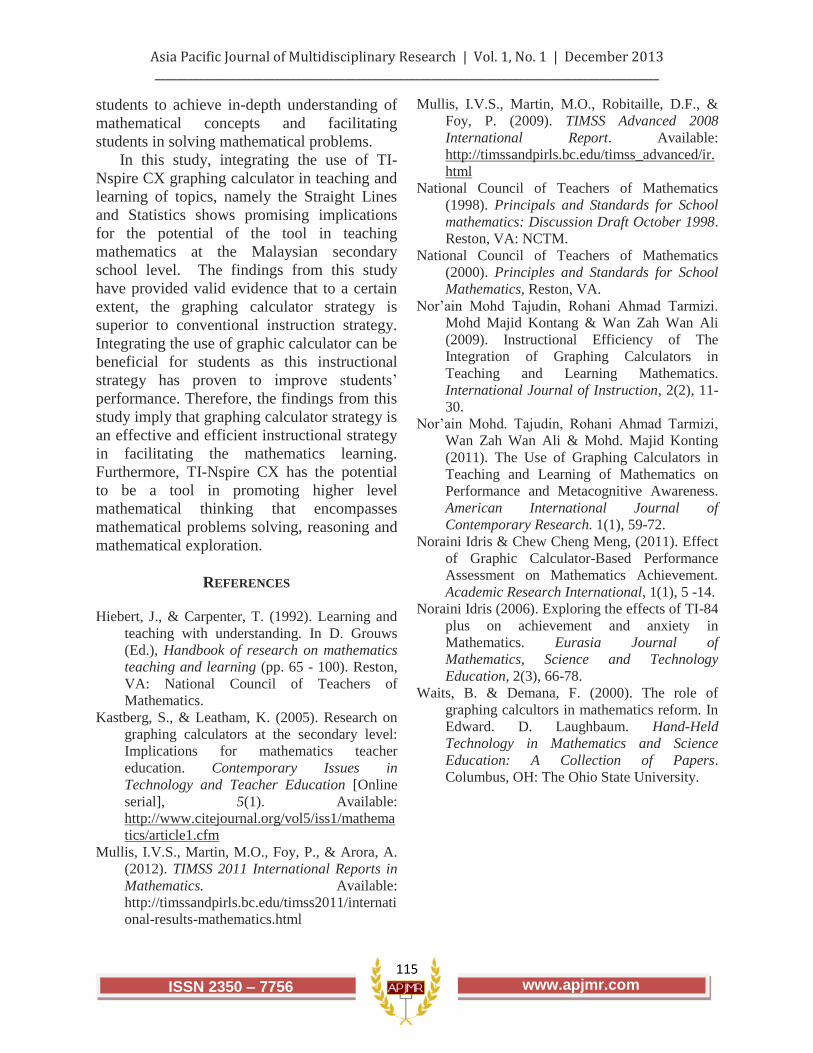
Table 8 presents the summary of the
results of the independent means t-test at p<
.05 for four secondary schools involving
students‟ mathematics achievement in the
topic mentioned earlier. For the topic Straight
Lines, students from all four schools with the
exception of School D took the pre test and
post test. School D had completed the topic
before the commencement of this study. The
pre test results from Schools A and C indicated
that the achievement of students in the control
and experimental groups were not similar. For
School B, the pre test results showed that the
students from both control and experimental
group were similar in achievement. For all
three schools, the post test results indicated
that students from the experimental group
performed better than the students from the
control group.
For the topic of Statistics, pre test results
of Schools A and B showed that students‟
achievement from both control and
experimental groups were not similar whereas
for Schools C and D, their achievement were
similar. However, for all four schools the post
test results indicated that students from the
experimental group performed better than the
Asia Pacific Journal of Multidisciplinary Research | Vol. 1, No. 1 | December 2013 _____________________________________________________________________________________________
114 ISSN 2350 – 7756 www.apjmr.com
control group. The findings indicate that for
both topics, Straight Lines and Statistics,
students who were exposed to the use of
graphic calculators performed better in the
test. Therefore, the findings have shown that
the use of graphing calculators by students in
the learning of Straight Lines and Statistics is
effective in improving their achievement.
Probably the use of graphic calculators
assisted students in their learning of these two
topics because statistics concepts can be
visualised through these graphic calculators to
enhance their understanding. Also, graphic
calculators allow visualisation and drawing of
graphs which can help students grasp straight
lines. The use of graphic calculators provides
opportunities for students to explore
mathematical concepts and encourage more
learning activities in the mathematics
classroom. Hence, supports better grasp and
understanding of mathematical concepts,
leading to better achievement results.
TABLE 8
Summary of the Results of the t-Tests for the Students‟ Mathematics Achievement
School Straight Lines
Achievement Test
(SLAT)
Statistics
Achievement Test
(SAT)
Pre-test Post-test ANCOVA
(Covariate=
SLAT Pretest)
Pre-test Post-test ANCOVA
(Covariate=
SAT Pretest)
A S - S S - S
B NS NS - S - S
C S - S NS NS -
D - - - NS S
Note: NS = not significant at p<.05; S=significant at p<.05
V. IMPLICATIONS TO TEACHING AND
LEARNING
The use of graphing calculators provides
an alternative to teaching mathematics. It
allows more flexibility in terms of student
activities. Students are exposed to activities
that encourage exploration of mathematical
concepts and this will help students see
mathematics as a „fun‟ subject. Graphing
calculators also assist teachers in maximising
the teaching time in the classroom. For
example, teachers can very quickly show
students different types of graphs with the use
of graphing calculators and they do not have to
waste time drawing the graphs manually. This
will also allow teachers to encourage more
student-centred activities. Through these
activities students will be encouraged to do
more discussion and group work.
In addition, teachers can make the best use
of this technology by employing the “balanced
approach”. This approach can be achieved by
routinely employing three strategies that were
recommended by Waits and Demana (2000):
solves analytically using traditional paper and
pencil algebraic methods, and then supports
the results using a graphing calculator, solves
using a graphing calculator, and then confirms
analytically the result using traditional paper
and pencil algebraic methods, and solves using
graphing calculator when appropriate (because
traditional analytic paper and pencil methods
are tedious and/or time consuming or there is
simply no other way!). It is hoped that this
approach will exploit the fullest advantages of
the use of graphing calculator in helping
Asia Pacific Journal of Multidisciplinary Research | Vol. 1, No. 1 | December 2013 _____________________________________________________________________________________________
115 ISSN 2350 – 7756 www.apjmr.com
students to achieve in-depth understanding of
mathematical concepts and facilitating
students in solving mathematical problems.
In this study, integrating the use of TI-
Nspire CX graphing calculator in teaching and
learning of topics, namely the Straight Lines
and Statistics shows promising implications
for the potential of the tool in teaching
mathematics at the Malaysian secondary
school level. The findings from this study
have provided valid evidence that to a certain
extent, the graphing calculator strategy is
superior to conventional instruction strategy.
Integrating the use of graphic calculator can be
beneficial for students as this instructional
strategy has proven to improve students‟
performance. Therefore, the findings from this
study imply that graphing calculator strategy is
an effective and efficient instructional strategy
in facilitating the mathematics learning.
Furthermore, TI-Nspire CX has the potential
to be a tool in promoting higher level
mathematical thinking that encompasses
mathematical problems solving, reasoning and
mathematical exploration.
REFERENCES
Hiebert, J., & Carpenter, T. (1992). Learning and
teaching with understanding. In D. Grouws
(Ed.), Handbook of research on mathematics
teaching and learning (pp. 65 - 100). Reston,
VA: National Council of Teachers of
Mathematics.
Kastberg, S., & Leatham, K. (2005). Research on
graphing calculators at the secondary level:
Implications for mathematics teacher
education. Contemporary Issues in
Technology and Teacher Education [Online
serial], 5(1). Available:
http://www.citejournal.org/vol5/iss1/mathema
tics/article1.cfm
Mullis, I.V.S., Martin, M.O., Foy, P., & Arora, A.
(2012). TIMSS 2011 International Reports in
Mathematics. Available:
http://timssandpirls.bc.edu/timss2011/internati
onal-results-mathematics.html
Mullis, I.V.S., Martin, M.O., Robitaille, D.F., &
Foy, P. (2009). TIMSS Advanced 2008
International Report. Available:
http://timssandpirls.bc.edu/timss_advanced/ir.
html
National Council of Teachers of Mathematics
(1998). Principals and Standards for School
mathematics: Discussion Draft October 1998.
Reston, VA: NCTM.
National Council of Teachers of Mathematics
(2000). Principles and Standards for School
Mathematics, Reston, VA.
Nor‟ain Mohd Tajudin, Rohani Ahmad Tarmizi.
Mohd Majid Kontang & Wan Zah Wan Ali
(2009). Instructional Efficiency of The
Integration of Graphing Calculators in
Teaching and Learning Mathematics.
International Journal of Instruction, 2(2), 11-
30.
Nor‟ain Mohd. Tajudin, Rohani Ahmad Tarmizi,
Wan Zah Wan Ali & Mohd. Majid Konting
(2011). The Use of Graphing Calculators in
Teaching and Learning of Mathematics on
Performance and Metacognitive Awareness.
American International Journal of
Contemporary Research. 1(1), 59-72.
Noraini Idris & Chew Cheng Meng, (2011). Effect
of Graphic Calculator-Based Performance
Assessment on Mathematics Achievement.
Academic Research International, 1(1), 5 -14.
Noraini Idris (2006). Exploring the effects of TI-84
plus on achievement and anxiety in
Mathematics. Eurasia Journal of
Mathematics, Science and Technology
Education, 2(3), 66-78.
Waits, B. & Demana, F. (2000). The role of
graphing calcultors in mathematics reform. In
Edward. D. Laughbaum. Hand-Held
Technology in Mathematics and Science
Education: A Collection of Papers.
Columbus, OH: The Ohio State University.
Copyright © 2022 FDOKUMEN