Integrating energy and land-use planning: socio-metabolic profiles along the rural–urban continuum...
32
Integrating energy and land-use planning: socio-metabolic profiles along the rural–urban continuum in Catalonia (Spain) Pere Ariza-Montobbio • Katharine N. Farrell • Gonzalo Gamboa • Jesus Ramos-Martin Received: 8 May 2013 / Accepted: 13 February 2014 / Published online: 4 April 2014 Ó Springer Science+Business Media Dordrecht 2014 Abstract Abandoning fossil fuels and increasingly relying on low-density, land-intensive renewable energy will increase demand for land, affecting current global and regional rural–urban relationships. Over the past two decades, rural–urban relationships all over the world have witnessed unprecedented changes that have rendered their boundaries blurred and have lead to the emergence of ‘‘new ruralities.’’ In this paper, we analyze the current profiles of electricity generation and consumption in relation to sociodemographic vari- ables related to the use of time and land across the territory of Catalonia, Spain. Through a clustering procedure based on multivariate statistical analysis, we found that electricity consumption is related to functional specialization in the roles undertaken by different types of municipalities in the urban system. Municipality types have distinctive metabolic profiles in different sectors depending on their industrial, services or residential role. Villages’ metabolism is influenced by urban sprawl and industrial specialization, reflecting current ‘‘new ruralities.’’ Segregation between work activity and residence increases both overall electricity consumption and its rate (per hour) and density (per hectare) of dissi- pation. A sustainable spatial organization of societal activities without the use of fossil fuels or nuclear energy would require huge structural and sociodemographic changes to reduce energy demand and adapt it to regionally available renewable energy. P. Ariza-Montobbio (&) FLACSO Ecuador - La Pradera, E7-174 y Av. Diego de Almagro-PBX, Quito, Ecuador e-mail: pariza@flacso.edu.ec; [email protected]; flacso@flacso.org.ec URL: http://www.flacso.org.ec P. Ariza-Montobbio Á K. N. Farrell Á G. Gamboa Á J. Ramos-Martin Institut de Cie `ncia i Tecnologia Ambientals, Universitat Auto `noma de Barcelona, Edifici C, 08193 Bellaterra (Cerdanyola del Valle `s), Barcelona, Spain K. N. Farrell Division of Resource Economics, Department of Agricultural Economics, Humboldt-Universita ¨t zu Berlin, Unter den Linden, 6, 10099 Berlin, Germany J. Ramos-Martin Departament d’Economia i d’Histo `ria Econo `mica, Universitat Auto `noma de Barcelona, EdificiB, 08193 Bellaterra (Cerdanyola del Valle `s), Barcelona, Spain 123 Environ Dev Sustain (2014) 16:925–956 DOI 10.1007/s10668-014-9533-x
Transcript of Integrating energy and land-use planning: socio-metabolic profiles along the rural–urban continuum...
Integrating energy and land-use planning:socio-metabolic profiles along the rural–urbancontinuum in Catalonia (Spain)
Pere Ariza-Montobbio • Katharine N. Farrell •
Gonzalo Gamboa • Jesus Ramos-Martin
Received: 8 May 2013 / Accepted: 13 February 2014 / Published online: 4 April 2014� Springer Science+Business Media Dordrecht 2014
Abstract Abandoning fossil fuels and increasingly relying on low-density, land-intensive
renewable energy will increase demand for land, affecting current global and regional
rural–urban relationships. Over the past two decades, rural–urban relationships all over the
world have witnessed unprecedented changes that have rendered their boundaries blurred
and have lead to the emergence of ‘‘new ruralities.’’ In this paper, we analyze the current
profiles of electricity generation and consumption in relation to sociodemographic vari-
ables related to the use of time and land across the territory of Catalonia, Spain. Through a
clustering procedure based on multivariate statistical analysis, we found that electricity
consumption is related to functional specialization in the roles undertaken by different
types of municipalities in the urban system. Municipality types have distinctive metabolic
profiles in different sectors depending on their industrial, services or residential role.
Villages’ metabolism is influenced by urban sprawl and industrial specialization, reflecting
current ‘‘new ruralities.’’ Segregation between work activity and residence increases both
overall electricity consumption and its rate (per hour) and density (per hectare) of dissi-
pation. A sustainable spatial organization of societal activities without the use of fossil
fuels or nuclear energy would require huge structural and sociodemographic changes to
reduce energy demand and adapt it to regionally available renewable energy.
P. Ariza-Montobbio (&)FLACSO Ecuador - La Pradera, E7-174 y Av. Diego de Almagro-PBX, Quito, Ecuadore-mail: [email protected]; [email protected]; [email protected]: http://www.flacso.org.ec
P. Ariza-Montobbio � K. N. Farrell � G. Gamboa � J. Ramos-MartinInstitut de Ciencia i Tecnologia Ambientals, Universitat Autonoma de Barcelona, Edifici C,08193 Bellaterra (Cerdanyola del Valles), Barcelona, Spain
K. N. FarrellDivision of Resource Economics, Department of Agricultural Economics, Humboldt-Universitat zuBerlin, Unter den Linden, 6, 10099 Berlin, Germany
J. Ramos-MartinDepartament d’Economia i d’Historia Economica, Universitat Autonoma de Barcelona, EdificiB,08193 Bellaterra (Cerdanyola del Valles), Barcelona, Spain
123
Environ Dev Sustain (2014) 16:925–956DOI 10.1007/s10668-014-9533-x
Keywords Energy metabolism � Electricity � MuSIASEM � Distributed
energy generation � Functional urban specialization � Renewable energy �Socio-metabolic profiles
1 Introduction
The end of cheap fossil energy and the growing consequences of climate change are setting
the scene for current and future political disputes about society’s transition toward
renewable energies (Abramsky 2010).
Abandoning fossil fuels and increasingly relying on dispersed and low power density
renewable energy will increase demand for land to generate energy (Scheidel and Sorman
2012; Smil 2008). The spatial dimensions of energy provision, previously externalized and
dismissed by the high-consuming global north, will regain importance affecting global and
regional rural–urban relationships.
Thanks to abundant fossil fuels, neoliberal globalization has brought about multi-
dimensional unprecedented changes in rural–urban relationships (Brereton et al. 2011;
Smith 2007). Growing networked interconnections and increased spatial mobility (Mars-
den 2009) have rendered the traditional boundaries between rural and urban areas more
blurry (Tacoli 2003). Diffuse urbanization, particularly in western industrialized societies,
has lead to the emergence of ‘‘new ruralities,’’ in terms of rural areas that increasingly
share urban features. The sustainability of such a rural–urban relationships based on fossil
fuels is, thus, directly related to the transition to renewable energies.
Most of modern renewable technologies generate electricity, which is claimed to be
versatile and ideal for managing uncertain future mobility (Gilbert and Perl 2010).
Growing debate has focused on desirable, feasible and efficient models of transforming
electrical grids. Combining advances in information and communication technology (ICT)
and in electrical grids design, ‘‘smart grids’’ are proposed to enable bidirectional com-
munication along with power flow between the consumer and the grid (Farhangi 2010;
Rifkin 2011; Usman and Shami 2013). Distributed energy generation has also been pre-
sented as a new paradigm to relocate generation and consumption of energy closer one
another (Ackermann et al. 2001; Alanne and Saari 2006; Pepermans et al. 2005). By
reducing overall consumption and environmental impacts, distributed generation empha-
sizes decentralization and small- and medium-size renewable power plants facilities.
The above literature on redesign of electrical grids is mainly concentrated on the
technical feasibility of implementing such technological systems. Although mentioning
environmental benefits for sustainable development, few references are made to the spatial
and sociodemographic reconfiguration they may imply or require. The promotion of such a
new paradigm means taking low-density and land-intensive renewable energy, as the basis
of the energy system. This requires careful consideration of both the spatial and social
distribution of present and future scenarios of energy consumption and their compatibility
with available renewable energy resources. In this paper, we aim to contribute to that work
by studying the present situation in Catalonia, Spain.
We analyze the current profiles of electricity generation and consumption in relation to
sociodemographic variables representing the use of time and land across the territory of
Catalonia for the year 2001, the most suitable date for obtaining all required data.1 Thus,
1 See Sect. 3, about methods for details.
926 P. Ariza-Montobbio et al.
123
we study profiles of ‘‘societal metabolism’’, understood as the set of conversions of energy
(and material) flows occurring within a society which are necessary for its continued
existence (Giampietro et al. 2009).
By identifying differences in land and time use and their associated energy flows within
the Catalonian region, we derive a typology of municipalities through a clustering pro-
cedure based on multivariate statistical analysis. This enables us to identify processes
explaining the relationship between spatial distribution of energy metabolic profiles and
sociodemographic structures and land uses. Comparison across this typology highlights the
relevance of urban sprawl and the related emergence of ‘‘new ruralities’’ typical of late-
industrial societies where villages are connected to urban centers through commuting.
Functional urban specialization in industrial, services or residential activities increases the
rate (per hour) and density (per hectare) of electricity consumption both in market and
household sectors and depends upon a centralized generation system.
After presenting details about the Catalonian case study and our methodological approach
in Sects. 2 and 3, we present in Sect. 4 the typology of municipalities and the metabolic
profiles it helped to identify. In Sect. 5, we discuss the main findings, identifying plausible
qualitative changes in urban densities and in urban hierarchy2 that could help with adjusting
current energy consumption profiles to increase their compatibility with a distributed energy
system. We close, in Sect. 6, with a set of reflections on the strengths and weaknesses of the
approach employed here and provide some recommendations for future work.
2 Background: urbanization and the spatial dimension of Catalonia’s energymetabolism
Catalonia (see Fig. 1) is one of the most densely populated, urbanized and industrialized
regions of Spain. With a population of 7.5 million, it represents 16 % of the Spanish
population (INE 2012) and it accounted for 18.7 % of total GDP (INE 2007) as well as for
19 % of primary energy consumption in Spain in 2009 (ICAEN 2009; IEA 2012).
Regarding electricity, Catalonia accounts for 20 % of total consumption in Spain, thus
being the largest electricity consumer in Spain (REE 2010).
Several studies have shown the influence of different socioeconomic sectors in driving
the high energy demand of Spain and Catalonia, highlighting the importance of the
transport and residential sectors (Alcantara and Duarte 2004; Alcantara and Padilla 2003;
Ramos-Martın (Coord.) 2009; Ramos-Martın et al. 2009; Roca and Alcantara 2001).
Growing energy consumption in the market economic sectors has been used for employing
a larger active population in low labor productivity activities such as construction and
services3 (Ramos-Martin et al. 2009). The household sector, meanwhile, has increased its
energy consumption due to: (1) Catalonia’s convergence with European material standard
of living and (2) the increase on the total number of households (31 % growth between
1981 and 2001) which reflects not only population growth but also structural change from
2 Throughout the paper, we refer to urban hierarchy as the structure of the network of cities in terms of therelative socioeconomic and demographic importance of the group of cities that form the urban system andtheir relationships. Thus, the urban hierarchy of an urban system based on polycentric compact mediumsized cities and villages with mixed uses is qualitatively different than that of a central big city, surroundedby a dispersed conurbation of a low-density mono-functional urban sprawl.3 High correlation between energy consumption and GDP, in Catalonia and Spain, as in many other westernindustrialized countries explains why growing GDP, despite low productivity of labor, has led to growingenergy consumption, see Ramos-Martın et al. 2009.
Integrating energy and land-use planning 927
123
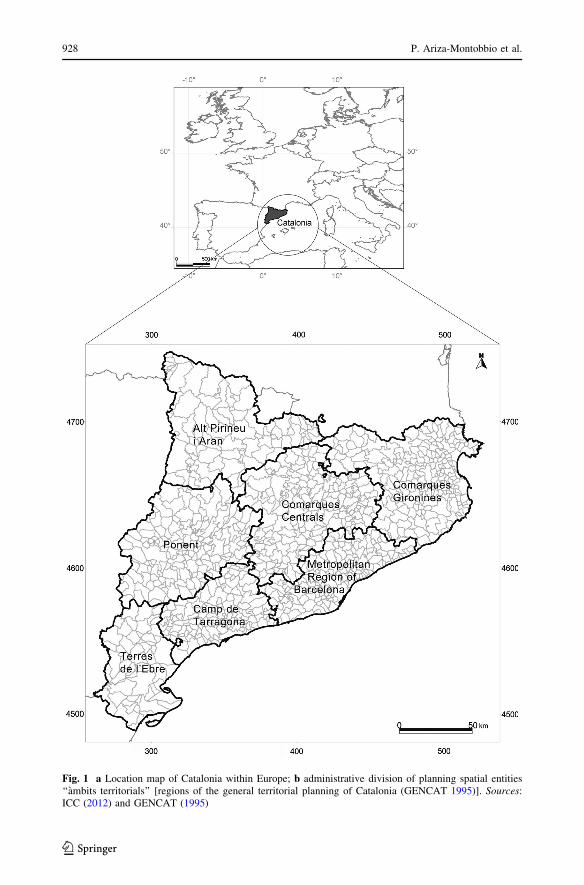
Fig. 1 a Location map of Catalonia within Europe; b administrative division of planning spatial entities‘‘ambits territorials’’ [regions of the general territorial planning of Catalonia (GENCAT 1995)]. Sources:ICC (2012) and GENCAT (1995)
928 P. Ariza-Montobbio et al.
123
nuclear families toward more single-parent and single-person households (Gamboa 2009;
Ramos-Martın et al. 2009). Catalonia’s energy metabolism, thus, faces a great difficulty of
increasing labor productivity to sustain an aging population without increasing energy
consumption4 (D’Alisa and Cattaneo 2012; Ramos-Martın et al. 2009).
This growing energy consumption in both market and household sectors is related to the
increased value of real estate and the urbanization boom, in particular urban sprawl. The
urban sprawl of Catalonia with its main focus in the Barcelona Metropolitan Region
(BMR) but also reproduced in other smaller metropolitan centers (Reus-Tarragona, Gi-
rona-Figueres and Lleida-Segria) has established a network of urban systems (FMR 2009;
GENCAT 1995; Nel lo 2001). The growth of urban areas has meant not only the growing
occupation of land, but also new urban–rural relationships and the diffusion of new life-
styles in rural areas, which have been converging with urban ones. Urban centers influence
more and more the development of the surrounding rural areas through new patterns of
mobility, teleworking, second homes and new ecotourist activities associated to natural
protected areas (FMR 2009). These changes have been energetically fueled mainly by
fossil energy, consumed through the rise of private automobile mobility and the indus-
trialization of agriculture. However, they are also dependent on a centralized electricity
generation system characterized by a great distance between generation and consumption
(see Fig. 2). Power plant siting is heavily skewed toward the south (nuclear, combined
cycle, large hydro and recently wind farms) and toward the mountains in the north with
hydropower production. Energy consumption, by contrast, has always been highest in the
central urban, industrial and northern touristic regions (Saladie 2011). Moreover, the
system is concentrated in few power plants that are responsible for most of the generation.
70 % of the generation in 2009 originated from just three nuclear power plants, seven
combined cycle units and five thermal stations. About forty large hydropower stations
(bigger than 10 MW of installed capacity) accounted for an additional 8 %. The remaining
22 % of electricity is generated through power plants of \50 MW of installed capacity,
mainly of renewable energy, waste-to-energy plants, small hydro stations (\10 MW) and
combined heat and power (CHP)5 (ICAEN 2009).
The interaction between the energy metabolism and the creation of landscapes has been
studied in the Barcelona Metropolitan Region. Research has developed tools for quanti-
fying the relationship between urbanization, the historical loss of energy efficiency of
agriculture and the functional disconnection between land uses previously integrated in the
agroforestry mosaic6 (Cusso et al. 2006; Marull et al. 2007; 2010).This has usefully
assessed the environmental impact of urbanization on the immediate surrounding envi-
ronment7 and has mainly explored the metabolism of the agricultural sector. By mapping
4 An aging population and the increasing isolation of citizens in single-person households puts a growingburden either on unpaid work for maintenance and care, or through its substitution by services bought in themarket which would increase the overall energy consumption (D’Alisa and Cattaneo 2012).5 Although Spain is net exporter of electricity, providing 8.333 Gwh to France in 2010, within Spain, Cataloniais a net importer of electricity, demanding from other regions of Spain 5.545 Gwh in 2010 (REE 2010).6 The historical loss of energy efficiency of agriculture is expressed by the progressive reduction of theenergy return on investment (EROI) from mid-nineteenth century to present, brought about by the intro-duction of fossil fuel inputs and the functional disconnection of forest, pasture and agricultural landspreviously managed integrally (Cusso et al 2006, Marull et al 2007).7 The growth of built-up areas and infrastructure sites occupying more and more space in the land matrixwith the rest of the landscape remaining residual in the Barcelona Metropolitan Region (BMR) has reducedthe ‘‘landscape efficiency’’, the ability of the landscape to satisfy human needs while maintaining thehealthiest ecological patterns and processes, such as ecological connectivity (Marull et al 2010).
Integrating energy and land-use planning 929
123
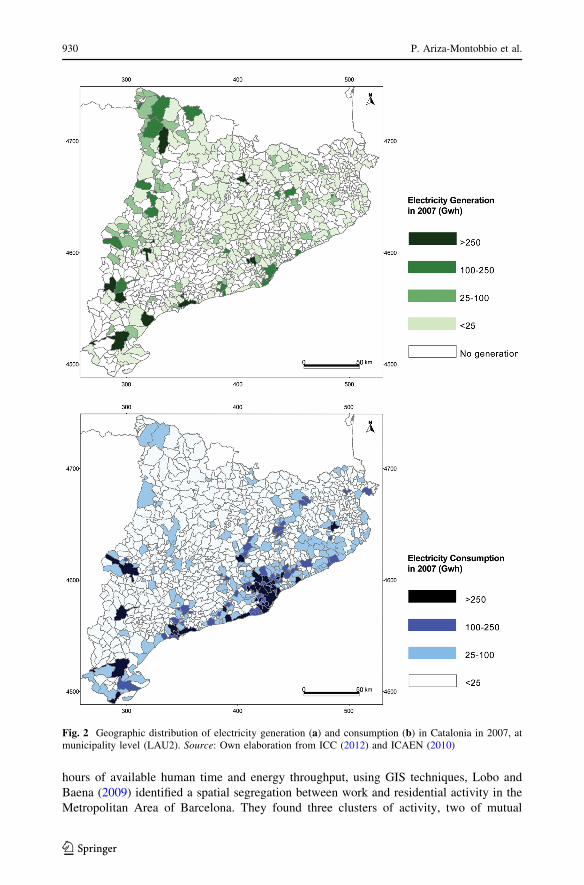
hours of available human time and energy throughput, using GIS techniques, Lobo and
Baena (2009) identified a spatial segregation between work and residential activity in the
Metropolitan Area of Barcelona. They found three clusters of activity, two of mutual
Fig. 2 Geographic distribution of electricity generation (a) and consumption (b) in Catalonia in 2007, atmunicipality level (LAU2). Source: Own elaboration from ICC (2012) and ICAEN (2010)
930 P. Ariza-Montobbio et al.
123
exclusion and a third large area of work and residence co-occurrence. Total energy
throughput tended to concentrate in areas of fast growth coinciding with exclusivity of
either industrial work or residential activities. Here, we follow Lobo and Baena’s (2009)
initiative in combining spatial and socioeconomic data, in order to complement these
previous studies by relating sociodemographic structural characteristics to energy meta-
bolic profiles across the rural–urban continuum of Catalonia.
3 Methods: applying MuSIASEM to relate metabolic profiles to a typologyof municipalities
In order to explore relationships between energy metabolism and the spatial distribution of
sociodemographic and land-use characteristics, we apply a two-steps methodological design.
First, we calculate a combination of conventional indicators capturing multiple character-
istics usually associated to ‘‘rural’’ and ‘‘urban’’ areas and indicators derived from the Multi-
Scale Integrated Analysis of Societal and Ecological Metabolism (MuSIASEM) approach
(Giampietro et al. 2009). Second, using multivariate statistical techniques applied to the set of
indicators, we derive a typology of municipalities with distinct metabolic profiles.
3.1 Indicators of rural–urban characteristics
In the Spanish and Catalan context, as in other European regions, certain characteristics in
municipalities have been identified as relevant indicators of contemporary ‘‘ruralities.’’ Low
population density, progressive aging of the population and a high degree of farming-related
occupation are among the foremost characteristics, followed by second-homes ratio or self-
employment (Entrena-Duran 1998; Ocana-Riola and Sanchez-Cantalejo 2005; Prieto-Lara
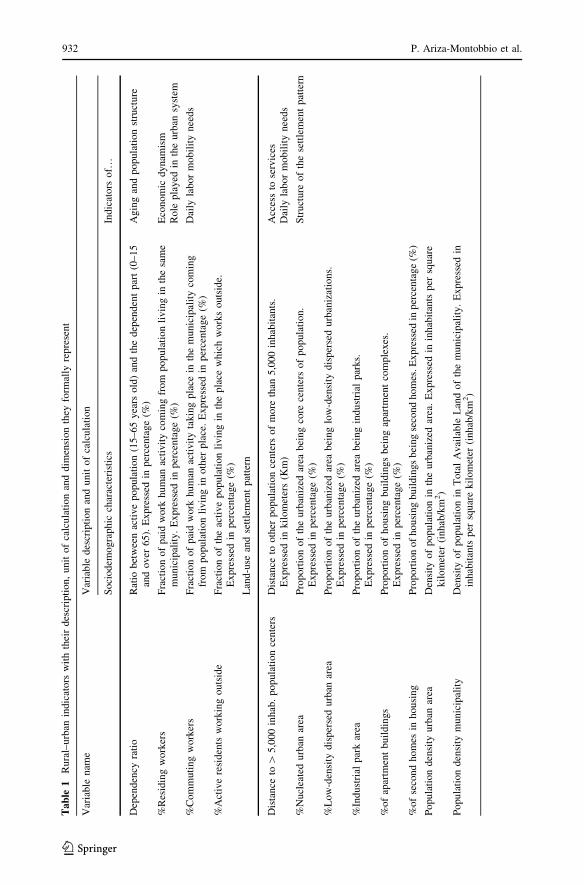
and Ocana-Riola 2010). Table 1 shows the indicators we specifically used to characterize
municipalities regarding their urban–rural characteristics. Some variables such as agrarian
people’s occupation and land use are already captured by MuSIASEM indicators.
3.2 The MuSIASEM approach at municipality level
In the MuSIASEM approach, information is combined from three different domains—
demographic, economic and biophysical (i.e., exosomatic energy consumption)—at dif-
ferent hierarchical levels in order to generate intensive variables for characterizing the
societal metabolism of a particular system.
Based on Georgescu-Roegen’s flow–fund model (Georgescu-Roegen 1971), different
types of variables are distinguished, depending on the role undertaken in the production
process. ‘‘Flow’’ elements enter but do not exit the production process or, conversely, exit
without having entered the process. The main flows analyzed here are electricity genera-
tion and consumption [total electricity consumption (TEC) and total electricity generated
(TEG) see Table 2].’’Fund’’ elements are agents that enter and exit the process, trans-
forming input flows into output flows. In our case, the main funds are human activity and
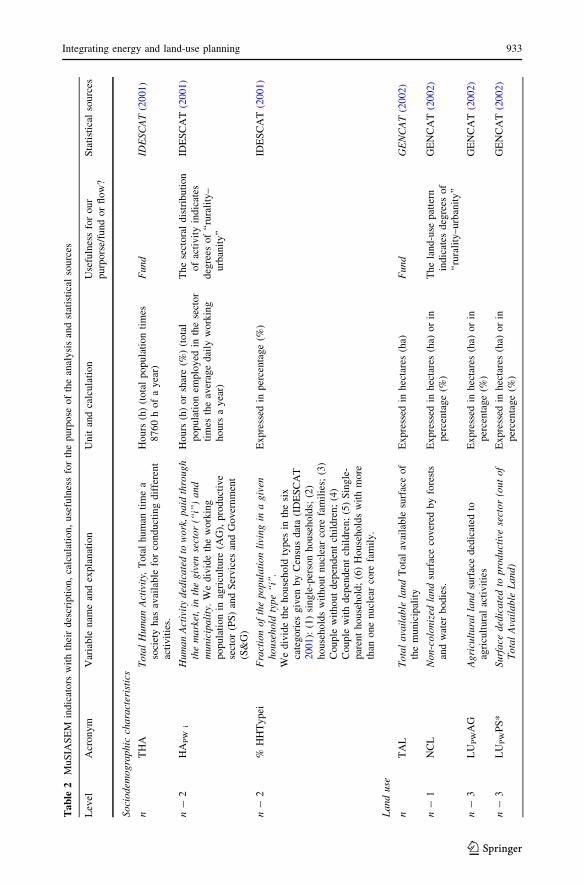
land use [total human activity (THA) and total available land (TAL) see Table 2]. Using
ratios between flows and funds, we can derive intensive variables, useful to generate
benchmarks for comparison, such as the exosomatic metabolic rate (EMR) (MJ/hour of
activity) or the TEC per hectare (MJ/ha) (see Table 2). In our case, because electricity is
mainly consumed in urban areas, and the agricultural sector does not play a major role in
Integrating energy and land-use planning 931
123
Ta
ble
1R
ura
l–u
rban
indic
ato
rsw
ith
thei
rd
escr
ipti
on
,u
nit
of
calc
ula
tio
nan
dd
imen
sio
nth
eyfo
rmal
lyre
pre
sen
t
Var
iab
len
ame
Var
iab
led
escr
ipti
on
and
un
ito
fca
lcu
lati
on
Soci
odem
ogra
phic
char
acte
rist
ics
Indic
ators
of…
Dep
enden
cyra
tio
Rat
iobet
wee
nac
tive
popula
tion
(15–65
yea
rsold
)an
dth
edep
enden
tpar
t(0
–15
and
over
65).
Expre
ssed
inper
centa
ge
(%)
Ag
ing
and
po
pula
tio
nst
ruct
ure
%R
esid
ing
work
ers
Fra
ctio
nof
pai
dw
ork
hum
anac
tivit
yco
min
gfr
om
popula
tion
livin
gin
the
sam
em
unic
ipal
ity.
Expre
ssed
inper
centa
ge
(%)
Eco
no
mic
dy
nam
ism
Ro
lep
layed
inth
eu
rban
syst
em
%C
om
muti
ng
work
ers
Fra
ctio
nof
pai
dw
ork
hum
anac
tivit
yta
kin
gpla
cein
the
munic
ipal
ity
com
ing
from
popula
tion
livin
gin
oth
erpla
ce.
Expre
ssed
inper
centa
ge
(%)
Dai
lyla
bor
mob
ilit
yn
eed
s
%A
ctiv
ere
siden
tsw
ork
ing
outs
ide
Fra
ctio
nof
the
acti
ve
popula
tion
livin
gin
the
pla
cew
hic
hw
ork
souts
ide.
Expre
ssed
inper
centa
ge
(%)
Lan
d-u
sean
dse
ttle
men
tp
atte
rn
Dis
tan
ceto
[5
,00
0in
hab
.p
op
ula
tio
nce
nte
rsD
ista
nce
too
ther
po
pula
tio
nce
nte
rso
fm
ore
than
5,0
00
inhab
itan
ts.
Expre
ssed
inkil
om
eter
s(K
m)
Acc
ess
tose
rvic
esD
aily
lab
or
mob
ilit
yn
eed
s
%N
ucl
eate
du
rban
area
Pro
po
rtio
no
fth
eu
rban
ized
area
bei
ng
core
cen
ters
of
po
pula
tio
n.
Expre
ssed
inper
centa
ge
(%)
Str
uct
ure
of
the
sett
lem
ent
pat
tern
%L
ow
-den
sity
dis
per
sed
urb
anar
eaP
rop
ort
ion
of
the
urb
aniz
edar
eab
eing
low
-den
sity
dis
per
sed
urb
aniz
atio
ns.
Expre
ssed
inper
centa
ge
(%)
%In
du
stri
alp
ark
area
Pro
po
rtio
no
fth
eu
rban
ized
area
bei
ng
ind
ust
rial
par
ks.
Expre
ssed
inper
centa
ge
(%)
%o
fap
artm
ent
bu
ild
ing
sP
rop
ort
ion
of
ho
usi
ng
bu
ild
ing
sb
ein
gap
artm
ent
com
ple
xes
.E
xpre
ssed
inper
centa
ge
(%)
%o
fse
cond
hom
esin
housi
ng
Pro
port
ion
of
housi
ng
buil
din
gs
bei
ng
seco
nd
hom
es.E
xpre
ssed
inper
centa
ge
(%)
Popula
tion
den
sity
urb
anar
eaD
ensi
tyof
popula
tion
inth
eurb
aniz
edar
ea.
Expre
ssed
inin
hab
itan
tsper
squar
ek
ilo
met
er(i
nh
ab/k
m2)
Popula
tion
den
sity
munic
ipal
ity
Den
sity
of
popula
tion
inT
ota
lA
vai
lable
Lan
dof
the
munic
ipal
ity.
Expre
ssed
inin
hab
itan
tsp
ersq
uar
ek
ilo
met
er(i
nh
ab/k
m2)
932 P. Ariza-Montobbio et al.
123
Ta
ble
2M
uS
IAS
EM
ind
icat
ors
wit
hth
eir
des
crip
tio
n,
calc
ula
tio
n,
use
fuln
ess
for
the
pu
rpose
of
the
anal
ysi
san
dst
atis
tica
lso
urc
es
Lev
elA
cro
ny
mV
aria
ble
nam
ean
dex
pla
nat
ion
Un
itan
dca
lcu
lati
on
Use
fuln
ess
for
ou
rpurp
ors
e/fu
nd
or
flow
?S
tati
stic
also
urc
es
So
cio
dem
ogra
phic
cha
ract
eris
tics
nT
HA
To
tal
Hu
ma
nA
ctiv
ity,
To
tal
hu
man
tim
ea
soci
ety
has
avai
lab
lefo
rco
nd
uct
ing
dif
fere
nt
acti
vit
ies.
Ho
urs
(h)
(to
tal
po
pu
lati
on
tim
es8
76
0h
of
ay
ear)
Fu
nd
IDE
SC
AT
(20
01)
n-
2H
AP
Wi
Hu
ma
nA
ctiv
ity
ded
ica
ted
tow
ork
,p
aid
thro
ug
hth
em
ark
et,
inth
eg
iven
sect
or
(‘‘i
’’)
an
dm
un
icip
ali
ty.
We
div
ide
the
wo
rkin
gp
op
ula
tio
nin
agri
cult
ure
(AG
),p
rod
uct
ive
sect
or
(PS
)an
dS
erv
ices
and
Go
ver
nm
ent
(S&
G)
Ho
urs
(h)
or
shar
e(%
)(t
ota
lp
op
ula
tio
nem
plo
yed
inth
ese
cto
rti
mes
the
aver
age
dai
lyw
ork
ing
ho
urs
ay
ear)
Th
ese
cto
ral
dis
trib
uti
on
of
acti
vit
yin
dic
ates
deg
rees
of
‘‘ru
rali
ty–
urb
anit
y’’
IDE
SC
AT
(20
01)
n-
2%
HH
Typei
Fra
ctio
no
fth
ep
op
ula
tio
nli
vin
gin
ag
iven
ho
use
ho
ldty
pe
‘‘i’’.
We
div
ide
the
ho
use
ho
ldty
pes
inth
esi
xca
tegori
esgiv
enby
Cen
sus
dat
a(I
DE
SC
AT
20
01):
(1)
sing
le-p
erso
nh
ou
seh
old
s;(2
)h
ou
seh
old
sw
ith
ou
tn
ucl
ear
core
fam
ilie
s;(3
)C
ou
ple
wit
ho
ut
dep
enden
tch
ild
ren
;(4
)C
ou
ple
wit
hd
epen
den
tch
ild
ren
;(5
)S
ing
le-
par
ent
ho
use
ho
ld;
(6)
Ho
use
ho
lds
wit
hm
ore
than
on
en
ucl
ear
core
fam
ily
.
Expre
ssed
inper
centa
ge
(%)
IDE
SC
AT
(20
01)
La
nd
use
nT
AL
To
tal
ava
ila
ble
land
To
tal
avai
lab
lesu
rfac
eo
fth
em
un
icip
alit
yE
xpre
ssed
inhec
tare
s(h
a)F
un
dG
EN
CA
T(2
00
2)
n-
1N
CL
No
n-c
olo
niz
edla
nd
surf
ace
cov
ered
by
fore
sts
and
wat
erb
od
ies.
Expre
ssed
inhec
tare
s(h
a)or
inper
centa
ge
(%)
Th
ela
nd
-use
pat
tern
ind
icat
esd
egre
eso
f‘‘
rura
lity
–u
rban
ity
’’
GE
NC
AT
(20
02
)
n-
3L
UP
WA
GA
gri
cult
ura
lla
nd
surf
ace
ded
icat
edto
agri
cult
ura
lac
tiv
itie
sE
xpre
ssed
inhec
tare
s(h
a)or
inper
centa
ge
(%)
GE
NC
AT
(20
02
)
n-
3L
UP
WP
S*
Su
rfa
ced
edic
ate
dto
pro
du
ctiv
ese
cto
r(o
ut
of
To
tal
Ava
ilab
leL
an
d)
Expre
ssed
inhec
tare
s(h
a)or
inper
centa
ge
(%)
GE
NC
AT
(20
02
)
Integrating energy and land-use planning 933
123

Ta
ble
2co
nti
nu
ed
Lev
elA
cro
ny
mV
aria
ble
nam
ean
dex
pla
nat
ion
Un
itan
dca
lcu
lati
on
Use
fuln
ess
for
ou
rpurp
ors
e/fu
nd
or
flow
?S
tati
stic
also
urc
es
n-
2L
Uin
fSurf
ace
ded
icate
dto
infr
ast
ruct
ure
sE
xpre
ssed
inhec
tare
s(h
a)or
inper
centa
ge
(%)
GE
NC
AT
(20
02
)
n-
2L
UH
HS
urf
ace
ded
ica
ted
tore
sid
enti
al
are
aE
xpre
ssed
inhec
tare
s(h
a)or
inper
centa
ge
(%)
GE
NC
AT
(20
02
)
En
erget
icm
eta
bo
lism
ind
ica
tors
nT
EC
SA
(or
TE
Ci)
To
tal
Ele
ctri
city
Co
nsu
mpti
on
tota
lel
ectr
icit
yco
nsu
med
ina
yea
rin
the
agg
reg
ate
lev
elo
fth
ew
ho
lem
un
icip
alit
y(‘
‘So
ciet
alA
ver
age,
SA
’’)
or
ina
giv
enin
ag
iven
soci
oec
on
om
icse
cto
r(‘
‘i’’
)
Expre
ssed
inm
egaj
oule
s(M
J)F
low
ICA
EN
(20
10)
n/n
-1
EM
RS
A(o
rE
MR
i)E
xoso
ma
tic
Met
ab
oli
cR
ate
elec
tric
ity
con
sum
pti
on
per
ho
ur
of
hu
man
tim
eav
aila
ble
toth
em
un
icip
alit
y(‘
‘SA
’’)
or
per
ho
ur
allo
cate
dto
ag
iven
soci
oec
on
om
icse
cto
r(‘
‘i’’
)
TE
CS
A/T
HA
(or
TE
Ci/
HA
i)M
easu
red
inm
egaj
oule
sp
erh
ou
r(M
J/h
)
Flo
w-F
un
dIC
AE
N(2
01
0)
IDE
SC
AT
(20
01)
n-
2T
EC
per
ha_
urb
anar
eaT
ota
lE
lect
rici
tyC
on
sum
pti
on
inu
rban
area
:el
ectr
icit
yco
nsu
mp
tion
inh
ou
seh
old
,se
rvic
esan
din
du
stri
alse
cto
rsp
erh
ecta
reo
fu
rban
area
RT
EC
S&
G,I
S,H
H/R
LU
HH
,P
WP
S
Mea
sure
din
meg
ajo
ule
sp
erh
ecta
re(M
J/h
a)
Flo
w-F
un
dIC
AE
N(2
01
0)
GE
NC
AT
(20
02
)
n-
1T
EC
per
HH
To
tal
Ele
ctri
city
Co
nsu
mpti
on
per
ho
use
ho
ldto
tal
elec
tric
ity
con
sum
edin
ay
ear
per
ho
use
ho
ld
TE
C/n
um
ber
of
ho
use
ho
lds
(HH
)(M
J/H
H)
Flo
w-F
un
dIC
AE
N(2
01
0)
IDE
SC
AT
(20
01)
n-
1T
EC
per
per
son
inth
eH
HT
ota
lE
lect
rici
tyC
on
sum
pti
on
per
per
son
livi
ng
inth
eh
ou
seh
old
tota
lel
ectr
icit
yco
nsu
med
ina
yea
rp
erp
erso
nli
vin
gin
ah
ou
seh
old
TE
C/p
erso
nin
the
ho
use
ho
ld(M
J/p
erso
nin
the
HH
)F
low
-Fu
nd
ICA
EN
(20
10)
IDE
SC
AT
(20
01)
nB
alan
ceG
ener
atio
n/
Co
nsu
mp
tio
n
Rati
oof
elec
tric
ity
gen
erate
din
resp
ect
of
the
elec
tric
ity
consu
med
TE
GS
A/T
EC
SA
Mea
sure
din
%F
low
-Flo
wIC
AE
N(2
01
0)
nT
EG
SA
(or
TE
Gi)
To
tal
Ele
ctri
city
Gen
era
ted
Ele
ctri
city
gen
erat
edb
yal
lte
chno
log
ies
(SA
),o
rb
ya
giv
enty
pe
(‘‘i
’’)
Expre
ssed
inm
egaj
oule
s(M
J)F
low
ICA
EN
(20
10)
934 P. Ariza-Montobbio et al.
123
electricity consumption,8 we always calculate TEC per hectare with reference to urbanized
area (the sum of all paved land in the municipality being residential complexes, population
centers or industrial parks).
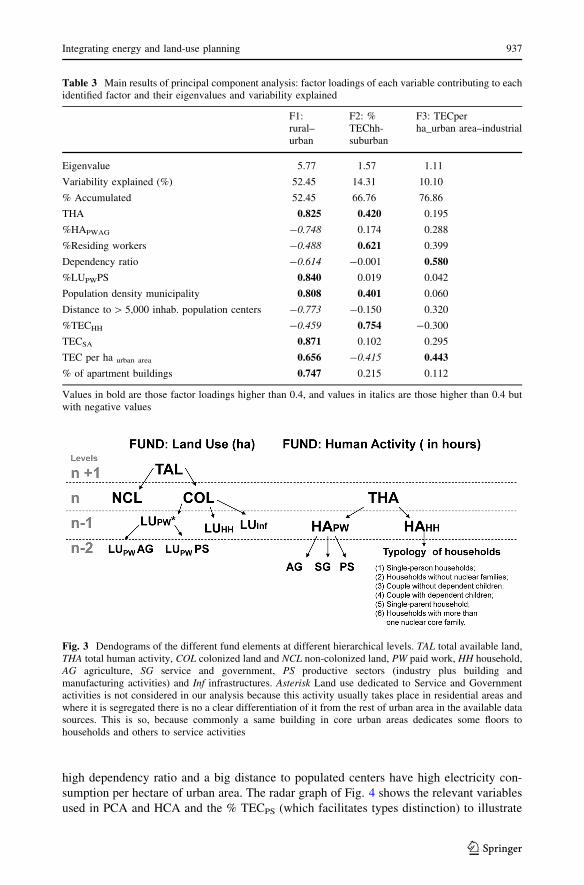
Figure 3 shows the different fund elements we have considered at different hierarchical
levels: the whole system (municipality) with the THA (Level n) and the total available land
(TAL) (Level n ? 1), the colonized (COL) and non-colonized land9 (NCL) (Level n), the
market [paid work (PW)] and household sectors (HH) (unpaid work and all the rest of non-
working human activities) (Level n - 1) and the sectoral distribution of land- and time use
across agriculture (AG), services (SG) and productive sectors (PS) (industry or building
and manufacturing activities) and household types (Level n - 2). Table 2 provides a
detailed overview of the associated indicators in terms of description, calculation and
purpose within our analysis.
MuSIASEM can be applied at different geographical scales, either a nation-state
(Eisenmenger et al. 2007; Falconı-Benıtez 2001; Gasparatos et al. 2009; Iorgulescu and
Polimeni 2009; Ramos-Martın 2001; Ramos-Martin et al. 2007; Sorman and Giampietro
2011), a region (Ramos-Martin et al. 2009) or a municipality. Aiming to get the highest
possible resolution of spatial distribution of energy metabolic profiles, we have conducted
our analysis at the municipality level. This was the lower geographical scale where the
most disaggregated data of all dimensions considered were available. The analysis at
multiple scales and dimensions, employing intensive variables, makes MuSIASEM useful
for exploring how similar absolute levels and per hectare densities of municipal electricity
consumption are related to the prevalence of different sectors and rates of electricity
consumption per hour of activity. The intensive flow/fund variables obtained by relating
flows (in this case electricity) to funds (in this case land and time use) are also of help for
comparing municipalities with different population sizes and land uses.
3.3 Multivariate statistical analysis to identify and characterize typologies
of municipalities
Municipality typologies were built through the application of principal component analysis
(PCA) (Abdi and Williams 2010) and hierarchical cluster analysis (HCA) (Hardle and
Simar 2012) to a selection of the above introduced indicators for a sample of 945
municipalities.10 PCA represents inter-correlated quantitative-dependent variables as a set
of new orthogonal variables called principal components (or factors). Principal compo-
nents group variables according to important patterns of similarity among them (Abdi and
Williams 2010). HCA further groups the data in different clusters according to such
patterns of similarity (Hardle and Simar 2012). In order to produce a meaningful
8 As later shown in Table 6, on average, the maximum electricity consumption in agriculture is around10 % in small villages.9 We consider forests and water bodies as ‘‘non-colonized land’’ with the aim to follow the initiallydeveloped cathegories of MuSIASEM. However, in our case, a Mediterranean area in South Europe, forestsand water bodies are strongly influenced by human activities. Here, ‘‘non-colonized’’ is used with themeaning of non-agricultural, non-urbanized land.10 Catalonia has 946 municipalities. Barcelona, however, was left aside due to the relative big difference insize as compared with all the rest of municipalities and also due to the lack of disaggregated data aboutelectricity consumption by neighborhoods. Its initial inclusion distorted any meaningful result. Barcelona,with 1,503,884 inhabitants in 2001 (23 % of Catalonia’s population), was about six to eight times larger thanthe neighboring second and third most populated cities of Catalonia (Hospitalet de Llobregat and Badalona),and ten times larger than the other three province capitals of Catalonia: Tarragona, Lleida and Girona.
Integrating energy and land-use planning 935
123
clustering, we needed to select indicators relevant for accomplishing our goal of relating
rural–urban characteristics and metabolic profiles of energy consumption. We selected
eleven indicators (see Table 3; Fig. 3) with the aim to represent all relevant dimensions
(sociodemographic structure, land-use distribution, energy metabolic profiles) and at the
same time key variables related to economic dynamism (understood as employment
attraction), the daily labor mobility needs, the role within the network of cities or the
relative access to services (as indicated in Table 1, last column). When selecting indica-
tors, we considered those with a high number of correlations with variables of other
dimensions and dismissed those highly correlated with variables representing the same
dimension. Further details of applying clustering procedures based on multivariate sta-
tistical analysis can be found in Kobrich et al. (2003), Mingorrıa and Gamboa (2010),
Siciliano (2012) and Usai et al. (2006).
The municipality typologies found through PCA and HCA were further characterized
through the help of statistical tests for variance analysis. After conducting the normality
test Shapiro–Wilk (Shapiro and Wilk 1965), all variables were found to follow a non-
parametric distribution. Thus, the nonparametric test Kruskal–Wallis one-way analysis of
variance by ranks (Kruskal and Wallis 1952) was used to identify statistically significant
differences between municipality types, this time using all the indicators of Tables 1 and 2.
The study was conducted using data of all dimensions for the year 2001, the most recent
year for which a suitable combination of population census data (IDESCAT 2001), land-
use maps of Catalunya (GENCAT 2002) and related electricity consumption data are
available.11 Electricity generation and consumption data were provided by Institut Catala
de l’Energia (Catalan Institute of Energy, ICAEN, in its acronym in Catalan) upon request.
4 Municipality types and metabolic profiles along the rural–urban continuum
The clustering procedure based on multivariate statistical analysis derived four types of
municipalities with distinct metabolic profiles regarding their sociodemographic, land-use
and electricity consumption characteristics: (a) cities, (b) small villages, (c) suburban
towns and (d) industrial villages. These types covered the broad range of the rural–urban
continuum and resulted from the grouping of the most significant indicators around three
significant principal components (factors) explaining the 77 % of the variability of the
sample (see Table 3). By looking at the contribution of each variable to the factors, we see
that factor F1 is composed of variables whose maximization indicates either ‘‘rural’’ (i.e.,
negative variables in italics) or ‘‘urban’’ (i.e., positive variables in bold) characteristics.
Factors F2 and F3, although less relevant in explaining sample variability, are key for
understanding the formation of the other two intermediate categories. F2 illustrates the
creation of suburban towns where municipalities with an intermediate size (THA), pop-
ulation density and share of workers living in the same village have a big share of elec-
tricity consumption in the household sector (%TECHH) and a low electricity consumption
per hectare of urban area (TECper ha urban area). F3 groups the sample toward the creation
of the ‘‘rural industrial village’’ category where villages with the rural characteristics of a
11 Although there is demographic data available for 2007, it is not disaggregated to the required level ofdetail. The most recent demographic data, for 2011, while suitably disaggreated, do not include electricityconsumption, and we have used the most recent, detailed land use map, which is for the year 2002. We haveused the most recently available energy generation data, i.e., 2007, for the purpose of interpreting impli-cations in our summary and conclusions.
936 P. Ariza-Montobbio et al.
123
high dependency ratio and a big distance to populated centers have high electricity con-
sumption per hectare of urban area. The radar graph of Fig. 4 shows the relevant variables
used in PCA and HCA and the % TECPS (which facilitates types distinction) to illustrate
Fig. 3 Dendograms of the different fund elements at different hierarchical levels. TAL total available land,THA total human activity, COL colonized land and NCL non-colonized land, PW paid work, HH household,AG agriculture, SG service and government, PS productive sectors (industry plus building andmanufacturing activities) and Inf infrastructures. Asterisk Land use dedicated to Service and Governmentactivities is not considered in our analysis because this activity usually takes place in residential areas andwhere it is segregated there is no a clear differentiation of it from the rest of urban area in the available datasources. This is so, because commonly a same building in core urban areas dedicates some floors tohouseholds and others to service activities
Table 3 Main results of principal component analysis: factor loadings of each variable contributing to eachidentified factor and their eigenvalues and variability explained
F1:rural–urban
F2: %TEChh-suburban
F3: TECperha_urban area–industrial
Eigenvalue 5.77 1.57 1.11
Variability explained (%) 52.45 14.31 10.10
% Accumulated 52.45 66.76 76.86
THA 0.825 0.420 0.195
%HAPWAG -0.748 0.174 0.288
%Residing workers -0.488 0.621 0.399
Dependency ratio -0.614 -0.001 0.580
%LUPWPS 0.840 0.019 0.042
Population density municipality 0.808 0.401 0.060
Distance to [ 5,000 inhab. population centers -0.773 -0.150 0.320
%TECHH -0.459 0.754 -0.300
TECSA 0.871 0.102 0.295
TEC per ha urban area 0.656 -0.415 0.443
% of apartment buildings 0.747 0.215 0.112
Values in bold are those factor loadings higher than 0.4, and values in italics are those higher than 0.4 butwith negative values
Integrating energy and land-use planning 937
123
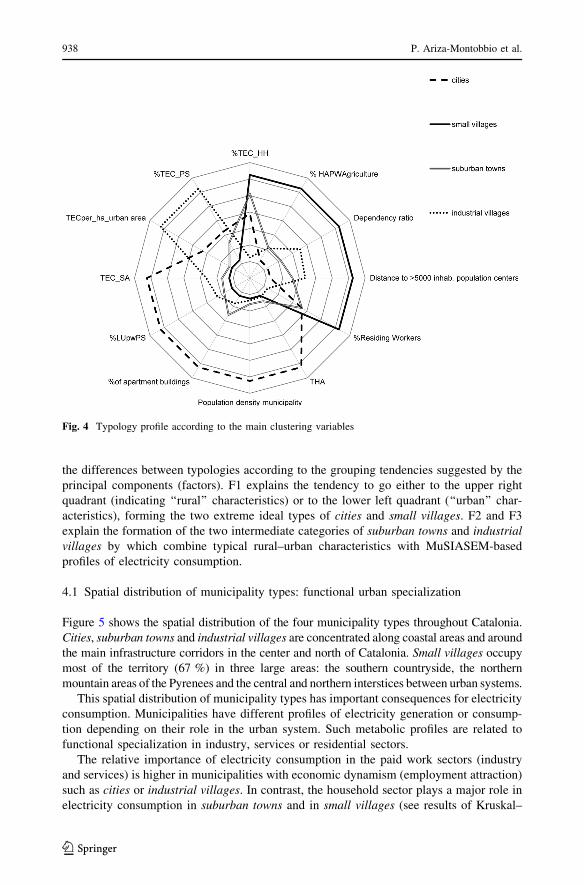
the differences between typologies according to the grouping tendencies suggested by the
principal components (factors). F1 explains the tendency to go either to the upper right
quadrant (indicating ‘‘rural’’ characteristics) or to the lower left quadrant (‘‘urban’’ char-
acteristics), forming the two extreme ideal types of cities and small villages. F2 and F3
explain the formation of the two intermediate categories of suburban towns and industrial
villages by which combine typical rural–urban characteristics with MuSIASEM-based
profiles of electricity consumption.
4.1 Spatial distribution of municipality types: functional urban specialization
Figure 5 shows the spatial distribution of the four municipality types throughout Catalonia.
Cities, suburban towns and industrial villages are concentrated along coastal areas and around
the main infrastructure corridors in the center and north of Catalonia. Small villages occupy
most of the territory (67 %) in three large areas: the southern countryside, the northern
mountain areas of the Pyrenees and the central and northern interstices between urban systems.
This spatial distribution of municipality types has important consequences for electricity
consumption. Municipalities have different profiles of electricity generation or consump-
tion depending on their role in the urban system. Such metabolic profiles are related to
functional specialization in industry, services or residential sectors.
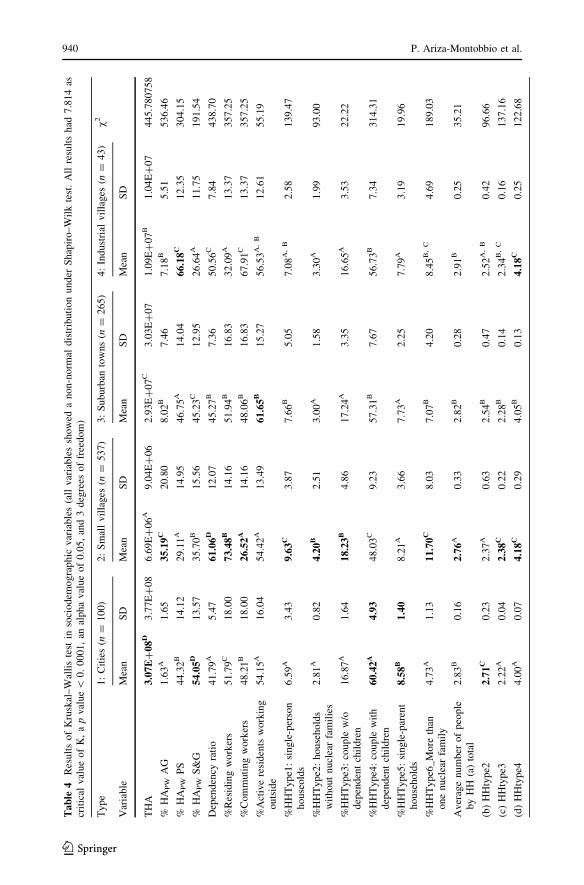
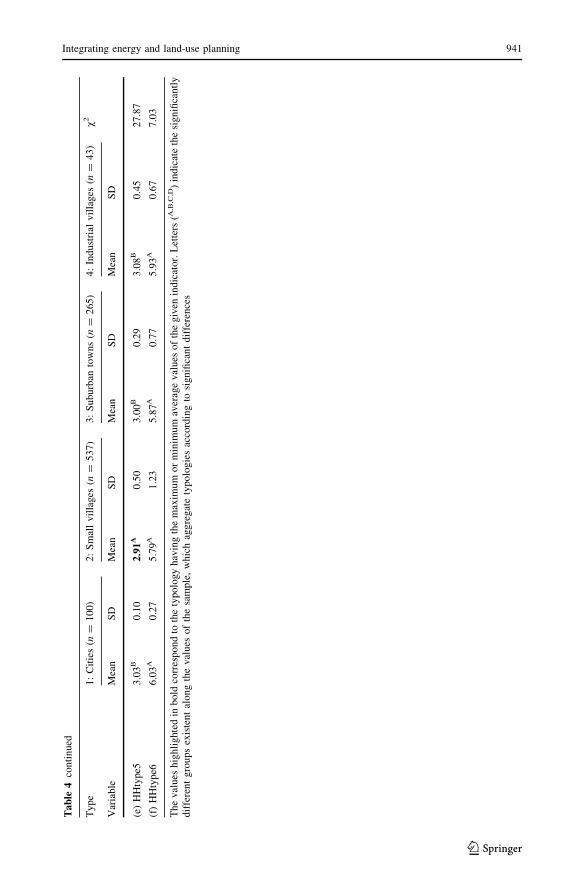
The relative importance of electricity consumption in the paid work sectors (industry
and services) is higher in municipalities with economic dynamism (employment attraction)
such as cities or industrial villages. In contrast, the household sector plays a major role in
electricity consumption in suburban towns and in small villages (see results of Kruskal–
Fig. 4 Typology profile according to the main clustering variables
938 P. Ariza-Montobbio et al.
123
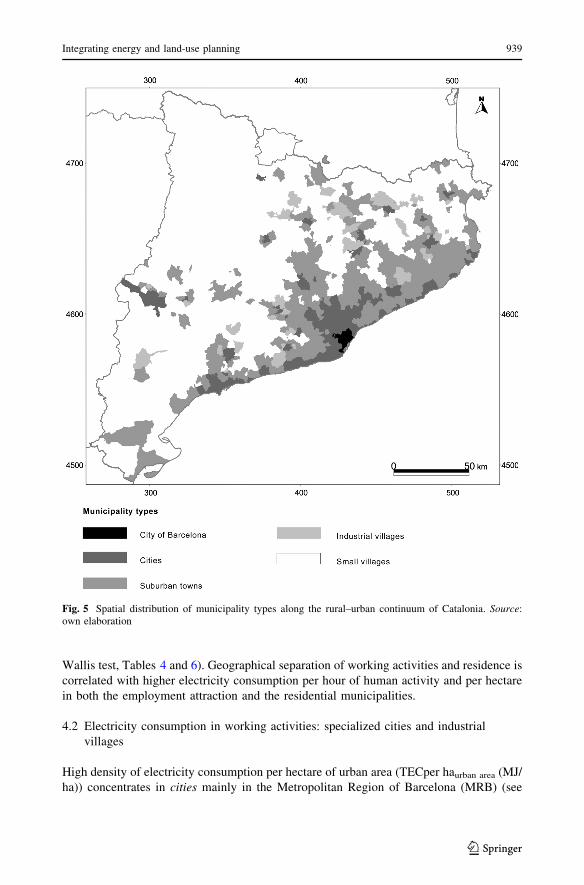
Wallis test, Tables 4 and 6). Geographical separation of working activities and residence is
correlated with higher electricity consumption per hour of human activity and per hectare
in both the employment attraction and the residential municipalities.
4.2 Electricity consumption in working activities: specialized cities and industrial
villages
High density of electricity consumption per hectare of urban area (TECper haurban area (MJ/
ha)) concentrates in cities mainly in the Metropolitan Region of Barcelona (MRB) (see
Fig. 5 Spatial distribution of municipality types along the rural–urban continuum of Catalonia. Source:own elaboration
Integrating energy and land-use planning 939
123
Ta
ble
4R
esult
so
fK
rusk
al–
Wal
lis
test
inso
ciod
emo
gra
ph
icv
aria
ble
s(a
llv
aria
ble
ssh
ow
eda
no
n-n
orm
ald
istr
ibu
tio
nu
nd
erS
hap
iro
–W
ilk
test
.A
llre
sult
sh
ad7
.81
4as
crit
ical
val
ue
of
K,
ap
val
ue\
0.
00
01,
anal
pha
val
ue
of
0.0
5,
and
3d
egre
eso
ffr
eed
om
)
Ty
pe
1:
Cit
ies
(n=
10
0)
2:
Sm
all
vil
lages
(n=
53
7)
3:
Su
bu
rban
tow
ns
(n=
26
5)
4:
Ind
ust
rial
vil
lages
(n=
43
)v
2
Var
iab
leM
ean
SD
Mea
nS
DM
ean
SD
Mea
nS
D
TH
A3
.07E
?0
8D
3.7
7E
?0
86
.69E
?0
6A
9.0
4E
?0
62
.93E
?0
7C
3.0
3E
?0
71
.09
E?
07
B1
.04
E?
07
44
5.7
80
75
8
%H
AP
WA
G1
.63
A1
.65
35
.19
C2
0.8
08
.02
B7
.46
7.1
8B
5.5
15
36
.46
%H
AP
WP
S4
4.3
2B
14
.12
29
.11
A1
4.9
54
6.7
5A
14
.04
66
.18
C1
2.3
53
04
.15
%H
AP
WS
&G
54
.05
D1
3.5
73
5.7
0B
15
.56
45
.23
C1
2.9
52
6.6
4A
11
.75
19
1.5
4
Dep
end
ency
rati
o4
1.7
9A
5.4
76
1.0
6D
12
.07
45
.27
B7
.36
50
.56
C7
.84
43
8.7
0
%R
esid
ing
work
ers
51.7
9C
18
.00
73
.48
B1
4.1
65
1.9
4B
16
.83
32
.09
A1
3.3
73
57
.25
%C
om
mu
tin
gw
ork
ers
48
.21
B1
8.0
02
6.5
2A
14
.16
48
.06
B1
6.8
36
7.9
1C
13
.37
35
7.2
5
%A
ctiv
ere
sid
ents
wo
rkin
go
uts
ide
54
.15
A1
6.0
45
4.4
2A
13
.49
61
.65
B1
5.2
75
6.5
3A
,B
12
.61
55
.19
%H
HT
yp
e1:
sing
le-p
erso
nh
ou
seo
lds
6.5
9A
3.4
39
.63C
3.8
77
.66
B5
.05
7.0
8A
,B
2.5
81
39
.47
%H
HT
yp
e2:
ho
use
ho
lds
wit
ho
ut
nu
clea
rfa
mil
ies
2.8
1A
0.8
24
.20B
2.5
13
.00
A1
.58
3.3
0A
1.9
99
3.0
0
%H
HT
yp
e3:
cou
ple
w/o
dep
enden
tch
ild
ren
16
.87
A1
.64
18
.23
B4
.86
17
.24
A3
.35
16
.65
A3
.53
22
.22
%H
HT
yp
e4:
cou
ple
wit
hd
epen
den
tch
ild
ren
60
.42
A4
.93
48
.03
C9
.23
57
.31
B7
.67
56
.73
B7
.34
31
4.3
1
%H
HT
ype5
:si
ngle
-par
ent
ho
use
ho
lds
8.5
8B1
.40
8.2
1A
3.6
67
.73
A2
.25
7.7
9A
3.1
91
9.9
6
%H
HT
yp
e6_
Mo
reth
anone
nucl
ear
fam
ily
4.7
3A
1.1
31
1.7
0C
8.0
37
.07
B4
.20
8.4
5B
,C
4.6
91
89
.03
Av
erag
en
um
ber
of
peo
ple
by
HH
(a)
tota
l2
.83
B0
.16
2.7
6A0
.33
2.8
2B
0.2
82
.91
B0
.25
35
.21
(b)
HH
typ
e22
.71C
0.2
32
.37
A0
.63
2.5
4B
0.4
72
.52
A,
B0
.42
96
.66
(c)
HH
type3
2.2
2A
0.0
42
.38C
0.2
22
.28
B0
.14
2.3
4B
,C
0.1
61
37
.16
(d)
HH
typ
e44
.00
A0
.07
4.1
8C0
.29
4.0
5B
0.1
34
.18
C0
.25
12
2.6
8
940 P. Ariza-Montobbio et al.
123
Ta
ble
4co
nti
nued
Ty
pe
1:
Cit
ies
(n=
10
0)
2:
Sm
all
vil
lages
(n=
53
7)
3:
Su
bu
rban
tow
ns
(n=
26
5)
4:
Ind
ust
rial
vil
lages
(n=
43
)v
2
Var
iab
leM
ean
SD
Mea
nS
DM
ean
SD
Mea
nS
D
(e)
HH
type5
3.0
3B
0.1
02
.91A
0.5
03
.00
B0
.29
3.0
8B
0.4
52
7.8
7
(f)
HH
type6
6.0
3A
0.2
75
.79
A1
.23
5.8
7A
0.7
75
.93
A0
.67
7.0
3
Th
ev
alues
hig
hli
ghte
din
bo
ldco
rres
po
nd
toth
ety
po
log
yh
avin
gth
em
axim
um
or
min
imu
mav
erag
ev
alu
eso
fth
eg
iven
indic
ato
r.L
ette
rs(A
,B,C
,D)
indic
ate
the
sig
nifi
can
tly
dif
fere
nt
gro
ups
exis
ten
tal
ong
the
val
ues
of
the
sam
ple
,w
hic
hag
gre
gat
ety
po
log
ies
acco
rdin
gto
sign
ifica
nt
dif
fere
nce
s
Integrating energy and land-use planning 941
123
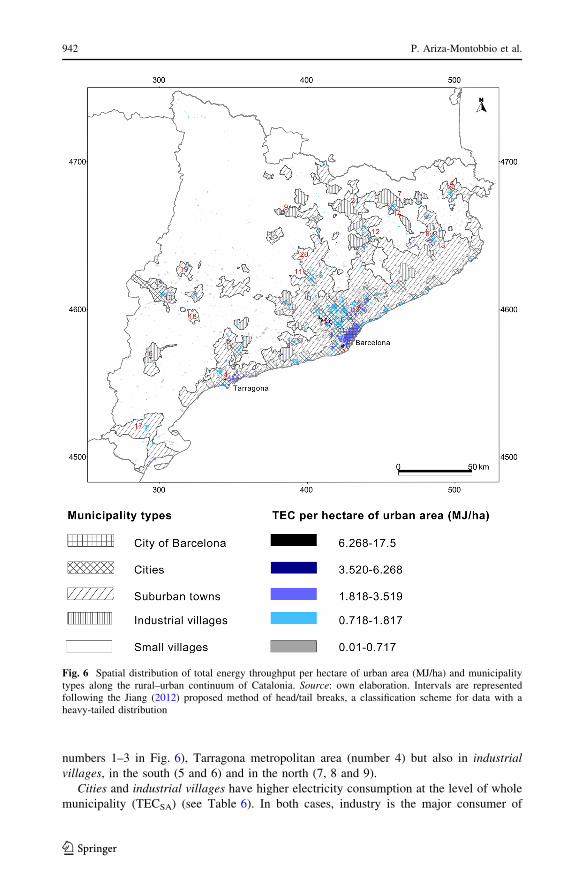
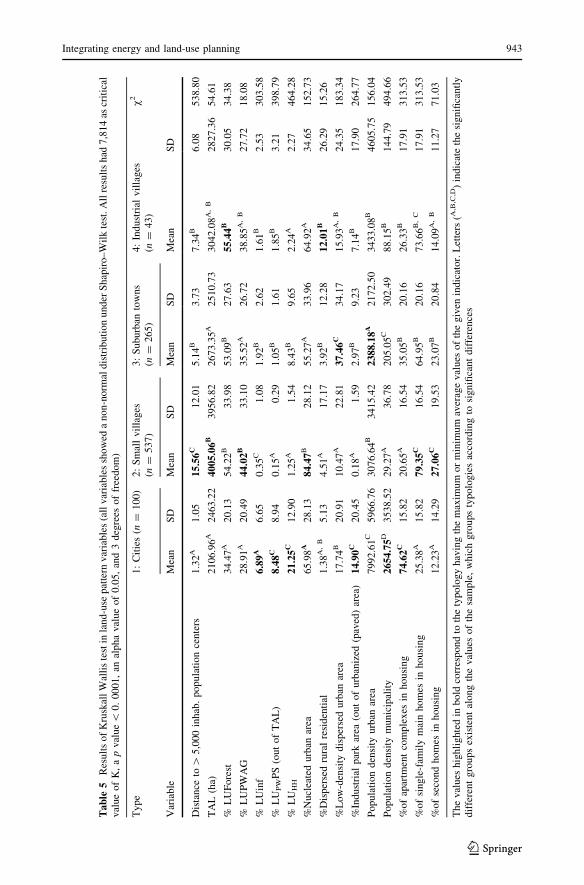
numbers 1–3 in Fig. 6), Tarragona metropolitan area (number 4) but also in industrial
villages, in the south (5 and 6) and in the north (7, 8 and 9).
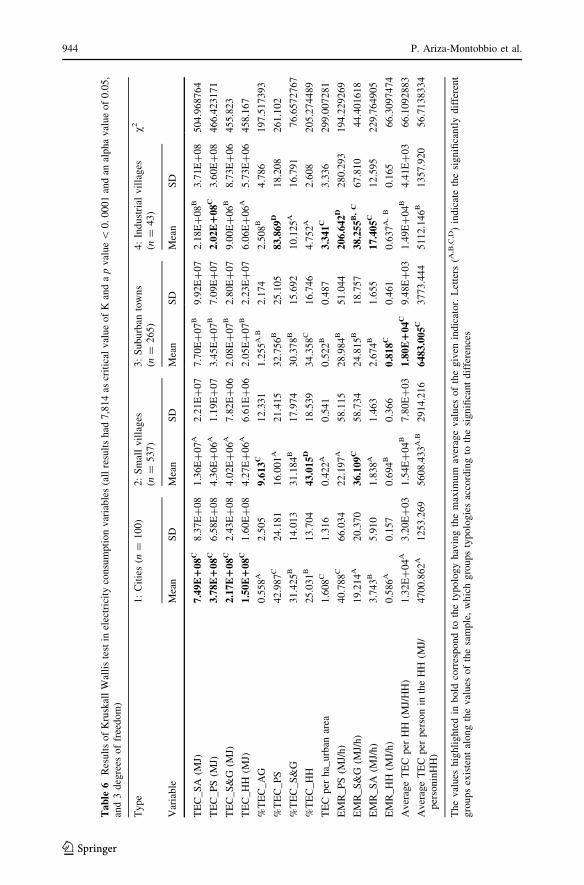
Cities and industrial villages have higher electricity consumption at the level of whole
municipality (TECSA) (see Table 6). In both cases, industry is the major consumer of
Fig. 6 Spatial distribution of total energy throughput per hectare of urban area (MJ/ha) and municipalitytypes along the rural–urban continuum of Catalonia. Source: own elaboration. Intervals are representedfollowing the Jiang (2012) proposed method of head/tail breaks, a classification scheme for data with aheavy-tailed distribution
942 P. Ariza-Montobbio et al.
123
Ta
ble
5R
esult
so
fK
rusk
all
Wal
lis
test
inla
nd
-use
pat
tern
var
iab
les
(all
var
iab
les
sho
wed
an
on
-no
rmal
dis
trib
uti
on
un
der
Sh
apir
o–
Wil
kte
st.A
llre
sult
sh
ad7
,81
4as
crit
ical
val
ue
of
K,
ap
val
ue\
0.
0001,
anal
pha
val
ue
of
0.0
5,
and
3d
egre
esof
free
dom
)
Ty
pe
1:
Cit
ies
(n=
10
0)
2:
Sm
all
vil
lages
(n=
53
7)
3:
Su
bu
rban
tow
ns
(n=
26
5)
4:
Ind
ust
rial
vil
lages
(n=
43
)v
2
Var
iab
leM
ean
SD
Mea
nS
DM
ean
SD
Mea
nS
D
Dis
tan
ceto
[5
,000
inh
ab.
po
pu
lati
on
cen
ters
1.3
2A
1.0
51
5.5
6C
12
.01
5.1
4B
3.7
37
.34
B6
.08
53
8.8
0
TA
L(h
a)2
10
6.9
6A
24
63
.22
40
05.
06
B3
95
6.8
22
67
3.3
5A
25
10
.73
30
42
.08
A,
B2
82
7.3
65
4.6
1
%L
UF
ore
st3
4.4
7A
20
.13
54
.22
B3
3.9
85
3.0
9B
27
.63
55
.44
B3
0.0
53
4.3
8
%L
UP
WA
G2
8.9
1A
20
.49
44
.02
B3
3.1
03
5.5
2A
26
.72
38
.85
A,
B2
7.7
21
8.0
8
%L
Uin
f6
.89A
6.6
50
.35
C1
.08
1.9
2B
2.6
21
.61
B2
.53
30
3.5
8
%L
UP
WP
S(o
ut
of
TA
L)
8.4
8C8
.94
0.1
5A
0.2
91
.05
B1
.61
1.8
5B
3.2
13
98
.79
%L
UH
H2
1.2
5C
12
.90
1.2
5A
1.5
48
.43
B9
.65
2.2
4A
2.2
74
64
.28
%N
ucl
eate
durb
anar
ea65.9
8A
28
.13
84
.47
B2
8.1
25
5.2
7A
33
.96
64
.92
A3
4.6
51
52
.73
%D
isper
sed
rura
lre
sid
enti
al1
.38
A,
B5
.13
4.5
1A
17
.17
3.9
2B
12
.28
12
.01
B2
6.2
91
5.2
6
%L
ow
-den
sity
dis
per
sed
urb
anar
ea1
7.7
4B
20
.91
10
.47
A2
2.8
13
7.4
6C
34
.17
15
.93
A,
B2
4.3
51
83
.34
%In
du
stri
alp
ark
area
(ou
to
fu
rban
ized
(pav
ed)
area
)1
4.9
0C
20
.45
0.1
8A
1.5
92
.97
B9
.23
7.1
4B
17
.90
26
4.7
7
Po
pu
lati
on
den
sity
urb
anar
ea7
99
2.6
1C
59
66
.76
30
76.6
4B
34
15
.42
23
88
.18A
21
72
.50
34
33
.08
B4
60
5.7
51
56
.04
Po
pu
lati
on
den
sity
mun
icip
alit
y2
65
4.7
5D3
53
8.5
22
9.2
7A
36
.78
20
5.0
5C
30
2.4
98
8.1
5B
14
4.7
94
94
.66
%o
fap
artm
ent
com
ple
xes
inh
ou
sin
g7
4.6
2C
15
.82
20
.65
A1
6.5
43
5.0
5B
20
.16
26
.33
B1
7.9
13
13
.53
%o
fsi
ng
le-f
amil
ym
ain
ho
mes
inh
ou
sin
g2
5.3
8A
15
.82
79
.35
C1
6.5
46
4.9
5B
20
.16
73
.66
B,
C1
7.9
13
13
.53
%o
fse
con
dh
om
esin
ho
usi
ng
12
.23
A1
4.2
92
7.0
6C
19
.53
23
.07
B2
0.8
41
4.0
9A
,B
11
.27
71
.03
Th
ev
alues
hig
hli
ghte
din
bo
ldco
rres
po
nd
toth
ety
po
log
yh
avin
gth
em
axim
um
or
min
imu
mav
erag
ev
alu
eso
fth
eg
iven
indic
ato
r.L
ette
rs(A
,B,C
,D)
indic
ate
the
sig
nifi
can
tly
dif
fere
nt
gro
ups
exis
ten
tal
ong
the
val
ues
of
the
sam
ple
,w
hic
hg
rou
ps
typ
olo
gie
sac
cord
ing
tosi
gn
ifica
nt
dif
fere
nce
s
Integrating energy and land-use planning 943
123
Ta
ble
6R
esult
so
fK
rusk
all
Wal
lis
test
inel
ectr
icit
yco
nsu
mpti
on
var
iab
les
(all
resu
lts
had
7,8
14
ascr
itic
alv
alu
eo
fK
and
ap
val
ue\
0.
00
01
and
anal
pha
val
ue
of
0.0
5,
and
3d
egre
eso
ffr
eed
om
)
Ty
pe
1:
Cit
ies
(n=
10
0)
2:
Sm
all
vil
lag
es(n
=5
37
)3
:S
ub
urb
anto
wn
s(n
=2
65
)4
:In
du
stri
alv
illa
ges
(n=
43
)v2
Var
iab
leM
ean
SD
Mea
nS
DM
ean
SD
Mea
nS
D
TE
C_
SA
(MJ)
7.4
9E
10
8C
8.3
7E
?0
81
.36E
?0
7A
2.2
1E
?0
77
.70
E?
07
B9
.92E
?0
72
.18E
?0
8B
3.7
1E
?0
85
04
.96
87
64
TE
C_
PS
(MJ)
3.7
8E
10
8C
6.5
8E
?0
84
.36E
?0
6A
1.1
9E
?0
73
.45
E?
07
B7
.09E
?0
72
.02E
10
8C
3.6
0E
?0
84
66
.42
31
71
TE
C_
S&
G(M
J)2
.17
E1
08
C2
.43
E?
08
4.0
2E
?0
6A
7.8
2E
?0
62
.08
E?
07
B2
.80E
?0
79
.00E
?0
6B
8.7
3E
?0
64
55
.82
3
TE
C_
HH
(MJ)
1.5
0E
10
8C
1.6
0E
?0
84
.27E
?0
6A
6.6
1E
?0
62
.05
E?
07
B2
.23E
?0
76
.06E
?0
6A
5.7
3E
?0
64
58
.16
7
%T
EC
_A
G0
.55
8A
2.5
05
9.6
13C
12
.33
11
.25
5A
.B2
.174
2.5
08
B4
.786
19
7.5
17
39
3
%T
EC
_P
S4
2.9
87
C2
4.1
81
16
.00
1A
21
.41
53
2.7
56
B2
5.1
05
83
.86
9D
18
.20
82
61
.10
2
%T
EC
_S
&G
31
.42
5B
14
.01
33
1.1
84
B1
7.9
74
30
.37
8B
15
.69
21
0.1
25
A1
6.7
91
76
.65
72
76
7
%T
EC
_H
H2
5.0
31
B1
3.7
04
43
.01
5D
18
.53
93
4.3
58
C1
6.7
46
4.7
52
A2
.608
20
5.2
74
48
9
TE
Cp
erh
a_u
rban
area
1.6
08
C1
.31
60
.422
A0
.54
10
.52
2B
0.4
87
3.3
41C
3.3
36
29
9.0
07
28
1
EM
R_
PS
(MJ/
h)
40
.78
8C
66
.03
42
2.1
97
A5
8.1
15
28
.98
4B
51
.04
42
06
.64
2D2
80
.29
31
94
.22
92
69
EM
R_
S&
G(M
J/h
)1
9.2
14
A2
0.3
70
36
.10
9C
58
.73
42
4.8
15
B1
8.7
57
38
.25
5B
,C
67
.81
04
4.4
01
61
8
EM
R_
SA
(MJ/
h)
3.7
43
B5
.91
01
.838
A1
.46
32
.67
4B
1.6
55
17
.40
5C
12
.59
52
29
.76
49
05
EM
R_
HH
(MJ/
h)
0.5
86
A0
.15
70
.694
B0
.36
60
.81
8C
0.4
61
0.6
37
A,
B0
.165
66
.30
97
47
4
Av
erag
eT
EC
per
HH
(MJ/
HH
)1
.32
E?
04
A3
.20
E?
03
1.5
4E
?0
4B
7.8
0E
?0
31
.80
E1
04
C9
.48E
?0
31
.49E
?0
4B
4.4
1E
?0
36
6.1
09
28
83
Av
erag
eT
EC
per
per
son
inth
eH
H(M
J/p
erso
nin
HH
)4
70
0.8
62
A1
25
3.2
69
56
08.4
33
A.B
29
14
.21
66
48
3.0
05C
37
73
.44
45
11
2.1
46
B1
35
7.9
20
56
.71
38
33
4
Th
ev
alu
esh
igh
lig
hte
din
bo
ldco
rres
po
nd
toth
ety
po
log
yh
avin
gth
em
axim
um
aver
age
val
ues
of
the
giv
enin
dic
ato
r.L
ette
rs(A
,B,C
,D)
ind
icat
eth
esi
gn
ifica
ntl
yd
iffe
ren
tg
rou
ps
exis
ten
tal
on
gth
ev
alues
of
the
sam
ple
,w
hic
hg
rou
ps
typ
olo
gie
sac
cord
ing
toth
esi
gn
ifica
nt
dif
fere
nce
s
944 P. Ariza-Montobbio et al.
123
electricity (see %TECPS in Table 6). Although cities consume more in absolute terms, both
at the level of whole municipality and at the level of productive sectors, industrial villages
consume more per hour of human activity (both in EMRSA and in EMRPS) and per hectare
of urban area (TECper haurban area). As industrial employment attractors (66 % of activity),
but with lower proportions of land dedicated to industrial parks, they consume electricity
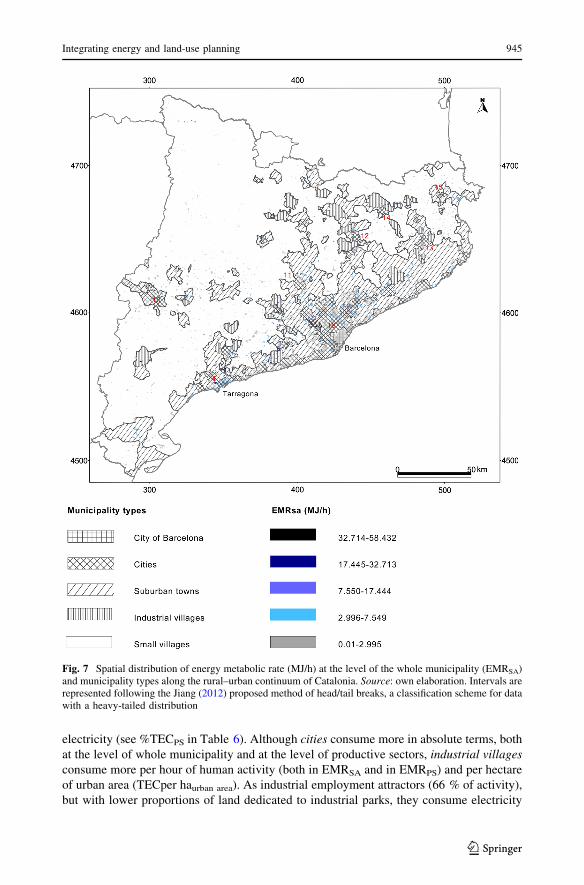
Fig. 7 Spatial distribution of energy metabolic rate (MJ/h) at the level of the whole municipality (EMRSA)and municipality types along the rural–urban continuum of Catalonia. Source: own elaboration. Intervals arerepresented following the Jiang (2012) proposed method of head/tail breaks, a classification scheme for datawith a heavy-tailed distribution
Integrating energy and land-use planning 945
123
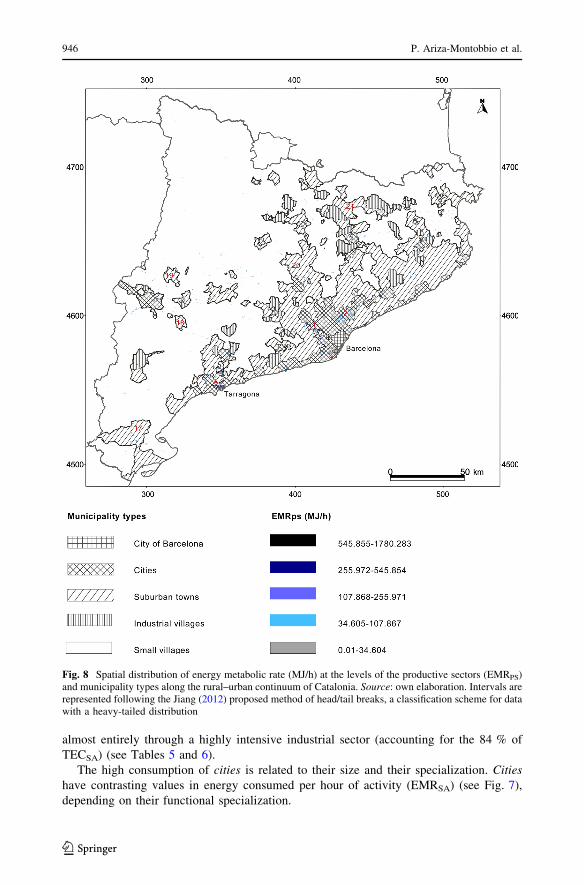
almost entirely through a highly intensive industrial sector (accounting for the 84 % of
TECSA) (see Tables 5 and 6).
The high consumption of cities is related to their size and their specialization. Cities
have contrasting values in energy consumed per hour of activity (EMRSA) (see Fig. 7),
depending on their functional specialization.
Fig. 8 Spatial distribution of energy metabolic rate (MJ/h) at the levels of the productive sectors (EMRPS)and municipality types along the rural–urban continuum of Catalonia. Source: own elaboration. Intervals arerepresented following the Jiang (2012) proposed method of head/tail breaks, a classification scheme for datawith a heavy-tailed distribution
946 P. Ariza-Montobbio et al.
123
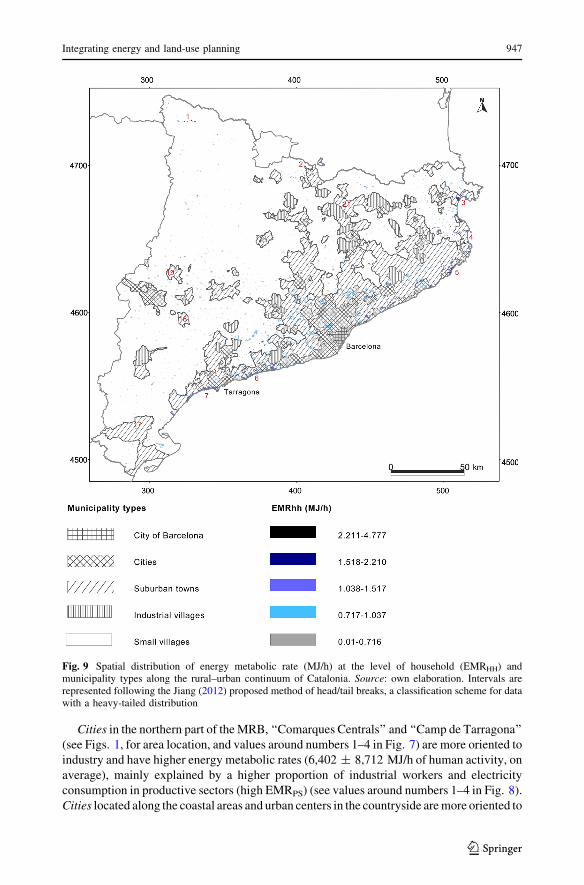
Cities in the northern part of the MRB, ‘‘Comarques Centrals’’ and ‘‘Camp de Tarragona’’
(see Figs. 1, for area location, and values around numbers 1–4 in Fig. 7) are more oriented to
industry and have higher energy metabolic rates (6,402 ± 8,712 MJ/h of human activity, on
average), mainly explained by a higher proportion of industrial workers and electricity
consumption in productive sectors (high EMRPS) (see values around numbers 1–4 in Fig. 8).
Cities located along the coastal areas and urban centers in the countryside are more oriented to
Fig. 9 Spatial distribution of energy metabolic rate (MJ/h) at the level of household (EMRHH) andmunicipality types along the rural–urban continuum of Catalonia. Source: own elaboration. Intervals arerepresented following the Jiang (2012) proposed method of head/tail breaks, a classification scheme for datawith a heavy-tailed distribution
Integrating energy and land-use planning 947
123
services and have lower EMRSA (1,895 ± 0,771 MJ/h, see numbers 10–16 in Fig. 7).
‘‘Industrial cities’’ consume a lot of energy per hectare due to their industrial parks (see
numbers 1–4 in Fig. 8). ‘‘Service cities,’’ on the contrary, do so, because of high density of
population and service activity. They are big compact cities with high concentrations of
apartment buildings which have intermediate densities of electricity consumption per hectare
but comparatively low intensities of consumption, per hour of human activity (see the contrast
between numbers 10–16 and Barcelona city in Figs. 6 and 7).
4.3 Electricity consumption in the household sector: suburban towns and small
villages
Suburban towns and small villages consume less electricity as compared to industrial
villages and cities and have a distinct complementary metabolic pattern (see Table 6).
They tend to play a residential role, sending workers to cities and industrial villages
(%Active Residents working outside in Table 4). Where people live and work in the same
village (%Residing Workers in Table 4), total municipal electricity consumption (Table 6)
tends to be lower and the share attributable to the household sector (%TECHH) higher.
Suburban towns and small villages, in comparison, consume more electricity per hour
spent in the household (EMRHH) and less per hectare of urban area (TEC per haurban area)
than the other two types. While the average number of people per household is similar
across municipality types, suburban towns have the highest average consumption of
electricity per household and per person living in the home. High EMRHH and low TEC per
haurban area, thus, seem to be related to a lifestyle characterized by consumerism in low-
density urban sprawl (37 % of urban area of this type, see Table 5).
A closer look at the spatial distribution of EMRHH (see Fig. 9) reveals that further
specialization takes place among suburban towns, depending upon where they are located
within the urban system. The highest energy consumption per hour spent in the household
takes place in the northern mountain areas (numbers 1 and 2 in Fig. 9) and in coastal areas
to the north (‘‘Costa Brava’’ in ‘‘Comarques Gironines’’, see values around numbers 3–5)
and to the south (‘‘Costa Daurada’’ in ‘‘Camp de Tarragona,’’ values around numbers 6 and
7). Suburban towns in these areas are touristic, with high income per capita and, on
average, more than 60 % of the urban land is low-density urbanization with a high pro-
portion of single-person households (16 %) and of second homes (60 %). There is scant
industrial activity and most of the population works in services. Households in such high-
income, touristic areas consume, per hour of activity, the triple the electricity of cities or
small villages in the southern countryside.12
12 Since detailed data about differences in the number and use of electric appliances at the level ofmunicipality are not available in IDESCAT 2001, we cannot assess their influence in explaining thissubstantial difference of EMRHH in coastal touristic areas. However, our results show statistically significantdifferences between higher incomes, higher proportion of single-person households, higher proportion ofsecond homes and the lower urban densities in touristic and coastal suburban towns. Higher incomes andhigher proportions of single-person households in these municipalities seem plausible explanations. As willbe explained subsequently, the higher proportion of single-person households correlates with higher needsfor appliances for more people who live alone. The higher proportion of second homes, however, does notnecessarily explain the higher consumption, and it could even entail some bias in the results. People onvacation are not registered in the census as permanent dwellers and could not be accounted in the calcu-lation, leading us to attribute the consumption of both permanent dwellers and vacationers, to only thedwellers. However, we think that this bias is distributed all along the sample. All municipalities with secondhomes will bear the same potential bias. Regarding lower urban densities, other studies, such as Tello(2005), have shown how the electricity consumption per capita, the number of cars per capita and the water
948 P. Ariza-Montobbio et al.
123
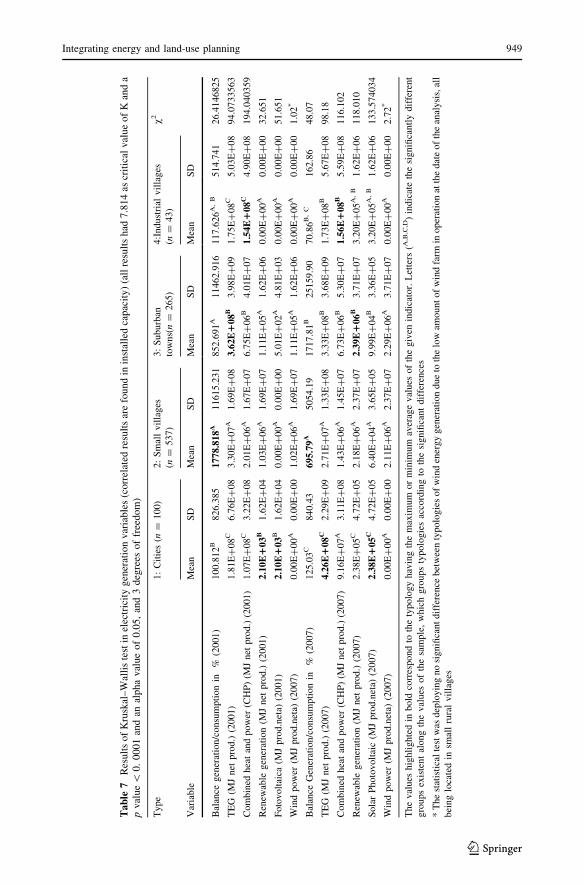
Ta
ble
7R
esult
sof
Kru
skal
–W
alli
ste
stin
elec
tric
ity
gen
erat
ion
var
iable
s(c
orr
elat
edre
sult
sar
efo
und
inin
stal
led
capac
ity)
(all
resu
lts
had
7.8
14
ascr
itic
alv
alu
eo
fK
and
ap
val
ue\
0.
00
01
and
anal
pha
val
ue
of
0.0
5,
and
3d
egre
eso
ffr
eed
om
)
Type
1:
Cit
ies
(n=
100)
2:
Sm
all
vil
lages
(n=
537)
3:
Suburb
an
tow
ns(
n=
265)
4:I
ndust
rial
vil
lages
(n=
43)
v2
Var
iable
Mea
nS
DM
ean
SD
Mea
nS
DM
ean
SD
Bal
ance
gen
erat
ion/c
onsu
mpti
on
in%
(2001)
100.8
12
B826.3
85
1778.8
18
A11615.2
31
852.6
91
A11462.9
16
117.6
26
A,
B514.7
41
26.4
146825
TE
G(M
Jnet
pro
d.)
(2001)
1.8
1E
?08
C6.7
6E
?08
3.3
0E
?07
A1.6
9E
?08
3.6
2E
108
B3.9
8E
?09
1.7
5E
?08
C5.0
3E
?08
94.0
733563
Com
bin
edhea
tan
dpow
er(C
HP
)(M
Jnet
pro
d.)
(2001)
1.0
7E
?08
C3.2
2E
?08
2.0
1E
?06
A1.6
7E
?07
6.7
5E
?06
B4.0
1E
?07
1.5
4E
108
C4.9
0E
?08
194.0
40359
Ren
ewab
legen
erat
ion
(MJ
net
pro
d.)
(2001)
2.1
0E
103
B1.6
2E
?04
1.0
3E
?06
A1.6
9E
?07
1.1
1E
?05
A1.6
2E
?06
0.0
0E
?00
A0.0
0E
?00
32.6
51
Foto
volt
aica
(MJ
pro
d.n
eta)
(2001)
2.1
0E
103
B1.6
2E
?04
0.0
0E
?00
A0.0
0E
?00
5.0
1E
?02
A4.8
1E
?03
0.0
0E
?00
A0.0
0E
?00
51.6
51
Win
dpow
er(M
Jpro
d.n
eta)
(2007)
0.0
0E
?00
A0.0
0E
?00
1.0
2E
?06
A1.6
9E
?07
1.1
1E
?05
A1.6
2E
?06
0.0
0E
?00
A0.0
0E
?00
1.0
2*
Bal
ance
Gen
erat
ion/c
onsu
mpti
on
in%
(2007)
125.0
3C
840.4
3695.7
9A
5054.1
91717.8
1B
25159.9
070.8
6B
,C
162.8
648.0
7
TE
G(M
Jnet
pro
d.)
(2007)
4.2
6E
108
C2.2
9E
?09
2.7
1E
?07
A1.3
3E
?08
3.3
3E
?08
B3.6
8E
?09
1.7
3E
?08
B5.6
7E
?08
98.1
8
Com
bin
edhea
tan
dpow
er(C
HP
)(M
Jnet
pro
d.)
(2007)
9.1
6E
?07
A3.1
1E
?08
1.4
3E
?06
A1.4
5E
?07
6.7
3E
?06
B5.3
0E
?07
1.5
6E
108
B5.5
9E
?08
116.1
02
Ren
ewab
legen
erat
ion
(MJ
net
pro
d.)
(2007)
2.3
8E
?05
C4.7
2E
?05
2.1
8E
?06
A2.3
7E
?07
2.3
9E
106
B3.7
1E
?07
3.2
0E
?05
A,
B1.6
2E
?06
118.0
10
Sola
rP
hoto
volt
aic
(MJ
pro
d.n
eta)
(2007)
2.3
8E
105
C4.7
2E
?05
6.4
0E
?04
A3.6
5E
?05
9.9
9E
?04
B3.3
6E
?05
3.2
0E
?05
A,
B1.6
2E
?06
133.5
74034
Win
dpow
er(M
Jpro
d.n
eta)
(2007)
0.0
0E
?00
A0.0
0E
?00
2.1
1E
?06
A2.3
7E
?07
2.2
9E
?06
A3.7
1E
?07
0.0
0E
?00
A0.0
0E
?00
2.7
2*
The
val
ues
hig
hli
ghte
din
bold
corr
espond
toth
ety
polo
gy
hav
ing
the
max
imum
or
min
imum
aver
age
val
ues
of
the
giv
enin
dic
ator.
Let
ters
(A,B
,C,D
)in
dic
ate
the
signifi
cantl
ydif
fere
nt
gro
ups
exis
tent
along
the
val
ues
of
the
sam
ple
,w
hic
hgro
ups
typolo
gie
sac
cord
ing
toth
esi
gnifi
cant
dif
fere
nce
s
*T
he
stat
isti
cal
test
was
dep
loyin
gno
signifi
cant
dif
fere
nce
bet
wee
nty
polo
gie
sof
win
den
ergy
gen
erat
ion
due
toth
elo
wam
ount
of
win
dfa
rmin
oper
atio
nat
the
dat
eof
the
anal
ysi
s,al
l
bei
ng
loca
ted
insm
all
rura
lvil
lages
Integrating energy and land-use planning 949
123
Suburban towns play a different role in the southern countryside, where they serve as
local capitals and economic centers, or where they form part of the industrial fabric of the
center and north. In these cases, they consume half as much electricity per hour in the
household sector (see numbers 17–21 in Fig. 9) and have higher-density urban areas, less
urban sprawl and lower percentages of second homes. Their human time is dedicated less
to services and more to industry, which explains their higher energy throughput per hectare
and higher EMRPS compared with the touristic and high-income towns and the commuter
dormitories surrounding metropolitan centers (see numbers 17–21 in Figs. 6 and 8).
Small villages reproduce the influence marked by the specialization of the nearest
suburban towns. Villages closer to high-income and touristic towns, for example, have
more urban sprawl, more percentage of second homes and more service activity. Conse-
quently, they have higher energy consumption rates per hour and per hectare, as compared
to more agrarian-oriented small villages of the southern countryside which are among the
lowest energy consumers per hectare and per hour of human activity.
4.4 Electricity generation
This spatial segregation of functions along the urban system is fed by a centralized and
concentrated system of electricity generation. Power plants in southern suburban towns
and northern small villages generate around 1,000 times more electricity than these
municipalities consume. Although there is, on average, some balance between generation
and consumption in cities and industrial villages [mainly due to the distribution of fossil
fuel-based combined heat and power (CHP)] (see Table 7), summing up all types of
electricity generation, suburban towns generate twice as much electricity as cities and
industrial villages. Renewable electricity generation in 2007 was ten times higher in small
villages and suburban towns than in cities. Although from 2001 to 2007, renewable energy
supply grew in the high-consuming industrial villages, it is still seven times lower than in
small villages and suburban towns. Renewable generation in cities and industrial villages
is entirely photovoltaic, while wind energy is generated only in small villages.
5 Distributed energy generation versus functional urban specialization:on the need for qualitative changes
The preceding review of four types of Catalan municipalities has allowed us to identify
relationships between the demographics, economic activity, mobility and electricity con-
sumption of different communities, distributed across the urban system. Differences found
in metabolic rates relate to the role undertaken by municipality types, illustrating current
urban functional specialization13 (Duranton and Puga 2005) and spatial segregation of
working and residential activities. We find that segregation of activities between cities and
industrial villages, where the paid work takes place, and suburban towns and small
Footnote 12 continuedconsumption per capita are strongly correlated with low-density urbanization. This helps to explain the highlevel of electricity consumption in the household sector.13 Technological progresses in transport and telecommunications have made it less costly for firms toseparate their production facilities from their management headquarters. Manufacturing sites are clustered insmaller but more numerous cities, while business and services centers are few and large cities that con-centrate abundant business service employment (Duranton and Puga 2005).
950 P. Ariza-Montobbio et al.
123
villages, where the workers reside, correlates with high speeds and densities of electricity
throughput. As Lobo and Baena (2009) have suggested, we find that areas with faster
growth and more economic dynamism, whether in residential or industrial activity, located
at the edge of urban sprawl, concentrate higher energy dissipation.
On the other side of the coin, our analysis shows an unbalanced pattern of electricity
generation, concentrated in towns close to the municipalities with the lowest consump-
tion, in the southern countryside. In both the paid work and the household sectors,
metabolic rates of electricity consumption are higher in the north and center of Catalonia.
The current distribution of electricity consumption depends upon large centralized grids,
incurring non-negligible losses through transmission and distribution. The high electricity
consumption of northern industrial villages and suburban towns suggests that these areas
should be prioritized for the development of renewable energy projects, both on effi-
ciency grounds and with reference to environmental justice (Ortega and Calaf 2010),
which suggests that high consumption areas should bear the brunt of generation. This had
begun to happen, with an increase in photovoltaics in industrial villages between 2001
and 2007. However, merely generating closer to consumption does not address the
intensity differential that we observed, which appears to be related rather to the segre-
gation of residential and productive activities. Co-occurrence of residence and work can,
on balance, be expected to reduce electricity consumption and would also reduce
mobility-related energy demand.
Our data suggest that urban planning targeted toward a structural qualitative change is
needed, if overall energy consumption is to be reduced. Our results confirm that dis-
persed urban land use, associated with larger houses and more detached units, which
consume more energy (in heat and electricity), is correlated with higher-intensity elec-
tricity consumption (Ewing and Rong 2008, Tello 2005). Suburban towns, with higher
per capita income and greater degrees of urban sprawl, are consuming more electricity
per hour of activity. Tello (2005), in diagnosing the environmental problems related to
urban sprawl in the Metropolitan Region of Barcelona, shows similar results, with
correlations between low-density urbanization and higher electricity and water con-
sumption per capita and higher number of cars per inhabitant. Suburban towns are also
the municipalities where there are a higher percentage of single-person households,
which are growing in number regionally in Catalonia and in Spain (Gamboa 2009;
Ramos-Martın et al. 2009) and elsewhere (Liu et al. 2003; Williams 2007). Although
economies of scale are less pronounced in electricity than in natural gas consumption for
heating (Brounen et al. 2012), our data suggest that the more people live alone and the
higher the proportion of detached houses in a municipality, the more electricity will be
consumed. The increasing number of appliances in single-person households, no matter
how efficient they are, lies behind the reported findings that efficiency gains are offset by
demographic changes in household size and household area (detached households in
urban sprawl areas) (Freire 2011; Gram-Hanssen et al. 2004; Kaza 2010), which can be
attributed to the rebound effect or Jevons Paradox (Giampietro and Mayumi 2008;
Jevons 1866).
Our results also suggest that urban planning measures should be aware of the risk of
mistakenly supporting the promotion of ‘‘smart cities’’ oriented to services (Domingue
et al. 2011). While service cities consume less electricity per hour of activity, such mea-
sures would be once again geographically externalizing high-energy throughput agricul-
tural and industrial activities. Instead, our data suggest that low-energy future urban
planning should focus on balancing the spatial distribution of land- and time uses.
Integrating energy and land-use planning 951
123
Recovering Howard’s (1898) (1985 [1898]) idea of promoting the creation of poly-
centric urban systems (Catalan et al. 2008), composed of networked compact medium-size
cities, towns and villages, Catalonian society could aim to relocate existing nodes of dense
electricity consumption toward a diversified collection of centers. Promoting diversified
economic activity, including concrete work opportunities in the agrarian sector, could help
to revitalize rural areas and balance out rapid urban growth. The recovering of integral
management of the agroforestry mosaic can be expected not only to provide new oppor-
tunities for young people who currently are moving to the cities but also to represent a
chance to more efficiently distribute electricity consumption in rural areas. In keeping with
Tello et al. (2013), our results suggest that increasing local, decentralized renewable
energy supplies in Catalonia has the potential to facilitate the integration of renewable
energies within wider efforts to recover the region’s agroforestry mosaic.
However, polycentric compact medium-size cities and revitalized rural areas should not
be confused with urban sprawl and the ‘‘consumption countryside,’’ where urban residents
consume the amenities of an ‘‘untouched’’ rural landscape (Marsden 1999). Urban sprawl
diffuses urban lifestyles to a very interrelated network of small villages promoting a
‘‘liquid rurality’’ where commuting is the principal mode of integration into labor markets
(Camarero 2009). Part of the current blurring of traditional boundaries of rural and urban
areas has been the result of this urbanization of the countryside. In our study, we have
found that co-occurrence of work and residence is correlated with lower intensity and
lower overall electricity consumption. Urban and spatial planning for a renewable energy
transition, thus, should promote such co-occurrence, transforming both city and country-
side together.
Our results and methodology can be used, when combined with participatory and multi-
criteria decision support methodologies (Munda 2008) to assess the plausibility and
energetic sustainability of different scenarios in land-use planning and urban growth in
Catalonia. For example, because it illustrates that urban growth centered and limited to the
outskirts of medium-size, compact and multi-functional towns would entail lower energy
consumption than exacerbating the urban sprawl of low-density and mono-functional co-
nurbations for commuter’s residence. This assessment would help society to reflect upon
the energy saving potential of qualitative changes in the spatial distribution of demographic
structures.
6 Conclusions
In the preceding pages, we have characterized a typology of municipalities based on a
combination of demographic, land-use and human activity data and associated energy
metabolic profiles. We found that electricity consumption is related to functional spe-
cializations in roles undertaken by different types of municipalities within the urban system
of Catalonia, Spain. Municipality types were found to have differing household and paid
work sector metabolic profiles, dependent upon whether they serve mainly an industrial,
services or residential role. Segregation between work activity and residence was found to
be correlated with increases in both overall electricity consumption and in both its rate (per
hour) and density (per hectare). In contrast, we found an inverse correlation associated with
higher the coincidences of paid work activity and place of residence in a municipality,
which corresponded with increasingly lower electricity consumption per hectare and per
hour of human activity. This suggests that future energy system planning should pay
952 P. Ariza-Montobbio et al.
123
attention not only to where new generation facilities are located but also to where and how
economic activities and residential settlements are distributed across a region.
Potential further applications of the approach presented here might include: referencing
additional data on heating and transport energy demand, which could provide insights
regarding how overall demand can be reduced; or extending the boundaries of the meta-
bolic profiles into other spatial dimensions relevant for sustainability, based on data
concerning, for example, water supply and consumption or waste generation. An update of
the present analysis, using data from after the 2007 financial crisis also seems recom-
mendable, as current energy demands in Catalonia have certainly been impacted. Future
research could also, for example, examine how smart-grid installations might be used to
help gather anonymous disaggregated, geo-referenced data on energy consumption by
household type at the level of municipality. Our study suggests that the availability of such
data could be quite useful for better understanding how household sector composition,
urban densities, urban hierarchy and energy consumption are related.
Our study began with the presumption that energy generation will be more distributed in
the coming energy scarce future. Our results suggest that this will need to be comple-
mented by structural and social transformations that coordinate the energy system with
spatial planning. In particular, a distributed generation plan that fails to reverse the spatial
segregation of residential and work activities, which is correlated with not only higher
transport demands, but also higher electricity consumption, seems unlikely to reduce
overall consumption and maximize efficiency of distribution. Living in a society based on
renewable energy requires new thinking concerning overall energy supply and individual
demand. However, this is not enough. Careful attention to social and demographic
transformations is needed, and cumulative energy demands need to be adjusted to the
spatially differentiated capacities and constraints of a distributed energy system.
Acknowledgments We would like to thank Joan Esteve, Albert Casanovas, Meritxell Baraut and MerceGarcıa from the Catalan Institute of Energy (ICAEN), Dolors Olivares, Marta Masats and Maite Car-amazana from the Catalan Institute of Statistics (IDESCAT) for their kind delivery of the data we requested.We also thank the anonymous reviewers for their careful reading. Their insights helped to improve sub-stantially the text. We would like also thank Joan Martinez-Alier for his intellectual support. We also wouldlike to thank Arnim Scheidel, Violeta Cabello and Alevgul Sorman who provided helpful comments andinsights to previous versions of this paper. We thank Marta Borros who helped in GIS techniques and mapselaboration and Sara Mingorrıa who helped in statistical analysis. The fourth author acknowledges supportfrom (i) the Consolidated Research Group on ‘‘Economic Institutions, Quality of Life and the Environ-ment,’’ SGR2009–00962; and (ii) the Spanish Ministry for Science and Innovation project HAR-2010-20684-C02-01. The first author acknowledges support from the Spanish Government funded researchproject Metabolismo Social y Conflictos Ambientales (CSO2010 21979).
References
Abdi, H., & Williams, L. J. (2010). Principal component analysis. Wiley Interdisciplinary Reviews Com-putational Statistics, 2(4), 433–459.
Abramsky, K. (Ed.). (2010). Sparking a worldwide energy revolution. Social struggles in the transition to apost-petrol world. Oakland, Edinburgh, Baltimore: AK Press.
Ackermann, T., Andersson, G., & Soder, L. (2001). Distributed generation: A definition. Electric PowerSystems Research, 57(3), 195–204.
Alanne, K., & Saari, A. (2006). Distributed energy generation and sustainable development. Renewable andSustainable Energy Reviews, 10(6), 539–558.
Alcantara, V., & Duarte, R. (2004). Comparison of energy intensities in European Union countries. Resultsof a structural decomposition analysis. Energy Policy, 32(2), 177–189.
Integrating energy and land-use planning 953
123
Alcantara, V., & Padilla, E. (2003). ‘‘Key’’ sectors in final energy consumption: An input-output applicationto the Spanish case. Energy Policy, 31(15), 1673–1678.
Brereton, F., Bullock, C., Clinch, J. P., & Scott, M. (2011). Rural change and individual well-being: Thecase of Ireland and rural quality of life. European Urban and Regional Studies, 18(2), 203–227. doi:10.1177/0969776411399346.
Brounen, D., Kok, N., & Quigley, J. M. (2012). Residential energy use and conservation: Economics anddemographics. European Economic Review, 56(5), 931–945.
Camarero, L. A. (Ed.). (2009). The rural population in Spain. From disequilibrium to social sustainability.Barcelona: La Caixa Foundation.
Catalan, B., Saurı, D., & Serra, P. (2008). Urban sprawl in the Mediterranean? Patterns of growth andchange in the Barcelona Metropolitan Region 1993–2000. Landscape and Urban Planning, 85(3–4),174–184.
Cusso, X., Garrabou, R., & Tello, E. (2006). Social metabolism in an agrarian region of Catalonia (Spain) in1860–1870: Flows, energy balance and land use. Ecological Economics, 58(1), 49–65.
D’Alisa, G., & Cattaneo, C. (2012). Household work and energy consumption: A de growth perspective.Catalonia’s case study. Journal of Cleaner Production, 38, 71–79.
Domingue, J., Galis, A., Gavras, A., Zahariadis, T., Lambert, D., Cleary, F., et al. (2011). Smart cities andthe future internet: Towards cooperation frameworks for open innovation. In The future internet (Vol.6656, pp. 431–446, Lecture Notes in Computer Science): Springer, Berlin, Heidelberg.
Duranton, G., & Puga, D. (2005). From sectoral to functional urban specialisation. Journal of UrbanEconomics, 57(2), 343–370.
Eisenmenger, N., Ramos-Martın, J., & Schandl, H. (2007). Analisis del metabolismo energetico y demateriales de Brasil, Chile y Venezuela. Revista Iberoamericana de Economıa Ecologica, 6, 17–39.
Entrena-Duran, F. (1998). Cambios en la construccion social de lo rural: De la autarquıa a la global-izacion. Madrid: Tecnos.
Ewing, R., & Rong, F. (2008). The impact of urban form on U.S. residential energy use. Housing PolicyDebate, 19(1), 1–30.
Falconı-Benıtez, F. (2001). Integrated assessment of the recent economic history of Ecuador. Populationand Environment, 22(3), 257–280.
Farhangi, H. (2010). The path of the smart grid. IEEE power & energy magazine. January/February 2010.FMR (2009). Atles de la nova ruralitat (Atlas of the new rurality). Fundacio del Mon Rural (FMR). http://
www.fmr.cat/atles/.Freire, J. (2011). Eficiencia Energetica i Efecte Rebot Desenvolupaments Metodologics i Evidencia
Empırica. Barcelona: Facultat de Ciencies Economiques i Empresarials Universitat Autonoma deBarcelona.
Gamboa, G. (2009). Application of the MuSIASEM approach to the analysis of the household sector: Thesupply and requirement of working hours to/from the service sector in Catalonia. Report of theCatalonia case study Deliverable 8, WP 3—Document C. http://www.smile-fp7.eu/deliverables/SMILE%20D8%20Document%20C.pdf.
Gasparatos, A., El-Haram, M., & Horner, M. (2009). Assessing the sustainability of the UK society usingthermodynamic concepts: Part 2. Renewable and Sustainable Energy Reviews, 13(5), 956–970.
GENCAT (1995). Pla Territorial General de Catalunya (PTGC). http://www20.gencat.cat/portal/site/territori/menuitem.2a0ef7c1d39370645f13ae92b0c0e1a0/?vgnextoid=3440a9c1aa9b7210VgnVCM1000008d0c1e0aRCRD.
GENCAT. (2002). Classificacio dels usos del sol a Catalunya 2002. Classification of land uses of Catalonia2002. http://www20.gencat.cat/portal/site/territori/menuitem.2a0ef7c1d39370645f13ae92b0c0e1a0/?vgnextoid=9384a43a6a72b310VgnVCM1000008d0c1e0aRCRD&vgnextchannel=9384a43a6a72b310VgnVCM1000008d0c1e0aRCRD&vgnextfmt=default.
Georgescu-Roegen, N. (1971). The enthropy law and the economic process. London, England: HarvardUniversity Press.
Giampietro, M., Mayumi, K. (2008). The Jevons Paradox: The evolution of complex adaptive systems andthe challenge for scientific analysis. In Polimeni, J. M., Mayumi, K., Giampietro, M. (eds.) The jevonsparadox and the myth of resource efficiency Improvements. Earthscan. pp. 79–140. ISBN1-84407-462-5.
Giampietro, M., Mayumi, K., & Ramos-Martin, J. (2009). Multi-scale integrated analysis of societal andecosystem metabolism (MuSIASEM): Theoretical concepts and basic rationale. Energy, 34(3),313–322.
Gilbert, R., Perl, A. (2010). Transportation in the post-carbon world. http://www.postcarbon.org/Reader/PCReader-Perl-Transportation.pdf. Accessed February 19, 2013.
954 P. Ariza-Montobbio et al.
123
Gram-Hanssen, K., Ropke, I., & Reisch, L. A. (2004). Domestic electricity consumption-consumers andappliances. In I. Røpke & L. A. Reisch (Eds.), The ecological economics of consumption (1st ed.,pp. 132–150). Cheltenham, UK: Edward Elgar.
Hardle, W., & Simar, L. (2012). Applied multivariate statistical analysis (3rd ed.). Heidelberg: Springer.Howard, E. (1985 [1898]). Garden cities of tomorrow: Powys: Attic books.ICAEN (2009). Estadıstiques Energetiques de Catalunya. Dades de Produccio Electrica. (Energy statistics of
catalonia. Electricity production data). http://www15.gencat.cat/icaen_prd_elec/.ICAEN (2010). Generacio d’energia electrica (Kwh) per tipus de central i capacitat instal�lada (Kw) a nivell
municipal. Consum d’energia electrica per codi d’activitat economica (CNAE 2009 i CNAE-93) anivell municipal. Anys 1992, 1996, 2001, 2006 i 2007. (Electricity generation (Kwh) per power planttype and installed capacity at the municipality level. Electricity consumption per economic activitycode (CNAE 2009 i CNAE-93) at the municipality level. Years 1992, 1996, 2001, 2006 and 2007. Dataprovided under data protection and statistical confidenciality agreement by the Institut Catala de laEnergia (ICAEN).
ICC(2012), Base de lımits administratius 1:250.000, Institut Cartografic de Catalunya (ICC) (� Carto-graphic base property of Institut Cartografic de Catalunya. http://www20.gencat.cat/portal/site/territori/menuitem.2a0ef7c1d39370645f13ae92b0c0e1a0/?vgnextoid=5e8a159adcc4c310VgnVCM1000008d0c1e0aRCRD&vgnextchannel=5e8a159adcc4c310VgnVCM1000008d0c1e0aRCRD&vgnextfmt=defaultand http://www.icc.cat (Accessed on 8 July, 2012).
IDESCAT (2001). Cens de poblacio (2001). Population census (2001). http://www.idescat.cat/cataleg/?tc=c&idp=64&lang=en.
IEA. (2012). Energy balances of OECD countries. IEA statistics. International energy agency. http://www.oecd-ilibrary.org/energy/energy-balances-of-oecd-countries-2012_energy_bal_oecd-2012-en.
Iorgulescu, R. I., & Polimeni, J. M. (2009). A multi-scale integrated analysis of the energy use in Romania,Bulgaria, Poland and Hungary. WESC 2006, 6th world energy system conference, Advances in EnergyStudies, 5th workshop on Advances, Innovation and Visions in Energy and Energy-related Environ-mental and Socio-Economic Issues, 34(3), 341–347.
Jevons, W. S. (1866). The coal question (2nd ed.). London: Macmillan and Co.Jiang, B. (2012). Head/tail breaks: A new classification scheme for data with a heavy-tailed distribution,
Professional Geographer, x: xx–xx. doi:10.1080/00330124.2012.700499. http://arxiv.org/abs/1209.2801.
Kaza, N. (2010). Understanding the spectrum of residential energy consumption: A quantile regressionapproach. Energy Policy, 38(11), 6574–6585.
Kobrich, C., Rehman, T., & Khan, M. (2003). Typification of farming systems for constructing represen-tative farm models: Two illustrations of the application of multi-variate analyses in Chile and Pakistan.Agricultural Systems, 76(1), 141–157.
Kruskal, W. H., & Wallis, W. A. (1952). Use of ranks in one-criterion variance analysis. Journal of theAmerican Statistical Association, 47(260), 583–621.
Liu, J. D., Daily, G. C., Ehrlich, P. R., & Luck, G. W. (2003). Effects of household dynamics on resourceconsumption and biodiversity. Nature, 421, 530–533.
Lobo, A., Baena, M. A. (2009). A first attempt of geographically-distributed multiscale integrated analysisof societal and ecosystem metabolism (MuSIASEM): Mapping human time and energy throughput inmetropolitan Barcelona, Reports on Environmental Sciences 2. http://www.recercat.net/handle/2072/16100.
Marsden, T. (1999). Rural futures: The consumption countryside and its regulation. Sociologia Ruralis,39(4), 501–526.
Marsden, T. (2009). Mobilities, vulnerabilities and sustainabilities: Exploring pathways from denial tosustainable rural development. Sociologia Ruralis, 49(2), 113–131.
Marull, J., Pino, J., Mallarach, J. M., & Cordobilla, M. J. (2007). The loss of landscape efficiency: anecological analysis of land-use changes in Western Mediterranean agriculture (Valles County, Cata-lonia, 1853–2004). Global Environmental A Journal of History and Natural and Social Sciences, 2,112–150.
Marull, J., Pino, J., Tello, E., & Cordobilla, M. J. (2010). Social metabolism, landscape change and land-useplanning in the Barcelona Metropolitan Region. Land Use Policy, 27(2), 497–510.
Mingorrıa, S., Gamboa, G. (2010). Metabolismo socio-ecologico de comunidades campesinas Q’eqchi’ y laexpansion de la agro-industria de cana de azucar y palma africana: Valle del Rıo Polochic, Guate-mala [Instituto de Ciencia y Tecnologıa Ambiental de la Universidad Autonoma de Barcelona (ICTA/UAB) y el Instituto de Estudios Agrarios de la Coordinacion de ONGs y Cooperativas (IDEAR/CONGCOOP)]: Magnaterra Editores.
Integrating energy and land-use planning 955
123
Munda, G. (2008). Social multi-criteria evaluation for a sustainable economy. Operation research anddecision theory series. Heidelberg, New York: Springer.
Nel�lo, O. (2001). Ciutat de ciutats. Barcelona: Empuries.Ocana-Riola, R., & Sanchez-Cantalejo, C. (2005). Rurality index for small areas in Spain. Social Indicators
Research, 73(2), 247–266.Ortega, M., & Calaf, M. (2010). Equitat ambiental a Catalunya. Integracio de les dimensions ambiental,
territorial i social a la presa de decisions. (Environmental equity in Catalonia. Integration of envi-ronmental, territorial and social dimensions to decision making.). Barcelona: Departament de laVicepresidencia. Consell Assessor per al Desenvolupament Sostenible de Catalunya (CADS).
Pepermans, G., Driesen, J., Haeseldonckx, D., Belmans, R., & D’haeseleer, W. (2005). Distributed gen-eration: Definition, benefits and issues. Energy Policy, 33(6), 787–798.
Prieto-Lara, E., & Ocana-Riola, R. (2010). Updating rurality index for small areas in Spain. Social Indi-cators Research, 95(2), 267–280.
Ramos-Martın, J. (2001). Historical analysis of energy intensity of Spain: From a ‘‘conventional view’’ to an‘‘integrated assessment’’. Population and Environment, 22(3), 281–313.
Ramos-Martın, J., Canellas-Bolta, S., Giampietro, M., & Gamboa, G. (2009). Catalonia’s energy metabo-lism: Using the MuSIASEM approach at different scales. Energy Policy, 37(11), 4658–4671.
Ramos-Martin, J., Giampietro, M., & Mayumi, K. (2007). On China’s exosomatic energy metabolism: Anapplication of multi-scale integrated analysis of societal metabolism (MSIASM). Ecological Eco-nomics, 63(1), 174–191.
Ramos-Martın, J. (Coord.) (2009). Us de l’Energia a Catalunya. Analisi del Metabolisme Energetic del’Economia Catalana (AMEEC). Informes del CADS. Barcelona: Consell Assessor per al Desenvo-lupament Sostenible.
Rifkin, J. (2011). The third industrial revolution: How lateral power is transforming energy the economy,and the world. Basingstoke: Palgrave Macmillan.
Roca, J., & Alcantara, V. (2001). Energy intensity, CO2 emissions and the environmental Kuznets curve.The Spanish case. Energy Policy, 29(7), 553–556.
Saladie, s. (2011). Els conflictes territorials del sistema electric a Catalunya (The territorial conflicts of theelectrical system of Catalonia). Treballs de la Societat Catalana de Geografia, 71–72, 201–221.
Scheidel, A., & Sorman, A. H. (2012). Energy transitions and the global land rush: Ultimate drivers andpersistent consequences. Global Environmental Change, 22(3), 588–595.
Shapiro, S. S., & Wilk, M. B. (1965). An analysis of variance test for normality (complete samples).Biometrika, 52(3–4), 591–611. doi:10.1093/biomet/52.3-4.591.
Siciliano, G. (2012). Urbanization strategies, rural development and land use changes in China: A multiple-level integrated assessment. Land Use Policy, 29(1), 165–178.
Smil, V. (2008). Energy in nature and society: General energetics of complex systems. Cambridge: The MITPress.
Smith, D. (2007). The changing faces of rural populations: ‘‘‘(re) fixing’’ the gaze ‘or ‘eyes wide shut’’?Journal of Rural Studies, 23(3), 275–282.
Sorman, A. H., & Giampietro, M. (2011). Generating better energy indicators: Addressing the existence ofmultiple scales and multiple dimensions. Ecological Modelling, 223(1), 41–53.
Tacoli, C. (2003). The links between urban and rural development. Environment and Urbanization, 15(1),3–12. doi:10.1177/095624780301500111.
Tello, E. (2005). Changing course? Principles and tools for local sustainability. In T. Marshall (Ed.),Transforming Barcelona (pp. 110–225). London: Routledge.
Tello, E. Pigrau, A. and Garcıa, M. (2013), Sostenibilidad y descentralizacion en las polıticas locales deenergıa. In. Canal, R. (Ed). Ciudades y pueblos que puedan durar. Polıticas locales para una nuevaepoca, Ed. Icaria, Barcelona, p. 29–43.
Usai, M. G., Casu, S., Molle, G., Decandia, M., Ligios, S., & Carta, A. (2006). Using cluster analysis tocharacterize the goat farming system in Sardinia. Livestock Science, 104(1–2), 63–76.
Usman, A., & Shami, S. H. (2013). Evolution of communication technologies for smart grid applications.Renewable and Sustainable Energy Reviews, 19, 191–199.
Williams, J. (2007). Innovative solutions for averting a potential resource crisis—the case of one-personhouseholds in England and Wales. Environment, Development and Sustainability, 9(3), 325–354.
956 P. Ariza-Montobbio et al.
123