Integrated seismic analysis of the Chalk Group in eastern Denmark-Implications for estimates of...
13
Integrated seismic analysis of the Chalk Group in eastern Denmark—Implications for estimates of maximum palaeo-burial in southwest Scandinavia Lars Nielsen a, ⁎, Lars Ole Boldreel a , Thomas M. Hansen b , Holger Lykke-Andersen c , Lars Stemmerik a , Finn Surlyk a , Hans Thybo a a Department of Geography and Geology, University of Copenhagen, Øster Voldgade 10, DK-1350 Copenhagen K, Denmark b Department of Informatics and Mathematical Modelling, Technical University of Denmark, Richard Petersens Plads, Building 321, DK-2800 Kgs. Lyngby, Denmark c Department of Earth Sciences, University of Aarhus, Høegh-Guldbergs Gade 2, DK-8000 Århus C, Denmark abstract article info Article history: Received 9 August 2010 Received in revised form 12 August 2011 Accepted 13 August 2011 Available online 28 August 2011 Keywords: Chalk Group Seismic velocity Palaeo-burial Seismic refraction Seismic reflection Wireline log data The origin of the topography of southwest Scandinavia is subject to discussion. Analysis of borehole seismic velocity has formed the basis for interpretation of several hundred metres of Neogene uplift in parts of Denmark. Here, refraction seismic data constrain a 7.5 km long P-wave velocity model of the Chalk Group below the Stevns peninsula, eastern part of the Danish Basin. The model contains four layers in the ~860 m thick Chalk Group with mean velocities of 2.2 km/s, 2.4 km/s, 3.1 km/s, and 3.9–4.3 km/s. Sonic and gamma wireline log data from two cored boreholes represent the upper ~450 m of the Chalk Group. The sonic velocities are consis- tent with the overall seismic layering, although they show additional fine-scale layering. Integration of gamma and sonic log with porosity data shows that seismic velocity is sensitive to clay content. In intervals near bound- aries of the refraction model, moderate increases in clay content correlate with reduction of porosity and in- crease in velocity. Higher clay contents do not further increase velocity. The reduction of porosity and increase in velocity are interpreted as clay causing increased pressure dissolution and cementation. The inter- preted velocities are systematically higher than values of a chalk velocity curve determined in previous studies, and it is estimated that a significant part of the velocity anomaly may be explained by the presence of clay. The remaining velocity anomaly can be explained by 450–500 m palaeo-burial of the Chalk Group. The burial anom- aly will be over-estimated by ~150–200 m if the analysis is based on the average Chalk Group velocity and clay content is disregarded. Burial anomaly values of ~450–600 m result if the strongest velocity contrast at ~600–650 m depth is interpreted to be a result of diagenetic effects, consistent with the clay-corrected esti- mates within uncertainty. © 2011 Elsevier B.V. All rights reserved. 1. Introduction The Upper Cretaceous–Danian (Lower Paleocene) Chalk Group extends over large parts of the North Sea area, the Danish Basin, and the Ringkøbing–Fyn basement high (Fig. 1; Japsen, 1998; Vejbæk et al., 2003; Ziegler, 1990). The thick Chalk Group consists mostly of carbonates (Surlyk et al., 2003, and references therein), but near the eastern basin margin close to the transition zone between the Baltic Shield and the Danish Basin influx of siliciclastic sediments may exist at different levels (Brotzen, 1959; Erlström et al., 1997; Vejbæk et al., 2003). Carbonates generally show large variability in seismic velocity due to lithology variation, diagenetic effects, burial and compaction, and pore volume, type and fluid (Anselmetti and Eberli, 1997; Eberli et al., 2003; Wang, 1997). A number of studies conducted over the past four decades have investigated factors controlling the velocity of chalk in the North Sea area (Fabricius, 2003; Fabricius et al, 2007, 2008; Japsen, 1998, 2000b; Scholle, 1977; Sclater and Christie, 1980), and a compilation of a large number of laboratory measure- ments of elastic properties of chalk from the Danish area shows dependency of porosity, pore type, pore fluid and cementation (Fabricius, 2007). Curves describing the increase in chalk velocities due to burial and compaction have been developed for the Danish area and used for mapping of overpressured and overcompacted areas (Japsen 1998, 2000a,b; Japsen and Bidstrup, 1999). The driving mechanisms, amount and timing of uplift and exhumation of Scandinavia is subject of debate (Anell et al., 2009; Japsen, 1998, 2000a; Japsen et al., 2007; Japsen and Bidstrup, 1999; Jordt et al., 1995; Lidmar-Bergström et al., 2000; Lidmar-Bergström and Bonow, 2009; Nielsen, 2002; Nielsen et al., 2005, 2009a,b; Sclater and Christie, 1980). Burial anomalies of the marginal areas of the North Sea and Danish Basin region of up to several hundred metres have been interpreted by comparison of sonic log velocities of Chalk Group strata with ‘standard curves’ for velocity–depth relations for Tectonophysics 511 (2011) 14–26 ⁎ Corresponding author. Tel.: + 45 35322454. E-mail address: [email protected] (L. Nielsen). 0040-1951/$ – see front matter © 2011 Elsevier B.V. All rights reserved. doi:10.1016/j.tecto.2011.08.010 Contents lists available at SciVerse ScienceDirect Tectonophysics journal homepage: www.elsevier.com/locate/tecto
-
Upload
independent -
Category
Documents
-
view
5 -
download
0
Transcript of Integrated seismic analysis of the Chalk Group in eastern Denmark-Implications for estimates of...

Tectonophysics 511 (2011) 14–26
Contents lists available at SciVerse ScienceDirect
Tectonophysics
j ourna l homepage: www.e lsev ie r .com/ locate / tecto
Integrated seismic analysis of the Chalk Group in eastern Denmark—Implications forestimates of maximum palaeo-burial in southwest Scandinavia
Lars Nielsen a,⁎, Lars Ole Boldreel a, Thomas M. Hansen b, Holger Lykke-Andersen c, Lars Stemmerik a,Finn Surlyk a, Hans Thybo a
a Department of Geography and Geology, University of Copenhagen, Øster Voldgade 10, DK-1350 Copenhagen K, Denmarkb Department of Informatics and Mathematical Modelling, Technical University of Denmark, Richard Petersens Plads, Building 321, DK-2800 Kgs. Lyngby, Denmarkc Department of Earth Sciences, University of Aarhus, Høegh-Guldbergs Gade 2, DK-8000 Århus C, Denmark
⁎ Corresponding author. Tel.: +45 35322454.E-mail address: [email protected] (L. Nielsen).
0040-1951/$ – see front matter © 2011 Elsevier B.V. Alldoi:10.1016/j.tecto.2011.08.010
a b s t r a c t
a r t i c l e i n f oArticle history:Received 9 August 2010Received in revised form 12 August 2011Accepted 13 August 2011Available online 28 August 2011
Keywords:Chalk GroupSeismic velocityPalaeo-burialSeismic refractionSeismic reflectionWireline log data
The origin of the topography of southwest Scandinavia is subject to discussion. Analysis of borehole seismicvelocity has formed the basis for interpretation of several hundredmetres of Neogene uplift in parts of Denmark.Here, refraction seismic data constrain a 7.5 km long P-wave velocity model of the Chalk Group below theStevns peninsula, eastern part of the Danish Basin. The model contains four layers in the ~860 m thick ChalkGroup with mean velocities of 2.2 km/s, 2.4 km/s, 3.1 km/s, and 3.9–4.3 km/s. Sonic and gamma wireline logdata from two cored boreholes represent the upper ~450 m of the Chalk Group. The sonic velocities are consis-tent with the overall seismic layering, although they show additional fine-scale layering. Integration of gammaand sonic log with porosity data shows that seismic velocity is sensitive to clay content. In intervals near bound-aries of the refraction model, moderate increases in clay content correlate with reduction of porosity and in-crease in velocity. Higher clay contents do not further increase velocity. The reduction of porosity andincrease in velocity are interpreted as clay causing increased pressure dissolution and cementation. The inter-preted velocities are systematically higher than values of a chalk velocity curve determined in previous studies,and it is estimated that a significant part of the velocity anomaly may be explained by the presence of clay. Theremaining velocity anomaly can be explained by 450–500 m palaeo-burial of the Chalk Group. The burial anom-aly will be over-estimated by ~150–200 m if the analysis is based on the average Chalk Group velocity and claycontent is disregarded. Burial anomaly values of ~450–600 m result if the strongest velocity contrast at~600–650 m depth is interpreted to be a result of diagenetic effects, consistent with the clay-corrected esti-mates within uncertainty.
rights reserved.
© 2011 Elsevier B.V. All rights reserved.
1. Introduction
The Upper Cretaceous–Danian (Lower Paleocene) Chalk Groupextends over large parts of the North Sea area, the Danish Basin,and the Ringkøbing–Fyn basement high (Fig. 1; Japsen, 1998; Vejbæket al., 2003; Ziegler, 1990). The thick Chalk Group consists mostly ofcarbonates (Surlyk et al., 2003, and references therein), but near theeastern basin margin close to the transition zone between the BalticShield and the Danish Basin influx of siliciclastic sediments mayexist at different levels (Brotzen, 1959; Erlström et al., 1997; Vejbæket al., 2003).
Carbonates generally show large variability in seismic velocity dueto lithology variation, diagenetic effects, burial and compaction, andpore volume, type and fluid (Anselmetti and Eberli, 1997; Eberliet al., 2003; Wang, 1997). A number of studies conducted over the
past four decades have investigated factors controlling the velocityof chalk in the North Sea area (Fabricius, 2003; Fabricius et al, 2007,2008; Japsen, 1998, 2000b; Scholle, 1977; Sclater and Christie,1980), and a compilation of a large number of laboratory measure-ments of elastic properties of chalk from the Danish area showsdependency of porosity, pore type, pore fluid and cementation(Fabricius, 2007). Curves describing the increase in chalk velocitiesdue to burial and compaction have been developed for the Danisharea and used for mapping of overpressured and overcompactedareas (Japsen 1998, 2000a,b; Japsen and Bidstrup, 1999).
The driving mechanisms, amount and timing of uplift andexhumation of Scandinavia is subject of debate (Anell et al., 2009;Japsen, 1998, 2000a; Japsen et al., 2007; Japsen and Bidstrup, 1999;Jordt et al., 1995; Lidmar-Bergström et al., 2000; Lidmar-Bergströmand Bonow, 2009; Nielsen, 2002; Nielsen et al., 2005, 2009a,b; Sclaterand Christie, 1980). Burial anomalies of the marginal areas of theNorth Sea and Danish Basin region of up to several hundred metreshave been interpreted by comparison of sonic log velocities of ChalkGroup strata with ‘standard curves’ for velocity–depth relations for

Fig. 1. (a) Simplified map of the Chalk Group thickness variation based on the regional studies of Vejbæk et al. (2003). The region has been subject to episodes of subsidence andinversion of localised structures, and it is characterised by a NW–SE-oriented fault zone system (Liboriussen et al., 1987; Erlström et al., 1997; Mogensen and Jensen, 1994; Thybo,2001; Vejbæk and Britze, 1995; Ziegler, 1990). Circles show location of the Stenlille, Slagelse and Höllviken boreholes. Box indicates the study area on the Stevns peninsula.(b) Refraction seismic line with shot points (asterisks). The locations of the Stevns-1 and Stevns-2 boreholes are shown. Modified after Stemmerik et al. (2006) and Nielsenet al. (2010). Fig. 1a and b are shown by permission.
15L. Nielsen et al. / Tectonophysics 511 (2011) 14–26
chalk sediments (Japsen, 1998, 2000b; Japsen and Bidstrup, 1999).These burial anomalies have been suggested as the result of generalNeogene uplift in the western and southwestern Scandinavian region,including the Norwegian mountain ranges and southern Sweden(Japsen, 1998, 2000a). The values of uplift of the Danish Basin areainterpreted by Japsen (1998, 2000a,b) and Japsen and Bidstrup(1999) are significantly larger than the corresponding values pre-dicted by a geodynamic model, which explains uplift of Scandinaviaas mainly driven by climatic effects (Nielsen, 2002; Nielsen et al.,2009a). By mass balance calculations of sediment and eroded rockvolumes based on results from seismic interpretation and analysisof present topography, Anell et al. (2010) interpreted significantuplift of the main Paleic surface in southern Norway around theearly Oligocene, although some topography along the western marginof Norway may be pre-Cenozoic.
Here, the study area is the Stevns peninsula of Sjælland located in theeastern part of the Danish Basin (Fig. 1). Previous seismic profiling indi-cates that the Chalk Group is ~900 m thick close to the Stevns peninsula(Lykke-Andersen and Surlyk, 2004), and sonic log information from theDanish Basin area shows that the Chalk Group is characterised by seismicP-wave velocities in the range of ~2500–4500 m/s (Japsen, 1998, 2000a;Nielsen and Japsen, 1991; Vejbæk et al., 2003). Jurassic and Lower Creta-ceous siliciclastic sediments typically constitute a low-velocity zonebelow the Chalk Group (Nielsen and Japsen, 1991). Themaximumburialanomaly has been estimated to amount to be ~500 m for the Stevnspeninsula based on extrapolation and interpolation of values obtainedfrom scattered boreholes (Japsen and Bidstrup, 1999). This value issomewhat lower than the ~750 m of burial anomaly indicated by anearlier burial anomaly map presented by Japsen (1998), which wasbased on an earlier version of the velocity–depth curve for the ChalkGroup. Burial anomaly values of 400–550 m have been interpreted for
the Stevns peninsula area based on regional reflection seismic mappingand integration of well log data (Vejbæk et al., 2003).
This study presents new values of maximum burial anomaly for theeastern Danish Basin area based on an approach in which results fromintegrated refraction/reflection seismic and log data interpretation arecompared with the chalk velocity curve presented by Japsen andBidstrup (1999) and Japsen (2000b). The seismic velocity structure ofthe ChalkGroup is interpreted by analysis of controlled-source refraction/wide-angle reflection seismic data. The seismic velocity model iscompared to coincident normal-incidence reflection seismic data, sonicand gamma log data, and porosity data from boreholes located close tothe seismic profile line. The seismic velocity structure of the ChalkGroup is interpreted in terms of changes in lithology, porosity reductioncaused by cementation, and burial/compaction, and new values of burialanomaly of the eastern part of the Danish Basin are presented.
2. Refraction and wide-angle reflection seismic model
The refraction/wide-angle reflection seismic data were collectedalong a 7.5 km long N–S oriented line on the Stevns peninsula(Fig. 1). In total, 176 seismic recorders each mounted with a 4.5 Hzvertical component geophone were distributed along the middle6 km of the line, and 18 explosive sources were detonated alongthe line of investigation; two of these sources were placed off thenorthern and southern end points of the line of recorders. Thedynamite charge size ranged from 0.3 kg to 1.0 kg, and the explosiveswere placed at the bottom of 3–4 m deep drill holes. The Chalk Groupis covered by a ~5 m thick layer of Quaternary clay till (GEUS, 2009).
Data examples from shotpoints 3, 8, and 17 are representative forthe data set as a whole (Fig. 2). The signal-to-noise ratio of the recordsection of shot point 17 is poor as compared to the data quality of the

16 L. Nielsen et al. / Tectonophysics 511 (2011) 14–26

Table 1Apparent velocities of first-arriving P-waves from the Chalk Group.
Refraction arrival First arrival in offset range (km) Apparent velocity (km/s)
P1 ~0–0.5 2.1–2.3P2 ~0.5–0.7 2.3–2.5P3 ~1.5–2.5 3.0–3.3P4 ~2.5–4.0 3.9–4.2
17L. Nielsen et al. / Tectonophysics 511 (2011) 14–26
record sections of shot points 3 and 8. The deterioration of the dataquality is most likely a consequence of increasing wind noise andsea-wave action at the nearby coastal cliff of Stevns Klint during theshooting procedure. At 0 km offset of the refraction seismic sections,which are projected onto a straight line, the first-arrival onset timesare delayed by up to 61 ms due to the combined effects of the shotpoints not being located exactly on the seismic line and delays inthe shot-triggering system. These delays are regarded as static errorsand accounted for in the modelling of the seismic arrivals.
The first-arriving P-waves in the 0–4 km offset range are charac-terised by four almost linear refracted arrivals: P1, P2, P3, and P4(Table 1). Only limited lateral variation in the apparent velocities ofthe four refracted phases is observed along the profile, indicatingthat the upper part of the subsurface is almost horizontally stratifiedwith limited lateral velocity variation. Three relatively strongreflected arrivals P2P, P3P, and PbcP are identified in the data. Thesereflections are most prominent in the high-pass filtered sections.The PbcP arrival is the strongest of the three reflections.
2.1. Interpretation of reflected and refracted arrivals
The vertical-incidence two-way travel time (twt) of the PbcPreflection is ~630 ms in the northern (Fig. 2a) and ~600 ms in thesouthern end of the profile (Fig. 2c). Lykke-Andersen and Surlyk(2004) interpreted a strong reflection event at 500–700 ms twt asthe base of the Chalk Group in marine normal-incidence reflectionseismic profiles acquired immediately off the east coast of the Stevnspeninsula. Therefore, the prominent PbcP reflection is interpreted tooriginate from the base of the Chalk Group, and P2P and P3P are inter-preted to be internal Chalk Group reflections. Regional seismicmapping shows that the Stevns peninsula is located at the transitionbetween areas with a twt of 400–600 ms and 600–800 ms to thebase of the Chalk Group (Vejbæk et al., 2003).
The four refractions P1–P4 constrain a four-layered model of theChalk Group with stepwise increases in velocity with depth. TheP2P and P3P reflections are interpreted to correspond to the base oflayers II and III of the Chalk Group velocity model. No reflectedarrivals from the base of layer I have been unequivocally identifiedin the shot record sections.
Relatively weak arrivals (Pb) typically showing high apparentvelocities of more than 5.3–5.8 km/s are observed at large offsets.However, the identification of these arrivals is uncertain due to theirrelatively low amplitudes and the generally poorer signal-to-noise-ratio at large offsets. The Pb arrivals are tentatively indicated in Fig. 2.The Pb arrivals may originate from compacted and metamorphosedPalaeozoic sediments mapped from reflection seismic interpretationof the O-horizon (Lassen, 2006; Lassen and Thybo, 2004). Alternatively,this arrival could originate from the topmost part of the crystallinebasement. Weak reflected energy, occasionally observed ~0.1 s behindthe PbcP at short offsets in the high-pass filtered records (Fig. 2a),could represent the O-horizon or the top of the crystalline basement,in which case the PbcP could be caused by layers near the Palaeozoic–Mesozoic boundary.
A total of 4170 travel time picks of the refracted P-waves from theChalk Group, P1–P4, the Chalk Group reflections, P2P, P3P, and PbcP,and the Pb arrivals have been used for combined forward raytracingmodelling and travel time inversion using the two-dimensional(2D) modelling algorithm of Zelt and Smith (1992). The resulting
Fig. 2. Refraction seismic data sections for shot points 3 (a), 8 (b), and 17 (c) recorded withinterval is 2 ms (Nyquist frequency of 250 Hz). All sections are shown with a reduction velopass (b40 Hz) and high-pass filtered (N40 Hz) versions of the data sets are shown. P1, P2, PInternal Chalk Group reflections (P2P and P3P) and a reflection from the base of the Chalkof the Precambrian basement is evident in the low-frequency records and marked by Pb. ArData sections plotted with the ZPLOT program of C. A. Zelt with minor modifications by P.
seismic P-wave velocity model consists of six layers (Fig. 3). Theobserved dips of the layer boundaries are small in the N–S direction,and the velocities of the Chalk Group layers determined by modellingare very similar to the apparent velocities observed for the refractedarrivals P1–P4 (Table 1). The internal layer boundaries of the ChalkGroup represent significant jumps in the P-wave velocity, whereasthe vertical velocity gradient is, in general, relatively moderate withineach layer. The lateral variation of the velocities is small.
2.2. Assessment of model uncertainties
The average travel time pick uncertainty is assumed to be 20 ms. Ingeneral, the calculated travel times fit the data of all 18 shots within theerror bars, and systematic deviations from the observed travel timesare limited, considering the relatively few model parameters of theobtained model (Fig. 4). The root-mean-square (RMS) misfit providedby the final velocity model is 12 ms.
The almost horizontal layering and the small velocity gradients ofthe final velocity model reduce undesired shadowing effects, and rayscan be traced to 98% of all the observation points. Absolute model para-meter uncertainties are estimated using the two-step procedure pro-posed by Zelt and Smith (1992), which involves perturbation of aselected model parameter of the final model and subsequent inversionand travel time fit evaluation keeping the perturbed parameterconstant. The absolute uncertainties the Chalk Group layer parameters(layers I–IV) are about 0.2 km/s for velocity nodes and 20–50 m fordepth nodes in the model distance range of 1.5–5.5 km. The deepestdepth node values (layers III and IV) have the largest uncertainties.Outside the 1.5–5.5 km distance range the data density is smaller, thenumber of crossing rays is limited, and the uncertainties are larger.
Layer V is interpreted as a low-velocity zone as no refracted arrivalsare observed for this layer, and its constant velocity of 3000 m/s is basedon sonic log information from deep boreholes (Nielsen and Japsen,1991). The low-velocity layer may represent Jurassic and/or LowerCretaceous siliciclastic sediments. The depth of ~1.1–1.3 km to the topof the deepest layer is constrained solely by the Pb phase in a limitedoffset range of the record sections except for shot points 14 and 15(Fig. 2a, b). Significant faulting of Palaeozoic strata and, in particular,the top of the crystalline basement has been interpreted from commer-cial reflection seismic data sections covering the Danish Basin and thebasement highs (Lassen and Thybo, submitted for publication). Howev-er, sharp topographic relief along the boundary between layers V and VIpossibly caused by faulting cannot be resolved by the refraction/wide-angle reflection seismic data presented here.
2.3. Constraints on velocity gradient
Velocity gradients can be better constrained by modelling of theamplitudes of the arrivals than by fitting of travel times (Braile andSmith, 1975). Different finite-difference methods have been developed
Reftek “Texan” instruments placed with a nominal spacing of 34 m. Temporal samplingcity of 4 km/s. The sections contain significant seismic energy up to ~60 Hz. Both low-3, and P4 refer to four refracted arrivals interpreted to originate from the Chalk Group.Group (PbcP) are identified in the high-pass filtered data. An arrival from near the toprows in (a) pinpoint the positions of secondary arrivals. Traces are scaled individually.Sroda.

Fig. 3. (a) Seismic P-wave velocity model shown with velocity nodes and layer boundaries, which define the velocity model. For details regarding interpolation of velocity values andmodel parameterisation see Zelt and Smith (1992). The velocity model is discontinuous across layer boundaries. Transparent grey areas indicate areas of limited or poor resolution.(b) Interpolated representation of the velocity model defined on a regular grid. The model consists of six layers. The four topmost layers constitute the Chalk Group. Thin (b 5 m thick)Quaternary deposits overlying the Chalk Group in the study area are omitted from the model for simplicity. Vertical arrows at the top of the model indicate the northern and southernend points of the coincident normal-incidence reflection seismic section. Model in (b) plotted with the vmed program by B. C. Zelt.
18 L. Nielsen et al. / Tectonophysics 511 (2011) 14–26
and applied for modelling of seismic wavefields (e.g., Levander, 1988;Robertsson et al., 1994). The Tesseral 2-D finite-difference modellingprogram is used here for calculation of the wavefield response ofthe velocity model (Fig. 5) with careful choice of parameters to ensurestability of the finite-difference algorithm and to avoid numericaldispersion (cf. Sandrin et al., 2009). The synthetic data are processedand plotted with the same parameters as the real data to facilitatecomparison of the low-frequency sections (Figs. 2a, 5).
Fig. 4. Calculated travel time curves for shot point 3 plotted on top of observed data.The travel time curve of the tentatively interpreted Pb phase is shown with a dottedline.
The calculated onset amplitudes and overall waveform charac-teristics generally match observations P1 and P2 of the real data.The first arrival between 1.5 and 2.2 km offset (P3) is modelledwith relatively lower amplitudes than P1 and P2, which is consistentwith observations and shows that the moderate vertical velocitygradient of layer III as compared to the gradients of layers I and II isconstrained by observations and a realistic feature of the velocitymodel. P4 is modelled with relatively strong amplitudes from 2.2 to
Fig. 5. Acoustic waveform response of the velocity model calculated for the position ofshot point 3. The source is a 60 Hz Ricker wavelet. The receiver spacing of the syntheticseismic section is 34 m equal to the nominal spacing of the real data. Data have beenlow-pass filtered (b40 Hz) and traces are scaled individually to the maximumamplitude.

19L. Nielsen et al. / Tectonophysics 511 (2011) 14–26
2.5 km offset. From 2.5 to 4 km offset the synthetic amplitudes of P4decrease gradually to low values. These features are consistent withthe data and are explained by a lateral decrease in the vertical velocitygradient of layer IV from 2 to 4 km model distance. The Pb phase ismodelled to show low amplitudes as observed in the data within theweak constraints of the low signal-to-noise ratio at large offsets.
The calculated reflected arrivals are too strong at small offset. Thismismatch between synthetic data and observations may be explainedby two factors: 1) the acoustic modelling applied for the wave fieldsimulation does not account for ground-roll (surface waves) andpossible damping of reflections caused by interference by such wavesis not reproduced; 2) the velocity model contains sharp boundaries; inthe chalk sediment the transition between layers may be gradual at ascale below the vertical seismic resolution. The synthetic data sectioncontains relatively strong multiple arrivals for offsets larger than 3 kmand arrival times larger than 0.6 s similar to observations in the recordedsections (Fig. 2a, b). In the real data sections, S-wave arrivals mayinterfere with these multiple arrivals. However, sharp, well-definedS-wave arrivals are not observed in the recorded data sections, so theiramplitudes are probably moderate.
3. Comparison of refraction and normal-incidence reflectionseismic profiles
The P-wave velocity model has been converted to two-way traveltime and superimposed on a coincident normal-incidence reflectionseismic section (Fig. 6). The reflectivity of the normal-incidence reflec-tion section supports the finding from the velocity modelling that theoverall layering in the area is almost horizontal. The internal ChalkGroup boundaries of the velocity model approximately coincide withchanges in reflectivity characteristics of the reflection section and strongnormal-incidence reflections for boundaries of layers II–IV. Layer I of thevelocity model corresponds to a part of the normal-incidence section,which shows discontinuous reflections with a variety of dips as well assub-horizontal reflections of relatively high amplitude. The dippingreflections may be caused by Mastrichtian or Danian mounded struc-tures in the upper ~20–30 mof the Chalk Group in the area (Anderskouvet al., 2007; Bjerager and Surlyk, 2007; Surlyk, 1997; Surlyk et al., 2006).In general, the upper two thirds of Layer II are characterised by sub-horizontal reflections of relatively large amplitude and good conti-nuity over several hundred metres. The lower third of this layer isalmost transparent. The northern part of Layer II is characterised byweak and diffuse reflections. The poor signal-to-noise ratio of this partof the section is probably caused by poor transmission of the seismicwaves through the upper part of the Quaternary sedimentary cover.
Fig. 6. Two-way travel time converted velocity model superimposed on the coincident reflspread. The geophone spacing was 2.5 m. A vibrator with a peak frequency of 100 Hz wa20 ms has been added to the two-way travel time converted velocity model boundaries in orlayer, which has been omitted from the refraction seismic modelling. The normal-incidence
The upper two thirds of layer III of the velocity model are characterisedby moderately strong reflections of good continuity. At model distances4–5.5 km, a low-relief bulge with an upwards slightly increasing relief ispresent. This detail is not resolved by the velocitymodel. The reflectionsof the lower third of layer III are relatively strong and continuous alongthe entire reflection seismic profile. The reflections observed in thenorthern part of layer III appear to be more contaminated by noisethan the middle and southern parts, consistent with the observationsmade for layer II. The lowermost layer of the Chalk Group (layer IV) ischaracterised by almost horizontal, continuous reflections of low rela-tive amplitude. The base of layer IV (base of the Chalk Group) coincideswith a strong, slightly dipping reflection, which is continuous along theentire reflection seismic section.
4. Comparison of seismic and log data
The Chalk Group is sub-divided into four layers with a verticalresolution of tens of metres based on the refraction seismic data. Thevelocity of each layer shows slight linear increase with depth inter-rupted by significant steps of up to 0.9 km/s across layer boundaries.The velocity structure is compared to the high resolution verticalsonic log profiles from the Stevns-1 and Stevns-2 boreholes, which are~450 m and ~350 m deep, respectively (Stemmerik et al., 2006).Stevns-1 is located ~0.9 km due east of the northern part of the line ofseismic recorders, and Stevns-2 is located ~4 km southwest of thesouthern end of the model profile (Fig. 1).
Velocity profiles extracted at 2 kmand4 kmmodel distance are usedfor comparison to Stevns-1 and Stevns-2, respectively. The velocitystructure is poorly constrained at the model end points and cannot beused for the comparison (Fig. 3). The velocity profile extracted at 2 kmapproximately matches the overall trend of the sonic log curve ofStevns-1 within the estimated uncertainties of the refraction seismicvelocity model (Fig. 7a). However, the model velocities of layer II(in particular the lower part of this layer) are systematically smallerthan the sonic log velocity values, whereas the model velocities appearto be slightly high compared to the average trend of sonic log velocityof the upper part of layer III. The log curve of Stevns-1 exhibits marked,almost abrupt increases in seismic velocity over depth intervals of lessthan30m in the vicinity of the layer boundaries of the refraction seismicmodel. At 2 kmmodel distance, the boundary between layers I and II ofthe velocity model is located at 70 m depth. The sonic log of Stevns-1exhibits an increase in velocity from ~2.2 km/s to ~2.4 km/s near thesame depth. An increase in velocity from ~2.7 km/s to ~2.9 km/s isobserved in the sonic log of Stevns-1 starting at ~300 m depth. Thisabrupt increase in velocity occurs about 30 m below the position of
ection seismic section. The reflection seismic section was acquired with a 72-channels used as the source, and the source location interval was 10 m. A constant value ofder to account for the uppermost up to 5 m thick, low-velocity Quaternary sedimentaryreflection seismic section is non-migrated. Horizontal scale refers to the velocity model.

Fig. 7. (a)–(c) Sonic, natural gamma, and porosity logs from the Stevns-1 borehole. In (a) the velocity profile extracted from 2 km model distance is shown with a dotted line.(d)–(f) Sonic, natural gamma, and porosity logs from the Stevns-2 borehole. (d) The velocity profile extracted from 2 km model distance is shown with a red dotted line. Thesonic logs have been despiked by eliminating velocity values higher than 5 km/s and values lower than 1 km/s. The log curves from Stevns-2 have been displaced 20 m downwardsin order to account for the topographic difference between the surface at model distance 4 km and the top of the borehole, which was drilled in a quarry.
20 L. Nielsen et al. / Tectonophysics 511 (2011) 14–26
the boundary between layers II and III of the velocity model at 2 kmmodel distance. Thus, the layer boundaries match abrupt changes inthe sonic log pattern within the uncertainties of the layer boundarydepth nodes also considering the ~2 km offset between the differentdata locations. The same overall layered characteristics are observed inthe sonic log curve for Stevns 2 but with some larger mismatch to thevelocity profile extracted at 4 km model distance which may be due tothe relatively large distance between Stevns 2 and the seismic velocityprofile line, and the fact that the velocity model profile at 4 km containsa local depression of the boundary between layers II and III, which doesnot match the reflection seismic section nor the depth of ~270 mwherethere is a marked increase in the sonic log velocity (Fig. 7d).
The small-scale velocity fluctuations observed on the sonic log curveswithin each layer cannot be resolved by the refraction/wide-angle reflec-tion data. The sonic log profiles indicate different velocity characteristicsof the Chalk Group layers. Layers I and III show velocity fluctuations of
large amplitude and short wavelength, whereas layer II, in general,shows fluctuations of relatively low amplitude.
Overall, the velocity increases with depth, and it is expected that thenormal effects of increasing burial constitute an important factor control-ling velocity (cf. Japsen, 1998; Japsen and Bidstrup, 1999). However, thestepwise increase in velocity of the velocity model cannot be explainedby a simple velocity–depth curve. Therefore, the abrupt and significantchanges in the velocity at the boundaries of the velocity model are inves-tigated in detail. Positive anomalies in the natural gamma log of Stevns-1are observed from ~55 to ~110 m depth and from ~300 to ~370 m depth(Fig. 7b; Fig. 8; Fig. 9). The positive anomalies in the gamma log are inter-preted to reflect the presence of marly chalk layers with a higher claycontent than the surrounding chalk (Schovsbo et al., 2008; Stemmeriket al., 2006). Low-porosity anomalies are observed in the same depthranges (Fig. 7c), consistent with observations from chalk located in theNorwegian sector of the North Sea (Brasher and Vagle, 1996). Details of

Fig. 8. Detail of sonic and gamma log curves of Stevns-1. The red curve represents a smoothed version of the sonic log curve calculated with a moving-window filter using Matlab.Arrows point to sonic and gamma log anomalies discussed in the text.
21L. Nielsen et al. / Tectonophysics 511 (2011) 14–26
the sonic and gamma log curves from Stevns-1 around the boundariesbetween layers I and II and layers II and III show that the top of thepositive gamma log anomalies correlate with an increase in seismicvelocity (marked by arrows in Figs. 8 and 9). This correlation may beexplainedby clay causing increasedpressure dissolution and cementationresulting in reduced porosity and increase in velocity. The observedcorrelation between moderate increase in clay content and increase invelocity is consistent with Fabricius et al. (2007, 2008). However, thelargest gamma peaks (at ~100 and ~350 m depth), which most likelyrepresent the largest clay content of the formation, do not correlatewith additional increases in velocity (Fig. 8; Fig. 9). Instead, the highestgamma peaks appear to correlate with unchanged or even a tendencytowards slightly reduced velocities. This observation is also consistentwith the finding by Fabricius et al. (2008) that high clay contents inchalk result in reduced velocity.
Similar correlations between natural gamma log values and poro-sity are observed for Stevns-2, although the porosity log of this bore-hole is not complete over the depth range recorded by the gamma log(Figs. 7d–e). For Stevns-2, there appears to be a low-velocity anomaly
from ~60 to ~100 m depth (Fig. 7d). The equivalent of the transitionfrom layer I to II of the velocity model thus most likely occurs near~100 m depth, where there is a marked increase in velocity but noincrease in the gamma ray signal (Fig. 10). However, the top ofincreased gamma ray values at ~110 m depth results in porosityreduction and an additional, localised increase in velocity. Consistentwith the observations for Stevns-1, it is observed that the boundarybetween layers II and III, which is interpreted to occur at ~270 mdepth at the location of Stevns-2, is marked by the top of a positivegamma anomaly and an increase in velocity. Again, it is noted thatthe highest gamma ray values at ~120–140 m depth and at ~310 mdepth do not cause additional increase in velocity but rather unchangedor slightly reduced velocities.
The combined log data set indicates that moderate increase in claycontent, interpreted based on gamma ray anomalies, locally results inreduced porosity and increased velocity, whereas the largest claycontent marked by the maximum gamma ray values correlates withunchanged velocities. The boundaries between layers I and II andbetween layers II and III are interpreted to be equivalent to the depths

Fig. 9. (a)–(b) Sonic and gamma log data from Stevns-1 with smoothed representations superimposed. For the purposes of smoothing the log data have been resampled to 0.01 m in-tervals. The smoothed curves are coloured according to depth range. Red: 55–70 m; green: 70–110 m; yellow: 110–305 m; blue: 305–320 m; cyan: 320–370 m; magenta: 370–448 m.The 55–70 m and 305–320 m depth interval correspond to the onset of the gamma and velocity anomalies discussed in text. (c) Cross-plot of smoothed gamma log and sonic values.Note that a positive relation between gamma and sonic log values are observed at the onset of anomalies at 55–70 m (red) and 305–320 m (blue) depth. Around the peak gamma valuesof the gamma anomalies at 70–110 m and 320–370 m depth the velocity is almost constant. Over the longer intervals from 110–305 m and 370–448 m depth mixed correlations areobserved.
22 L. Nielsen et al. / Tectonophysics 511 (2011) 14–26
where the velocity increases because of moderate increases in claycontent. However, in Stevns-2, a positive velocity step that mostlikely represents the transition from layer I to II is situated ~10 mabove the top of a positive gamma ray anomaly. This mismatchmay, at least partly, be explained by a low-velocity anomaly between~60 and ~100 m depth at that borehole.
5. Palaeo-burial anomaly
The velocity estimates for the four Chalk Group layers found inthis study are systematically high compared to the velocity–depthcurve of chalk presented by Japsen and Bidstrup (1999) and Japsen(2000b) (Fig. 11). This observation suggests that the Chalk Groupsediments have undergone burial and compaction causing increased
velocity (cf. Japsen, 1998, 2000a,b; Japsen and Bidstrup, 1999; Vejbæket al., 2003). Detailed comparison of the velocity model of this studyand the curve of Japsen (2000b) shows different, conflicting estimatesof maximum burial anomaly for the four layers of the Chalk Groupbelow the Stevns peninsula ranging from ~450 m to ~1000 m(Fig. 11). Overall, these estimates of burial anomaly increase in astepwise manner from the upper to the deepest Chalk Group layer.
The stepwise increases in seismic velocity across the internal layerboundaries of the Chalk Group are not present in the velocity–depthcurve for chalk of Japsen and Bidstrup (1999) and Japsen (2000b).The stepwise increases of P-wave velocity are here interpreted to becaused by the clay-enriched levels and the resulting reduction inporosity. These effects of varying clay content appear to explain thehigh values of maximum burial anomaly at the top of layers II and
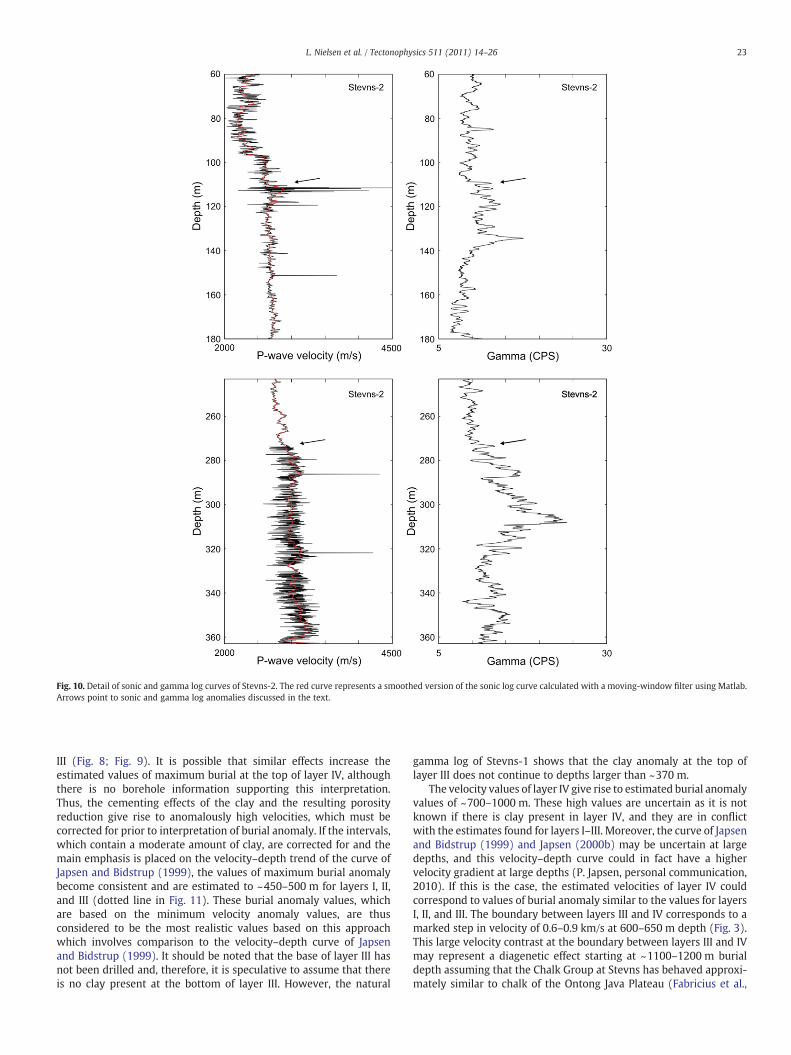
Fig. 10. Detail of sonic and gamma log curves of Stevns-2. The red curve represents a smoothed version of the sonic log curve calculated with a moving-window filter using Matlab.Arrows point to sonic and gamma log anomalies discussed in the text.
23L. Nielsen et al. / Tectonophysics 511 (2011) 14–26
III (Fig. 8; Fig. 9). It is possible that similar effects increase theestimated values of maximum burial at the top of layer IV, althoughthere is no borehole information supporting this interpretation.Thus, the cementing effects of the clay and the resulting porosityreduction give rise to anomalously high velocities, which must becorrected for prior to interpretation of burial anomaly. If the intervals,which contain a moderate amount of clay, are corrected for and themain emphasis is placed on the velocity–depth trend of the curve ofJapsen and Bidstrup (1999), the values of maximum burial anomalybecome consistent and are estimated to ~450–500 m for layers I, II,and III (dotted line in Fig. 11). These burial anomaly values, whichare based on the minimum velocity anomaly values, are thusconsidered to be the most realistic values based on this approachwhich involves comparison to the velocity–depth curve of Japsenand Bidstrup (1999). It should be noted that the base of layer III hasnot been drilled and, therefore, it is speculative to assume that thereis no clay present at the bottom of layer III. However, the natural
gamma log of Stevns-1 shows that the clay anomaly at the top oflayer III does not continue to depths larger than ~370 m.
The velocity values of layer IV give rise to estimated burial anomalyvalues of ~700–1000 m. These high values are uncertain as it is notknown if there is clay present in layer IV, and they are in conflictwith the estimates found for layers I–III. Moreover, the curve of Japsenand Bidstrup (1999) and Japsen (2000b) may be uncertain at largedepths, and this velocity–depth curve could in fact have a highervelocity gradient at large depths (P. Japsen, personal communication,2010). If this is the case, the estimated velocities of layer IV couldcorrespond to values of burial anomaly similar to the values for layersI, II, and III. The boundary between layers III and IV corresponds to amarked step in velocity of 0.6–0.9 km/s at 600–650 m depth (Fig. 3).This large velocity contrast at the boundary between layers III and IVmay represent a diagenetic effect starting at ~1100–1200 m burialdepth assuming that the Chalk Group at Stevns has behaved approxi-mately similar to chalk of the Ontong Java Plateau (Fabricius et al.,
Fig. 11. Velocity profiles from 2 km (red) and 4 km (blue) model distance plotted together with the curve of Japsen (2000b) for the seismic P-wave velocity increase with depth forchalk (thick black line). Numbers indicate values of apparent uplift estimated by the vertical distance between nodes in the velocity model and the standard curve. Dotted line con-nects velocity estimates which are apparently not influenced by the cementation effects of clay and fall on a trend approximately parallel to the standard curve.
24 L. Nielsen et al. / Tectonophysics 511 (2011) 14–26
2008). The refracted waves are probably sensitive to the onset of thisvelocity increase and such interpretation would indicate a burialanomaly of ~450–600 m, in approximate agreement with the clay-corrected estimates for the shallower layers, considering the uncer-tainties of the velocitymodel. However, as no corematerial is availablefrom this depth interval, the interpretation is solely supported by theobserved velocity contrast in the refraction model.
The sonic velocities of layer II are higher than the correspondingvelocities of the refraction model indicating that the refraction modelcould lead to underestimation of maximum burial anomaly for thislayer. However, as stated earlier, the sonic velocities appear systemati-cally low compared to the refraction model for parts of layer III, andrefraction and sonic velocities are generally consistent for layer I.There is no obvious reason why refraction velocities should be system-atically higher or lower than sonic velocities, and it is assumed here thatfor the Chalk Group as a whole, such systematic deviations cancel outand do not give rise to systematic misinterpretations.
6. Discussion
The seismic model shows that the Chalk Group is subhorizontallystratified and that, overall, its base dips gently towards the northalong the investigated profile line. This result is consistent with thefinding of Lykke-Andersen and Surlyk (2004) who demonstrate thatthe Base-Chalk reflection is planar and dips gently northward basedon interpretation of reflection seismic lines acquired offshore StevnsKlint.
The average thickness of the Chalk Group along the profile is860 m. This is less than the total Chalk Group thickness of ~1000 mfound in the Stenlille boreholes (Nielsen and Japsen, 1991) and the~1200 m found in the Höllviken boreholes (Fig. 1) (Brotzen, 1959),but more than the ~700 m found in the Slagelse-1 borehole, westernSjælland (Nielsen and Japsen, 1991) (Fig. 1). On the regional maps ofVejbæk et al. (2003), the contour separating areas with Chalk Groupthicknesses of 600–750 m from areas with 750–900 m of thickness
crosses the Stevns peninsula. Offshore the Stevns peninsula, the pre-served thickness of the Chalk Group has been estimated to increasenorthwards from ~700 m to ~1160 m with a thickness of ~830 mjust offshore Stevns Klint, approximately 4 km east of the centralpart of the seismic profile of this study (Lykke-Andersen and Surlyk,2004).
The maximum burial anomaly of the Chalk Group is here estimatedto amount to ~450–500 m by integrated interpretation of refraction/wide-angle reflection seismic data with sonic log, natural gamma log,and porosity data. The interpretation based on the assumption thatthe boundary between layers III and IV represents a diagenetic effect(Fabricius, 2007; Fabricius et al., 2008) results in a burial anomaly esti-mate of ~450–600 m, approximately consistent with the other findingspresented here. However, borehole data are not available to support theinterpretation of the deepest layer boundary of the Chalk Group, andthe large velocity contrast between layers III and IV may also be causedby other factors, such as changes in lithology. In the present analysis it isattempted to eliminate the influence of clay, which is interpreted tocause cementation due to increased pressure dissolution, porosityreduction and anomalously high velocities in intervals just below thelayer boundaries of the velocity model. In more regional studies, Japsenand Bidstrup (1999) and Vejbæk et al. (2003) reported burial anomaliesof ~500 m for the Stevns region. They did, however, not have access todata from the exact same location as studied here, and, therefore, it isnot possible to make a direct comparison of their estimates and the re-sults presented here. Japsen (1998, 2000a,b), and Japsen and Bidstrup(1999) based estimates of palaeo-burial anomaly primarily on averagevelocities for the entire Chalk Group calculated from sonic log transittimes extracted from several scattered deep boreholes. If the same strat-egy was followed here and the average velocity of the entire ChalkGroup column was used to estimate maximum burial anomaly, a signi-ficantly larger value of ~640 m would be found. Thus, maximum burialanomalywould be overestimatedby150 to 200 m, if the approachof re-lying on average velocities for the Chalk Group as a whole was adopted.The layering of the velocity structure combined with stratigraphical

25L. Nielsen et al. / Tectonophysics 511 (2011) 14–26
changes in lithology, the differences in reflection characteristics, and thedifferences in small-scale velocity fluctuation characteristics of the indi-vidual Chalk Group layers indicate that the group below the Stevnspeninsula cannot be regarded as a uniform, homogeneous unit.Consequently, it is not straightforward to produce reliable estimatesof maximum palaeo-burial. The results presented here indicate thatthe velocity field of the Chalk Group in the eastern part of the DanishBasin is influenced by factors additional to subsidence, burial and com-paction. Amoderate content of clay in the study area cause a systematicbias towards high velocities (see e.g. Henriksen et al. (1999), Fabricius(2007), Fabricius et al. (2007, 2008) for general descriptions of theinfluence of lithology change on the characteristics of chalk in theDanish area) which must be corrected for prior to estimation of maxi-mum burial anomaly. The presence of clay-enriched intervals is proba-bly mostly restricted to the eastern areas of the Danish Basin, whereasthe North Sea chalk is more pure (Erlström et al., 1997; Japsen, 2000a;Surlyk et al., 2003; Vejbæk et al., 2003). If not accounted for, the pres-ence of a moderate clay content can lead to significant over-estimationof uplift of the Chalk Group in the eastern part of the Danish Basin.However, a high content of clay may result in reduced velocities(e.g. Fabricius et al., 2008) and consequently cause underestimationof burial anomaly and uplift.
7. Conclusions
Interpretation of refraction/wide-angle reflection seismic dataacquired on the peninsula of Stevns, eastern Denmark, shows thatthe Chalk Group is ~860 m thick with an overall velocity structurethat can be described by a four-layered model. Mean velocities ofthe layers are 2.2 km/s, 2.4 km/s, 3.1 km/s, and 3.9–4.3 km/s fromtop to bottom. Overall, burial depth appears to control velocity,but significant steps in velocity of up to 0.2–0.9 km/s at the layerboundaries cannot be explained by a simple velocity–depth relation.Comparison with sonic log data collected to a depth of ~450 m innearby boreholes confirms the overall layered structure of theupper part of the Chalk Group. Abrupt changes in the overall velocitystructure are also observed in the sonic log data at the boundaries.Integration of natural gamma log data and porosity data stronglyindicates that temporary moderate increases of clay content causedlocalised reduction of porosity and resulted in the stepwise increaseof the velocities, at least at the boundaries between layers I and IIand between layers II and III. However, the influence of clay iscomplex, and the intervals with the highest clay contents show eitherno additional velocity anomaly or slightly reduced velocity. Thesedifferent effects related to the content of clay are consistent withfindings from other studies. The cause of the marked step betweenlayers III and IV is less well constrained because there is no boreholecontrol at that depth. A coincident normal-incidence reflection seismicsection shows that the layer boundaries of the velocity model approxi-mately coincide with changes in the seismic reflectivity characteristicsand with the presence of marked reflections.
Comparison of the interpreted velocity structure with a curvedescribing increase in P-wave velocity of chalk as a function ofdepth, which has been applied in previous studies of palaeo-burialand uplift in the North Sea area and the Danish Basin, reveals thatmoderate clay contents at different depth intervals of the ChalkGroup cause a bias towards high velocities. It is found here that theburial anomaly of the Chalk Group is approximately 450–500 m bycorrecting for the influence of the clay. Analysis based on averagevelocities of the total Chalk Group column will result in ~150 to200 m higher burial anomaly estimates at Stevns. An alternativeinterpretation, which is based on the assumption that the strongvelocity contrast between layers III and IV represents diageneticeffects, results in a burial anomaly estimate of ~450–600 m, consis-tent with the findings based on the clay-correction analysis.
Acknowledgments
This study was financed by the Danish Natural Science ResearchCouncil. Peer Jørgensen, University of Copenhagen, was responsiblefor the technical aspects of the refraction/wide-angle seismic experi-ment, including loading and detonation of the 18 shots. EgonNørmark, University of Aarhus, processed the normal-incidence re-flection seismic data by use of Landmark Software (ProMAX) madeavailable to University of Aarhus through a Landmark UniversityGrant. All refraction/wide-angle reflection seismic data were pro-cessed using Landmark software (ProMAX) which is made availableto the University of Copenhagen through a Landmark UniversityGrant. All logging data were prepared by the Geological Survey ofDenmark and Greenland. Comments by I. Fabricius and P. Japsen toan earlier version of this manuscript helped improve the manuscript.Discussion with Peter Japsen about velocity–depth relations for chalksediments is highly appreciated.
References
Anderskouv, K., Damholt, T., Surlyk, F., 2007. Late Maastrichtian chalk mounds, StevnsKlint, Denmark—combined physical and biogenic structures. Sedimentary Geology200, 57–72.
Anell, I., Thybo, H., Artemieva, I.M., 2009. Cenozoic uplift and subsidence in the NorthAtlantic region: geological evidence revisited. Tectonophysics 474, 78–105.
Anell, I., Thybo, H., Stratford, W., 2010. Relating Cenozoic North Sea sediments totopography in southern Norway: the interplay between tectonics and climate.Earth and Planetary Science Letters 300, 19–32. doi:10.1016/j.epsl.2010.09.009.
Anselmetti, F.S., Eberli, G.P., 1997. Sonic velocity in carbonate sediments and rocks. In:Palaz, I., Marfurt, K.J. (Eds.), Carbonate Seismology: Society of Exploration Geo-physicists Geophysical Developments Series, 6, pp. 53–74.
Bjerager, M., Surlyk, F., 2007. Danian cool-water bryozoan mounds at Stevns Klint,Denmark—a new class of non-cemented skeletal mounds. Journal of SedimentaryResearch 77, 634–660.
Brasher, J.E., Vagle, K.R., 1996. Influence of lithofacies and diagenesis on NorwegianNorth Sea chalk reservoirs. AAPG Bulletin 80, 746–769.
Braile, L.W., Smith, R.B., 1975. Guide to the interpretation of crustal refraction profiles.Geophysical Journal of the Royal Astronomical Society 40 (2), 145–176.
Brotzen, F., 1959. On Tylocidaris species (Echinoidea) and the stratigraphy of theDanian of Sweden. SGU Series C 571, 1–81.
Eberli, G.P., Beachle, G.T., Anselmetti, F.S., Incze, M.L., 2003. Factors controlling elasticproperties in carbonate sediments and rocks. The Leading Edge 7, 654–660.
Erlström, M., Thomas, S.A., Deeks, N., Sivhed, U., 1997. Structure and tectonic evolutionof the Tornquist Zone and adjacent sedimentary basins in Scania and the southernBaltic Sea area. Tectonophysics 271, 191–215.
Fabricius, I.L., 2003. How burial diagenesis of chalk sediments controls sonic velocityand porosity. AAPG Bulletin 87, 1755–1778.
Fabricius, I.L., 2007. Chalk: composition, diagenesis and physical properties. Bulletin ofthe Geological Society of Denmark 55, 97–128.
Fabricius, I.L., Høier, C., Japsen, P., Korsbech, U., 2007.Modelling elastic properties of impurechalk from South Arne Field, North Sea. Geophysical Prospecting 55, 487–506.
Fabricius, I.L., Gommesen, L., Krogsbøll, A., Olsen, D., 2008. Chalk porosity and sonic velocityversus burial depth: influence of fluid pressure, hydrocarbons, and mineralogy. AAPGBulletin 92, 201–223.
GEUS, 2009. The Jupiter data base. www.geus.dk 2009.Henriksen, A.D., Fabricius, I.L., Borre, M.K., Korsbech, U., Theilgaard, A.T., Zandbergen, J.,
1999. Core density scanning, degree of induration and dynamic elastic moduli ofPalaeogene limestone in the Copenhagen area. The Quarterly Journal of Engineer-ing Geology 32, 107–117.
Japsen, P., 1998. Regional velocity–depth anomalies, North Sea Chalk: a record of over-pressure and Neogene uplift and erosion. AAPG Bulletin 82, 2031–2074.
Japsen, P., 2000a. Fra Kridthav til Vesterhav. Nordsøbassinets udvikling vurderet ud fraseismiske hastigheder. Geologisk Tidsskrift 2, 1–36.
Japsen, P., 2000b. Investigation of multi-phase erosion using reconstructed shale trendsbased on sonic data. Sole Pit axis, North Sea. Global and Planetary Change 24,189–210.
Japsen, P., Bidstrup, T., 1999. Quantification of late Cenozoic erosion in Denmark based onsonic data and modelling. Bulletin of the Geological Society of Denmark 46, 79–99.
Japsen, P., Green, P.F., Nielsen, L.H., Rasmussen, E.S., Bidstrup, T., 2007. Mesozoic–Cenozoic exhumation events in the eastern North Sea Basin: a multi-disciplinarystudy based on palaeothermal, palaeoburial, stratigraphic and seismic data. BasinResearch 19, 451–490.
Jordt, H., Faleide, J.I., Bjørlykke, K., Ibrahim, M.T., 1995. Cenozoic sequence stratigraphyof the central and northern North Sea Bain: tectonic development, sediment distri-bution and provenance areas. Marine and Petroleum Geology 12, 845–879.
Lassen, A., Thybo, H., 2004. Seismic evidence for Late Proterozoic orogenic structuresbelow the Phanerozoic sedimentary cover in the Kattegat area, SW Scandinavia.Tectonics 23. doi:10.1029/2003TC001499.
Lassen, A., 2006. Structure and evolution of the pre-Permian basement in the Danisharea. PhD thesis, Geological Institute, University of Copenhagen, Denmark, 272 pp.

26 L. Nielsen et al. / Tectonophysics 511 (2011) 14–26
Lassen, A., Thybo, H., submitted for publication. Neoproterozoic and Palaeozoic evolu-tion of SW Scandinavia based on integrated reflection seismic interpretation.Precambrian Research.
Levander, A.R., 1988. Fourth-order finite-difference P-SV seismograms. Geophysics 53,1425–1436.
Liboriussen, J., Ashton, P., Tygesen, T., 1987. The tectonic evolution of the FennoscandianBorder Zone in Denmark. Tectonophysics 137, 21–29.
Lidmar-Bergström, K., Bonow, J.M., 2009. Hypothesis and observations on the origin ofthe landscape of southern Norway—a comment regarding the isostasy-climate-erosion hypothesis by Nielsen et al. 2008. Journal of Geodynamics 48, 95–100.
Lidmar-Bergström, K., Ollier, C.D., Sulebak, J.C., 2000. Landforms and uplift history ofsouthern Norway. Global and Planetary Change 24, 211–231.
Lykke-Andersen, H., Surlyk, F., 2004. Topography of the Cretaceous–Palaeogene bound-ary at Stevns Klint, Denmark: inversion tectonics or primary relief of the chalk sea-floor? Journal of the Geological Society (London) 161, 343–352.
Mogensen, T.E., Jensen, L.N., 1994. Cretaceous subsidence and inversion along theTornquist Zone from the Kattegat to the Egersund Basin. First Break 12, 211–222.
Nielsen, L., Looms, M.C., Hansen, T.M., Cordua, K.S., Stemmerik, L., 2010. Estimation ofchalk heterogeneity from stochastic modeling conditioned by crosshole GPRtraveltimes and log data. In: Miller, R.D., Bradford, J.H., Holliger, K. (Eds.), Advancesin near-surface seismology and ground-penetrating radar: SEG, Geophysicaldevelopments series, 15, pp. 379–398.
Nielsen, L.H., Japsen, P., 1991. Deep wells in Denmark 1935–1990—lithostratigraphicsubdivision. Geological Survey of Denmark, Series A 31 177 pp.
Nielsen, S.B., 2002. A post mid-Cretaceous North Sea model. Bulletin of the GeologicalSociety of Denmark 49, 187–204.
Nielsen, S.B., Gallagher, K., Egholm, D.L., Clausen, O.R., Summerfield, M., 2009a. Reply tocomment regarding the ICE hypothesis. Journal of Geodynamics 48, 101–106.
Nielsen, S.B., Gallagher, K., Leighton, C., Balling, N., Svenningsen, L., Jacobsen, B.H., Thomsen,E., Nielsen, O.B., Heilmann-Clausen, C., Egholm, D.L., Summerfield, M.A., Clausen, O.R.,Piotrowski, J.A., Thorsen, M.R., Huuse, M., Abrahamsen, N., King, C., Lykke-Andersen, H.,2009b. The evolution of western Scandinavian topography: A review of Neogene upliftversus the ICE (isostasy-climate-erosion) hypothesis. Journal of Geodynamics 47, 72–95.
Nielsen, S.B., Thomsen, E., Hansen, D.L., Clausen, O.R., 2005. Plate-wide stress relaxationexplains European Paleocene basin inversions. Nature 435, 195–198.
Robertsson, J.O.A., Blanch, J.O., Symes, W.W., 1994. Viscoelastic finite-difference modeling.Geophysics 59, 1444–1456.
Sandrin, A., Nielsen, L., Thybo, H., 2009. Layered crust–mantle transition zone below alarge crustal intrusion in the Norwegian–Danish Basin. Tectonophysics 472, 194–212.
Scholle, P.A., 1977. Chalk diagenesis and its relation to petroleum exploration; oil fromchalks, a modern miracle? AAPG Bulletin 61, 982–1009.
Schovsbo, N.H., Rasmussen, S.L., Sheldon, E., Stemmerik, L., 2008. Correlation of carbonisotope events in the Danish Upper Cretaceous chalk. Geological Survey ofDenmark and Greenland Bulletin 15, 13–16.
Sclater, J.G., Christie, P.A.F., 1980. Continental stretching; an explanation of the post-Mid-Cretaceous subsidence of the central North Sea basin. Journal of GeophysicalResearch 85, 3711–3739.
Stemmerik, L., Surlyk, F., Klitten, K., Rasmussen, S.L., Schovsbo, N., 2006. Shallow coredrilling of the Upper Cretaceous Chalk at Stevns Klint, Denmark. Geological Surveyof Denmark and Greenland Bulletin 10, 13–16.
Surlyk, F., 1997. A cool-water carbonate ramp with bryozoan mounds: Late Cretaceous–Danian of the Danish Basin. In: James, N.P., Clark, J.D.A. (Eds.), Cool-Water Carbonates:SEPM Spec. Publ., 56, pp. 293–307.
Surlyk, F., Damholt, T., Bjerager,M., 2006. StevnsKlint, Denmark: UppermostMaastrichtianchalk, Cretaceous–Tertiary boundary, and lower Danian bryozoan mound complex.Bulletin of the Geological Society of Denmark 54, 1–48.
Surlyk, F., Dons, T., Clausen, C.K., Higham, J., 2003. Upper Cretaceous. In: Evans, D., Graham,C., Armour, A., Bathurst, P. (Eds.), The Millennium Atlas: Petroleum Geologyof the Central and northern North Sea. The Geological Society of London, London,pp. 213–233.
Thybo, H., 2001. Crustal structure along the EGT profile across the Tornquist Fan inter-preted from seismic, gravity and magnetic data. Tectonophysics 334, 155–190.
Vejbæk, O.V., Bidstrup, T., Britze, P., Erlström, M., Rasmussen, E.S., Sivhed, U., 2003.Chalk structure maps of the central and eastern North Sea. Geological Survey ofDenmark and Greenland (GEUS), Report 2003/106. 55 pp.
Vejbæk, O.V., Britze, P., 1995. Top pre-Zechstein, Geological Map of Denmark 1:750000.Geological Survey of Denmark and Greenland (GEUS), Map Series 45, 9 pp.
Wang, Z., 1997. Seismic properties of carbonate rocks. In: Palaz, I., Marfurt, K.J. (Eds.),Carbonate Seismology: Society of Exploration Geophysicists Geophysical Develop-ments Series, 6, pp. 29–52.
Zelt, C.A., Smith, R.B., 1992. Seismic traveltime inversion for 2-D crustal velocity struc-ture. Geophysical Journal International 108, 16–34.
Ziegler, P.A., 1990. Geological Atlas of Western and Central Europe. Shell InternationalePetroleum Maatschappij. The Hague/Elsevier, Amsterdam. 239 pp.