The Times they Are A-Changin' . Organizational Change and Immigrnat Employment Opportunities in...
38
IZA DP No. 258 The Times They are A-Changin' Organizational Change and Immigrant Employment Opportunities in Scandinavia Michael Rosholm Kirk Scott Leif Husted DISCUSSION PAPER SERIES Forschungsinstitut zur Zukunft der Arbeit Institute for the Study of Labor February 2001
Transcript of The Times they Are A-Changin' . Organizational Change and Immigrnat Employment Opportunities in...

IZA DP No. 258
The Times They are A-Changin'Organizational Change and Immigrant EmploymentOpportunities in Scandinavia
Michael RosholmKirk ScottLeif Husted
DI
SC
US
SI
ON
PA
PE
R S
ER
IE
S
Forschungsinstitutzur Zukunft der ArbeitInstitute for the Studyof Labor
February 2001
�������������������� �������� ��� ���� ���� ���� �������� ��������������
������������������ ���� �� ��
���� ����������������������� ��� ��������� �����������������������������
�!������������������� ��� ���������� �����������
�
"��#�$����������������� ��! ��������������������
Discussion Paper No. 258 February 2001
IZA
P.O. Box 7240 D-53072 Bonn
Germany
Tel.: +49-228-3894-0 Fax: +49-228-3894-210
Email: [email protected]
This Discussion Paper is issued within the framework of IZA’s research area �"����� ���#��$�"����� � ��"����%���&Any opinions expressed here are those of the author(s) and not those of the institute. Research disseminated by IZA may include views on policy, but the institute itself takes no institutional policy positions. The Institute for the Study of Labor (IZA) in Bonn is a local and virtual international research center and a place of communication between science, politics and business. IZA is an independent, nonprofit limited liability company (Gesellschaft mit beschränkter Haftung) supported by the Deutsche Post AG. The center is associated with the University of Bonn and offers a stimulating research environment through its research networks, research support, and visitors and doctoral programs. IZA engages in (i) original and internationally competitive research in all fields of labor economics, (ii) development of policy concepts, and (iii) dissemination of research results and concepts to the interested public. The current research program deals with (1) mobility and flexibility of labor markets, (2) internationalization of labor markets and European integration, (3) the welfare state and labor markets, (4) labor markets in transition, (5) the future of work, (6) project evaluation and (7) general labor economics. IZA Discussion Papers often represent preliminary work and are circulated to encourage discussion. Citation of such a paper should account for its provisional character.

IZA Discussion Paper No. 258 February 2001
%�������
�������������������� �������� ��� ���� ���� ���� �������� ��������������
������������������ ���� �� ∗ �
This article compares and contrasts male immigrant labor market experiences in Sweden and Denmark during the period 1985 - 1995. Using register-based panel data sets from Sweden and Denmark, a picture of the employment assimilation process of immigrants from Norway, Poland, Turkey, and Iran is brought forth. The comparative approach shows that immigrants in Sweden and Denmark experienced similar declines in employment prospects between 1985 and 1995 despite quite different developments of aggregate labor market conditions. The explanation offered here is that the changing organizational structure – towards more flexible work organization - has resulted in a decrease in the attractiveness of immigrant employees due to the increasing importance of country-specific skills and informal human capital. JEL Classification: J61, J71, L23, O30 Keywords: Immigrants, employment assimilation, organizational change Michael Rosholm Department of Economics Aarhus School of Business Fuglesangs Alle 20 8210 Århus V Denmark Tel.: +45 89 42 15 59 Fax: +45 86 13 63 34 Email: [email protected]
∗ This paper is written within the research project "Labour Demand, Education and the Dynamics of Social Exclusion" funded by European Commission under the TSER network (contract number SOE2-CT97-3052), the Swedish Council for Research in Humanities and Social Science, and the Danish Social Research Council (FREJA and the program "Polarization of The Welfare Society and The Funding Crisis”).
2
1. Introduction
This article charts the change in the employment assimilation process of first generation male
immigrants from selected countries in Denmark and Sweden during the period 1985 – 1995. A
comparative analysis of employment performance gives evidence of a significant negative
impact of organizational change on the employment opportunities of immigrants.
Denmark and Sweden are both Scandinavian countries with well-developed social welfare
systems, and similar cultural and historical backgrounds. Despite these extensive similarities,
there are a number of differences in national labor market experiences, which will allow for a
better understanding of the processes underlying immigrant economic integration.
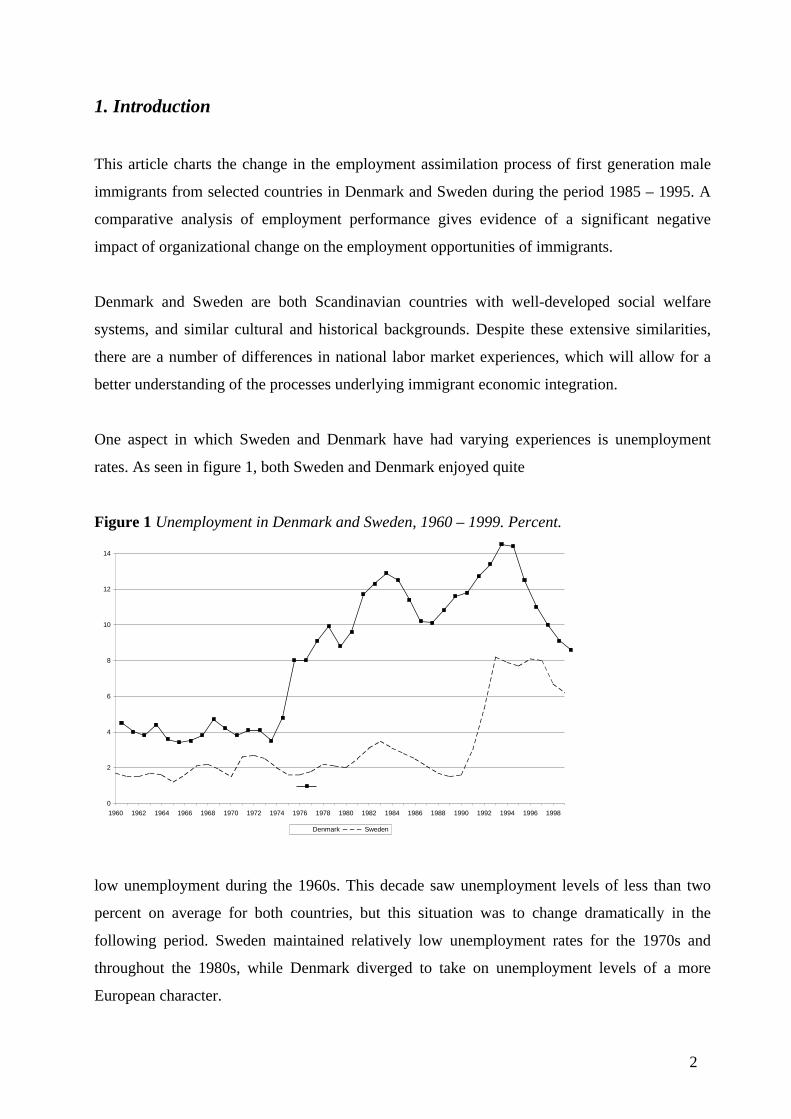
One aspect in which Sweden and Denmark have had varying experiences is unemployment
rates. As seen in figure 1, both Sweden and Denmark enjoyed quite
Figure 1 Unemployment in Denmark and Sweden, 1960 – 1999. Percent.
0
2
4
6
8
10
12
14
1960 1962 1964 1966 1968 1970 1972 1974 1976 1978 1980 1982 1984 1986 1988 1990 1992 1994 1996 1998
Denmark Sweden
low unemployment during the 1960s. This decade saw unemployment levels of less than two
percent on average for both countries, but this situation was to change dramatically in the
following period. Sweden maintained relatively low unemployment rates for the 1970s and
throughout the 1980s, while Denmark diverged to take on unemployment levels of a more
European character.

3
Figure 1 clearly shows that the economic situations in Denmark and Sweden were quite
different during the 1980s, despite similar political, social and economic institutions. By the
early 1990s, however, the unemployment rates had ‘converged’. This development provides us
with an opportunity to examine the effects of cyclical and structural developments on immigrant
economic performance.
A look at annual GNP growth (not presented here) shows that there existed no serious
differences in growth rates between Sweden and Denmark during the entire period from 1960
through 1999, although the two countries did not share the same cyclical patterns. A look at the
period of interest to this study does show some difference, however, with Denmark having
lower growth rates in the late 1980s, followed by increasing rates in the early 1990s, while
Sweden experienced stagnant or even negative GNP growth during the first years of the 1990s.
It is first in the mid 1990s that Sweden’s growth rate returns to Danish levels.
Given the above situation, it can be said that the period 1985 – 1995 began with Sweden and
Denmark experiencing quite different economic conditions, and ended with the two nations
exhibiting similar levels of unemployment and economic growth. Therefore, ceteris paribus, the
employment prospects of immigrants in these two countries should differ in the early period,
and then become increasingly similar as time goes by.
This would be the case if the economic performance of immigrants was purely a function of the
macroeconomic climate in the destination country. This is not believed to be the actual case,
however.1 Evidence from Sweden points to weakening immigrant labor market attachment and
income performance even during the cyclical upturn of the late 1980s (Scott 1995, 1999;
Bevelander 1998; Bevelander and Nielsen 1999), pointing to a deterioration in labor market
assimilation of a non-cyclical nature. This article will show that the labor market performance
of immigrants deteriorated in both Denmark and Sweden during the late 1980s and early 1990s,
even after correcting for individual effects, cohort effects, and cyclical effects. Furthermore, this
deterioration is shown to increase with the ‘cultural distance’ from the immigrants’ origin
country to Denmark/Sweden. This is taken as evidence that organizational changes in the labor
1 A look at the raw employment rates of immigrants relative to natives is not very informative on this issue,since the composition of immigrants change, and in addition the immigrants residing in Denmark and Sweden in1995 have on average been in the countries for a longer period - see the descriptive statistics in the appendix.

4
market away from assembly line production work towards multi-tasking, teamwork, the use of
computers etc. (see Snower 1999), do not benefit immigrants, as their informal - ‘linguistic and
cultural’ - capital, which is becoming increasingly important, is not sufficient to obtain and keep
jobs. Specifically, we present evidence that suggests that the deterioration in employment
opportunities is caused by increasing statistical discrimination performed by employers on
certain groups of immigrants.
The analysis is performed by using similar data sets – drawn from administrative registers - of
immigrants to Denmark and Sweden and ‘control samples’ of Danes and Swedes to analyze
immigrants’ employment relative to natives. The methodology used is a panel-data probit
model, which is designed to correct for individual-specific effects.
2. Previous Research
Earlier studies on differences in native-immigrant employment rates and relative incomes of
immigrants have shown a varied picture. Accounting for 10 and 5 percent of the populations in
Sweden and Denmark, respectively, nearly all groups of immigrants in Sweden and Denmark
have lower employment rates than natives. Almost identical patterns are found in other Western
European countries with similar labor market conditions, e.g. Germany, the Netherlands and
England (Schmidt 1994; Penninx, Schoorl, and van Praag 1993; Kee 1994; Shields and Price
1996).
North American studies, on the other hand, find for Canada that immigrants assimilate quickly
(Baker and Benjamin 1996) and for the USA that immigrants have a lower employment rate and
a higher unemployment rate than the native born during the first years in the US, and they then
catch up to reach a stable employment and unemployment rate (Chiswick and Hurst 1996;
Chiswick, Cohen and Zach 1997). Much recent research points towards nationality and time of
entry as significant factors in the labor market assimilation of immigrants (Borjas 1985, 1987,
1989, 1994, 1995; Fry 1997). Here we see discussion of the importance of motivation, scarring
effects of time at entry, and other, non-observable characteristics. Other studies point to
increased investments in language leading to higher earnings and greater chances of finding
employment (McManus 1985; Chiswick and Miller 1995, 1999; Dustmann 1994, 1999).

5
In the Swedish case, studies on the economic integration of immigrants show a very high labor
market attachment during the 1950s and 1960s with high employment rates and relatively high
incomes (Wadensjö 1973; Ohlsson 1975; Ekberg 1983). Current research into the situation of
the 1970s and 1980s shows a different picture, characterized by low immigrant employment
rates and relatively low incomes. Not even the economic upturn in the late eighties served to
reverse the development. In fact, the opposite happened as incomes and employment rates of
immigrants decreased, even for immigrant groups that had been in Sweden for more than
twenty years (Ekberg 1990, 1991; Bevelander 1995, 1998; Bevelander and Nielsen 1999; Scott
1995, 1999). These studies suggest that not only supply side factors, but also demand side and
institutional factors work to explain the poor labor market attachment of immigrants. It is
argued that there has been a shift towards increasing discrimination by authorities, employers,
and employees (Broomé, Bäcklund, Lundh and Ohlsson 1996). At the institutional level, the
policies pertaining to immigration, integration and the labor market have influenced the labor
market success of immigrants both on entry and in the long run (Bevelander, Carlsson and
Rojas 1997; Kamali 1997; Blos, Fischer and Straubhaar 1997).
There is not much empirical work on the integration of immigrants in Denmark. In Hummel-
gaard et al (1995), the labor market performance of immigrants from less developed countries is
compared with the performance of Danes. They find that unemployment is much more common
among immigrants and that, once unemployed, immigrants stay unemployed longer. They also
find that there are large differences in the integration of immigrants from different regions of the
world. The same is found in Husted et al (2000a), where wage and employment assimilation
profiles are estimated for the time period 1984 to 1995. They find no strong evidence of
employment assimilation for immigrants in the Danish labor market, but they find at least a
declining employment gap during the first 10 years after immigration.

6
3. Foundation and Hypotheses
This article presents the hypothesis that the changing organizational structure of modern
industrialized economies has adversely affected immigrants. The explosion in computerization,
which began during the late 1970s and early 1980s, has altered traditional production methods
as well as opened the door for new spheres of economic activity. The traditional, hierarchical
industrial organization is no longer necessary, and can even be seen as a disadvantage. Snower
(1999) argues that
“… many of the inherited methods of producing, working, and managing – based on the insightsgained from more than a century of division of labor, standardization, and mass production – arenow widely obsolete.”
Computerization has brought with it the ability to control entire production processes with a
minimum of workers. The reporting route from lowest assembly-line worker to upper-
management is often much more direct today than it was in the 1960s, and the demands on
workers are subsequently much greater.2
While this change may be beneficial to the economy in general, and for certain groups of
workers in particular, it is hypothesized that the effects should be negative on members of the
workforce not raised in the country. Language skills for immigrants were not of vital
importance in the traditional industrial economy. Those employed in manufacturing were often
at lower levels, and performed relatively monotonic work with little interaction among co-
workers. Today’s organizational structure often involves concepts such as job rotation, quality
circles, and work teams, all of which increase the need for interpersonal communication, and
therefore implicitly favor natives.
This perspective can be seen as an expansion of the view of technological change and capital-
skill complementarity.3 The traditional view here is that increased technology often leads to
increased demands for educated labor, and widens the wage gap between the educated and the
uneducated. Here we also assert that it increases the demand for those “educated” in the
2 For a thorough discussion of this process, and the changes in work organization in general, see Snower (1999).3 See Goldin & Katz (1996).

7
functioning of the local society and the labor market. Thus, even highly educated immigrants
may suddenly find themselves in the same category as the uneducated natives.
Given the perspective of organizational change, and the hypothesis that it strikes
disproportionately at immigrants, what is to be expected in a real world examination of data?
The purpose of this work is to examine the possible validity of this perspective using empirical
data from Denmark and Sweden.
Empirical evidence suggests that the process of organizational changes is particularly
widespread in Denmark and Sweden (OECD, 1999), especially in dimensions such as job
rotation, team-based work organization, greater involvement of lower level employees, and the
flattening of management structures. Hence, Danish and Swedish data sets on immigrants and
natives are ideal for investigating the issues described above.
If there is indeed a structural effect, which affects immigrants disproportionately, then we
should expect to find several indicators in the empirical data. The first should be that - given
our hypothesis that the organizational changes work against immigrant assimilation - as the
changes become more extensive and spread throughout the economy, the problems should
become evident through lower immigrant employment rates. In addition, these problems should
be worse for immigrants from nations which can be classified as more “culturally distant.”
A second indicator should be in the effect of the business cycle. The changes evident in
immigrant economic performance should be occurring independently of the business cycle. In a
world where immigrants and natives are interchangeable, the business cycle should account for
most of the shifting economic prospects of both groups. In our framework, however, the two are
no longer interchangeable due to increased emphasis on skills that give natives an advantage.
This hypothesis can be tested using the comparative approach in this paper. If the organizational
change towards newer organizational forms occurred simultaneously in Sweden and Denmark,
which is assumed4, then we should see similar movements in employment assimilation among
immigrants in Denmark and Sweden. The fact that the two countries have differing
unemployment levels and business cycles which are not entirely in sync should lead to different
assimilation trends in the two countries if the structural component is of little importance.

8
In short, if the development of immigrants’ employment performance in Denmark and Sweden
is similar over time, we will attribute this to the impact of organizational change, while different
developments in the two countries may be attributed to cyclical effects. The next question is
how to test this. One method is to introduce time dummies that will measure any changes in the
levels of employment. It may be that organizational change, however, affects not only the level,
but also the shape of assimilation profiles (the relation between e.g. employment level and years
since migration). The argument here is that if there is an increasing need for ‘linguistic and
cultural’ capital, then employers are likely to perform statistical discrimination on any groups
that are perceived to have less of these factors on average. Thus, according to this line of
argument, statistical discrimination will be based on the country of origin (in actual practice
based on your name) rather than on human capital factors.5 As such, the variable ‘Years Since
Migration’ (YSM) should become less important in the employment equation as the process of
organizational change intensifies. To test for this effect we will allow the parameters
determining the shape of the assimilation profiles to change over time.
4. Data
The Swedish and Danish data used in the analysis come from public registers maintained by
Statistics Sweden and Statistics Denmark, respectively. The Swedish data set is a stratified
sample of immigrants (from 16 major origin countries) and Swedes, followed from 1968
through 1996. Some of the information used in this study is only available from 1985, however.
The data is described in more detail in Scott (1999). The Danish data set consists of the entire
immigrant population in Denmark and their children, followed during the period 1984 through
1995. In addition, we have a data set containing 10% of all Danes in the age group 16-75. The
Danish data sets are described in some detail in Husted et al. (2000a).
4 For more empirical evidence of the prevalence of flexible working structures in Sweden and Denmark, seeOECD (1999).5 It is by now a stylized fact in the Nordic countries that employers select among job applicants by removing firstall those with a ‘strange’ – from a Nordic point of view - name. This has been documented through several‘experiments’ where immigrants ‘faking’ a Danish name suddenly are invited for job interviews where they werepreviously rejected.
9
In order to make our data as comparable as possible (and to facilitate the empirical analysis), a
sub-sample of first generation immigrants to Denmark and Sweden from 4 major immigrant
countries is extracted, such that there are approximately 2,500 individuals from each of the
origin countries. The countries are Norway, Poland, Turkey, and Iran, with the order in which
these countries are mentioned reflecting assumed cultural proximity to Denmark and Sweden.
In addition, samples of approximately the same size of Danes and Swedes are selected.
The sample is subsequently restricted to include only males6 in the age group 20-59 years, who
are not currently in education, and who are not currently self employed. Both panels are then
censored, so that they cover the period 1985 through 1995. In this period, a number of variables
are available that are defined in a similar fashion in the two countries.
The dependent variable, an annual employment indicator, takes the value one if the individual
has been working during the year. To be classified as ‘working during the year’ an individual
must have positive reported earnings. This is, admittedly, a very generous measure of
employment. However, as can be seen from Figure A1 in the appendix, employment rates of
immigrants are still very low. We have experimented with other definitions of employment, but
the results presented below are robust to such changes.
We note from Figure A1, that native Danes and Swedes experience weakly falling employment
rates over the period. In Denmark, employment rates of Norwegians and Poles were fairly
constant, whereas those of Turks fell, while employment rates for Iranians increased, albeit
from a very low initial level. It should be noted, however, that Iranians in 1985 had only been in
Denmark for 2 years on average, while in 1995 this average had increased to 8.4 years (see
Table A1 in the appendix). In Sweden, employment rates were fairly constant until 1990, when
they began to fall for all groups, but most notably for immigrants from Turkey and Iran – the
culturally and linguistically most distant of the immigrants groups. Not much can be said about
the impact of organizational change from Figure A1, however. To do this, an econometric
modeling strategy is necessary, and the econometric model is described in the next section.
6 The behaviour of immigrant females from less developed countries with respect to the labor market is sodifferent – and difficult to explain – that they are removed here to maintain the focus of the paper. For adiscussion of these issues for Denmark, see Husted et al. (2000b).

10
The human capital variables include age at migration (AAM) and its square, and years since
migration (YSM) and its square. For the education variable a set of indicators measuring level
of education obtained in Sweden/Denmark are used, with no education as the reference
category, and then educational level is divided into five groups: primary, secondary, and
theoretical 1, 2, and 3. The theoretical categories correspond roughly to two-year university,
bachelor’s degree and graduate degree.7 The effect of marital status is captured by an indicator
variable taking the value 1 for married individuals and 0 otherwise,8 and finally, the number of
children is used. We also use an indicator measuring if an immigrant has become naturalized –
that is, whether he has received Danish or Swedish citizenship.
Demand factors include geographical information, grouped into metropolitan area (ref.), and
non-metropolitan area. To measure time-specific effects, we include a set of annual dummies.
In addition to the time dummies, a trend effect on YSM for immigrants and on Age for natives
is also included, to capture changing effects expected for experience as time progresses.
We estimate separate equations for each origin country. Additional important information such
as pre-immigration education, working experience etc. is unfortunately not available. This
problem is reduced by the fact that we employ a random effects estimator.
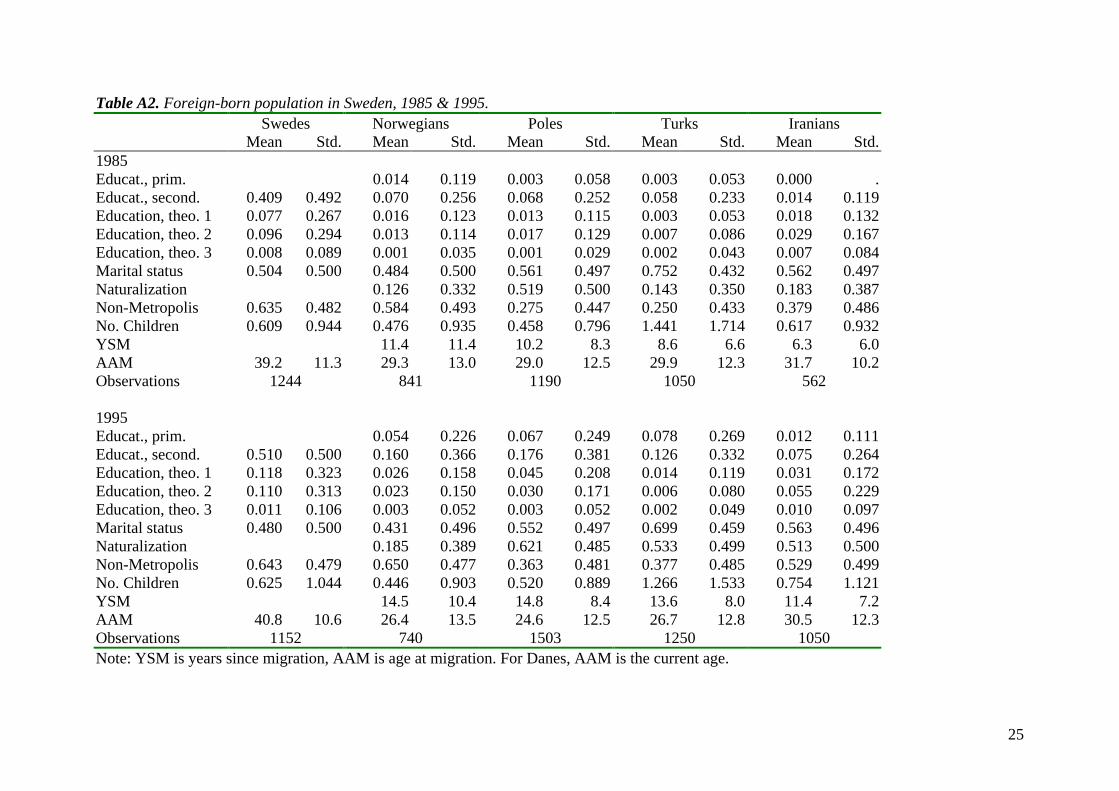
Descriptive statistics for Danish and Swedish immigrants as well as for the aggregate variables
are reported in Tables A1 and A2 in the Appendix.
7 The education obtained in the home country is not available for immigrants in Denmark, hence – although it isavailable for Swedish immigrants – we have not included this information.8 For Denmark, this variable measures cohabitation as well as marriage.

11
5. Econometric Specification
We will be performing an analysis of the determinants of employment probabilities, and we
would like to exploit the panel structure of our data sets, so as to avoid cohort immigration
effects (Borjas 1987) among other things. The appropriate type of estimator is thus a binary
choice panel data estimator. Framing the model in a latent utility framework, let the utility of
working for individual i at time t be denoted by ity . This index may depend on a number of
explanatory variables in the following manner
'it it it t i ity YSM xβ γ δ α ε= + + + +
where YSM denotes years since migration (we have ignored squared terms for the ease of
exposition) and x is a vector of other individual characteristics. Now, in our case, we would like
to analyze if the employment assimilation profiles flatten over time, that is, whether the
parameter β changes over time. The most flexible way to do this is to introduce period-specific
β ’s. This approach showed a linear trend in the parameters, which lead us to estimate the
restricted model
( ) '0 1 1985it it it t i ity YSM t xβ β γ δ α ε= ⋅ + − + + + +
in order to gain efficiency. We were able to reject the hypothesis that the more general model
was better, and hence, we report the estimates from this restricted equation. The linear trend is
allowed in the parameters on YSM and its square. The dependent variable in the study is thus an
indicator taking the value 1 if the individual i has worked in the year t (that is, if 0ity > ) and 0
otherwise.
We have chosen to estimate a random effects probit model. The tδ are time effects, which
capture level shifts in employment probabilities over time. The iα are random individual-
12
specific effects, which are are assumed to follow a discrete distribution with two points of
support.9
6. Results
In this section we present the results from the estimation of separate employment equations for
native men and men from the selected four immigrant countries, in Denmark and Sweden. The
complete regression results are presented in the appendix, and here we present only graphical
interpretations of immigrant assimilation profiles. The calculation of these profiles is based
upon a typical individual with given characteristics, with the only difference being nationality.
The individual is defined as a male, aged 26 upon entry into Denmark / Sweden, living outside
of a metropolitan area, married or cohabiting, with one child, and primary school education
obtained in Denmark / Sweden. Note that a different choice of standard person may change the
relative positions of the employment assimilation profiles, but the evolution of the profiles from
1985 to 1995 will be (approximately) the same irrespective of this choice. The profiles show the
progression in the employment probability with increased years since migration, or increased
age in the case of natives.
The benefit of this approach is that it allows an easy overview of the comparative performance
of individuals who differ only in terms of their ethnic/national backgrounds. The diagrams were
constructed using the values of the relevant parameters in 1985 and 1995 in order to identify
differences between the beginning and the end of our study.10 The traditional problems
associated with construction of lifetime profiles based upon single years are avoided through the
use of a panel data estimation methodology, and by the stratification into samples for different
origin countries.
Figure 2 shows employment development for immigrants and natives in Denmark in 1985 and
1995. For native Danes, employment rates are very high in both years, and they show a slight
decline with increasing age (for natives, YSM=1 corresponds to an individual aged 26).
9 We have experimented with several econometric specifications, such as a logit model, a normal mixingdistribution, more than two points of support etc., but the estimation results were robust to such changes.10 The parameters differ over time due to the interaction of YSM with a time trend, and due to the presence oftime dummies. For natives, Age is interacted with a time trend.

13
Figure 2 Employment development with years since migration, Denmark
Denmark 1985
0
0.2
0.4
0.6
0.8
1
1 2 3 4 5 6 7 8 9 10 11 12 13 14 15 16 17 18 19 20 21
YSM
dk85 nor85 pol85 tur85 iran85
Denmark 1995
0
0.2
0.4
0.6
0.8
1
1 2 3 4 5 6 7 8 9 10 11 12 13 14 15 16 17 18 19 20 21
YSM
dk95 nor95 pol95 tur95 iran95
For Norwegian immigrants, employment rates have also been fairly constant, falling from
slightly above 70% to slightly below, but for non-Nordic immigrants there has occurred a
dramatic change in calculated employment probabilities. The profiles for all non-Nordic
immigrants displayed ‘better’ patterns in 1985 compared to 1995. By 1995 the assimilation
patterns had either shifted downwards or, in the case of Poland, shifted from upward to
downward sloping. This indicates that the positive effects of years since migration from the
1985 data was less pronounced or even absent in 1995. Norwegian immigrants do not seem to

14
have experienced any changes in relative employment probabilities during the period under
investigation.
Figure 3 portrays a similar situation for Sweden, with certain differences. While the Danish case
showed a shifting of in some cases already negatively sloping profiles, the Swedish profiles
were generally more positive in 1985 than the Danish ones, with noticeable improvement with
increased years in the country.
Figure 3 Employment development with years since migration, Sweden
Sweden 1985
0
0.2
0.4
0.6
0.8
1
1 2 3 4 5 6 7 8 9 10 11 12 13 14 15 16 17 18 19 20 21
YSM
sw85 nor85 pol85 tur85 iran85
Sweden 1995
0
0.2
0.4
0.6
0.8
1
1 2 3 4 5 6 7 8 9 10 11 12 13 14 15 16 17 18 19 20 21
YSM
sw95 nor95 pol95 tur95 iran95

15
By 1995 this situation had changed considerably, with increased years in Sweden leading in
general to decreased employment probabilities. The initial employment probabilities in 1995
were generally lower than in 1985, and these appear to decrease as time goes by. An example
here could be the Turks. Based on the 1985 profile, it is seen that a 26 year old Turkish male
should have a 65 percent chance of being employed during his first year in Sweden. Using the
same profile, a 36 year old Turk (initial age (26) + ysm (10)) having lived in Sweden for 10
years should have a 76 percent probability of being employed. Moving the clock forward to
1995, we see that the initial employment probability for the 26 year old is now only 57 percent,
while the 36 year old now only has a 54 percent chance of employment.
Looking at these graphs provides some understanding of the relative labor market positions of
different nationalities, but is not quite as clear on the actual assimilation process. In order to
make this process more visible, Figure 4 has been constructed from the same information as
above, using a familiar difference-in-differences approach. Here we plot the changes in
employment probabilities for the different nationalities between 1985 and 1995, net of the
changes in employment probability of the natives. Denote the employment profile of an
immigrant by EI and the similar age profile of a Dane by ED. The diagrams below then plot
( ) ( )EI EI ED ED1995 1985 1995 1985− − −
Thus, the diagrams become quite simple to interpret – any positive values indicate an
improvement in labor market position relative to natives, and negative values show
deterioration in standing.
Figure 4 shows that Norwegians both in Denmark and Sweden experienced a decline in
employment assimilation of between 5 and 20 percentage points. There is a penalty to be paid in
terms of employment for being Norwegian during 1995 that did not exist in 1985, and this
penalty increases with increased time in the country.
Turning our focus to the Poles, we can see a quite similar pattern forming in both Denmark and
Sweden. In both Denmark and Sweden the Polish men improved their employment situation
remarkably during the first years in the country, only to see this positive movement turn
negative as years in the country increases. Note that a negatively sloping difference-in-

16
differences ‘profile’ implies that the assimilation profiles have generally become more
negatively sloped during the period. Thus, spending time in the destination country is not as
beneficial - in terms of employment prospects – to the individual in 1995 as it was in 1985.
Figure 4 Relative changes in employment assimilation, 1985 – 1995.
D-I-D profiles, Norwegians
-0.4
-0.3
-0.2
-0.1
0
0.1
0.2
0.3
0.4
1 2 3 4 5 6 7 8 9 10 11 12 13 14 15 16 17 18 19 20 21
Norwegians in Denmark Norwegians in Sweden
D-I-D profiles for Poles
-0.4
-0.3
-0.2
-0.1
0
0.1
0.2
0.3
0.4
1 2 3 4 5 6 7 8 9 10 11 12 13 14 15 16 17 18 19 20 21
Poles in Denmark Poles in Sweden
D-I-D profiles for Turks
-0.4
-0.3
-0.2
-0.1
0
0.1
0.2
0.3
0.4
1 2 3 4 5 6 7 8 9 10 11 12 13 14 15 16 17 18 19 20 21
Turks in Denmark Turks in Sweden
D-I-D Profiles, Iranians
-1
-0.8
-0.6
-0.4
-0.2
0
0.2
1 2 3 4 5 6 7 8 9 10 11 12 13 14 15 16 17 18 19 20 21
Iranians in DK Iranians in Sweden
For Turks, there seems to be an across the board decline between 1985 and 1995 in employment
prospects. The figure shows that Turkish employment assimilation declines for both Sweden
and Denmark, with somewhat greater declines for those in Denmark. Turks in Sweden
experienced relative declines of between 5 and 25 percentage points, while the Turks in
Denmark saw drops of between 20 and approximately 34 percentage points. Note once again
that not only the level, but also the slope of the assimilation profiles have changed during the
period.
As with the Turks and Poles, the Iranians show worsening assimilation profiles in figure 4, with
drops for both Swedish and Danish residents. The Swedish profile is positively sloped after 5
years in Sweden, implying improving assimilation profiles for Iranians, but the entire profile is
still 8-28 percentage points below that of 1985, when adjusted for native performance. For

17
Denmark, the initial situation of Iranians is virtually unchanged, but the assimilation profile has
worsened dramatically. Note, however, that in 1985 very few Iranians had spent more than 5-10
years in Denmark (the average was only 2 years), hence the profiles shown in Figures 2 and 4
must be taken with some caution, especially the latter part of them.
The employment profiles displayed here show that there appears to be no movement towards
increasing relative employment rates among immigrants from Norway, Poland, Turkey, or Iran.
On the contrary, the chances of obtaining employment for these immigrants is actually smaller
in 1995 than in 1985, a fact which is in line with our expectations. In addition, it is seen that the
deterioration is increasing with the degree of cultural distance to Denmark and Sweden, in
general.
As stated in the hypotheses, it is expected that the organizational change of the economy would
lead to weakened immigrant prospects, and that is what seems to be occurring. In 1985, we see
that the employment profiles for immigrants in Denmark and Sweden were generally increasing
and concave, which implies that employment prospects became brighter as one accumulated
time in the host country. This could be the result of increased information or networks
facilitating job acquisition. In 1995, these concave profiles had either flattened or turned
convex, which points to a decreasing importance of time in the host country.
That the results are so similar for both countries is somewhat surprising, since the economic
circumstances have differed greatly. Sweden had an aggregate unemployment level in 1985 of
about 3 percent, while Danish unemployment was closer to 9 percent. By 1995, Sweden and
Denmark both had unemployment levels of 8 to 10 percent. In other words, the unemployment
situation in Denmark was relatively unchanged from the earlier period, while it was
dramatically higher in Sweden. If immigrant employment performance was merely a reflection
of cyclical patterns, then the Danish case should have remained relatively unchanged, while the
Swedish one should have shifted, at least if the immigrants were more adversely affected than
the natives.
A look at the difference-in-differences profiles for employment, however, shows that
immigrants in the two countries were affected similarly by the changes during the ten years
under observation. All nationalities in both countries saw declining employment prospects, not
only for recently arrived immigrants, but also for those who had been in the destination country

18
for a prolonged time. This could be the case if there was a change in labor demand with
increasing emphasis placed on country-specific characteristics. In this case, employers may well
be employing statistical discrimination in their hiring processes. Given their understanding that
language and cultural factors are of importance, employers could restrict their potential
employee pool to those who are more likely to have these characteristics. This would explain
the decrease in employment prospects for those immigrants who can be expected to have
accumulated country-specific human capital through their time spent in the destination country.
The consequence of organizational change in both countries is that the (negative) signal of
being an immigrant – with a lower level of informal, country specific skills such as language
and cultural understanding – suddenly dominates the (previously positive) signal of having
spent some time in the destination country – thus acquiring these skills.
Now that a pattern of worsening employment possibilities has been charted, it is of interest to
examine the income performance of these immigrants. In a previous version of this paper, we
performed the analysis of employment probabilities and income jointly in a panel data sample
selection model similar to that used by Husted et al. (2000a), but we found essentially, that all
the change over time was in the employment probabilities.11 Hence, in order to maintain the
focus, we have chosen to ignore the income aspects of the assimilation story.
11 This is likely a result of low wage dispersion in the Scandinavian countries and the effect of a strongcentralized collective bargaining system.

19
7. Conclusions
In this article, we have investigated the empirical implications of organizational change in the
labor market for immigrants in Denmark and Sweden from four selected countries. We have
used administrative register data for immigrants and natives for the period 1985-1995 to
estimate panel data probit models for being employed.
Denmark and Sweden are similar in many ways, but they differ in one important way, namely
the evolution of unemployment during the period of investigation. In addition, organizational
changes are very widespread in both economies, when compared to other OECD countries.
Employment assimilation is the key to economic assimilation in both Sweden and Denmark.
The relative paucity of low-wage service employment in both countries leads to the conclusion
that entrance into employment should be a major step towards assimilation into the country in
general. This entrance into gainful employment seems to be becoming increasingly difficult.
The reasons for this may well be the very same factors which are adding to the international
competitiveness of industrialized economies. Recent decades have seen a change in
organizational structure in almost all sectors. The old hierarchical system of industrial
production dating back to Taylor and beyond has been slowly eroded. Increasing use of
information technology has allowed for the chaining of production processes and the
consolidation of control (Snower 1999). This changing organization has placed a premium upon
interpersonal communicative skills, since interaction between workers, and between workers
and management has become more common and intense. The ability to rapidly and efficiently
communicate information has become essential to the smooth functioning of modern
organizations.
Given this, immigrants can be expected to be more adversely affected by the change than
natives, and this indeed appears to be the case. Evidence from both Denmark and Sweden
shows that immigrants in 1995 had poorer employment prospects than they had in 1985. The
fact that the shifts in prospects evident in the difference-in-differences profiles were similar for
immigrants in both Denmark and Sweden gives support for the argument that this is caused by
organizational change rather than other macroeconomic factors. Had the changing employment

20
patterns been the result of primarily cyclical factors, then we would expect the Danish data to
show almost no differences between 1985 and 1995, since these two years had quite similar
levels of aggregate unemployment and GNP growth. This was not the case, however, and the
fact that Denmark showed a similar pattern as Sweden, which had quite a different economic
experience, leads us to conclude that the shifting economic performance of immigrants is the
result of structural shifts in labor demand. These shifts, as mentioned above, serve to strengthen
natives’ positions at the expense of immigrants.
References
Baker, M. & D. Benjamin (1994) ”The Performance of Immigrants in the Canadian Labor Market,” Journal ofLabor Economics 12 (3): 369-405.
Bevelander, P. (1995) Labor Force Participation of Immigrants in Sweden 1960-1990. Fil. Lic-dissertation, Dept.of Economic History, Lund, Sweden.
(1998) ”Employment and Structural Change. Economic Integration of Immigrants in the Swedish and MalmoeLabor Market 1970-1990.” Gorter C, Nykamp P, Poot J (ed) Urban Areas of Host Nations, EconomicAspects of Labor Market Absorption and Sectoral Impacts. Routledge, Amsterdam.
Bevelander, P. & H. Nielsen (1999) ”Declining employment assimilation of immigrants in Sweden: Observed orunobserved characteristics?” CEPR Discussion Paper 2132.
Bevelander P., B. Carlsson & M. Rojas M, (1997) I krusbärslandets storstäder, Invandrare i Stockholm, Göteborgoch Malmö, SNS förlag, Kristianstad.
Blos M., P. Fischer & T. Straubhaar (1997) The impact of migration policy on the labor market performance ofmigrants: a comparative case study, New community, 23(4).
Borjas, G. (1985) "Assimilation, Changes in Cohort Quality, and the Earnings of Immigrants," Journal of LaborEconomics, vol. 3, no. 4.
(1987), “Self-Selection and the Earnings of Immigrants,” The American Economic Review 77, no. 4, pp.531-53.
(1989) "The Self-Employment Experience of Immigrants," Journal of Human Resources, vol. 21.
(1994) "Immigrant Skills and Ethnic Spillover", Journal of Population Economics, 7:2
(1995) “Assimilation and Changes in Cohort Quality Revisited: What Happened to Immigrant Earnings in the1980s?” Journal of Labor Economics, vol. 13, no. 2.
Broomé, P., A.-K. Bäcklund, C. Lundh & R. Ohlsson (1996) Varför sitter ‘Brassen’ på bänken? Stockholm: SNSFörlag.
Chiswick, B., Y. Cohen & T. Zach (1997) ”The Labor Market Status of Immigrants: Effects of the UnemploymentRate at Arrival and Duration of Residence,” Industrial and Labor Relations Review 50 (2): 289-303.
Chiswick, B. & M. Hurst (1996) ”The Employment, Unemployment, and Unemployment Compensation Benefitsof Immigrants,” Research in Employment Policy Vol.1.

21
Chiswick, B. & P. Miller (1995) “The Endogeneity between Language and Earnings: International Analyses,”Journal of Labor Economics, vol. 13, no. 2.
(1999) “Language Skills and Earnings among Legalized Aliens,” Journal of Population Economics, 12(1).
Dustmann, C. (1994) Speaking Fluency, Writing Fluency and Earnings of Migrants. Journal of PopulationEconomics 7 (2): 133-156.
(1999) “Temporary Migration, Human Capital, and Language Fluency of Migrants,” Scandinavian-Journal-of-Economics 101(2).
Ekberg, J. (1983) Inkomsteffekter av invandring, Lund: Lund Economic Studies, no. 27.
(1990) Invandrarna på arbetsmarknaden, DS 1990:35. Stockholm: Almänna förlaget.
(1991) Vad Hände Sedan? En studie av utrikes födda på arbetsmarknaden (What Happened Next? A Study ofForeign Born in the Labor Market). Växjö, 1991.
Fry, R. (1997) ”The Increase in Idleness of Immigrants Arrivals: The Role of Age at Arrival, Refugees, andCountry of Origin,” Quarterly Review of Economics and Finance 37: 209-228.
Goldin, C. & L. Katz (1996) “The Origins of Technology-Skill Complementarity,” NBER Working Paper 5657.
Hummelgaard, H., L. Husted, A. Holm, M. Baadsgaard & B. Olrik (1995), Ethnic Minorities - Integration andMobility, (In Danish), AKF Forlaget, Copenhagen.
Husted, L., H. S. Nielsen, M. Rosholm, & N. Smith (2000a), “Employment and Wage Assimilation of Male FirstGeneration Immigrants in Denmark,” International Journal of Manpower, forthcoming.
(2000b), “Hit Twice ? Danish Evidence on the Double-Negative Effect on the Earnings of Immigrant Women.”Mimeo.
Kamali, M. (1997) ”Distorted integration: clientization of immigrants in Sweden,” Uppsala multiethnic papers 41,Uppsala.
Kee, P. (1994) ”Native-Immigrant Employment Differentials in the Netherlands: The Role of Assimilation andDiscrimination.” International Review of Applied Economics 8 (2): 174-196.
McManus, W.S. (1985) “Labor Market Assimilation of Immigrants: The Importance of Language Skills,”Contemporary Policy Issues, vol. III.
OECD (1999), “Employment Outlook, June 1999”, chapter 4 (titled ‘New Enterprise Work Practices and theirLabour Market Implications’). OECD, Paris.
Ohlsson, R. (1975) Invandrarna på Arbetsmarknaden (Immigrants in the Labor Market). Economic historicalpublications, Lund, Sweden.
Penninx, R., J. Schoorl & C. van Praag (1993) The Impact of International Migration Receiving Countries: TheCase of the Netherlands. NIDI CBGS Publications, Swets en Zeitlinger, Amsterdam.
Schmidt, C. (1994) The Economic Performance of Germany’s East Europeans Immigrants. Discussion Paper 94/9,Ludwig-Maxmilians University, München, Germany.
Scott, K. (1995) Migrants in the Labor Market. Employment Patterns and Income Development of Immigrants toSweden 1970-1990. Fil. Lic-dissertation. Dept. of Economic History, Lund, Sweden.
22
(1999) The Immigrant Experience: Changing Employment and Income Patterns in Sweden, 1970 – 1993, Lund:Lund University Press.
Shields, M. & S. Wheatley Price (1998) The Earnings of First and Second Generation Immigrants in England: AnInvestigation Using the Quarterly Labor Force Survey.“ Applied Economics, 30, pp. 1157-1168.
Snower, D. (1999) “The Organizational Revolution and its Labor Market Implications,” Keynote address to theEALE conference, September, 1999.
Wadensjö, E. (1973) Immigration och Samhällsekonomi (Immigration and Social Economy), Lund.

23
Figure A1. The evolution of employment rates for natives and immigrants in Denmark andSweden.
Sweden
0
0.2
0.4
0.6
0.8
1
85 87 89 91 93 95
Em
ploy
men
t rat
e
Swedes Norwegians Poles Turks Iranians
Denmark
0
0.2
0.4
0.6
0.8
1
85 87 89 91 93 95
Em
ploy
men
t rat
e
Danes Norwegians poles Turks Iranians

24
Table A1. Descriptive Statistics, Native and foreign-born population in Denmark, 1985 & 1995.Danes Norwegians Poles Turks Iranians
Mean Std. Mean Std. Mean Std. Mean Std. Mean Std.1985Educat., prim. 0.086 0.280 0.077 0.267 0.228 0.419 0.018 0.132Educat., second. 0.457 0.498 0.023 0.151 0.049 0.216 0.006 0.079 0.013 0.114Education, theo. 1 0.043 0.204 0.037 0.188 0.021 0.143 0.000 0.000 0.000 0.000Education, theo. 2 0.070 0.255 0.045 0.207 0.044 0.206 0.000 0.000 0.009 0.093Education, theo. 3 0.061 0.239 0.074 0.262 0.050 0.219 0.000 0.000 0.022 0.147Marital status 0.702 0.458 0.540 0.499 0.650 0.477 0.667 0.472 0.175 0.381Naturalization 0.102 0.303 0.569 0.496 0.007 0.085 0.053 0.224Non-Metropolis 0.883 0.321 0.334 0.472 0.409 0.492 0.239 0.427 0.237 0.426No. Children 0.713 0.946 0.581 0.905 0.695 0.883 1.362 1.374 0.303 0.745YSM 7.2 4.2 8.9 4.8 8.4 4.2 2.0 2.4AAM 38.4 10.5 30.2 8.9 28.3 9.2 21.8 7.9 25.1 6.0# observations 1361 1119 675 967 228
1995Educat., prim. 0.066 0.248 0.098 0.297 0.243 0.429 0.077 0.266Educat., second. 0.478 0.500 0.032 0.177 0.041 0.198 0.005 0.069 0.050 0.218Education, theo. 1 0.055 0.228 0.045 0.208 0.026 0.160 0.008 0.091 0.069 0.254Education, theo. 2 0.091 0.288 0.055 0.228 0.037 0.189 0.009 0.094 0.077 0.266Education, theo. 3 0.065 0.247 0.091 0.288 0.031 0.173 0.001 0.032 0.041 0.198Marital status 0.653 0.476 0.618 0.486 0.600 0.490 0.809 0.393 0.477 0.500Naturalization 0.152 0.359 0.487 0.500 0.112 0.315 0.371 0.483Non-Metropolis 0.892 0.311 0.274 0.446 0.277 0.448 0.190 0.393 0.249 0.433No. Children 0.584 0.932 0.653 0.996 0.641 0.886 1.617 1.355 0.563 0.921YSM 12.6 6.6 12.2 6.9 13.1 6.7 8.4 3.0AAM 39.6 10.9 27.8 9.2 26.3 9.0 18.8 8.2 26.7 7.2Observations 1439 1385 1487 1904 1684Note: YSM is years since migration, AAM is age at migration. For Danes, AAM is the current age.
25
Table A2. Foreign-born population in Sweden, 1985 & 1995.Swedes Norwegians Poles Turks Iranians
Mean Std. Mean Std. Mean Std. Mean Std. Mean Std.1985Educat., prim. 0.014 0.119 0.003 0.058 0.003 0.053 0.000 .Educat., second. 0.409 0.492 0.070 0.256 0.068 0.252 0.058 0.233 0.014 0.119Education, theo. 1 0.077 0.267 0.016 0.123 0.013 0.115 0.003 0.053 0.018 0.132Education, theo. 2 0.096 0.294 0.013 0.114 0.017 0.129 0.007 0.086 0.029 0.167Education, theo. 3 0.008 0.089 0.001 0.035 0.001 0.029 0.002 0.043 0.007 0.084Marital status 0.504 0.500 0.484 0.500 0.561 0.497 0.752 0.432 0.562 0.497Naturalization 0.126 0.332 0.519 0.500 0.143 0.350 0.183 0.387Non-Metropolis 0.635 0.482 0.584 0.493 0.275 0.447 0.250 0.433 0.379 0.486No. Children 0.609 0.944 0.476 0.935 0.458 0.796 1.441 1.714 0.617 0.932YSM 11.4 11.4 10.2 8.3 8.6 6.6 6.3 6.0AAM 39.2 11.3 29.3 13.0 29.0 12.5 29.9 12.3 31.7 10.2Observations 1244 841 1190 1050 562
1995Educat., prim. 0.054 0.226 0.067 0.249 0.078 0.269 0.012 0.111Educat., second. 0.510 0.500 0.160 0.366 0.176 0.381 0.126 0.332 0.075 0.264Education, theo. 1 0.118 0.323 0.026 0.158 0.045 0.208 0.014 0.119 0.031 0.172Education, theo. 2 0.110 0.313 0.023 0.150 0.030 0.171 0.006 0.080 0.055 0.229Education, theo. 3 0.011 0.106 0.003 0.052 0.003 0.052 0.002 0.049 0.010 0.097Marital status 0.480 0.500 0.431 0.496 0.552 0.497 0.699 0.459 0.563 0.496Naturalization 0.185 0.389 0.621 0.485 0.533 0.499 0.513 0.500Non-Metropolis 0.643 0.479 0.650 0.477 0.363 0.481 0.377 0.485 0.529 0.499No. Children 0.625 1.044 0.446 0.903 0.520 0.889 1.266 1.533 0.754 1.121YSM 14.5 10.4 14.8 8.4 13.6 8.0 11.4 7.2AAM 40.8 10.6 26.4 13.5 24.6 12.5 26.7 12.8 30.5 12.3Observations 1152 740 1503 1250 1050Note: YSM is years since migration, AAM is age at migration. For Danes, AAM is the current age.
26
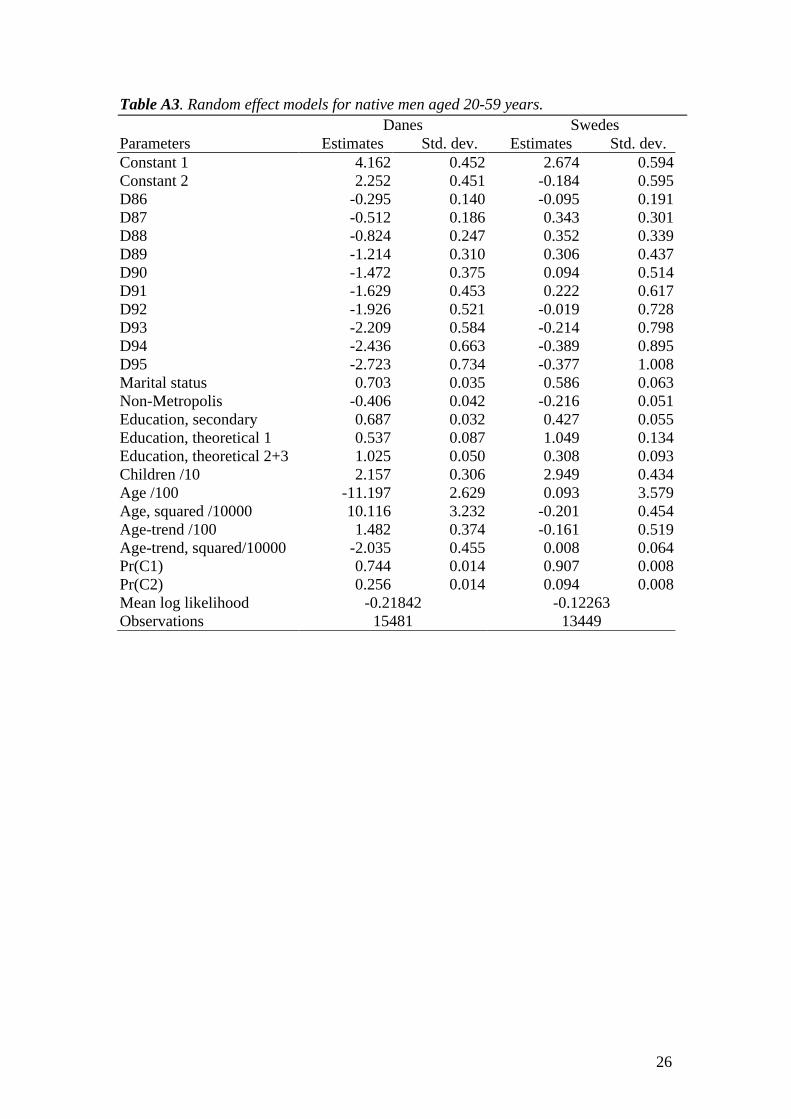
Table A3. Random effect models for native men aged 20-59 years. Danes Swedes
Parameters Estimates Std. dev. Estimates Std. dev.Constant 1 4.162 0.452 2.674 0.594Constant 2 2.252 0.451 -0.184 0.595D86 -0.295 0.140 -0.095 0.191D87 -0.512 0.186 0.343 0.301D88 -0.824 0.247 0.352 0.339D89 -1.214 0.310 0.306 0.437D90 -1.472 0.375 0.094 0.514D91 -1.629 0.453 0.222 0.617D92 -1.926 0.521 -0.019 0.728D93 -2.209 0.584 -0.214 0.798D94 -2.436 0.663 -0.389 0.895D95 -2.723 0.734 -0.377 1.008Marital status 0.703 0.035 0.586 0.063Non-Metropolis -0.406 0.042 -0.216 0.051Education, secondary 0.687 0.032 0.427 0.055Education, theoretical 1 0.537 0.087 1.049 0.134Education, theoretical 2+3 1.025 0.050 0.308 0.093Children /10 2.157 0.306 2.949 0.434Age /100 -11.197 2.629 0.093 3.579Age, squared /10000 10.116 3.232 -0.201 0.454Age-trend /100 1.482 0.374 -0.161 0.519Age-trend, squared/10000 -2.035 0.455 0.008 0.064Pr(C1) 0.744 0.014 0.907 0.008Pr(C2) 0.256 0.014 0.094 0.008Mean log likelihood -0.21842 -0.12263Observations 15481 13449

27
Table A4. Random effect models for Norwegian men aged 20-59 years.
Denmark SwedenParameters Estimates Std. dev. Estimates Std. dev.Constant 1 2.043 0.163 -1.190 0.177Constant 2 -0.360 0.163 1.254 0.171D86 0.112 0.099 -0.152 0.138D87 0.055 0.095 -0.235 0.119D88 -0.081 0.101 -0.473 0.114D89 -0.038 0.099 -0.323 0.120D90 -0.058 0.106 -0.261 0.118D91 -0.080 0.115 -0.463 0.118D92 -0.072 0.125 -0.586 0.128D93 -0.214 0.134 -0.730 0.123D94 -0.228 0.149 -0.852 0.133D95 -0.158 0.158 -0.751 0.140Marital status 0.534 0.034 0.259 0.040Naturalization 0.483 0.042 0.084 0.055Non-Metropolis -0.316 0.029 -0.004 0.037Education, primary -0.514 0.046 -0.279 0.136Education, secondary 0.088 0.049 0.784 0.085Education, theoretical 1 0.175 0.082 0.968 0.270Education, theoretical 2+3 0.371 0.064 1.166 0.291Children /10 1.000 0.180 1.191 0.196YSM /100 0.435 2.292 6.202 1.012YSM, squared /10000 0.036 12.780 -10.447 2.692AAM /100 -1.968 0.864 3.451 0.818AAM, squared /10000 -1.587 1.343 -7.331 1.162YSM-trend /100 -0.072 0.301 -0.534 0.143YSM-trend, squared/10000 -0.052 1.465 1.137 0.386Pr(C1) 0.676 0.011 0.287 0.013Pr(C2) 0.324 0.011 0.713 0.013Mean log likelihood -0.36662 -0.35789Observations 14538 9732Note: YSM is years since migration, AAM is age at migration

28
Table A5. Random effect models for Polish men aged 20-59 years.
Denmark SwedenParameters Estimates Std. dev. Estimates Std. dev.Constant 1 0.950 0.162 -1.539 0.108Constant 2 -0.903 0.161 0.772 0.106D86 -0.184 0.101 -0.162 0.092D87 0.055 0.098 0.234 0.092D88 -0.106 0.104 0.245 0.094D89 -0.140 0.101 0.468 0.091D90 -0.041 0.109 0.525 0.088D91 0.015 0.116 0.584 0.094D92 0.048 0.128 0.400 0.091D93 0.155 0.141 0.358 0.095D94 0.195 0.155 0.372 0.100D95 0.411 0.168 0.538 0.105Marital status 0.384 0.029 0.161 0.030Naturalization 0.222 0.036 0.284 0.032Non-Metropolis -0.275 0.027 0.081 0.031Education, primary -0.096 0.053 -0.241 0.095Education, secondary 0.308 0.046 0.832 0.061Education, theoretical 1 0.379 0.105 0.625 0.093Education, theoretical 2+3 0.769 0.066 0.347 0.105Children /10 -0.226 0.154 1.671 0.164YSM /100 9.293 2.194 19.184 0.848YSM, squared /10000 0.324 12.110 -51.122 2.479AAM /100 -1.118 0.806 0.383 0.556AAM, squared /10000 -1.078 1.327 -2.122 0.914YSM-trend /100 -0.787 0.293 -2.421 0.115YSM-trend, squared/10000 -1.302 1.406 6.295 0.308Pr(C1) 0.634 0.014 0.275 0.011Pr(C2) 0.367 0.014 0.725 0.011Mean log likelihood -0.48223 -0.35809Observations 13291 14986Note: YSM is years since migration, AAM is age at migration

29
Table A6. Random effect models for Turkish men aged 20-59 years.
Denmark SwedenParameters Estimates Std. dev. Estimates Std. dev.Constant 1 2.393 0.121 -0.084 0.114Constant 2 1.062 0.117 1.885 0.115D86 0.121 0.080 -0.051 0.088D87 0.056 0.078 0.118 0.093D88 -0.168 0.080 0.110 0.093D89 -0.339 0.079 0.105 0.090D90 -0.344 0.085 0.020 0.092D91 -0.451 0.094 -0.092 0.093D92 -0.617 0.100 -0.242 0.091D93 -0.603 0.112 -0.419 0.098D94 -0.754 0.121 -0.489 0.104D95 -0.662 0.134 -0.309 0.115Marital status 0.142 0.033 0.230 0.032Naturalization 0.077 0.053 0.259 0.030Non-Metropolis -0.133 0.033 -0.242 0.033Education, primary 0.039 0.032 -0.359 0.104Education, secondary 0.435 0.104 0.317 0.076Education, theoretical 1 1.224 0.186 1.115 0.286Education, theoretical 2+3 0.372 0.165 0.754 0.238Children /10 -0.242 0.097 0.783 0.076YSM /100 -2.049 1.463 8.856 0.808YSM, squared /10000 -2.508 6.672 -28.121 2.224AAM /100 0.177 0.691 0.299 0.637AAM, squared /10000 -7.368 1.466 -7.857 1.008YSM-trend /100 -0.190 0.219 -0.888 0.150YSM-trend, squared/10000 0.644 0.886 1.851 0.451Pr(C1) 0.457 0.018 0.422 0.014Pr(C2) 0.543 0.018 0.578 0.014Mean log likelihood -0.52092 -0.43289Observations 16462 12672Note: YSM is years since migration, AAM is age at migration

30
Table A7. Random effect models for Iranian men aged 20-59 years.
Denmark SwedenParameters Estimates Std. dev. Estimates Std. dev.Constant 1 -0.448 0.258 -2.005 0.156Constant 2 -1.842 0.259 0.166 0.158D86 0.123 0.138 -0.186 0.124D87 0.492 0.132 -0.032 0.118D88 0.449 0.128 0.204 0.112D89 0.392 0.133 0.167 0.108D90 0.111 0.136 0.118 0.106D91 0.050 0.145 -0.062 0.112D92 0.108 0.153 -0.304 0.114D93 0.142 0.170 -0.473 0.120D94 0.192 0.191 -0.602 0.128D95 0.478 0.211 -0.594 0.141Marital status 0.175 0.031 0.129 0.038Naturalization 0.186 0.041 0.394 0.039Non-Metropolis -0.206 0.033 -0.035 0.035Education, primary 0.088 0.078 0.275 0.347Education, secondary 0.363 0.041 -0.111 0.128Education, theoretical 1 0.256 0.075 -0.391 0.128Education, theoretical 2+3 0.530 0.065 0.350 0.088Children /10 -0.346 0.196 1.290 0.176YSM /100 34.754 4.782 42.965 1.890YSM, squared /10000 1.226 33.914 -166.701 8.794AAM /100 -0.726 1.538 -0.634 0.757AAM, squared /10000 -4.320 2.469 -2.143 1.102YSM-trend /100 -1.397 0.584 -2.446 0.240YSM-trend, squared/10000 -8.711 3.686 11.708 1.009Pr(C1) 0.387 0.016 0.270 0.015Pr(C2) 0.613 0.016 0.730 0.015Mean log likelihood -0.53489 -0.43296Observations 14529 9025Note: YSM is years since migration, AAM is age at migration

�������������� ����� �� �������� ������
���� � � ���
171 C. Dustmann
F. Windmeijer Wages and the Demand for Health – A Life Cycle Analysis
5 7/00
172 D. Card Reforming the Financial Incentives of the Welfare System
3 7/00
173 D. S. Hamermesh Timing, Togetherness and Time Windfalls
5 7/00
174 E. Fehr J.-R. Tyran
Does Money Illusion Matter? An Experimental Approach
7 7/00
175 M. Lofstrom Self-Employment and Earnings among High- Skilled Immigrants in the United States
1 7/00
176 O. Hübler W. Meyer
Industrial Relations and the Wage Differentials between Skilled and Unskilled Blue-Collar Workers within Establishments: An Empirical Analysis with Data of Manufacturing Firms
5 7/00
177 B. R. Chiswick G. Repetto
Immigrant Adjustment in Israel: Literacy and Fluency in Hebrew and Earnings
1 7/00
178 R. Euwals M. Ward
The Renumeration of British Academics
5 7/00
179 E. Wasmer P. Weil
The Macroeconomics of Labor and Credit Market Imperfections
2 8/00
180 T. K. Bauer I. N. Gang
Sibling Rivalry in Educational Attainment: The German Case
5 8/00
181 E. Wasmer Y. Zenou
Space, Search and Efficiency 2 8/00
182 M. Fertig C. M. Schmidt
Discretionary Measures of Active Labor Market Policy: The German Employment Promotion Reform in Perspective
6 8/00
183 M. Fertig
C. M. Schmidt
Aggregate-Level Migration Studies as a Tool for�Forecasting Future Migration Streams
1 8/00
184 M. Corak
B. Gustafsson T. Österberg
Intergenerational Influences on the Receipt of Unemployment Insurance in Canada and Sweden
3 8/00
185 H. Bonin K. F. Zimmermann
The Post-Unification German Labor Market 4 8/00
186 C. Dustmann
Temporary Migration and Economic Assimilation 1 8/00

187 T. K. Bauer M. Lofstrom K. F. Zimmermann
Immigration Policy, Assimilation of Immigrants and Natives’ Sentiments towards Immigrants: Evidence from 12 OECD-Countries
1 8/00
188
A. Kapteyn A. S. Kalwij
The Myth of Worksharing
5
8/00
A. Zaidi 189
W. Arulampalam
Is Unemployment Really Scarring? Effects of Unemployment Experiences on Wages
3
8/00
190 C. Dustmann
I. Preston Racial and Economic Factors in Attitudes to Immigration
1 8/00
191 G. C. Giannelli C. Monfardini��
�
Joint Decisions on Household Membership and Human Capital Accumulation of Youths: The role of expected earnings and local markets
5 8/00
192 G. Brunello Absolute Risk Aversion and the Returns to Education
5 8/00
193 A. Kunze The Determination of Wages and the Gender Wage Gap: A Survey
5 8/00
194 A. Newell F. Pastore
Regional Unemployment and Industrial Restructuring in Poland
4 8/00
195 F. Büchel A. Mertens
Overeducation, Undereducation, and the Theory of Career Mobility
5 9/00
196 J. S. Earle K. Z. Sabirianova
Equilibrium Wage Arrears: A Theoretical and Empirical Analysis of Institutional Lock-In
4 9/00
197 G. A. Pfann
Options to Quit
1 9/00
198 M. Kreyenfeld C. K. Spiess G. G. Wagner
A Forgotten Issue: Distributional Effects of Day Care Subsidies in Germany
3 9/00
199 H. Entorf
Rational Migration Policy Should Tolerate Non-Zero Illegal Migration Flows: Lessons from Modelling the Market for Illegal Migration
1 9/00
200 T. Bauer G. S. Epstein I. N. Gang
What are Migration Networks?
1 9/00
201 T. J. Dohmen G. A. Pfann
Worker Separations in a Nonstationary Corporate Environment
1 9/00
202 P. Francois
J. C. van Ours Gender Wage Differentials in a Competitive Labor Market: The Household Interaction Effect
5 9/00
203 J. M. Abowd F. Kramarz��D. N. Margolis T. Philippon
The Tail of Two Countries: Minimum Wages and Employment in France and the United States
5 9/00

204 G. S. Epstein
Labor Market Interactions Between Legal and Illegal Immigrants
1 10/00
205 A. L. Booth M. Francesconi J. Frank
Temporary Jobs: Stepping Stones or Dead Ends? 1 10/00
206 C. M. Schmidt R. Baltussen R. Sauerborn
The Evaluation of Community-Based Inter-ventions: Group-Randomization, Limits and Alternatives
6 10/00
207
C. M. Schmidt
Arbeitsmarktpolitische Maßnahmen und ihre Evaluierung: eine Bestandsaufnahme
6
10/00
208 J. Hartog R. Winkelmann
Dutch Migrants in New Zealand: Did they Fare Well?
1 10/00
209 M. Barbie M. Hagedorn A. Kaul
Dynamic Effciency and Pareto Optimality in a Stochastic OLG Model with Production and Social Security
3 10/00
210 T. J. Dohmen
Housing, Mobility and Unemployment 1 11/00
211 A. van Soest M. Das X. Gong
A Structural Labour Supply Model with Nonparametric Preferences
5 11/00
212
X. Gong A. van Soest P. Zhang
Sexual Bias and Household Consumption: A Semiparametric Analysis of Engel Curves in Rural China
5 11/00
213
X. Gong A. van Soest E. Villagomez
Mobility in the Urban Labor Market: A Panel Data Analysis for Mexico
1 11/00
214
X. Gong A. van Soest
Family Structure and Female Labour Supply in Mexico City
5 11/00
215
J. Ermisch M. Francesconi
The Effect of Parents’ Employment on Children’s�Educational Attainment
5 11/00
216
F. Büchel
The Effects of Overeducation on Productivity in Germany —�The Firms’ Viewpoint
5 11/00
217
J. Hansen R. Wahlberg
Occupational Gender Composition and Wages in Sweden
5 11/00
218
C. Dustmann A. van Soest
Parametric and Semiparametric Estimation in Models with Misclassified Categorical Dependent Variables
1 11/00

219
F. Kramarz T. Philippon
The Impact of Differential Payroll Tax Subsidies on Minimum Wage Employment
5 11/00
220
W. A. Cornelius E. A. Marcelli
The Changing Profile of Mexican Migrants to the United States: New Evidence from California and Mexico
1 12/00
221
C. Grund
Wages as Risk Compensation in Germany
5 12/00
222
W.P.M. Vijverberg
Betit: A Family That Nests Probit and Logit
7 12/00
223
M. Rosholm M. Svarer
Wages, Training, and Job Turnover in a Search-Matching Model
1 12/00
224
J. Schwarze
Using Panel Data on Income Satisfaction to Estimate the Equivalence Scale Elasticity
3 12/00
225
L. Modesto J. P. Thomas
An Analysis of Labour Adjustment Costs in Unionized Economies
1 12/00
226
P. A. Puhani�
On the Identification of Relative Wage Rigidity Dynamics: A Proposal for a Methodology on Cross-Section Data and Empirical Evidence for Poland in Transition
4/5 12/00
227
L. Locher�
Immigration from the Eastern Block and the former Soviet Union to Israel: Who is coming when? �
1 12/00
228
G. Brunello S. Comi C. Lucifora
The College Wage Gap in 10 European Countries: Evidence from Two Cohorts
5 12/00
229
R. Coimbra T. Lloyd-Braga L. Modesto
Unions, Increasing Returns and Endogenous Fluctuations
1 12/00
230
L. Modesto
Should I Stay or Should I Go? Educational Choices and Earnings: An Empirical Study for Portugal
5 12/00
231
G. Saint-Paul
The Economics of Human Cloning 5 12/00
232
E. Bardasi M. Francesconi
The Effect of Non-Standard Employment on Mental Health in Britain
5 12/00
233
C. Dustmann C. M. Schmidt
The Wage Performance of Immigrant Women: Full-Time Jobs, Part-Time Jobs, and the Role of Selection
1 12/00

234
R. Rotte M. Steininger
Sozioökonomische Determinanten extremistischer Wahlerfolge in Deutschland: Das Beispiel der Eu-ropawahlen 1994 und 1999
3 12/00
235
W. Schnedler
Who gets the Reward? An Empirical Exploration of Bonus Pay and Task Characteristics
5 12/00
236
R. Hujer M. Caliendo
Evaluation of Active Labour Market Policy: Methodological Concepts and Empirical Estimates
6 12/00
237
S. Klasen I. Woolard
Surviving Unemployment without State Support: Unemployment and Household Formation in South Africa
3 12/00
238
R. Euwals A. Börsch-Supan A. Eymann
The Saving Behaviour of Two Person House-holds: Evidence from Dutch Panel Data
5 12/00
239
F. Andersson K. A. Konrad
Human Capital Investment and Globalization in Extortionary States
5 01/01
240
W. Koeniger
Labor and Financial Market Interactions: The Case of Labor Income Risk and Car Insurance in the UK 1969-95
5 01/01
241
W. Koeniger
Trade, Labor Market Rigidities, and Government-Financed Technological Change
2 01/01
242
G. Faggio J. Konings
Job Creation, Job Destruction and Employment Growth in Transition Countries in the 90’s
4 01/01
243
E. Brainerd
Economic Reform and Mortality in the Former Soviet Union: A Study of the Suicide Epidemic in the 1990s
4 01/01
244
S. M. Fuess, Jr. M. Millea
Pay and Productivity in a Corporatist Economy: Evidence from Austria
5 01/01
245
F. Andersson K. A. Konrad
Globalization and Human Capital Formation
5 01/01
246
E. Plug W. Vijverberg
Schooling, Family Background, and Adoption: Does Family Income Matter?
5 01/01
247
E. Plug W. Vijverberg
Schooling, Family Background, and Adoption: Is it Nature or is it Nurture?
5 01/01
248
P. M. Picard E. Toulemonde
The Impact of Labor Markets on Emergence and Persistence of Regional Asymmetries
2 01/01

249
B. M. S. van Praag P. Cardoso�
“Should I Pay for You or for Myself?” The Optimal Level and Composition of Retirement Benefit Systems
3 01/01
250
T. J. Hatton J. G. Williamson
Demographic and Economic Pressure on Emigration out of Africa
1 01/01
251
R. Yemtsov
Labor Markets, Inequality and Poverty in Georgia
4 01/01
252
R. Yemtsov
Inequality and Income Distribution in Georgia
4 01/01
253
R. Yemtsov
Living Standards and Economic Vulnerability in Turkey between 1987 and 1994
4 01/01
254
H. Gersbach A. Schniewind
Learning of General Equilibrium Effects and the Unemployment Trap
3 02/01
255
H. Gersbach A. Schniewind
Product Market Reforms and Unemployment in Europe
3 02/01
256
T. Boeri H. Brücker
Eastern Enlargement and EU-Labour Markets: Perceptions, Challenges and Opportunities
2 02/01
257
T. Boeri
Transition with Labour Supply
4 02/01
258
M. Rosholm K. Scott L. Husted
The Times They Are A-Changin’: Organizational Change and Immigrant Employment Opportunities in Scandinavia
1 02/01
�
An updated list of IZA Discussion Papers is available on the center‘s homepage ����������.