Integrated Property Tax: The Potential Own Source Revenue ...
111
ISSN: 2362-1303 (Paper) | eISSN: 2362-1311(Online) JOURNAL OF ADVANCED ACADEMIC RESEARCH (JAAR) January 2015 Vol. 2. No. I www.phdcentre.edu.np 1 Integrated Property Tax: The Potential Own Source Revenue of Municipal Finance in Nepal Shankar Prasad Upadhyay 1 & Prof. Dr. Kamal Das Manandhar 2 1 PhD Scholar, Mewar University, Chittorgarh, Rajasthan, India 2 Assistant Dean (Management Faculty), Tribhuvan University, Nepal Corresponding Author Shankar Prasad Upadhyay Email: [email protected] Abstract Integrated property means the lands within municipal area and physical structures in general. The main objective of the study is to find out the contribution of integrated property tax on own source revenue and total revenue as well as to explore its potentiality. A descriptive research design was adopted among 500 respondents (100 municipal policy advisors and 400 municipal taxpayers) of three municipalities as well as stratified random sampling method was used to select municipalities. Damak (East), Hetauda (Central) and Birendranagar (West) were the sample municipalities. The contribution of integrated property tax on own source revenue of Hetauda municipality is nominally fluctuating overall period of six years and the fluctuation rate of Birendranagar municipality is comparatively higher than Hetauda. Damak municipality has the highest contribution percentage of integrated property tax on own source revenue. Own source revenue collection of Damak, Hetauda and Birendranagar municipality has been fluctuating. From the view point of municipal taxpayers and municipal policy making advisors, integrated property tax is more potential own source revenue of municipality in comparison to other sources. The integrated property tax is highly potential own source revenue of municipal finance in Nepal. Keywords: Integrated Property Tax, Municipal Finance, Own source Revenue, Revenue Potentiality Introduction Generally the municipal finance concerns with the income and expenditure preferences of the municipal governments. It covers the revenue sources as well as the systems of financing infrastructures through the utilization of revenues. Municipal revenues basically are of two types; internal and external. Internal sources of revenue are also known as own source. Own source revenues are also of the two types: tax revenues (rent tax, house and land tax, enterprise tax, vehicle tax, property tax, entertainment tax, commercial video tax, advertisement tax etc.) and
-
Upload
khangminh22 -
Category
Documents
-
view
0 -
download
0
Transcript of Integrated Property Tax: The Potential Own Source Revenue ...

ISSN: 2362-1303 (Paper) | eISSN: 2362-1311(Online)
JOURNAL OF ADVANCED ACADEMIC RESEARCH (JAAR) January 2015
Vol. 2. No. I www.phdcentre.edu.np 1
Integrated Property Tax: The Potential Own Source Revenue of
Municipal Finance in Nepal
Shankar Prasad Upadhyay1 & Prof. Dr. Kamal Das Manandhar
2
1PhD Scholar, Mewar University, Chittorgarh, Rajasthan, India
2Assistant Dean (Management Faculty), Tribhuvan University, Nepal
Corresponding Author
Shankar Prasad Upadhyay
Email: [email protected]
Abstract
Integrated property means the lands within municipal area and physical structures in general.
The main objective of the study is to find out the contribution of integrated property tax on own
source revenue and total revenue as well as to explore its potentiality. A descriptive research
design was adopted among 500 respondents (100 municipal policy advisors and 400 municipal
taxpayers) of three municipalities as well as stratified random sampling method was used to
select municipalities. Damak (East), Hetauda (Central) and Birendranagar (West) were the
sample municipalities. The contribution of integrated property tax on own source revenue of
Hetauda municipality is nominally fluctuating overall period of six years and the fluctuation rate
of Birendranagar municipality is comparatively higher than Hetauda. Damak municipality has
the highest contribution percentage of integrated property tax on own source revenue. Own
source revenue collection of Damak, Hetauda and Birendranagar municipality has been
fluctuating. From the view point of municipal taxpayers and municipal policy making advisors,
integrated property tax is more potential own source revenue of municipality in comparison to
other sources. The integrated property tax is highly potential own source revenue of municipal
finance in Nepal.
Keywords: Integrated Property Tax, Municipal Finance, Own source Revenue, Revenue
Potentiality
Introduction
Generally the municipal finance concerns with the income and expenditure preferences of the
municipal governments. It covers the revenue sources as well as the systems of financing
infrastructures through the utilization of revenues. Municipal revenues basically are of two types;
internal and external. Internal sources of revenue are also known as own source. Own source
revenues are also of the two types: tax revenues (rent tax, house and land tax, enterprise tax,
vehicle tax, property tax, entertainment tax, commercial video tax, advertisement tax etc.) and

ISSN: 2362-1303 (Paper) | eISSN: 2362-1311(Online)
JOURNAL OF ADVANCED ACADEMIC RESEARCH (JAAR) January 2015
Vol. 2. No. I www.phdcentre.edu.np 2
non-tax revenues(parking charge, and service charge, building permit fee, etc.)."Integrated
property" means the lands within municipal area and physical structures such as wall, building,
go down, shade, garage etc. built thereon (Nepal Government, 1999). In the context of
developing countries, property tax is of particular importance because more responsibilities are
increasingly being devolved to local government, so that the need for a major local government
revenue source that can generate sufficient revenue to finance local expenditure and the score of
the property tax is high(Kayuza, 2006). The property tax can play a key role in this democratic
governance process. It is one of the few levies available to local governments that fit the criteria
for a good local tax. Most of its burden falls within the local area, so it is a tax that presents local
residents with a “price” for local services provided. (Bahl, 2009). As clearly stated in the Section
136 to 145 of Local Self Governance Act(1999), Land Revenue and House and Land Tax, Rent
Tax, Enterprise Tax, Vehicle Tax, Property Tax, Entertainment Tax, Commercial Video Tax,
Advertisement Tax, Parking Charge, and Service Charge are the major own revenue sources of
municipal finance in Nepal.
The intent of the present study is to address the main objective i.e. to find out the contribution of
integrated property tax on municipal own source revenue and total revenue to explore its
potentiality for the future.
Government Policies Regarding Integrated Property Tax in Nepal
Nepal Government has made legal provisions regarding the implementation of integrated
property tax in municipalities of Nepal. According to rule144 of Local Self Governance
Regulation (1999), following policies have been made for the implementation of integrated
property tax:(1) The minimum and maximum rates of the integrated property tax that may be
levied by a Municipality within its area shall be as prescribed, (2) For the purpose of the tax to be
levied pursuant to sub-rule (1), a Municipality shall have to stratify its area as per necessity, and
a separate statement of integrated property of the residents or such stratification of each Ward
shall have to be prepared in the format referred, (3) Upon preparation of the statement pursuant
to sub-rule (2), the Municipality shall constitute a Valuation Committee consisting of five
persons in maximum consisting specialists and competent persons as well for the valuation of
integrated property. (4) The period of tenure of the committee constituted pursuant to sub-rule
(3) shall be of one year in maximum.
(5) In making recommendation for the assessment of the taxable value of the integrated property,
the Valuation Committee shall have to recommend on the following basis:-
Taking the current market rate as the basis for assessing the value of integrated property for tax,
Deducting the depreciation from the value of the physical structure assessed as per the current
market-price,

ISSN: 2362-1303 (Paper) | eISSN: 2362-1311(Online)
JOURNAL OF ADVANCED ACADEMIC RESEARCH (JAAR) January 2015
Vol. 2. No. I www.phdcentre.edu.np 3
While deducting the depreciation for the purpose of valuation pursuant to clause (a), it shall be
deducted from 10 percent to 40 percent,
(d) While valuating the physical structure other than land, it shall be valued on the basis of the
classification referred,
(e) While assessing the value of physical structure, if it is in destroyed or demolished conditions,
deducting the value equal to the value of the destroyed or demolished parts. (6) For the purpose
of levying tax on the integrated property, the format of the form for valuation of integrated
property shall be as referred,
(7) Once the recommendation for valuation of integrated property has been made pursuant to
sub-rule (5), the Municipality shall have to assess the rate of valuation of integrated property
within the month of Shrawan (starting month of new fiscal year).(8) The value assessed by the
Municipality pursuant to sub-rule (7) and the rate of the tax fixed by the Municipal Council to be
levied thereon shall have to be published as per the format referred,(9) The person who is not
satisfied with the valuation of the integrated property published pursuant to sub-rule (8) may
submit an application before the Mayor for revaluation within thirty five days from the date of
publication of such notice.(10) The Municipality shall have to finalize the process of revaluation
upon the application submitted pursuant to sub-rule (9) within one month.
(11) The decision taken by the Municipality pursuant to sub-rule (10) shall be final. (12) No
change shall be made in the valuation of the taxable property and rate thereof fixed pursuant to
sub-rules (7) or (10) for five years. (13) For the valuation of the taxable property assessed
pursuant to sub-rules (7) or (10) and for payment of the tax on the integrated property so levied,
the Municipality shall have to send a bill within the month of Mansir(fifth month of the fiscal
year).(14) The tax to be paid as per the bill received pursuant to sub-rule (13) shall be paid by the
concerned taxpayer to the Municipality within the same fiscal year. (15) The Municipality may
exempt 10 percent from the tax amount to be paid by a taxpayer who has paid the tax amount
within 30 days from the date of receipt of the bill sent by the Municipality pursuant to sub-rule
(13).
Integrated property tax practices and its coverage
There are major differences between Nepalese municipalities concerning their IPT/HALT
performance. Some municipalities like Dharan have tax coverage of 70%, while others like
Madhyapur-Thimi are having only 10-15% tax coverage. This report analyses the reasons for the
high discrepancy between municipalities such as the ones mentioned above and to state
recommendations on how to improve performance regarding IPT/HALT. The report will also
give implications for other municipalities, which might learn from best-practice fields and
furthermore from mistakes (udle/GTZ, 2009, p. 6).

ISSN: 2362-1303 (Paper) | eISSN: 2362-1311(Online)
JOURNAL OF ADVANCED ACADEMIC RESEARCH (JAAR) January 2015
Vol. 2. No. I www.phdcentre.edu.np 4
Prospects and challenges
Actual rates of tax vary widely in international practice, and a lack of reliable data on assessment
practices prevents ready translation of reported nominal rates to effective levels (Youngman,
1996).Municipalities must be authorized to expand their internal revenue base and modify the tax
rate according to local situation so that they can collect adequate revenue to meet their financial
needs (Thapa, 2004, p. 4). The valuation of property is one of the key problems with the
effective use of the property tax in developing and transitional countries. (Youngman,
Alternative Perspective on Property Taxation, 2005, p. 7). Nepalese municipalities still have a
revenue potential increase of almost 60%. It is the fact that there is high resistance of taxpayers
and integrated property tax in many municipalities is not full-fledged. Missing revaluations of
tax rates and the potential of integrated property taxin Nepal is quite obvious. The high taxpayer
resistance is based on the mistrust against the local administration (MLD, udle/GTZ, 2008, p. 9).
Another problem is the very high taxpayer resistance. People are mistrusting the public servants
and criticizing the lack of transparency. The visibility of the output generated by public money
needs to be improved by a lot in order to raise taxpayer compliance and to build a tax culture.
This process obviously will take some time. Without a comprehensive database and software to
maintain and update it the chances for success seem to be very low. Another crucial question is
how the central government is going to decide upon the future of local property tax. Local
property tax is highly dependent on external influences. A lot of municipalities were completely
dependent on external consultants and finance packages during the IPT/HALT implementation
process. With the government‟s acknowledgement of the importance of IPT/HALT, its
commitment in financial and technical support, the chances for an improvement of local property
tax revenues in Nepalese municipalities are quite optimistic (udle/GTZ, 2009).Property taxes are
particularly valuable for developing countries. Provided that the property resources and their
ownership can be identified, real property can provide one of the few bases for a reliable and
broadly based taxation system (Hefferen, 2010). Municipalities are fully responsible for
formulating and executing local or municipal policies and programmes in partnership with other
local governance performers and they have substantial roles in bringing local actors together to
form a common vision of how to take action to issues raised in a coordinated way (MLD, 2012).
Regarding the measurement, explanation and control of tax evasion, we still need to fulfil many
gaps in our understanding although we might have learned so many matters of finance and
taxation. (Alm, 2012). Tax source is an important own source municipal revenues. Both the
benefit and ability to pay principle of taxation are the basic philosophies (BSBA, 2013)..A
challenge for a study of taxpayer attitude is a lack of reliable data due to an individual‟s
reluctance to reveal one‟s own non-compliance. (Merima Ali, 2013, p. 5). The main sources of
own revenue for municipalities are usually property taxes, business licenses, market fees and
various user charges. They have the potential to provide substantial and reliable revenue if well
administered, but in practice all have serious drawbacks (ICTD, 2013, p. 2)

ISSN: 2362-1303 (Paper) | eISSN: 2362-1311(Online)
JOURNAL OF ADVANCED ACADEMIC RESEARCH (JAAR) January 2015
Vol. 2. No. I www.phdcentre.edu.np 5
Method
Study Area
The study was concerned with all the municipality area and the topic was directly related to 58
municipalities of Nepal so that all the municipalities were the study population. According to the
Local Self Governance Act (1999) of Nepal, 53 municipalities were formed in similar process
and criteria out of 58. In this study, stratified random sampling method was used for the selection
of municipalities so as to select three municipalities out of 53 considering the number of
municipalities, ecological belt and coverage of the study area. The following figure (figure 1) has
depicted the name of sample municipalities of the study area.
(Figure -1)
(Map of Nepal, Source: NEksapInfo, 2013)
3.2 Research Design and Methodology of the Study
Cross sectional data have been collected and descriptive research design has been adopted to
analyze the contribution of integrated property tax on own source revenue and the contribution of
own source revenue on total revenue as well as potentiality of integrated property tax as a major
own source municipal revenues.
Out of eighteen municipalities of strata - 1( 8,37,043 municipal population ), Damak
municipality ( EsternTerai belt) was sampled, from the strata - 2( 9,99,764 municipal population
), Hetauda municipality (Central Inner-Terai belt) was sampled out of seventeen municipalities
Birendranagar
Hetauada
Damak

ISSN: 2362-1303 (Paper) | eISSN: 2362-1311(Online)
JOURNAL OF ADVANCED ACADEMIC RESEARCH (JAAR) January 2015
Vol. 2. No. I www.phdcentre.edu.np 6
and from strata - 3 (8,98,264 municipal population ), Birendranagar (Western Hill belt)
municipality was taken as a sample out of 19 municipalities.
Municipal policy advisors and taxpayers were the respondents of the study. The samples taken
from each municipality were equal, and in total 100 samples were taken from municipal policy
advisors and 400 samples were taken from taxpayers of sample municipalities.
Self administered questionnaires have been developed in 5 point Linker Scale and dichotomous
and conducted survey for primary data collection and secondary information were obtained from
municipalities ( Damak, Hetauda and Birendranagar), Ministry of Federal Affairs and Local
Development, Urban Development Through Local Efforts(udle/GTZ), District Development
Committees and Local Bodies' Fiscal Commission. Relevant books, journals as well as published
and unpublished performance or work of the concerned organizations working on the field were
used for the macro analysis of the study. For the analysis of secondary data, various analytical
tables have been set up and different analytical tools of statistics including SPSS-20 software
have been used for the analysis of primary data.
Result
In this research, there were 500 respondents (400 municipal taxpayers and 100 municipal policy
advisors), among them 75% respondents were males and female respondents were 25%. Out of
100 municipal policy advisors, most of them were local political party members (i.e. 62%), CCI
members were 28%, government tax officers were 6% and few were civil society members.
Likewise, more than 50% taxpayers were engaged in business activities and 27.5% taxpayers
were private job -holders. Similarly, about 12% and 10.5% taxpayers were involved in
government job and agriculture respectively.
Both types of respondents' views have been collected to find out the contribution of integrated
property tax on own source revenue and the contribution of own source revenue on total revenue
of municipalities, and the potentiality of integrated property tax in municipal finance. They are
presented and discussed as below:
Table No. 1: Integrated Property Tax, Own Source Revenue, and Total Revenue of Recent
Six Fiscal Years
Name of
Municipality
Total
Integrated
Property
Tax
Received
(Rs.)
Total Own
Source
Revenue
Received
(Rs.)
Total
Revenue
Received
(Rs.)
Contribution
of Integrated
Property Tax
on Own Source
Revenue ( % )
Contributio
n of Own
Source
Revenue on
Total
Revenue ( %
)

ISSN: 2362-1303 (Paper) | eISSN: 2362-1311(Online)
JOURNAL OF ADVANCED ACADEMIC RESEARCH (JAAR) January 2015
Vol. 2. No. I www.phdcentre.edu.np 7
Damak 26300262 157492170 536259001 16.70 29.37
Hetauda 54788542 465606853 104237017
3 11.77 44.67
Birendranagar 10710062 88387977 353989225 12.12 24.97
Total 91798866 711487000
193261839
9 12.90
36.81
(Source: Damak, Hetauda and Birendranagar Municipality Offices, 2014)
On the basis of above tabulated data; integrated property tax collection of recent past six fiscal
years is lowest inBirendranagar municipality and highest in Hetauda Municipality, as well as the
same status of own source revenue and total revenue of the same municipalities. Comparatively,
the contribution of integrated property tax on own source revenue of Damak municipality is
higher (i.e. 16.70 %,) than Birendranagar municipality (i.e. 12.12%). The above table also
reveals that Hetauda municipality has the highest contribution of own source revenue on total
revenue (i.e. 44.67%) and Damak and Birendranagar municipalities have respectively 29.37%
and 24.97% own source revenue contribution on total revenue. It shows that Hetauda
municipality has given high attention to collect other local sources of revenues.
Table No. 2: Contribution of Integrated Property Tax on Total Own Source Revenue
Munic
ipality
Descriptions
Fiscal Years
007/08
008/
09 009/10 010/11 011/12 012/13 Total
Dam
ak
Integrated Property Tax
Received Rs. 2158 2518 2512 4443 6495 8174 26300
Own Source Revenue
Received Total 15675
4727
0 17427 21933 26281 28906 157492
IPT Contribution (%) 13.77 5.33 14.41 20.26 24.71 28.28 16.70
Het
au
da
Integrated Property Tax
Received Rs. 7790 9462 6873 8577 10634 11453 54789
Own Source Revenue
Total 45732
5746
3 62227 97051 101357
10177
7 465607
IPT Contribution (%) 17.03
16.4
7
11.05 8.84 10.49 11.25 11.77
Bir
end
ran
a
gar
Integrated Property Tax
Received Rs. 505 549 3041 2769 1524 2322 10710
Own Source Revenue
Total 8490
1360
6 16542 17845 13781 18124 88388

ISSN: 2362-1303 (Paper) | eISSN: 2362-1311(Online)
JOURNAL OF ADVANCED ACADEMIC RESEARCH (JAAR) January 2015
Vol. 2. No. I www.phdcentre.edu.np 8
IPT Contribution (%) 5.95 4.03 18.38 15.52 11.06 12.81 12.12
(Source: Damak, Hetauda and Birendranagar Municipality Offices, 2014)
The above data (Table-2) shows that the contribution of integrated property tax on own source
revenue of Damak municipality is in raising trend except one fiscal year i.e. 2008/009. The
contribution of the same tax on own source revenue of Hetauda municipality is nominally
fluctuating overall period of six years and the fluctuation rate of integrated property tax of
Birendranagar municipality is comparatively higher than Hetauda municipality. Damak
municipality has the highest contribution percentage of Integrated property tax on own source
revenue ( i.e. 16.70% ), and Hetauda municipality has the lowest contribution percentage of the
same tax (i.e.11.77%).
Table No. 3: Contribution of Own Source Revenue on Total Revenue ( Rs. in 000)
Mu
nic
ipali
ty
Descriptions
Fiscal Years
007/08 008/09 009/10 010/11 011/12 012/13 Total
Dam
ak
Total Revenue
Received Rs. 52845 91338 62303 120971 92069 116733 536259
Own Source Revenue
Received Rs. 15675 47270 17427 21933 26281 28906 157492
Contribution( %)of
Own Source Revenue
to Total Revenue
29.66 51.75 27.97 18.13 28.54 24.76 29.37
Het
au
da
Total Revenue
Received Rs. 81624 119182 260662 211972 196003 172928 1042371
Own Source Revenue
Received Rs. 45732 57463 62227 97051 101357 101777 465607
Contribution( %)of
Own Source Revenue
to Total Revenue
56.03 48.21 23.87 45.78 51.71 58.86 44.67
Bir
end
ran
agar
Total Revenue
Received Rs. 25016 57188 72975 81608 48408 68794 353989
Own Source Revenue
Received Rs. 8490 13606 16542 17845 13781 18124 88388
Contribution( %)of
Own Source Revenue 33.94 23.79 22.67 21.87 28.47 26.35 24.97

ISSN: 2362-1303 (Paper) | eISSN: 2362-1311(Online)
JOURNAL OF ADVANCED ACADEMIC RESEARCH (JAAR) January 2015
Vol. 2. No. I www.phdcentre.edu.np 9
to Total Revenue
(Source: Damak, Hetauda and Birendranagar Municipality Offices, 2014)
The above (Table - 3) data reflect that the total revenue and own source revenue of six years of
Hetauda municipality is higher than Damak and Birendranagar municipalities. Own source
revenue collection ratio of Damak, Hetauda and Birendranagar municipality has been fluctuating
as the contribution of own source revenue on total revenue of all the municipalities has been
changed. In an aggregate form, the contribution of own source revenue on total revenue of
Hetauda municipality is higher (i.e. 44.67%) than other two Damak and Birendranagar
municipalities, as they have 29.37% and 24.97% contribution of own source revenue on total
revenue respectively. The table depicts that Hetauda municipality has been paying high attention
continuously to increase own source revenue in comparison to other two municipalities.
On the basis of the following figure (Figure: 1), most of the taxpayers believe that the integrated
property tax is more potential source of own source revenue of municipalities in Nepal. More
than 83 (potential 41% and highly potential 42.5%) percent taxpayers have expressed their views
on potentiality of the tax.
Figure: 1
(Source: Field Survey, 2014)

ISSN: 2362-1303 (Paper) | eISSN: 2362-1311(Online)
JOURNAL OF ADVANCED ACADEMIC RESEARCH (JAAR) January 2015
Vol. 2. No. I www.phdcentre.edu.np 10
Table – 4: Comparative Opinions of Municipal Taxpayers and Policy Advisors on
Integrated Property Tax
S.N. Major Revenue Headings
Opinions of Municipal
Tax Payers
Opinions of Municipal
Policy Advisors
Highly
Potential
(%)
Potential (%)
Highly
Potential
(%)
Potential (%)
1 Integrated Property Tax 42.5 41 62 27
2 Business /Profession Tax 33.5 54.8 54 34
3 Rental Tax 25.5 34.8 40 34
4 Building Permit Fee 38.5 38.5 39 52
5 Service Fee 21.8 50 12 61
6 Environmental Pollution
Fee 13.8 43.5 5 47
(Source: Field Survey, 2014)
Based on above comparative table (Table:4), among the six major headings of municipal own
source revenues, integrated property tax has highest scores, and the second highest scorer is
business /profession tax from the view point of taxpayers and municipal policy making advisors.
Comparatively, the environment pollution control fee and municipal service fee are less potential
sources of municipal own source revenues.
Figure: 2
A Comparative Views on IPT Tax of Taxpayers and Municipal Policy making Advisors

ISSN: 2362-1303 (Paper) | eISSN: 2362-1311(Online)
JOURNAL OF ADVANCED ACADEMIC RESEARCH (JAAR) January 2015
Vol. 2. No. I www.phdcentre.edu.np 11
(Source: Field Survey, 2014)
Based on above pie chart (Figure: 2), the taxpayers express their views pertaining to potentiality
of integrated property tax with 42.50 percent highly potential and 41 percent potential. Similarly,
the municipal policy advisors state that their views relating to the potentiality of integrated
property tax with 62 percent highly potential and 27 percent potential.
Discussion
The findings shown in above tables and figures are compared with the prior researches to know
the similarity and dissimilarity in data. The contribution of integrated property tax on revenue
lies between11.77% to16.70% and the contribution of own source revenue on total revenue lies
between24.97% to 44.67% within the study period. The average contribution of property tax of
all the municipalities is above than 11.77 %. House and land tax is the second largest revenue
source of all the municipalities of Nepal (Silwal, 2012)
Although the contribution of own source revenue on total revenue of all the municipalities have
been fluctuating, the lower contribution ratios of own source revenue to total revenue of Damak,
Hetauda and Birendranagar municipalities are 18.13%, 23.87% and 21.87% respectively. In
average, the contribution of own source revenue on total revenue of Damak, Hetauda and
Birendranagar municipalities are 29.37%, 44.67% and 24.97% respectively. The collection
amount of integrated property tax of Hetauda municipality has been increasing enthusiastically
so that there is no doubt to secure full marks from this indicator in Minimum Condition and
Performance Measurement (MCPM) rating system. MCPM manual (Government of Nepal,
42.50%
41% 62%
27% Opinions of Municipal
Tax Payers Highly
Potential (%)
Opinions of Municipal
Tax Payers Potential
(%)
Opinions of Municipal
Policy Advisors Highly
Potential (%)
Opinions of Municipal
Policy Advisors
Potential (%)

ISSN: 2362-1303 (Paper) | eISSN: 2362-1311(Online)
JOURNAL OF ADVANCED ACADEMIC RESEARCH (JAAR) January 2015
Vol. 2. No. I www.phdcentre.edu.np 12
Secretariat of LBFC, 2009, p. 27)has mentioned the provision for integrated property tax
implementation and its performance regarding MCPM assessment for securing full marks from
the indicator that increases income from the integrated property tax in the last year compared to
second last fiscal year.
From the view point of municipal taxpayers and policy advisors, integrated property tax is more
potential own source revenue of municipality in comparison to other sources. Property tax
proponents have long advocated redefining the property tax so that it might come closer to
realizing its potential. Many have identified specific best practices, including administrative and
policy reforms that have been broadly successful (Bahl, 2009).
Conclusion
The study concludes that the contribution of integrated property tax on own source revenue of
one municipality is not consistent with the contribution of other municipalities. Likewise, the
contribution ratio of own source revenue on total revenue has no uniformity among
municipalities. The more integrated property tax contribution ratio; the more own source
revenue, the more own source revenue; more chances of getting performance grants by the
central government. The study clearly shows that the integrated property tax is highly potential
own source revenue of municipal finance in Nepal.
Acknowledgement
I am grateful to the Prof. Dr. Kamal Das Manandhar for his regular support and guidance to me.
I would also like to express my sincere thanks to Dr. Tatwa P. Timsina and Mr. Tej Bahadur
Karki and other team members of PhD Centre, Kathmandu for expected encouragement. I also
thank to Mr. SangamChaulagain (Lecturer of Makawanpur Multiple Campus Hetauda) for
language editing and my colleagues Mr. Yam Bahadur Silwal and Bhaskar Chandra Adhkari for
field works. Also, I am thankful to Mr. Pashupati BabuPuri (Executive Officer, Hetauda
Municipality), Mr.Ganesh Timsina (Executive Officer, Damak Municipality), and Mr. Hotraj
Lamsal (Executive Officer, Birendranagar Municipality), and all the respondents for their
gracious cooperation in data collection. And, I would also like to express my candid thanks to all
the municipal staff and respondents for their amiable mutual aid.
References
Alm, J. (2012, February ). Measuring, explaining and controlling tax evasion: lessons from
theory, experiments and field study. International Tax and Public Finance, 19(1), 54 - 77.
Bahl, R. (2009). Property Tax Reform in Developing and Transitional Countries. USAID.

ISSN: 2362-1303 (Paper) | eISSN: 2362-1311(Online)
JOURNAL OF ADVANCED ACADEMIC RESEARCH (JAAR) January 2015
Vol. 2. No. I www.phdcentre.edu.np 13
BSBA. (2013, February 11). Priciples and Theories of Taxation. Retrieved March 22, 2015, from
www.slideshare.net
Government of Nepal, Secretariat of LBFC. (2009). Minimum Condition and Performance
Measure Assessment Manual of Municipality. Kathmandu: Government of Nepal,
Secretariat of LBFC.
Hefferen, M. (2010). Property Taxation and Mass Appraisal Valuation in Australia-Adapting to a
New Environment. Australia: Mike Hefferen.
ICTD. (2013, October 5). Local Government Revenue Mobilization in Anglophone Africa. 2.
Africa: ICTD.
Kayuza, H. M. (2006). Real Property Taxation in Tanzania. Stockholm: Royal Institute of
Technology.
Merima Ali, O. H. (2013). Citizens' Attitudes Towards Taxation in Kenya, Tanzania, Uganda
and South Africa. Norway: Afrobarometer.
MLD. (2012). Public Expenditure & Financial Accountability and Fiduciary Risk Reduction
Action Plan. Kathmandu: Government of Nepal, Ministry of Local Development.
MLD, udle/GTZ. (2008). Land Property Tax in Nepal: Status Quo, Lessons Learnt and
Recommendations. Kathmandu: MLD and UDLE/ GTZ.
Nepal Government. (1999). LSG Regulation. Kathmandu: Nepal Law Commission.
Silwal, S. (2012). Municipal Finance in Nepal. Kathmandu: Sudarshan Silwal.
Thapa, R. B. (2004). Financial Resource Mobilization in Pokhara Sub-municipal Corporation.
Journal of Nepalese Business Studies, 4.
udle/GTZ. (2009). Local Property Tax Improvement. Kathmandu: MLD and GTZ.
Youngman, J. M. (1996). Tax on Land and Buildings. Victor Thuronyi: International Monetory
Fund.
Youngman, J. M. (2005). Alternative Perspective on Property Taxation. Joan M. Youngman.

ISSN: 2362-1303 (Paper) | eISSN: 2362-1311(Online)
JOURNAL OF ADVANCED ACADEMIC RESEARCH (JAAR) January 2015
Vol. 2. No. I www.phdcentre.edu.np 14
Respondents wise Status of Non-Governmental Organizations
(NGOs) of Karnali Zone Nepal
Kushendra Bahadur Mahat1 & Prof. Dr. Bihari Binod Pokharel
2
1PhD Scholar, Dr. K. N. Modi University, Newai, Rajasthan, India
2 Director, Master of Business Management Program, Nepal Commerce Campus, Tribhuwan
University, Minbhawan, Kathmandu, Nepal
Corresponding Author
Kushendra Bahadur Mahat
Email: [email protected]
Abstract
Non-Governmental Organizations (NGOs) have been promoted in the development activities in
Nepal since the restoration of democracy in 1990. NGOs have been recognized as one of the
development facilitator institutions in Karnali Zone. The objective of this study was focused to
identify the status of Non-Governmental Organizations (NGOs) on the basis of its structure,
environment, values and Impact. The study had adopted the civil society index as a theoretical
tool of study. Randomly in total 562 respondents were selected from five districts of Karnali
zone. The findings of ANOVA showed that there was a significant difference between
respondents in the structure of NGOs in P=0.007 significant level at 95% confidence interval.
But other three components environment, values and impact were not significantly difference. It
could be assumed that because of the geographical differences, involvement of human resources,
basic infrastructure, access on communication and technologies and perception on NGOs
activities are the major factors which made the perceptual difference among the respondents in
structure of NGOs. Similarly, contribution of NGO in promotion of political awareness,
transparency of their work and empowering citizenship were more or less in the same level in all
five districts so response of participants became similar in environment, values and impact of
NGOs. It is necessary to identify the locally reliable and related indicators of NGO to assess the
NGO's status and their performance.
Keywords: NGO, Respondents, Status,

ISSN: 2362-1303 (Paper) | eISSN: 2362-1311(Online)
JOURNAL OF ADVANCED ACADEMIC RESEARCH (JAAR) January 2015
Vol. 2. No. I www.phdcentre.edu.np 15
Introduction
The study was focused to identify the status of Non-Governmental Organizations (NGOs) on the
basis of its structure, environment, values and Impact. This study was carried out in five districts;
Dolpa, Humla, Jumla, Kalikot and Mugu of Karnali Zone. Karnali Zone falls under the lowest
ranking among all zones and districts of Nepalfrom the Human Development Index (HDI). In
this context, NGOs were played significant contribution to meet the minimum basic needS of the
community along with Nepal Government. There were 32000 NGOs registered and affiliated
with Social Welfare Council which 560 NGO in Karnali Zone. NGOs in Nepal formed and
operate under the Societies Registration Act 2034 (1977) and Social Welfare Act 2044. District
Administration Office (DAO) and the Social Welfare Council (SWC) are the important
governing institutions of NGOs in Nepal (Dhakal, 2007, p. 5). NGOs HAVE been working on
the environment sector, forestry sector, wildlife sector and national development; poverty,
human right, HIV and AIDS, health, etc. (Bhandari, 2014, p. 183). Since the 1990s, the role of
development non-governmental organisations (NGOs) in international development has
increased along with massive interest and concern over NGO performance from NGO
practitioners, governments, citizens, donors, policymakers and academics (Lund, 2012). The
current main crux of the matter in Nepal is how to reach out to the most excluded and needy
people for their improvements. Both donors and NGOs apply different approaches to this issue;
some INGOs go as far as contracting directly with local communities and user groups – by
passing intermediary Nepali NGOs (Ingdal, 2007, p. iv). NGOs have been recognized as one of
the development actors but formal academic research of the contributions and their status is not
carried out in Karnali Zone. Civil society institution and NGOs in different sectors can bridge the
differences between transitional citizens with different backgrounds as they learn to coexist in
the public sphere and concomitantly develop higher levels of trust (Abom, 2004; TUSALEM,
2007, p. 380). To find the status of the NGOs in Karnali Zone, specific research was carried out
with the basis of Civil Society Index (CSI).
Method
Quantitative designed was applied in the study. In quantitative data, cross-tab, frequency table
and ANOVA test and multiple comparison (Bonferroni test) values were analyzed for descriptive
analysis of data, as well as correlation was done to explore the relation between two and multiple
variables. In total 562 respondents were selected from 5 groups: beneficiaries -400, NGOs Board
- 56, NGOs staff – 56, Civil Society - 25, Government Official – 25. In district wise, number of
participation were Dolpa - 66, Humla – 82, Jumla - 146, Kalikot - 174 and Mugu - 94 by using
the simple random sampling. Multistage Simple Random Sampling was used to deduct the size
of the study area on the basis of logical reasoning and simple random sampling which was
adopted to select the respondents. Under the random sampling, lottery method (two types of
similar paper card was used having with symbol of '0' and '1' ('0' means not selected and '1'

ISSN: 2362-1303 (Paper) | eISSN: 2362-1311(Online)
JOURNAL OF ADVANCED ACADEMIC RESEARCH (JAAR) January 2015
Vol. 2. No. I www.phdcentre.edu.np 16
means selected) was used to select the respondents for survey and interview both. The entire
paper cards were kept in one container and participants were asked to draw the card. Who got the
1, was selected for the study.
Result
This study had measured the main four elements (structure, environment, values, and impact) of
NGOs on the basis of five types of respondents. These four elements determine the overall status
of the NGOs and their performances. All these four elements also include 25 sub-elements.
Under these 25 sub-elements there were 74 individual indicators which support to measure the
NGOs. These sub-elements were as below:
Structure
There are six main components under the structure. These six components are breadth of citizen
participation, depth of citizen participation, diversity of civil society participation, resources,
level of organization and inter relation of NGOs. There is a significant difference between
respondents in the structure. There is significant difference of breadth of citizen participation
between civil society to beneficiaries, NGO board and Civil Society. There is significantly
difference of depth of citizen participation between civil society and beneficiaries and NGO
board. There is a significant difference of resources and interrelation between NGO boards, civil
society and beneficiaries.
Environment
There are seven main components under the environment. These seven components are political
context, basic freedom of rights, socio-economic context, socio-cultural context, private sector
civil society, legal environment and state civil society. There is no significantly difference
between beneficiaries, NGO board, NGO staff, and Government and Civil society.
Values
There are seven main components under values. These seven components are democracy,
transparency, tolerance, non-violence, private sector civil society, poverty eradication and gender
equity. There is no significantly difference of non-violence between respondents.
Impact
There are five main components under Impact. These five components are holding state &
private sector, influencing public policy, responding to social interest, empowering citizens and
building social capital. There is no significantly difference of non-violence between respondents.

ISSN: 2362-1303 (Paper) | eISSN: 2362-1311(Online)
JOURNAL OF ADVANCED ACADEMIC RESEARCH (JAAR) January 2015
Vol. 2. No. I www.phdcentre.edu.np 17
The study had collected the data from the respondents regarding their perception on status of
NGOs of Karnali Zone on the basis of major four elements. The data presented below explained
the mean value of each element of NGOs. The following data shows the mean differentiation of
four major elements (structure, environment, values, and impact) on the basis of five types of
respondents. The analysis of variance (ANOVA) test was calculated and found the following
values. The mean values and value of f-test has given the description of NGOs status in Karnali
Zone. Comparative data are presented to identify the high and low value of four main elements
as well as its significant differences between and within the respondents.
Respondent wise mean value of four elements of NGOs
STRUCTURE
ENVIZRONMENT
VALUE
IMPACT
ANOVA test within the respondents
Description F Value P - Values Remarks
Structure 3.582 0.007 Significant
Environment 0.941 0.44 Insignificant

ISSN: 2362-1303 (Paper) | eISSN: 2362-1311(Online)
JOURNAL OF ADVANCED ACADEMIC RESEARCH (JAAR) January 2015
Vol. 2. No. I www.phdcentre.edu.np 18
Values 0.977 0.420 Insignificant
Impact 0.829 0.507 Insignificant
Source: Field survey, 2014
From the above table in the structure F value is 3.582 and P-values is .007 observed. It indicates
there is a significant difference between respondents in the structure. And other three
components environment, values and impact are not significantly difference observed within
respondents. There was significant difference in structure among the types of respondents in P =
.007 significant level at 95% confidence interval. But the data accepted was no difference in
environment, values and impact among the types of respondents in P = .44, P = 0.420 and P =
0.507 respectively significant level at 95% confidence interval.
Respondent wise multiple comparison of major elements of NGOs (Bonferroni test)
Table 1: Respondent wise multiple comparison of structure of NGOs
Source: Field survey, 2014
The table no. 1 shows that there was significant difference between the beneficiaries and civil
society at the P = 0.021 significant level which is less than .05. The value of beneficiaries was
significantly higher than civil society. Similarly, there was significant difference between the
NGO board and civil society at the P = 0.005 significant level which is less than .05. The value
of NGO board was significantly higher than civil society.
Desc
ripti
on
Respondents types P-
Values
95% confident
level Remarks
Lower
bound
Upper
bound
Str
uct
ure
Beneficiaries – NGO board 1.000 -6.187 2.002 No significant difference
Beneficiaries - NGO staff 1.000 -3.741 4.449 No significant difference
Beneficiaries – Government 1.000 -3.014 8.819 No significant difference
Beneficiaries – Civil society 0.021 0.585 12.419
Beneficiary has
significantly higher
NGO board – NGO staff 1.000 -2.977 7.870 No significant difference
NGO board – Government 0.419 -1.908 11.898 No significant difference
NGO board – Civil society 0.005 1.691 15.498
NGO board has
significantly higher
NGO staff – Government 1.000 -4.355 9.452 No significant difference
NGO staff – Civil society 0.124 -0.755 13.052 No significant difference
Government – Civil society 1.000 -4.518 11.7183 No significant difference

ISSN: 2362-1303 (Paper) | eISSN: 2362-1311(Online)
JOURNAL OF ADVANCED ACADEMIC RESEARCH (JAAR) January 2015
Vol. 2. No. I www.phdcentre.edu.np 19
The relation between the other respondents; government vs. civil society, NGO staff vs. civil
society, NGO staff vs. government, beneficiaries vs. government, NGO board vs. NGO staff
found no significant difference because the P value was greater than .05 significant level.
The above table and graphs shows that NGO board value has higher score and civil society has
lower score between five respondents.
Table No. 2: Respondent wise multiple comparison of environment of NGOs
Source: Field survey, 2014
The table no. 2 has explained the multiple comparisons between the respondents regarding their
perception on environment of NGOs. The data shows that there was no significant differences
between the each group of respondents because P value was found greater than .05 (5%) of
significant level at 95% confidence interval.
Table no. 3: Respondent wise multiple comparison of values of NGOs
De
scr
ipt
io
n
Respondents types
P-
Value
s
95% confident
level
Remarks Lowe
r
boun
d
Upper
bound
En
vir
on
men
t
Beneficiaries – NGO board 1.000 -4.771 3.822 No significant difference
Beneficiaries - NGO staff 1.000 -3.967 4.626 No significant difference
Beneficiaries – Government 1.000 -7.253 5.163 No significant difference
Beneficiaries – Civil society 0.731 -2.253 10.163 No significant difference
NGO board – NGO staff 1.000 -4.887 6.494 No significant difference
NGO board – Government 1.000 -7.814 6.673 No significant difference
NGO board – Civil society 0.854 -2.814 11.673 No significant difference
NGO staff – Government 1.000 -8.618 5.8696 No significant difference
NGO staff – Civil society 1.000 -3.618 10.869 No significant difference
Government – Civil society 0.986 -3.518 13.518 No significant difference
Description Respondents types P-
Values
95% confident
level Remarks
Lower
bound
Upper
bound
Valu
es Beneficiaries – NGO board
1.000 -2.604 2.864 No significant
difference
Beneficiaries - NGO staff 1.000 -3.247 2.222 No significant

ISSN: 2362-1303 (Paper) | eISSN: 2362-1311(Online)
JOURNAL OF ADVANCED ACADEMIC RESEARCH (JAAR) January 2015
Vol. 2. No. I www.phdcentre.edu.np 20
Source: Field survey, 2014
Following the analysis of table no. 2, the study found insignificant association between the
respondents regarding their perception on environment of NGO. In the same way, the data also
explored the relationship between the respondents regarding their response on 'value' of NGO.
The data of table no. 3 shows that there was no significant difference between the respondents.
NGO board vs. government or NGO's staff vs. civil society vs. beneficiaries were found no
relations between them. The P value was found greater the .05 significant levels. It accepted the
null hypothesis.
Table No. 4: Respondent wise multiple comparison of impact of NGOs
difference
Beneficiaries – Government 1.000 -2.363 5.538
No significant
difference
Beneficiaries – Civil society 1.000 -1.843 6.058
No significant
difference
NGO board – NGO staff 1.000 -4.264 2.979
No significant
difference
NGO board – Government 1.000 -3.152 6.067
No significant
difference
NGO board – Civil society 1.000 -2.632 6.587
No significant
difference
NGO staff – Government 1.000 -2.510 6.710
No significant
difference
NGO staff – Civil society 1.000 -1.990 7.230
No significant
difference
Government – Civil society 1.000 -4.901 5.941
No significant
difference
Description Respondents types P-
Values
95% confident
level
Remarks
Lower
bound
Upper
bound
Imp
act
Beneficiaries – NGO board 1.000 -4.846 2.397
No significant
difference
Beneficiaries - NGO staff 1.000 -5.096 2.147
No significant
difference
Beneficiaries – Government 1.000 -3.931 6.536
No significant
difference
Beneficiaries – Civil society 1.000 -4.051 6.416
No significant
difference

ISSN: 2362-1303 (Paper) | eISSN: 2362-1311(Online)
JOURNAL OF ADVANCED ACADEMIC RESEARCH (JAAR) January 2015
Vol. 2. No. I www.phdcentre.edu.np 21
Source: Field survey, 2014
Impact is known as the output of NGO. The study also evaluated the impact of NGO in the
Karnali Zone. The analysis of survey data presented in table no. 4 shows that there was no
significant difference between the respondents regarding the impact of NGO. It is interesting that
the P value of each relation was found equal (P = 1.000) which is greater than .05. The result
accepted there was no significant difference between the respondents.
Table no. 5: Respondent wise Sub group of main elements of NGOs
Main
Element
Sub-Elements F Value P-Values Remarks
Str
uct
ure
3.582 0.007 Significant
Breadth of citizen Participation 3.881 .004 Significant
Depth of citizen participation 3.964 .004 Significant
Diversity of civil society
participants
2.132 .076 Insignificant
Resources 3.177 .013 Significant
Level of organization .305 .875 Insignificant
Inter relations 2.740 .028 Significant
En
vir
on
men
t
0.941 0.44 Insignificant
Political context 2.037 .088 Insignificant
Basic freedom & rights 2.134 .075 Insignificant
Socio-economic context 1.144 .335 Insignificant
Socio-cultural context .005 1.000 Insignificant
Private sector civil society 1.960 .099 Insignificant
Legal environment .700 .592 Insignificant
State civil society relation .782 .537 Insignificant
Va
lue s 0.977 0.420 Insignificant
NGO board – NGO staff 1.000 -5.047 4.547
No significant
difference
NGO board – Government 1.000 -3.579 8.633
No significant
difference
NGO board – Civil society 1.000 -3.699 8.513
No significant
difference
NGO staff – Government 1.000 -3.329 8.883
No significant
difference
NGO staff – Civil society 1.000 -3.449 8.763
No significant
difference
Government – Civil society 1.000 -7.300 7.060
No significant
difference

ISSN: 2362-1303 (Paper) | eISSN: 2362-1311(Online)
JOURNAL OF ADVANCED ACADEMIC RESEARCH (JAAR) January 2015
Vol. 2. No. I www.phdcentre.edu.np 22
Democracy .490 .743 Insignificant
Transparency 1.884 .112 Insignificant
Tolerance .770 .545 Insignificant
Non-violence 1.265 .283 Insignificant
Environmental sustainability 1.377 .240 Insignificant
Poverty eradication .749 .559 Insignificant
Gender equity 1.195 .312 Insignificant
Imp
act
0.829 0.507 Insignificant
Holding state & private sector 1.279 .277 Insignificant
Influencing public policy .700 .592 Insignificant
Responding to social interest .151 .963 Insignificant
Empowering citizens 1.372 .242 Insignificant
Building social capital 1.596 .174 Insignificant
Source: Field survey, 2014
From the above table no 5 under the structure, there are six components. Out of six, four
components observed significant. Breadth of citizen participants F value is 3.881 and P-value is
0.004, Depth of citizen participation F value is 3.964 and P-value is 0.004, Resources F value is
3.177 and P-value is 0.013 and inter relations F value is 2.74 and P-value is 0.028 Out of six two
components are insignificant, diversity of civil society participants F value is 2.132 and P-value
is 0.076 and level of organization F value is 0.305 and P-value is 0.875
And other three main components environment, values and impact of the nineteen components
are not significantly difference observed within respondents.
Discussion
The study found the significant difference on structure of NGO from the perceptual analysis of
respondents. Under the structure of NGO, there was significant difference on the depth of citizen
participation, mobilization of resources and inter relations which determines the social status of
NGO and its effect on development. The beneficiaries, civil society and NGOs staff had different
perception on volunteering, charitable giving, NGO membership, collective action under and the
financial, human and technical resources as well as level of communication and cooperation of
NGOs in the districts. Many previous literatures has accepted NGO as a development partners.
Lenihan, Eoghan Walsh and Helena has stated that NGOs are significant players in the
development field (2006, p. 422). In the Nepalese context, the role of NGOs and Civil Societies
are still service and development oriented. Civil societies play important roles in the changing of
individuals‟ lives by bringing together diverse groups of people to solve social problems
(Bhandari, 2014, p. 177).

ISSN: 2362-1303 (Paper) | eISSN: 2362-1311(Online)
JOURNAL OF ADVANCED ACADEMIC RESEARCH (JAAR) January 2015
Vol. 2. No. I www.phdcentre.edu.np 23
From the perspective of respondents of all five districts, there was no significant difference on
environment, values and impact of NGO. Environment wise, there was no association in political
context, basic freedom & rights, socio-economic context, legal environment and state civil
society relationship in these study areas. Though, it was acceptable that all the NGOs of different
districts were providing their services to the community. According to Yap, Nonita also, there
are NGOs which define their mandate as helping to remove the stumbling blocks to
development: some pursue this objective through the delivery of relief and social welfare
services; others do it by helping to organize communities or sectors (1989/1990, p. 77).
Values of NGO talk about the democracy, transparency, tolerance, non-violence, environmental
sustainability, poverty reduction and gender equity. All these variables were insignificant with
the perception of respondents in Karnali zone. There was no relation between the respondents
but independently all these factors were working in the study areas. The previous study showed
that in modem development discourse, one area that has gained considerable currency has been
the impact delivered by NGOs, mainly because their work is understood to have direct and
obvious effects on the lives of poor and marginalized people (Linda Kelly, 2004, p. 696). The
NGO sector is hugely diverse, ranging from small CBOs dealing with local community issues to
larger, nationally based NGOs, which mostly address social or economic needs (Mercer, 1999, p.
249).
Impact of NGO explained about the holding state & private sector, influencing public policy,
responding to social interest, empowering citizens and building social capital in this study. These
factors were also found insignificant differences from the perspective of respondents. The
contributions of NGO in these sectors were found meaningful in their particular context and it
was also reported in the previous studies. Nusrat Jahan Chowdhury has stated that both national
and international policy-making institutions have acknowledged the contribution of NGOs in
alleviating poverty, through empowering the poor and continuing to support their endeavors
(Chowdhury, 2008, p. 117). Characteristics of the Process of Development with Equity it is
important to appreciate the full significance of the point that the right to development associates
development with equity and justice (Sengupta, 1999). NGOs have done much to address the
needs and issues of the 'poor across the world. However, much remains to be done with regard to
understanding the effects that NGOs and their multiple approaches and agendas have on wider
sociological processes such as the building of social capital and social organizing (Abom, 2004,
p. 342).
Presence of NGO also plays the role to create the positive relationship between the different key
stakeholders. From the study showed that there was no association between the various activities
of NGO in Karnali zone from the respondents perspective though independently their status was
meaningful. Lawrence T. Woods showed the important of NGO by stating that the ability to

ISSN: 2362-1303 (Paper) | eISSN: 2362-1311(Online)
JOURNAL OF ADVANCED ACADEMIC RESEARCH (JAAR) January 2015
Vol. 2. No. I www.phdcentre.edu.np 24
foster mutual understanding among peoples and states and between people and states is
considered vital by most NGOs (1995, p. 824).
Conclusion
The study was focused to identify the status; structure, environment, value and impact of NGOs
in Karnali zone with the perspective of different respondents NGO board, NGO staff,
Beneficiaries, Government agencies and Civil Societies. The findings showed that there was
significant difference in structure. The perspective of beneficiaries and civil society, NGO board
and civil society had different perception in breadth and depth of citizen participation; inter
relation and resources of the NGOs. It could be assumed that because of the geographical
differences, involvement of human resources, basic infrastructure, access on communication and
technologies and perception on NGOs activities are the major factors which made the perceptual
difference among the respondents. Similarly, the findings showed that the rest major three
elements; environment, values and impact had no significant difference. From the respondents'
perspective, the status of these three elements was similar in all five districts. Normally, it could
be observed that the contribution of NGO in promotion of political awareness, transparency of
their work and empowering citizenship were more or less in the same level in all five district so
response of participants became similar. The study found the similar response of respondents in
environment, values and impact of NGO so it is necessary to identify the locally reliable and
related indicators of NGO to assess the NGO's status and their performance.
References
Abom, B. (2004, April). Social Capital, NGOs, and Development: A Guatemalan Case Study.
Development in Practice, 14(3), 42-353.
Bhandari, M. (2014). Civil Society and Non-Governmental Organizations (NGOs) Movements in
Nepal in terms of Social Transformation. Pacific Journal of Science and Technology,
177-189.
Chowdhury, N. J. (2008). A Journey towards Development: The Impact of Local NGO
Programmes on Women Living in the Char Lands of Bangladesh. Development in
Practice, 117-124.
Dhakal, T. N. (2007). Challenges of Civil Society Governance in Nepal. JOAAG Vol. 2 no 1, 65-
66.
Ingdal, A. S. (2007). A Discussion Paper on Donor Best Practices Towards NGOs in Nepal.
Norwegian Agency for Development Cooperation, Oslo, Norway.
Lenihan, E. W. (2006, August). Accountability and Effectiveness of NGOs: Adapting Business
Tools Successfully. Development in Practice, 16(5), 412-424.

ISSN: 2362-1303 (Paper) | eISSN: 2362-1311(Online)
JOURNAL OF ADVANCED ACADEMIC RESEARCH (JAAR) January 2015
Vol. 2. No. I www.phdcentre.edu.np 25
Linda Kelly, P. K. (2004). Impact Measurement for NGOs: Experiences from India and Sri
Lanka. Development in Practice, 696-702.
Lund, R. N. (2012). Review of NGO performance research published in academic journals
between 1996 and 2008. Adolescent Health Research, Unit, University of Cape, Town,
Cape Town, South Africa.
Mercer, C. (1999). Reconceptualizing State-Society Relations in Tanzania: Are NGOs 'Making a
Difference'? Wiley, 247-258.
Sengupta, A. (1999). The Right to Development as a Human Right.
TUSALEM, R. F. (2007, June). Boon or a Bane? The Role of Civil Society in Third- and Fourth-
Wave Democracies. International Political Science Review / Revue internationale de
science politique, Vol.28, No. 3 (Jun., 2007), pp. 361-386, 28(3), pp.361-386.
Woods, L. T. (1995, September). Learning from NGO Proponents of Asia-Pacific Regionalism:
Success and Its Lessons. Asian Survey, 35(9), 812-827.
Yap, N. (1989/1990, Winter). CouncilNGOs and Sustainable Development. International
Journal,, 45(1), 75-105.

ISSN: 2362-1303 (Paper) | eISSN: 2362-1311(Online)
JOURNAL OF ADVANCED ACADEMIC RESEARCH (JAAR) January 2015
Vol. 2. No. I www.phdcentre.edu.np 26
Researcher Observational Analysis of the Role of Educational
Facilities on Students' Achievement
Bijaya Nepal1 & Prof. Dr. Ramkrishna Maharjan
2
1PhD Scholar, Mewar University, Rajasthan, India
2 Professors, Tribhuvan University, Kathmandu, Nepal
Corresponding Author
Bijaya Nepal
Email: [email protected]
Abstract
This study was undertaken to analyse the researcher's observation on different five variables:
school’s library, e-library, science laboratory, availability of computer laboratory and its
management. These educational facilities effect on the learning process and the achievement of
the students’. The main objective of this study was to analyse the role of schools' educational
facilities on students' achievement on community-based school and institutional schools of
Central Development Region of Nepal. The data presented in this paper were collected to know
the measurement of availability of educational facilities and students' achievement from the
selected schools for the research. This study was conducted from January to July 2014. During
this time, observation checklist was designed to obtain descriptive results using cross tabulation
and percentage; and multi-stage sampling methods were applied. The sample size was taken
proportionately from 3,125 numbers of Secondary and Higher Secondary schools. The selected
districts were Sindhupalchok, Kavre, Makwanpur, Kathmandu and Chitwan. From the universe,
32(1.02 percent) schools were taken by using proportionate stratified random sampling. The
value of data Cronbach's Alpha is 0.86 within 36 variables. Analysis of data was done by using
the SPSS version 20. Chi-square test was applied to analyze the data. There was significance
association (p=.000) between community and institutional schools students' achievement test
min score of science and computer subjects and significance association (p=.010) among
ecological region (Mountain, Hill, Valley and Terai) students achievement test min score of five
core subjects has been found which means that the availability and management of educational
facilities and achievement in most of the private schools are better than governmental one.
Keywords: Educational Facilities, Observational Analysis and Students' Achievement

ISSN: 2362-1303 (Paper) | eISSN: 2362-1311(Online)
JOURNAL OF ADVANCED ACADEMIC RESEARCH (JAAR) January 2015
Vol. 2. No. I www.phdcentre.edu.np 27
Introduction
Schools exist for the purpose of teaching and learning. Educational facilities are provided for this
purpose. They are the material and resources provided to the teachers and the students to
optimize their productivity in teaching and learning process. The realization that the transfer of
knowledge does not only take place in the four walls of the classroom, but it goes beyond it. So,
it does not limit within the teacher and the students, rather the learning takes place through
discovery, exploration and interaction with the internal. External environment has necessitated
the creative and innovative development of teaching and learning facilities that reflect these
changes (Asiabaka, 2008). Useful types of educational facilities to be contacted by the planners
and the school management team are acoustical design engineering, audio visual, sciences
laboratory, building design, interior design, computer laboratory, lighting design, management
consulting, project planning, site planning, technical equipment specialization, and urban
planning(Propst, 1972).
Firstly, the government should provide necessary facilities for the schools. Secondly, School
Management Committee can manage all type of necessary facilities and thirdly, the head of the
school should ensure optimal implementation of these facilities. Policies and Programmes of the
Government of Nepal for fiscal year 2071-72 (2014-15), In order to promote quality education of
school, "one school; one library and e-library, and one school; one science laboratory"
programmes will be launched gradually in secondary schools. Technological gap will be reduced
through education system based on information technology (GoN, 2014, p. 9).
There are basically two types of financial assistance by the government to provide necessary
assistance to public schools in Nepal. The first is earmarked grants; this includes teachers' salary,
textbooks, scholarship etc. The second type involves block grants; which includes the school‟s
cost of administrative expenses, expenditures related to infrastructure development and
educational materials. Out of the total number of grants that a school receives in an academic
year, around 80 percent goes to teacher's salary and only 20 percent to construction and
educational material support (Thapa, 2011, p. 25).
E-library is an education-focused digital library containing full-text documents, books, images,
videos, audio files, and interactive educational software that can be accessed through an intranet
or on the Internet. It was started in Nepal from 2008 with the aims to improve children's' Nepal
reading skills and develop a reading culture in schools by giving them free and open access to
age-appropriate reading materials and to enable students to do research projects and promote
habit of independent inquiry (OLE Nepal, 2015 ). The Ministry of Education of the Government
of Nepal is beginning to show an interest in enhancing the quality of education in Nepali schools
through the use of Information and Communication technology. The vision is to provide an e-
library in every high school in Nepal. About one million US dollars have been allocated for the
current fiscal year to start a pilot programme(Naresh & Paul, 2011, pp. 7-8).

ISSN: 2362-1303 (Paper) | eISSN: 2362-1311(Online)
JOURNAL OF ADVANCED ACADEMIC RESEARCH (JAAR) January 2015
Vol. 2. No. I www.phdcentre.edu.np 28
Nepal‟s National Planning Commission Three Year Interim Plan (2007/8-2009/10) includes the
following statement: „Libraries will gradually be established in community schools. Programs
will be implemented to encourage local bodies and organizations to open and run libraries in
different educational institutes in the backward regions.‟ This is a step in the right direction, but
much robust action is required. Sadly, there is little evidence to show that even this programme
has been implemented (Naresh & Paul, 2011, pp. 7-8).
Computer Laboratory; the school has large well-equipped computer labs for the use of junior and
senior students set up by highly qualified professionals. The computer courses have been made
compulsory for students of classes III to secondary level. It is powered by Pentium, multimedia,
the necessary hardware and software, to reinforce the students' abilities with required computing
knowledge and skills.
Educational facilities are those things that enable the teacher to take out their work well and also
help the students to learn easily. Educational facilities are vital tools in the teaching and learning
process, therefore adequate provision, management and implementation these facilities
(Lawanson & Gede, 2011, p. 50).
Library is a counterpart of a school physical infrastructure. It plays a vital role in the learning
process of the school. The library is an essential component of a good school (Deepak Raj &
Tapash, 2013). The library room should be located in such a place where students are not getting
disturbed by noise (GoN, 2010).It is a useful means of storing communicable knowledge and
nobody can do much without it. A library is a repository of books and should have textbooks,
workbooks, reference books, fiction, and non-fiction books at various reading levels, reference
books oil special topics and interests and related pamphlets, clippings, pictures, maps, charts,
periodicals, etc. are placed in proper shelf (Tribhuvan University, 2002).
Laboratory is an essential part of a school. This is the place where experiments are performed
and hypothesis are tested and verified. At +2 stages, a school needs biology, physics, chemistry,
a computer laboratory (OECD , 2013c, p. 5). Mere knowledge would not be sufficient for
building the required competence in specific content area. If theory is supported by practices,
clarity could be maintained as well as psychomotor skills could be developed (OECD , 2013b).
The most fundamental problem in facilities provision is lack of policy guidelines for
infrastructural development in schools. In some schools, there are inadequate classrooms, staff
offices, laboratories and workshops, libraries, study areas while in some, these facilities are
adequately provided. This situation arises as the Nepal Governments have failed to establish
policy directives on minimum standards in relation to educational facilities (Timsina, 2008).
While some classes hold under trees and students are exposed to harsh weather conditions, others
hold in air conditioned classrooms. While some others have well equipped laboratories,
workshops, libraries and other facilities for effective teaching and learning, others have none,

ISSN: 2362-1303 (Paper) | eISSN: 2362-1311(Online)
JOURNAL OF ADVANCED ACADEMIC RESEARCH (JAAR) January 2015
Vol. 2. No. I www.phdcentre.edu.np 29
and where they exist, such facilities are poorly equipped. It therefore becomes imperative that the
different levels of government should address the issue of development and implementation of
minimum standards for facilities development and management.
This study focuses on to examine the differences between community and institutional school's
infrastructure by using researcher's observation about the facilities arranged by the school. So,
data were collected from the schools to measure the condition of school infrastructure and
students' achievement. On the basis of observation checklist survey conducted in June 2014, the
situation of existing essential and basic school infrastructure availability and management. The
main objective of this study was to analyse the role of schools infrastructure on students'
achievement of community and institutional schools of central development regions of Nepal.
This study was limited on researcher observational analysis regarding essential infrastructure and
technology (School building, computer laboratory, science laboratory, library and e-library) in
secondary and higher secondary school and their students' two subjects' achievement test means
score of central development region of Nepal.
Management of Educational Facilities
Specific educational facilities requirement of community and institution schools in terms of type
quantity and quality needs to be properly assessed to provide the operational guide for facilities
provision. A comprehensive diagnostic inventory survey of the existing stock of educational
facilities in the community or institution should be done. This will provide the educational map
or the distributional network of the existing educational facilities needed in the development of
the facilities master plan. The government should make sure that all the educational facilities
such as educational, game facilities, school building and general-purpose facilities should be
provided (Lawanson & Gede, 2011).
Educational facilities management is a systematic process of rationalizing the provision, use and
maintenance of these facilities within an educational institution to ensure their optimal utilization
and achievement of educational objectives both in the immediate and in the future given the
available resources. In other words, it a process that involves rationally: Determining which
facilities are required to achieve school goals; Providing such facilities most advantageously in
terms of resource use, Monitoring to ensure optimal use of educational facilities so provided,
Maintaining the facilities regularly to ensure their longevity and Reviewing the provision of
these facilities to ensure that it continues to meet both the changing educational needs in the
advantageous manner The activities that come under the umbrella of educational facilities
management or educational facilities planning and administration are sequentially linked.
Consequently, these activities will be recognized as stages in a chain of activities (Laboratories,
1955; Asiabaka, 2008 and Lawanson & Gede, 2011). The following are stages in sequential
order: 1) recognition of learning needs, 2) list of evaluation, 3) facilities utilization analysis, 4)
establishment of educational facilities master plan, 5) site selection and acquisition, 6)

ISSN: 2362-1303 (Paper) | eISSN: 2362-1311(Online)
JOURNAL OF ADVANCED ACADEMIC RESEARCH (JAAR) January 2015
Vol. 2. No. I www.phdcentre.edu.np 30
preparation of educational specifications and educational project design (Lawanson & Gede,
2011, pp. 50-53).
Theoretical Prospective
According to CarolCash, 1993, the Cash model, shown in Figure 1 below; the condition of the
school's educational facilities is indirectly related to student achievement because of its effect on
the attitudes of students. Well-maintained school educational facilities will send a message to
management that education is important. Conversely, poorly maintained school educational
facilities will send the message that education is not important and a negative attitude will be
passed on to the students (Linda Lemasters , 1997), (Lanham‟s ,1999) and (Al-Enezi ,
2002);(O‟Sullivan, 2006).
Figure: 1 Role of school educational facilities
Impact of Physical Facilities on Student's Achievement
According to Lyons (2002), learning is a complex activity that puts students' motivation and
physical condition to the test. It has been a long-held assumption that curriculum and teaching
are the only major parameters that have an impact on learning. However, it is becoming more
apparent that the physical conditions in schools indeed influence student achievement. Pearls
(2008) observe that design features and components of school buildings have been proven to
have a measurable influence upon student learning. Among the influential features and
components are those impacting temperature, lighting, acoustics and age. Researchers have
found a negative impact upon student performance in buildings where deficiencies in any of
these features exist. In addition, overcrowded school buildings and classrooms have been found
to be a negative influence upon the students‟ performance. Particular building feature such as air
conditioning, lighting, or presence of windows to serve as variables with which to compare
students‟ achievement. The overall impact of a school building on students can be either positive
or negative, depending upon the condition of the building. In cases where students attend school
in substandard buildings they are handicapped in their academic achievement. Correlation
Management
Principal
Learning
Environment
Students'
Achievement
School educational facilities
Parents
Teacher

ISSN: 2362-1303 (Paper) | eISSN: 2362-1311(Online)
JOURNAL OF ADVANCED ACADEMIC RESEARCH (JAAR) January 2015
Vol. 2. No. I www.phdcentre.edu.np 31
studies show a strong positive relationship between overall building conditions and student
achievement. Studies by Pearls (2008) regarding the number of students in schools as compared
with its capacity found out that overcrowded conditions have a negative influence upon students
and teachers.
In summary, the reviewed study indicates the impact of use of instructional materials and
resource utilization on student achievement. While there is abundant research on impact of these
parameters in education, there is none with samples that include Central Nepal. Understanding
the impact of instructional materials in education is important for all education stakeholders in
this development region in order to provide appropriate resources for effective and improved
academic achievement. Central Nepal has not had any documented assessments of principals and
teachers perception of resource utilization in education. The proposition examined in this study
was that at least part of the explanation for the link between school resource utilization, quality
and education outcomes is the mediating influence of instructional facilities.
Method
Descriptive and analytical research design was used and cross-sectional data were collected to
analyse comparison between status of the schools ' infrastructure management and students'
achievement test result of community and institutional schools' of Central Nepal. This study was
related to researcher observation analysis. So, only observation tool was used for the research.
The research was done on the basis of multi-stage sampling method. The targeted area of the
study was Nepal, where the research was accomplished. In the first stage cluster, random
sampling method was used, where the field i.e. Nepal was divided into five development regions.
One of them was Central Development Region (CDR) was taken as a single cluster.
In second stage, the single cluster is divided into four sub-clusters (Mountain, Hill, Valley and
Terai) on the basis of ecological belt. Furthermore, five districts were selected as a study area
among nineteen cluster i.e. nineteen districts of four ecological belts.
In third stage, the proportionate stratified random sampling method was used to select target
schools from both urban and rural areas': community and institutional in secondary and higher
secondary schools' of five districts. So, the secondary and higher secondary schools were taken
as universe. The sample size was taken as proportionately among number of 3125 (1893
Secondary and 1232 higher secondary schools) (GoN, 2012, p. 79). The selected districts were
Sindhupalchok, Kavre, Makwanpur, Kathmandu and Chitawan and 32 (1.02 percent) schools
were taken from total universe by using proportionate stratified random sampling.

ISSN: 2362-1303 (Paper) | eISSN: 2362-1311(Online)
JOURNAL OF ADVANCED ACADEMIC RESEARCH (JAAR) January 2015
Vol. 2. No. I www.phdcentre.edu.np 32
Instrumentation, Data Collection and Analysis
Observation check list and rating scale for informal discussion with principal were used as data
collection tools. Observation check list and rating scale were developed by researcher. It
consisted of five questions along with some educational facilities information required to be
filled in by the respondents. Among these questions, four were in the form of checklist; mostly
having answers liked scale the researcher was fill-up suitable information which is chick list
show.
The subject matters were about school educational facilities; library, e-library, science
laboratory, computer laboratory and students achievement test. The reliability and validity of the
instrument was maintained by seeking opinion of the subject experts, pilot study, and Cronbach's
Alpha test. The value of data Cronbach's Alpha is .085 within 36 indicators. Analysis of data
was done by using the SPSS 20. Frequency table, cross tabulation, Chi-square test were applied
to analyse the data.
Result and Discussion
This chapter presents research findings, researcher interpretation and discussion. In this study, 32
schools were taken as sample for analysis of availability of instructional facility and students'
achievement. Schools were chosen from four ecological regions; among them: 3(9.4 percent)
schools from mountain region, 9(28.1 percent) schools from hill, 13(40.6 percent) from schools
from valley and 7(21.9 percent) schools from Terai. The study investigated the role of
educational facilities availability and utilization in instructional programmes in secondary and
higher secondary schools. Analysis of subject matters in checklist form, two types of issues were
included. One type was „checklist‟ having answers in; 'Not available, Very Unsatisfactory,
Unsatisfactory, Satisfactory, and Very Satisfactory' and the other was „check list with grouping
form‟.
The research looked at factors such as;
- The adequacy of reference book in library in community and institutional schools in
Central Nepal.
- The sufficiency of e-library and their utilization in community and institutional schools in
Central Nepal.
- The availability of computer in computer laboratory and the extent of their utilization in
community and institutional schools in Central Nepal.
- The adequacy of science laboratory and their utilization in community and institutional
schools in Central Nepal.
- Level of ability in two subjects (computer and science) of students' in community and
institutional schools in Central Nepal.

ISSN: 2362-1303 (Paper) | eISSN: 2362-1311(Online)
JOURNAL OF ADVANCED ACADEMIC RESEARCH (JAAR) January 2015
Vol. 2. No. I www.phdcentre.edu.np 33
The research findings are presented using descriptive statistics.
Researcher observation data have been collected to analyze comparison between availability of
instructional facility and students' achievement test of community and institutional School of
Nepal which was on the basis of observation check list survey conducted in June 2014and
discussed as follows:
Table: 1 Condition of library
Condition of library Types of schools* Ecological region** Total Cumulativ
e Percent Communi
ty
Institution
al
Mounta
in
Hill Valley Terai
Not available Count 4 4 1 4 2 1 8
25.0 Total % 12.5 12.5 3.1 12.5 6.2 3.1 25.0
Very
Unsatisfactory1
Count 4 4 1 0 6 1 8 50.0
Total % 12.5 12.5 3.1 0.0 18.8 3.1 25.0
Unsatisfactory2
Count 0 1 0 0 1 0 1 53.1
Total % 0.0 3.1 0.0 0.0 3.1 0.0 3.1
Satisfactory3
Count 4 1 1 1 1 2 5 68.8
Total % 12.5 3.1 3.1 3.1 3.1 6.2 15.6
Very Satisfactory4 Count 4 6 0 4 3 3 10
100.0 Total % 12.5 18.8 0.0 12.5 9.4 9.4 31.2
Total Count 16 16 3 9 13 7 32
100.0 Total % 50.0 50.0 9.4 28.1 40.6 21.9 100.0
Sources: Field survey, June 2014
*No significant association P= 0.525 (2-sided), **No significant association P= 0.391(2-sided)
Above table 1 explores the status of school library with respect to school locality i.e. mountain,
hill, valley and Terai. It is evident from the chi-square results that there is no significant
difference among ecological regionsand types of schools with respect to availability of library
facility sufficiency. Against all variables no significant difference were found. School must have
provision of appropriate library facilities and sufficiency books and references books (GoN,
2010). But data shows that more than 50 percent schools' library facility is very poor condition.
1Facility is available butfewer than 1500 books are available and library room is not properly managed.
2Facility is available but 1501 to 2000 books are available and library room is not properly managed. 3Facility is available and 2001 to 2500 books are available and library room is properly managed. 4More than 2500 books are available and library room is properly managed.

ISSN: 2362-1303 (Paper) | eISSN: 2362-1311(Online)
JOURNAL OF ADVANCED ACADEMIC RESEARCH (JAAR) January 2015
Vol. 2. No. I www.phdcentre.edu.np 34
Table: 2 Condition of e-library
Availability of e-library Types of schools* Ecological region** Total Cumulative
Percent Community Institutional Mountain Hill Valley Terai
Not available
Count 13 7 2 5 8 5 20 62.5
Total % 40.6 21.9 6.2 15.6 25.0 15.6 62.5
Very
Unsatisfactory5
Count 2 1 1 1 1 0 3 71.9
Total % 6.2 3.1 3.1 3.1 3.1 0.0 9.4
Unsatisfactory6 Count 0 2 0 0 1 1 2
78.1 Total % 0.0 6.2 0.0 0.0 3.1 3.1 6.2
Satisfactory7
Count 1 5 0 3 2 1 6 96.9
Total % 3.1 15.6 0.0 9.4 6.2 3.1 18.8
Very
Satisfactory8
Count 0 1 0 0 1 0 1 100.0
Total % 0.0 3.1 0.0 0.0 3.1 0.0 3.1
Total Count 16 16 3 9 13 7 32
100.0 Total % 50.0 50.0 9.4 28.1 40.6 21.9 100.0
Sources: Field survey, June 2014
*No significant association P= 0.099 (2-sided), **No significant association P= 0.827 (2-sided)
The above table shows that no signification associationhas been found between community and
institutional schools and ecological wise schools. The data show that more than 70 percent
schools' e-library facility availability is very poor condition and more than 40 community
schools have not available modern educational facilities i.e. e-library. The learning environment
in school is considered to be primary factor for enhancing the effectiveness of modern
technology aspect (Daggett, 2008). In the same manner, the provision of educational material
also helps the teachers to make the students learn the specific objectives of the course book
(GoN, 2010). Information communication technology also include among others soft ware's
(OECD , 2013c). The application of the software requires that the school principal should be
exposed to necessary in-service training to enable them make maximum use of the
software(Asiabaka, The Need for Effective Facility Management in Schools in Nigeria, 2008).
Modern educational equipment shall be provided to each class as required (MOLJI, 2009).
Table: 3 Condition of science laboratory
5 E-library is available but not properly managed and students are not extent of their utilization.
6 E-library is available but students are not extent of their utilization.
7 E-library is available and properly managed this.
8 E-library is properly managed and students and teachers are extent of their utilization.

ISSN: 2362-1303 (Paper) | eISSN: 2362-1311(Online)
JOURNAL OF ADVANCED ACADEMIC RESEARCH (JAAR) January 2015
Vol. 2. No. I www.phdcentre.edu.np 35
Condition of Science
laboratory
Types of schools* Ecological region** Total Cumulative
Percent Community Institutional Mountain Hill Valley Terai
Not available
Count 3 5 0 3 4 1 8
25.0 % of
Total 9.4 15.6 0.0 9.4 12.5 3.1 25.0
Minimum
requirement9
Count 10 6 2 3 7 4 16
75.0 % of
Total 31.2 18.8 6.2 9.4 21.9 12.5 50.0
Maximum
requirement10
Count 3 5 1 3 2 2 8
100.0 % of
Total 9.4 15.6 3.1 9.4 6.2 6.2 25.0
Total
Count 16 16 3 9 13 7 32
100.0 % of
Total 50.0 50.0 9.4 28.1 40.6 21.9 100.0
Sources: Field survey, June 2014
*No significant association P= 0.368 (2-sided), **No significant association P= 0.794 (2-sided)
Above table examines the relationship between researcher‟s evaluations of the educational
facilities (Availability and condition of science laboratory) of selected schools. The data shows
that more than 75 percent schools' sciences laboratory availability is poor condition and more
than 25 percent schools have not available science laboratory. The result of this research shows
around 75 percent of Nepalese schools' qualities of educational facilities are still unsatisfactory
(Thapa, 2011). Similarly it can be generalized to Nepal as a whole.
Table: 4 Availability of computer in computer laboratory
Available of computers
in computer lab
Types of schools* Ecological region** Total Cumulative
Percent Community Institutional Mountain Hill Valley Terai
Not available Count 2 1 0 1 1 1 3
9.4 Total % 6.2 3.1 0.0 3.1 3.1 3.1 9.4
Less than 5 Count 2 2 0 1 2 1 4
21.9 Total % 6.2 6.2 0.0 3.1 6.2 3.1 12.5
6 to 10 Count 0 1 0 0 1 0 1
25.0 Total % 0.0 3.1 0.0 0.0 3.1 0.0 3.1
9One combine science lab; all types of physics, chemistry and biology equipments are managed in the same room.
10Three sseparate science lab;The physics lab is equipped by optical, electrical; thermo dynamical, mechanical instruments, The
chemistry lab is equipped with different types of solutions, salts and components and Biology lab is equipped by slides,
microscopes, skeletons and different specimens.

ISSN: 2362-1303 (Paper) | eISSN: 2362-1311(Online)
JOURNAL OF ADVANCED ACADEMIC RESEARCH (JAAR) January 2015
Vol. 2. No. I www.phdcentre.edu.np 36
11 to 15 Count 1 3 1 1 2 0 4
37.5 Total % 3.1 9.4 3.1 3.1 6.2 0.0 12.5
16 to 20 Count 6 0 0 3 2 1 6
56.3 Total % 18.8 0.0 0.0 9.4 6.2 3.1 18.8
More than 21 Count 5 9 2 3 5 4 14
100.0 Total % 15.6 28.1 6.2 9.4 15.6 12.5 43.8
Total Count 16 16 3 9 13 7 32
100.0 Total % 50.0 50.0 9.4 28.1 40.6 21.9 100.0
Sources: Field survey, June 2014
*No significant association P= 0.092 (2-sided), **No significant association P= 0.952 (2-sided)
The above table shows that there no signification association has been found between
community and institutional schools and ecological wise schools' available of computers in
computer lab. The data show that more than 75 percent schools' available of computers in
computer lab is good condition and only 6.2 percent community schools and 3.1 percent
institutional schools have not available computer lab.Most of the public schools they are left
behind in terms of use of modern educational equipment such as use of computers as compared
to private schools (Bhatta, 2005). Private schools spend much more on students' education
besides other expenditures made on infrastructure and physical facilities as compared to public
schools (Thapa, 2011). The study argues that private schools have managed such facilities better
than those of public schools (SMAERC, 2008).
Table: 5 Achievement test min score
Achievement test
result percent
Types of schools* Ecological region** Total Cumulative
Percent Community Institutional Mountain Hill Valley Terai
31 to 35 Count 2 0 0 1 0 1 2
6.3 Total % 6.2 0.0 0.0 3.1 0.0 3.1 6.2
36 to 40 Count 5 0 0 1 0 4 5
21.9 Total % 15.6 0.0 0.0 3.1 0.0 12.5 15.6
41 to 45 Count 7 0 2 4 1 0 7
43.8 Total % 21.9 0.0 6.2 12.5 3.1 0.0 21.9
46 to 50 Count 2 5 1 1 4 1 7
65.6 Total % 6.2 15.6 3.1 3.1 12.5 3.1 21.9
51 to 55 Count 0 11 0 2 8 1 11
100.0 Total % 0.0 34.4 0.0 6.2 25.0 3.1 34.4
Total Count 16 16 3 9 13 7 32
Total % 50.0 50.0 9.4 28.1 40.6 21.9 100.0
Sources: Field survey, June 2014

ISSN: 2362-1303 (Paper) | eISSN: 2362-1311(Online)
JOURNAL OF ADVANCED ACADEMIC RESEARCH (JAAR) January 2015
Vol. 2. No. I www.phdcentre.edu.np 37
*Significant association P=0.000(2-sided), ** Significant association P=0.010 (2-sided)
The above table shows that a significant associationhas been found between community and
institutional and ecological wise schools students' achievement test min score. According to
students' achievement in above table, wide range of students' from institutional school has got
good result in comparison to the community based school. More than 40 percentage of
community based school's students got below 45 marks achievement average score. Private
schools' performances are still unsatisfactory (Thapa, 2011). Similarly it can be generalized to
Nepal as a whole. Public schools are regularly suffering from low achievement, poor
infrastructure and facilities and weak management and regulation. Studies have shown that in
terms of students‟ cognitive development, public schools in Nepal have struggled to add value
(Caddell, 2006; Carney, 2003). Governments' educational plans have continuously failed.
Community schools are suffering from insufficient; admission, participation, retention of
students, and educational quality (Carney,2003).
Conclusion
Following conclusion was sketched on the basic of above data:
- School's educational facilities give meaning to the teaching and learning process.
- School's management of educational facilities is an integral part of the overall
management of the school.
- School's principal should carry out comprehensive assessment of the facilities to
determine areas of their need.
- It requires an integrated effort of all stakeholders who possess the expertise needed for
accurate and up-to-date assessment of all aspects of instructional facilities.
- The actualization of the goals and objectives of education require the available, most
utilization and proper management of the facilities.
- Furthermore, advances in science and technology, require that the school management
should adopt modern educational facilities management.
- Facilities provision and management will improve the quality of teaching and learning.
Acknowledgement
We would like to express my hearty gratitude to the all school principals and SMC members who
helped me a lot to mirror the truth. We are further thankful to all of friends, who showed the way
by encouraging and providing their constructive suggestions and comments to accomplish this
article. We are also thankful to PhD Centre, Kathmandu, Nepal for the supportive role to wrap
the research up.

ISSN: 2362-1303 (Paper) | eISSN: 2362-1311(Online)
JOURNAL OF ADVANCED ACADEMIC RESEARCH (JAAR) January 2015
Vol. 2. No. I www.phdcentre.edu.np 38
References
Asiabaka, D. (. (2008, 4 8). The Need for Effective Facility Management in Schools in Nigeria.
New York Science Journal, 1(2), 10-21. Retrieved Oct 10, 2014, from
http://www.sciencepub.org
Daggett, W. R. (2008). Color in an Optimum Learning Environment. International Center fo
Leadership in Education, Rexford, NY , 9.
Deepak Raj, P., & Tapash, D. (2013). Performance of Community Schools in Nepal: A Macro
Level Analysis. International Journal of Scientific & Technology, 2(7), 148-152.
Retrieved 2 15, 2015, from http://www.ijstr.org
GoN. (2010). National Framework of Child-friendly School For Quality Education. Department
of Education. Kathmandu: Ministry of Education, Government of Nepal.
GoN. (2012). Flash I Report. Department of Education. Sanothimi, Bhaktapur: Ministry of
Education,Government of Nepal.
GoN. (2014). Policies and Programmes of the Government of Nepal for Fiscal Year 2071-72
(2014-15). Rt. Hon. President, Dr. Ram Bsran Yadsv at the Meeting of the Legislature-
Parliament of the Constituent Assembly (pp. 1-15). Singh Durbar, Kathmandu:
Government of Nepal Office of the Prime Minister and Council of Ministers. Retrieved
12 29, 2014, from http://www.opmcm,gov,np
Lawanson, O. A., & Gede, N. T. (2011, November). Provision and Management of School
Facilities for the Implementation of UBE Programme. Journal of Educational and Social
Research, 1(4), 48. Retrieved Feb 5, 2013, from
http://www.mcser.org/images/stories/JESR-Special-Issues/JESR-
November2011/lawanson-olukemi-anike.pdf
MOLJI. (2009). The Right of Children to Free and Compulsory Education Act. Legislative
Department. New Delhi: The Gazette of India, Ministry of Law and Justice India.
Retrieved 6 10, 2014, from http://ssa.nic.in/rte-docs/free%20and%20compulsory.pdf
Naresh, K., & Paul, B. (2011). Library Development in Nepal: Problems and prospects. NLF
presentain in Houston at NRN Conference (pp. 118-129). Houston Texas: Nepal Library
Foundation. Retrieved Dec 10, 2014, from http://www.nepallibrary.org/NLF-
Presentation-in-Houston-at-NRN-Conference-2010
O‟Sullivan, S. (2006). A Study of the Relationship between Building Conditions and Student
Academic Achievement in Pennsylvania‟s High School. Virginia Polytechnic Institute
and State University, Educational Leadership and Policy Studies. Falls Church, Virginia:

ISSN: 2362-1303 (Paper) | eISSN: 2362-1311(Online)
JOURNAL OF ADVANCED ACADEMIC RESEARCH (JAAR) January 2015
Vol. 2. No. I www.phdcentre.edu.np 39
Virginia Polytechnic Institute and State University. Retrieved Oct 1, 2013, from
http://scholar.lib.vt.edu/theses/available/etd-08312006-
155402/unrestricted/SOSETD.pdf.pdf
OECD . (2013b). Innovative Learning Environments. paris: OECD Publishing .
OECD . (2013c). Effectiveness, Efficiency and Sufficiency: An OECD framework for a physical
learning environments module. Paris: OECD Publishing. Retrieved 1 2, 2015, from
http://www.oecd.org/edu/innovation-
education/centreforeffectivelearningenvironmentscele/LEEPFrameworkforWEB.docx
OLE Nepal. (2015 , 4 25). E-Pustakalaya. Retrieved from OLE Nepal.org:
http://olenepal.org/wp-content/uploads/2012/01/inter-school-network.png
Propst, R. (1972). The High School: The Process and the Place. New York: Educational
Facilities Laboratories. Retrieved Jan 1, 2014, from https://books.google.com.np/b
Thapa, A. (2011). Does private school competition improve public school performance? The
case of Nepal. Graduate School of Art and Science. New York: Columbia University.
Retrieved Dec 10, 2014, from
http://academiccommons.columbia.edu/download/fedora_content/download/ac:132306/C
ONTENT/Thapa_colu..
Timsina, T. P. (2008). School effectiveness with preference to the public and private schools in
Nepal. School of Education. Dhulikheal: Kathmandu University.
Tribhuvan University. (2002). School Effectiveness in Nepal: A Synthesis of Indicators.
Tribhuvan University, Department of Education. Kathmandu: Research Centre for
Educational Innovation and Development (CERID).

ISSN: 2362-1303 (Paper) | eISSN: 2362-1311(Online)
JOURNAL OF ADVANCED ACADEMIC RESEARCH (JAAR) January 2015
Vol. 2. No. I www.phdcentre.edu.np 40
Model of Entrepreneurial Success: A Review and Research Agenda
Maheshwar Prasad Yadav1
1PhD Scholar, Mewar University, Rajasthan, India
Abstract
The aim of this paper is to review the entrepreneurial models in order to identify most
widespread factors of entrepreneurial success. This study comprises descriptive cum analytical
research design. Nine models of entrepreneurial success were reviewed that led to three
important findings. The first one is the both micro and macro factors, i.e., individual and
environment contexts are necessary to build a comprehensive model of entrepreneurial success.
The second is all three types of social, financial and human capital are essential to build a
complete model that can explain entrepreneurial success in a better way. The third is the
opportunity, environment and resources played the strong role; entrepreneur, innovation,
management skills, organization and personal motivation played the moderate role while the
weak role-played by the other factors as a whole. Based on the results, the study concludes that
the recent research agenda of entrepreneurial success are: Do these factors play vital role for
entrepreneurial success in the context of developing country like Nepal? Do entrepreneurs
equipped with higher financial capital, social capital, and human capital more likely to be
successful? What financial capital, social capital, and human capital matters for entrepreneurial
success? How do financial, social, and human resources used by entrepreneurs behave and
interact?
Keywords: Entrepreneurial Success, Model, Research Agenda, Review.
Introduction
An entrepreneur assembles, coordinates and directs various factors of production namely land,
labour, capital and other materials. Entrepreneur is one who does things differently. Entrepreneur
is a decision maker, coordinator, innovator, creative destructor, social leader, information
synthesizer, and risk taker (Bhole, 2007, p. 58). The entrepreneur combines various inputs in an
innovative manner to generate value to the customer with the hope that this value will exceed the
cost of inputs. Entrepreneurs are considered to be the change agents in the socio-economic
development of any country (Bhargava, 2007, p. 31). An entrepreneur is neither a scientific
innovator nor salaried manger, who is assumed to be an opportunity seeker (Aryal, 1994, p. 36).
The word entrepreneur entered economic theory more than two centuries ago when a French

ISSN: 2362-1303 (Paper) | eISSN: 2362-1311(Online)
JOURNAL OF ADVANCED ACADEMIC RESEARCH (JAAR) January 2015
Vol. 2. No. I www.phdcentre.edu.np 41
banker, Cantillon, used this word to signify an undertaker of business (Dayal, 2007, p. 34).
Entrepreneurs are individuals or group of individuals who invest capital, organize and direct
business and industrial units. Moreover, an entrepreneur is one who combines the land of one,
the labour of others and the capital of yet another, and, thus produces a product (Khanka, 2010,
p. 2). An entrepreneur could be a trader, a technician, an educated unemployed or the like. The
major theme to all of them is the desire for breaking away from traditional ways of doing things.
Furthermore, entrepreneurs must be jacks-of-all-trades who need not excel in any one skill but
are competent in many (Lazear, 2005, p. 649). The primary implication is that individuals with
balanced skills are more likely than others to become entrepreneurs. Those who have varied
work and educational backgrounds are much more likely to start their own businesses than those
who have focused on one role at work or concentrated in one subject at school.
Entrepreneurship is the dynamic process of creating incremental wealth. Entrepreneurship is “a
process of identifying, evaluating, seizing an opportunity and bringing together the resources
necessary for success”. Entrepreneurship is a dynamic process of vision, change, and creation.
Entrepreneurship is the recognition and pursuit of opportunity without regard to the resources
you currently control, with confidence that you can succeed, with the flexibility to change course
as necessary, and with the will to rebound from setbacks (Thapa, Thulaseedharan, Joshi, &
Goswami, 2008). It is also known as the art of finding profitable solutions to the problems.
Furthermore, entrepreneurship, in broader sense, is based on sociological, psychological and
management perspectives (Rajput, 2011). In sociological prospective, entrepreneurship is related
with a particular social culture. While it flourishes in a society which has greater number of
people with psychological characteristics, that is, need for accomplishment, vision, ability to face
rejections and oppositions in psychological prospective. Management prospective of
entrepreneurship divides entrepreneurship into individual and environment contexts. This
perspective is best argued by Kuratko & Hodgetts (2002)who stated that the individual
prospective is referred to as micro factors and environment context is referred to as macro factors
of entrepreneurship or entrepreneurial success. Entrepreneurship is a way of thinking that
emphasizes opportunities over threats (Krueger, Reilly, & Carsrud, 2000).Entrepreneurship is the
breaking away from traditional ways of doing things.
The importance of human capital as a key determinant of entrepreneurial success, and propensity
to pursue entrepreneurial activities, has become a topic very much debated in the literature (
(Bates, 1990); (Schoar, 2009)).Experience is also important in determining success.
Entrepreneurial family background impacts upon the development of social and human capital
resources and affect the profitability and growth of new enterprise (Anderson & Miller, 2003, p.
17). Entrepreneurs from higher socio-economic groupings had high endowments of human
capital. Significantly, their businesses were characterized by greater profitability and growth
potential. Investments in human and social capital enhance entrepreneurial performance

ISSN: 2362-1303 (Paper) | eISSN: 2362-1311(Online)
JOURNAL OF ADVANCED ACADEMIC RESEARCH (JAAR) January 2015
Vol. 2. No. I www.phdcentre.edu.np 42
substantially (Bosma N. , Praag, Thurik, & Wit, 2002, p. 9). Likewise, almost every firm needs a
substantial financial input. The financial resources of the starting entrepreneur are therefore
important (Bosma, Praag, & Wit, 2000, p. 20). In order to have success as an entrepreneur, the
importance of communicating with relations seems to be growing (Bosma, Praag, & Wit, 2000,
p. 21). Having capabilities in this respect can be indicated as owning social capital and also in
literature increased attention is paid on the relation between social capital and entrepreneurship.
With the above backdrop, this study aims at reviewing model of entrepreneurial success in order
to identify research agenda in the days to come in the context of developing country like Nepal.
The present study emphasizes on reviewing the factors used in the models at micro and macro
perspectives and social, financial and human capital used in the models of entrepreneurial
success to identify most common factors of entrepreneurial success as a whole.
The remainder of the paper is organized as follows. Section 2 describes the review of
literature while methodology is mentioned in section 3. Section 4 incorporates discussion
and results. Section 5 summarizes the results and offers some agenda for future research.
Finally, section 6 acknowledges all whose write ups or contributions used in this study.
Model of Entrepreneurial Success
An Indigenous (Indian) model on Entrepreneurial Success
The first model reviewed for this study is of Zafar (1983)who proposed An Indigenous (Indian)
model on Entrepreneurial Success. This model argues that entrepreneurship development is
dependent on entrepreneurial traits (Et), opportunity (Op), skills (Sk), project report (Pr), finance
(F), infrastructure (If) and environment (En). Each of these factors is further divided into
variables and these variables.
This model is based on the economics and psychology of the entrepreneur and social
environment. Despite being very old model but it is built in Indian context and therefore it is
relevant to this study. This model lacks some of the fundamental micro factors such as
entrepreneurial motivation, vision, strategic planning and innovation and macro factors such as
team, entrepreneurial culture and entrepreneurial network.
Timmons Model of the Entrepreneurial Process
The second model is of Timmons (1989)who proposed Timmons Model of the Entrepreneurial
Process. The factors of this model are the entrepreneur, the founding team, the opportunity, and
the resources. Simply, Timmons model is normative. The key ingredient is the entrepreneur;
however the model recognizes the fact that the activity of entrepreneurship is too diverse to be
performed by one man and states that three different characteristics required are: the thought
man, the man of action and the front man. Further if the entrepreneur has the right team

ISSN: 2362-1303 (Paper) | eISSN: 2362-1311(Online)
JOURNAL OF ADVANCED ACADEMIC RESEARCH (JAAR) January 2015
Vol. 2. No. I www.phdcentre.edu.np 43
members, then he or she will deliberately search for opportunities and upon finding the right
opportunity the entrepreneur seeks the resources to make this opportunity a commercial success.
This model is integrated and holistic focuses on the fit and balance among the forces of
entrepreneurial success in the individual context of entrepreneurship as well as environment
context. Nevertheless, the environment context is not incorporated comprehensively as the local
cultural and network factor are not included.
General Model of Entrepreneurial Success
The third model review is of Rauch and Frese (2000) who proposed General Model of
Entrepreneurial Success. This model is based on the Giessen-Amsterdam model of
entrepreneurial success. This is an interdisciplinary model and is a comprehensive model;
however it has controversial implications if the arrows in the model are viewed. However this
model focuses on the facts that there is not success without actions and concept of action is
central to the model. Well thought strategies and tactics of action are the hurdles through which
entrepreneurs has to grow through to be successful. In other words, planning and decision
making are the key factors of success and the model assumes that the market is made up of actors
who have goals and ideas how to proceed with opportunities.
This model does not consider the effect of environment which contributes to success of the
enterprise. Hence, this model focuses more on the individual and less importance is given to
environmental context of entrepreneurship.
Wickham Model of Entrepreneurial Performance
The fourth model reviewed is of Wickham (2001), who proposed Wickham Model of
Entrepreneurial Performance. According to this model the entrepreneurial performance
improves if the entrepreneur has better know-how of the industry in which the firm operates in,
management and interpersonal skills and has entrepreneurial motivation to make the firm
successful. This model considers administrative and interpersonal skills as key factors of
improvement of the entrepreneurial performance and ignores the commonly discussed attributes
of entrepreneur: innovation, entrepreneurial mindset and etc. However, the entrepreneurial
motivation is considered. Hence, this model does not include micro factors comprehensively.
Similarly, from macro factors perspective, the model includes only one macro factor. Therefore,
this model is not a comprehensive model to be used as benchmark to develop the best model for
entrepreneurial success.
The Entrepreneurial Capital Model
The fifth model reviewed is of Erikoson (2002)who proposed the Entrepreneurial Capital Model
and this model argues that performance of an entrepreneurial venture is linked to entrepreneurial
competence, commitment and motivation. The competence is referred to the ability of the

ISSN: 2362-1303 (Paper) | eISSN: 2362-1311(Online)
JOURNAL OF ADVANCED ACADEMIC RESEARCH (JAAR) January 2015
Vol. 2. No. I www.phdcentre.edu.np 44
entrepreneur to identify and select the right opportunity and level of commitment entrepreneur
shows toward the venture. The model also argues that level of entrepreneurial motivation is also
important for the healthy performance of the venture. In other words, key success factors are
based on the individual context and environment context is not taken into consideration.
Hisrich and Peters Model of Entrepreneurial Process
The sixth model reviewed is of Hisrich and Peters (2002) who proposed Model of
Entrepreneurial Process (Rajput, 2011). It is an interdisciplinary model, as it takes into
consideration most area that has been studied in entrepreneurship research and considers the
personal, sociological and environmental factors. Further each factor is represented by relevant
variables. The model has four stages: innovation, triggering event, implementation and growth.
Each stage requires certain inputs and variables and some of the variable are required at more
than one stages. However, this model clearly has some controversial implications if one looks at
interactions of the entrepreneurial factors. For example, commitment is not just needed at the
triggering event state but it is required at all stages.
An Integrative Model of Entrepreneurship
The seventh model reviewed is the very famous model of Morris et al. (2005) and it is called An
Integrative Model of Entrepreneurship (Rajput, 2011). This is based on the concept that
entrepreneurship is a result of interactions among a number of factors: process, entrepreneur,
environment, business concept, resources and organizational context. This model uses a layer
approach to explain each factor. The first layer identifies six critical factors of entrepreneurship
and each factor represents a collectivity exhaustive set of factors which are important for the
occurrence of an entrepreneurial event.
This model is comprehensive but it has limited depth. For example, the factor of entrepreneur is
not fully explored and it is just included in the model. In other words, this model is exactly
opposite to the Timmons model of the Entrepreneurial Process- entrepreneur dominance.
The Conceptual Model of Entrepreneurial Success
The eight model reviewed is of Kumar (2007) who proposed the Conceptual Model of
EntrepreneurialSuccess. Thismodel is based on Bilijan (2002) position explaining entrepreneurial
success that would require three phenomena: willingness to start enterprise, identifying
opportunities and success of the enterprise.The willingness is to start an enterprise is determined
by the pulls and pushes that an individual face. The push factors are: job dissatisfaction, job loss,
unemployment, career setbacks, saturation in the existing market, language, immigrant status,
deprivation, low family income and lack of flexibility in the previous job. Pull is based on the
amount of opportunities which surrounds the entrepreneur. Identification of an opportunity is
attributed to the creativity of a person to identify the right opportunity. Creation of an enterprise
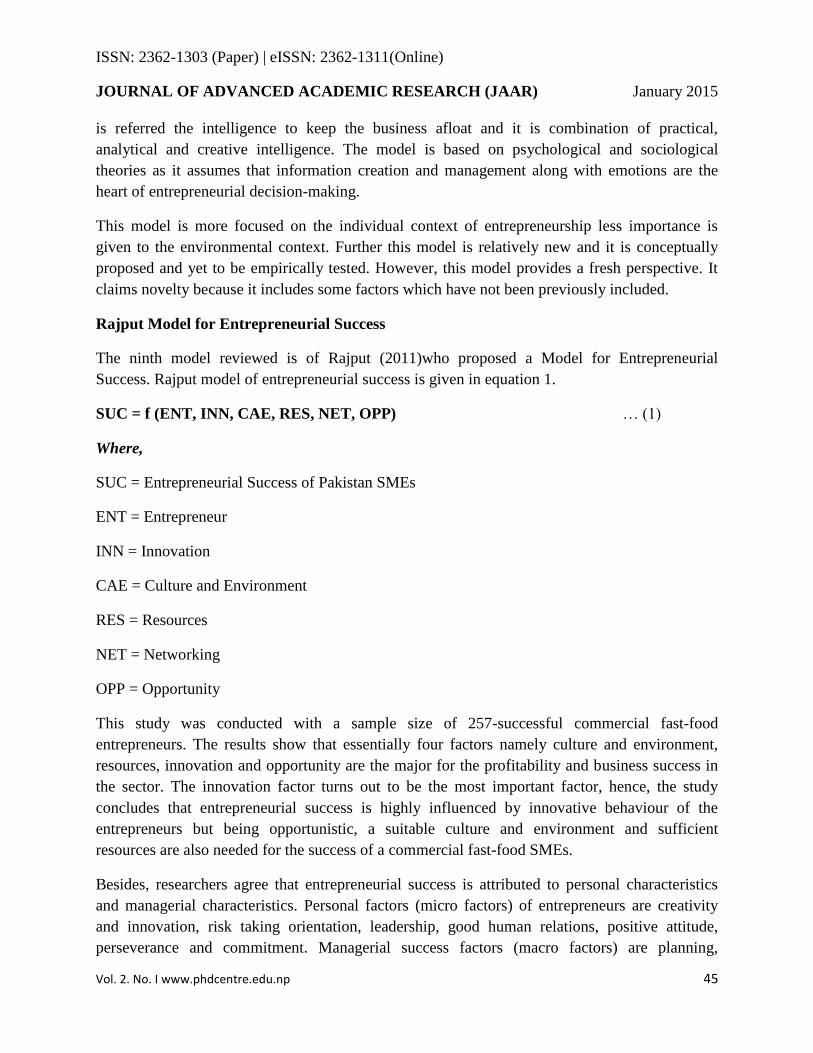
ISSN: 2362-1303 (Paper) | eISSN: 2362-1311(Online)
JOURNAL OF ADVANCED ACADEMIC RESEARCH (JAAR) January 2015
Vol. 2. No. I www.phdcentre.edu.np 45
is referred the intelligence to keep the business afloat and it is combination of practical,
analytical and creative intelligence. The model is based on psychological and sociological
theories as it assumes that information creation and management along with emotions are the
heart of entrepreneurial decision-making.
This model is more focused on the individual context of entrepreneurship less importance is
given to the environmental context. Further this model is relatively new and it is conceptually
proposed and yet to be empirically tested. However, this model provides a fresh perspective. It
claims novelty because it includes some factors which have not been previously included.
Rajput Model for Entrepreneurial Success
The ninth model reviewed is of Rajput (2011)who proposed a Model for Entrepreneurial
Success. Rajput model of entrepreneurial success is given in equation 1.
SUC = f (ENT, INN, CAE, RES, NET, OPP) … (1)
Where,
SUC = Entrepreneurial Success of Pakistan SMEs
ENT = Entrepreneur
INN = Innovation
CAE = Culture and Environment
RES = Resources
NET = Networking
OPP = Opportunity
This study was conducted with a sample size of 257-successful commercial fast-food
entrepreneurs. The results show that essentially four factors namely culture and environment,
resources, innovation and opportunity are the major for the profitability and business success in
the sector. The innovation factor turns out to be the most important factor, hence, the study
concludes that entrepreneurial success is highly influenced by innovative behaviour of the
entrepreneurs but being opportunistic, a suitable culture and environment and sufficient
resources are also needed for the success of a commercial fast-food SMEs.
Besides, researchers agree that entrepreneurial success is attributed to personal characteristics
and managerial characteristics. Personal factors (micro factors) of entrepreneurs are creativity
and innovation, risk taking orientation, leadership, good human relations, positive attitude,
perseverance and commitment. Managerial success factors (macro factors) are planning,
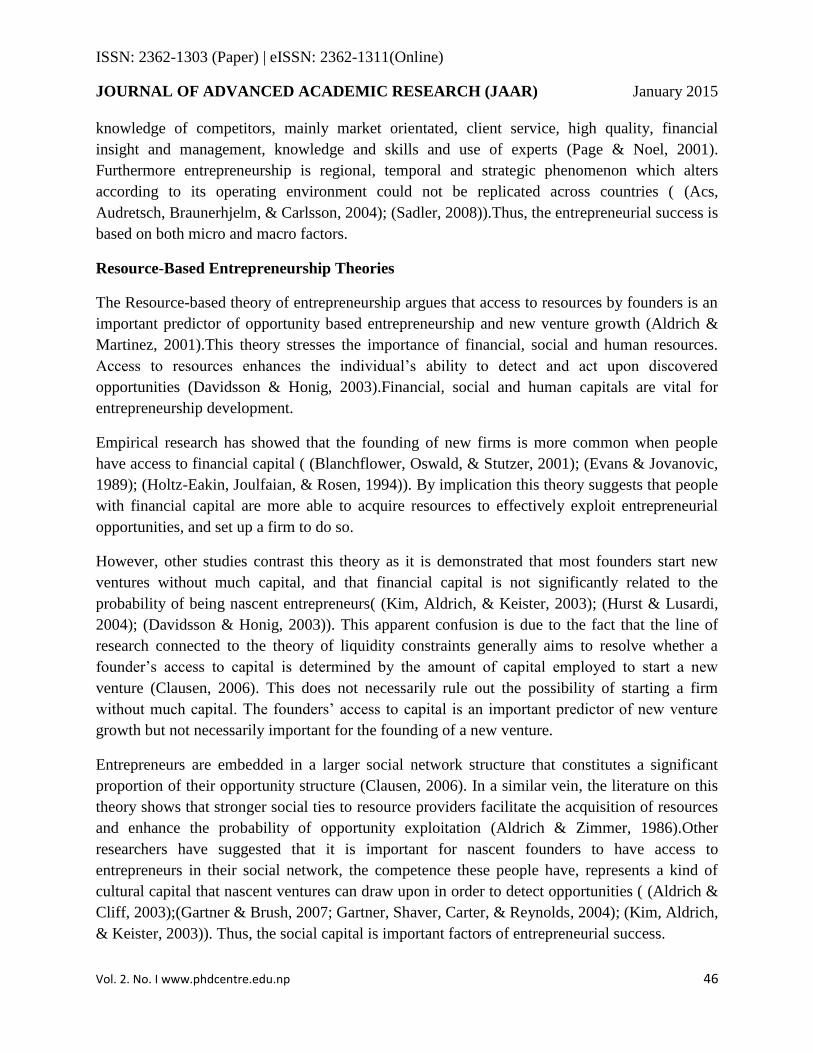
ISSN: 2362-1303 (Paper) | eISSN: 2362-1311(Online)
JOURNAL OF ADVANCED ACADEMIC RESEARCH (JAAR) January 2015
Vol. 2. No. I www.phdcentre.edu.np 46
knowledge of competitors, mainly market orientated, client service, high quality, financial
insight and management, knowledge and skills and use of experts (Page & Noel, 2001).
Furthermore entrepreneurship is regional, temporal and strategic phenomenon which alters
according to its operating environment could not be replicated across countries ( (Acs,
Audretsch, Braunerhjelm, & Carlsson, 2004); (Sadler, 2008)).Thus, the entrepreneurial success is
based on both micro and macro factors.
Resource-Based Entrepreneurship Theories
The Resource-based theory of entrepreneurship argues that access to resources by founders is an
important predictor of opportunity based entrepreneurship and new venture growth (Aldrich &
Martinez, 2001).This theory stresses the importance of financial, social and human resources.
Access to resources enhances the individual‟s ability to detect and act upon discovered
opportunities (Davidsson & Honig, 2003).Financial, social and human capitals are vital for
entrepreneurship development.
Empirical research has showed that the founding of new firms is more common when people
have access to financial capital ( (Blanchflower, Oswald, & Stutzer, 2001); (Evans & Jovanovic,
1989); (Holtz-Eakin, Joulfaian, & Rosen, 1994)). By implication this theory suggests that people
with financial capital are more able to acquire resources to effectively exploit entrepreneurial
opportunities, and set up a firm to do so.
However, other studies contrast this theory as it is demonstrated that most founders start new
ventures without much capital, and that financial capital is not significantly related to the
probability of being nascent entrepreneurs( (Kim, Aldrich, & Keister, 2003); (Hurst & Lusardi,
2004); (Davidsson & Honig, 2003)). This apparent confusion is due to the fact that the line of
research connected to the theory of liquidity constraints generally aims to resolve whether a
founder‟s access to capital is determined by the amount of capital employed to start a new
venture (Clausen, 2006). This does not necessarily rule out the possibility of starting a firm
without much capital. The founders‟ access to capital is an important predictor of new venture
growth but not necessarily important for the founding of a new venture.
Entrepreneurs are embedded in a larger social network structure that constitutes a significant
proportion of their opportunity structure (Clausen, 2006). In a similar vein, the literature on this
theory shows that stronger social ties to resource providers facilitate the acquisition of resources
and enhance the probability of opportunity exploitation (Aldrich & Zimmer, 1986).Other
researchers have suggested that it is important for nascent founders to have access to
entrepreneurs in their social network, the competence these people have, represents a kind of
cultural capital that nascent ventures can draw upon in order to detect opportunities ( (Aldrich &
Cliff, 2003);(Gartner & Brush, 2007; Gartner, Shaver, Carter, & Reynolds, 2004); (Kim, Aldrich,
& Keister, 2003)). Thus, the social capital is important factors of entrepreneurial success.

ISSN: 2362-1303 (Paper) | eISSN: 2362-1311(Online)
JOURNAL OF ADVANCED ACADEMIC RESEARCH (JAAR) January 2015
Vol. 2. No. I www.phdcentre.edu.np 47
Likewise, underlying the human capital entrepreneurship theory are two factors, education and
experience (Becker, 1975). The knowledge gained from education and experience represents a
resource that is heterogeneously distributed across individuals and in effect central to
understanding differences in opportunity identification and exploitation [ (Anderson & Miller,
2003); (Chandler & Hanks, 1998); (Gartner, Shaver, Carter, &Reynolds, 2004); (Shane &
Venkataraman, 2000)].Empirical studies show that human capital factors are positively related to
becoming an ascent entrepreneur(Kim, Aldrich, & Keister, 2003); (Davidsson & Honig, 2003);
(Korunka, Frank, Lueger, & Mugler, 2003);increase opportunity recognition and even
entrepreneurial success ( (Anderson & Miller, 2003); (Davidsson & Honig, 2003)). Therefore,
human capital is vital factor of entrepreneurial success.
The resource-based entrepreneurship theories synthesizes theoretical insights from Austrian
economics, Penrose‟s (1959) resources approach, and modern resource-based theory, focusing
on the essential subjectivity of the entrepreneurial process(Foss, Kiein, Kor, & Mahoney, 2008,
p. 73). This new synthesis describes entrepreneurship as a creative team act in which
heterogeneous managerial mental models interact to create and arrange resources to produce a
collective output that is creatively superior to individual output. This study review nine models
of entrepreneurial success to identify most widespread factors of entrepreneurial success taking
resource based entrepreneurship theories into account.
Method
This study comprises descriptive cum analytical research design and based on literature review.
The literatures on models of entrepreneurial success were collected by literature survey. Nine
models of entrepreneurial success have been reviewed to achieve objectives of this study .The
list of models of entrepreneurial success selected for the study is given in Table-1.
Table 1: List Models of Entrepreneurial Success Selected for the Study
SN Model Author(s)
1 Indian Model of Entrepreneurship Zafar (1983)
2 Timmons Model of the Entrepreneurial Process Timmons (1989)
3 General Model of Entrepreneurial Success Rauch and Frese (2000)
4 Wickham Model of Entrepreneurial Performance Wickham (2001)
5 The Entrepreneurial Capital Model Erikoson (2002)
6 Model of Entrepreneurial Process Hisrich& Peters (2002)
7 The Integrative Model of Entrepreneurship Morris et al. (2005)

ISSN: 2362-1303 (Paper) | eISSN: 2362-1311(Online)
JOURNAL OF ADVANCED ACADEMIC RESEARCH (JAAR) January 2015
Vol. 2. No. I www.phdcentre.edu.np 48
8 The Conceptual Model of Entrepreneurial Success Kumar (2007)
9 Rajput Model of Entrepreneurial Success Rajput (2011)
Moreover, the simple statistical techniques of analysis such as table, frequency distribution,
percentage and mode were employed in this study. The recent research agenda on entrepreneurial
success was determined through analyzing the factors used in the models reviewed at individual
and environmental perspectives.
Result and discussion
Entrepreneurship in general is the phenomena to capitalize on identified opportunities or creation
of new opportunities through innovation. Terjesen, Hessels, & Li (2013) analyzed 259 articles
published in 21 leading journals from 1989 to 2010 found the heterogeneous nature of
entrepreneurship across countries and its role, among others, in explaining outcomes at firm
(e.g., financial and export performance) and country (e.g., economic growth).
Entrepreneurial success is attributed to personal and managerial characteristics. Thapa,
Thulaseedharan, Joshi, & Goswami, (2008) found that among many socio-economic and
motivational factors, size of initial investment, number of workers, family business and
promising demand of product/services are some of the major determinants of street
entrepreneurial success. Lazear (2005) presented that entrepreneurs must be jacks-of-all-trades
who need not excel in any one skill but are competent in many.
Personal factors (micro factors) of entrepreneurs are creativity and innovation, risk taking
orientation, leadership, good human relations, positive attitude, perseverance and commitment.
Micro factors focus on individual. Some of micro factors of entrepreneurial success identified in
others countries are entrepreneurial values, managerial skills and interpersonal skills. Managerial
factors (macro factors) are planning, knowledge of competitors, mainly market orientated client
service, high quality, financial insight and management, knowledge and skills and use of experts
(Page & Noel, 2001). Macro factors determine overall environment within which enterprise
operates. These factors provide opportunities, threats, information affecting all entrepreneurs
within the environment.
Chandan &Junejo (2009) listed these factors as socio-demographics, markets, culture, economic,
political, legal, productive, technological, infrastructure and other physical factor of particular
environment. Furthermore, these factors are beyond control of an entrepreneur. However,
Blanchflower & Oswald (1998) stated that consistent with the existence of capital constraints on
potential entrepreneurs, the estimates imply that the probability of self-employment depends
positively upon whether the individual ever received an inheritance or gift. On the other hand,
Roomi (2011) confirms that women entrepreneurs‟ personal resources and social capital have a
significant role in their business growth. Further, it reveals that the moral support of immediate

ISSN: 2362-1303 (Paper) | eISSN: 2362-1311(Online)
JOURNAL OF ADVANCED ACADEMIC RESEARCH (JAAR) January 2015
Vol. 2. No. I www.phdcentre.edu.np 49
family, independent mobility and being allowed to meet with men play a decisive role in the
sales and employment growth of women-owned enterprises in an Islamic country such as
Pakistan. Likewise, Thapa, Thulaseedharan, Joshi, & Goswami (2008)also summarized that the
entrepreneurs with higher education and experiences have greater chances of success. Human
capital that comprises education and experience is important factors f entrepreneurial success. It
is similar to human capital theory of entrepreneurship.
Furthermore, the nine most acknowledged models of entrepreneurship were identified the diverse
factors for entrepreneurial success. The Indigenous (Indian) Model on Entrepreneurial Success
by Zafar (1983) argues that entrepreneurship development is dependent on entrepreneurial traits
(Et), opportunity (Op), skills (Sk), project report (Pr), finance (F), infrastructure (If) and
environment (En). Likewise, the Model of the Entrepreneurial Process by Timmons (1989)
showed the entrepreneur, the founding team, the opportunity, and the resources as that the factors
for entrepreneurial success. Cagetti & Nardi (2006) constructs and calibrates a parsimonious
model of occupational choice that allows for entrepreneurial entry, exit, and investment decisions
in the presence of borrowing constraints. At the aggregate level, more restrictive borrowing
constraints generate less wealth concentration and reduce average firm size, aggregate capital,
and the fraction of entrepreneurs
Moreover, the General Model of Entrepreneurial Success by Rauch and Frese (2000) comprised
that planning and decision making are the key factors of success. Similarly, Wickham Model of
Entrepreneurial Performance consisted of better know-how of the industry, management and
interpersonal skills and entrepreneurial motivation to make the firm successful.
The Entrepreneurial Capital Model of Erikoson (2002) argues that performance of an
entrepreneurial venture is linked to entrepreneurial competence, commitment and motivation.
Likewise, Hisrich and Peters (2002) Model of Entrepreneurial Process is an interdisciplinary
model. The model showed that entrepreneurship research considers the personal, sociological
and environmental factors.
The model by Morris et al. (2005) is An Integrative Model of Entrepreneurship. This is based on
the concept that entrepreneurship is a result of interactions among a number of factors: process,
entrepreneur, environment, business concept, resources and organizational context. This model
uses a layer approach to explain each factor. The first layer identifies six critical factors of
entrepreneurship and each factor represents a collectivity exhaustive set of factors which are
important for the occurrence of an entrepreneurial event.
The Conceptual Model of Entrepreneurial Success of Kumar (2007) is based on Bilijan (2002)
position that entrepreneurial success would require explaining three phenomena: willingness to
start enterprise, identifying opportunities and success of the enterprise. The model is based on
psychological and sociological theories as it assumes that information creation and management

ISSN: 2362-1303 (Paper) | eISSN: 2362-1311(Online)
JOURNAL OF ADVANCED ACADEMIC RESEARCH (JAAR) January 2015
Vol. 2. No. I www.phdcentre.edu.np 50
along with emotions are the heart of entrepreneurial decision-making. This model is more
focused on the individual context of entrepreneurship less importance is given to the
environmental context. Likewise, Rajput(2011) Modelof Entrepreneurial Success showed that
essentially four factors namely culture and environment, resources, innovation and opportunity
are the major factors of the profitability and business success in the sector.
The models reviewed and discussed show that both types of factors: micro and macro, i.e.,
individual and environment contexts are important for business success as shown in Table 2.
Table 2: Summary of Factors used in Models of Entrepreneurial Success
SN Model Author(s) Individual Context Environmental
Context
1 Indian Model of
Entrepreneurship
Zafar
(1983)
Entrepreneurial traits,
opportunity, Skills and
Project report
Entrepreneurship
development, Finance,
Infrastructure and
Environment
2 Timmons Model of the
Entrepreneurial Process
Timmons
(1989)
Opportunity and The
team Resources
3 General Model of
Entrepreneurial Success
Rauch and
Frese
(2000)
Personality and Goals
Human Capital,
Environment and
Strategies
4
Wickham Model of
Entrepreneurial
Performance
Wickham
(2001)
Personal motivation,
Management skills and
People skills
Industry knowledge
5 The Entrepreneurial
Capital Model
Erikoson
(2002)
Opportunity, Ability
and Motivation
6 Model of
Entrepreneurial Process
Hisrich&
Peters
(2002)
Innovation,
Opportunity, Personal
motivation and
Management Skills
Business Planning
Organization,
Environment, and
Resources
7 The Integrative Model
of Entrepreneurship
Morris et
al. (2005) Entrepreneur, Concept
Organization,
Environment and
resources, and The
process
8
The Conceptual Model
of Entrepreneurial
Success
Kumar
(2007)
Willingness to start
enterprise and
Opportunity
identification
Success of enterprise
9 Rajput Model of Rajput Entrepreneur, Culture & environment,

ISSN: 2362-1303 (Paper) | eISSN: 2362-1311(Online)
JOURNAL OF ADVANCED ACADEMIC RESEARCH (JAAR) January 2015
Vol. 2. No. I www.phdcentre.edu.np 51
Entrepreneurial Success (2011) Innovation and
Network
Opportunity and
Resources
There are nine studies on model of entrepreneurial success reviewed in this study.The models
reviewed and discussed show that both types of factors: micro and macro, i.e., individual and
environment contexts are necessary to build a comprehensive model. Therefore, it can be argued
that neither the micro factors alone nor macro factors can explain entrepreneurial success. Hence,
the root cause of success may lie in the combination of different micro and macro factors within
which an enterprise operates.
On the other hand, it would be worthwhile to see the factors employed in the models fall in
which category of capital among social, financial and human capitals as well as its focus in
construction of model of entrepreneurial success. Table 3 shows the classification of factors of
entrepreneurial success into social, financial and human capital.
Table 3: Classification of Factors of Entrepreneurial Success into Social, Financial and
Human Capital
S
N Model Author(s)
Social
Capital
Financial
Capital
Human
Capital
Others
1
Indian Model
of
Entrepreneurs
hip
Zafar
(1983)
Entrepreneurs
hip
development
and
Environment
Finance,
Infrastruct
ure
Entrepreneurial
traits, Skills
and project
report
Opportunity
2
Timmons
Model of the
Entrepreneuri
al Process
Timmons
(1989)
Resources The team
Opportunity
3
General
Model of
Entrepreneuri
al Success
Rauch
and Frese
(2000)
Environment Human
Capital,
Personality and
Goals
Strategies
4
Wickham
Model of
Entrepreneuri
al
Performance
Wickham
(2001)
Personal
motivation,
Management
skills and
People skills,
Industry
knowledge
5 The Erikoson Ability and Opportunity

ISSN: 2362-1303 (Paper) | eISSN: 2362-1311(Online)
JOURNAL OF ADVANCED ACADEMIC RESEARCH (JAAR) January 2015
Vol. 2. No. I www.phdcentre.edu.np 52
Entrepreneuri
al Capital
Model
(2002) Motivation
6
Model of
Entrepreneuri
al Process
Hisrich&
Peters
(2002)
Environment Resources Personal
motivation and
Management
Skills,
Innovation,
Business
Planning
Opportunity,
Organization
7
The
Integrative
Model of
Entrepreneurs
hip
Morris et
al. (2005)
Environment Resources Entrepreneur,
Concept Organization
and The
process
8
The
Conceptual
Model of
Entrepreneuri
al Success
Kumar
(2007)
Willingness to
start enterprise,
Opportunity
identification
Success of
enterprise
9
Rajput Model
of
Entrepreneuri
al Success
Rajput
(2011)
Network,
Culture,
environment,
Resources Entrepreneur,
Innovation Opportunity
Based on the review and discussion on the models of entrepreneurial success, the models show
that all three types of social, financial and human capital along with some other external factors
are necessary to build a comprehensive model. However, the models comprise large number of
human capital while less number of social and financial capital. It means that these models focus
human capital at lager extent while less focused on social and financial capital. Viewed in this
perspective, it can be argued that combination of these capitals in a model can explain
entrepreneurial success. Hence, the actual root cause of success may lie in the combination of
different factors within which an enterprise operates.
Likewise, it is very much sensible to identify most common factors of entrepreneurial success.
Based on the review of acclaimed nine models of entrepreneurial success, the most widespread
factors of entrepreneurial success are given in Table 4. The widespread factors of entrepreneurial
success were identified through frequency distribution of the uses of the factors of these models.

ISSN: 2362-1303 (Paper) | eISSN: 2362-1311(Online)
JOURNAL OF ADVANCED ACADEMIC RESEARCH (JAAR) January 2015
Vol. 2. No. I www.phdcentre.edu.np 53
Table 4: Most Widespread Factors of Entrepreneurial Success
SN Factors of Entrepreneurial Success Total Frequency Percentage
1 Opportunity 6 66.67
2 Environment 5 55.56
3 Resources 4 44.44
4 Entrepreneur 2 22.22
5 Innovation 2 22.22
6 Management Skills 2 22.22
7 Organization 2 22.22
8 Personal motivation 2 22.22
9 Ability and Motivation 1 11.11
10 Business Planning 1 11.11
11 Concept 1 11.11
12 Culture 1 11.11
13 Entrepreneurial traits 1 11.11
14 Entrepreneurship development 1 11.11
15 Finance 1 11.11
16 Goals 1 11.11
17 Human Capital 1 11.11
18 Industry knowledge 1 11.11
19 Infrastructure 1 11.11
20 Network 1 11.11
21 People skills 1 11.11
22 Personality 1 11.11
23 Skills and Project report 1 11.11
24 Strategies 1 11.11
25 Success of enterprise 1 11.11
26 The process 1 11.11
27 The team 1 11.11
28 Willingness to start enterprise 1 11.11
The frequency table shows that a most repeated (mode) factor of entrepreneurial success is
opportunity. Six out of nine (66.67 percent) models are highlighted its prominent role for
entrepreneurial success. Likewise, environment and resource are also important factors of
entrepreneurial success. There are 55.56 percent and 44.44 percent of models revealed that
environment and resource as vital factors respectively. On the other hand, entrepreneur,
innovation, management skills, organization, and personal motivation are moderately important
factors of entrepreneurial success. Two out of nine models included these factors as the vital one.
The rest 20 factors are less important factors of entrepreneurial success as only 11.11 percent
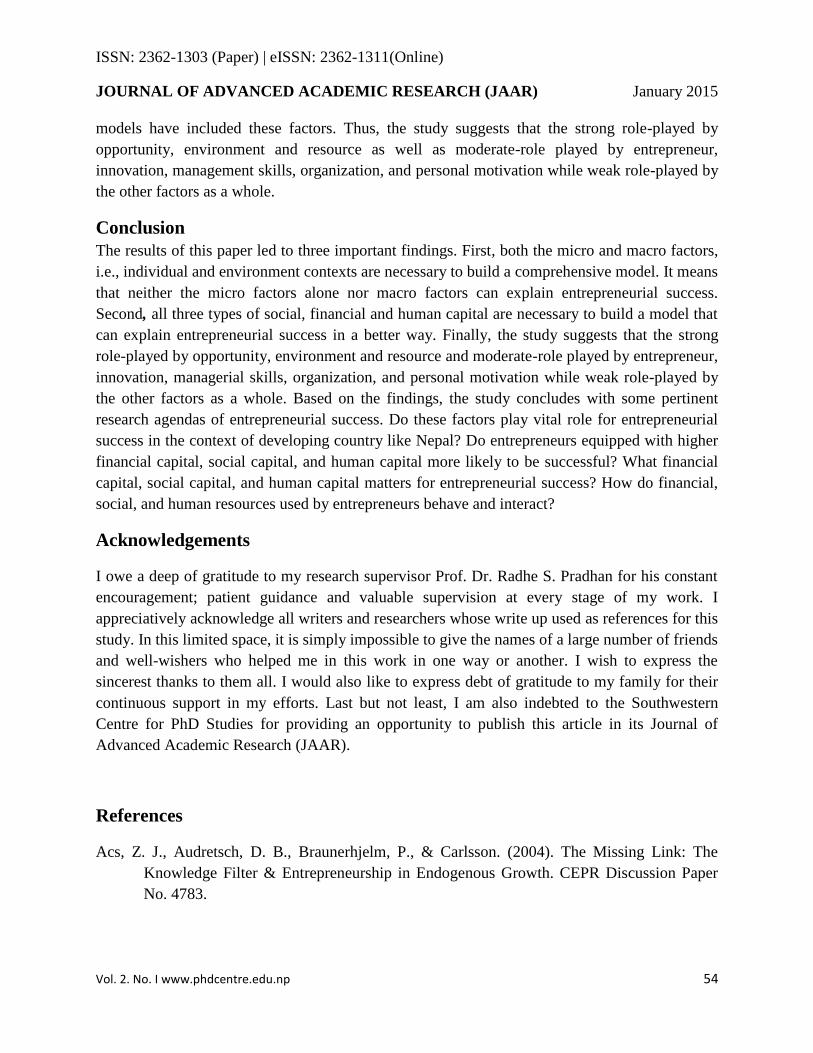
ISSN: 2362-1303 (Paper) | eISSN: 2362-1311(Online)
JOURNAL OF ADVANCED ACADEMIC RESEARCH (JAAR) January 2015
Vol. 2. No. I www.phdcentre.edu.np 54
models have included these factors. Thus, the study suggests that the strong role-played by
opportunity, environment and resource as well as moderate-role played by entrepreneur,
innovation, management skills, organization, and personal motivation while weak role-played by
the other factors as a whole.
Conclusion
The results of this paper led to three important findings. First, both the micro and macro factors,
i.e., individual and environment contexts are necessary to build a comprehensive model. It means
that neither the micro factors alone nor macro factors can explain entrepreneurial success.
Second, all three types of social, financial and human capital are necessary to build a model that
can explain entrepreneurial success in a better way. Finally, the study suggests that the strong
role-played by opportunity, environment and resource and moderate-role played by entrepreneur,
innovation, managerial skills, organization, and personal motivation while weak role-played by
the other factors as a whole. Based on the findings, the study concludes with some pertinent
research agendas of entrepreneurial success. Do these factors play vital role for entrepreneurial
success in the context of developing country like Nepal? Do entrepreneurs equipped with higher
financial capital, social capital, and human capital more likely to be successful? What financial
capital, social capital, and human capital matters for entrepreneurial success? How do financial,
social, and human resources used by entrepreneurs behave and interact?
Acknowledgements
I owe a deep of gratitude to my research supervisor Prof. Dr. Radhe S. Pradhan for his constant
encouragement; patient guidance and valuable supervision at every stage of my work. I
appreciatively acknowledge all writers and researchers whose write up used as references for this
study. In this limited space, it is simply impossible to give the names of a large number of friends
and well-wishers who helped me in this work in one way or another. I wish to express the
sincerest thanks to them all. I would also like to express debt of gratitude to my family for their
continuous support in my efforts. Last but not least, I am also indebted to the Southwestern
Centre for PhD Studies for providing an opportunity to publish this article in its Journal of
Advanced Academic Research (JAAR).
References
Acs, Z. J., Audretsch, D. B., Braunerhjelm, P., & Carlsson. (2004). The Missing Link: The
Knowledge Filter & Entrepreneurship in Endogenous Growth. CEPR Discussion Paper
No. 4783.

ISSN: 2362-1303 (Paper) | eISSN: 2362-1311(Online)
JOURNAL OF ADVANCED ACADEMIC RESEARCH (JAAR) January 2015
Vol. 2. No. I www.phdcentre.edu.np 55
Aldrich, H., & Cliff, J. (2003). The pervasive effects of family on entrepreneurship: toward a
family embeddedness perspective. Journal of Business Venturing, 18, 573-596.
Aldrich, H., & Martinez, M. (2001). Many are called, but few are chosen: An Evolutionary
Perspective for the Study of Entrepreneurship. Entrepreneurship Theory and Practice, 25
(2), 41-56.
Aldrich, H., & Zimmer. (1986). Entrepreneurship through Social Networks. In D. Sexton, & R.
Smulor, The Art and Science of Entrepreneurship (pp. 3-23). New York: Ballinger.
Anderson, A., & Miller, C. (2003). Class matters: human and social capital in the entrepreneurial
process. The Journal of Socio-Economics, 32, 17-36.
Aryal, B. R. (1994). Entrepreneurship Development Programmes in Nepal: An Overview. The
Nepalese Management Review, X(1), 36-40.
Bates, T. (1990). Entrepreneur Human Capital Inputs and Small Business Longevity . Review of
Economics and Statistics, 72, 552-559.
Becker. (1975). Human Capital . Chicago, IL: Chicago University Press.
Bhargava, S. (2007). Towards Entrepreneurship Development in the 21st Century. In S.
Bhargava (Ed.), Developmental Aspects of Entrepreneurship (pp. 21-33). New Delhi,
India: Response Books: Business Books from SAGE.
Bhole, L. M. (2007). The Evolution of the Concept of Entrepreneurship. In S. Bhargava,
Developmental Aspects of Entrepreneurship (pp. 44-69). New Delhi, India: Sage
Publication Asia-Pacific Pvt. Ltd.
Bilijan, A. (2002). Entrepreneurship under difficult circumstances: factors hindering SME
growth in the Republic of Macedonia. South-East Europe Review, 109-122.
Blanchflower, D. G., & Oswald, A. J. (1998, January ). What Makes an Entrepreneur? Journal of
Labor Economics, 16(1), 26-60.
Blanchflower, D., Oswald, A., & Stutzer, A. (2001). Latent entrepreneurship across nations? .
European Economic Review, 45, 680-691.
Bosma, N., Praag, M. V., & Wit, G. d. (2000). Determinants of Successful Entrepreneurship:
RESEARCH REPORT 0002/E. Zoetermeer, The Netherlands: EIM, SCientific AnaLysis
of Entrepreneurship and SMEs (ACALES).

ISSN: 2362-1303 (Paper) | eISSN: 2362-1311(Online)
JOURNAL OF ADVANCED ACADEMIC RESEARCH (JAAR) January 2015
Vol. 2. No. I www.phdcentre.edu.np 56
Bosma, N., Praag, M. v., Thurik, R., & Wit, G. d. (2002, March). The Value of Human and
Social Capital Investments for the Business Performance of Startups. SCALES
(Scientific AnaLysis of Entrepreneurship and SMEs), 1-11.
Cagetti, M., & Nardi, M. D. (2006, October ). Entrepreneurship, Frictions, and Wealth. Journal
of Political Economy, 114(5), 835-870.
Chandan, L. R., & Junejo, M. A. (2009). Strategies for developing the success of small medium
enterprises in Pakistan . International Journal of Business & Management, 14(6), 23-46.
Chandler, G., & Hanks, S. (1998). An examination of the substitutability of founder‟s human and
financial capital in emerging business ventures. Journal of Business Venturing, 13, 353-
369.
Clausen, T. (2006). Who identifies and Exploits entrepreneurial opportunities. Retrieved from
www.ccsr.ac.uk
Davidsson, P., & Honig, B. (2003). The role of social and human capital among nascent
entrepreneurs. Journal of Business Venturing, 18(3), 301-331.
Dayal, I. (2007). Towards Developing Entrepreneurship and Building Entrepreneurial
Organizations. In S. Bhargava (Ed.), Developmental Aspects of Entrepreneurship (pp.
34-43). New Delhi, India: Response Books: Business Books from SAGE.
Erikoson, T. (2002). The Joint Influence of Interaction History and Time Horizon on Venture-
Capitalist/New-Venture Hide . Abstract College Entrepreneurship Research Conference
(BCERC) Frontiers of Entrepreneurship Research 2007.
Evans, D., & Jovanovic, B. (1989). An Estimated Model of Entrepreneurial Choice under
Liquidity Constraints. The Journal of Political Economy, 97, 808-827.
Foss, N. J., Kiein, P. G., Kor, Y. Y., & Mahoney, J. T. (2008). Entrepreneurship, Subjectivism,
and The Resource-Based View: Toward a New Synthesis. Strategic Entrepreneurship
Journal, 2, 73–94.
Gartner, W., & Brush, C. (2007). Entrepreneurship as organizing: Emergence, newness and
transformation. Praeger perspectives on entrepreneurship, 3, 1-20.
Gartner, W., Shaver, K., Carter, N., & Reynolds, P. (2004). Handbook of entrepreneurial
dynamics. Thousand Oaks, CA: Sage Publications.
Holtz-Eakin, D., Joulfaian, D., & Rosen, H. S. (1994). Sticking it out: Entrepreneurial Survival
and Liquidity Constraints. Journal of Political Economy, 1(102).

ISSN: 2362-1303 (Paper) | eISSN: 2362-1311(Online)
JOURNAL OF ADVANCED ACADEMIC RESEARCH (JAAR) January 2015
Vol. 2. No. I www.phdcentre.edu.np 57
Hurst, E., & Lusardi, A. (2004). Liquidity Constraints, Household Wealth, Entrepreneurship.
Journal of Political Economy, 2, 112.
Khanka, S. S. (2010). Entrepreneurial Development. New Delhi: S. Chand & Company Ltd.
Kim, P., Aldrich, H., & Keister, L. (2003). Access (not) denied: The Impact of financial, human
and cultural capital on becoming a Nascent Entrepreneur . Working paper.
Korunka, C., Frank, H., Lueger, M., & Mugler, J. (2003). The entrepreneurial personality in the
context of resources, environment, and the startup process-A configurational approach.
Entrepreneurship Theory and Practice, 28(1), 23-42.
Krueger, N. F., Reilly, M. D., & Carsrud, A. L. (2000). Competing models of entrepreneurial
intentions. Journal of Business Venturing, 15(5-6), 411-432.
Kumar, M. (2007). Explaining Enterpreneurial Success: a conceptual model. Academy of
Enterpreneurship Journal.
Kuratko, D. F., & Hodgetts, R. M. (2002). Entrepreneurship: A contemporary approach (5th ed.).
South-Western Publication.
Lazear, E. P. (2005, October ). Entrepreneurship. Journal of Labor Economics, 23(4), 649-68.
Page, W., & Noel, T. W. (2001). The Impact of Knowledge Resources on New Venture
Performance . Journal of Small Business Management , 47(1), 1-22.
Rajput, A. A. (2011). Developing Entrepreneurial Model for Pakistani SMEs: A Case Study on
Commercial Fast-food SMEs. Islamabad: Department of Management & Social Sciences,
Mohammad Ali Jinnah University.
Rauch, A., & Frese, M. (2000). Psychological approaches to entrepreneurial success: A general
model and an overview of findings. (C. Cooper, & I. Robertson, Eds.) International
Review of Industrial and Organisational Psychology, 10, 1-41.
Roomi, M. A. (2011, November 13). Entrepreneurial capital, social values and Islamic traditions:
Exploring the growth of women-owned enterprises in Pakistan. International Small
Business Journal, 31, 175-191.
Sadler, R. J. (2008). Corporate Entrepreneurship in the Public Sector: The Dance of the
Chameleon. Australian Journal of Public Administration, 59(2), 25-43.
Schoar, A. (2009). The Divide Between Subsistence and Transformational Entrepreneurship.
NBER Working Paper.

ISSN: 2362-1303 (Paper) | eISSN: 2362-1311(Online)
JOURNAL OF ADVANCED ACADEMIC RESEARCH (JAAR) January 2015
Vol. 2. No. I www.phdcentre.edu.np 58
Shane, S., & Venkataraman, S. (2000). The promise of entrepreneurship as a field of research
(note). Academy of Management Review , 25(1), 217-26.
Terjesen, S., Hessels, J., & Li, D. (2013, May 1 ). Comparative International Entrepreneurship :
A Review and Research Agenda. Journal of Management, XX(X), 1-46.
Thapa, A., Thulaseedharan, A., Joshi, L. P., & Goswami, A. (2008, December). Determinants of
Street nterpreneurial Success. The Journal Of Business Studies, 5(1).
Timmons, J. A. (1989). The Enterpreneurial Mind. Brick House Publication Company, ISBN -
10:0931790859.
Wickham, P. A. (2001). Overconfidence in new start-up success probability judgment.
International Journal of Entrepreneurial Behavior & Research , 12(4), 210-227.
Zafar, A. (1983). Pakistani entrepreneurs: Their development, characteristics, & attitudes.

ISSN: 2362-1303 (Paper) | eISSN: 2362-1311(Online)
JOURNAL OF ADVANCED ACADEMIC RESEARCH (JAAR) January 2015
Vol. 2. No. I www.phdcentre.edu.np 59
Role of Economic Factors in Promoting Dalit Education
Gopal Lamsal1 & Prof. Dr. Ram Krishna Maharjan
2
1PhD Scholar, Mewar University, Rajasthan, India
2Professor, Tribhuvan University, Kathmandu, Nepal
Corresponding Author
Gopal Lamsal Email: [email protected]
Abstract
The study was conducted to identify the Role of economic factors in promoting Dalit Education.
Dalits are socially, educationally, politically and economically backward. Dalits are known as
the disadvantage communities who are culturally categorized as the untouchable caste in
society. Legally, it is not allowed to do discrimination in spear of social activities on the basis of
caste and ethnicity even though it is still in practice. The study was conducted among the 227
Dalit students, 18 guardians and 25 key informant interview group was in-depth interview and
discussion in Nawalparasi district of Nepal. Purposive sampling technique was used to select the
respondents from the Dalit communities. School enrolled children were participated in this
study. Self-reported structured questionnaire was formed in 5 point Likert's scale to collect the
perceptual data. Grade wise, mainly grade 5-10 students at least sometimes felt the problem of
tiffin money, problem to manage the expenditure of their school's stationeries, problem of one
uniform, feeling of sadness when they had no shoes like other friends, feeling of stress when they
could not pay the school's fee and problem of one uniform. In all these issues there was highly
significant association (p = .000) found on perception of different grade Dalit students. From the
discussion, it was found that the Role of economic factors in promoting Dalit Education.
Keywords: Dalit, Education, Role, economic, factor, promote
Introduction
Education is something which must to be brought within the reach of everyone. ‟The object of
primary education is to see that every child that enters the gateways of a primary school does
permission it only at a stage when it becomes literate and continues to be literate throughout the
rest of his life.‟-B. R. Ambedkar.
Therefore, education can be considered as the instruments that can bring the social change and
economic transformation in the country. It leads the country in the path of development.
Similarly, it plays the decisive role in the overall process of development like social
advancement and economic betterment. UDHR has declared the education is not only national

ISSN: 2362-1303 (Paper) | eISSN: 2362-1311(Online)
JOURNAL OF ADVANCED ACADEMIC RESEARCH (JAAR) January 2015
Vol. 2. No. I www.phdcentre.edu.np 60
but also international birth right of every child. Nepal has also signatures in that acts but in
practice, there is no accessibility, availability and freedom in education in Nepal. The overall
literacy of the country is 65.9 percent to male 75.1 percent and female 57.4 the highest literacy
rate reported Kathmandu district 86.3 percent and lowest in Rautahat 41.7 percent (CBS, 2014).
The current policy (focuses on education) is not only based on education but also- the adherence
to the “child‟s right to develop its personality, talents, physical and mental abilities to its fullest
potential” (Chr&Gj, Feb-23, 2009) article- 29. Education is also generally considered as a key
factor. In reducing poverty and child labour and in promoting new democracy, peace, tolerance
and development (UNICEF) both approaches largely draw their attention away from the
approaches of parents and children themselves. Efforts have been directed instead towards
sensitizing uneducated masses of their “Rights to education.” and “The importance of education”
yet not much is known about how exactly uneducated people perceive education as a tool for
their own family‟s subsistence or advancement. What future expectations and aspirations do
parents have for their children?
Nepal has many characteristic features. Among them, the researcher focuses on the backward
poor community as treated untouchable Dalit‟s Community, Nepal‟s religious and cultural value
which bears high and low caste. Even though uneducated community it is also burning issues
until today. Education plays a crucial role to develop their languages, dialects, literatures, arts,
scripts, religion etc. The educated people can maintain and sustain the cultural diversities and
national unity so empowering indigenous communities providing education, health, employment
opportunities, organized public education in Nepal has completed all most five decade several
experiment have been done. (Harbinson & Myers, 1964) Say “education opens the door of
development in all fields”. They develop the indicators of human capital and compare these with
economic development & predictability by choosing different indicator products different result
but the overall correlation between greater human capitals & greater level of economic rebutted.
In economics the more we invest the more we get in return. By using that philosophy, most of
Government, NGOs and INGOs were provided many opportunities for the empowerment of
Dalit‟s fifty years ago but all the efforts are almost useless (Koirala B. , 1996). Thus, the
researcher wants to seek as to what types of education can empower the Dalit community.
Education should be vocational, employ generating, practical, behavioural, earning activities of
behaviours change that broke the remaining vicious circle of inequality. It is essentially formal,
non-formal and informal education and trainings are needed which help not only the youth but
also an adult group of ethnic and Dalit community.
The present research proposal wants to focus on the impact of education in empowering among
the group of people in Nepal. Who are for centuries have been treated untouchable caste-
(Chhuna nahune tatha paninachalne Jat) other people whom so-called high caste can‟t touch or
can‟t take food from them and uses of the term “Dalit”. The word “Dalit” is derived from the

ISSN: 2362-1303 (Paper) | eISSN: 2362-1311(Online)
JOURNAL OF ADVANCED ACADEMIC RESEARCH (JAAR) January 2015
Vol. 2. No. I www.phdcentre.edu.np 61
Sanskrit literature and used in political and social scientists in Nepal to identify the category of a
group who are socially, culturally, economically, religiously oppressed (Koirala B. , 1996). The
word Nepali Dalit as similar as the word scheduled caste. The Indian and British governments
used the term-scheduled caste for the first time in 1935 (Commission, 1927). In India Harijan
(The child of God) is the same so-called untouchable lower caste but in Nepal the word Dalit is
widely used in a society to society. In Nepal national Legal code of 1854, the Muluki Ain
formulated on the basis of Hindu orthodoxy included five hierarchical categories. They are
Tagadhari, Matyali, Alcohol drinkers, impure but touchable and next is untouchable caste (Barr,
Durston, Jenkins, Onoda, & Pradhan, June, 2007, pp. 2,3) from whom water is not acceptable
and whose touch requires sprinkling of holy water. As in India, Nepal has no single definition
schedule of castes. Different Dalit organizations such as Dalit Vikas (committee formed in 1997,
and the National Dalit (commission have defined different groups as belong to the Dalit caste.
NDC proposed (bills, 2003, p.2) is defined “Dalit community as communities who have been left
behind in social, economic, educational, political and religious spheres and deprived from the
human dignity and social justice due to caste based discrimination and untouchability. First
chairperson of the NDC describes, “Actually, Dalit is not a caste and caste groups but it is the
exclusionary, situation of poor people that made by the so- called upper class, clever groups who
rules people in the society. Consequently, they are socially excluded, politically neglected,
educationally deprived of, economically exploited and religiously oppressed. They are
victimized community previously. They had called untouchable or Sudra but now called as
Dalit” (January 12, 2009 Kathmandu Nepal). But the researcher focuses is limited to three Nepali
speaking Dalit caste groups. Musahar, Kami, Damai, traditionally Damai is tailor, caste and
musician. A kami is blacksmith and a Musahar is nomadic fish keeping and Banihari in the land
of Jamindar for their livelihood. The country‟s population for a total, Damai has 472862 (1.8%),
Kami has 1,258,554 (4.8 %), and Musahar has 234490 (0.8%) (CBS, 2012, p. 144). Of the 20%
Dalits (Nepal national plans commission). Dalit women and men suffer equally from the practice
but Terai Dalit face more discrimination and worse than those living in the hills (Bennett, 2006).
All three castes are dominant Hindu religious and culture. In Nepali Hindu society Dalit are
generally disadvantaged and poor than the other people. In Nepal 20 percent of people are in
Dalit community. They are mostly below poverty line. The researcher wants to seek how Dalit
can be empowered. As the date fluctuates, the number of the Dalit population also varies
according to differences. Estimates range from 12 percent to over 20 percent (NDC), (Bennett,
2006) has determined 11.8 percent (CWIN, 2005), Sixteen percent of the total population.
Human Rights Watch Group (2004), 21 percent. Centre Human Rights and Global Justice (2005)
20 percent of Nepal‟s Dalit populations. By the result of that are three cases. Among them one
that may include or exclude in the groups two may Dalit have changed their caste three
respondents themselves don‟t want to be identified as Dalit.

ISSN: 2362-1303 (Paper) | eISSN: 2362-1311(Online)
JOURNAL OF ADVANCED ACADEMIC RESEARCH (JAAR) January 2015
Vol. 2. No. I www.phdcentre.edu.np 62
Method
This article deals with most of the procedures adopted for the fulfilment of the statement. It
includes research design, population and sampling, tools, validation; data collection procedure,
data analysis and interpretation of the study are as following.
The methodology used in this study is both qualitative and quantitative in nature. This study is
based mainly on qualitative and descriptive design. Therefore, primary and secondary data were
collected from various sources. For the help of population and sampling I chose Nawalparasi
district the western region of Nepal. The field was rural and urban community schools where
purposing Dalit students are schooling. Among them 227 schooling Dalit children are involved
with my research questionnaires and observations, 18 their guardians and 25 key informant‟s
interview were involved that interview and 13 case study. The study was conducted 14
community schools and 8 VDCs and only one municipality of Nawalparasi district. The study
only focuses how and in what way Dalit communities empower through current schooling
system of Nepal. For reliability and validity tools were developed in consultation with the
resource persons and developed tools were pre-tests to ensure their reliability and validity. Datas
were verified through cross tab and using SPSS method. Mostly primary data were using in the
article. After filtering data I described and interpretation them in according to my field
experience.
Results
Poverty is enemy of life. One of the philosophers has said 'To be a thief better than a Pauper'.
God has given your life then it is your duty to survive it. So, first people think about their
livelihood then other creativity. As the National data of Nepal; 25.2% (2011 est.) people are
living below poverty line. Among them; majority are falls under the Dalit and Janjati (Ethnic
groups). So, it becomes the barriers for educational development of Dalit community also.
Managing the Tiffin money
Regarding these problem, researcher asked the Dalit students about their economic status to
manage their tiffin expenditure.
The data shows that 8.4% said that their parents could not manage their money for tiffin for
school followed by 7.9% said quite often, 48.9% said sometimes, 6.6% said hardly ever and
28.2% said never. From the data, it is know that more than 65% had problem to manage the daily
expenditure of tiffin in schools, which may affect their school education.
Table 1: Managing the Tiffin money
Grade Parents do not give tiffin money Total
Never Hardly ever Sometimes Quite Often Very Often # %

ISSN: 2362-1303 (Paper) | eISSN: 2362-1311(Online)
JOURNAL OF ADVANCED ACADEMIC RESEARCH (JAAR) January 2015
Vol. 2. No. I www.phdcentre.edu.np 63
Four 1 1 0 0 0 2 0.9
Five 1 5 1 0 0 7 3.0
Six 3 0 17 1 3 24 10.6
Seven 9 3 20 2 5 39 17.2
Eight 21 1 44 8 7 81 35.7
Nine 26 5 28 7 4 70 30.8
Ten 3 0 1 0 0 4 1.8
Total 64 15 111 18 19 227 100
% 28.2 6.6 48.9 7.9 8.4 100
Chi-Square Tests
Value df Asymp. Sig. (2-sided)
Pearson Chi-Square 77.115a 24 .000
Sources: Field survey, 2014
Grade wise, mainly grade 5-10 students at least sometimes felt the problem of tiffin money.
There is significant association (p = .000) found on perception of different grade students on
managing the daily expenditure of their tiffin in school by their parents.
Problem of money for stationary
Without adequate availability of stationary; books, copies, pencils, schools bag, education of
students cannot be effective. These things can support to motivate the students also.
Table 2: Problem of money for stationary
Grade Problem of money for stationary Total
Never Hardly ever Sometimes Quite Often Very Often # %
Four 0 2 0 0 0 2 0.9
Five 3 4 0 0 0 7 3.0
Six 14 1 2 0 7 24 10.6
Seven 29 3 3 0 4 39 17.2
Eight 33 10 24 4 10 81 35.7
Nine 25 13 25 5 2 70 30.8
Ten 0 3 0 0 1 4 1.8
Total 104 36 54 9 24 227 100
% 45.8 15.8 23.8 4.0 10.6 100
Chi-Square Tests
Value Df Asymp. Sig. (2-sided)
Pearson Chi-Square 76.330a 24 .000
Sources: Field survey, 2014

ISSN: 2362-1303 (Paper) | eISSN: 2362-1311(Online)
JOURNAL OF ADVANCED ACADEMIC RESEARCH (JAAR) January 2015
Vol. 2. No. I www.phdcentre.edu.np 64
The above table no. 2 shows that 10.6% Dalit students had very often faced the problem of
money for stationary whereas 45.8% said that they had never faced such problem. Similarly,
15.8% said hardly ever followed by 23.8% had sometimes and 4% had quite often faced problem
of money for stationary. Around 38% students from grade 6-10 had reported that they had to face
frequently problem of money to manage their stationeries.
There is highly significant association (p = .000) found on perception of different grade students
on problem to manage the expenditure of their school's stationeries.
Have one uniform
Now a day, even in public school has also system of Uniform. In reality, the Uniform system
came into existence to reduce the economic stratification of rich and poor in schools premises.
But, in some cases, purchasing of simple uniform is also become more expensive for poor people
whose daily income is very low and limited only to manage the hand to mouth problem of
family. Hardly, parent can be able to purchase the single uniform yearly for their children.
The problem could be observed among the disadvantage and marginalized community in Nepal.
From this study, data shows around 44% had reported that basically they had only one uniform
for a year whereas 47.1% said that they had never faced such problem of single uniform for one
whole year. 8.8% said that hardly ever they had to manage by only one uniform.
Table 3: Have one uniform
Grade Have one uniform Total
Never Hardly ever Sometimes Quite Often Very Often # %
Four 1 1 0 0 0 2 0.9
Five 3 4 0 0 0 7 3.0
Six 7 3 6 1 7 24 10.6
Seven 21 2 7 4 5 39 17.2
Eight 42 5 16 6 12 81 35.7
Nine 33 5 8 10 14 70 30.8
Ten 0 0 2 1 1 4 1.8
Total 107 20 39 22 39 227 100
% 47.1 8.8 17.2 9.7 17.2 100
Chi-Square Tests
Value df Asymp. Sig. (2-sided)
Pearson Chi-Square 44.775a 24 .006
Sources: Field survey, 2014
On the basis of grade of students; from grade 6-10 had reported that they had very often faced
the problem of one uniform.

ISSN: 2362-1303 (Paper) | eISSN: 2362-1311(Online)
JOURNAL OF ADVANCED ACADEMIC RESEARCH (JAAR) January 2015
Vol. 2. No. I www.phdcentre.edu.np 65
There is highly significant association (p = .006) found on perception of different grade students
on problem of one uniform.
Feeling sadness when comparing shoes with others friends
It is general understanding that dressing of man determines his economic status so people want
to be luxurious to show their status in society. Basically, children are more interested to get new
clothes, shoes and other fashionable goods. Children sometimes feel inferior if they have no
adequate facilities as their friends have which gives them mental tension as well as parents also
feel pain being unable to fulfil the interest of their children.
Regarding such types of feeling; researcher asked to Dalit-students that whether they felt sadness
when they had no shoes like other non-Dalit friends. The following data (table no. 4) shows
59% said that they never felt any sadness or inferiority when they had no shoes like other friends
whereas 10.1% said that very often they felt such sadness. Similarly, 5.7% reported that hardly
ever followed by 21.1% reported sometimes and 4% reported quite often.
Table 4: Feeling sadness when comparing shoes with others friends
Grade No shoes like others Total
Never Hardly ever Sometimes Quite Often Very Often # %
Four 1 1 0 0 0 2 0.9
Five 6 0 0 0 1 7 3.0
Six 4 1 15 0 4 24 10.6
Seven 23 1 10 1 4 39 17.2
Eight 58 4 6 5 8 81 35.7
Nine 40 6 17 3 4 70 30.8
Ten 2 0 0 0 2 4 1.8
Total 134 13 48 9 23 227 100
% 59.0 5.7 21.1 4.0 10.1 100
Chi-Square Tests
Value Df Asymp. Sig. (2-sided)
Pearson Chi-Square 61.496a 24 .000
Sources: Field survey, 2014
On the basis of grade of students; from grade 5-10 had reported that they had very often felt
sadness when they had no shoes like other friends.
There is highly significant association (p = .000) found on perception of different grade students
on feeling of sadness when they had no shoes like other friends.
Feeling of stress when they cannot pay school fees

ISSN: 2362-1303 (Paper) | eISSN: 2362-1311(Online)
JOURNAL OF ADVANCED ACADEMIC RESEARCH (JAAR) January 2015
Vol. 2. No. I www.phdcentre.edu.np 66
Stress is mental activity constructed due to negative effect of internal or external environmental
factors. One student cannot be concentrated on study when they have stress in mind. Stress
makes people ill as well as destroys the creativity. Sometimes in daily life, people become the
victim of stress because of the interrelationship between the family members, neighbour and
friends. Basically in children or teenage; people want the similar luxurious life as their neighbour
or friends have. In Nepal, majority of median and low class people suffered by the economic
problem.
Table 5: Feeling of stress when they cannot pay school fees
Grade Cannot pay school fees Total
Never Hardly ever Sometimes Quite Often Very Often # %
Four 1 0 1 0 0 2 0.9
Five 3 0 2 0 2 7 3.0
Six 6 2 14 2 0 24 10.6
Seven 14 2 21 2 0 39 17.2
Eight 56 3 11 5 6 81 35.7
Nine 39 8 12 5 6 70 30.8
Ten 2 0 0 0 2 4 1.8
Total 121 15 61 14 16 227 100
% 53.3 6.6 26.9 6.2 7.0 100
Chi-Square Tests
Value df Asymp. Sig. (2-sided)
Pearson Chi-Square 64.185a 24 .000
Sources: Field survey, 2014
The Dalit-education can be affected by their economic status so Dalit-students were asked about
their feeling of stress when they could not pay school fees in time or never. The data shows that
53.3% had never felt stress when they could not pay school fees whereas 7% said that very often
they felt stress during the time of payment of school fees. Similarly, 6.6% said that they felt
hardly ever followed 26.9% said sometimes and 6.2% said that quite often they felt stress (Table
no.5).
On the basis of level of education, even grade 5 – 10 students felt very often stress during the
payment of school fees.
There is highly significant association (p = .000) found on perception of different grade students
on feeling of stress when they could not pay the school's fee.

ISSN: 2362-1303 (Paper) | eISSN: 2362-1311(Online)
JOURNAL OF ADVANCED ACADEMIC RESEARCH (JAAR) January 2015
Vol. 2. No. I www.phdcentre.edu.np 67
Discussion
The working paper on “Hostel Schemes for Dalit Students: Inclusive and Incentive Orient
for Higher Education?” Is a part of the study of impact assessment of scheduled caste welfare
programmers? (George & Naseem, 2010). It highlights serious flaws in service delivery and
reiterates the fact that though several incentive schemes to encourage SCs/STs students for
attainment of quality education exist, practices beyond policies remain critical questions as
ever. This work, drawing this paper from an assessment study of Babu Jagjivan Ram Chhatravas
Yojana, highlights how wrong exclusion occurs even in a targeted scheme. Using available data,
the paper argues that the scheme has not adequately followed the stated preferential criteria of
low literacy and focus of middle and secondary level of education for SCs females while
selecting locations. Most importantly, the scheme does not include poverty as a criterion for
selection of beneficiaries, which allows wrong exclusion on a large scale. Despite several policy
and programmes interventions to help improve the educational conditions of scheduled castes
(SCs) and scheduled tribes (STs) in India, serious gaps exist in their literacy rate, participation in
higher, technical and professional education as compared to other social groups, which is more
a paradox than the query. The paper suggests that segregation of data across middle,
secondary and higher education of SCs male and female in rural and urban India by level of
poverty is a practical option to select locations and beneficiaries as long as the scheme has
budget constraints for universal coverage. The paper also looks at the extent to which the hostel
scheme acts as an incentive for SCs students to continue their education, which is one of its
major objectives.
The working in very better because the poor students who are not afford lodging and fooding
problem it is concerned higher level of students in the Indian context. But there is gape my
article is in western Nepalese rural, urban and terrain context whereas basic level of students,
their guardians and local level of KII group are gathered in my case study it is real class room
centred. It focuses how can the Dalit communities‟ people manage their economic problem even
though they are mostly unemployment, landless and traditional behaviour?
It is renowned on rural education schemes helping Scheduled Castes (SCs) and the Scheduled
Tribes (STs) in rural India (Boxx, October, 2012). Even less is known about how to increase
educational opportunity, especially for the most marginalized groups, such as the semi-nomadic,
Dalit Community or ethnic community of Kanjars. This study hopes to enlighten new
opportunities of addressing social and gender inequality within marginalized SCs and STs
through education. Pardada Pardadi Educational Society (PPES) is an innovative, non-
governmental organization (NGO) that is addressing gender inequality, poverty and education.
Since 2010, PPES has attempted in a novel approach to convince Kanjar families to send their
daughters to school by providing an incentive package that focuses on socialization, hygiene and
literacy and later academics. In a specially designed project for the Kanjars, PPES built a

ISSN: 2362-1303 (Paper) | eISSN: 2362-1311(Online)
JOURNAL OF ADVANCED ACADEMIC RESEARCH (JAAR) January 2015
Vol. 2. No. I www.phdcentre.edu.np 68
hygiene complex (toilets and showers) creating a tangible community link to the benefits of
education. Moreover, children with good attendance are rewarded with a solar light providing
lighting in a community without electricity. The results of these projects on the retention of
Kanjar girls in school are promising but there is still a long way to go.
At this time India is in need of specific educational strategies for resolving obvious inequalities,
including gender inequality of the most historically marginalized groups of their society (Boxx,
October, 2012). To the researcher‟s opinion it seems that the Indian government is not acting
conclusively enough on the issue of girl child education, especially for children from STs and
SCs. Scholarships alone are not enough, given the lack of real demand within the community for
educational opportunities. More clear links must be drawn and true opportunities created for
these groups that really incentivize education for both girls and boys. Additionally, health
education programs for these communities are in terrible need as well. Moreover, educational
schemes must not only provide the best practices possible but also address the root causes of
marginalization. The group of rural Uttar Pradesh Kanjars surveyed for this research are
symbolic of several groups of lower caste peoples living in rural India and it is hoped that the
information presented will help to lighten some of the difficulties associated with their inclusion
in educational programs. Nevertheless, more research is greatly needed.
In the same case, the Dalit of Nepal can be empowered through education and other incentive
packages. Such as lodging, fooding, clothing, housing and educational instruments is essential in
the case of Nawalparasi district.
The model for the right to primary education, free of charge, is established by international
instruments, notably Article 4 (a) of UNESCO‟s Convention against Discrimination in
Education, and Articles 13 and 14 of the International Covenant on Economic, Social and
Cultural Rights. Article 13 (2) the international covenant accepts clearly the right of every one to
primary education, free of charge. Likewise, Article 14 lays down State commitments for a
detailed plan of action for the progressive implementation of the right to compulsory education,
free of charge, for all. These obligations are similar to the political commitments made under the
Dakar Framework for action regarding the national action plan of EFA, (UNESCO, 2008).
In the plan of action for primary education, the United Nations Committee on Economic, Social
and Cultural Rights (CESCR) has interpreted the right to compulsory primary education, free of
charge, for all members in its General Comment No. 11 (1999) as well as No. 13 (1999). The
General Comment No11 states that the nature of this requirement for primary education free of
charge is unquestionable. Article 13(2) (a) General Comment No. 13 states that the obligation to
provide primary education for all is an immediate (para. 51) and core obligation (para. 57) of
these States.

ISSN: 2362-1303 (Paper) | eISSN: 2362-1311(Online)
JOURNAL OF ADVANCED ACADEMIC RESEARCH (JAAR) January 2015
Vol. 2. No. I www.phdcentre.edu.np 69
Article 13(2) (a) of the International covenant has stated that primary education has two
distinctive features: “compulsory” and “available free to all”. Compulsory schooling means that
neither parents, nor guardians, nor the State is entitled to treat as optional the decision as to
whether the child should have access to primary education. In order to ensure universal primary
school attendance, States Parties are obliged to set the minimum working age at no less than 15
years, (Para. 41; see also Article 2 (3) of ILO Convention No. 138 (1973) concerning Minimum
Age for Admission to Employment) and to ensure that communities and families are not
dependent on child labour (General Comment No. 13, Para. 55).
CESCR has interpreted the requirement that primary education be available free for all. It has
clearly stated that States Parties must ensure the availability of primary education, without
charge to the child, parents or guardians (General Comment No. 11, Para. 7).
To make compulsory primary education truly free for all children, States Parties are thus grateful
to eliminate all direct and indirect costs of schooling. Direct costs such as school fees imposed
by the government, local authorities or schools run counter to the international obligations and
must be eliminated. However, the indirect costs such as expenses for schoolbooks, uniforms or
travel to and from school may be permissible but subject to the examination. Currently, the
heaviest charge on a family‟s budget is from the indirect costs, notably for parents‟ compulsory
contributions (Shiwakoti, 2009).
National Framework to Ensure Free and Compulsory Primary Education Government of Nepal
has been making efforts for Free and Compulsory Primary Education (FCPE) since the
beginning of the nineties. The piloting of free and primary education was carried out in Banepa
Municipality of Kavre district and Ratna Nagar Municipality of Chitwan district in 1995/96. The
Local Self Government Act was introduced in 1999, on the above background, of which FCPE
was later extended to Chitwan and Ilam districts. The main objective of this program was to
ensure education for all including the disadvantaged groups.
The Education for All (EFA) program has given special attention to the schooling of
disadvantaged groups. One of the goals of EFA program was to ensure basic education of quality
for all children, particularly girls, Dalit, disabled and children in difficult circumstances and
children belonging to ethnic minorities, through free and compulsory primary education in Nepal
by 2015.
To ensure basic education for disadvantaged groups, the government introduced several
supportive measures at different times. It included free textbooks, scholarship schemes for Dalit
girls (50 percent) and disabled, school feeding program, alternative schooling program including
school improvement and expansion program in the areas of low enrolment (Shiwakoti, 2009).
Confirming clearly obligation to the child's right to receive quality basic education of up to
Grade 8, the core document of School Sector Reform (SSR) has stated that adequate

ISSN: 2362-1303 (Paper) | eISSN: 2362-1311(Online)
JOURNAL OF ADVANCED ACADEMIC RESEARCH (JAAR) January 2015
Vol. 2. No. I www.phdcentre.edu.np 70
arrangements will be made to ensure free education to children from economically disadvantaged
communities and children with disabilities. SSR has stated that free education will be
implemented from the 2009 academic year in Grade 6 and gradually extended up to Grade 10. In
the bright of all these, this study intends to analyse the educational status as well as provisions
required, measures and process that are essential to ensure the rights of the disadvantaged groups
to receive quality basic education.
The study report Shiwakoti and his team clearly defined about free and compulsory education
can help the expansion and improvement of education so the report is very well in encouraging
education related scholars but There is a gap in the study report and this article their studies
report cannot explained about what are economic factors and how can economic factors affecting
in promoting Dalit education if the parents have had adequate, economic resources, the schooled
teaching and learning environment is adequate, available, accessible, acceptable and
adaptable all kind of technical difficulties and obstacles of education for Dalit can be promoted.
Their studies are general for all Nepalese contexts but this article specified in the case of
Nawalparasi district.
Schooling of Dalit Children in India (Nambissan, 1996, pp. 1011-1024)the educational
backwardness of the Dalit communities is generally attributed to poverty and illiterate home
environments existing among them. This article draws attention to the effect the learning
environment within the formal educational system which has been having on the Dalit pupils. It
argues that' besides poor infrastructural facilities, lack of effective pedagogic supports to acquire
linguistic, numerical and cognitive competencies harmfully affect the schooling of Dalit
children. More importantly, in spite of active encouragement from poor family members, the
indifferent treatment by teachers and school administrators largely shape the learning
experiences of these socially disadvantaged groups. By creating a separate sphere of non-formal
education if or such groups, the government of late has renounced its responsibility to generate
equity within the formal school system
It has been claimed that School Feeding Programs increase school participation among poor and
food insecure group of people (Dheressa, 2011). This study investigates if the program has
significant positive impact on school enrolment, class attendance, and student drop-out patterns
among primary school children in DaraWoreda of Sidama Zone, Southern Ethiopia. Data were
collected from individual stakeholders. Household Questionnaire, Key Informant Interviews and
Observation were the methods employed to collect the data. The quantitative data have been
analysed, and then whereas the qualitative data are analysed along with the quantitative results.
The study found significant positive impact of School Feeding Program on the three school
participation indicators, although it has some roles with regard to these objectives. The result
also shows that the major factors affecting school enrolment are demand for child labour, cost of
schooling, obtain ability of school, teaching quality and school infrastructure, distance to school,

ISSN: 2362-1303 (Paper) | eISSN: 2362-1311(Online)
JOURNAL OF ADVANCED ACADEMIC RESEARCH (JAAR) January 2015
Vol. 2. No. I www.phdcentre.edu.np 71
the availability of food incentives and safety concerns. Whereas, those affecting class attendance
and student drop-out include illness, work for money/food, domestic work, school hour hunger
and long distance to school. Besides, it has been determined that even among beneficiary
households, the elder household head is less likely that the children get enrolled to school during
their primary school ages or will not properly attend class even if enrolled. Meanwhile, absence
from classes decreases in both beneficiary and non-beneficiary households when household head
education level and household income are higher. However, it is found that neither household
head education nor household income have significant effect on student drop-out in recipient
households. The study recommends that both the nutritional and economic values of School
Feeding Program should be improved in order to significantly enhance school participation.
They studied the next functioning and effectiveness of scholarships and incentives intended for
girls and children of disadvantaged communities (Acharya & Luitel, 2006)Is a good thesis
report. They desired to understand various incentive schemes from local perspectives rise from
the need to provide policy makers, planners, administrators, educators and donors with
important insights to help improve the management of current incentive and scholarship
schemes.
They had selected three districts Rasuwa, Saptari and Surkhet (Acharya & Luitel, 2006) the
study used interviews, group discussions, and observation and case studies. They find that all
three study districts, most of the respondents agreed that the available scholarships/incentives
reached the needy population, but complained that they did not cover all of the needy children.
According to the teachers, since the scholarships/incentives have been in place, the girls‟
enrolment and school attendance have increased in the selected schools. In most cases incentives
in the form of food and oil were reported to be the most effective in increasing girls' enrolment
and attendance.
The study report is very well but not specified in the case of the role for economic factors in
promoting Dalit education. My article is in class room specified and Dalit education. There is an
operation all schools activities concerned to family economic situations as like as managing the
tiffin money, problem of money for stationary, have one uniform, feeling sadness when
comparing shoes with others friends, feeling of stress when they cannot pay school fees etc. All
of the factors with in-depth interview explored that it is comparatively empowering than
previous years of the schools, VDCs, LDOs office and DEO records of Nawalparasi district of
Nepal.
Conclusion
The study explored from the discussion, was found that the role of economic factors in
promoting Dalit Education like felt the problem of tiffin money, problem to manage the
expenditure of their school's stationaries, problem of one uninform, feeling of sadness when they
had no shoes like other friends, feeling of stress when they could not pay the school's fee and

ISSN: 2362-1303 (Paper) | eISSN: 2362-1311(Online)
JOURNAL OF ADVANCED ACADEMIC RESEARCH (JAAR) January 2015
Vol. 2. No. I www.phdcentre.edu.np 72
problem of one uninform. Teachers, administration and their colleague‟s behaviour, can effect
on learning of Dalit students. Legally, it is not allowed to do discrimination in spear of economic
activities on the basis of poverty, caste, and ethnicity even though it is still somewhat practice
most of rural areas of Nawalparasi district. The discriminative behaviour is slowly decaying with
the help of huge amount of scholarship for Dalit and Janajati. They are gradually empowered
through incentives measures like scholarships, mid-day meals, dresses, inclusive education and
reservation policy of government in most of the field in Nepal. Not only government but also
NGOs, INGOs, and other local level organizations are supporting Dalit promoting programme.
Acknowledgements
I express my gratitude to the respondents. Besides that I like to give my thanks to the Mewar
University, very most indebted the Chairperson of PhD Scholars Association of Nepal Mr. Tej
Bahadur Karki, Academic Advisor of PhD center Prof. Dr. Tatwa P. Timsina, Excellent
Scholar Mr. Dasarath Neupane and Southwestern Centre for PhD Studies for their Valuable
support and guidance.
References
Acharya, S., & Luitel, B. (2006). The Functioning and Effectiveness of Scholarship and Incentive
Schemes in Nepal. Kathmandu: UNESCO Office of Kathmandu.
Barr, E., Durston, S., Jenkins, R., Onoda, E., & Pradhan, A. (June, 2007). Dalit in India and
Nepal; Policy Options for Improving Social Inclusion in Education. UNICEF. New York:
UNICEF.
Bennett, L. (2006). Unequal Citizens; Gender,Caste and Ethinic Exclusion in Nepal. World
Bank, DFID.
Boxx, W. (October, 2012). Addressing Educational Opportunities for Rural Kanjars: Findings
from an Educational Incentive Scheme in Anupshahar, Uttar Pradesh, India. Ludwig
Maximillian University, Munich, Germany., Anupshahar, Uttar Pradesh.
CBS. (2012). National Population and Housing Census 2011 (National Report). Central Bureau
of Statistics., National Planning Commission. Kathmandu: Central Bureau of Statistics
Kathmandu, Nepal.
CBS. (2014, Sep). National Population and Housing Census 2011 Caste/Ethnicity. Retrieved
from www.http://cbs.gov.np/.
Chr&Gj, D. I. (Feb-23, 2009). Recasting Justice; Securing Dalit Rights in Nepal’s New
Constitution.

ISSN: 2362-1303 (Paper) | eISSN: 2362-1311(Online)
JOURNAL OF ADVANCED ACADEMIC RESEARCH (JAAR) January 2015
Vol. 2. No. I www.phdcentre.edu.np 73
Commission, S. (1927). Scheduled Caste. British: Unpublished Statement.
Dheressa, D. K. (2011). Education in Focus: Impacts of School Feeding Program on School
Participation. Norwegian University of Life Sciences (UMB), Department of
International Environment and Development Studies (Noragric),. Southern Ethiopia:
Unpublished M.A Thesis.
George, S., & Naseem, D. (2010). Hostel Schemes for Dalit Student How Inclusive and Incentive
Oriented for Higher Education. Indian Iunstitude of Dalit studies(IIDS). New Delhi:
IIDS,New Delhi.
Harbinson, F., & Myers, C. (1964). Education, Manpower & Economic Gorth; Strategies of
Human Resource Development. New York: Mc Graw Hill.
Koirala, B. (1996). Schooling and Dalit of Nepal - A Case Study of Bungkot Dalit Community.
Alberta University: Unpublished PhD Thesis.
Koirala, B. N. (2010). Late Comers in School: The Status of Dalit Girls in Education". Feminist
Dalit Organization, Education. Kathmandu: Feminist Dalit Organization,.
Nambissan, G. B. ( 1996, April 20-27). Equity in Education? Schooling of Dalit Children in
India. Economic and Political Weekly, 31, 1011-1024. Retrieved from 4404063
Shivakoti, D. K. (2013). Implementation of Marginalized Group Education Scholarship.
Educational, Social Inclusion Research Fund (SIRF)/ SNV Nepal. Bakhundole, Lalitpur:
Unpublished.
Shiwakoti, P. D. (2009). Ensuring Free and Compulsory Basic Education for Disadvantaged
Groups in the Context of Education for All. Tribhuvan University, Education.
Kathmandu: CERED.
UNESCO. (2008). The Right to Primary Education Free of Charge for all: Ensuring Compliance
with International Obligations. Paris: UNESCO.

ISSN: 2362-1303 (Paper) | eISSN: 2362-1311(Online)
JOURNAL OF ADVANCED ACADEMIC RESEARCH (JAAR) January 2015
Vol. 2. No. I www.phdcentre.edu.np 74
Gender Role in Global Personal Self-Esteem and Narcissism among
Nepalese School Adolescents
Neupane, Dasarath1 & Timsina, Tatwa
2
1PhD scholar, Dr. K.N. Modi University, Rajasthan, India
2Professor, Tribhuvan University, Kathmandu, Nepal
Corresponding Author
DasarathNeupane
Abstract
Introduction: Global personal self-esteem and narcissism with reference to gender role among
school adolescents was studied in Kathmandu. The general aim of this research was to explore
the correlation in global personal self-esteem and narcissism with response to gender among
Nepalese school adolescents.
Methodology: The study was correlational in design employing a pen-and-paper self-report
survey. Within the survey, instruments (Rosenberg Self-Esteem Scale 1979 / RSES and
Narcissistic Personality Inventory 1981/ NPI) measured the global personal self-esteem and
narcissism. Participants were drawn from thirty (fifteen public and fifteen private) schools of
Kathmandu. These schools were chosen in random selection. The number of participations was
936 school students.
Results: The study investigated the prevalence of global personal self-esteem in the school with
reference to gender. The result from the survey indicates that there is no significant difference
between self-esteem and gender. On the other hand, girls are reported slightly higher
narcissistic behaviour than boys.
Conclusion: Self-esteem is how people feel about themselves generally. This study explored the
prevalence rates of global personal self-esteem with reference to gender. It showed that there is
no significant correlation between them. On the other hand, narcissism is a psychological
condition defined as a total obsession with self, to the exclusion of almost all other interaction
with people. The present study explored the prevalence rates of narcissism with reference to
gender. It showed that girls reported slightly higher narcissistic behaviour than boys’ which

ISSN: 2362-1303 (Paper) | eISSN: 2362-1311(Online)
JOURNAL OF ADVANCED ACADEMIC RESEARCH (JAAR) January 2015
Vol. 2. No. I www.phdcentre.edu.np 75
contradicts the previous findings. Why it is found so in the Nepalese context is left for further
research.
Key words: Gender role, global personal self-esteem, narcissism
Introduction
Brown (1998) defined self-esteem as a global personality trait that is relatively enduring across
time and situations– a term to describe how people feel about themselves generally. Gender
differences have been becoming a great interest to the researchers in the field of psychology.
Gender has an impact on various aspects of adolescents and can also affect changes in self-
esteem during the adolescent years. Gender refers to “the array of socially constructed roles and
relationships, personality traits, attitudes, behaviours, values, relative power and influence that
society ascribes to the two sexes on a differential basis” (Health Canada, 2000). A number of
factors including biological, cognitive, social, and environmental factors contribute to influence
an adolescent's personal development and self-esteem (Kearney-Cooke, 1999).
Gender-based beliefs are mostly derived from gender role stereotypes existing in every
society. Great consistency in standards of desirable gender-role behaviour has been found in both
within and across different cultures. Eagly and Wood, (1991) have highlighted some expected
characteristic features related to gender role. For example, males are expected to be objective,
independent, assertive, logical and competitive whereas females are expected to be more passive,
sensitive, illogical, dependent, accommodating and supportive. However, a little change has been
seen over the past two decades regarding such beliefs within the developed societies and
apparently around the world as well. Gender socialization has created expectations for the way
women and men behave, think and feel about themselves. For women, one‟s family, peer
support, reflected appraisals and family relationships are important determinants of self-esteem.
Parental support and family connectedness are especially important for girls. On other hand
feelings of mastery, self-actualization and academic performance are more important for males.
Narcissism is an inflated sense of self-importance and it is an extreme preoccupation of self
(Doty & Fenlason, 2013). While going on the root of the term, it is derived from the Greek
mythological word Narcissus. It means a young man falls in love of self-image (Davison &
Neale, 1998); the term generally describes an exaggerated self-love (Reber, 1995).
The focus of the present study, however, was not upon the clinical or abnormal psychological
aspects of personality or the self and it should be noted that most of the research in the field of
narcissism and its correlates has generally employed nonclinical samples (Papps & O'Carroll,
1998). To be more precise, certain narcissistic characteristics typically present as continua, as do
many other psychological constructs including self-esteem (Hoyle, Kernis, Leary, & Baldwin,

ISSN: 2362-1303 (Paper) | eISSN: 2362-1311(Online)
JOURNAL OF ADVANCED ACADEMIC RESEARCH (JAAR) January 2015
Vol. 2. No. I www.phdcentre.edu.np 76
1999).Correspondingly, Baumeister et. al. (1996) considers specific narcissistic tendencies to be
present to a measurable degree in people with certain self- presentational styles.
Furthermore, and of particular interest, the statement in the DSM-IV- TR that narcissistic traits
are common in adolescents, although these traits do not necessarily result in later development of
Narcissistic Personality Disorder (American Psychiatric Association, 2000). Given this
conceptualization, particularly in the context of the present study‟s sample, it warrants an
exploration of the relationship between narcissism and gender role.
General objective
The general aim of this research was to explore the gender role in global personal self-
esteem and narcissism among Nepalese school adolescents.
The specific objectives of this research can be described as:
To build knowledge based on the phenomena of global personal self-esteem and narcissism with
reference to gender in school level.
Hypothesis
Gravetter and Forzano (2003) mention that before a research idea can be evaluated, it needs to be
transformed into hypotheses. These hypotheses are statements about the relationship between
variables. The hypotheses of this study are as follow:
Gender role is significant in global personal self-esteem and narcissism.
There would be a significant positive correlation between gender and global personal self-
esteem.
There would be a significant positive correlation between gender and narcissism.
Methods
Design and Participants
The study was correlational in design employing a pen-and-paper self-report survey. Within the
survey, two separate instruments (Rosenberg Self-Esteem Scale 1979 / RSES and Narcissistic
Personality Inventory 1981/ NPI) measured the variables global personal self-esteem and
narcissism. There are a number of methodological considerations, beginning with issues
surrounding the consent procedures and the form of survey (i.e., self-report) employed in the
present study that require consideration. Participants were drawn from thirty schools: fifteen
governments funded and fifteen private schools from Kathmandu, Nepal. These schools were
chosen in random selection. The respondents were between 12 years to 18 years. The total

ISSN: 2362-1303 (Paper) | eISSN: 2362-1311(Online)
JOURNAL OF ADVANCED ACADEMIC RESEARCH (JAAR) January 2015
Vol. 2. No. I www.phdcentre.edu.np 77
number of students was 936. The following table no. 1 illustrates the data of respondents‟ grade,
age and gender.
Table no. 1 Respondents‟ grade, age and gender cross tabulation
Grade
Total 8 10
Age
12 33 1 34
13 168 4 172
14 176 63 239
15 73 192 265
16 18 166 184
17 3 35 38
18 0 4 4
Total 471 465 936
Grade Total
8 10
Gender Boy 228 241 469
Girl 243 224 467
Total 471 465 936
Materials
All constructs were measured using pen-and-paper self-report questionnaires. Each of the two
scales began on a separate page with its own preamble to introduce the scale, resulting in a
questionnaire battery including an instruction/cover sheet. For the measure of personal self-
esteem, the Rosenberg Self-Esteem Scale / RSES (Rosenberg, 1979) was used. The scale
consists of ten items which was used in the pilot study and main study. The 10-item Rosenberg
Self-Esteem Scale is a widely used, brief, and easily administered one-dimensional measure of
personal global self-esteem with a reported alpha coefficient of .77 (Keith & Bracken, 1996). In
the original form of the RSES, respondents are asked to indicate to what extent they agree with
the listed statements using a 4- point scale like Strongly Agree (SA), Agree (A), Disagree (D),
and Strongly Disagree (SD). The response format was modified from the original to a5-point
Likert-type scale: Strongly Agree, Agree, Uncertain, Disagree and Strongly Disagree.
In the case of narcissism, the nonclinical 40-item Narcissistic Personality Inventory / NPI
(Raskin & Hall, 1981) scale measured the narcissism in the present study. Originally, it was a 54-
itemscale, which was used in clinical diagnostic procedure for Narcissistic Personality
Disorder/NPD (American Psychiatric Association, 2000). The modified scale measures the
individual differences in nonclinical narcissism and is the most broadly used narcissism
inventory (John & Robins, 1994). The present study followed Raskin and Hall's (1981) the

ISSN: 2362-1303 (Paper) | eISSN: 2362-1311(Online)
JOURNAL OF ADVANCED ACADEMIC RESEARCH (JAAR) January 2015
Vol. 2. No. I www.phdcentre.edu.np 78
commonly used 40-itemNPI inventory that has a forced- choice format and individuals with high
scores generally report high global personal self-esteem and are self-confident. They appear to be
aggressive, highly competitive, egotistical, socially manipulative, and lacking in empathy
(Raskin & Novacek, 1989).
Procedure
During the scheduled lesson, the researcher and class teacher distributed surveys to consenting
students. Students were told to ask the researcher for assistance at any time if they experienced
difficulties with the questionnaire. The researcher also reinforced the anonymity of the process
and students‟ right to decline or cease participation at any time. Participants were told the
importance of truthful responses and that they were to answer the questions without conferring or
copying. The class teacher, who remained in the classroom during data collection, gave those
students who had declined to participate other quiet activities. Completed surveys were collected
by the researcher and sealed in unmarked envelopes; the classroom survey process took on
average approximately 30 minutes.
Results
Hypothesis Testing
Hypothesis 1 reported that there would be a significant positive correlation between gender and
global personal self-esteem. ANOVA test with gender as an independent variable and global
personal self-esteem as a dependent variable, results showed that mean scores of boys was
22.5846 and girls was 22.6832. It also did not support the predicted hypothesis. The following
table no. 2 shows the result in detail.
Table no. 2 (Gender-wise mean scores of global personal self-esteem)
N Mean
Std.
Deviation
Std.
Error
95% Confidence
Interval for Mean
Min
imu
m
Maxim
um
Lower
Bound
Upper
Bound
Boy 467 22.5846 5.02342 .23246 22.1278 23.0414 10.00 40.00
Girl 464 22.6832 4.65863 .21627 22.2582 23.1082 10.00 37.00
Total 931 22.6337 4.84270 .15871 22.3223 22.9452 10.00 40.00
Sum of
Squares df Mean Square F Sig.
Between Groups 2.263 1 2.263 .096 .756
Within Groups 21807.838 929 23.475
Total 21810.101 930

ISSN: 2362-1303 (Paper) | eISSN: 2362-1311(Online)
JOURNAL OF ADVANCED ACADEMIC RESEARCH (JAAR) January 2015
Vol. 2. No. I www.phdcentre.edu.np 79
In terms of narcissism, the hypothesis 2, there would be a significant positive correlation
between gender and narcissism, ANOVA test with gender as an independent variable and
narcissism as a dependent variable, result showed that mean scores of boys was 62.0968 and
girls was 62.5773. The p value of the results is 0.021, which is <0.05. It supports the predicted
hypothesis. The following table no. 3 shows the result in detail.
Table no. 3 (Gender-wise mean scores of narcissism)
N Mean Std.
Deviation
Std.
Error
95% Confidence
Interval for Mean
Min
imu
m
Maxim
um
Lower
Bound
Upper
Bound
Boy 465 62.0968 3.45994 .16045 61.7815 62.4121 47.00 74.00
Girl 459 62.5773 3.75157 .17511 62.2332 62.9215 44.00 71.00
Total 924 62.3355 3.61380 .11889 62.1022 62.5688 44.00 74.00
Sum of Squares Df Mean Square F Sig.
Between Groups 65.517 1 65.517 5.378 .021
Within Groups 11244.976 923 12.183
Total 11310.493 924
Discussion
The goal of this study was to explore the gender relationship on global personal self-
esteem and narcissism among the school adolescents. Above mentioned results showed mixed
results than from existing literature. The results between gender and global personal self-esteem
are matched with previous findings. However, the results of narcissism with reference to gender
are not matched with previous findings.
The results showed that there is no significant positive correlation between gender and global
personal self-esteem (p>0.05, i. e. 0.756). The results were close to the results found by
Coopersmith(1967). Moreover, the results were matched with Skaalvik(1990) and Simon and
Simon (1975) who found no significant difference between males and females in self-esteem.
On the other hand, the results on narcissism and gender, showed that there is significant
correlation between gender and narcissism (p<0.05, i.e. 0.021). The present finding on
narcissism contradict with Grijalva et al. (2014) reviews on gender role on narcissism. Thus,
there could have further research on it in the context of Nepalese school environments.
Conclusion
Thus, self-esteem is how people feel about themselves generally. This study explored the
prevalence rates of global personal self-esteem with reference to gender. It showed that there is

ISSN: 2362-1303 (Paper) | eISSN: 2362-1311(Online)
JOURNAL OF ADVANCED ACADEMIC RESEARCH (JAAR) January 2015
Vol. 2. No. I www.phdcentre.edu.np 80
no significant correlation between them. On the other hand, narcissism is a psychological
condition defined as a total obsession with self, to the exclusion of almost all other interaction
with people. Narcissism is often characterized by a lack of empathy for others, an immature
sense of humour, sadistic or destructive tendencies towards other people, and a compulsion to
satisfy personal needs without regard for others. The present study explored the prevalence rates
of narcissism with reference to gender. It showed that girls are reported slightly higher
narcissistic behaviour than boys which contradicts the previous findings. Why it is found so in
the Nepalese context is left for further research.

ISSN: 2362-1303 (Paper) | eISSN: 2362-1311(Online)
JOURNAL OF ADVANCED ACADEMIC RESEARCH (JAAR) January 2015
Vol. 2. No. I www.phdcentre.edu.np 81
References
American Psychiatric Association. (2000). Diagnostic and statiscal manual of mental disorders
(4th text rev ed.). Washington, DC: Author.
Baumeister, R. F., Smart, L., & Boden, J. M. (1996). Relation of threatened egotism to violence
and aggression: The dark side of high self-esteem. Psychological Review, 103, 5-33.
Brown, J. D. (1998). The self. Boston: MA: M'Graw Hill.
Coopersmith, S. (1967). The antecedents of self-esteem. San Francisco: W. H. Freeman & Co.
Davison, G. C., & Neale, J. M. (1998). Abnormal psychology (7th ed.). New York: Wiley.
Doty, J., & Fenlason, J. (2013). Narcissim and Toxic Leaders. Military Review, 55-60.
Eagly, A., & Wood, W. (1991). Explaining sex differences in social behavior: A meta-analytic
perspective. Personality and Social Psychology Bulletin, 17, 306-315.
Gravetter, F., & Forzano, L. (2003). Research methods for the bevavioural sciences. California:
Wadsworth/Thomson Learning, Inc.
Grijalva, E., Newman, D. A., Tay, L., Donnellan, M. B., Harms, P., & Robins, R. W. (2014).
Gender Differences in Narcissism: A Meta-Analytic Review. American Psychological
Association.
Health Canada. (2000). Health Canada ’s gender-based analysis policy, 14. Ottawa.
Hoyle, R. H., Kernis, M. H., Leary, M. R., & Baldwin, M. W. (1999). Selfhood: Identity, esteem,
regulation. Boulder, CO: Westview Press.
John, O. P., & Robins, R. W. (1994). Accuracy and bias in self-perception: Individual differences
in self-enhancement and the role of narcissism. Journal of Personality and Social
Psychology, 66, 206-219.
Kearney-Cooke, A. (1999). Gender Differences and Self-esteem. J. Gend.Specif.Med, 2(3), 46-
52.
Keith, L. K., & Bracken, B. A. (1996). Self-concept instrumentation: A historical and evaluative
review. In B. A. Bracken, Handbook of self-concept: Developmental, social, and clinical
considerations (pp. 91-170). New York: Wiley.
Papps, B. P., & O'Carroll, R. E. (1998). Extremes of eslf-esteem and narcissism and the
experience and expression of anger and aggression. Aggressive Behavior, 24, 421-438.

ISSN: 2362-1303 (Paper) | eISSN: 2362-1311(Online)
JOURNAL OF ADVANCED ACADEMIC RESEARCH (JAAR) January 2015
Vol. 2. No. I www.phdcentre.edu.np 82
Raskin, R., & Hall, C. S. (1981). The Narcissistic Personality Inventory: Alternate form
reliability and further evidence of construct validity. Journal of Personality Assessment,
45, 159-162.
Raskin, R., & Novacek, J. (1989). An MMPI description of the narcissistic personality. Journal
of Personality Assessment, 53, 66-80.
Reber, A. S. (1995). The Penguin dictionary of psychology (2nd ed.). London: Penguin.
Rosenberg, M. (1979). Conceiving the self . New York: Basic Books.
Skaalvik, E. (1990). Gender differences in general academic self-esteem and in success
expectations on defined academic problems. Journal of Educational Psychology, 82, 593-
598.

ISSN: 2362-1303 (Paper) | eISSN: 2362-1311(Online)
JOURNAL OF ADVANCED ACADEMIC RESEARCH (JAAR) January 2015
Vol. 2. No. I www.phdcentre.edu.np 83
Media and Advertising Preferences of Nepalese Audiences
Gopal Thapa1
1Lecturer, Nepal Commerce Campus (TU), Minbhawan, Kathmandu
1PhD Scholar, Dr. K N Modi University, Rajasthan, India
Under the Supervision of Prof. Dr. Bihari Binod Pokharel
Abstract
No one can escape from death, tax and advertising. There are various media available for
advertising. Advertising is used by different organization in different ways. Different customers
have responded differently, to the different message and media. This article highlights on the
consumers‟ preference towards the message and media on the basis of age, gender and education.
This study is part of the pilot study of my PhD research work. It is a descriptive study based on
survey method. Total 80 respondents consisting different gender, age and education background
were taken as sample on judgmental basis. The result revealed that most of the Nepalese prefer
television, television advertising and musical message.
Keywords: Advertisement, Audience, Consumer, Media television,
Introduction
Advertising
One of the popular tools of marketing communication is advertising. Advertising is any paid
form of non-personal presentation and promotion of ideas, goods or services by an identified
sponsor. Advertising is used by different organization in different ways. A large company set
up its own advertising department for all or most of the advertising functions while those do not
have separate department hires advertising agencies to promote their products. There are various
types of media are available in the market for advertisers to conduct advertising functions.
Television Advertising
Among various media television is one which hold upper hand because of its unique audio and
visual characteristics. According to Keller (2008), Television is generally acknowledged as the
most powerful advertising medium as it allows for sight, sound, and motion and reaches a broad
spectrum of consumers. The wide reach of TV advertising translates to low cost per exposure.
From a brand equity perspective, TV advertising has two particularly important strengths. First,

ISSN: 2362-1303 (Paper) | eISSN: 2362-1311(Online)
JOURNAL OF ADVANCED ACADEMIC RESEARCH (JAAR) January 2015
Vol. 2. No. I www.phdcentre.edu.np 84
TV advertising can be effective means of vividly demonstrating product attributes and
persuasively explaining their corresponding consumer benefits. Second, TV advertising can be
compelling means for dramatically portraying non-product-related user and usage imagery,
brand personality, and so on. Television is a common medium of information and is very
effective in delivering a message or in a wide sense, for effective marketing communication.
Kotler & Fox (1985) stated that television has advantages and disadvantages related to its
effectiveness as a medium to broadcast advertising messages. The advantages are that the
information can be easily viewed, listened to, and pictured. Belch & Belch (2004) stated that
television is considered the ideal medium to advertise as advertisement exposure can showcase
the most attractive side of the products. The disadvantage of TV advertising is the higher cost,
that fact that it can be highly confusing medium that the audience is selective. In emerging
market like Nepal, television is the most popular medium for information and entertainment
A television advertisement is a span of television programming produced and paid for by an
organization that conveys a message fully controlled by an advertiser. Television advertising is
also popularly known as television commercials. Television advertisement gives information to a
large number of people than any other medium, comparatively at lower cost per audience. Due to
its satellite facility, television programs are viewed globally. In today‟s glamorous world, we can
show all aspects of products, services or organizations through advertisement with human
appeal. The vast majority of television advertisements today consist of brief advertising spots,
ranging in length from a few seconds to several minute infomercials. Advertisement of these
sorts has been used to sell imaginable over the years, from the household products to political
campaigns.
In today‟s world, the popularity of television is increasing day by day. It is useful for the
advertisers to know the popularity of television among different people. Different types of
advertisement appeal to the different customers differently. Careful analysis should be done in
this regard for the success of any advertisement campaign. Hence, the main objective of this
study is to provide useful information regarding the effectiveness of television advertising to
different people in urban areas.
Objective
Main objective of this study is to analyze the media and advertising preferred by
Nepalese audience on the basis of age, education, gender etc. It also analyzes the effectiveness of
message preferred by different target audiences.
Method
This study is a descriptive research based on survey method. It is based on the pilot study of my
ph d work. It is based on primary data. Self administered closed ended questionnaires were

ISSN: 2362-1303 (Paper) | eISSN: 2362-1311(Online)
JOURNAL OF ADVANCED ACADEMIC RESEARCH (JAAR) January 2015
Vol. 2. No. I www.phdcentre.edu.np 85
distributed between January 20, 2012 to February 25, 2012. Data was collected from students
and faculty members of various colleges under Tribhuvan University within Kathmandu valley
offering business education.100 questionnaire were distributed on the basis of judgmental
sampling. Among them 80 questionnaires were returned. Among the 80 respondents from the
urban areas of Kathmandu valley, 40 respondents were male and 40 were female. Simple
descriptive statistical tools have used to analyze the data.
Result and discussion
Among the 80 respondents, collected data from various age and education background is
presented as follows:
Table No. 1: Education and age of Respondents
Source: Field Survey 2012
Advertising and Customers’ Preference
While taking advertising decisions, advertisers should be aware about the types of television
advertisement preferred by the audiences. In this study all advertisements are divided into four
categories consisting musical advertisement, glamorous advertisements, simple advertisements
and all or mixed types of advertisements.
The table shows the age level and their advertisement preference.
Table No. 2: Age and Advertisement Preference
Age
No. of
Respondents
Musi
cal %
Glamor
ous %
Simp
le %
All
Types %
Total
%
Below
15 16 10
62.
5 3
18.
75 1
6.2
5 2
12.
5 100
16-25 16 9
56.
25 5
31.
25 0 0 2
12.
5 100
26-35 16 6 37. 7 43. 0 0 3 18. 100
Education Level Sample Size Age Group Sample Size
Below S. L. C. 16 Below 15 16
S. L. C. 16 16-25 16
Plus 2 16 26-35 16
Graduate 16 36-45 16
Post Graduate 16 Above 45 16
Total 80 Total 80

ISSN: 2362-1303 (Paper) | eISSN: 2362-1311(Online)
JOURNAL OF ADVANCED ACADEMIC RESEARCH (JAAR) January 2015
Vol. 2. No. I www.phdcentre.edu.np 86
5 75 75
36-45 16 5
31.
25 9
56.
25 1
6.2
5 1
6.2
5 100
Above
45 16 8 50 7
43.
75 0 0 1
6.2
5 100
Total 80 38 31 2 9
Source: Field Survey 2012
It was found that 62.5% of people who are below 15 years, preferred musical ad mostly.
Likewise, 56.25% of people who are 16-25 years also preferred musical ad but 43.75% of the
people who are 26-35years old and 56.25% of people who are 36-45 years old preferred
glamorous advertising. Similarly, 50% of the people who are above 45 years old liked musical
advertising.
Consumers‟ preferences on the basis of literacy level on Television advertising is presented in
the following table.
Table No. 3: Literacy – wise Consumers’ Preference on Television Advertising
Source: Field survey: 2012
The above table shows that people who belong to below SLC and SLC preferred to musical
advertisement i.e. 68.75% and 56.25% respectively. Most of the plus 2 and graduate people i.e.
50% and 56.56% respectively preferred to glamorous advertisement. Again, people who belong
to post graduate group preferred to musical advertisement are by 62.5%.
The above table shows that plus 2 and graduate people are influenced by glamorous
advertisement and below SLC, SLC and post graduate people are influenced by musical
advertisement.
Likewise consumer preference on television advertisement as per the gender is presented
as follows:
Education Level
Sample
Size
Musi
cal %
Glam
orous % Simple %
All
Types %
Tot
al
Below SLC 16 11 68.75 3 18.75 1 6.25 1 6.25 16
SLC 16 9 56.25 4 25 2 12.5 1 6.25 16
Plus two 16 6 37.5 8 50 0 0 2 12.5 16
Graduate 16 5 31.25 9 56.25 0 0 2 12.5 16
Post Graduate 16 10 62.5 3 18.75 2 12.5 1 6.25 16
Total 80 41 51.25 27 33.75 5 6.25 7 8.75 180

ISSN: 2362-1303 (Paper) | eISSN: 2362-1311(Online)
JOURNAL OF ADVANCED ACADEMIC RESEARCH (JAAR) January 2015
Vol. 2. No. I www.phdcentre.edu.np 87
Table No. 4: Gender-wise Preference of Television Advertisements
Gende
r
Sampl
e Size
Musica
l % Glamorous %
Simpl
e %
All
Types % Total
Male 40 20 50 15
37.
5 3 7.5 2 5 40
Female 40 25
62.
5 10 25 1 2.5 4
1
0 40
Total 80 45 25 4 6 80
Source: Field survey: 2012
The above table shows the preference of advertisement according to gender. Out of 40 male 50%
of respondents are found to like the musical advertisements, 37.5% of respondents preferred to
glamorous advertisements, 7.5% of respondents preferred simple advertisements and 5%
respondents liked all types of advertisements. Regarding female respondents, 62.5% preferred
musical advertisements, 25% preferred glamorous advertisements, 2.5% preferred simple
advertisements and 10% preferred all types of advertisements.
From the above analysis, it can be concluded that female consumers seems to give more
priority to musical advertisements than the glamorous advertisements. For more clarity the above
information is presented in following diagram.
From above diagram, it is clear that out of the total 40 male respondents 50%
respondents preferred to musical advertisements, 35% preferred to glamorous advertisements,
8% preferred to simple advertisements and 5% respondents preferred to all types of
Male
Female

ISSN: 2362-1303 (Paper) | eISSN: 2362-1311(Online)
JOURNAL OF ADVANCED ACADEMIC RESEARCH (JAAR) January 2015
Vol. 2. No. I www.phdcentre.edu.np 88
advertisements. Similarly, among the 40 female respondents, 62.5% preferred to musical
advertisements, 25% preferred to glamorous advertisements, 2.5% referred to simple
advertisements and 10% preferred to all types of advertisements.
The table below presents the consumers way of watching television when advertisements arte
telecasted.
Table No. 5: Consumers Television Watching Habit
Gender Sample Size Watching % Not watching %
Male 40 30 75 10 25
Female 40 34 85 6 15
Total 80 64 80 16 20
Source: Field survey: 2012
The above table presents the habit of people watching television living in Kathmandu. Out of
total 80% people are found to have the habit of watching television. Among them, 75% male and
85% female are found that they are watching television where female percentage is higher than
male by 10%. Television watching habit of male and female is also explained by the following
bar diagram.
From the above figures, it is clear that percentage of women watching television seems higher
than male by 10%. Likewise, 25% of male are found not to have the habit of watching television
whereas female percentage is only 15%.
Male
Female

ISSN: 2362-1303 (Paper) | eISSN: 2362-1311(Online)
JOURNAL OF ADVANCED ACADEMIC RESEARCH (JAAR) January 2015
Vol. 2. No. I www.phdcentre.edu.np 89
Consumers’ Preferences to the Product
Consumer prefers different product by considering various factors. Advertisement is one
of the important factors which affect the consumers‟ preferences. The result of consumers‟
preferences to the various type of product is presented in the table below:
Table No. 6: Consumers’ Preferences to the Product Advertised
Description No. of Respondents %
Product frequently advertised 65 81.25
Product not advertised 15 18.75
Total 80 100
Source: Field survey: 2012
The above table shows the number of consumers‟ preferences to the product. Out of the 80
respondents, 81.25% responded that they prefer the frequently advertised product whereas
18.75% respondents opined that they prefer to buy the product that is not advertised.
From the above analysis, it can be concluded that majority of the consumers give the priority to
the frequently advertised product.
Consumers’ Preferences to the Media
Consumers prefer different media according to their needs, interests and priority. There
are various media available in the market like newspaper, magazine, radio, television, pamphlets
and poster etc. The situation of consumers‟ preferences to the various media is presented in the
table below:
Table No. 7: Consumers’ Preferences to the Media
Media No. of Respondents %
Newspaper 10 12.5
Magazine 2 2.5
Television 63 78.75
Radio 4 5
Pamphlets & Posters 1 1.25
Total 80 100
Source: Field Survey 2012
The above information presents the number of respondents preferring the media. Out of
the total 80 respondents, majority of respondents 78.75% preferred to television whereas rest of

ISSN: 2362-1303 (Paper) | eISSN: 2362-1311(Online)
JOURNAL OF ADVANCED ACADEMIC RESEARCH (JAAR) January 2015
Vol. 2. No. I www.phdcentre.edu.np 90
the respondents opined that they prefer Newspaper, Magazine, Radio and Pamphlets & posters
by 12.5%, 2.5%, 5% and 1.25% respectively.
From the above analysis, it can be concluded that Television advertisement seems to be
the most popular media.
The present study was conducted to analyze the media and advertising preferred by Nepalese
audience on the basis of age, education, gender. The result revealed that majority of the
Nepalese audiences‟ preferred musical advertisements. This finding is in line with previous study
of Bhandari (1984). Results also revealed that most of the audiences preferred to watch
television. In the opinion of Agrawal and Singh (1985) nearly 70% of Indian customers prefer to
watch television. In comparison to previous findings Nepalese audiences‟ preference towards
television is higher than Indian customer. Mittal (1994) concluded this study that 75% urban
customer purchase product because of advertising. Comparing these findings to the present
study, majority of the customers (81.25%) preferred frequently advertised products which is
higher than previous findings.
Conclusion
Majority of the respondents who belong to age group below 15 and 16 to 25 preferred musical
advertisement by 62.5% and 56.25% respectively. In the context of age group 26 to 35 and 36 to
45 majority of the respondents preferred glamorous advertisement i.e. 43.75%, and 56.25%
respectively. Again age group above 45, majority of the respondents i.e. 47.5% preferred musical
advertisement.
In case of education-wise preferences to the advertisement indicate that most of the lower
educated preferred to musical advertisement. Likewise most of the male as well as female
customers preferred musical advertisements.
In relation to television watching habits, majority of the respondents (80%) found to have the
habit of watching television. The percentage of women respondents seems to be higher than male
respondents regarding television viewing habit.
Similarly, majority of the customers (81.25%) preferred frequently advertised products.
In relation to the consumers‟ preference towards media, most of the respondents (78.58%)
responded that they preferred to television. Thus, television is the most popular media for
advertisement.

ISSN: 2362-1303 (Paper) | eISSN: 2362-1311(Online)
JOURNAL OF ADVANCED ACADEMIC RESEARCH (JAAR) January 2015
Vol. 2. No. I www.phdcentre.edu.np 91
References
Aaker, Batra & Myers (1995). Advertising Management. New Delhi: Prentice Hall of India
Private Limited.
Amatya, S.K. and Gopal Thapa (2005). Fundamenetals of Advertising. Kathmandu: Khanal
Publication Pvt.Ltd.
Belch, Belch & Purani (2010). Advertising and Promotion. New Delhi: Tata McGraw Hill
Education Private Limited.
Clow & Baack (2006) Integrated Advertising, Promotion and Marketing Communications. New
Delhi: Prentice Hall of India Private Limited.
Chunawalla, S. A. (2010). Advertising, Sales and Promotion Management. Mumbai: Himalaya
Publishing House.
Chunawalla, S. A. and R. C. Sethia (1999). Foundations of Advertising: Theory and Practice.
Mumbai: Himalaya Publishing House.
Kumar & Mittal (2002). Advertising Management. New Delhi: Anmol Publications Private
Limited.
Shah & D’Souza (2009). Advertising and Promotions an IMC perspective. New Delhi: Tata
McGraw Hill Education Private Limited.
Sontakki, C. N. (1999). Advertising . Mumbai: Kalyani Publishers.
Thapa, Gopal (2008). Dictionary of Marketing. Kathmandu: Buddha Academic Enterprises Pvt.
Ltd.
Thapa, Gopal and D. K. Neupane (2009). Marketing Management. Kathmandu: Ashmita
Publication Pvt. Ltd.
Wofff, K Howard and Prem Raj Pant (2010). Social Science Research and Thesis Writing.
Kathmandu: Buddha Academic Enterprises Pvt. Limited.

ISSN: 2362-1303 (Paper) | eISSN: 2362-1311(Online)
JOURNAL OF ADVANCED ACADEMIC RESEARCH (JAAR) January 2015
Vol. 2. No. I www.phdcentre.edu.np 92
Application of Structural-Functional Theory in Risk of HIV
Transmission
Tej Bahadur Karki1 &Prof. Dr. Ritu Prasad Gartoulla
2
1PhD Scholar, Dr. K. N. Modi University, Newai, Rajasthan, India
2Medical Anthropologist, Institute of Medicine, Maharajgunj, Kathmandu, Nepal
Corresponding Author
Tej Bahadur Karki
Email: [email protected]
Abstract
The study was conducted with the purpose to explore the interrelationship and interdependency
between the individual and whole social systems that effects on HIV transmission during the time
of social changes and transformation. The concept of structural functional theory was adopted to
conduct this study. Phenomenological approach was applied to explore the experiences of risk
behavior of human immune deficiency virus (HIV) transmission among the respondents working
in Kathmandu valley (Kathmandu, Lalitpur and Bhaktpur districts). This Research was based on
exploratory research design and simple random technique was used to select the respondents.
The Study was conducted in Kathmandu valley among garment factory workers, brick factory
workers, transport workers and health workers. Individual factors, socio-cultural factors,
economic factors, educational factors and political factors are found as a functional unit of
society which functions to influence the risk of HIV transmission in whole social structure. So,
the finding is individual should be aware on the negative function of factors which can influence
to increase the risk of HIV transmission. Cultural practices should be open to discuss about the
risk behavior of people regarding their connection with HIV transmission.
Keywords: HIV Transmission, Risk, Structural-functional, Theory
Introduction
Structural Functionalism is a sociological theory that attempts to explain why society functions
the way it does by focusing on the relationships between the various social institutions that
makes up society (e.g., government, law, education, religion, etc). According to the Woodger,
1948, Merton, 1968, Structural functionalism has a lengthy history in both the biological
sciences and the social sciences. Functionalism's history goes back to Aristotle's study of
ultimate causes in nature or of actions in relation to their ends, or utility. Developed in l7th
century France, Montesquieu's doctrine of separation of powers is based on the notion of
functions that are best undertaken separate from each other as a means of ensuring stability and
security (Fisher, 2010).Structural functional, especially in the work of Talcott Parsons, Robert
Merton, and their students and followers, was for many years the dominant sociological theory
(Ritzer, 2011).

ISSN: 2362-1303 (Paper) | eISSN: 2362-1311(Online)
JOURNAL OF ADVANCED ACADEMIC RESEARCH (JAAR) January 2015
Vol. 2. No. I www.phdcentre.edu.np 93
Functionalists tend to view social and political units in more holistic, organic terms. Susser said
"Social practices are said to have a functional role in sustaining the system as a whole" (1992, p.
204).Functionalism became important when Darwin's evolutionary theories began to influence
thinking about human behaviour Darwin conceived of the idea of survival in functional terms.
Each function was important to the survival of the whole system.Francesca M. Cancian (19ó8)
describes two distinctive types of functional analysis: traditional and formal.Traditional
functional analysis is the most commonly used. It is based on the premise that all social
patternswork to maintain the integration and adaptation of the larger system. Formal functional
analysis is called formal because itdoes not include a theoretical orientation or a
substantivehypothesis about events. Rather it examines the relationshipsbetween elements. It
contrasts with the traditionaltype of analysis in that its proponents reject the attributesof
"integration" and "adaptation" in favour of an examinationof the equilibrating or feedback
functions in systems (Fisher, 2010).
The general diagram of structural Functionalism is used as bellow:
Sources: (WIKIBOOKS, 2014)

ISSN: 2362-1303 (Paper) | eISSN: 2362-1311(Online)
JOURNAL OF ADVANCED ACADEMIC RESEARCH (JAAR) January 2015
Vol. 2. No. I www.phdcentre.edu.np 94
Talcott Parsons is one of the Grand Old Men of world of sociology. Regarding the structural
functionalism of Parsons, he talks about the structure of general Action systems which covers the
cultural system, social system, behavioral organism and personality system. In social system, he
also talks about the relationship between the actors and social system (Ritzer, 2011). On the one
hand, actor has primary role to develop the social system. On the other hand, social system
controls the function of actor. During the course of life cycle of one individual, people play the
various roles and do the practices. Regarding the risk behavior; willingly or unwillingly people
engage in risk taking behavior which creates the problem in life. In connection with this point of
Parsons, the main focus of this study is to explore the interrelationship and interdependency
between the individual and whole social systems and their effects on HIV transmission during
the time of social changes and transformation. The broader research question of this study is that
how interaction between the individual and social systems plays the roles to increase the risk of
HIV transmission?
Method
The study was conducted among the 404 transport workers, brick factory workers, health
workers and garment factory workers working in Kathmandu valley (Kathmandu, Lalitpur and
Bhaktpur districts) by using the self-administered structured questionnaires. Besides that, 22 in-
depth interview and 5 case studies were collected. Concurrent mixed design was adopted to
collect and analyse the data. Phenomenological approach was applied to collect the human
experience in their phenomena and how people understand the risk behaviour of HIV
transmission and how various social factors associate with individual behaviour of people. The
findings of primary data was compared and discussed with secondary data. Random sampling
was done to select the respondents. The study was conducted in 2013.
Result and Discussion
The study has identified the interaction between the different factors and social systems which
affect in increasing the risk of HIV transmission in society as extraneous factors. Researcher
found that there is direct relation between the individual factors; knowledge and attitude towards
HIV and practices related with sexual behavior and there is indirect relationship found between
other factors (e.g. socio-cultural, educational, economic and political) and risk of HIV
transmission.
Out of total 404 respondents, 29.46% were females and rests were males. Among them, 57%
respondents were married and rest was unmarried. As per ethnicity 53.2% of respondents were
Janjati (ethnic group) followed by 30.44% Chhetri and Brahmin, 11.38% Dalit and 5%
Muslim/Yadav were participated in research. The mean age of the respondents was 27.31 years
and Std. Deviation was 7.614, which ranges from 15 years to 49 years. As data of education level
of respondents shows that majority (25.50%) of respondents had primary level of education

ISSN: 2362-1303 (Paper) | eISSN: 2362-1311(Online)
JOURNAL OF ADVANCED ACADEMIC RESEARCH (JAAR) January 2015
Vol. 2. No. I www.phdcentre.edu.np 95
followed by 27.48% respondents from the Higher secondary level and above, 21.29% from lower
secondary level, 13.12% from secondary level, 7.92% from literate and 4.7% were illiterate
respondents.
The following pictorial diagram shows the interrelationship of the different functional units in
society and its effect on risk of HIV transmission.
Figure 1: Structural-Functional Theory of Risk of HIV Transmission
The terms functional analysis and structural analysis both have been applied to a great variety of
approaches in many disciplines. According to Susses, the functional approach is used more often
than any other method in the study of Western political science (Susser, 1992). Structural
functional theory is one of the broader approaches which can be used to explain the functional
relation of different units of society and its effect on change and development of society.
Researcher has adopted the lens of this theory to explore the functional relationship of different
factors of society to influence the changing scenarios of HIV and AIDS.
In course of this study, it was also observed that in some cases, cultural factors of Nepalese
society had direct contribution increasing the risk of HIV transmission. Cultural practices are
different in different geographical location. Some closed society has rigid types of cultural
Marriage system
Family relation
Social stigma
Gender relation
Cultural Taboos
Poverty/income
Migration
Conflict
Government Policy
Educational status
of Individual
Knowledge
Attitude
Practices

ISSN: 2362-1303 (Paper) | eISSN: 2362-1311(Online)
JOURNAL OF ADVANCED ACADEMIC RESEARCH (JAAR) January 2015
Vol. 2. No. I www.phdcentre.edu.np 96
taboos on discussion of sexual behavior which is contributing in HIV transmission. A wife
cannot ask to husband about their sexual behavior as well as husband cannot ask to wife about
her sexual interest. Culturally, people become used to the blind trust on sex partners. They have
to adjust anyhow in their own cultural because culture affects the personality. According to the
Rao, man is not only a social animal but also a cultural being. Man‟s social life has been made
possible because of culture. Cultural is something that has elevated him from the level of animal
to the heights of man. Man cannot survive as man without culture. It represents the entire
achievements of mankind (Rao, 2008).
"My husband became the HIV positive due to lack of awareness on HIV and AIDS, there may be
negligence also. On the other hand, my blind trust towards my husband made me also HIV
positive."
- 28 years married HIV Positive Female
"Being a HIV positive is shameful work. So, if my family members or I would be infected then I
could not disclose HIV status in communities".
- Brick factory worker, 32 years married male
Economic factors have also significant role for the increasing risk of HIV transmission. In the
Nepalese case, migration is one of the main causes of inadequate opportunity of employment in
own country. Actually, the roots cause of migration is poverty. Poverty is explained as a social
problem (Heald, 2010, p. 140). According to the report of National Health Committee of New
Zealand, poverty can be defined in absolute or relative terms. Poverty has long been recognized
as an important determinant of ill health. People who are poor have worse self-reported health,
higher rates of disability, and higher rates of death, disease and injury. Children from poor
families have higher rates of illness, injury and death than other children (June 1998, p. 24). To
explain the basic causes of poverty, sociologists are increasingly focusing their attention on
society as a whole and particularly on the stratification system, rather than studying the poor in
isolation. As Peter Townsend states, 'The description, analysis and explanation of poverty in any
country must proceed within the context of a general theory of stratification'. Theories of
stratification should provide theories of poverty since the poor are part of stratification systems-
the bottom part (Heald, 2010, pp. 160-161). In connection between the poverty and HIV
transmission, UNAIDS has reported that „Poverty is also seen as enhancing vulnerability to HIV.
The growing rates of HIV and AIDS in economically disadvantaged communities of the
industrialized world and in developing countries emphasize the role played by poverty in fuelling
the epidemic. There has long been worldwide recognition of the negative impact of poverty on
health and of the need to undertake aggressive action towards poverty alleviation and
development‟ (UNAIDS, 1998, p. 8).

ISSN: 2362-1303 (Paper) | eISSN: 2362-1311(Online)
JOURNAL OF ADVANCED ACADEMIC RESEARCH (JAAR) January 2015
Vol. 2. No. I www.phdcentre.edu.np 97
Similarly, we can observe the close relationship between the political factors and risk of HIV
transmission because politics can determine the quality and effectiveness of policy of concerned
government. Nepal Government has developed next 5 years (2011-2016) National HIV and
AIDS strategy following the 2006-2011 strategy. As stated in introduction of strategy, building
on the achievements, lessons and experiences of the past five years, the strategy (2011- 2016)
will focus on the following key points:
- Addressing the all dimensions of continuum of care from prevention to treatment care
and support
- Effective coverage of quality interventions based on the epidemic situation and
geographical prioritization
- Health system and community system strengthening
- Integration of HIV services into public health system in a balanced way to meet the
specific needs of target populations
- Strong accountability framework with robust HIV surveillance, program monitoring and
evaluation to reflect the results into NHSP‐II and National Plan. (National Centre for
AIDS and STD Control, November 2011)
"I can't blame society in increasing the risk of HIV. Government should be more careful about
the treatment and job opportunities of people living with HIV (PLHIV)."
-29 years married HIV Positive male
In the perceptual data collected from the respondents shows that there is significant association
between the conflict and risk of HIV transmission but analysis of secondary data of HIV
prevalence generated by Nepal Government shows that there is similar trend of up and down
ratio of HIV prevalence in pre-conflict, during conflict and post-conflict period of Nepal in last
20 years.
Education is one of the key factors which determine the personality of people. The study found
that education has vital role to increase the risk of HIV transmission. There is significant
association found among the response of different target groups regarding the influence of
education on risk behaviour of people.
‘In transport sectors, more time people live out of home and want to do romance so when they
use to take drink then they desire sex. Comparatively now a days some educated people are also
involved in transport sectors. Somehow they are aware about the HIV transmission. Education
is major factor which is associated with risk taking behaviour. Those people who have good
education they are definitely aware about the HIV transmission.‟

ISSN: 2362-1303 (Paper) | eISSN: 2362-1311(Online)
JOURNAL OF ADVANCED ACADEMIC RESEARCH (JAAR) January 2015
Vol. 2. No. I www.phdcentre.edu.np 98
- Transport workers (36 years, Mr. KC, resident of Kaski district (Western Region of
Nepal).
The commutative effect of all these factors goes in individual factors because personality is
affected by the whole cultural phenomena of society. How one people grow, observe the
phenomena, got knowledge, develop their attitude and do the practices are depend on the
structural function of social variables. In this study, researcher try to divide the individual factors
into three main variables i.e. knowledge, attitude and practices. The observation found that
around 95% people have knowledge of HIV transmission, only around 41% are ready to disclose
their HIV status in society and only around 25% has practices to use the condom in their 1st
sexual contact. Risk of HIV transmission can be reduced only by safer practices but it is found
very weak. Various socio-cultural factors are responsible to determine the good practices in any
movement.
"when attachment becomes closer with any sex partner and both will be ready for sexual
intercourse, everything forgets at that time, when & how HIV transmits, and none cares either it
transmits or not".
- Brick Factory worker (26 years resident of Salyan district)
Conclusion
People existence can only be meaningful when they interact with their phenomena. Personality
cannot be developed in isolation so it is natural and mandatory that social variables should
functional together to change the social structure. We can observe the positive and negative both
types of influence of functional units in social change. HIV is one of social problem; it is
acquired disease so it can be prevented by using the social treatment theory. Community and
individual should be aware on the function of social variables which can directly or indirectly
influence risk behaviour of HIV transmission. HIV can only be transmitted when individual
behaviour will be wrong in practices. Cultural practices are one of the key drivers of personality
development; but culture is manmade so individual can change the cultural practices if it
becomes problematic for individual life. E.g. we have to convince for open discussion on sexual
practices in our close society also which can give the broader knowledge of sexual transmitted
infections. So, in researcher come to the conclusion that risk of HIV transmission should be
observed from the holistic perspective of social structure.

ISSN: 2362-1303 (Paper) | eISSN: 2362-1311(Online)
JOURNAL OF ADVANCED ACADEMIC RESEARCH (JAAR) January 2015
Vol. 2. No. I www.phdcentre.edu.np 99
References
Fisher, J. R. (2010). System Theory and Structural Functionalism. In J. T. Breuning (Ed.), 21st
Century Political Science: A Reference Handbook (Vol. 1, pp. 71-80). Loss Angeles,
London, New-Delhi, Singapore, Washington DC: Sage & Reference.
Heald, M. H. (2010). Sociology : Themes and Perspectives. New Delhi, India: OXFORD
University Press.
National Centre for AIDS and STD Control. (November 2011). NATIONAL HIV/AIDS
STRATEGY 2011 ‐ 2016. Teku, Kathmandu, Nepal: Government of Nepal: Ministry of
Health and Population.
National Health Committee . (June 1998). The Social, Cultural and Economic Determinants of
Health in New Zealand: Action to Improve Health. New Zealand: National Advisory
Committee on Health and Disability.
Rao, C. N. (2008). Sociology: principles of sociology with an Introduction to Social Thought.
Ram Nagar, New Delhi: S. Chand & Company Ltd.
Ritzer, G. (2011). Sociological Theory (5th Edition). India: Tata McGraw-Hill.
Susser, B. (1992). Apptooches to the stdy of polit¡cs. New York: Macmillan.
UNAIDS. (1998). Expanding the global response to HIV/AIDS through focused action Reducing
risk and vulnerability: definitions, rationale and pathways. Geneva 27 – Switzerland:
Joint United Nations Programme on HIV/AIDS.
WIKIBOOKS. ( 2014, April 2). Retrieved May 13, 2014, from WIKIBOOKS: Open Books for an
open world: http://en.wikibooks.org/wiki/Sociological_Theory/Structural_Functionalism

ISSN: 2362-1303 (Paper) | eISSN: 2362-1311(Online)
JOURNAL OF ADVANCED ACADEMIC RESEARCH (JAAR) January 2015
Vol. 2. No. I www.phdcentre.edu.np 100
Socio-cultural Causes of Gender Disparity in Nepalese Society
Anita Shrestha1& Prof. Dr. Ritu Prasad Gartoulla
2
1PhD Scholar, Mewar University, Rajasthan, India
2Professor, Institute of Medicine, TU, Kathmandu, Nepal
Corresponding Author
Anita Shrestha
Email: [email protected]
Abstract
Gender is socially constructed idea and disparity is the problem created by the society. The study
was conducted from the socio-cultural perspective so the main objective of this study was to
identify the socio-cultural causes of gender disparity in five different ethnic groups: Newar,
Magar, Tamang, Rai/Limbu and Brahmin/Chhetri of Kathmandu Valley. Total 390 respondents
were selected randomly from the all ethnic groups. Except the role of religion, the role of
culture, patriarchy system, social perception, sources of income, level of education, political
awareness & involvement and gender based division of labor had significant effect to increase
the gender disparity in society. Political announcement that Nepal as a secular country had
effected in the perception and practices related to the religious activities of people also. The
government should address the socio-cultural problem and further researcher should explore the
strategies to address the problem of gender disparity.
Keywords: Causes, Disparity, Gender, Nepal, Society, Socio-culture
Introduction
Society is the web of social relationship in one hand and on the other hand culture is man-made.
People developed the culture to maintain the social norms, values and historical civilization in
society. The cultural transformation and orientation determines the personality of every
individual. There is interrelationship and interdependency between the culture and personality.
When people feel suffocation because of the rigid cultural pattern, they try to break the
traditional culture and reform the new culture to live the life in comfort zone.
Men and women always comprise the two halves of the population in every society. However,
the rights and opportunities accorded to women have never been on per with the rights and
opportunities accorded to men of the said societies. These differences in the opportunities of life
found between men and women have forced women in many contexts to bear a subordinate
position. This can be seen in a number of sectors, namely the economic, political, social, and
cultural life of each society (Baker, 1999, p. 16).

ISSN: 2362-1303 (Paper) | eISSN: 2362-1311(Online)
JOURNAL OF ADVANCED ACADEMIC RESEARCH (JAAR) January 2015
Vol. 2. No. I www.phdcentre.edu.np 101
In many countries, the birth of a boy becomes a reason to celebrate, whereas the birth of a girl is
a disaster. Selective abortions of female fetuses and female infanticide are no exception,
resulting in unnatural gender ratios.
A British Sociologist, Ann Oakley and a supporter of the Women's Liberation Movement, comes
down strongly on the side of culture as the determinant of gender roles rather than biology. The
sexual division of labour is supported and justified by a belief and value system which states that
gender roles are normal, natural, right and proper (Heald M. H., 2010, p. 373). Study of the
history of human society reveals that in no society of the world has women enjoyed absolute
equality on par with men. Everywhere they were subjected to inequality, discrimination and
exploitation (Rao, 2008, p. 813).Connell (1987) elaborated one of the most integrative theories
of gender. This theory is important because it allows for an understanding of the complex
interplay between gender and power beyond the individual perspective. A central emphasis of
this theory is that the analysis of gender involves a three-part structural model involving sexual
division of labor (e.g. financial inequality), sexual division of power (e.g. authority), and the
structure of affective attachments (e.g. social norms) (Ngozi C Mbonu, 2010, p. 2).
In the Nepalese context, this gender based discrimination is mainly faith based, embedded with
fear and myth, and is deep routed in the culture and social norms (SAMUHIK ABHIYAN, Mar
2008, p. 25).Gender disparity is also one effect of cultural transformation. People practice the
discriminatory behavior unknowingly also. They think it as the continuation of their culture. So,
here researcher has tried to identify the role of socio-cultural practices to determine the degree of
gender disparity in study areas.
Method
The study was based on the descriptive cross-sectional research design. Total 390 respondents
were selected from the 5 different ethnic groups; Newar, Magar, Tamang, Rai/Limbu and
Brahmin/Chhetri for the study, among them respondents were equally distributed in three
districts; Kathmandu, Lalitpur and Bhaktpur. So, 130 respondents were selected from the each
district. Following the objectives of this study, researcher had collected data by using the 5
points Likert scales. Simple random sampling technique was applied to select the respondents.
Statistical analysis; cross tab, Chi-square and correlation test was done to show the significant
association between the different ethnic groups.
Result
The demographic information of the study showed that there was 50.3% male followed by 49.7%
female were participated in study. Data shows that 4.6% wife were illiterate followed by 1.8%
husband. Similarly, in total, 7.7 husbands had master and above degree followed by only 2.1%
wife. In the study, the age distribution of wife shows 20 to 60 years followed by 24-60 years of

ISSN: 2362-1303 (Paper) | eISSN: 2362-1311(Online)
JOURNAL OF ADVANCED ACADEMIC RESEARCH (JAAR) January 2015
Vol. 2. No. I www.phdcentre.edu.np 102
husbands. Mean age of wife was 35.46 years followed by 39.13 years of husband. Marriage age
of wife was found in between the 15-31 followed by husband had in between 16-35 ages. The
mean age of wife during her marriage was 21.53 years followed by husband had 24.84 years.
1. Patriarchy system and gender disparity
Majority of the Nepalese societies had patriarchy system. Male headed societies are there. So,
researcher also collected the perceptual data on patriarchy system as a cause of gender disparity
in community.
Table 2: Patriarchy system and gender disparity
Patriarchy system causes the gender disparity in your community
Caste of Respondents
Total Newar Magar Tamang
Rai or
Limbu
Brahmin or
Chhetri
Strongly
Agree
Count 48 51 48 62 32 241
% of Total 12.4% 13.2% 12.4% 16.0% 8.3% 62.3%
Agree Count 17 22 20 11 34 104
% of Total 4.4% 5.7% 5.2% 2.8% 8.8% 26.9%
Neutral Count 5 1 1 3 1 11
% of Total 1.3% 0.3% 0.3% 0.8% 0.3% 2.8%
Disagree Count 3 3 5 2 7 20
% of Total 0.8% 0.8% 1.3% 0.5% 1.8% 5.2%
Strongly
Disagree
Count 3 1 3 0 4 11
% of Total 0.8% 0.3% 0.8% 0.0% 1.0% 2.8%
Total Count 76 78 77 78 78 387
% of Total 19.6% 20.2% 19.9% 20.2% 20.2% 100.0%
Sources: Field survey, 2014
62.3% respondents strongly agreed that patriarchy system is one cause of gender disparity
followed by 26.9% reported agree in the above statement. Caste wise, 16% Rai or Limbu
followed by 13.2% Magar, 12.4% Newar and 12.4% Tamang and 8.3% Brahmin/Chhetri
respondents strongly agreed on the perception that patriarchy system causes the gender disparity
in all ethnic communities.
2. Cultural taboos causes the gender disparity
Socio-cultural orientation determined the personality development of individual. Cultural norms
play the role of social law so people become compelled to accept the cultural barrier. Regarding

ISSN: 2362-1303 (Paper) | eISSN: 2362-1311(Online)
JOURNAL OF ADVANCED ACADEMIC RESEARCH (JAAR) January 2015
Vol. 2. No. I www.phdcentre.edu.np 103
this issue, the table no. 2 shows that 21.2% respondents were strongly agreed that cultural taboos
causes the gender disparity followed by 30.1% agreed.
The data shows that regarding the cultural taboos as a cause of gender disparity, around 50%
respondents were found in neutral and disagree.
Table 3: Cultural taboos causes the gender disparity
Cultural taboos (female should be obedient, they should not speak in front of Father-in-law
or brother-in-law) causes the gender disparity
Caste of Respondents
Total Newar Magar Tamang
Rai or
Limbu
Brahmin or
Chhetri
Strongly
Agree
Count 15 18 19 11 19 82
% of Total 3.9% 4.7% 4.9% 2.8% 4.9% 21.2%
Agree Count 15 32 29 21 19 116
% of Total 3.9% 8.3% 7.5% 5.4% 4.9% 30.1%
Neutral Count 9 3 9 10 6 37
% of Total 2.3% 0.8% 2.3% 2.6% 1.6% 9.6%
Disagree Count 23 14 12 27 16 92
% of Total 6.0% 3.6% 3.1% 7.0% 4.1% 23.8%
Strongly
Disagree
Count 15 10 8 8 18 59
% of Total 3.9% 2.6% 2.1% 2.1% 4.7% 15.3%
Total Count 77 77 77 77 78 386
% of Total 19.9% 19.9% 19.9% 19.9% 20.2% 100.0%
Chi-Square Tests
Value Df Asymp. Sig. (2-sided)
Pearson Chi-Square 31.636a 16 .011
Symmetric Measures
Value Asymp. Std. Errora Approx. T
b Approx. Sig.
Interval by
Interval Pearson's R .011 .053 .214 .831
c
Sources: Field survey, 2014
There was significant association found on perception of five different ethnic groups (p = .011)
regarding the cultural taboos as a causes of gender disparity. Similarly, there was significant
relation (r = .011, p = .053) found on perception of female and male regarding the cultural taboos
as a causes of gender disparity.

ISSN: 2362-1303 (Paper) | eISSN: 2362-1311(Online)
JOURNAL OF ADVANCED ACADEMIC RESEARCH (JAAR) January 2015
Vol. 2. No. I www.phdcentre.edu.np 104
3. Social perception toward gender that Male is stronger than female causes the gender
disparity
Social perception is important to understand the meaning of phenomena. Social behavior is
strongly guided by the social understanding. The table no. 3 shows that 63.6% respondents
strongly agreed that gender disparity is caused by the social perception towards the gender that
males are stronger than females followed by 21.8% agreed on the same statement.
Table 4: Social perception toward gender
Social perception toward gender that Male is stronger than female causes the gender
disparity
Caste of Respondents
Total Newar Magar Tamang
Rai or
Limbu
Brahmin or
Chhetri
Strongly
Agree
Count 39 54 49 60 43 245
% of Total 10.1% 14.0% 12.7% 15.6% 11.2% 63.6%
Agree Count 22 18 15 14 15 84
% of Total 5.7% 4.7% 3.9% 3.6% 3.9% 21.8%
Neutral Count 4 1 2 1 4 12
% of Total 1.0% 0.3% 0.5% 0.3% 1.0% 3.1%
Disagree Count 12 3 7 3 11 36
% of Total 3.1% 0.8% 1.8% 0.8% 2.9% 9.4%
Strongly
Disagree
Count 0 1 3 0 4 8
% of Total 0.0% 0.3% 0.8% 0.0% 1.0% 2.1%
Total Count 77 77 76 78 77 385
% of Total 20.0% 20.0% 19.7% 20.3% 20.0% 100.0%
Chi-Square Tests
Value Df Asymp. Sig. (2-sided)
Pearson Chi-Square 30.391a 16 .016
Symmetric Measures
Value Asymp. Std. Errora Approx. T
b Approx. Sig.
Pearson's R .006 .055 .115 .909c
Sources: Field survey, 2014
There was significant association found on perception of five different ethnic groups (p = .016)
regarding the perception of society that males are stronger than females as a causes of gender

ISSN: 2362-1303 (Paper) | eISSN: 2362-1311(Online)
JOURNAL OF ADVANCED ACADEMIC RESEARCH (JAAR) January 2015
Vol. 2. No. I www.phdcentre.edu.np 105
disparity. Similarly, there was significant relation (r = .006, p = .055) found on perception of
female and male regarding the perception of society that males are stronger than females as a
causes of gender disparity.
4. Religious belief that female should do the fasting for the welfare of family causes the
gender disparity
In total, 44.6% respondents were found disagree that religious belief that female should do the
fasting for the welfare of family is one cause of gender disparity followed by 41.9% agree on the
same statement. Comparatively, more people were found disagree on this cause than the no. of
people who agree.
Table 5: Religious belief
Religious belief that female should do the fasting for the welfare of family causes the
gender disparity
Caste of Respondents
Total Newar Magar Tamang Rai or Limbu Brahmin or
Chhetri
Strongly
Agree
Count 13 11 9 17 17 67
% of Total 3.4% 2.9% 2.3% 4.4% 4.4% 17.4%
Agree Count 10 24 16 21 23 94
% of Total 2.6% 6.2% 4.2% 5.5% 6.0% 24.5%
Neutral Count 7 9 21 10 5 52
% of Total 1.8% 2.3% 5.5% 2.6% 1.3% 13.5%
Disagree Count 29 25 18 25 20 117
% of Total 7.6% 6.5% 4.7% 6.5% 5.2% 30.5%
Strongly
Disagree
Count 17 8 12 5 12 54
% of Total 4.4% 2.1% 3.1% 1.3% 3.1% 14.1%
Total Count 76 77 76 78 77 384
% of Total 19.8% 20.1% 19.8% 20.3% 20.1% 100.0%
Chi-Square Tests
Value Df Asymp. Sig. (2-sided)
Pearson Chi-Square 37.008a 16 .002
Symmetric Measures
Value Asymp. Std. Errora Approx. T
b Approx. Sig.
Pearson's R -.130 .053 -2.564 .011c
Sources: Field survey, 2014
There was significant association found on perception of five different ethnic groups (p = .016)
regarding the religious belief on fasting of female as a causes of gender disparity. Similarly,

ISSN: 2362-1303 (Paper) | eISSN: 2362-1311(Online)
JOURNAL OF ADVANCED ACADEMIC RESEARCH (JAAR) January 2015
Vol. 2. No. I www.phdcentre.edu.np 106
there was significant relation (r = .006, p = .055) found on perception of female and male
regarding the religious belief on fasting of female as a causes of gender disparity
5. Income causes the gender disparity
Income of male and female also play the role to determine the gender relationship in family and
society. Regarding this issue, 66.8% respondents strongly agree that income causes the gender
disparity followed by 20.6% respondent found in agree in the same.
Table 6: Income causes the gender disparity
Income causes the gender disparity
Caste of Respondents
Total Newar Magar Tamang
Rai or
Limbu
Brahmin or
Chhetri
Strongly
Agree
Count 50 53 50 64 39 256
% of Total 13.1% 13.8% 13.1% 16.7% 10.2% 66.8%
Agree Count 14 22 18 8 17 79
% of Total 3.7% 5.7% 4.7% 2.1% 4.4% 20.6%
Neutral Count 3 0 1 3 6 13
% of Total 0.8% 0.0% 0.3% 0.8% 1.6% 3.4%
Disagree Count 6 3 5 2 7 23
% of Total 1.6% 0.8% 1.3% 0.5% 1.8% 6.0%
Strongly
Disagree
Count 3 0 3 1 5 12
% of Total 0.8% 0.0% 0.8% 0.3% 1.3% 3.1%
Total Count 76 78 77 78 74 383
% of Total 19.8% 20.4% 20.1% 20.4% 19.3% 100.0%
Sources: Field survey, 2014
Ethnicity wise, out of 66.8% responses, 16.7% Rai/Limbu found strongly agrees that income is
one cause of gender disparity compared with 10.2% Brahmin/Chhetri.
6. Illiteracy causes the gender disparity
Education is the light of knowledge. So, it supports to understand the social norms and values
and also teach to solve the social problem and makes life easy for the social adjustment. Gender
disparity is one social problem, created from the perception and practices of society. So,
researcher asked respondent about the role of education in gender disparity.

ISSN: 2362-1303 (Paper) | eISSN: 2362-1311(Online)
JOURNAL OF ADVANCED ACADEMIC RESEARCH (JAAR) January 2015
Vol. 2. No. I www.phdcentre.edu.np 107
Table 7: Illiteracy causes the gender disparity
Illiteracy causes the gender disparity
Caste of Respondents
Total Newar Magar Tamang
Rai or
Limbu
Brahmin or
Chhetri
Strongly
Agree
Count 54 56 53 62 47 272
% of Total 14.0% 14.5% 13.7% 16.1% 12.2% 70.5%
Agree Count 14 19 20 13 18 84
% of Total 3.6% 4.9% 5.2% 3.4% 4.7% 21.8%
Neutral Count 3 0 3 1 3 10
% of Total 0.8% 0.0% 0.8% 0.3% 0.8% 2.6%
Disagree Count 4 2 0 2 6 14
% of Total 1.0% 0.5% 0.0% 0.5% 1.6% 3.6%
Strongly
Disagree
Count 2 0 1 0 3 6
% of Total 0.5% 0.0% 0.3% 0.0% 0.8% 1.6%
Total Count 77 77 77 78 77 386
% of Total 19.9% 19.9% 19.9% 20.2% 19.9% 100.0%
Sources: Field survey, 2014
In total, 70.5% respondents strongly agree that illiteracy is one cause of gender disparity
followed by 21.8% agree on the same cause. In total, more than 90% respondents agreed that
illiteracy is one cause of gender disparity.
7. Lack of political awareness causes the gender disparity
Politics of country prepared the rules and regulation of social development and change. 27.2%
respondents followed by 25.1% respectively strongly agree and agree on the statement that lack
of political awareness causes the gender disparity. Around 30% respondents disagree on the
same cause followed by 19.1% had neutral response.
Table 8: Lack of political awareness causes the gender disparity
Lack of political awareness causes the gender disparity
Caste of Respondents
Total Newar Magar Tamang
Rai or
Limbu
Brahmin or
Chhetri
Strongly
Agree
Count 27 13 28 23 13 104
% of Total 7.0% 3.4% 7.3% 6.0% 3.4% 27.2%
Agree Count 18 23 17 27 11 96
% of Total 4.7% 6.0% 4.4% 7.0% 2.9% 25.1%

ISSN: 2362-1303 (Paper) | eISSN: 2362-1311(Online)
JOURNAL OF ADVANCED ACADEMIC RESEARCH (JAAR) January 2015
Vol. 2. No. I www.phdcentre.edu.np 108
Neutral Count 11 18 17 14 13 73
% of Total 2.9% 4.7% 4.4% 3.7% 3.4% 19.1%
Disagree Count 16 13 8 10 17 64
% of Total 4.2% 3.4% 2.1% 2.6% 4.4% 16.7%
Strongly
Disagree
Count 5 9 7 4 21 46
% of Total 1.3% 2.3% 1.8% 1.0% 5.5% 12.0%
Total Count 77 76 77 78 75 383
% of Total 20.1% 19.8% 20.1% 20.4% 19.6% 100.0%
Chi-Square Tests
Value Df Asymp. Sig. (2-sided)
Pearson Chi-Square 45.841a 16 .000
Symmetric Measures
Value Asymp. Std. Errora Approx. T
b Approx. Sig.
Interval by Interval Pearson's R .134 .052 2.644 .009c
Sources: Field survey, 2014
There was significant association found on perception of five different ethnic groups (p = .000)
regarding the illiteracy as a causes of gender disparity. Similarly, there was significant relation (r
= .134, p = .052) found on perception of female and male regarding the illiteracy as a cause of
gender disparity.
8. Gender based division of labor causes the gender disparity
We can observe in many work places that there is gender based division of labor. Basically,
physically males are taken stronger than females. In government job also, very few female can
be seen in the decision making level.
Table 9: Gender based division of labor causes the gender disparity
Gender based division of labor causes the gender disparity
Caste of Respondents
Total Newar Magar Tamang
Rai or
Limbu
Brahmin or
Chhetri
Strongly
Agree
Count 55 55 52 65 42 269
% of Total 14.4% 14.4% 13.6% 17.0% 11.0% 70.2%
Agree Count 13 16 14 8 22 73
% of Total 3.4% 4.2% 3.7% 2.1% 5.7% 19.1%
Neutral Count 3 2 5 1 3 14
% of Total 0.8% 0.5% 1.3% 0.3% 0.8% 3.7%
Disagree Count 5 2 2 3 6 18

ISSN: 2362-1303 (Paper) | eISSN: 2362-1311(Online)
JOURNAL OF ADVANCED ACADEMIC RESEARCH (JAAR) January 2015
Vol. 2. No. I www.phdcentre.edu.np 109
% of Total 1.3% 0.5% 0.5% 0.8% 1.6% 4.7%
Strongly
Disagree
Count 1 1 3 1 3 9
% of Total 0.3% 0.3% 0.8% 0.3% 0.8% 2.3%
Total Count 77 76 76 78 76 383
% of Total 20.1% 19.8% 19.8% 20.4% 19.8% 100.0%
Sources: Field survey, 2014
In response of participants, 70.2% respondents responded strongly agree followed by 19.1%
responded agree that gender based division of labour is one cause of gender disparity. In total,
around 90% respondents agreed that gender based division of labour causes the gender disparity.
Discussion
As the finding of the study showed that around 90% respondents had agreed patriarchal culture
had contributed to gender disparity in Nepalese society. From the previous study, it was reported
that historically the development of Hindu society has been one of ever increasing hierarchy –of
hierarchy based explicitly on an ideology of a parallel development of institutions concerned
with the control of female sexuality… [Whenever] purity is the primary idiom of status
differentiation, there is certain to be a major preoccupation with the maintenance of female
chastity. This is especially so in India where the purity of the caste is a direct function of the
purity of its womenfolk. The male members of the caste are in large measure dependent for their
status rating on the purity of their women (Allen, 1982). It is commonly acceptable that culture
dominates the personality of people. In many cultures, arranged or forced marriages are still very
common, often resulting in sexual abuse. Women often do not have the same rights regarding
divorce or inheritance. Polygamy is also a cause of discrimination (Spagnoli, 2008). As (Clafer,
1997) states, that standards Norms are that standards that define the obligatory and expected
behaviors of people in various situations. This reflects belief of society about correct and
incorrect behaviors. Once these behaviors become second nature, members of a society, do not
able to analyze every situation consciously and decide what there appropriate actions ought to
be. Norms also can inhibit the type of thinking that might result in challenges to the dominant
members of society (Dr. Safdar Rehman Ghazi, 2011, p. 102).In Nepalese society; usually, girls
and women take meals last in the family as the norms of specific ethnic groups. They have to
serve the food first to the elderly people, male members and children of the family before taking
food themselves. They have to make do with the remaining food after the males, elderly and
children eat. On the other hand they prefer to provide nutritious food to their sons first by
considering that the boys will have to do hard work in future to earn money for the family. They
provide such food to daughters after providing for their sons. Because of this, the women are
malnourished compared to the men and it is even more difficult to go outside to do hard work
(SAMUHIK ABHIYAN, Mar 2008, p. 37).

ISSN: 2362-1303 (Paper) | eISSN: 2362-1311(Online)
JOURNAL OF ADVANCED ACADEMIC RESEARCH (JAAR) January 2015
Vol. 2. No. I www.phdcentre.edu.np 110
Similarly, religion is one culture of people. Religion creates one rule to control the society.
People may not ignore the basic belief of religion so it may determine the level of gender
disparity in society. The previous study explained that one of the main causes of gender
discrimination is religion. Many religions place women below men, and create a patriarchal
society. Religion was, to Marx, "the opium of the people" (Marx 7 Engels, 1964; Stark &
Bainbridge, 1996). Ellis (1986) referred to religion as a form of psychopathology. But in this
study, less than 50% (only around 42%) agreed that religion causes the gender disparity.
The study found that more than 50% respondents agreed that level of political awareness causes
the gender disparity in Nepal. The previous study showed that in terms of ethnic participation in
the political parties and their sister organizations; there is overwhelming majority of the
Brahmins and Chhetries. From the inclusion perspective, status of hill Janajati and Dalit is rather
satisfactory but Terai Middle Caste and Terai Janajati representing a huge portion of population
fall far behind (Nepal R. S., 2009, p. 9). Women‟s inclusion in decision making in local
governance remains a challenge. Proportionally, their inclusion is far lower at the local level
(around 10%) than at the national level (33%). This meets local governance reservations of one
woman member in each of the VDCs/DDCs but it is clear that these are way below national
reservations (DFIDN Nepal Operational Plan: Gender Equality and Social Inclusion Annex,
2011).
Gender based division of labour also found causes to gender disparity. According to the Gurung
1995; Brown 1997, in the context of rural Nepal, gender analysis is critical. Women are largely
responsible for the day-today today tasks within the farming system. Cash crop production and
the migration of males to urban work centers is increasing the workload of rural Nepali women
(2003, p. 338).
Conclusion
Gender disparity is one great problem of Nepal. It causes the problem in social change and
development. By nature, male and female are born equally and have equal rights in society and
Nation. The study found that more than 88% agreed patriarchy system causes the gender
disparity followed by around 51% agreed on culture taboos, 85% agreed on social perception
toward gender, 41% agreed on religious belief, 92% agreed on illiteracy, 88% agreed on income,
52% agreed on lack of political awareness and 89% agreed on gender based division of labor.
Nepal is announced as the secular (irreligious) country which gave the opportunity to accept the
any religion of own interest. So, it may be cause that less than 50% people agreed the role of
religion to create the gender disparity in society. Now, people become free from the rule of
religion. They want to change their religion if they felt problem because of the rigid norms of
religion. Basically, economic sources, social perception and patriarchy system were prevailed in
the all types of society so the study found that there was need of further research to explore the
corrective measure to address the socio-culture causes of gender disparity.

ISSN: 2362-1303 (Paper) | eISSN: 2362-1311(Online)
JOURNAL OF ADVANCED ACADEMIC RESEARCH (JAAR) January 2015
Vol. 2. No. I www.phdcentre.edu.np 111
References
Allen, M. (1982). 'Introduction: The Hindu View of Women' . In M. a. Allen, 'Women in India
and Nepal'. Canberra: Australian National University.
Baker, T. L. (1999). Doing Social Research (Third Edition). Singapore: McGraw Hill.
Brown, S. (2003). Spatial Analysis of Socioeconomic Issues: Gender and GIS in Nepal.
Mountain Research and Development, 23(4), 338-344.
Clafer, H. (1997). Women and equality changing patterns in American culture;. USA: Oxford
University Press.
Dr. Safdar Rehman Ghazi, D. S. ( 2011, March). Family Structural Norms Leading to Gender
Disparity in Pakistan. Asian Social Science, Vol. 7, (No. 3), 101-107.
Heald, M. H. (2010). Sociology : Themes and Perspectives. New Delhi, India: OXFORD
University Press.
Nepal, R. S. (2009). Women’s Political Participation,Empowerment and Inclusions in Nepal:
Survey Report and Strategic Action Plan, 2009. Kathmandu: Renaissance Society Nepal,
Women’s Democratic Network, Central Committee and United Nations Development
fund for Women (UNIFEM).
Ngozi C Mbonu, B. V. (2010). Gender-related power differences, beliefs and reactions towards
people living with HIV/AIDS: an urban study in Nigeria. BMC Public Health, 1-10.
Rao, C. N. (2008). Sociology: principles of sociology with an Introduction to Social Thought.
Ram Nagar, New Delhi: S. Chand & Company Ltd.
SAMUHIK ABHIYAN. (Mar 2008). GENDER & SOCIAL DISCRIMINATION STUDY: A
Comprehensive Assessment on Gender & Caste Based Discrimination in the Hill
Districts of Mid and Far Western Development Regions. Kathmandu Nepal: Government
of Nepal/ Government of Finland Rural Village Water Resources Management Project
(RVWRMP).
Spagnoli, F. (2008, May 9). Retrieved August 20, 2012, from A.P.A. - Blog:
http://filipspagnoli.wordpress.com/2008/05/09/human-rights-facts-10/