Tax Assignment and Revenue Sharing in Nigeria
36
Central Bank of Nigeria Economic and Financial Review Volume 44/1 March 2006 1 Tax Assignment and Revenue Sharing in Nigeria: Challenges and Options S.C. Rapu ∗ Assignment of taxes and revenue-sharing to different levels of government are politically divisive issues in Nigeria. Although these are not peculiar to the country, but they are unique because the federation has not been able to establish a widely acceptable system, despite the various fiscal commissions since 1946. The debate is the devolution of more taxes with high revenue yields to the state and local governments. The sub-national governments contend that, the currently assigned taxes are poor in terms of their bases and, therefore, revenues are not able to meet their expenditure expectations. Typical policy responses to these agitations by the Federal Government are minor adjustments in the revenue-sharing arrangements and the introduction of non-statutory transfers. Such measures have, however not assuaged the aspirations of the sub-national governments. Rather, the demand is a complete review of the sharing formula of the federally-collected revenue that could reduce to reasonable levels the existing vertical and horizontal fiscal imbalances. Similarly, some state governments are demanding for an increase in their shares of revenues derived from their jurisdictions. Specifically, the entrenchment of reasonable weights on derivation principle in the sharing of all revenue items is the most critical issue today. This paper build on the history as well as the current legal framework of tax assignment and revenue-sharing in Nigeria to identify the challenges while also drawing from the theoretical framework for policy options which will provide for a stable federal system in Nigeria. The paper recommended among others the strengthening of states internal revenue bases, adjustments on the vertical and horizontal revenue-sharing formula, effective compliance with the allocation of the mandatory 10% of states’ internally generated revenue. The paper concludes that changes to the existing tax assignment and revenue-sharing arrangements will go a long way in protecting our nascent democracy. Keywords: Federalism, Constitution, Inter-Governmental Fiscal Relations, Tax Assignments, Revenue-Sharing, Fiscal Imbalances JEL Classification Numbers: E62, H2, H71, H77 Author’s e-mail: [email protected] ∗ Rapu is a Deputy Director in the Research and Statistics Department, Central Bank of Nigeria, Minna. The views expressed in this paper are personal and should not be regarded as the views of the Central Bank of Nigeria. The author is grateful to the several reviewers and to the Management of the Research and Statistics Department for its financial support for the final review of this paper. All remaining errors are the author’s responsibility.
-
Upload
khangminh22 -
Category
Documents
-
view
1 -
download
0
Transcript of Tax Assignment and Revenue Sharing in Nigeria

Central Bank of Nigeria Economic and Financial Review Volume 44/1 March 2006 1
Tax Assignment and Revenue Sharing in Nigeria: Challenges and Options
S.C. Rapu∗
Assignment of taxes and revenue-sharing to different levels of government are politically divisive
issues in Nigeria. Although these are not peculiar to the country, but they are unique because the
federation has not been able to establish a widely acceptable system, despite the various fiscal
commissions since 1946. The debate is the devolution of more taxes with high revenue yields to the
state and local governments. The sub-national governments contend that, the currently assigned taxes
are poor in terms of their bases and, therefore, revenues are not able to meet their expenditure
expectations. Typical policy responses to these agitations by the Federal Government are minor
adjustments in the revenue-sharing arrangements and the introduction of non-statutory transfers.
Such measures have, however not assuaged the aspirations of the sub-national governments. Rather,
the demand is a complete review of the sharing formula of the federally-collected revenue that could
reduce to reasonable levels the existing vertical and horizontal fiscal imbalances. Similarly, some state
governments are demanding for an increase in their shares of revenues derived from their
jurisdictions. Specifically, the entrenchment of reasonable weights on derivation principle in the
sharing of all revenue items is the most critical issue today. This paper build on the history as well as
the current legal framework of tax assignment and revenue-sharing in Nigeria to identify the
challenges while also drawing from the theoretical framework for policy options which will provide
for a stable federal system in Nigeria. The paper recommended among others the strengthening of
states internal revenue bases, adjustments on the vertical and horizontal revenue-sharing formula,
effective compliance with the allocation of the mandatory 10% of states’ internally generated revenue.
The paper concludes that changes to the existing tax assignment and revenue-sharing arrangements
will go a long way in protecting our nascent democracy.
Keywords: Federalism, Constitution, Inter-Governmental Fiscal Relations, Tax
Assignments, Revenue-Sharing, Fiscal Imbalances
JEL Classification Numbers: E62, H2, H71, H77
Author’s e-mail: [email protected]
∗ Rapu is a Deputy Director in the Research and Statistics Department, Central Bank of Nigeria, Minna. The views expressed in this paper are personal and should not be regarded as the views of the Central Bank of Nigeria. The author is grateful to the several reviewers and to the Management of the Research and Statistics Department for its financial support for the final review of this paper. All remaining errors are the author’s responsibility.
2 Central Bank of Nigeria Economic and Financial Review March 2006
I. Introduction
he federal system in Nigeria has evolved since 1946 and it is recognized by
the constitutional division of administrative responsibilities and expenditure
assignments to different levels of government. Each government is
empowered by assignment of own taxes while that of the sub-national
governments are complemented with statutory and non-statutory transfers from the
federally- collected revenues by the Federal Government. However, tax assignment
and revenue-sharing in the Federal Republic of Nigeria have witnessed periodic
changes, following the recommendations of the different fiscal commissions
established by the various regimes. For example, under the military governments,
frequent changes of assignment of taxes and revenue-sharing formula through
changes in decrees was a notable feature of the federal system in Nigeria. It is
important to note that debates about tax assignment and revenue-sharing are not
peculiar to Nigeria. Nonetheless, Nigeria’s case is unique because the criteria for
vertical and horizontal distribution of revenue so far used have not enjoyed wide
acceptability.
Recently, agitations for a complete review of the assigned taxes to each level of
government and the revenue-sharing criteria have become the main politically
divisive issues. Specifically, some state governments are asking for the control of
revenues of natural resources found in their domains. This has also, generated
further debates that all non-oil revenue sources of the Federation Account should be
shared on the basis of derivation. However, because of the wide gap in tax bases
among the sub-governments and the need to achieve equal development across the
country, the political actors at the centre are not pre-disposed to accede to some of
these demands.
In this context, the debates suggest the need to review upwards the shares of the sub-
national governments in terms of statutory transfers from the federally-collected
revenue. Equally, the oil-rich states particularly and, the economically advantage
states, are asking for an upward review of the weights attached to the sharing of not
only revenues from natural resources but all non-oil revenue items. Similarly, current
debates emphasize the need to review the horizontal–sharing indices which tend to
favour the well established states (older states) and local governments to the
disadvantage of the states and local governments with low per capita income. These
debates are not limited to the fiscal relationships between the federal, state and local
governments but also extend to the relationships between the states and their local
T

Rapu: Tax Assignment and Revenue Sharing 3
governments. The local governments in view of their fiscally-disadvantage positions
in the federal system are also, demanding for a favourable revenue-sharing system
from the revenues of state governments from assigned taxes and fees known as ‘State
Allocations’ to complement transfers from the Federation Account and the VAT Pool
Account, including assigned taxes and fees.
The objective of this paper, therefore, is to identify the challenges of tax assignment
and revenue-sharing arrangements in Nigeria and proffer solutions. These policy
options are aimed first, to accommodate the growing desires of some state
governments wishing to acquire greater tax autonomy. Second, is to provide an
overall transfer system that will ensure more funds to the sub-national governments
to meet the Millennium Development Goals (MDGs) as well as achieve equalization
effect across the state and local governments in the country. With this background,
the rest of the paper is organized in four parts. Part two focuses on the theoretical
framework on tax assignment and revenue-sharing in a federal system. Part three
traces the evolution of tax assignment and revenue-sharing in Nigeria and evaluates
the outcomes. Part four identifies the challenges and makes suggestions for new
options. Part five summarizes and concludes the paper.
II Theoretical Expositions
II.1 Federalism and Assignment of Responsibilities
Federalism is defined as the amalgam of sub-units of national sovereign governments
that operate independently under a constitutionally defined sphere of functional
competence (Oates, 1972). It is a decentralization of responsibilities for expenditure
and revenue to different levels of government that ensures that each government
makes decisions and allocates resources according to its own priorities.
A number of economic arguments have been put forward to explain the adoption of
fiscal federalism. One strand of the literature emphasized economies of scale in the
provision of public goods, allocation and market efficiencies1. The other strand rests
mainly on the idea that ‘federal transfer system’ could be seen as a risk-sharing
mechanism against regional government’s revenue shocks2. On the contrary, political
arguments far enjoy higher considerations in the adoption of federalism. Thus,
federalism is favoured when a country’s population is not homogenous in terms of
ethnic, linguistic, cultural, racial or other important national characteristics. It is
1 Casella et all, 1990; Weber et all, 2001, Cremer, et all 1994, and Tanzi, 1995 2 See Persson et.all 1996; IKein et all, 1998, and Ahmad E, et all; 2003.

4 Central Bank of Nigeria Economic and Financial Review March 2006
used to induce the sub-units to remain in the federation while maintaining their
different individual characteristics. In sum, it is generally believed that fiscal
decentralization strengthens democracy by increasing interest in local politics.
II.2 Tax Assignment and Revenue Sharing in a Federal System
II.2.1 Tax Assignment
Tax assignment indicates the level of government that should be in control of a
particular tax and how this should be administered. In public finance theory, there is
no ideal system of tax assignment rather it varies from jurisdiction to jurisdiction,
under three options namely: the assignment of all tax bases to sub-national
governments only; the assignment of all tax bases to the central government only;
and the assignment of tax bases to each level of government (Martinez-Vasquez et al,
1995).
It is generally recognized that both distributional and macroeconomic management
considerations argue against the type of arrangement where all tax bases are assigned
to the sub-national governments only (such as practiced in the former Yugoslavia).
Under this system, the centre imposes surcharges on taxes collected by the sub-
national governments. Nonetheless, this arrangement cannot facilitate income re-
distribution through the tax system while it also deprives the central government any
tax tool as fiscal policy instrument for macroeconomic management. The major
advantage is that spending decisions are compatible with tax decisions and,
therefore, it encourages tax competitions among the sub-national governments (Ter
Minassian, 1997).
The assignment of all tax bases to the central government only is consistent with the
pursuit of macroeconomic objectives, while it generates more revenues owing to
economies of scale and prevents revenue losses and high costs of administration. This
presupposes that the central government is obliged to transfer some of the revenue
collected to the sub-national governments. However, this is most often critiqued
because it separates spending authorities from revenue–raising responsibilities.
Thus, the arrangement removes the links between the benefits derived from public
expenditures and their prices (taxes). The third option, which is the most frequently
observed, is the one which assigns own sources of revenue to each level of
government with a combination of inter/intra-governmental transfers. However, the
major problem with this system is the issue of overlapping of tax bases which means
likely increase in the burden of the tax payers (Tanzi, 1995).

Rapu: Tax Assignment and Revenue Sharing 5
Generally, the implementation of assigned taxes to any level of government follows
four methods, namely: independent legislation and administration, dual
administration, surcharges on federal taxes and tax-sharing. Independent legislation
and administration guarantees tax sovereignty, but sometimes inconsistent laws and
administrative bottlenecks could create problems and increase the cost of
administration. Dual administration means that both the centre and the units have
legislative and administrative responsibilities. Tax sharing implies that the central
government gives a fraction of revenue from some selected taxes collected from a
sub-national government to the same government e.g. automobile taxes. Under this
system, each sub-unit has latitude to choose their own rates. Surcharge implies that
the lower levels of government may surcharge the central government for the taxes
collected in its jurisdiction or vice-versa (Diaz-Cayeros and Mclure, 2000).
Three basic considerations which determine the type of taxes allocated to each level
of government are: administrative efficiency; the objective of the tax and the mobility
of the tax base (Shar, 1998). Following these broad principles, there is a general
consensus in the public finance theory, on the types of taxes that should be assigned
to the different levels of government (May, 1996).
• progressive re-distributive taxes are centralized e.g. personal income tax,
corporate tax;
• taxes for economic stabilization are collected centrally e.g. import and export
taxes;
• taxes on mobile factors of production are centralized e.g. capital gain taxes;
• residence-based taxes such as sales, excise and retail taxes can be
decentralized;
• destination-based taxes are also subject to central collection -Value Added
Tax;
• benefits tax/user charges are assigned to the level of government that
provides the services such as toll fees, hospital and school fees, motor licenses
etc.;
• taxes distributed on unequal basis to jurisdictions are administered by the
central government e.g. taxes on natural resources; and
• tax on immobile factors of production such as land and buildings are assigned
to the local jurisdictions e.g. property taxes are assigned to municipal
councils.
6 Central Bank of Nigeria Economic and Financial Review March 2006
II.3 Revenue–Sharing in a Federal System
Many federal systems attempt to achieve equity through revenue-sharing between the
central and regions/local bodies and among the regions/local bodies. This reflects the
fact that most times the high-yielding revenue types are assigned to the central
government while substantial and growing expenditures are devolved to the sub-
national governments, reflecting the presence of vertical fiscal imbalance. A vertical
fiscal imbalance is measured by the extent to which a tier of governments’
expenditures is financed by own assigned taxes (Marcelo et al, 2000). There is also
the horizontal fiscal imbalance, since the revenue-raising capacities of each of the
sub-national government vary and they face different costs, revenue-shocks and
demand pressures as they attempt to meet their assigned expenditures. In this
context, a horizontal fiscal imbalance is measured by the portion of which a sub-
national governments’ expenditures is financed by the assigned revenues compared
to their counterparts. Thus, revenue-sharing in a federal system to a large extent is
aimed at not only to re-distribute resources within the nation but also to effectively
control the borrowing capacities of the regions/local councils (Broadway and
Hobson, 1993)
Revenue-sharing in a federal system is implemented usually, through two main
options, namely: a tax-to-tax sharing system or pooling the entire tax receipts before
sharing. Tax-to-tax revenue sharing system (as practiced in Germany, Argentina, and
Brazil) has some problems. The system could provide incentives for the central
government to concentrate efforts more on those taxes that are either not shared or
to a lesser degree shared and those, which can achieve its stabilization policies. When
these happen, the entire national tax system may be distorted. For these problems,
many federations are attracted to a sharing system whereby, the entire proceeds are
paid into one account and the pooled resources distributed to all tiers of government
through agreed vertical and horizontal sharing procedures.
The procedures for the distribution of central revenue among the tiers of government
are enforced through approved laws or by the constitution, reflecting the
formula/indices for both vertical and horizontal sharing procedures. Thus, the
formula-based system provides for the predictability of revenue particularly, by the
sub-national governments, which is an essential ingredient for budget planning. It
also, removes the intensive lobbying associated with revenue-sharing when the
formula/indices are not specified and also, erases the fear of domination by the
minorities.

Rapu: Tax Assignment and Revenue Sharing 7
III Historical Background
III.1 Evolution of Tax Assignment and Revenue-Sharing Formula in
Nigeria
Federalism was adopted in Nigeria in 1946, when the Richards Constitution came into
existence, thus, recognizing the regional governments (North, West and East). The
Phillipson Fiscal Commission (1946) assigned direct taxes (personal income tax),
licenses and mining rents to the regions while taxes such as import and export duties,
excise duties, company income taxes were assigned to the Federal Government. In
recognition of the need to give the regions the right incentives for revenue
mobilization, the principle of derivation was given high priority for the distribution of
federally-collected revenue (Ahmad and Singh, 2003).
The adoption of the Macpherson Constitution in 1951 offered another opportunity to
re-visit the issues of tax assignment and revenue–sharing in Nigeria. Thus, the Hicks-
Phillipson Fiscal Commission (1951) was set up to review the existing tax assignment
and revenue–sharing procedures. To broaden the revenue base of the regions, the
commission recommended additional taxes, namely: sales tax on motor spirits, excise
tax on tobacco, and entertainment tax. The recommended revenue-sharing formula
adopted three principles: derivation, population and needs. Also, special grants for
police and education were transferred to the regions. Each of the regions was satisfied
with the new fiscal arrangements- the west was satisfied with the principle of
derivation, the north with the principles of population and needs while the east liked
the special grants.
In 1953, the Louis Chicks Fiscal Commission was established to fashion out new fiscal
arrangements based on the Lyttleton Constitution of regional self-government. The
Commission made a strong case for an upward review of the financial strength of the
Federal Government. Against this backdrop, mining rents and royalties, and personal
income taxes were brought under the purview of the Federal Government. The
proceeds were shared between the federal and the regional governments. Derivation
principle was again applied in the sharing of these resources but the major
impediment was the difficulty experienced in establishing the statistical data for the
distribution of these resources among the regions, hence, there were several
complaints (Ashwe, 1986).
As the country approached independence, the Raisman Fiscal Commission (1958)
reviewed the existing tax assignment and revenue-distribution. The Commission

8 Central Bank of Nigeria Economic and Financial Review March 2006
expanded the regional tax base and subsequently, allowed them the full share of the
proceeds from export taxes as well as excise duties and the Federal Government
received the share attributable to consumption in Lagos. The marketing boards were,
however, regionalized while the regions were empowered to fix producer’s price,
impose sales tax on the export commodities and retain the operational surpluses of
the boards. In addition, the administration and retention of proceeds from personal
income tax were reverted to the regional governments. It established the Distributable
Pool Account (DPA) into which the shares of federally-collected revenue for the
regions were deposited. Thus, the federally-collected revenue was 70 percent shared to
the Federal Government while 30 percent was paid into the DPA. The proceeds of the
DPA were distributed to the regions on the principles of derivation, population and
needs using the formula of 40, 31, 24, and 5 percent for the Northern, Eastern,
Western regions, and the Southern Cameroon, respectively (CBN, 2000).
Nigeria became a sovereign state in 1960; subsequently, the revenue-sharing formula
of the proceeds of the DPA was adjusted in 1961, following the pulling out from the
federation by the Southern Cameroon. The new adjustment allocated 42, 32.6, and
25.6 percent to the Northern, Eastern, and Western regions, respectively. A further
adjustment was made in 1963, as a result of the creation of the Mid-Western region.
Thus, the share of the Western region was divided between it and the Mid-Western
region at a ratio of 18.9 and 6.3 percent for the Western and the Mid-Western regions,
respectively. The Federal Government in 1964 commissioned the Binns Fiscal
Commission with the mandate to recommend a widely acceptable tax assignment and
revenue–sharing systems. Following those recommendations, the share of DPA from
federally–collected revenue was increased to 35 percent while that of the Federal
Government was reduced to 65 percent. Soon after, tensions were generated as the
report of the Commission abandoned the principle of derivation and adopted internal
revenue generation efforts, and needs. The tensions generated by the report later
became a serious political crisis, culminating into a military intervention in 1966.
The military take-over laid to rest the confusion, as the Federal Military Government
suspended the constitution and other related political activities. With decrees, the
Federal Military Government made frequent adjustments to tax assignment and
revenue-sharing formula. Thus, it retained most of the taxes such as company income
tax, petroleum profit tax, and excise duties. Others were the sharing of excise duties on
sale of tobacco and petroleum products and import duties on motor spirits equally
between the federal and the DPA; export duties on the basis of 3:2 by the state of

Rapu: Tax Assignment and Revenue Sharing 9
origin and the DPA; and the introduction of uniform tax structure on personal income
and sales taxes in 1975. The Federal Government replaced the regional marketing
boards with commodity boards and, thus, assumed the control of the operations of the
boards. In 1971, with Decree No.9, it retained all the off-shore oil revenue while
Decree No. 6 (1975) channeled all revenues to be shared by the states through the
DPA, except for the 20 percent of on-shore mining rents and royalties due to the states
of origin on the principle of derivation ((Okunrounmu, 1996).
Following the transition program, the Aboyade Fiscal Committee (1977) was set up to
review the fiscal arrangements in Nigeria. The committee renamed the DPA as
‘Federation Account’; however, most of the recommendations were considered too
technical and radically different from the past and, therefore, were rejected. The
Okigbo Fiscal Commission (1980) was established by the new civilian administration.
It accepted the earlier recommendation that all federally-collected revenue should be
transferred into the Federation Account, except those classified as Federal
Government independent revenue (Nigeria FR, 1980).
Since then, the revenue–sharing procedure has followed generally, the provisions of
the 1981 Revenue Allocation Act, except for minor changes in the shares of the
different tiers of government, including additional beneficiaries. Thus, between 1980
and1986, the share of the Federal Government was 55 percent, the state governments,
34.5 percent while that of the local governments increased from 8.0 percent in 1980 to
10.0 percent in 1986. In 1987, further amendments were made in the shares of the
state governments from 34.5 percent in 1986 to 32.5 percent. This boosted the share
of special funds, specifically, the Oil Mineral Producing Areas Development
Commission (OMPADEC) and general ecology (Table 1).
Another amendment to the revenue-sharing formula was made by the Federal Military
Government in 1990. Consequently, the federal and the state governments lost some
percentages in their shares in favour of the local councils and special funds. The shares
of the local councils and the special funds were raised to 15 and 5 percent, respectively.
Further amendments in 1993, increased the shares of the local councils and special
funds to 20 and 7.5 percent, respectively while that of the federal and state
governments declined to 48.5 and 24.0 percent, respectively. These amendments
came through the recommendations of a central finance commission established in
1989 namely: National Revenue Mobilization, Allocation and Fiscal Commission
(NRMAFC). While the previous fiscal commissions were ad-hoc, the NRMAFC is a

10 Central Bank of Nigeria Economic and Financial Review March 2006
permanent central fiscal commission of government. The 1993 amendment remained
in force until 2002 when the Supreme Court judgment of April 2002 made some
fundamental changes (Nigeria FR, 2002).
Transfers to states and local governments from the Federation Account used the
following indices: population (30 %); land mass/terrain (10 %); equality of states (40
%); internal revenue generation efforts (10 %); and social development indicators
(10%). The social development indices uses six factors namely: primary school
enrollment (24% of 10 %); direct number of students enrolled in secondary schools
(8% of 10%); and inverse number of students enrolled in secondary schools (8% of
10%); number of hospital beds (30% of 10 %); index of access to clean water (15% of
10%); and the quantity of rainfall (15% of 10%). However, there have been several
complaints on the statistical data for the revenue transfers.
An assessment of the inter-governmental fiscal relationship at the state governments
level showed that sharing of the state internally-generated between each state
government and the local governments was also, institutionalized. Each state
government was required by law to allocate 10.0 percent of its own internally-
generated revenue from assigned taxes to the local governments in that state. The
formula for the distribution of the allocation across the local governments varies from
jurisdiction to jurisdiction.
An important change in tax assignment during the military interregnum was the
replacement of states’ sales tax with value-added tax (VAT) in 1994, while the Federal
Government assumed the administrative responsibility. VAT proceeds are kept in the
VAT Pool Account and shared among the three tiers of government. Initially, the
Federal Government received only 20 percent of the VAT proceeds to cover
administrative costs while state and local governments received 50 and 30 percent,
respectively. In 1995, the Federal Government’s share was increased to 50 percent
while state and local governments received 30 and 20 percent, respectively. Again, the
vertical distribution was adjusted in 1996 to 35, 40, and 25 percent to the Federal,
State and Local Governments and later amended to 15, 50, and 35 percent to the
Federal, State and Local Governments, respectively, in 2000. Transfers to states and
local governments used the following indices: derivation (20%), Equity (50%) and
Population (30%). Similarly, in 1995, the Federal Government through Decree No.7
introduced the education tax. It stipulates the purpose and the distribution procedure
and established a National Trust Fund Board. The Board is entrusted with the

Rapu: Tax Assignment and Revenue Sharing 11
administration and disbursement of the proceeds while the Federal Inland Revenue
Service (FIRS) is charged with the collection (Table 2).
Table 1: Federation Account’s Revenue Allocation Formula (Per cent) Years Federal
Govt. Region/State Govt.
Local Govt.
Special Funds
FCT Derivation OMPADEC Gen. Statutory
Ecology 1960 70.0 30.0 - - - - 1963-67
65.0 35.0 - - - -
1980 55.0 34.5 8.0 2.5 - - 1982 55.0 34.5 10.0 - - - 0.51987 55.0 32.5 10.0 - - 1.5 1.0 -1990 50.0 30.0 15.0 1.0 1.0 1.5 1.0 0.51993 48.5 24.0 20.0 1.0 1.0 3.0 2.0 0.51995-98
48.5 24.0 20.0 1.0 1.0 3.0 2.0 0.5
1999 48.5 24.0 20.0 1.0 1.0 3.0 2.0 0.52000-02
48.5 24.0 20.0 1.0 13.0 0.0 2.0 0.5
Notes: 1. 1960 to 1976 Local Governments were funded through the Regional Governments. 2. The 13 percent derivation is on mineral oil revenue only Sources: Approved Budgets of the Government of the Federal Republic of Nigeria.
TABLE 2: VAT Revenue Allocation Formula (Percent)
1994 1995 1996 1997 1998 1999-2004
Federal Government 20 50 35 35 25 15
State Governments & FCT 50 30 40 40 45 50
Local Governments 30 20 25 25 30 35
Total 100 100 100 100 100 100
Sources: Approved Budgets of the Government of the Federal Republic of Nigeria
III.2 Evaluation of Tax Assignment and Revenue–Sharing
Performances in Nigeria
III.2.1 Tax Assignment Performance in Nigeria
Between 1948/49 and 1966/67 fiscal years, owing largely, to the favorable
decentralization of taxes, particularly with those taxes having high revenue-yielding
qualities to the regions, such as excise, export duties, etc., the regional governments
generated more of their revenues that covered own expenditures from internal
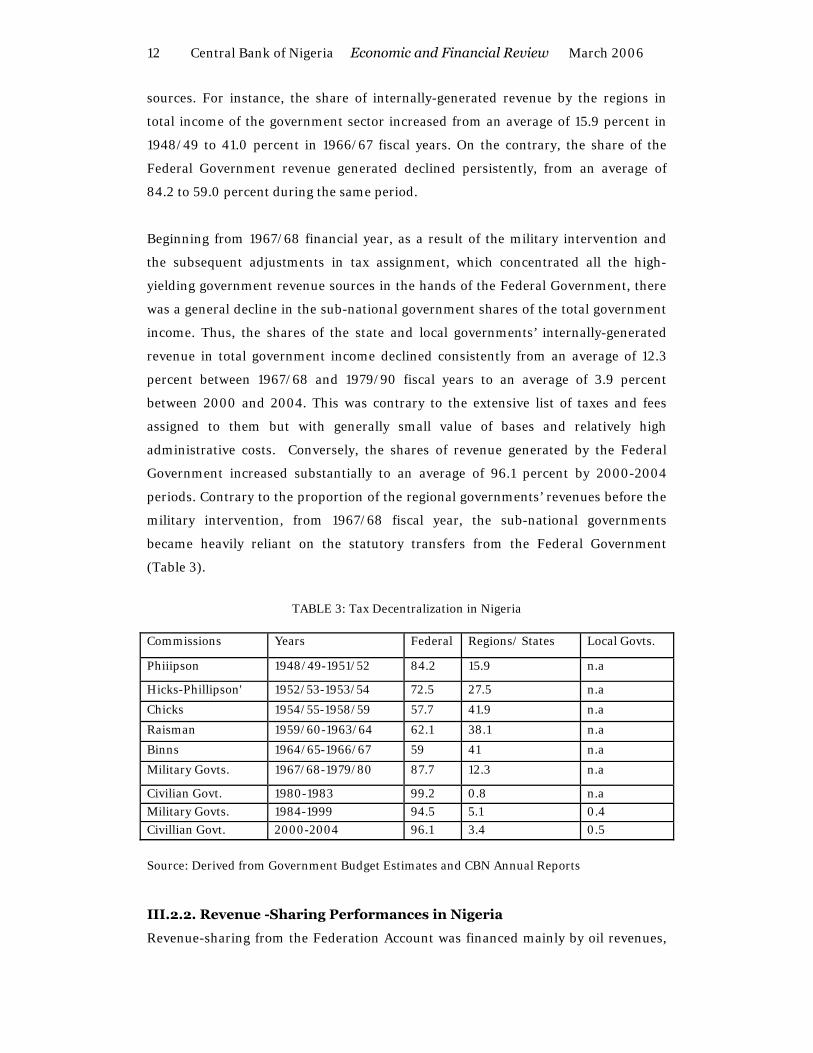
12 Central Bank of Nigeria Economic and Financial Review March 2006
sources. For instance, the share of internally-generated revenue by the regions in
total income of the government sector increased from an average of 15.9 percent in
1948/49 to 41.0 percent in 1966/67 fiscal years. On the contrary, the share of the
Federal Government revenue generated declined persistently, from an average of
84.2 to 59.0 percent during the same period.
Beginning from 1967/68 financial year, as a result of the military intervention and
the subsequent adjustments in tax assignment, which concentrated all the high-
yielding government revenue sources in the hands of the Federal Government, there
was a general decline in the sub-national government shares of the total government
income. Thus, the shares of the state and local governments’ internally-generated
revenue in total government income declined consistently from an average of 12.3
percent between 1967/68 and 1979/90 fiscal years to an average of 3.9 percent
between 2000 and 2004. This was contrary to the extensive list of taxes and fees
assigned to them but with generally small value of bases and relatively high
administrative costs. Conversely, the shares of revenue generated by the Federal
Government increased substantially to an average of 96.1 percent by 2000-2004
periods. Contrary to the proportion of the regional governments’ revenues before the
military intervention, from 1967/68 fiscal year, the sub-national governments
became heavily reliant on the statutory transfers from the Federal Government
(Table 3).
TABLE 3: Tax Decentralization in Nigeria
Commissions Years Federal Regions/ States Local Govts.
Phiiipson 1948/49-1951/52 84.2 15.9 n.a
Hicks-Phillipson' 1952/53-1953/54 72.5 27.5 n.a
Chicks 1954/55-1958/59 57.7 41.9 n.a
Raisman 1959/60-1963/64 62.1 38.1 n.a
Binns 1964/65-1966/67 59 41 n.a
Military Govts. 1967/68-1979/80 87.7 12.3 n.a
Civilian Govt. 1980-1983 99.2 0.8 n.a
Military Govts. 1984-1999 94.5 5.1 0.4
Civillian Govt. 2000-2004 96.1 3.4 0.5
Source: Derived from Government Budget Estimates and CBN Annual Reports III.2.2. Revenue -Sharing Performances in Nigeria
Revenue-sharing from the Federation Account was financed mainly by oil revenues,
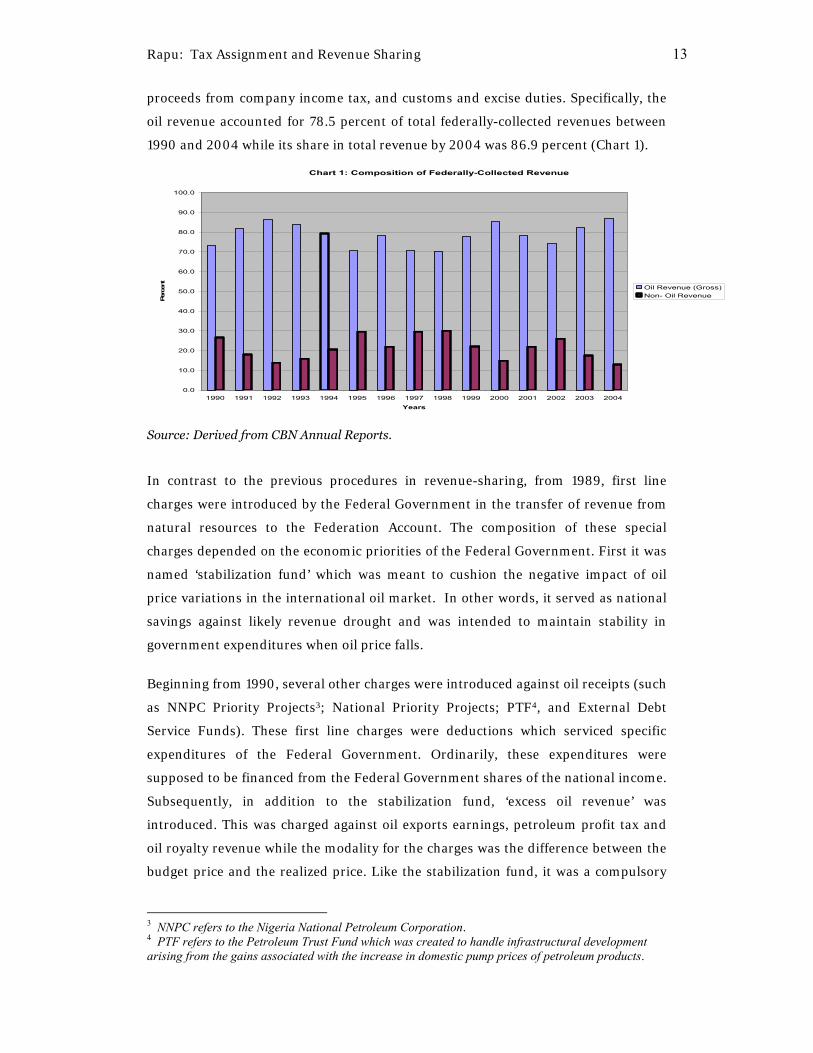
Rapu: Tax Assignment and Revenue Sharing 13
proceeds from company income tax, and customs and excise duties. Specifically, the
oil revenue accounted for 78.5 percent of total federally-collected revenues between
1990 and 2004 while its share in total revenue by 2004 was 86.9 percent (Chart 1).
Chart 1: Composition of Federally-Collected Revenue
0.0
10.0
20.0
30.0
40.0
50.0
60.0
70.0
80.0
90.0
100.0
1990 1991 1992 1993 1994 1995 1996 1997 1998 1999 2000 2001 2002 2003 2004Years
Perc
ent
Oil Revenue (Gross)Non- Oil Revenue
Source: Derived from CBN Annual Reports.
In contrast to the previous procedures in revenue-sharing, from 1989, first line
charges were introduced by the Federal Government in the transfer of revenue from
natural resources to the Federation Account. The composition of these special
charges depended on the economic priorities of the Federal Government. First it was
named ‘stabilization fund’ which was meant to cushion the negative impact of oil
price variations in the international oil market. In other words, it served as national
savings against likely revenue drought and was intended to maintain stability in
government expenditures when oil price falls.
Beginning from 1990, several other charges were introduced against oil receipts (such
as NNPC Priority Projects3; National Priority Projects; PTF4, and External Debt
Service Funds). These first line charges were deductions which serviced specific
expenditures of the Federal Government. Ordinarily, these expenditures were
supposed to be financed from the Federal Government shares of the national income.
Subsequently, in addition to the stabilization fund, ‘excess oil revenue’ was
introduced. This was charged against oil exports earnings, petroleum profit tax and
oil royalty revenue while the modality for the charges was the difference between the
budget price and the realized price. Like the stabilization fund, it was a compulsory
3 NNPC refers to the Nigeria National Petroleum Corporation. 4 PTF refers to the Petroleum Trust Fund which was created to handle infrastructural development arising from the gains associated with the increase in domestic pump prices of petroleum products.

14 Central Bank of Nigeria Economic and Financial Review March 2006
savings designed for macroeconomic management and was usually drawdown at
regular intervals and shared among the tiers of government according to the existing
revenue-sharing formula.
Thus, between 1989 and 2004, an average of 65.7 per cent of the federation account
revenues was distributed while the balance of 34.3 percent was deductions to satisfy
some specific Federal Government expenditures and/or served as national savings.
Of this balance, deductions in respect of some Federal Government dedicated
expenditures accounted for 21.0 percent while deductions as national savings were
13.2 percent of the total federation account revenues. The relative share of the
Federal Government in the amount distributed (including special funds and other
transfers unspecified) averaged 54.5 percent while allocations to the sub-national
governments (state and local governments and allocations in respect of 13%
derivation principle) accounted for 45.5 percent in the same periods.
A breakdown of the financial statement showed that between 1989 and 1993, the
share of the proceeds of the revenue actually distributed was 58.8 percent. This
increased to 59.9 percent during 1994 to 1999 periods and since 2000 it has
increased further to 79.5 percent. This was attributed to the improved transparency
in revenue-sharing by the civilian administration; implementation of the 13.0 %
derivation and the landmark judgment of the Supreme Court in April 2002.
Subsequently, the shares of the Federal Government in the amount distributed from
the Federation Account declined from an average of 57.5 percent in 1989-1993 fiscal
years to 56.4 and 49.3 percent in 1994-1999, and 2000-2004 periods, respectively.
Conversely, the shares of the sub-national governments increased from 36.6 percent
in 1989 to 52.6 percent in 2004. On the other hand, since the inception of VAT in
1994, the sub-national governments have enjoyed higher shares and accounted for
69.1 percent of the total proceeds in the VAT Pool Account (Table 4).
Another important assessment of the performance of revenue-sharing is the
evaluation of the rate of compliance to the mandatory 10 % allocation by the state
governments to the local governments. For example, between 1998 and 2004, an
average of 2.9 percent of total internally-generated revenue by the state governments
was allocated to the local councils across the country, indicating a shortfall of 7.3
percent. This showed that consistently, the state governments have not honored the
required lawful obligations to the local councils (Chart 2).

Rapu: Tax Assignment and Revenue Sharing 15
However, there are variations of compliance across the state governments. The long-
term implication of these variations is that the achievement of decentralization in
different states will occur at different times and nationally, could be delayed.
Nonetheless, recent actions of the Federal Government over withholding of local
councils allocations from the distributable revenue in some states is another landmark
in the fiscal relationships between the federal and state/local governments in Nigeria.

16 Central Bank of Nigeria Economic and Financial Review March 2006
1989 1990 1991 1992 1993 1994 1995 1996 1997 1998 1999 2000 2001 2002 2003 2004 In Billion Naira
Federal Account Revenue 49.3 83.5 98 185.6 187.2 190.7 294.2 343.6 364.7 347.3 712.4 1478 1703 1478 1964 3249Less:First Charge 2/ 10.2 38 44 96.2 80.3 76.6 123.6 165 157.5 103 265.9 489 568.2 58.6 143 808.3 of which Stabilization/Excess Funds 10.2 21.3 21.6 47.5 24.4 5.1 18.6 35 35 0 93 291.5 179.5 12.4 143 808.3 Others 0 16.7 22.4 48.7 55.9 71.5 105 130 122.5 103 172.9 197.5 388.7 46.2 0 0Federal Account: 3/ 39.1 45.5 54 89.4 106.9 114.1 170.6 178.6 207.2 244.3 446.5 989.3 1135 1419 1821 2441
Federally -Collected Rev.(net) 1/ 100 100 100 100 100 100 100 100 100 100 100 100 100 100 100 100Less:First Charge 2/ 20.7 45.5 44.9 51.8 42.9 40.2 42 48 43.2 29.7 37.3 33.1 33.4 4 7.3 24.9 of which Stabilization/Excess Funds 20.7 25.5 22 25.6 13 2.7 6.3 10.2 9.6 0 13.1 19.7 10.5 0.8 7.3 24.9 Others 0 20 22.9 26.2 29.9 37.5 35.7 37.8 33.6 29.7 24.3 13.4 22.8 3.1 0 0Federal Account: 3/ 79.3 54.5 55.1 48.2 57.1 59.8 58 52 56.8 70.3 62.7 66.9 66.6 96 92.7 75.1 of whichFederal Government 4/ 63.4 56.7 56.7 55.9 54.9 57.7 56 56 56 56.9 55.6 51.8 44.7 52 50.4 47.4State,Local Govts.&Derivation 5/ 36.6 43.3 43.3 44.1 45.1 42.3 44 44 44 43.1 44.4 48.2 55.3 48 49.6 52.6
VAT Pool Account 7/ (Naira Billion) 0 0 0 0 0 7.3 20.8 31 34 36.9 47.1 58.5 91.8 1.8.6 136.4 159.5Distribution:Federal 8/ 0 0 0 0 0 2 7.4 10.8 12.3 9.6 7.6 8.3 13.4 15.5 20 23.8State 0 0 0 0 0 5 6.3 11.2 13.8 16 28.7 30.6 44.9 52.6 65.9 96.2Local 0 0 0 0 0 0.3 3.6 4.6 6.8 9.2 9.6 13.9 20.1 18.7 39.6 46
Distribution:Federal 8/ 0 0 0 0 0 27.4 35.6 34.8 36.2 26 16.1 14.2 14.6 14.3 14.7 14.9State 0 0 0 0 0 68.5 30.3 36.1 40.6 43.4 60.9 52.3 48.9 48.4 48.3 60.3Local 0 0 0 0 0 4.1 17.3 14.8 20 24.9 20.4 23.8 21.9 17.2 29 28.8Source: Derived from CBN Annual Reports.
In Billion Naira
In Percent
Table 4: Composition of the Distribution of Centrally-Collected Revenue
In Percent

Rapu: Tax Assignment and Revenue Sharing 17
Chart 2: State Governments Revenue Allocation to Local Councils
0
50
100
150
1998 1999 2000 2001 2002 2003 2004Years
Naira
, Billion
State IGR (N, billion)Allocation to Local Councils (N, billion)
Source: Derived from CBN Annual Reports.
IV Challenges of Tax Assignment and Revenue-Sharing in
Nigeria
IV.1. Current Legal Framework for Fiscal Federalism in Nigeria
The fiscal chapter of the 1999 Constitution of the Federal Republic of Nigeria
stipulates the inter-governmental fiscal relations. The constitution maintains an
erstwhile division of functions between the various levels of government. However,
the state governments, out of its own powers and responsibilities, assign certain
functions and duties to the local councils while the constitution gives to the state
legislatures the prerogative to create councils. In tandem, the constitution assigns to
the Federal Government the power to legislate and collect revenues from company
income tax, custom and excise, education tax, custom levies/surcharges, value-added
tax and other independent revenue. The National Assembly also, legislates on
matters concerning personal income tax but the state governments have
administrative responsibilities and, therefore, retain the proceeds which they collect,
except for personal income taxes of the personnel of the armed forces and residents
of Abuja, FCT.
The constitution assigns to the state governments with the proceeds of the federal tax
on motor vehicle licenses and other powers to set rates and retain proceeds on some
other minor taxes including stamp duties, business registration fees and lease fees of
state lands. Taxing power on properties is assigned to the local governments, in
addition to some other minor taxes (Table 5).

18 Central Bank of Nigeria Economic and Financial Review March 2006
Table 5: Nigeria’s Tax Jurisdiction 1999 Federal Government State Government Local Government
1. Companies Income Tax Personal Income tax (on residents of the State)
Tenement rate
2. Petroleum Profits Tax Capital Gains Tax (on individuals only)
Shop and Kiosk Rates
3. Value Added Tax Stamp Duties (on individual only
Liquor Licence Fees
4. Education tax (on Companies only) Road taxes e.g. vehicle licenses
Slaughter slab fees
5. Capital Gains Tax (on Corporate Bodies and Abuja Resident
Betting and Gumming Taxes
Marriage, Birth and Death Registration Fees
6. Stamp Duties (on Corporate Bodies) Business Premises and Registration levy
Street name Registration Fees (excluding state and capital)
7. With-holding Tax (on Companies) Development levy (Max of N100 per annum on taxable individuals only)
Market/Motor Park Fees (excluding State-owned markets)
8. Personal Income tax (on personnel of the Armed Forces, Police, External Affairs Ministry and Residents of Abuja
Street Name Registration Fees (State Capital Only)
Domestic Animal Licence Fees
9. Mining rents and royalties Right of Occupancy Fees (State capital only)
Bicycle, Trucks, Canoe, Wheelbarrow, Carts and Canoe Fees
10. Customs Duties (i.e. import Duties and Export Duties
Market fees (where market is financed by State Government)
Right of Occupancy fees (excluding State Capital)
11. Excise Duties Miscellaneous revenues e.g. rents on property)
Cattle Tax
12. Miscellaneous revenues (e.g. Farming from Oil states. Rents on property etc –Largely Independent Revenue of the Federal Government.
Merriment fees
Radio and TV license fees
Vehicle Parking Fees
Public Convenience, Sewage and refuse Disposal Fees
Burial Ground and Religious places permit fees
Signboard and Billboard Advertisement Permit Fees.
Source: Federal Ministry of Finance
The constitution mentions revenue sharing in Chapter 4, Part C, Section VI, and
Paragraph 162. It establishes the “Federation Account” while it describes all federally-

Rapu: Tax Assignment and Revenue Sharing 19
collectible revenue except those classified as ‘independent revenue’ of the Federal
Government as Federation Account revenues. The National Assembly makes laws for
the distribution of the proceeds from that account. In addition, the 1999 Constitution
maintains that not less than 13 percent of mineral revenues should be transferred to
the states on the basis of derivation.
Third Schedule, Part N establishes the central finance commission - Revenue
Mobilization, Allocation and Fiscal Commission (RMAFC), with a major change in
the scope of the tasks compared with the past. Therefore, the commission is not only
to concern itself with the distribution of the divisible revenue but to suggest ways of
augmenting the revenue from other sources. In summary, it will examine the entire
gamut of issues concerning tax assignment and revenue- sharing in the country.
The constitution provides for the establishment of the state finance commission
known as the ‘State Joint Local Government Accounts Committee’. It requires that
allocations to the local councils from the Federation Account are to be paid in that
same account while the States’ Houses of Assembly make laws for the distribution
across local councils. The constitution stipulates that each state government pays a
specified percentage of its internally-generated revenue into the Joint Account. The
National Assembly is assigned with the power to specify the percentage of the state
allocation to the councils from own internal taxes and fees. However, the state
legislatures make laws for the sharing of the state allocation among the local councils.
Current allocations from the Federation Account are: Federal Government (52.68 %);
state governments (26.72%) and the local governments (20.60%). Indices for
transfers to the states and local governments have remained the same as in the 1981
Revenue Allocation Act. It is important to note that the constitution made no
mention of the VAT Pool Account and the Education Trust Fund. Rather it assumes
that proceeds from the two sources form part of the Federation Account. In addition,
the law makes it mandatory for the state governments to allocate 10% of its
internally-generated revenue to the local councils. The sharing formula varies from
state to state depending on the laws of the state legislatures (Nigeria, FR,2005).

20 Central Bank of Nigeria Economic and Financial Review March 2006
IV.2 Challenges of Tax Assignment and Revenue Sharing in
Nigeria
IV.2.1 Fiscal Imbalances- Vertical and Horizontal Fiscal Imbalances
Assessment of Vertical Fiscal Imbalance in Nigeria
The Federal Government initially generates roughly about 96.1 percent of the total
general government income. As a result a large vertical fiscal imbalance exists among
the tiers of government. For instance, in 1980- 2004 periods, the state and local
governments’ internal revenues only financed 12.1 percent of their expenditures. In
other words, about 87.9 percent of expenditures on the average were financed from
statutory and non-statutory transfers from the Federal Government. However, a
steady improvement was recorded between 2000 and 2004 periods. Thus, the sub-
national government’s total expenditure was financed to the tune of 9.9 percent from
its own internal revenue sources compared with 1.5 percent during 1993-1999
financial years (Table 6).
Similarly, studies on local government finance point out that that level of
government’s internally-generated revenues are able to meet minuscule portion of
the total expenditures, which is anywhere between 0.4 and 0.6 percent. In other
words, the administration of local taxes is unsatisfactory, reflected in low collections
of taxes and fees, and the inability of the local councils to periodically adjust the
property values, tax rates, and user charges. The implication is a wide gap between
revenue generated and expenditure, which explains a large vertical fiscal imbalance
when compared with other levels of government (Chart 3).

Rapu: Tax Assignment and Revenue Sharing 21
Exp en d itu reYears Gen eral Fed eral Su b -Nat ion al Fed eral Su b -Nat ion al Fed eral Su b -Nat ion al
Govt . Govt s . Govt . Govt s . Govt . Govt s .N’Billion N’Billion N’Billion N’Billion N’Billion % %
1980 24.6 15 9.6 15.8 0.1 105.6 11981 26.2 11.4 14.7 15.3 0.1 134 0.71982 26.3 11.9 14.3 12.1 0.1 101.5 0.71983 24.5 9.6 14.9 11.1 0.1 115.2 0.71984 19.4 9.9 9.5 11.8 0.1 118.9 1.11985 20.9 13 7.9 15.9 1.6 121.9 20.21986 24 16.2 7.8 13 1.9 80.1 24.41987 33.1 22 11.1 25.5 2.2 115.8 19.81988 42.2 27.7 14.5 27.8 2.4 100.2 16.61989 58.4 41 17.4 51.3 1.9 125 10.91990 87.2 60.3 26.9 68.6 3.5 113.8 131991 102.8 66.6 36.2 81.6 3.9 122.6 10.81992 142.5 92.8 49.7 195.4 6.1 210.6 12.21993 254.9 191.2 63.7 198.4 6.7 103.8 10.51994 235.8 160.9 74.9 206 11.9 128 15.91995 349.1 248.8 100.3 480.7 18.7 193.2 18.61996 444.1 337.4 106.7 524.1 21 155.3 19.71997 550.8 428.2 122.6 591.5 29.5 138.1 24.11998 674.4 487.1 187.3 475.6 31.4 97.6 16.81999 1176 947.7 228.3 969.9 37.6 102.3 16.52000 1214.7 701.1 513.6 1945.2 43.9 277.5 8.52001 1786.4 1018 768.4 2276.8 68.3 223.6 8.92002 1912.5 1018.2 894.3 1799.9 100 176.8 11.22003 2509 1226 1283 2629.3 139 214.5 10.82004 2964.5 1377.3 1587.2 3941.3 156.6 286.2 9.9
Own Reven u e Gen erat ed Ver t ical Fiscal Im balan ce
Sou r ce : Der ived from CBN An n u al Rep or t s
Table 6: Assessm en t of Ver t ical Im balan ces in Niger ia
Chart 3: Assessment of Vertical Fiscal Imbalance By Local Governments (2000-2004)
0
100
200
300
400
500
2000 2001 2002 2003 2004Years
Nai
ra B
illio
n
Own revenueExpenditure
Source: Derived from CBN Annual Report, 2004.

22 Central Bank of Nigeria Economic and Financial Review March 2006
Assessment of Horizontal Fiscal Imbalance in Nigeria
The wide disparities in tax bases available to each state produce large differences in
internal revenue efforts across the state governments. This is attributed to the
differences in resource endowments, expenditures, infrastructures and efficiency of
tax administration among the states. Thus, it accounts for the large horizontal fiscal
imbalance observed in the federation. The financial statements of the state
governments showed that only Lagos State generated internal revenue that was able
to cover an average of 48.4 percent of its expenditure (recurrent and capital
expenditures) in 2001-2004. Of the remaining 35 states, only 9 had internal
resources that covered 10 percent of total expenditures on the average in the same
period while the rest had revenues that were only able to cover less than 10 percent of
expenditures (Table 7).
The major challenge, therefore, is how to design a good inter-governmental transfer
system that can reduce the vertical and horizontal fiscal disparities without a threat
to secession or break-up being considered. A review of the constitutional
responsibilities of the different levels of government with taxes assigned shows a
great divergence. The assigned responsibilities to the state and local governments
were mainly social services in nature requiring huge financial outlays (Table 8).
Analysis of the consolidated general government social sector expenditure showed
that, on the average, the sub-national governments accounted for 61.3 percent of the
total in 1998-2004. Apart from 1998 and 2002 fiscal years, the shares of the Federal
Government expenditure on social services were lower than that of the sub-national
governments in all other years under review (Table 9).
This reflects a huge burden on the sub-national governments if the country is to
achieve the Millennium Development Goals (MDGs) by the year 2015. In summary,
they will require additional resources either as statutory transfers from the federally-
collectible revenue or they should be assigned with some of the high-yielding taxes.

Rapu: Tax Assignment and Revenue Sharing 23
Table 7: Assessment of Horizontal Fiscal Imbalance in Nigeria
Internal Revenue (N'Billion) Total Expenditure (N'Billion) Horizontal Fiscal Imbalance (Percent)
State 2001 2002 2003 2001 2002 2003 2001 2002 2003 Average
Abia 2.2 0.8 0.8 16.1 14.6 17.0 13.7 5.5 4.7 7.9
Adamawa 0.5 0.4 0.7 11.9 7.1 23.7 4.2 5.6 3.0 4.3
Akwa-Ibom 0.6 2.6 3.9 28.2 32.5 56.7 2.1 8.0 6.9 5.7
Anambra 0.6 1.6 2.4 10.8 26.2 23.7 5.6 6.1 10.1 7.3
Bauchi 0.9 0.7 0.7 13.3 11.9 13.4 6.8 5.9 5.2 6.0
Bayelsa 0.3 0.5 0.5 22.6 34.1 28.0 1.3 1.5 1.8 1.5
Benue 1.6 0.7 0.7 12.6 14.4 16.4 12.7 4.9 4.3 7.3
Borno 0.8 0.7 0.9 15.5 20.6 23.1 5.2 3.4 3.9 4.2
Cross River 0.8 2.2 1.2 14.0 21.6 14.5 5.7 10.2 8.3 8.1
Delta 8.2 6.0 6.3 57.2 63.0 67.2 14.3 9.5 9.4 11.1
Ebonyi 0.2 0.2 0.3 12.0 16.9 15.5 1.7 1.2 1.9 1.6
Edo 0.2 - 1.5 10.5 - 17.3 1.9 - 8.7 3.5
Ekiti 0.2 1.4 0.4 8.1 18.3 10.4 2.5 7.7 3.8 4.7
Enugu 2.2 1.4 1.9 11.8 12.3 17.7 18.6 11.4 10.7 13.3
Gombe 0.5 0.7 1.6 11.7 8.6 17.9 4.3 8.1 8.9 7.1
Imo 1.2 1.2 1.9 16.9 22.4 31.2 7.1 5.4 6.1 6.2
Jigawa 1.1 1.1 0.4 11.5 24.3 16.1 9.6 4.5 2.5 5.5
Kaduna 1.7 1.3 7.1 15.7 24.6 39.9 10.8 5.3 17.8 11.3
Kano 4.3 7.4 2.9 25.3 39.7 44.4 17.0 18.6 6.5 14.1
Katsina 1.1 2.4 1.1 13.6 18.6 12.4 8.1 12.9 8.9 10.0
Kebbi 0.2 0.7 0.5 9.8 14.7 7.6 2.0 4.8 6.6 4.5
Kogi 0.6 1.2 2.0 11.0 19.5 26.0 5.5 6.2 7.7 6.4
Kwara 1.5 0.6 2.2 13.3 16.5 17.7 11.3 3.6 12.4 9.1
Lagos 12.5 29.4 48.4 35.4 58.2 81.5 35.3 50.5 59.4 48.4
Nassarawa 0.9 0.3 0.8 11.3 9.8 13.2 8.0 3.1 6.1 5.7
Niger 0.5 - 0.6 10.7 - 14.8 4.7 - 4.1 2.9
Ogun 2.2 2.6 2.7 17.4 15.6 17.6 12.6 16.7 15.3 14.9
Ondo 1.1 1.1 3.1 21.2 20.1 38.8 5.2 5.2 8.0 6.2
Osun 1.8 2.3 2.0 11.5 18.9 14.2 15.7 12.2 14.1 14.0
Oyo 1.5 1.9 3.5 12.7 10.1 18.9 11.8 18.8 18.5 16.4
Plateau 0.7 1.8 3.2 13.1 19.9 24.4 5.3 4.0 13.1 7.5
Rivers 3.3 12.6 8.8 29.2 37.9 70.2 11.3 33.2 12.5 19.0
Sokoto 0.5 0.8 1.4 11.0 13.1 15.5 8.2 6.1 9.0 7.8
Traba 0.4 0.4 0.5 12.4 10.7 13.8 3.2 3.7 3.6 3.5
Yobe 0.3 0.5 0.5 12.9 11.5 16.0 2.3 4.3 3.1 3.3
Zamfara 0.9 1.2 1.4 10.1 12.2 15.1 8.9 9.8 9.3 9.3

24 Central Bank of Nigeria Economic and Financial Review March 2006
For one thing, the current horizontal revenue–sharing formula favors those states
that already have economic and social infrastructures in place. For example, the
number of hospital beds and school enrolments are positively related to individual
state’s stage of development. Certainly, there is no basis for comparison in terms of
the number of hospital beds and schools enrolment in Jigawa State with that of Kano
State, from where the former was carved out. The revenue-sharing based on
internally-generated revenue, population and land mass, again, tend to also favor the
well-established states with good economic infrastructure, higher population, and
bigger land areas.
Thus, apart from those state governments’ allocations influenced by allocations under
derivation principle on natural resources revenue, allocations to the well-established
states are much higher than the fiscally–disadvantaged state governments. In a
nutshell, the existing horizontal revenue-sharing indices cannot achieve the
equalization effect across states and local governments as anticipated by the Federal
Government. The overall effect is the increasing disparities and uneven development
across states and local governments in the country (Chart 4).

Rapu: Tax Assignment and Revenue Sharing 25
Table 8: Assignments of Responsibilities in the 1999 Constitution
EXCLUSIVE LEGISLATIVE LIST CONCURRENT LIST RESIDUAL LIST* Federal Government State Governments Local Governments Accounts of the Federation Allocation of revenue Sewage Disposal
Arms, Ammunition, Defence and National Security
Antiquities and monuments Environmental Sanitation
Aviation, Railways, Federal Trunk Roads and Maritime matters
Archives Maintenance of Feeder Earth Roads
Immigration & Internal Affairs Collection of taxes Primary Education
Financial laws, and currency Issue & Exchange Control
Electoral Law Payment of Salaries
Census, National Honour & Citizenship Electric power Market Stalls
Foreign Affairs and International Treaties Exhibition of cinematograph films
Rural Health
Creation of States & regulation of political parties National and State elections
Industrial, commercial Crafts and Small Scale Industries.
Mining & National Parks Or agricultural development
Labour, and Public service of the federation Scientific and Technological Research Statistics
Patents & trademarks Trigonometrical, cadastral and topographical surveys
Legal Proceeding between governments in the federation
University, Technological and Post Primary Education
Establishment of federal agencies
Telecommunications
Public debt of the Federation
Management of territorial waters
Weights and Measures
International trade and commerce
Formulation, annulment and dissolution of manage
Nuclear Energy
Stamp Duties
*Derived from the residual list for states.
Table 9: Social Sector Expenditure Profile in Nigeria 1998 1999 2000 2001 2002 2003 2004
Capital Exp. On Soc. Service (N Billion)
44.7 51.2 77.7 176.3 416.1 491 497.6
Share of Federal Govt. (percent) 52.3 33.8 36 30.2 53.3 32.2 33.1
Share of State/Local Govt. (percent)
47.7 66.2 64 69.8 46.7 67.8 66.9
Sources: CBN Annual Reports
26 Central Bank of Nigeria Economic and Financial Review March 2006
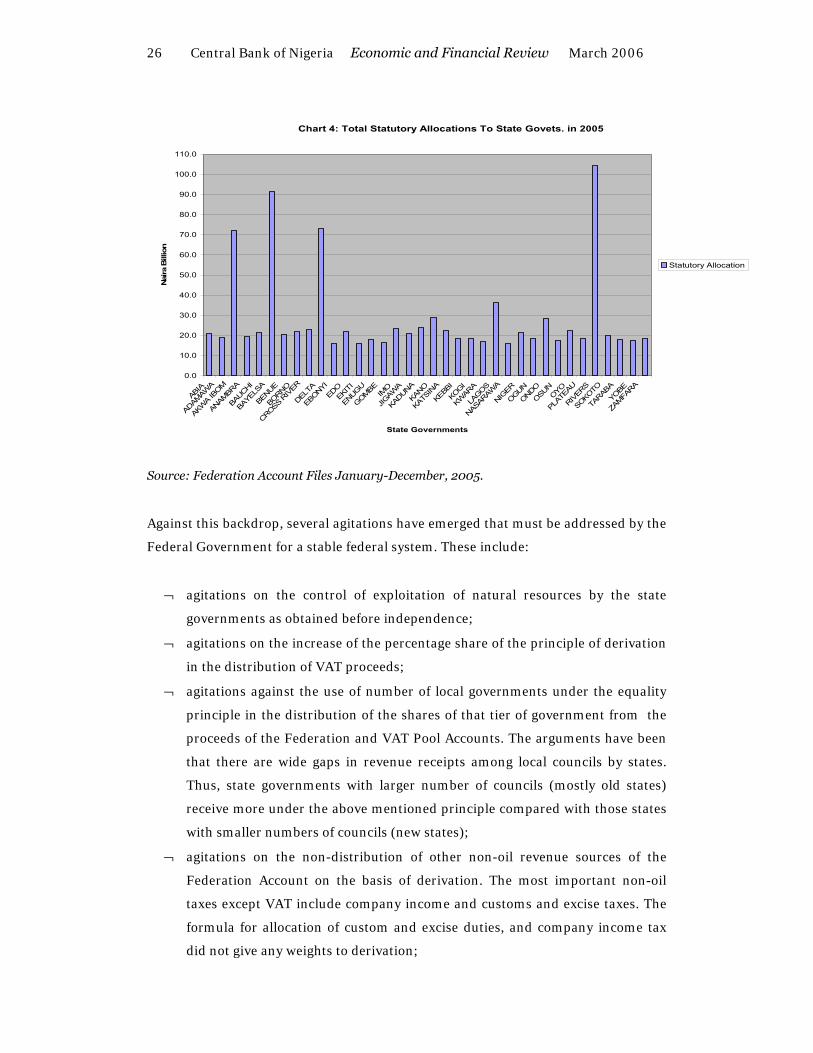
Source: Federation Account Files January-December, 2005.
Against this backdrop, several agitations have emerged that must be addressed by the
Federal Government for a stable federal system. These include:
¬ agitations on the control of exploitation of natural resources by the state
governments as obtained before independence;
¬ agitations on the increase of the percentage share of the principle of derivation
in the distribution of VAT proceeds;
¬ agitations against the use of number of local governments under the equality
principle in the distribution of the shares of that tier of government from the
proceeds of the Federation and VAT Pool Accounts. The arguments have been
that there are wide gaps in revenue receipts among local councils by states.
Thus, state governments with larger number of councils (mostly old states)
receive more under the above mentioned principle compared with those states
with smaller numbers of councils (new states);
¬ agitations on the non-distribution of other non-oil revenue sources of the
Federation Account on the basis of derivation. The most important non-oil
taxes except VAT include company income and customs and excise taxes. The
formula for allocation of custom and excise duties, and company income tax
did not give any weights to derivation;
Chart 4: Total Statutory Allocations To State Govets. in 2005
0.0
10.0
20.0
30.0
40.0
50.0
60.0
70.0
80.0
90.0
100.0
110.0
ABIA
ADAMAW
A
AKW
A IB
OM
ANAMBR
A
BAUCHI
BAYE
LSA
BENUE
BORNO
CROSS RIV
ER
DELTA
EBONYI
EDOEK
ITI
ENUGU
GOMBEIM
O
JIGAW
A
KADUNA
KANO
KATS
INA
KEBB
I
KOGI
KWAR
A
LAGOS
NASAR
AWA
NIGER
OGUN
ONDOOSU
NOYO
PLAT
EAU
RIVER
S
SOKO
TO
TARAB
A
YOBE
ZAMFA
RA
State Governments
Nai
ra B
illio
n
Statutory Allocation

Rapu: Tax Assignment and Revenue Sharing 27
¬ agitations for the inclusion of receipts of education and value–added taxes
proceeds as part of the Federation Account, according to the intentions of the
1999 Constitution;
¬ suggestions that personal income tax administration and collection should be
transferred to the Federal Government for better compliance and enhanced
revenue;
¬ agitations by the state governments on the reviews of the vertical and
horizontal revenue-sharing systems.
IV.2.2. Enforcing Compliance with the Law on Allocation of 10 percent
Internally-Generated Revenue to the Councils by the State Governments.
Another major challenge of tax assignment and revenue-sharing in Nigeria is the
enforcement of compliance by the state governments to allocate 10 percent of their
internally-generated revenue to their local councils. The existence of vertical fiscal
imbalance in respect of state governments and local governments, and horizontal
imbalance across local governments has necessitated this constitutional requirement.
The local governments serve as the grassroots governments and, therefore, a lot of
social services expenditure burden is placed on them. This will, therefore, require a
substantial transfer of funds from the state governments to the local councils in
addition to the statutory and non-statutory transfers from the Federal Government to
enable them meet their expenditure expectations on the MDGs. Evidence has shown
that the state governments over the years have continued to flout this requirement.
Hence, the task before the Federal Government is on how to ensure compliance with
the constitutional provision and the law
IV.2.3. Modality for the Sharing of Transfers from Federation Account to
Local Councils by the State Governments
Recent developments point to the confusion emanating from the constitution in
terms of the sharing of the allocations from the statutory accounts among the local
governments in the states. Whereas the constitution grants the state legislatures the
powers to make laws for the distribution of these transfers, the Federal Government
is insisting that the transfers are exclusively, meant for those local councils created
before the 1999 Constitution. This controversy emerged as a result of the
unprecedented creation of local governments by the state governments. Meanwhile,
the state governments are invoking their powers in the constitution to create local
councils.

28 Central Bank of Nigeria Economic and Financial Review March 2006
This impasse has resulted in most of the cases, the withholding of the shares of the
councils from the centrally-distributable revenue in some of the states. The
development, therefore, does not augur well for the good governance at the level of
the councils and could delay the decentralization process. In this regard, the major
challenge for the Federal Government is to find a permanent solution to this problem
in the interest of the local government administration and finances.
IV.2.4. Establishment of a Good Statistical Base for the Horizontal
Revenue-Sharing Across State and Local Governments
Good revenue-sharing arrangements without an acceptable statistical base for
calculating the indices for each sub-national government, for the purpose of
determining each government share, could also generate tension and confusion. This
was a major impediment in the implementation of the fine recommendations of Louis
Chicks Fiscal Commission of 1953. Thus, the current task before the Federal
Government is on how to generate a good data for the horizontal distribution of
federally-collectible revenue to the sub-national governments.
IV.3 Policy Options for Reforms of Tax Assignment and Revenue-
Sharing Arrangements in Nigeria
IV.3.1. Increasing the Fiscal Capacities of the States and Local
Governments
The current debate is that, sub-national governments in Nigeria, lack the financial
capacities to carry out some of the assigned responsibilities and, therefore, the
suggestion is to trim down these responsibilities. However, this will move Nigeria
towards a unitary system of government. With this regard, the option is to improve
the sub-national governments’ fiscal capacities through partly, modifications of
assigned taxes and introduction of other more reliable taxes as follows.
The introduction of state excise taxes on alcoholic beverages and tobacco products is
a good example for new tax assignment to the state governments. This form of tax
would be politically acceptable as a means of financing state governments’
expenditures on health care services. The new tax system is expected to be a
residence-based tax and does not eliminate excise tax by the Federal Government
(such as practiced in Mexico)5.
In particular, personal income taxes form a major component of tax assignment to
5 See Walsh C., 1996 pg 115

Rapu: Tax Assignment and Revenue Sharing 29
the state governments. Evidence over the years has shown that yields from the
personal income have been low. Consequently, in view of the performance of VAT
compared with the former sales tax, there are new suggestions that the Federal
Government should be encouraged to takeover the administration of personal income
tax. However, we differ with this suggestion, rather we proffer that the powers to set
rates, in addition to the existing administrative responsibilities should be transferred
to the state governments. This will enable them to adjust rates, depending on their
economic circumstances and revenue needs.
The constitution has recognized that property rate is intrinsically local in character
and assigns it to the local governments. However, concerned with the stagnation in
yields from the tax, we suggest a reform in this regard on the grounds of cost
efficiency and higher compliance rate. Thus, the administration of property tax
should be placed under the purview of the state governments while the proceeds
should be given to the local councils, with a surcharge of not more than 10.0 percent
to cover administrative costs. Thus, besides increasing revenue, it will also reduce tax
evasion and avoidance. Another area in which the councils could increase their tax
revenue is through entertainment tax on birthdays and burial ceremonies, taxes on
advertisement in their localities, and cost recovery charges, such as tolls for use of
local roads and other user charges. Again, more substantial taxes on fairs and
markets or a local business license tax (as practiced in Germany) based on actual
turnover could be pursued by the local councils to enhance their internal revenue
base.
IV.3.2 Inclusion of the Education Tax and VAT in the Federation Account
One thing that has emerged clear with the coming into force of the 1999 Constitution
is that the fate of the Education Trust Fund cannot be different from that of the
Petroleum (special) Trust Fund. By extension education tax revenue is now part of
the Federation Account Revenue and should be paid into that account. The VAT Pool
Account should be abolished and merged with the Federation Account for simplicity
and transparency as well as in conformity with the constitutional provisions.
IV.3.3 Review of the Vertical Distribution Formula
To further boost statutory transfers to the sub-national governments, the revenue-
sharing formula should be reviewed. A notable feature of Nigeria’s federal fiscal
arrangements is the multiple channels of transfers from the Federal Government to
the sub-national governments. Some are statutory transfers such as the Federation

30 Central Bank of Nigeria Economic and Financial Review March 2006
Account and VAT revenues while others are plan transfers in the form of grants-in-aid.
Plan transfers include transfers from education tax revenue and transfers in respect of
Universal Basic Education (UBE), Basic Primary Healthcare and others. Therefore,
considering the needs of the states and local councils to meet their different
expenditure outlays, this paper considers a consolidated revenue transfers that is
based on a tax-by-tax sharing system. However, the percentage allocation to each tier
of government can be determined by proper bargaining, depending largely on the
expenditure needs of each tier of government on social services, internal security and
defense. We, therefore, suggest a sharing formula below:
Table 10: Suggested Vertical Distribution of Revenue in the Nigerian Federation (in percent)
Federal State Local Councils Derivation Total Oil Taxes & Revenue 52.5 32.5 15.0 20.0 100.0
Company Income Tax 50.0 50.0 - 5.0 100.0
Customs & Excise 50.5 30.0 19.5 5.0 100.0
Value -Added Tax 30.0 40.0 30.0 20.0 100.0
Education Tax 30.0 70.0 - - 100.0
Average 42.6 44.5 12.9 - 100.0
The suggested vertical distribution in Table 10 is based on the following assumptions:
• that the funding of primary education should revert to the states while the
federal and local councils participations are restricted to design and
implementation, respectively. Basically, from experience over the years, the
local councils lack the capacities to have this function assigned to them not
only in terms of funding, but also administration;
• that the state governments’ expenditure on social infrastructures will continue
to rise and remain higher than that of the Federal Government;
• derivation should apply on a tax-by-tax basis and directly on the outstanding
receipts before distribution. In view of this, derivation becomes a first charge
on all revenue items except for education tax. This is mainly to serve as an
incentive to state governments;
• this formula assumes the exclusion of special funds;
• the inclusion of education tax and VAT revenues in the federation account and
the abolition of the individual taxes disbursement mechanisms;
• education tax should strictly be earmarked for the purpose except if abolished
under the new tax reforms; and
• that the state governments should adjust regularly, the amount of state
allocation to the councils.

Rapu: Tax Assignment and Revenue Sharing 31
The new options allocates to the Federal Government (42.6%), state governments
(44.5 %), and local governments (12.9%) of total federally-collectible revenue. The
objective here is to increase statutory transfers and decrease grants. This
generally will remove the political-influence factors associated with federal grants
in the inter-governmental transfers. Thus, the consolidation of all transfers as
statutory revenue-sharing makes these transfers explicit and predictable.
IV.3.4 Review of the Horizontal Revenue-Sharing Formula
Revenue-sharing across the sub-national governments can be shared on a tax-by-tax
basis, applying different weights and principles. The table below attempts to play
down on most of the objections facilitating agitations in the horizontal revenue-
sharing system. The suggested distribution profile did not recognize the principle of
tax efforts while it de-emphasized the principle of geographic area
(landmass/terrain). For instance, emphasis on equality principle is to help those
disadvantaged sub-national governments with low per capita income compared with
national standard to have more fund for infrastructural development, thereby,
encouraging private investment to boost economic activities in their respective states
and local councils. If the emphasis placed on the principles of equity is adopted it will
achieve the equalization effect across the sub-national governments and reduce
considerably the unintended advantages to the well-established states and local
councils in the current distribution system.
Under the principle of social development factors, there is a recognition of the inverse
of all the sub-factors and considerable weight given to them. It is believed that the
implementation of this will encourage an even social development across the sub-
national governments. These principles and the associated percentages are also,
recommended for revenue distribution to local governments. However, the use of the
number of local governments under equality of states should be abrogated since the
power to create local governments has been reverted to the state governments.
Table 11: Suggested Horizontal Distribution of Revenue in Nigeria
Revenue Sources Population Landmass/ Terrain
Equality Social Factor
Inverse of Social factor
Total
Oil Taxes & Revenue
20 5 60 5.5 9.5 100
Company Income Tax
10 10 60 10 10 100
Customs & Excise 30 0 60 5 5 100
Value Added Tax 25 0 60 7.5 7.5 100
Education Tax 0 0 40 30 30 100

32 Central Bank of Nigeria Economic and Financial Review March 2006
IV.3.5 Compelling the State Governments to Allocate the Mandatory 10
% of their Internal Revenue to the Local Councils
The Federal Government should establish a standard format to enable it monitor this
aspect of the constitution and stiff penalty stipulated in the law. For instance, it could
be recommended that failure to comply, the fiscal commission should deduct the
outstanding amounts from individual state government’s share from the Federation
Account. Thus, the States House of Assembly should endeavor to monitor the
compliance of the law. In addition, the state finance commission should be properly
constituted. Rather than allow the officials of the state’s ministry of finance to
dominate the committee, it should be made an independent body like the RMFAC.
The objective of these reforms is to make the transfer system predictable, measurable
and transparent. The proportion for distribution should be automatically adjustable
to inflation. Although the criteria for distribution among the local councils need to
vary from state to state because of differences in local situations, this should not be
an impediment to the earlier achievement of decentralization in the country.
Consequently, we suggest this framework below for adoption according to local
conditions.
Table 12: Framework for Revenue-Sharing to LGs. Criteria Weights Derivation 10% Population 30% Equality 30% Own revenue efforts 10% Geographic Area: 10% Rural Area -4% Urban Area -6% Social Factors: 10% Direct -5% Inverse -5%
The principles underlying this framework, is that apart from the size of local
governments represented by the population and geographical area (which are major
determinants of the financial needs of the councils), revenue-sharing should be
complemented by set of criteria, which measure efficiency by the revenue-generating
efforts of local councils, and equity by the level of local income per capita. Thus, the
equity principle favors the fiscally-disadvantaged councils while the former is an
encouragement to those high revenue-generating councils for their efforts.

Rapu: Tax Assignment and Revenue Sharing 33
IV.3.6 Constitutional Amendment on the Distribution of Proceeds from
the Federation Account
The Federal Government should pursue vigorously the amendment of the
constitution in the area of the power of the state legislatures to create local councils.
Thus, the National Assembly can be given the confirmation authority based on the
available resources. The main implication of the excessive creation of councils is that,
the available funds will be spent on mere administration rather than on economic
and social infrastructures. Thus, there is the need to amend the chapter of the
constitution dealing with the creation of local councils for a proper decentralization
in Nigeria.
The Federal Government through the RMFAC should establish a good and acceptable
statistical base for the purpose of revenue-sharing across the sub-national
governments. This is in terms of derivation, population, and geographic area. This
should also, be reviewed at regular intervals through independent surveys.
V Summary and Conclusion
The paper described the basis of tax assignment and revenue sharing in a federal
system. The evolution of tax assignment and revenue-sharing arrangements in
Nigeria were also discussed. The result of the review indicates that in the earlier
periods of the Federation, fiscal decentralization was encouraged by granting high
revenue-yielding taxes to the regions. However, with the coming of military rule in
1966 marked the beginning of the erosion of the taxing powers of the sub-national
governments and the concentration of national financial resources in the hands of the
Federal Government. Consequently, from 1967/68 fiscal year, a notable feature has
been the growing vertical and horizontal fiscal imbalances in the Federation in terms
of fiscal capacities of the various levels of government and across the federating units.
These have generated debates threatening the existence of the nation and suggesting
a likely break-up.
The introduction of democratic rule in 1999 has generated new issues namely:
inadequate fiscal autonomy for the states and local governments, poor federation
account distribution formula, lack of fairness in the distribution of non-oil federal
taxes, the control of the exploitation of natural resources, etc. Options were proffered
for reforms in the financial transactions and the fiscal relationships in the Federation.
These suggestions include: the strengthening of state internal revenue bases through
the introduction of state excise taxes on alcoholic beverages and tobacco products,

34 Central Bank of Nigeria Economic and Financial Review March 2006
etc; adjustments on the vertical and horizontal revenue-sharing formula; adoption of
a tax-by-tax sharing system; entrenchment of the derivation principle in the
distribution of all revenues collected centrally; the transfer of education tax to the
federation account and the merging of VAT revenue with the same account; effective
compliance with the allocation of the mandatory 10 % of state governments’
internally-generated revenue; the amendment of the constitution to reduce the
powers of the state legislatures to create local governments; and the establishment of
an acceptable statistical base for revenue distribution across state and local
governments.
The paper concludes that changes to the existing tax assignment and revenue-sharing
arrangements will go a long way in protecting our nascent democracy. It will also
reduce agitations and tensions in the system while it will facilitate the stable
provisions of public services across the sub-national governments.

Rapu: Tax Assignment and Revenue Sharing 35
References
Ahmad E. and Raju Singh (2003): Political Economy of Oil-Revenue Sharing in a Developing Country: Illustrations from Nigeria, IMF Working Paper No. 03/16, January 2003.
Alberto Diaz – Cayeros and Charles E. Mclure, Jr(2000): Tax Assignment: In Achievements and Challenges of Fiscal Decentralization; Lessons from Mexico edited by Marcelo M. Giugale and Steven B. Webb The World Bank Washington D.C. May 2000.
Ashwe Chiichii (1986): Fiscal Federalism in Nigeria: Research Monograph No. 46 Canberra Centre for Research on Federal Financial Relations, Australian National University.
Bird, Richard M., (1990): Federal-Provincial Fiscal Arrangement: Is there an agenda for the 1990s? ‘In Canada: ‘The state of the Federation. 1990, edited by Ronald L. Walt and Dunglas M. Brown (Kengitus,Ontario: Institute of Inter-governmental Relations, Queen’s University.
Broadway, Robin and Paul Hobson, (1993): Intergovernmental Fiscal Relations in Canada: Canadian Tax Foundation, Toronto.
Casella, Alessandra & J Feinstein (1990): Public Good in Trade: On the Formation of Markets and Political Jurisdiction:’ NBER Working Paper No.3554 (Cambridge, Massachusetts: National Bureau of Economic Research).
Central Bank of Nigeria (2000): Changing Structure of Nigeria Economy; 2000.
Cremer, Jacque, Antom Estach and Paul Seabright (1994): The Decentralization of Public Services: Lessons from the Theory of the Firm: Policy Research Working Paper 1345, Office of the Vice President, Development Economics, World Bank,Washington D.C
Ikein, Augustine and Comfort Briggs-Anigboh (1998): Oil and Fiscal Federalism in Nigeria: The Political Economy of Resources Allocation in a Developing Country (Aldershot, United Kingdom; Ashgate).
Le Breton, Michel and Shlomo Weber (2001): The Art of Making Everybody Happy: ‘How to Prevent Secession’ Working Paper No. 01/176, November, 2001.
Marcelo Giugale, et al (2000): Overview of Fiscal Decentralization in Mexico: In Achievements and Challenges of Fiscal Decentralization; Lessons from Mexico edited by Marcelo M. Giugale and Steven B. Webb, The World Bank Washington D.C. May 2000.
Martinez- Vasquez, Jorge, Charles E. Mclure, Jr and Sally Wallance (1995): Sub-national Fiscal Decentralization in Ukraine: ‘In Richard M. Bird, Robal Ebel and Christine I. Wallich, edited. Decentralization of the Socialist States; Inter-governmental Finance in Transition Economics, Washington, DC; World Bank, pp 281-319.

36 Central Bank of Nigeria Economic and Financial Review March 2006
May R. J. (1996): Federalism and Fiscal Adjustment’: Glanenton Press, Oxford pp 55-99
Nigeria, Federal Republic (1980): Report of the Presidential Commission on Revenue Allocation: Main Report (Apapa, Federal Government Press)
Nigeria, Federal Republic (2002): Report of the Supreme Court Judgment on Revenue Allocation April 2002.
Nigeria, Federal Republic (2005): Federation Account Allocation Committee Files: January- December, 2005.
Oates W.C (1972). Fiscal Federalism: New York, Harcourt, Brace,Jovanuricts.
Okunrounmu, T.O. (1996): Fiscal Federalism: In Nigeria’s Prospects for Development a.k.a. Vision 2020: Proceedings of the Workshop organized by the CBN/World Bank Collaborative Study, April15-17, 1996.
Shar, Anwar (1998): Fiscal Decentralization an Elusive Goal? A case study of Indonesia and Pakistan Experiences: Presented at the International Conference on Fiscal Decentralization on developing Countries.
Tabellini, Guido and Torstein Persson (1996): Federal Fiscal Constitutions: Risk –Sharing and Redistribution: Journal of Political Economy Vol. 104 pp979-1009.
Tanzi Vito (1995): Fiscal Federalism and Decentralization and Macroeconomic Aspects: Annual World Bank Conference ed. Micheal Bren and Book Plaskovic: The World Bank Washington DC 1995.
Ter Minassian, Teresa (1997): Fiscal Federalism in Theory and Practice: IMF, Washington
Walsh, Cliff (1996): Making a Mess of Tax Allocation: Australia: A case study ‘In Paul Boothe, ed., Reforming Fiscal Federalism for Global Competition: A Canada - Australian Comparison, Calgary Western Center for Study in Economics Policy.