Reforming taxes and improving health: a revenue-neutral tax reform to eliminate medical and...
40
REFORMING TAXES AND IMPROVING HEALTH: A REVENUE-NEUTRAL TAX REFORM TO ELIMINATE MEDICAL AND PHARMACEUTICAL VAT Santiago Álvarez-García Carlos Pestana Barros Juan Prieto-Rodriguez FUNDACIÓN DE LAS CAJAS DE AHORROS DOCUMENTO DE TRABAJO Nº 338/2007
Transcript of Reforming taxes and improving health: a revenue-neutral tax reform to eliminate medical and...

REFORMING TAXES AND IMPROVING HEALTH:
A REVENUE-NEUTRAL TAX REFORM TO ELIMINATE MEDICAL AND PHARMACEUTICAL VAT
Santiago Álvarez-García Carlos Pestana Barros Juan Prieto-Rodriguez
FUNDACIÓN DE LAS CAJAS DE AHORROS DOCUMENTO DE TRABAJO
Nº 338/2007

De conformidad con la base quinta de la convocatoria del Programa
de Estímulo a la Investigación, este trabajo ha sido sometido a eva-
luación externa anónima de especialistas cualificados a fin de con-
trastar su nivel técnico. ISBN: 84-89116-07-5 La serie DOCUMENTOS DE TRABAJO incluye avances y resultados de investigaciones dentro de los pro-
gramas de la Fundación de las Cajas de Ahorros.
Las opiniones son responsabilidad de los autores.

Reforming Taxes and Improving Health: A Revenue-Neutral Tax
Reform to Eliminate Medical and Pharmaceutical VAT
Santiago Álvarez-García, Department of Economics, University of Oviedo Carlos Pestana Barros, Instituto Superior de Economia e Gestão, Technical University
of Lisbon Juan Prieto-Rodriguez, Department of Economics, University of Oviedo♣
Abstract The aim of this paper is to analyse a tax reform consisting of an increment of the indirect taxes on alcohol and tobacco to finance the elimination of VAT on health and pharmaceutical services. We first estimate an Almost Ideal Demand System for the purpose of evaluating expenditure and price elasticities. We then micro-simulate the abolition of VAT on health services combined with a increment on alcohol and tobacco excise duties, so that total revenue remains unchanged. This reform would generate small private and social welfare gains complemented with externalities derived from the tobacco and alcohol demand cut.
Keywords: Micro-simulation, tax reforms, health, pharmaceutical products, welfare.
JEL classification numbers: D12, H23, H31.
♣ Avda. del Cristo s/n, Oviedo, Spain e-mail: [email protected]. Telephone: +(34) 985103768
2
1. INTRODUCTION
The economic modelling of this research can be encompassed within the increasing
interest in taxes which would target the enforcing of significant reductions in the
consumption of alcohol and tobacco, thereby reducing addictive behaviour (Duffy, 2006;
Markowitz, 2005; Young and Likens, 2000) and public funds devoted to finance their
negative effects on citizens’ health. In fact, fiscal policies that attempt to promote health
can be justified in terms of the externalities that they will induce. If externalities are defined
as the benefits and costs that result from unplanned side-effects of economic activities that
concern individuals other than the parties involved in the activity, then air pollution related
to tobacco and the health effects derived from alcohol and tobacco consumption are
illustrative examples of externalities. Both these examples are negative externalities, of
which one of the major contributory factors is alcohol and tobacco addiction. Obviously,
they could be reduced by enforcing by law anti-addictive behaviour (Escaria and Molina,
2004).
One way to increase demand for healthcare provision could be by decreasing the tax
on health services. Moreover, if, as expected, alcohol and tobacco consumption and health
services are substitutive goods, to enforce stronger effects, this decrease could be financed
by an increase in alcohol & tobacco-related taxation. Furthermore, these simultaneous
changes could be calculated in order to constitute a revenue-neutral tax reform. The most
radical of such a type of fiscal reform is analysed in this paper, since we propose the
abolition of Value Added Tax (VAT) on health services, while maintaining revenue
constant by means of the corresponding increase of VAT on alcohol and tobacco1. Health
policies involving tax-cut proposals are often drawn up without taking into account all of
their potential economic effects. That is to say, they generally lack the support provided by
empirical evidence, which would justify their approval. However, there are other economic
tools which allow us to understand the effects of such proposals. One of these tools is
micro-simulation (Sonsbeek and Gradus, 2006; Alcock and Docwra, 2005; Liu, Vliet and
Watling, 2006), which enables the assessment of public reforms even before they are
passed by Parliament. These techniques are increasingly used in developed countries
(Algers et al. 1997; Mertz 1991, O’Donoghue (2001).
The main aim of this paper is to shed some light on this debate by using micro-
simulation tools to analyse the expected demand shifts and their effects on consumers’

3
welfare. A motivation for our simulation derives from Stigler and Becker’s (1977)
hypothesis that tastes neither change capriciously nor differ importantly between people. It
is the difference in income and prices that determine differences in consumer behaviour.
This hypothesis has been tested for alcohol consumption at OECD level (Selvanathan,
2006). Based on the resulting evidence we simulate the tax changes that will affect price
and income and therefore, will orientate consumer behaviour and attitudes in favour of
health services and pharmaceutical products and away from tobacco and alcohol
consumption.
In order to meet this objective, the first stage of this research is to examine
consumers’ behaviour. Thus, we will assess the own-price elasticities, cross-elasticities and
expenditure elasticities of 16 different groups of consumer goods. This will allow us to
analyse issues such as the consumers’ response to price or income changes, as well as the
complementary or substitute nature of the different goods. Nevertheless, it is crucial to
understand, from an economic perspective, demand patterns and the effectiveness of
public policies which support these goods and services.
The econometric basis of our microsimulation exercise is the estimation of an
Almost Ideal Demand System (AIDS), proposed by Deaton and Muelbauer (1980a, 1980b),
which will permit us to control all cross-effects due to any price or real income changes.
The data set to estimate this model is the Spanish Continuous Household Expenditure
Survey (ECPF).
The paper is organised as follows: in Section 2, we describe the contextual setting; in
Section 3, we present the Almost Ideal System; in Section 4, we estimate the elasticities; in
Section 5, we estimate the distributive and welfare results; and finally, in Section 6, we
discuss the results and present the conclusions.
2. CONTEXTUAL SETTING
In Spain, as in other European Union countries, indirect taxation on consumption is
concentrated primarily on Value Added Tax (VAT) and the different excise duties imposed
on specific consumer goods, such as spirits, beer, hydrocarbons, tobacco, electricity and
vehicle registration, Romero et al. (2003) and Sanz et al. (2003).
Since joining the European Union (EU) in 1986, the Spanish tax on consumption has
been adapted to the European norm of indirect taxation harmonisation. This process has
been of particular relevance in the case of VAT, since it is the most important EU
consumption tax, levied on sales. Since the 6th EU directive on tax, approved on 17th May

4
1977, all member-states have had to comply with the same tax rules (exemptions,
deductions, etc.). This situation signifies that it is not possible for any EU state to change
its tax regime unilaterally, in accordance with the stipulations of the EU directive.
However, national governments can propose tax changes, which must be approved by the
other countries, as has happened recently with regard to cultural goods. Therefore, the
simulation of tax changes has to take into consideration this legal framework. Its practical
application would require approval at EU level.
However, the 6th EU directive permits exemption for the following health services
(article 13): health services delivered by hospitals and health centres, namely those
recognised as health services by the state; blood and milk and other health products; dental
services; women’s contraceptive products and products and services used by the disabled.
In Spain, pharmaceutical products are non-exempt and are taxed at a VAT rate of 4%,
while medical products, including optical products and other corrective devices are taxed at
7%. Additionally, transport services related to hospital attendance are also taxed at 7%.
Furthermore, taxes on tobacco and alcohol are also harmonised at EU level, but each
EU member-state is free to set the VAT rate, beyond a minimum level. Thus, whereas any
changes in tobacco and alcohol products are easily attained, this is not the case for health-
related products, European Union (2005a,b).
3. A COMPLETE DEMAND SYSTEM: DATA AND ESTIMATION PROCESS
The database used in this paper is The Spanish Continuous Household Expenditure
Survey (ECPF). The ECPF is a panel created and distributed by the Spanish National
Institute of Statistics (INE). The survey provides quarterly and annual information on
household incomes and consumption, including personal consumption, self-supply and
payment in kind. It is targeted at 3,200 families chosen by sampling techniques and one
eighth of the sample is renewed each quarter. In addition, it includes exhaustive
information on household characteristics such as employment status, demographics, etc.2
Unfortunately the ECPF does not provide data on prices, although it is essential to
estimate a system of demand. To solve this problem, information on prices has been obtain
from the Laspeyres price indexes available from the Spanish National Institute of Statistics.
The empirical study adopted in this paper consists of two stages: an estimation
stage and a simulation stage. The first stage obtains the price elasticity and expenditure
elasticity matrix by using ECPF data corresponding to the period from 1985 (third

5
quarter) to 1995 (fourth quarter). Based on these results, the second stage then simulates
the effects of a tax reform, taking the 1998 ECPF data as a reference.
The model used in the estimation phase is the Almost Ideal Demand System
(AIDS) proposed by Deaton and Muellbauer (1980a and 1980b). The main attraction of
AIDS is that it allows a first-order approximation to an unknown demand system
(Nicol, 1989). The model is estimated on the basis of the assumption that individuals
will alter their spending decisions as a result of the price changes generated by the
simulated reform. For each group of goods, the following equation has been estimated:
∑=
+++=16
1loglog
jihthtijtijihiht ypaw εβγ [1]
where i notes the i-th houshold, j the j-th group of goods and t is the time. Hence, ihtw is
the expenditure share of good i -th for the household h -th at perid t ; p represents
prices and y is the real expenditure, which is obtained from the expenditure on all
goods deflated by the Stone Index.
Parameter a is modelled using a series of dummies which allow households to be
categorised by home tenure, alcohol and tobacco consumption, education, size of town
of residence, employment status (active or inactive) and employment category. The
model is estimated under the assumption that individuals will alter their expenditure
decisions as a result of the price changes generated by the simulated reform. Hence, the
share that each good has in the total expenditure, iw , must be predicted and adjusted by
the prediction error, ε , where iii Yw εβ ˆˆ += . Moreover, to fulfil the theoretical
properties of the theory of consumption, the parameters of this equation system have
been estimated imposing the homogeneity (equation [2], [3]) and a symmetry constraint
[4]:
∑=
=16
1
1i
iha [2]
∑ ∑= =
==16
1
16
10
i iiji γβ [3]
jiij γγ = ji,∀ [4]
Moreover, the add up of all the expenditure shares, iw , should verify:

6
∑=
=16
1
1i
ihtw [5]
Given that the AIDS is composed of a system of dependent linear equations, n-1
equations of the system have been estimated, excluding the equation which corresponds
to consumer durables. The parameter values of the equation that is omitted in the
estimation have been obtained by taking the constraints included in equations [2] to [5]
into account. Seasonal variation, on the other hand, is corrected by including a variable
which takes account of the trend of the series, and by introducing a dummy variable for
each quarter of the series (the variable which corresponds to the fourth quarter is
omitted in the estimation).3
Infrequent purchase and seasonal variation are among the main econometric
problems with this type of data. To avoid the first of these problems, the model has been
estimated using instrumental variables in a three-stage least squares estimation process.4
4. DEMAND SYSTEM ESTIMATION
The expenditure and price elasticities of this demand system are obtained from the
following expressions:
1+=i
ii w
eβ
[6]
( ) ijj
kk
n
ikjj
i
i
i
ij
iiij P
wPPw
wwPδ
βγβ
ε −⎥⎥⎦
⎤
⎢⎢⎣
⎡
⎥⎥⎦
⎤
⎢⎢⎣
⎡
∂∂
+−+
= ∑≠
lnln1
1 [7]
where δij =1, if i = j and 0 in all other cases.
The estimated expenditure elasticity and the Marshallian own-price elasticity are
presented in Tables 2 and 3. As can be seen, all goods are observed to have positive
expenditure elasticity; that is to say, none of the categories is an inferior good. This is the
expected outcome, since the expenditure items considered in the equations involve a
certain degree of aggregation and although it may be the case that a specific good is
inferior, it is unlikely that an entire category of goods would meet that definition. However,
several expenditure groups are defined as necessities since their expenditure elasticity is less
than one (including food, as might be expected). Tobacco and alcohol products are
addictive normal goods and therefore they have an expected expenditure elasticity between
zero and one, as it is the case. This result is in line with other research such as Selvanathan

7
(2006), Duffy (2006) and Chaloupka and Wechsler (1997). However, medical and
pharmaceutical products and services can be considered luxurious goods since they have an
estimated expenditure elasticity close to, but higher than, one, Bradford (2003).
The own-price elasticities have the expected sign for almost all the groups of goods.
Furniture and household services is the only group that exhibits a positive price elasticity
mean. In any case, as can be seen in Table 2, this elasticity presents negative values at least
for the last ten percentiles. So, since the zero value is included in any two-tail confidence
interval for the standard confidence levels, we can consider that the elasticity of such goods
is not significantly different from zero. Moreover, all the goods analysed exhibit inelastic
demands with the exception of private and public transport services and durable goods.
Consequently, we cannot expect more than proportional changes in the demand for health
services as a reaction to VAT rate reductions.
Table 3 lists the cross-elasticities between the 16 groups of goods and the three
groups concerned by the tax reform. For substitutes, cross-elasticity has to be positive. On
the other hand, complementary goods have a negative cross-elasticity. The evidence in
Table 3 confirms the expectation that alcohol and tobacco are complementary goods, but
medical and pharmaceutical products and services are substitutive with respect to tobacco
and alcohol goods. Furthermore, with regard to health services, the most important
substitution relations occur with gas, tobacco, education, alcohol and private transport. The
relations of the most complementarity are with leisure, consumer durables, furniture, public
transport and fuel. On the other hand, education followed by health are the consumption
groups with the highest positive cross-elasticity with respect to alcoholic beverages. Hence,
education and health (the two principal publicly-provided services) are substitutes with
respect to alcohol and this relationship is stronger than that between other groups and
alcohol. The strongest observed substitution relationship between tobacco and other
consumption goods is with public transportation. Finally, the strongest observed
complementarity between tobacco and other consumption goods is with private transport.
After the estimation phase had been completed, the proposed tax reform, consisting
of an increment of the tax applied on tobacco and alcohol and the application of an
exemption on medical and pharmaceutical products and services was simulated. To

8
determine the exact magnitude of the excise duties on tobacco and alcohol required to keep
tax revenue constant, an iterative procedure was designed. It adjusted the fiscal parameters
trying to remove any deviation of the tax revenue. The tax increment was evaluated in a
fifteenth percent rise of the excise duties on tobacco and alcohol.
When Pj varies, it can be proved that shares variations are approximately equal to:
( )j
jijijii P
Pww
Δ+=Δ δε [8]
where j
j
PPΔ
is approximately the VAT rate change and δij =1, if i = j and 0 otherwise. It
can be observed that, according to equation [8], an inelastic good will increase its share –
although its demand will decrease - if its price rises, as should be the case of tobacco and
alcohol with the proposed reform. On the other hand, if own-price elasticity is lower than
one, in absolute values, the share and demand quantity will decrease where there is a price
reduction, as expected for medical and pharmaceutical products and services. Furthermore,
substitute goods will decrease their demand and share of total expenditure when prices
decrease because of tax cuts, as expected with respect to tobacco and alcohol due to the
proposed exemption of VAT on heath services. On the other hand, we expect a rise in
health services demand and expenditure share due to the simultaneous increments of
tobacco and alcohol prices. Changes in the shopping basket induced by the simulated
reform, using the consumption behaviour implicit in the AIDS model, are shown in Table
4. Such changes in the shares of each group of goods within total expenditure are a direct
consequence of the own- and cross-effects on spending derived from the reform.
Moreover, although the proposed reform is revenue-neutral, it will induce changes in the
real expenditure of households and hence, an expenditure effect is also incorporated in
these changes.
Since medical and pharmaceutical products and services have an inelastic demand
and are substitutes for tobacco and alcohol, the proposed reform must lead unambiguously
to an increment in its demand but not in its expenditure share, as shown in Table 4. In fact,
the estimated percentage decline in its share (-0.075%) is smaller than the tax cut (-2.46%).
Therefore, it is clear that the proposed indirect tax reform will induce a higher level of

9
health products and services consumption. In fact, the demand quantity variation, which
can be assessed by applying simple algebra, is almost a 2-percent rise.
Moreover, we may also expect a rise in the tobacco and alcohol shares, since their
demand is inelastic and their prices are increasing. However, these effects would be
partially counterbalanced by the decrease in those of medical and pharmaceutical products
and services. The total effect of the proposed reform would be a fall in the demanded
quantity of tobacco and alcohol. However, the tobacco share would increase and alcohol
decrease when we consider simultaneously all the cross-effects.
5. DISTRIBUTIVE AND WELFARE RESULTS
In this section, the distributive and welfare outcomes are analysed using population
values. Even when dealing with revenue-neutral tax reforms, a thorough assessment of
such reform requires prior knowledge of at least two critical issues. Firstly, it is necessary to
calculate the effects of the tax reform on the expenditure distribution. Secondly, the effect
on individual well-being and social welfare must be evaluated. The set of results obtained
will enable us to establish a clearer view of the likely effect induced by the implementation
of the analysed tax reform. These effects will be calculated from the elasticities presented in
the previous section and derived from the AIDS model.
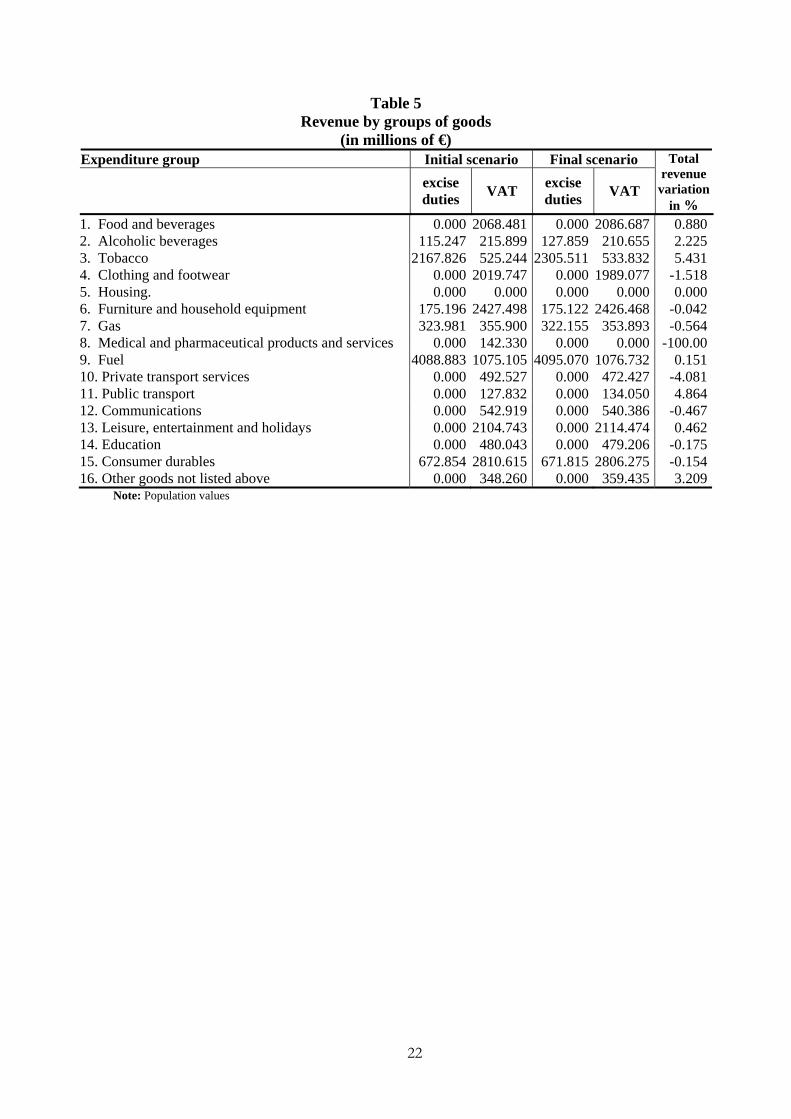
First, we analyse the revenue effects by groups evaluated at population values that are
displayed in Table 5. Obviously, these changes are related to changes in Table 4 (although
these referred to the sample used to estimate the AIDS model).
It can be observed that the revenue changes for the goods groups that would not
suffer a price modification have the same sign as the changes in their expenditure shares
displayed in Table 4, since the tax weight in their price would remain constant. Hence, for
these groups revenue or share changes are related to changes in their demand due to
relative price changes and, to a lesser extent, real expenditure changes. Another issue that
should be considered is the increment in the tobacco VAT revenue. It has to be taken into
account that VAT is applied on the price once the excise duties are imputed; so, VAT
percentage increments below the excise duty rise would not imply an increment in the
consumption but a reduction in the final quantity demanded.

10
These changes in the revenue prove that the changes in indirect tax revenue are not
equally distributed. Hence, with regard to expenditure distribution, we can assert that the
reform considered here leads to slightly increased inequality, as shown in the Gini indices
in Table 6.
In addition, the reforms considered here impair the redistributive capacity of indirect
taxation, as revealed by the Reynolds-Smolensky index in Table 6. This is due mainly to the
loss of progressiveness of indirect taxation, computed via the Kakwani index.
The effects of such reforms on the individual well-being may be studied through
Hicks’ Equivalent Variation and Compensating Variation (1939) and King’s Equivalent
Expenditure (1983), which assume that households reallocate expenditure where relative
prices change.
The equivalent expenditure, given a vector of reference of prices, RP , is defined as
the expenditure level that allows the household to attain a reference level of utility, Rv . That
is, if the indirect utility function is known, the equivalent expenditure can be obtained by
solving the following equation:
( ) ReR vGPv =, [9]
That can be expressed in terms of the expenditure function as:
( )RRe vPeG ,= [10]
In order to evaluate a fiscal reform, the equivalent expenditure measure can be
computed at the initial level of utility achieved by the household, 0ν , and will be identified
as the initial equivalent expenditure, 0eG , or at the post-reform level of utility, 1ν , and be
called final equivalent expenditure, 1eG :
( )010 ,vpeGe = [11]
( )101 ,vpeGe = [12]

11
A fiscal reform that generates welfare gains will imply that: 10ee GGG << where G
represents the actual level of expenditure. If the reform means losses, then this order is
reversed, having: 10ee GGG >> .
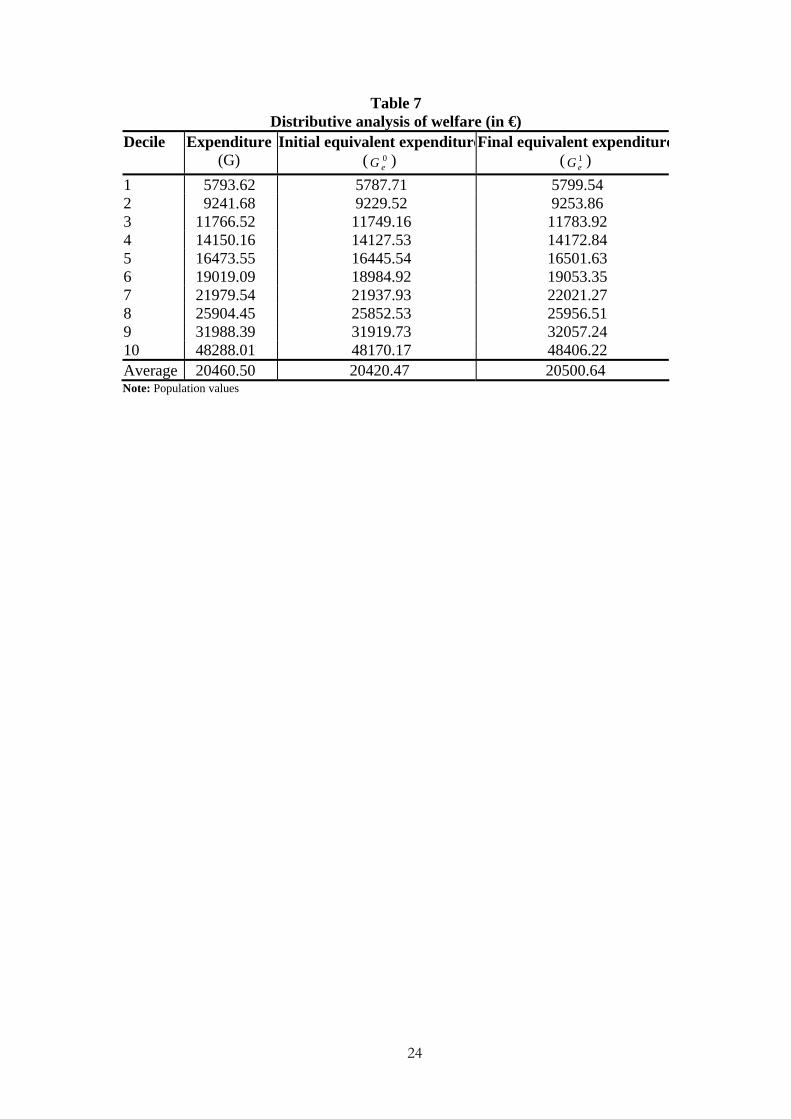
In Table 7, these measures are presented by deciles. In all the cases, the final
equivalent expenditure is higher than the real expenditure and this, in turn, is higher than
the initial equivalent expenditure. Hence, according to this measure, the proposed reform
will imply gains along all the expenditure distribution.
This order can be informative, but the particular value of the welfare gain or loss for
each taxpayer can be assessed as the difference between his initial and final equivalent
expenditures: 01ii eei GGGEB −= [13]
The Compensating Variation (CV) and the Equivalent Variation (EV) are also
metrics that represent monetary equivalents of changes in welfare. CV is defined as the
monetary amount by which the impaired households should be compensated, or which
should be demanded from the gainers due to the price change induced by the reform. This
compensation allows us to maintain households on the initial indifference curve. EV is
identified with the amount of money that the households which lost (gained) in the reform
would be willing to pay to prevent (ensure) the actual occurrence of the change in the price
vector. The Equivalent Variation and the Compensating Variation, as King (1983) proved,
can be expressed in terms of the equivalent expenditure as:
( ) ( ) GGvpevpeVC e −=−= 00001 ,, [14]
( ) ( ) 11011 ,, eGGvpevpeVE −=−= [15]
CV and EV thus defined (Deaton and Muelbauer, 1980b; Creedy, 1999) will both
take on negative values when there is a gain in welfare and positive values if there is a loss.
These measures depend on the particular form of the indirect utility function. In the
particular case of an AIDS model, the aforementioned function, expressed in logarithmic
terms, is (Baker, Blundell and Micklewright, 1989):

12
( )( )pb
payv lnlnln −= [16]
where b(p) and )(ln pa are defined as:
( ) ∏=
⋅=16
0li
iippb ββ [17]
and:
( ) jili lj
ijli
ii pppapa lnln21lnln
16 1616
0 ∑∑∑= ==
++= γα [18]
Thus, taking into account the equivalent expenditure definition, we have:
( )( )
( )( )R
Re
PbPaG
pbpaG lnlnlnln −
=− [19]
Hence, the explicit function of the equivalent expenditure used in this empirical
research is:
( )( ) ( )[ ] ( )R
Re PapaG
pbPb
G lnlnlnln +−= [20]
Therefore, the initial and final equivalent expenditures that we have computed for
the micro-simulation of the proposed tax reform are defined, respectively, as:
( )( ) ( )[ ] ( )10
0
1 lnlnlnln papaypbpb
G oe +−= [21]
( )( ) ( )[ ] ( )01
1
01 lnlnlnln papaypbpb
Ge +−= [22]
The static monetary variation evaluates changes in the total monetary expenditure in
the short run, that is, just before the consumers have had enough time to modify their
behaviour under the new prices. It is defined as:
( )∑=
−=16
1
01000 /i
iiiihih pppxwSMV [23]

13
0ihx being the pre-reform demanded quantity for the i-th good and the j-th household
and 0ihw the expenditure share for the same good and household. This index will take
positive values if the tax reform increases welfare and will have a negative sign otherwise.
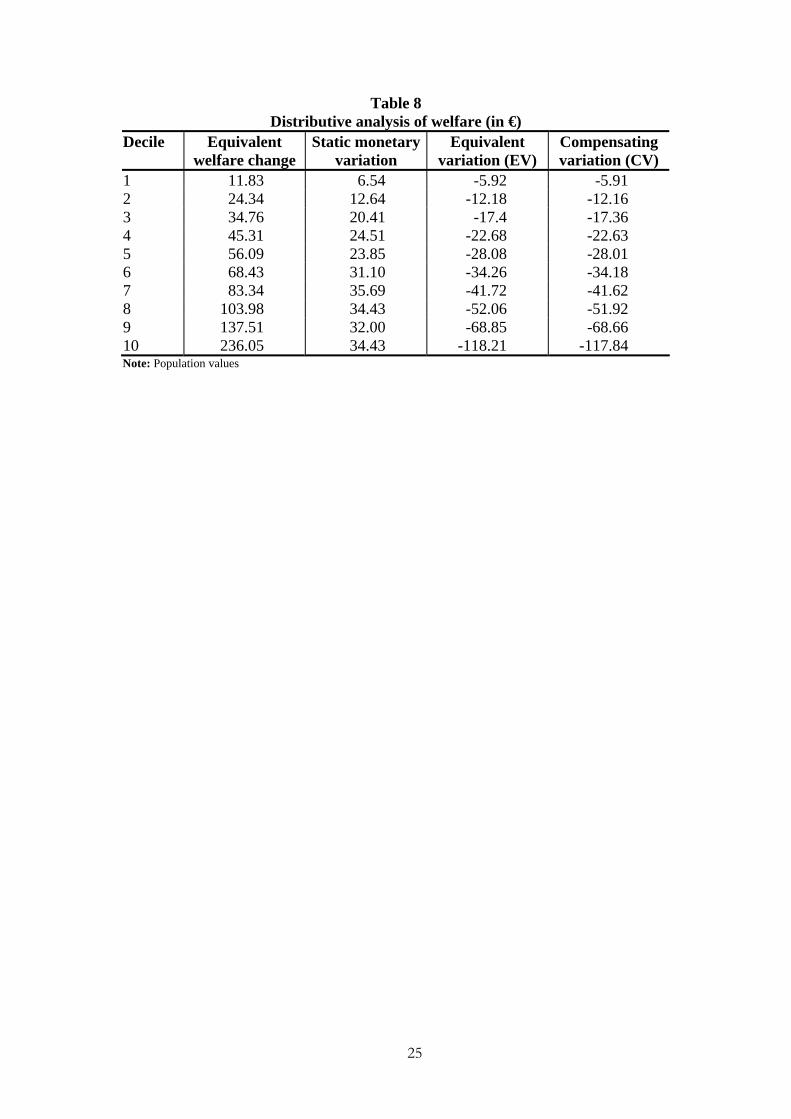
Differences in the consumption patterns along the expenditure distribution compel
us to study how gains originated by the proposed reform are distributed. As a starting
point, Table 8 contains the distribution of such gains by expenditure deciles. As stated
previously in Table 7, the results in Table 8 show that the proposed reform would induce,
on average, welfare gains in the short and long terms, regardless of the index used to
evaluate these changes.
Three effects must be stressed. Firstly, welfare gains are substantially greater if we
take into account household behaviour (SME takes the smallest values in absolute terms) in
the upper half of the expenditure distribution. Secondly, in absolute terms, these average
welfare gains are not very important, since they represent a small percentage in the average
household’s spending. Finally, results clearly indicate that welfare gains grow with
expenditure. Even more, welfare gains of the households from the last decile are almost 20
times greater than those from the first decile.
To complete this distributional analysis, we have also computed the revenue changes
by deciles displayed in Table 9. It can be observed that the lower the decile, the higher the
revenue loss, that is, households in the lower part of the expenditure distribution would
support the proposed tax reform. This can explain the expected inequality increment
measured by the Gini index. The total effect is mainly due a two opposite effects. First,
there is an expected increment of tobacco revenue when we move up in the expenditure
distribution. Second, we expect a decrease in the pharmaceutical and medical products and
services revenue more important at the upper deciles of the expenditure distribution, which
more than counterbalance revenue effects on tobacco.
As a supplement to the analysis of individual well-being, the effects on social welfare
of the proposed tax reform have been analysed. Specifically, Table 10 shows the results for
the Atkinson indices and King’s lambda for different values of the inequality aversion
parameter, ε. These results show small gains in social welfare when only price changes
effects are taken into account. However, the proposed tax reform would generate

14
important externalities derived from the tobacco and alcohol tax increment and the
pharmaceutical and medical services tax cut. Hence, we consider that the total social gains
are much more important than the effects captured by the traditional social welfare index,
such as those displayed in Table 10, that only take into account the monetary outcomes.
6. CONCLUSIONS
In this paper, we have simulated a fiscal reform that seeks to improve health by
means of an increase in tobacco and alcohol excise duties and a cut in pharmaceutical and
medical products and services VAT. We adopted a two-step procedure, the first of which
was to estimate the elasticities of demand by group of goods, using an Almost Ideal
Demand System of equations (Deaton and Muelbauer, 1980a, 1980b). Next, we have
simulated the change on alcohol and tobacco needed to finance the elimination of VAT in
health services in order to leave total revenue unchanged, Lewitt and Coates (1982).
Although the proposed reform does not have overall effects on revenue, since we haved
impose revenue-neutrality in our analysis, we expect a small increment in the expenditure
inequality measured by the Gini index and a decrease of progressiveness of indirect
taxation, computed via the Kakwani index. These effects are related to revenue rises at the
bottom deciles of the expenditure distribution and revenue reductions at the upper deciles.
However, the proposed tax reform would generate small private and social
welfare gains for all the deciles. Moreover, although both alcohol and tobacco are not
luxury goods, differences in the consumption pattern along the expenditure distribution
signify that the higher the income decile, the higher the average gains associated with
the proposed reform measured using either the Compensating Variation or the
Equivalent Variation.
The results displayed enable us to draw the conclusion that this policy can be
enforced in Spain because the monetary gains would be complemented with important
externalities derived from the tobacco and alcohol tax increment and the pharmaceutical
and medical services tax cut.
Therefore, this policy would lead to urgently needed decreases in illnesses related
to the addiction to alcohol and tobacco and to an increment in the pharmaceutical and
medical demand that should help to increase health. However, we recognise that more
investigation is needed to clarify the present results.

15
NOTES
1 For a general analysis of indirect taxes on welfare, see Creedy (1999).
2 This survey has been used, for instance, in Browning and Collado (2001).
3 The estimated coefficients and their standard errors are not reported in this paper but
they are available from correspondence author.
4 The exogenous variables are a set of dummy variables capturing if the household owns its
house (or has a second house), if some members smoke or drink, household head’s
education level, if the household is living in a municipality smaller than 10000 inhabitants
or greater than 500000 inhabitants, some member is unemployed or retired or self-
employed, white or blue collar. Prices and temporal variables temporal to capture terms
and tendency were also included as exogenous variables. The expenditure shares and the
total expenditure in real terms were the endogenous variables.

16
References
Alcock, J. and Docwra, G. (2005) A simulation analysis of the market effect of the Australian broadcasting corporation. Information Economics and Policy, 17, 407-427.
Algers, S.; Bernauer, E., Boero, M., Breheret, L., Dougherty, M., Fox, K., and Gabard, J.F. (1997) Review of microsimulation models. Deliverable nr. 3, SMARTEST Project, EU. (Available from www.its.leeds.ac.uk/projects/smartest/deliv3f.html)
Baker, P., Blundell, R.W. y Micklewright, J. (1989) Modelling energy demand in the UK using micro-data. Economic Journal, 99, 720-738.
Bradford, D. (2003). Pregnancy and the demand for cigarettes. American Economic Review, 93(5), 1752-1763.
Browning, M. and Collado, M.D. (2001) The response of expenditures to anticipated income changes: panel data estimates. American Economic Review, 91, 681-692.
Chaloupka and Wechsler. (1997). Tobacco control policies and smoking among young adults. Journal of Health Economics, 16(3), 359-73.
Creedy, J. (1999) Modelling indirect taxes and tax reform, Cheltenham: Edward Elgar.
Deaton, A. and Muelbauer, J. (1980b) Economics and consumer behaviour, Cambridge: Cambridge University Press.
Deaton, A. and Muellbauer, J. (1980a) An almost ideal demand system. American Economic Review, 70, 312-326.
Duffy, M. (2006) Tobacco consumption and policy in the United Kingdom. Applied Economics, 38,11, 1235-1257
Escaria, J.J. and Molina, J.A. (2004) Will a special tax on tobacco reduce lung cancer mortality? Evidence for EU countries. Applied Economics, 36,15, 1717-1722.
European Union (2005a) Excise Duty Tables. Part II – Energy products and Electricity, REF 1.021, mimeo, Brussels, Belgium.
European Union (2005b) Vat Rates Applied in the Member States of the European Community, Doc number 1636/2005 – En, mimeo, Brussels, Belgium.
Hicks, J.R. (1939) Value and Capital, Oxford: Clarendon Press.
King, M.A. (1983) Welfare Analysis of Tax Reforms Using Household Data. Journal of Public Economics, 21, 183-214.
Lewit, E. M. and Coate, D. (1982). The potential for using excise taxes to reduce smoking, Journal of Health Economics, 1(2), 121-45.
Liu, R. ; Vliet, D.V. and Watling, D. (2006) Microsimulation models incorporating both demand and supply dynamics. Transportation Research Part A, 40, 125-150.
Markowitz, S. (2006) Alcohol, Drugs and Violent Crime. International Journal of Law and Economics, 25,1, 20-44.

17
Merz, J. (1991) Micro-simulation – A survey of principles, developments and applications”, International Journal of Forecasting, 7, 77-104
Nicol, C.J. (1989) Testing a theory of Exact aggregation. Journal of Business and Economics, 7,259-265.
O´Donoghue, C. (2001) “Dynamic Microsimulation: A Methodological Survey”, Brazilian Electronic Journal of Economics, Vol. 4 No.2.
Romero, D. and Sanz, J.F. (2003) El Impuesto sobre las Ventas Minoristas de Determinados Hidrocarburos. Una evaluación de sus efectos económicos, Hacienda Pública Española/Revista de Economía Pública, 164, 49-73.
Sanz, J.F., Romero, D., Castañer, J., Prieto, J. and Fernández, J.F. (2003) Microsimulación y comportamiento en el análisis de reformas de imposición indirecta. El simulador de Imposición Indirecta del Instituto de Estudios Fiscales (SINDIEF). Madrid: Instituto de Estudios Fiscales.
Selvanathan, S. (2006) How similar are alcohol drinkers? International evidence. Applied Economics, 38,12, 1253-1362.
Sonsbeek, J.M. van and Gradus, R.H.J.M. (2006) A microsimulation analysis of the 2006 regime change in the Dutch disability scheme. Economic Modelling, 32, 427-456.
Stigler, S. and Becker, P. (1977) De Gustibus Non Est Disputandum. American Economic Review, 67, 76-90.
Young, D.J. and Likens, T.W. (2000) Alcohol regulation and auto fatalities. International Journal of Law and Economics, 20,1, 107-126.

18
Table 1 Expenditure elasticities, by group of goods
Expenditure group Mean Percentile 90
Percentile 99
1. Food and non-alcoholic beverages 0.629 0.776 0.849 2. Alcoholic beverages 0.663 0.857 0.948 3. Tobacco 0.809 0.914 0.955 4. Clothing and footwear 1.139 1.070 1.041 5. Housing 0.793 0.876 0.922 6. Furniture and household equipment 0.944 0.966 0.984 7. Gas 0.691 0.846 0.930 8. Medical and pharmaceutical products and services 1.059 1.026 1.010 9. Fuel 1.246 1.128 1.073 10. Private transport services 1.201 1.093 1.045 11. Public transport 1.015 1.006 1.002 12. Communications 0.864 0.922 0.961 13. Leisure, entertainment and holidays 1.437 1.228 1.146 14. Education 1.300 1.114 1.048 15. Consumer durables 1.488 1.178 1.065 16. Other goods not listed above 1.275 1.137 1.040
Note: Population values

19
Table 2 Own-price elasticities, by group of goods
Expenditure group Mean
Percentile 90
Percentile99
1. Food and non-alcoholic beverages -0.242 -0.513 -0.647 2. Alcoholic beverages -0.332 -0.714 -0.894 3. Tobacco -0.874 -0.940 -0.966 4. Clothing and footwear -0.647 -0.827 -0.904 5. Housing -0.814 -0.869 -0.899 6. Furniture and household equipment 0.506 -0.096 -0.556 7. Gas -0.571 -0.784 -0.899 8. Medical and pharmaceutical products and services -0.815 -0.921 -0.970 9. Fuel -0.817 -0.911 -0.955 10. Private transport services -1.853 -1.398 -1.198 11. Public transport -1.003 -1.001 -1.001 12. Communications -0.980 -0.987 -0.992 13. Leisure, entertainment and holidays -0.668 -0.857 -0.931 14. Education -0.123 -0.670 -0.865 15. Consumer durables -1.570 -1.233 -1.109 16. Other goods not listed above 5.411 2.186 -0.062
Note: Population values

20
Table 3 Ordinary cross-elasticities
Alcoholic beverages Tobacco
Medical and pharmaceutical
products and services1. Food and beverages 0.0058 0.0879 0.0077 2. Alcoholic beverages -0.3321 -0.2461 0.2997 3. Tobacco -0.0993 -0.8742 0.0309 4. Clothing and footwear 0.0189 -0.1663 -0.0326 5. Housing. -0.0108 -0.0056 0.0279 6. Furniture and household equipment -0.0158 -0.0124 -0.0429 7. Gas -0.1996 0.0806 0.3905 8. Medical and pharmaceutical products and services 0.1144 0.0230 -0.8155 9. Fuel -0.0128 -0.0105 -0.0803 10. Private transport services -0.8155 -0.2960 0.0861 11. Public transport 0.6319 0.2464 -0.0710 12. Communications 0.0132 -0.0315 0.0467 13. Leisure, entertainment and holidays -0.0107 -0.0045 -0.2081 14. Education 0.9725 -0.1201 0.1434 15. Consumer durables -0.2099 -0.0357 -0.1369 16. Other goods not listed above 0.5093 0.4576 0.9756
Note: Population values

21
Table 4 Expenditure shares pre- and post-reform (behavioural impact)
Initial scenario Final scenario Expenditure group Mean Std. Dev. Mean Std. Dev.
% variation
1. Food and beverages 0.1998 0.1023 0.2014 0.1023 0.787 2. Alcoholic beverages 0.0077 0.0147 0.0076 0.0147 -2.191 3. Tobacco 0.0198 0.0278 0.0201 0.0278 1.542 4. Clothing and footwear 0.0713 0.0553 0.0702 0.0553 -1.499 5. Housing. 0.2385 0.1224 0.2382 0.1224 -0.156 6. Furniture and household equipment 0.0898 0.0554 0.0897 0.0554 -0.040 7. Gas 0.0143 0.0131 0.0143 0.0131 -0.494 8. Medical and pharmaceutical products and services 0.0288 0.0377 0.0288 0.0377 -0.075 9. Fuel 0.0361 0.0393 0.0362 0.0393 0.157 10. Private transport services 0.0260 0.0323 0.0249 0.0320 -3.916 11. Public transport 0.0092 0.0163 0.0097 0.0163 5.049 12. Communications 0.0210 0.0153 0.0209 0.0153 -0.412 13. Leisure, entertainment and holidays 0.1366 0.1013 0.1374 0.1012 0.528 14. Education 0.0165 0.0292 0.0165 0.0292 -0.195 15. Consumer durables 0.0662 0.1185 0.0660 0.1184 -0.221 16. Other goods not listed above 0.0184 0.0267 0.0189 0.0267 2.946
Note: Sample values
22
Table 5 Revenue by groups of goods
(in millions of €) Expenditure group Initial scenario Final scenario
excise duties VAT excise
duties VAT
Total revenue
variation in %
1. Food and beverages 0.000 2068.481 0.000 2086.687 0.8802. Alcoholic beverages 115.247 215.899 127.859 210.655 2.2253. Tobacco 2167.826 525.244 2305.511 533.832 5.4314. Clothing and footwear 0.000 2019.747 0.000 1989.077 -1.5185. Housing. 0.000 0.000 0.000 0.000 0.0006. Furniture and household equipment 175.196 2427.498 175.122 2426.468 -0.0427. Gas 323.981 355.900 322.155 353.893 -0.5648. Medical and pharmaceutical products and services 0.000 142.330 0.000 0.000 -100.009. Fuel 4088.883 1075.105 4095.070 1076.732 0.15110. Private transport services 0.000 492.527 0.000 472.427 -4.08111. Public transport 0.000 127.832 0.000 134.050 4.86412. Communications 0.000 542.919 0.000 540.386 -0.46713. Leisure, entertainment and holidays 0.000 2104.743 0.000 2114.474 0.46214. Education 0.000 480.043 0.000 479.206 -0.17515. Consumer durables 672.854 2810.615 671.815 2806.275 -0.15416. Other goods not listed above 0.000 348.260 0.000 359.435 3.209
Note: Population values

23
Table 6 Distribution, progressiveness and redistribution indices
Pre-reform Post-reform Gini gross expenditure 0.31782913 Gini net expenditure 0.3134844 0.3135677 Reynolds-Smolensky index 0.0043447 0.0042615 Average rate 0.1137857 0.1137857 Kakwani progressiveness index 0.0385543 0.0380730 Reordenation income index 0.0006055 0.0006269
Note: Population values
24
Table 7 Distributive analysis of welfare (in €)
Decile Expenditure (G)
Initial equivalent expenditure( 0
eG ) Final equivalent expenditure
( 1eG )
1 5793.62 5787.71 5799.54 2 9241.68 9229.52 9253.86 3 11766.52 11749.16 11783.92 4 14150.16 14127.53 14172.84 5 16473.55 16445.54 16501.63 6 19019.09 18984.92 19053.35 7 21979.54 21937.93 22021.27 8 25904.45 25852.53 25956.51 9 31988.39 31919.73 32057.24 10 48288.01 48170.17 48406.22 Average 20460.50 20420.47 20500.64 Note: Population values
25
Table 8 Distributive analysis of welfare (in €)
Decile Equivalent welfare change
Static monetary variation
Equivalent variation (EV)
Compensating variation (CV)
1 11.83 6.54 -5.92 -5.91 2 24.34 12.64 -12.18 -12.16 3 34.76 20.41 -17.4 -17.36 4 45.31 24.51 -22.68 -22.63 5 56.09 23.85 -28.08 -28.01 6 68.43 31.10 -34.26 -34.18 7 83.34 35.69 -41.72 -41.62 8 103.98 34.43 -52.06 -51.92 9 137.51 32.00 -68.85 -68.66 10 236.05 34.43 -118.21 -117.84 Note: Population values

26
Table 9 Distributive analysis of revenue (in €)
Decile Total revenue
variation Alcohol revenue
variation Tobacco revenue variation
Pharmaceutical and medical
revenue variation
1 1.047 0.212 3.209 -2.669 2 0.869 0.358 5.959 -5.519 3 1.624 0.492 8.612 -7.212 4 1.909 0.525 10.275 -8.389 5 0.183 0.578 11.171 -10.878 6 1.038 0.764 13.640 -12.378 7 1.979 0.940 15.296 -12.919 8 0.089 0.937 16.453 -15.762 9 -3.328 0.833 18.211 -20.435 10 -5.415 0.712 23.300 -26.568

27
Table 10
Atkinson index & King’s lambda Pre-reform Post-reform
ε
Atkinson index
Initial equally-distributed equivalent
expenditure Atkinson
index Final equally-distributed equivalent expenditure
King’s lambda
0 0.000 17605.322 0.000 17674.436 1.0039 0.5 0.081 16176.465 0.081 16236.390 1.0037 1 0.159 14802.736 0.160 14854.067 1.0035 1.5 0.234 13477.730 0.235 13521.002 1.0032 2 0.307 12198.293 0.308 12234.014 1.0029 2.5 0.377 10967.233 0.378 10995.948 1.0026 3 0.444 9795.360 0.445 9817.732 1.0023 3.5 0.506 8701.248 0.507 8718.113 1.0019 4 0.562 7707.071 0.563 7719.423 1.0016 4.5 0.612 6831.115 0.613 6840.000 1.0013 5 0.655 6081.141 0.656 6087.516 1.0011
Note: Population values
FUNDACIÓN DE LAS CAJAS DE AHORROS
DOCUMENTOS DE TRABAJO
Últimos números publicados
159/2000 Participación privada en la construcción y explotación de carreteras de peaje Ginés de Rus, Manuel Romero y Lourdes Trujillo
160/2000 Errores y posibles soluciones en la aplicación del Value at Risk Mariano González Sánchez
161/2000 Tax neutrality on saving assets. The spahish case before and after the tax reform Cristina Ruza y de Paz-Curbera
162/2000 Private rates of return to human capital in Spain: new evidence F. Barceinas, J. Oliver-Alonso, J.L. Raymond y J.L. Roig-Sabaté
163/2000 El control interno del riesgo. Una propuesta de sistema de límites riesgo neutral Mariano González Sánchez
164/2001 La evolución de las políticas de gasto de las Administraciones Públicas en los años 90 Alfonso Utrilla de la Hoz y Carmen Pérez Esparrells
165/2001 Bank cost efficiency and output specification Emili Tortosa-Ausina
166/2001 Recent trends in Spanish income distribution: A robust picture of falling income inequality Josep Oliver-Alonso, Xavier Ramos y José Luis Raymond-Bara
167/2001 Efectos redistributivos y sobre el bienestar social del tratamiento de las cargas familiares en el nuevo IRPF Nuria Badenes Plá, Julio López Laborda, Jorge Onrubia Fernández
168/2001 The Effects of Bank Debt on Financial Structure of Small and Medium Firms in some Euro-pean Countries Mónica Melle-Hernández
169/2001 La política de cohesión de la UE ampliada: la perspectiva de España Ismael Sanz Labrador
170/2002 Riesgo de liquidez de Mercado Mariano González Sánchez
171/2002 Los costes de administración para el afiliado en los sistemas de pensiones basados en cuentas de capitalización individual: medida y comparación internacional. José Enrique Devesa Carpio, Rosa Rodríguez Barrera, Carlos Vidal Meliá
172/2002 La encuesta continua de presupuestos familiares (1985-1996): descripción, representatividad y propuestas de metodología para la explotación de la información de los ingresos y el gasto. Llorenc Pou, Joaquín Alegre
173/2002 Modelos paramétricos y no paramétricos en problemas de concesión de tarjetas de credito. Rosa Puertas, María Bonilla, Ignacio Olmeda
174/2002 Mercado único, comercio intra-industrial y costes de ajuste en las manufacturas españolas. José Vicente Blanes Cristóbal
175/2003 La Administración tributaria en España. Un análisis de la gestión a través de los ingresos y de los gastos. Juan de Dios Jiménez Aguilera, Pedro Enrique Barrilao González
176/2003 The Falling Share of Cash Payments in Spain. Santiago Carbó Valverde, Rafael López del Paso, David B. Humphrey Publicado en “Moneda y Crédito” nº 217, pags. 167-189.
177/2003 Effects of ATMs and Electronic Payments on Banking Costs: The Spanish Case. Santiago Carbó Valverde, Rafael López del Paso, David B. Humphrey
178/2003 Factors explaining the interest margin in the banking sectors of the European Union. Joaquín Maudos y Juan Fernández Guevara
179/2003 Los planes de stock options para directivos y consejeros y su valoración por el mercado de valores en España. Mónica Melle Hernández
180/2003 Ownership and Performance in Europe and US Banking – A comparison of Commercial, Co-operative & Savings Banks. Yener Altunbas, Santiago Carbó y Phil Molyneux
181/2003 The Euro effect on the integration of the European stock markets. Mónica Melle Hernández
182/2004 In search of complementarity in the innovation strategy: international R&D and external knowledge acquisition. Bruno Cassiman, Reinhilde Veugelers
183/2004 Fijación de precios en el sector público: una aplicación para el servicio municipal de sumi-nistro de agua. Mª Ángeles García Valiñas
184/2004 Estimación de la economía sumergida es España: un modelo estructural de variables latentes. Ángel Alañón Pardo, Miguel Gómez de Antonio
185/2004 Causas políticas y consecuencias sociales de la corrupción. Joan Oriol Prats Cabrera
186/2004 Loan bankers’ decisions and sensitivity to the audit report using the belief revision model. Andrés Guiral Contreras and José A. Gonzalo Angulo
187/2004 El modelo de Black, Derman y Toy en la práctica. Aplicación al mercado español. Marta Tolentino García-Abadillo y Antonio Díaz Pérez
188/2004 Does market competition make banks perform well?. Mónica Melle
189/2004 Efficiency differences among banks: external, technical, internal, and managerial Santiago Carbó Valverde, David B. Humphrey y Rafael López del Paso

190/2004 Una aproximación al análisis de los costes de la esquizofrenia en españa: los modelos jerár-quicos bayesianos F. J. Vázquez-Polo, M. A. Negrín, J. M. Cavasés, E. Sánchez y grupo RIRAG
191/2004 Environmental proactivity and business performance: an empirical analysis Javier González-Benito y Óscar González-Benito
192/2004 Economic risk to beneficiaries in notional defined contribution accounts (NDCs) Carlos Vidal-Meliá, Inmaculada Domínguez-Fabian y José Enrique Devesa-Carpio
193/2004 Sources of efficiency gains in port reform: non parametric malmquist decomposition tfp in-dex for Mexico Antonio Estache, Beatriz Tovar de la Fé y Lourdes Trujillo
194/2004 Persistencia de resultados en los fondos de inversión españoles Alfredo Ciriaco Fernández y Rafael Santamaría Aquilué
195/2005 El modelo de revisión de creencias como aproximación psicológica a la formación del juicio del auditor sobre la gestión continuada Andrés Guiral Contreras y Francisco Esteso Sánchez
196/2005 La nueva financiación sanitaria en España: descentralización y prospectiva David Cantarero Prieto
197/2005 A cointegration analysis of the Long-Run supply response of Spanish agriculture to the com-mon agricultural policy José A. Mendez, Ricardo Mora y Carlos San Juan
198/2005 ¿Refleja la estructura temporal de los tipos de interés del mercado español preferencia por la li-quidez? Magdalena Massot Perelló y Juan M. Nave
199/2005 Análisis de impacto de los Fondos Estructurales Europeos recibidos por una economía regional: Un enfoque a través de Matrices de Contabilidad Social M. Carmen Lima y M. Alejandro Cardenete
200/2005 Does the development of non-cash payments affect monetary policy transmission? Santiago Carbó Valverde y Rafael López del Paso
201/2005 Firm and time varying technical and allocative efficiency: an application for port cargo han-dling firms Ana Rodríguez-Álvarez, Beatriz Tovar de la Fe y Lourdes Trujillo
202/2005 Contractual complexity in strategic alliances Jeffrey J. Reuer y Africa Ariño
203/2005 Factores determinantes de la evolución del empleo en las empresas adquiridas por opa Nuria Alcalde Fradejas y Inés Pérez-Soba Aguilar
204/2005 Nonlinear Forecasting in Economics: a comparison between Comprehension Approach versus Learning Approach. An Application to Spanish Time Series Elena Olmedo, Juan M. Valderas, Ricardo Gimeno and Lorenzo Escot
205/2005 Precio de la tierra con presión urbana: un modelo para España Esther Decimavilla, Carlos San Juan y Stefan Sperlich
206/2005 Interregional migration in Spain: a semiparametric analysis Adolfo Maza y José Villaverde
207/2005 Productivity growth in European banking Carmen Murillo-Melchor, José Manuel Pastor y Emili Tortosa-Ausina
208/2005 Explaining Bank Cost Efficiency in Europe: Environmental and Productivity Influences. Santiago Carbó Valverde, David B. Humphrey y Rafael López del Paso
209/2005 La elasticidad de sustitución intertemporal con preferencias no separables intratemporalmente: los casos de Alemania, España y Francia. Elena Márquez de la Cruz, Ana R. Martínez Cañete y Inés Pérez-Soba Aguilar
210/2005 Contribución de los efectos tamaño, book-to-market y momentum a la valoración de activos: el caso español. Begoña Font-Belaire y Alfredo Juan Grau-Grau
211/2005 Permanent income, convergence and inequality among countries José M. Pastor and Lorenzo Serrano
212/2005 The Latin Model of Welfare: Do ‘Insertion Contracts’ Reduce Long-Term Dependence? Luis Ayala and Magdalena Rodríguez
213/2005 The effect of geographic expansion on the productivity of Spanish savings banks Manuel Illueca, José M. Pastor and Emili Tortosa-Ausina
214/2005 Dynamic network interconnection under consumer switching costs Ángel Luis López Rodríguez
215/2005 La influencia del entorno socioeconómico en la realización de estudios universitarios: una aproxi-mación al caso español en la década de los noventa Marta Rahona López
216/2005 The valuation of spanish ipos: efficiency analysis Susana Álvarez Otero
217/2005 On the generation of a regular multi-input multi-output technology using parametric output dis-tance functions Sergio Perelman and Daniel Santin
218/2005 La gobernanza de los procesos parlamentarios: la organización industrial del congreso de los di-putados en España Gonzalo Caballero Miguez
219/2005 Determinants of bank market structure: Efficiency and political economy variables Francisco González
220/2005 Agresividad de las órdenes introducidas en el mercado español: estrategias, determinantes y me-didas de performance David Abad Díaz
221/2005 Tendencia post-anuncio de resultados contables: evidencia para el mercado español Carlos Forner Rodríguez, Joaquín Marhuenda Fructuoso y Sonia Sanabria García
222/2005 Human capital accumulation and geography: empirical evidence in the European Union Jesús López-Rodríguez, J. Andrés Faíña y Jose Lopez Rodríguez
223/2005 Auditors' Forecasting in Going Concern Decisions: Framing, Confidence and Information Proc-essing Waymond Rodgers and Andrés Guiral
224/2005 The effect of Structural Fund spending on the Galician region: an assessment of the 1994-1999 and 2000-2006 Galician CSFs José Ramón Cancelo de la Torre, J. Andrés Faíña and Jesús López-Rodríguez
225/2005 The effects of ownership structure and board composition on the audit committee activity: Span-ish evidence Carlos Fernández Méndez and Rubén Arrondo García
226/2005 Cross-country determinants of bank income smoothing by managing loan loss provisions Ana Rosa Fonseca and Francisco González
227/2005 Incumplimiento fiscal en el irpf (1993-2000): un análisis de sus factores determinantes Alejandro Estellér Moré
228/2005 Region versus Industry effects: volatility transmission Pilar Soriano Felipe and Francisco J. Climent Diranzo
229/2005 Concurrent Engineering: The Moderating Effect Of Uncertainty On New Product Development Success Daniel Vázquez-Bustelo and Sandra Valle
230/2005 On zero lower bound traps: a framework for the analysis of monetary policy in the ‘age’ of cen-tral banks Alfonso Palacio-Vera
231/2005 Reconciling Sustainability and Discounting in Cost Benefit Analysis: a methodological proposal M. Carmen Almansa Sáez and Javier Calatrava Requena
232/2005 Can The Excess Of Liquidity Affect The Effectiveness Of The European Monetary Policy? Santiago Carbó Valverde and Rafael López del Paso
233/2005 Inheritance Taxes In The Eu Fiscal Systems: The Present Situation And Future Perspectives. Miguel Angel Barberán Lahuerta
234/2006 Bank Ownership And Informativeness Of Earnings. Víctor M. González
235/2006 Developing A Predictive Method: A Comparative Study Of The Partial Least Squares Vs Maxi-mum Likelihood Techniques. Waymond Rodgers, Paul Pavlou and Andres Guiral.
236/2006 Using Compromise Programming for Macroeconomic Policy Making in a General Equilibrium Framework: Theory and Application to the Spanish Economy. Francisco J. André, M. Alejandro Cardenete y Carlos Romero.

237/2006 Bank Market Power And Sme Financing Constraints. Santiago Carbó-Valverde, Francisco Rodríguez-Fernández y Gregory F. Udell.
238/2006 Trade Effects Of Monetary Agreements: Evidence For Oecd Countries. Salvador Gil-Pareja, Rafael Llorca-Vivero y José Antonio Martínez-Serrano.
239/2006 The Quality Of Institutions: A Genetic Programming Approach. Marcos Álvarez-Díaz y Gonzalo Caballero Miguez.
240/2006 La interacción entre el éxito competitivo y las condiciones del mercado doméstico como deter-minantes de la decisión de exportación en las Pymes. Francisco García Pérez.
241/2006 Una estimación de la depreciación del capital humano por sectores, por ocupación y en el tiempo. Inés P. Murillo.
242/2006 Consumption And Leisure Externalities, Economic Growth And Equilibrium Efficiency. Manuel A. Gómez.
243/2006 Measuring efficiency in education: an analysis of different approaches for incorporating non-discretionary inputs. Jose Manuel Cordero-Ferrera, Francisco Pedraja-Chaparro y Javier Salinas-Jiménez
244/2006 Did The European Exchange-Rate Mechanism Contribute To The Integration Of Peripheral Countries?. Salvador Gil-Pareja, Rafael Llorca-Vivero y José Antonio Martínez-Serrano
245/2006 Intergenerational Health Mobility: An Empirical Approach Based On The Echp. Marta Pascual and David Cantarero
246/2006 Measurement and analysis of the Spanish Stock Exchange using the Lyapunov exponent with digital technology. Salvador Rojí Ferrari and Ana Gonzalez Marcos
247/2006 Testing For Structural Breaks In Variance Withadditive Outliers And Measurement Errors. Paulo M.M. Rodrigues and Antonio Rubia
248/2006 The Cost Of Market Power In Banking: Social Welfare Loss Vs. Cost Inefficiency. Joaquín Maudos and Juan Fernández de Guevara
249/2006 Elasticidades de largo plazo de la demanda de vivienda: evidencia para España (1885-2000). Desiderio Romero Jordán, José Félix Sanz Sanz y César Pérez López
250/2006 Regional Income Disparities in Europe: What role for location?. Jesús López-Rodríguez and J. Andrés Faíña
251/2006 Funciones abreviadas de bienestar social: Una forma sencilla de simultanear la medición de la eficiencia y la equidad de las políticas de gasto público. Nuria Badenes Plá y Daniel Santín González
252/2006 “The momentum effect in the Spanish stock market: Omitted risk factors or investor behaviour?”. Luis Muga and Rafael Santamaría
253/2006 Dinámica de precios en el mercado español de gasolina: un equilibrio de colusión tácita. Jordi Perdiguero García

254/2006 Desigualdad regional en España: renta permanente versus renta corriente. José M.Pastor, Empar Pons y Lorenzo Serrano
255/2006 Environmental implications of organic food preferences: an application of the impure public goods model. Ana Maria Aldanondo-Ochoa y Carmen Almansa-Sáez
256/2006 Family tax credits versus family allowances when labour supply matters: Evidence for Spain. José Felix Sanz-Sanz, Desiderio Romero-Jordán y Santiago Álvarez-García
257/2006 La internacionalización de la empresa manufacturera española: efectos del capital humano genérico y específico. José López Rodríguez
258/2006 Evaluación de las migraciones interregionales en España, 1996-2004. María Martínez Torres
259/2006 Efficiency and market power in Spanish banking. Rolf Färe, Shawna Grosskopf y Emili Tortosa-Ausina.
260/2006 Asimetrías en volatilidad, beta y contagios entre las empresas grandes y pequeñas cotizadas en la bolsa española. Helena Chuliá y Hipòlit Torró.
261/2006 Birth Replacement Ratios: New Measures of Period Population Replacement. José Antonio Ortega.
262/2006 Accidentes de tráfico, víctimas mortales y consumo de alcohol. José Mª Arranz y Ana I. Gil.
263/2006 Análisis de la Presencia de la Mujer en los Consejos de Administración de las Mil Mayores Em-presas Españolas. Ruth Mateos de Cabo, Lorenzo Escot Mangas y Ricardo Gimeno Nogués.
264/2006 Crisis y Reforma del Pacto de Estabilidad y Crecimiento. Las Limitaciones de la Política Econó-mica en Europa. Ignacio Álvarez Peralta.
265/2006 Have Child Tax Allowances Affected Family Size? A Microdata Study For Spain (1996-2000). Jaime Vallés-Giménez y Anabel Zárate-Marco.
266/2006 Health Human Capital And The Shift From Foraging To Farming. Paolo Rungo.
267/2006 Financiación Autonómica y Política de la Competencia: El Mercado de Gasolina en Canarias. Juan Luis Jiménez y Jordi Perdiguero.
268/2006 El cumplimiento del Protocolo de Kyoto para los hogares españoles: el papel de la imposición sobre la energía. Desiderio Romero-Jordán y José Félix Sanz-Sanz.
269/2006 Banking competition, financial dependence and economic growth Joaquín Maudos y Juan Fernández de Guevara
270/2006 Efficiency, subsidies and environmental adaptation of animal farming under CAP Werner Kleinhanß, Carmen Murillo, Carlos San Juan y Stefan Sperlich

271/2006 Interest Groups, Incentives to Cooperation and Decision-Making Process in the European Union A. Garcia-Lorenzo y Jesús López-Rodríguez
272/2006 Riesgo asimétrico y estrategias de momentum en el mercado de valores español Luis Muga y Rafael Santamaría
273/2006 Valoración de capital-riesgo en proyectos de base tecnológica e innovadora a través de la teoría de opciones reales Gracia Rubio Martín
274/2006 Capital stock and unemployment: searching for the missing link Ana Rosa Martínez-Cañete, Elena Márquez de la Cruz, Alfonso Palacio-Vera and Inés Pérez-Soba Aguilar
275/2006 Study of the influence of the voters’ political culture on vote decision through the simulation of a political competition problem in Spain Sagrario Lantarón, Isabel Lillo, Mª Dolores López and Javier Rodrigo
276/2006 Investment and growth in Europe during the Golden Age Antonio Cubel and Mª Teresa Sanchis
277/2006 Efectos de vincular la pensión pública a la inversión en cantidad y calidad de hijos en un modelo de equilibrio general Robert Meneu Gaya
278/2006 El consumo y la valoración de activos Elena Márquez y Belén Nieto
279/2006 Economic growth and currency crisis: A real exchange rate entropic approach David Matesanz Gómez y Guillermo J. Ortega
280/2006 Three measures of returns to education: An illustration for the case of Spain María Arrazola y José de Hevia
281/2006 Composition of Firms versus Composition of Jobs Antoni Cunyat
282/2006 La vocación internacional de un holding tranviario belga: la Compagnie Mutuelle de Tram-ways, 1895-1918 Alberte Martínez López
283/2006 Una visión panorámica de las entidades de crédito en España en la última década. Constantino García Ramos
284/2006 Foreign Capital and Business Strategies: a comparative analysis of urban transport in Madrid and Barcelona, 1871-1925 Alberte Martínez López
285/2006 Los intereses belgas en la red ferroviaria catalana, 1890-1936 Alberte Martínez López
286/2006 The Governance of Quality: The Case of the Agrifood Brand Names Marta Fernández Barcala, Manuel González-Díaz y Emmanuel Raynaud
287/2006 Modelling the role of health status in the transition out of malthusian equilibrium Paolo Rungo, Luis Currais and Berta Rivera
288/2006 Industrial Effects of Climate Change Policies through the EU Emissions Trading Scheme Xavier Labandeira and Miguel Rodríguez

289/2006 Globalisation and the Composition of Government Spending: An analysis for OECD countries Norman Gemmell, Richard Kneller and Ismael Sanz
290/2006 La producción de energía eléctrica en España: Análisis económico de la actividad tras la liberali-zación del Sector Eléctrico Fernando Hernández Martínez
291/2006 Further considerations on the link between adjustment costs and the productivity of R&D invest-ment: evidence for Spain Desiderio Romero-Jordán, José Félix Sanz-Sanz and Inmaculada Álvarez-Ayuso
292/2006 Una teoría sobre la contribución de la función de compras al rendimiento empresarial Javier González Benito
293/2006 Agility drivers, enablers and outcomes: empirical test of an integrated agile manufacturing model Daniel Vázquez-Bustelo, Lucía Avella and Esteban Fernández
294/2006 Testing the parametric vs the semiparametric generalized mixed effects models María José Lombardía and Stefan Sperlich
295/2006 Nonlinear dynamics in energy futures Mariano Matilla-García
296/2006 Estimating Spatial Models By Generalized Maximum Entropy Or How To Get Rid Of W Esteban Fernández Vázquez, Matías Mayor Fernández and Jorge Rodriguez-Valez
297/2006 Optimización fiscal en las transmisiones lucrativas: análisis metodológico Félix Domínguez Barrero
298/2006 La situación actual de la banca online en España Francisco José Climent Diranzo y Alexandre Momparler Pechuán
299/2006 Estrategia competitiva y rendimiento del negocio: el papel mediador de la estrategia y las capacidades productivas Javier González Benito y Isabel Suárez González
300/2006 A Parametric Model to Estimate Risk in a Fixed Income Portfolio Pilar Abad and Sonia Benito
301/2007 Análisis Empírico de las Preferencias Sociales Respecto del Gasto en Obra Social de las Cajas de Ahorros Alejandro Esteller-Moré, Jonathan Jorba Jiménez y Albert Solé-Ollé
302/2007 Assessing the enlargement and deepening of regional trading blocs: The European Union case Salvador Gil-Pareja, Rafael Llorca-Vivero y José Antonio Martínez-Serrano
303/2007 ¿Es la Franquicia un Medio de Financiación?: Evidencia para el Caso Español Vanesa Solís Rodríguez y Manuel González Díaz
304/2007 On the Finite-Sample Biases in Nonparametric Testing for Variance Constancy Paulo M.M. Rodrigues and Antonio Rubia
305/2007 Spain is Different: Relative Wages 1989-98 José Antonio Carrasco Gallego

306/2007 Poverty reduction and SAM multipliers: An evaluation of public policies in a regional framework Francisco Javier De Miguel-Vélez y Jesús Pérez-Mayo
307/2007 La Eficiencia en la Gestión del Riesgo de Crédito en las Cajas de Ahorro Marcelino Martínez Cabrera
308/2007 Optimal environmental policy in transport: unintended effects on consumers' generalized price M. Pilar Socorro and Ofelia Betancor
309/2007 Agricultural Productivity in the European Regions: Trends and Explanatory Factors Roberto Ezcurra, Belen Iráizoz, Pedro Pascual and Manuel Rapún
310/2007 Long-run Regional Population Divergence and Modern Economic Growth in Europe: a Case Study of Spain María Isabel Ayuda, Fernando Collantes and Vicente Pinilla
311/2007 Financial Information effects on the measurement of Commercial Banks’ Efficiency Borja Amor, María T. Tascón and José L. Fanjul
312/2007 Neutralidad e incentivos de las inversiones financieras en el nuevo IRPF Félix Domínguez Barrero
313/2007 The Effects of Corporate Social Responsibility Perceptions on The Valuation of Common Stock Waymond Rodgers , Helen Choy and Andres Guiral-Contreras
314/2007 Country Creditor Rights, Information Sharing and Commercial Banks’ Profitability Persistence across the world Borja Amor, María T. Tascón and José L. Fanjul
315/2007 ¿Es Relevante el Déficit Corriente en una Unión Monetaria? El Caso Español Javier Blanco González y Ignacio del Rosal Fernández
316/2007 The Impact of Credit Rating Announcements on Spanish Corporate Fixed Income Performance: Returns, Yields and Liquidity Pilar Abad, Antonio Díaz and M. Dolores Robles
317/2007 Indicadores de Lealtad al Establecimiento y Formato Comercial Basados en la Distribución del Presupuesto Cesar Augusto Bustos Reyes y Óscar González Benito
318/2007 Migrants and Market Potential in Spain over The XXth Century: A Test Of The New Economic Geography Daniel A. Tirado, Jordi Pons, Elisenda Paluzie and Javier Silvestre
319/2007 El Impacto del Coste de Oportunidad de la Actividad Emprendedora en la Intención de los Ciu-dadanos Europeos de Crear Empresas Luis Miguel Zapico Aldeano
320/2007 Los belgas y los ferrocarriles de vía estrecha en España, 1887-1936 Alberte Martínez López
321/2007 Competición política bipartidista. Estudio geométrico del equilibrio en un caso ponderado Isabel Lillo, Mª Dolores López y Javier Rodrigo
322/2007 Human resource management and environment management systems: an empirical study Mª Concepción López Fernández, Ana Mª Serrano Bedia and Gema García Piqueres

323/2007 Wood and industrialization. evidence and hypotheses from the case of Spain, 1860-1935. Iñaki Iriarte-Goñi and María Isabel Ayuda Bosque
324/2007 New evidence on long-run monetary neutrality. J. Cunado, L.A. Gil-Alana and F. Perez de Gracia
325/2007 Monetary policy and structural changes in the volatility of us interest rates. Juncal Cuñado, Javier Gomez Biscarri and Fernando Perez de Gracia
326/2007 The productivity effects of intrafirm diffusion. Lucio Fuentelsaz, Jaime Gómez and Sergio Palomas
327/2007 Unemployment duration, layoffs and competing risks. J.M. Arranz, C. García-Serrano and L. Toharia
328/2007 El grado de cobertura del gasto público en España respecto a la UE-15 Nuria Rueda, Begoña Barruso, Carmen Calderón y Mª del Mar Herrador
329/2007 The Impact of Direct Subsidies in Spain before and after the CAP'92 Reform Carmen Murillo, Carlos San Juan and Stefan Sperlich
330/2007 Determinants of post-privatisation performance of Spanish divested firms Laura Cabeza García and Silvia Gómez Ansón
331/2007 ¿Por qué deciden diversificar las empresas españolas? Razones oportunistas versus razones económicas Almudena Martínez Campillo
332/2007 Dynamical Hierarchical Tree in Currency Markets Juan Gabriel Brida, David Matesanz Gómez and Wiston Adrián Risso
333/2007 Los determinantes sociodemográficos del gasto sanitario. Análisis con microdatos individuales Ana María Angulo, Ramón Barberán, Pilar Egea y Jesús Mur
334/2007 Why do companies go private? The Spanish case Inés Pérez-Soba Aguilar
335/2007 The use of gis to study transport for disabled people Verónica Cañal Fernández
336/2007 The long run consequences of M&A: An empirical application Cristina Bernad, Lucio Fuentelsaz and Jaime Gómez
337/2007 Las clasificaciones de materias en economía: principios para el desarrollo de una nueva clasificación Valentín Edo Hernández
338/2007 Reforming Taxes and Improving Health: A Revenue-Neutral Tax Reform to Eliminate Medical and Pharmaceutical VAT Santiago Álvarez-García, Carlos Pestana Barros y Juan Prieto-Rodriguez