ATLAS data quality operations and performance ... - DiVA portal
Upload
khangminh22Category
view
5download
0
TB/18-19/168
1
Title of Meeting Board of Directors Date 28/02/2019
Title of Paper: Integrated Performance and Quality Report (IQPR) Performance Update as of: January 2019
Author: All Executive Directors
Presenter: Helen Greatorex, Chief Executive
Executive Director:
Sheila Stenson – Executive Director of Finance
Purpose: the paper is for: Delete as applicable • Discussion and information.
Recommendation: The Board is asked to consider January’s Integrated Quality and Performance Report (IQPR) noting the key areas of focus. Summary of Key Issues: No more than five bullet points Each section has been written by the executive lead for the domain. This report includes for the first time, a summary by Care Group, of CLiQ check themes. In addition, as requested by the Board in January, a version control tracker has been introduced so that the reader can easily identify changes to format or content. The report provides trust-wide performance data, with Care Group and locality data monitored by the executive and their teams. The report highlights performance that has improved, is on track and has declined. Of particular note in January, was the continued trend of a very high (more than double) long length of stay for our older adult patients. This is a key piece of work for our senior clinicians currently and an organisational priority. The Transformation work with Kent County Council is having the anticipated effect on some aspects of Community Mental Health Team work and the report sets out the mitigation in hand to ensure that our patients are safe and our staff clear about priorities and processes. It is positive to note that our follow up of patients discharged from hospital is back to 95.6%, ensuring that when people are at their most vulnerable, in the first seven days post discharge, we make contact with them and ensure that they have the care that they need.
Report History: None
TB/18-19/168
2
Strategic Objectives: Select as applicable ☒ Consistently deliver an outstanding quality of care
☐ Recruit retain and develop the best staff making KMPT a great place to work
☒ Put continuous improvement at the heart of what we do
☐ Develop and extend our research and innovation work
☐ Maximise the use of digital technology
☐ Meet or exceed requirements set out in the Five Year Forward View
☐ Deliver financial balance and organisational sustainability
☐ Develop our core business and enter new markets through increased
partnership working
☐ Ensure success of our system-wide sustainability plans through active
participation, partnership and leadership
Implications / Impact: Patient Safety: Patient safety is a key priority and issues that may affect this, are highlighted in the report and considered by the Board. Identified Risks and Risk Management Action: Risks set out in the report are all reflected in the Trust’s risk register or BAF. All risks are outlined within the paper below Resource and Financial Implications: Failure to achieve some of the regulatory, performance or data quality metrics could result in a financial penalty under the NHS Standard Contract and importantly, to a poor quality service for patients potentially leading to claims. Legal/ Regulatory: None Engagement and Consultation: Not applicable Equality: None Quality Impact Assessment Form Completed: No
TB/18-19/168
3
Introduction The Integrated Quality and Performance Report (IQPR) is a key document in ensuring that the Board
is sighted on key areas of concern in relation to a range of internally and externally set Key
Performance Indicators (KPIs).
Good examples of IQPRs from high performing organisations, change and improve over time.
KMPT’s is no different, and continues to be adjusted and improved in the light of feedback from
internal and external stakeholders. Any changes to indicators will be clearly documented and the
report will include the rationale for any change.
Each member of the Chief Executive’s team provides the commentary to the area for which they are
the lead. This adds a further strengthening to the actions outlined, and ownership and accountability
where improvements are required.
Importantly the IQPR now includes a dedicated section on workforce. This is an extremely important
area of focus for us because without brilliant people, we cannot deliver brilliant care. Reducing our
turnover rate, improving the robustness of our appraisal and supervision, and helping our workforce
stay fit and at work, are all essential in meeting our strategic objectives.
Because this report brings together in one place, all the key work streams that the Chief Executive’s
team lead, the overarching paper is presented to the Board by the Chief Executive.
Our nine Strategic Objectives (for 2016-19) are set out at the start of the report under our aim of
Brilliant Care Through Brilliant People, along with the Care Quality Commission’s five Domains (Safe,
Caring, Effective, Responsive and Well Led) helps focus the report on both the national and local
context.
TB/18-19/168
4
Executive Commentary

TB/18-19/168
5
The data provided to the Board is drawn from performance in January and is shown at Trust-wide
level.
Of particular note in January was performance against a number of indicators relating to Community
Mental Health Teams for adults. Whilst there was an improvement from 92.9 to 95.6% in seven day
follow up, the percentage of patients who have a valid Care Plan reduced from 92.7 to 91.1%. Crisis
Plans reduced by a further .6% to 93% against a target of 95%. We had anticipated a dip in
performance during the transformation work with Kent County Council and the teams are focused on
driving up performance. Where there is variance, team by team, worker by worker analysis is
undertaken and remedial action including bringing in temporary staff is taken.
We remain extremely concerned at the number of older adults whose stay with us significantly
exceeds the best practice average length of stay (LoS). The target is 52 days, and our performance in
January 2019 increased from its December position of 107.3, to 115.3. Clearly, this is not what we
want for our patients and being able to discharge people when they no longer need to be in hosptial is
a priority. Our most senior clinical staff are leading work to address this unsatisfactory situation, and a
foccused Quality Improvement intiative is due to commence on Orchard Ward. We know that if our
average LoS was at the right level, our patients would receive the right care in the right place, and we
would have significant numbers of spare beds on our wards for older adults.
A trend line over twelve months is provided after each section enabling the reader to see a year’s
performance at a glance. Trust-wide data is drawn from a range of sources and includes individual,
team, Care Group and locality information. That data is reviewed and explored by members of the
executive team with every Care Group at the monthly Quality Performance Review meetings. In
addition, where an area is receiving additional attention as a result of concerns, special reporting and
monitoring mechanisms are implemented, supported by trajectories for improvement.
Not all areas of performance (including those nationally set) have a target set against them. This is an
area for further consideration with the board as the report evolves. It is helpful to note that in the
absence of a national target for mental health service users, the Trust has set its own local target for
two key indicators;
Referral to Assessment Within Four Weeks
Referral to Treatment Within Eighteen Weeks
We are exploring ways to disagregate this information to make it a more meaningful indicator of the
quality of care. Currently, the data represents all services provided by the Trust, where referrals are
received. We believe that there is a more helpful way to share and use this information and anticipate
that work over the Spring will enable us to further improve this element of the report.
TB/18-19/168
6
Of the eighteen Single Oversight Framework targets, it is notable that the biggest challenges continue
to relate to the organisation’s financial performance. This is accurately reflected on the BAF and the
Well Led section of this report sets out the detail of actions in hand to ensure that we remain on track
to meet our year end control total, and address our underlying financial defecit.
There is an important interface between some aspects of this, and our ability to attract and retain the
best people, high spend on temporary staff, and our current above agency cap spend are issues on
which the board will want to remain sighted.
Underpinning the IQPR is a series of executive chaired meetings. They bring together KMPT experts
in their field in order to understand the data at a granular level and test that actions in hand to resolve
concerns are strong enough and delivering improvements in a timely way.
Supporting the work of the board, are its sub-committees each of which considers in detail, aspects of
the IQPR. This report, when working as we expect it to, will enable the board to operate at strategic
level, confident in the work of the sub-committees in testing assurance and understanding further
detail provided by the executive and their teams.
The report is becoming a familiar tool and point of reference in the Trust and as we had hoped, further
strengthening our ability to triangulate information and explore in detail areas of concern. My team will
provide detail on the work being done to understand and address these areas of concern whilst
maintaining improved performance across a range of other areas.
Helen Greatorex
Chief Executive
TB/18-19/168
7
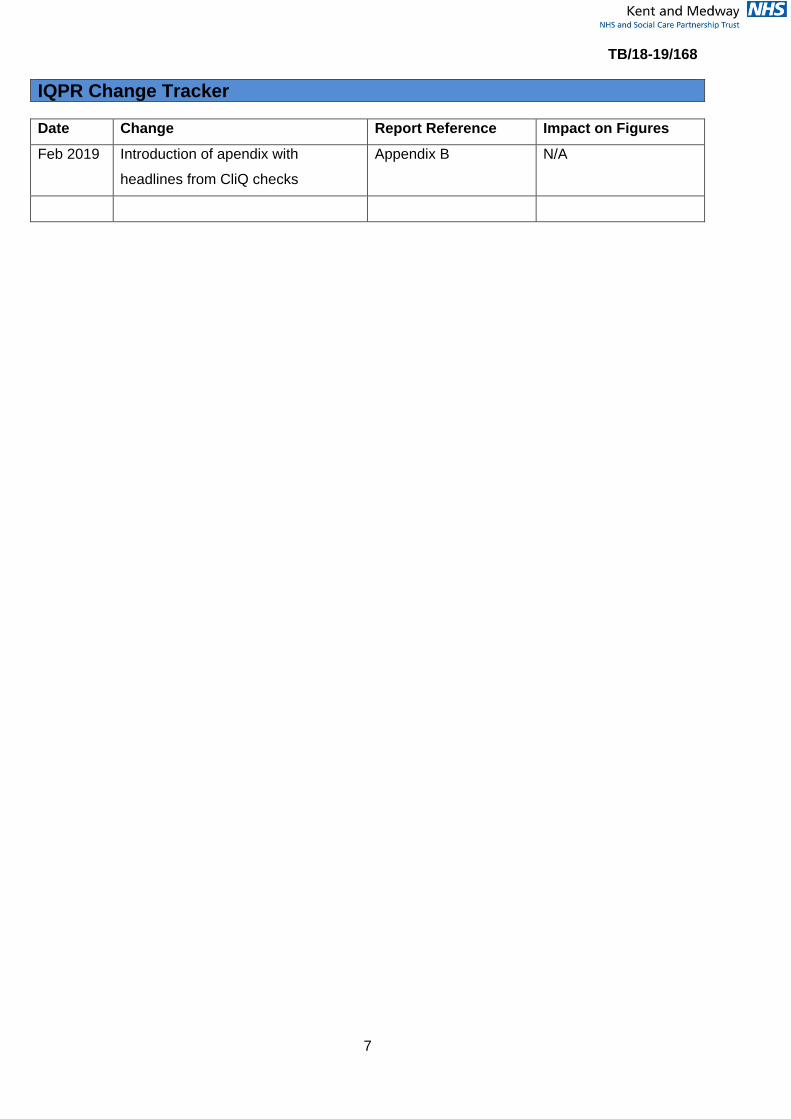
IQPR Change Tracker Date Change Report Reference Impact on Figures
Feb 2019 Introduction of apendix with
headlines from CliQ checks
Appendix B N/A
TB/18-19/168
8
Regulatory Targets – Single Oversight Framework (SoF) Overview The Single Oversight Framework (SOF) sets out how NHS Improvement (NHSI) oversee NHS trusts
and NHS foundation trusts, using one consistent approach. It helps to determine the type and level of
support needed. The first version of the SOF was published in September 2016 with small
amendments made in 2017.
The Framework aims to help NHSI to identify NHS providers' support needs across five themes:
• quality of care
• finance and use of resources
• operational performance
• strategic change
• leadership and improvement capability
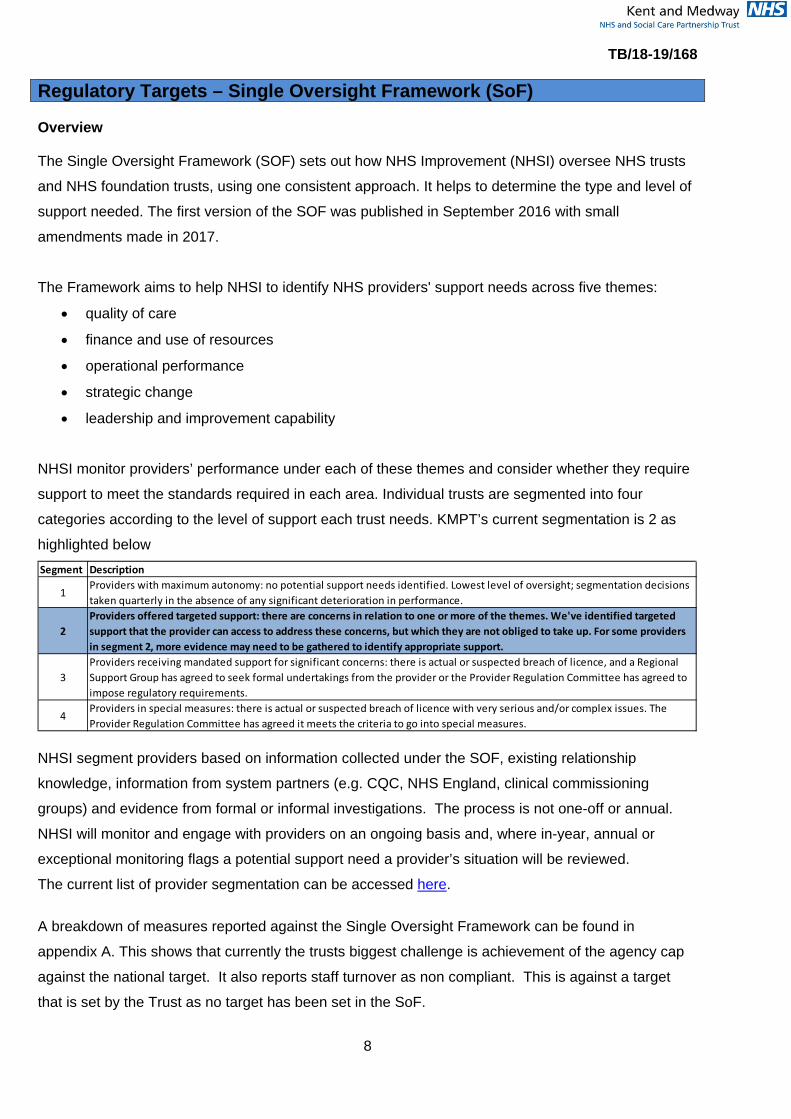
NHSI monitor providers’ performance under each of these themes and consider whether they require
support to meet the standards required in each area. Individual trusts are segmented into four
categories according to the level of support each trust needs. KMPT’s current segmentation is 2 as
highlighted below
NHSI segment providers based on information collected under the SOF, existing relationship
knowledge, information from system partners (e.g. CQC, NHS England, clinical commissioning
groups) and evidence from formal or informal investigations. The process is not one-off or annual.
NHSI will monitor and engage with providers on an ongoing basis and, where in-year, annual or
exceptional monitoring flags a potential support need a provider’s situation will be reviewed.
The current list of provider segmentation can be accessed here.
A breakdown of measures reported against the Single Oversight Framework can be found in
appendix A. This shows that currently the trusts biggest challenge is achievement of the agency cap
against the national target. It also reports staff turnover as non compliant. This is against a target
that is set by the Trust as no target has been set in the SoF.
Segment Description
1Providers with maximum autonomy: no potential support needs identified. Lowest level of oversight; segmentation decisions taken quarterly in the absence of any significant deterioration in performance.
2Providers offered targeted support: there are concerns in relation to one or more of the themes. We've identified targeted support that the provider can access to address these concerns, but which they are not obliged to take up. For some providers in segment 2, more evidence may need to be gathered to identify appropriate support.
3Providers receiving mandated support for significant concerns: there is actual or suspected breach of licence, and a Regional Support Group has agreed to seek formal undertakings from the provider or the Provider Regulation Committee has agreed to impose regulatory requirements.
4Providers in special measures: there is actual or suspected breach of licence with very serious and/or complex issues. The Provider Regulation Committee has agreed it meets the criteria to go into special measures.
TB/18-19/168
9
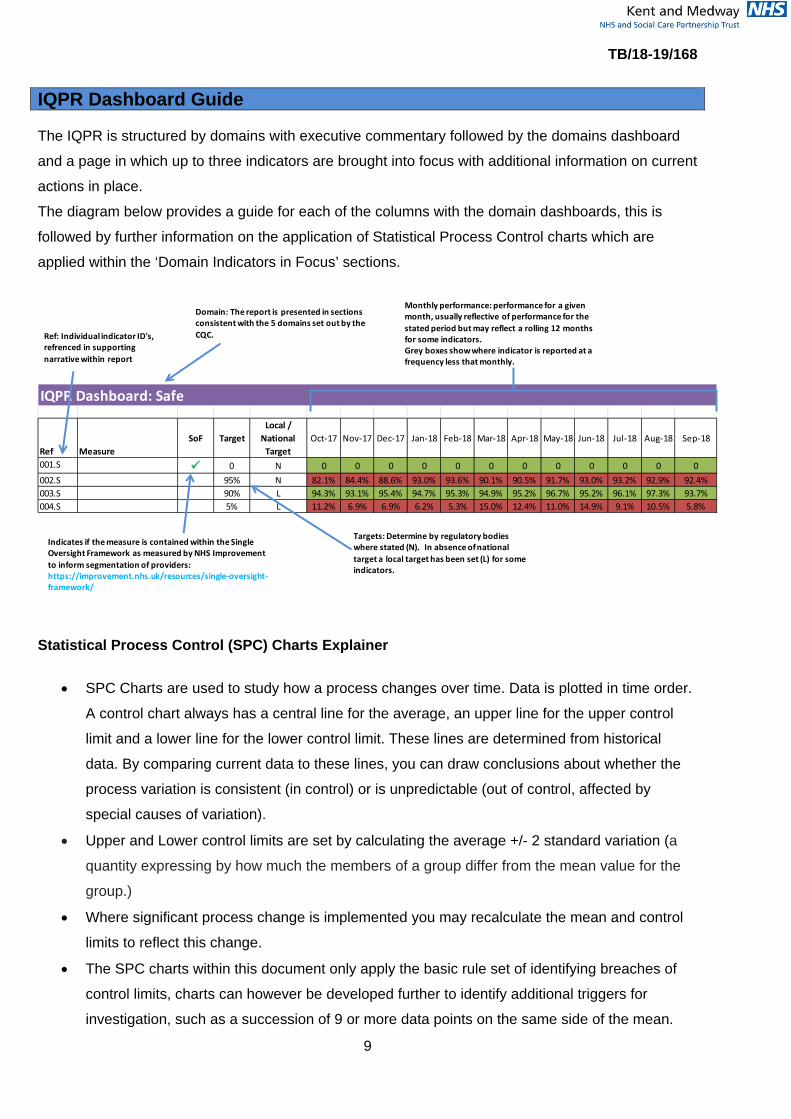
IQPR Dashboard Guide The IQPR is structured by domains with executive commentary followed by the domains dashboard
and a page in which up to three indicators are brought into focus with additional information on current
actions in place.
The diagram below provides a guide for each of the columns with the domain dashboards, this is
followed by further information on the application of Statistical Process Control charts which are
applied within the ‘Domain Indicators in Focus’ sections.
Statistical Process Control (SPC) Charts Explainer
• SPC Charts are used to study how a process changes over time. Data is plotted in time order.
A control chart always has a central line for the average, an upper line for the upper control
limit and a lower line for the lower control limit. These lines are determined from historical
data. By comparing current data to these lines, you can draw conclusions about whether the
process variation is consistent (in control) or is unpredictable (out of control, affected by
special causes of variation).
• Upper and Lower control limits are set by calculating the average +/- 2 standard variation (a
quantity expressing by how much the members of a group differ from the mean value for the
group.)
• Where significant process change is implemented you may recalculate the mean and control
limits to reflect this change.
• The SPC charts within this document only apply the basic rule set of identifying breaches of
control limits, charts can however be developed further to identify additional triggers for
investigation, such as a succession of 9 or more data points on the same side of the mean.
IQPR Dashboard: Safe
Ref MeasureSoF Target
Local / National
TargetOct-17 Nov-17 Dec-17 Jan-18 Feb-18 Mar-18 Apr-18 May-18 Jun-18 Jul-18 Aug-18 Sep-18
001.S 0 N 0 0 0 0 0 0 0 0 0 0 0 0002.S 95% N 82.1% 84.4% 88.6% 93.0% 93.6% 90.1% 90.5% 91.7% 93.0% 93.2% 92.9% 92.4%003.S 90% L 94.3% 93.1% 95.4% 94.7% 95.3% 94.9% 95.2% 96.7% 95.2% 96.1% 97.3% 93.7%004.S 5% L 11.2% 6.9% 6.9% 6.2% 5.3% 15.0% 12.4% 11.0% 14.9% 9.1% 10.5% 5.8%
Indicates if the measure is contained within the SingleOversight Framework as measured by NHS Improvement to inform segmentation of providers: https://improvement.nhs.uk/resources/single-oversight-framework/
Targets: Determine by regulatory bodies where stated (N). In absence of national target a local target has been set (L) for some indicators.
Domain: The report is presented in sections consistent with the 5 domains set out by the CQC.
Monthly performance: performance for a given month, usually reflective of performance for the stated period but may reflect a rolling 12 months for some indicators.Grey boxes show where indicator is reported at a frequency less that monthly.
Ref: Individual indicator ID's, refrenced in supporting narrative within report
TB/18-19/168
10
Trust IQPR by CQC Domains, Trust Strategic Objectives & Board Assurance Framework CQC Domain Safe Trust Strategic Objective & Board Assurance Framework
• Consistently deliver an outstanding quality of care
Executive Lead(s): Executive Director of Nursing & Quality Lead Executive Committee: Quality Committee
Executive Commentary
There are four key performance areas to draw the Board’s attention:
• Annual CPA reviews
• Serious Incidents
• Number of reported deaths incidents
• AWOLs
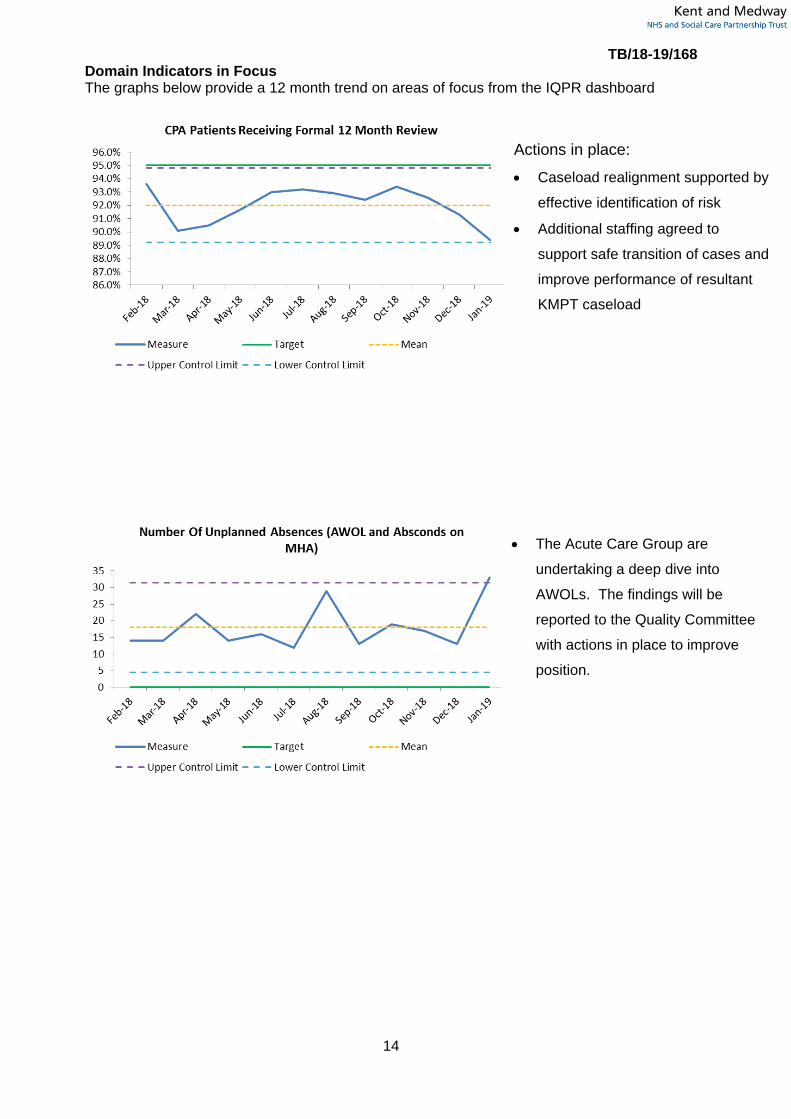
CPA Patients Receiving Formal 12 Month Review (002.S)
January saw a reduction in performance by 1.9% resulting in 89.4% against a target of 95%, the
lowest position since April. This was largely a result of a reduction of 2.3% in CRCG with CMHT’s the
biggest contributing factor to the care group reduction.
The Trust Risk Register and the Board Assurance Framework fully reflect the risk and the anticipated
decline in CMHT operational performance as a result of the KMPT and KCC transformation. The most
recent transition work has involved caseloads realignment to health or social care professionals and
sequential handover of care to relevant lead professionals. The transition has had an impact on our
capacity to conduct annual CPA reviews. To address this performance issue, teams are reviewing
and resetting their performance trajectories, actively implementing the agreed mitigating actions. In
addition, administrative staff are leading on scheduling and bringing forward reviews. Managers have
temporarily increased staffing to address the capacity gaps and are reviewing all patients to ensure
they are on the appropriate CPA pathway that is reflective of their needs.
Further action taken to mitigate risks, has been a review and relaunch of the CPA policy to ensure
practice is focused on those patients with complex and high care needs. Additional guidance is being
produced to support clinicians with evidencing care in health records for those patients not subject to
CPA. Teams that had higher ratios of social care than health staff, coupled with existing vacancies
such as in Maidstone, South West Kent and South Kent Coast CMHTs have experienced the greatest
impact. The Chief Operating Officer and her team are also considering centralising some locality
CMHT functions in order to pull together a critical mass of staff which will increase capacity to
respond to current activity. It is anticipated that performance will start to improve in the months ahead,
TB/18-19/168
11
following implementation of the above actions. Assurance has been provided that all patients subject
to CPA are being seen and offered interventions in spite of a delay in the formal annual review.
Number of unplanned absences, AWOLs and absconds on MHA (005.S)
There was an increase in the AWOLs in January 2019, 33 compared to 13 in December and a annual
average of 17. The increase has been largely from Younger Adult Acute wards. This reflects the
complexity of the case mix in on those wards in January e.g. one patient was responsible for 6
incidents and is now being nursed in a PICU while four patients were involved in 13 incidents. All the
patients who went AWOL returned unharmed to the ward. The ward multidisciplinary teams would
always endeavour to provide the least restrictive care which may involve unescorted, escorted leave
and care on open acute wards. The AWOL types are mainly people not returning from leave at
agreed time, running away during periods of escorted leave and a small number of patients pushing
past staff or visitors on acute wards. As the number of AWOLs has significantly increased in January,
the Acute Care group are undertaking a deep dive into AWOLs and a report will be provided to the
Quality Committee on the actions taken to improve this safety measure. Serious Incidents Declared To STEIS (006.S) January saw an increase in externally reported Serious Incidents, 13 compared to 5 in December.
This is not necessarily when the incident occurred but rather when KMPT became aware of it. There
is no time frame set for reporting SIs within the current National Framework, each incident is
considered on its own merit and reported at any time if there is evidence of care or service delivery
issues. Some incidents included in the report go back to July 2018. Consistent with most months, the
majority of the SIs are related to unexpected deaths of people who had been in contact with CMHTs.
Of note this month, are two SIs related to Information Governance, in addition to a safeguarding and
serious self harm incident. The IG incidents have already been fully investigated, learning shared and
actions taken to reduce likelihood of reoccurrence. There are no teams that are seen as outliers, the
incidents are evenly spread across the teams. All the incidents will be subject to a full Root Cause
Analysis investigation, with any identified learning shared across the teams and Trusts as indicated.
All Deaths Reported On Datix And Suspected Suicide (010.S)
As a result of undertaking a data cleanse exercise for the past ten months there continues to be
fluctuation on numbers reported and there was a significant increase in January to 471 compared to
191 in December. This is due to conclude in March 2019. This was in line with implementing our
improvements in reporting of deaths following the March (2017) National Quality Board’s Learning
from deaths report. The work has involved reconciling mortality data on RiO with Datix incidents. As
staff review RiO records, they may notice people who have been in contact at some point with the
Trust and marked as deceased on the national spine. When this happens, a Datix alert is raised and
each death incident is reviewed to ensure that there were no care or service delivery issues leading
TB/18-19/168
12
up to the last contact. These reviews are conducted as part of the three times a week Mortality
Review Panels. Approximately a quarter of the January incidents were from data cleanse. The vast
majority of the remaining incidents are predominantly older people in facilities such as nursing or
residential homes, acute hospitals, hospices that may be on end of life pathway and had been
discharged by the Trust for some time.
To further understand the themes of the deaths incidents reported and to inform improvement work,
Structured Judgement Review (SJR) training was provided to a group of patient safety leads and
senior medical staff on 13th February 2019. The training delivered by the Improvement Academy
involves a review of case records, considers the standard of care provided in various phases and
requires the reviewer to make judgements on whether the care was excellent, good, adequate, poor
or very poor. The purpose of undertaking these reviews is to learn and they are considered to be a
Quality Improvement Tool. These reviews are now endorsed by the Royal College of Psychiatrists. As
part of the trust’s learning from deaths agenda, the intention is to begin to use this methodology to
review all deaths incidents. It is hoped that by doing this, it will provide themes which can be taken
forward for quality improvement initiatives. Further scoping is required and will be undertaken to
inform implementation. The Board will be updated on further developments and progress through the
quarterly mortality reports.
Restrictive Practice (011.S-0.13S)
There has been a significant increase in the number of restrictive practice incidents which could be as
a result of more accurate reporting following clinical visits to discuss importance of reporting incidents
across older adults and some acute wards and also as a result of preparation for the new reporting
definitions that are due to come into effect April 2019. The majority of the incidents in older adults are
very low level holds to support personal care situations. There were 86 reported restraint incidents in
Older adults services.
A number of wards have been identified as having a significant impact on the overall figures.
Chartwell Ward (Restraints=23, Seclusions=10, Prone=3.) saw a dramatic rise in the number of
recorded restraints, from 6 in December 2018 to 23 in January 2019. Over half of the restraints and
prone incidents are attributable to one patient who was admitted to the ward early January from a
PICU unit. The ward have received support from the Promoting Safe Services team who provided
advice and guidance in addition to Positive Behaviour Support (PBS) input. Further PBS study days
have been organised with the manager on the teams away day to train staff in PBS as well as to
ensure continued accurate reporting. Foxglove and Fern wards similarly have experienced increases
with a small number of patients attributable for a significant number of the incidents recorded. The
Promoting Safer Services group will continue to review and scrutinise data in relation to restrictive
practice and to offer additional support and guidance to teams on the management of behaviour that
challenges.
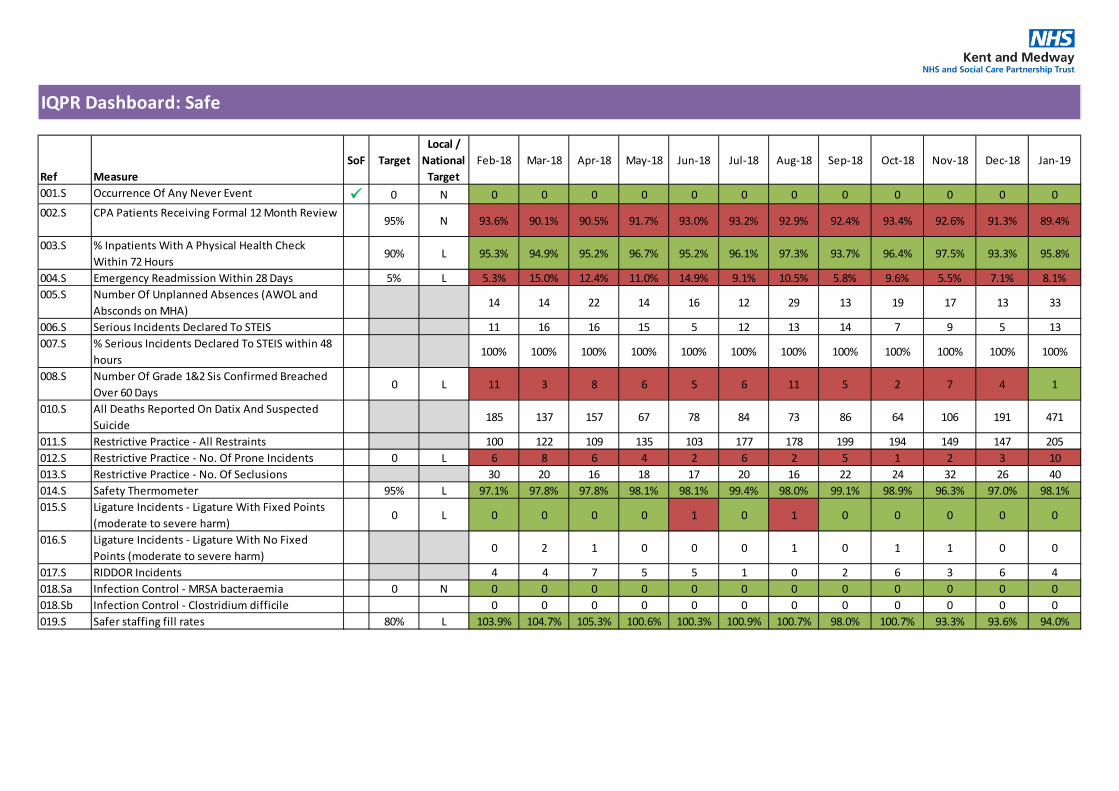
IQPR Dashboard: Safe
Ref MeasureSoF Target
Local / National
TargetFeb-18 Mar-18 Apr-18 May-18 Jun-18 Jul-18 Aug-18 Sep-18 Oct-18 Nov-18 Dec-18 Jan-19
001.S Occurrence Of Any Never Event 0 N 0 0 0 0 0 0 0 0 0 0 0 0002.S CPA Patients Receiving Formal 12 Month Review
95% N 93.6% 90.1% 90.5% 91.7% 93.0% 93.2% 92.9% 92.4% 93.4% 92.6% 91.3% 89.4%
003.S % Inpatients With A Physical Health Check Within 72 Hours
90% L 95.3% 94.9% 95.2% 96.7% 95.2% 96.1% 97.3% 93.7% 96.4% 97.5% 93.3% 95.8%
004.S Emergency Readmission Within 28 Days 5% L 5.3% 15.0% 12.4% 11.0% 14.9% 9.1% 10.5% 5.8% 9.6% 5.5% 7.1% 8.1%005.S Number Of Unplanned Absences (AWOL and
Absconds on MHA)14 14 22 14 16 12 29 13 19 17 13 33
006.S Serious Incidents Declared To STEIS 11 16 16 15 5 12 13 14 7 9 5 13007.S % Serious Incidents Declared To STEIS within 48
hours100% 100% 100% 100% 100% 100% 100% 100% 100% 100% 100% 100%
008.S Number Of Grade 1&2 Sis Confirmed Breached Over 60 Days
0 L 11 3 8 6 5 6 11 5 2 7 4 1
010.S All Deaths Reported On Datix And Suspected Suicide
185 137 157 67 78 84 73 86 64 106 191 471
011.S Restrictive Practice - All Restraints 100 122 109 135 103 177 178 199 194 149 147 205012.S Restrictive Practice - No. Of Prone Incidents 0 L 6 8 6 4 2 6 2 5 1 2 3 10013.S Restrictive Practice - No. Of Seclusions 30 20 16 18 17 20 16 22 24 32 26 40014.S Safety Thermometer 95% L 97.1% 97.8% 97.8% 98.1% 98.1% 99.4% 98.0% 99.1% 98.9% 96.3% 97.0% 98.1%015.S Ligature Incidents - Ligature With Fixed Points
(moderate to severe harm)0 L 0 0 0 0 1 0 1 0 0 0 0 0
016.S Ligature Incidents - Ligature With No Fixed Points (moderate to severe harm)
0 2 1 0 0 0 1 0 1 1 0 0
017.S RIDDOR Incidents 4 4 7 5 5 1 0 2 6 3 6 4018.Sa Infection Control - MRSA bacteraemia 0 N 0 0 0 0 0 0 0 0 0 0 0 0018.Sb Infection Control - Clostridium difficile 0 0 0 0 0 0 0 0 0 0 0 0019.S Safer staffing fill rates 80% L 103.9% 104.7% 105.3% 100.6% 100.3% 100.9% 100.7% 98.0% 100.7% 93.3% 93.6% 94.0%
TB/18-19/168
14
Domain Indicators in Focus The graphs below provide a 12 month trend on areas of focus from the IQPR dashboard
• The Acute Care Group are
undertaking a deep dive into
AWOLs. The findings will be
reported to the Quality Committee
with actions in place to improve
position.
Actions in place:
• Caseload realignment supported by
effective identification of risk
• Additional staffing agreed to
support safe transition of cases and
improve performance of resultant
KMPT caseload
TB/18-19/168
15
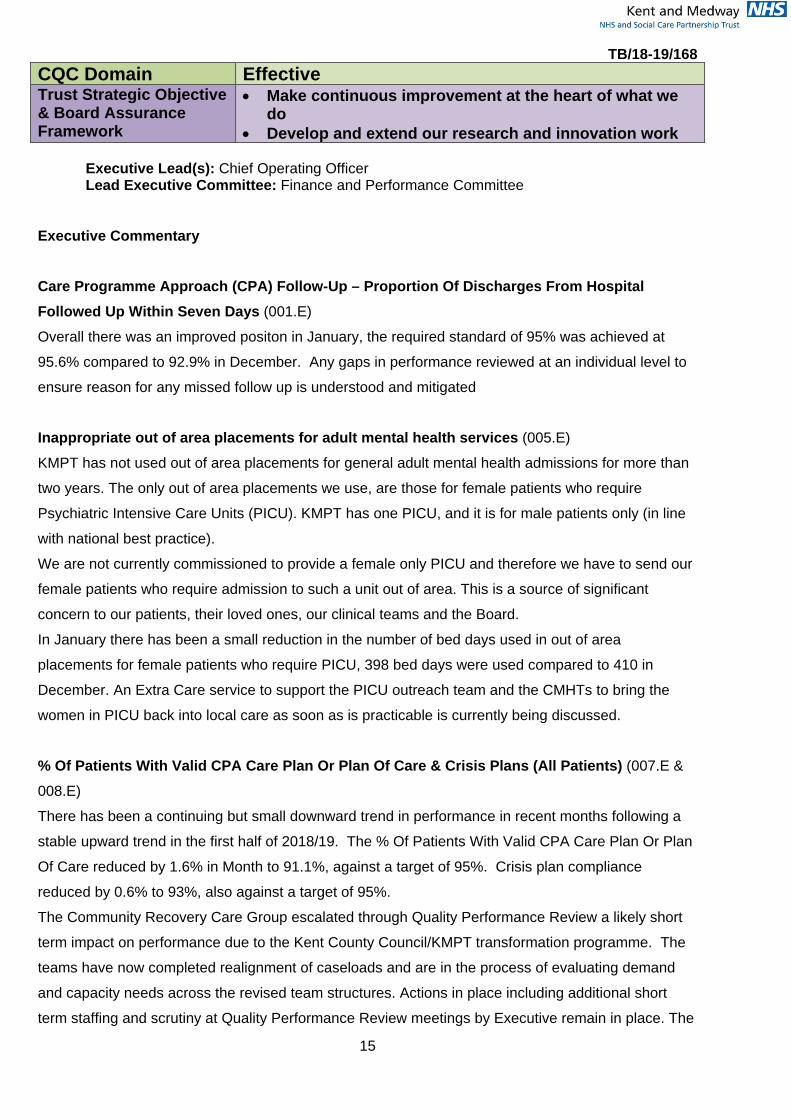
CQC Domain Effective Trust Strategic Objective & Board Assurance Framework
• Make continuous improvement at the heart of what we do
• Develop and extend our research and innovation work Executive Lead(s): Chief Operating Officer Lead Executive Committee: Finance and Performance Committee
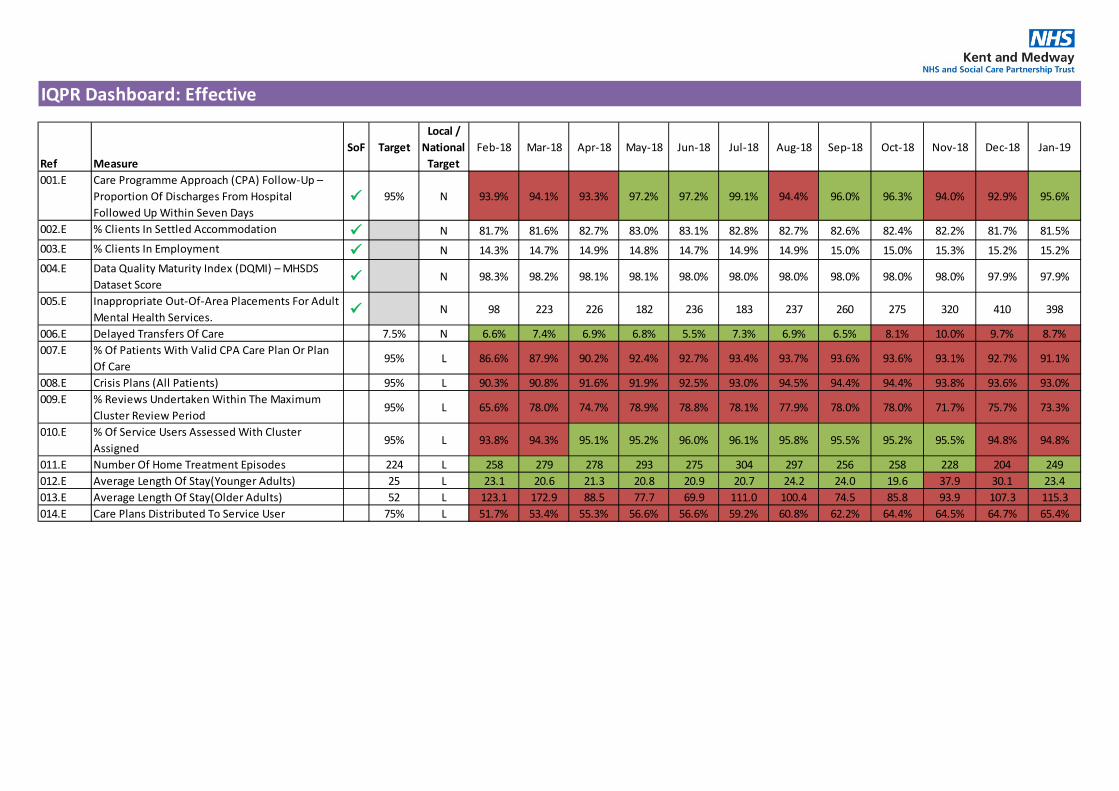
Executive Commentary Care Programme Approach (CPA) Follow-Up – Proportion Of Discharges From Hospital Followed Up Within Seven Days (001.E)
Overall there was an improved positon in January, the required standard of 95% was achieved at
95.6% compared to 92.9% in December. Any gaps in performance reviewed at an individual level to
ensure reason for any missed follow up is understood and mitigated
Inappropriate out of area placements for adult mental health services (005.E) KMPT has not used out of area placements for general adult mental health admissions for more than
two years. The only out of area placements we use, are those for female patients who require
Psychiatric Intensive Care Units (PICU). KMPT has one PICU, and it is for male patients only (in line
with national best practice).
We are not currently commissioned to provide a female only PICU and therefore we have to send our
female patients who require admission to such a unit out of area. This is a source of significant
concern to our patients, their loved ones, our clinical teams and the Board.
In January there has been a small reduction in the number of bed days used in out of area
placements for female patients who require PICU, 398 bed days were used compared to 410 in
December. An Extra Care service to support the PICU outreach team and the CMHTs to bring the
women in PICU back into local care as soon as is practicable is currently being discussed.
% Of Patients With Valid CPA Care Plan Or Plan Of Care & Crisis Plans (All Patients) (007.E &
008.E) There has been a continuing but small downward trend in performance in recent months following a
stable upward trend in the first half of 2018/19. The % Of Patients With Valid CPA Care Plan Or Plan
Of Care reduced by 1.6% in Month to 91.1%, against a target of 95%. Crisis plan compliance
reduced by 0.6% to 93%, also against a target of 95%.
The Community Recovery Care Group escalated through Quality Performance Review a likely short
term impact on performance due to the Kent County Council/KMPT transformation programme. The
teams have now completed realignment of caseloads and are in the process of evaluating demand
and capacity needs across the revised team structures. Actions in place including additional short
term staffing and scrutiny at Quality Performance Review meetings by Executive remain in place. The
TB/18-19/168
16
CRCG Associate Medical Director has recommended for those persons not subject to CPA we
introduce streamlined recording processes which will release clinical time. CLIQ checks evidence
overall quality standards are being maintained.
Average Length of Stay (Older Adults) (013.E) Older persons ALoS has increased from 107.3 in December to 115.3 in January (over double the
target) and is of significant concern. This is an area of focus for the executive and a detailed plan to
address this, and reduce the number of patients who are stranded with us, is being led by senior
clinicians. A programme to reduce the ALoS for Older Adults is in place, using a Rapid process
improvement workshop, is due to commence in March 2019.
IQPR Dashboard: Effective
Ref MeasureSoF Target
Local / National
TargetFeb-18 Mar-18 Apr-18 May-18 Jun-18 Jul-18 Aug-18 Sep-18 Oct-18 Nov-18 Dec-18 Jan-19
001.E Care Programme Approach (CPA) Follow-Up – Proportion Of Discharges From Hospital Followed Up Within Seven Days
95% N 93.9% 94.1% 93.3% 97.2% 97.2% 99.1% 94.4% 96.0% 96.3% 94.0% 92.9% 95.6%
002.E % Clients In Settled Accommodation N 81.7% 81.6% 82.7% 83.0% 83.1% 82.8% 82.7% 82.6% 82.4% 82.2% 81.7% 81.5%003.E % Clients In Employment N 14.3% 14.7% 14.9% 14.8% 14.7% 14.9% 14.9% 15.0% 15.0% 15.3% 15.2% 15.2%004.E Data Quality Maturity Index (DQMI) – MHSDS
Dataset Score N 98.3% 98.2% 98.1% 98.1% 98.0% 98.0% 98.0% 98.0% 98.0% 98.0% 97.9% 97.9%
005.E Inappropriate Out-Of-Area Placements For Adult Mental Health Services. N 98 223 226 182 236 183 237 260 275 320 410 398
006.E Delayed Transfers Of Care 7.5% N 6.6% 7.4% 6.9% 6.8% 5.5% 7.3% 6.9% 6.5% 8.1% 10.0% 9.7% 8.7%007.E % Of Patients With Valid CPA Care Plan Or Plan
Of Care95% L 86.6% 87.9% 90.2% 92.4% 92.7% 93.4% 93.7% 93.6% 93.6% 93.1% 92.7% 91.1%
008.E Crisis Plans (All Patients) 95% L 90.3% 90.8% 91.6% 91.9% 92.5% 93.0% 94.5% 94.4% 94.4% 93.8% 93.6% 93.0%009.E % Reviews Undertaken Within The Maximum
Cluster Review Period95% L 65.6% 78.0% 74.7% 78.9% 78.8% 78.1% 77.9% 78.0% 78.0% 71.7% 75.7% 73.3%
010.E % Of Service Users Assessed With Cluster Assigned
95% L 93.8% 94.3% 95.1% 95.2% 96.0% 96.1% 95.8% 95.5% 95.2% 95.5% 94.8% 94.8%
011.E Number Of Home Treatment Episodes 224 L 258 279 278 293 275 304 297 256 258 228 204 249012.E Average Length Of Stay(Younger Adults) 25 L 23.1 20.6 21.3 20.8 20.9 20.7 24.2 24.0 19.6 37.9 30.1 23.4013.E Average Length Of Stay(Older Adults) 52 L 123.1 172.9 88.5 77.7 69.9 111.0 100.4 74.5 85.8 93.9 107.3 115.3014.E Care Plans Distributed To Service User 75% L 51.7% 53.4% 55.3% 56.6% 56.6% 59.2% 60.8% 62.2% 64.4% 64.5% 64.7% 65.4%

TB/18-19/168
18
Domain Indicators in Focus The graphs below provide a 12 month trend on areas of focus from the IQPR dashboard
• Extra Care community response
to be implemented in 2019 to
reduce number of women with a
primary diagnosis of Personality
Disorder admitted to PICU
• Ongoing discussions with CCGs
to achieve zero inappropriate out
of area placements by 2021
• All information triangulated through quality performance reviews to maintain Executive scrutiny, ascertain areas of concern and ensure key issues are actioned planned
• The Community Recovery Care
Group leadership required to ensure all persons on CPA remain prioritised for review of care and risk
• The Community Recovery Care
Groups have additional staffing agreed for short term support to ensure no significant decline in overall performance
TB/18-19/168
19
CQC Domain Well led – Workforce Trust Strategic Objective & Board Assurance Framework
• Recruit, retain and develop the best staff making KMPT a great place to work
Executive Lead(s): Director of Workforce and Communications Lead Executive Committee: Workforce Committee
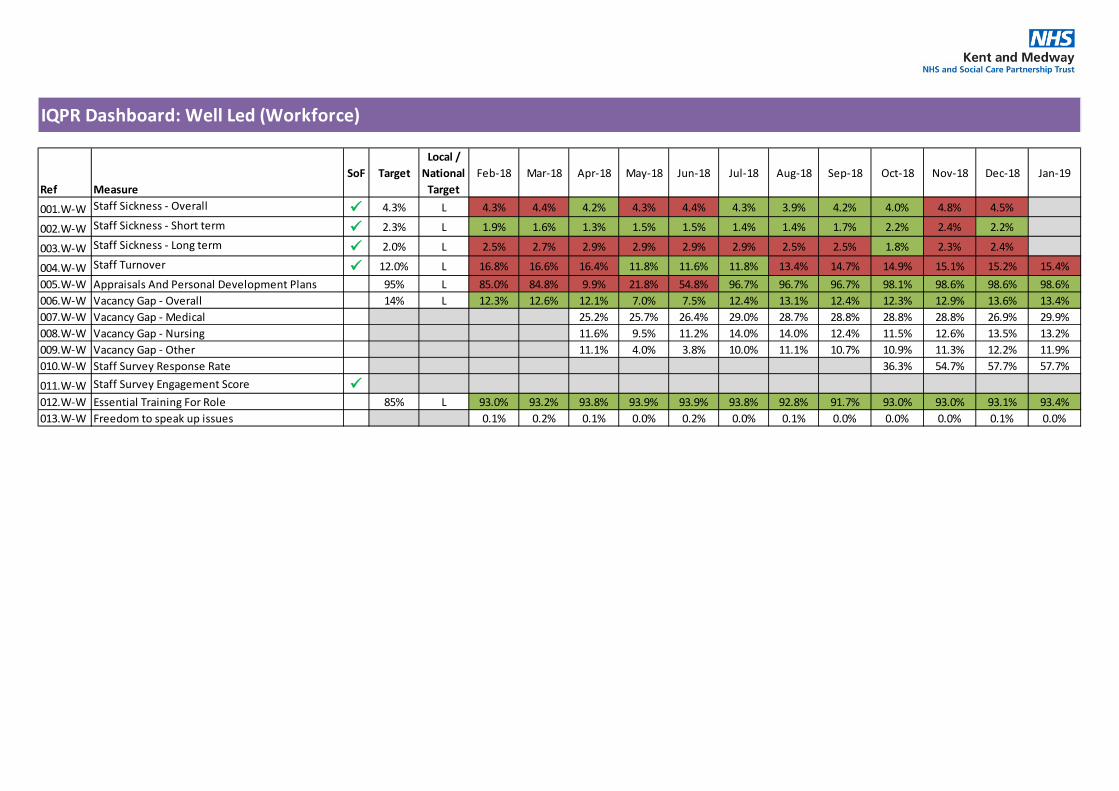
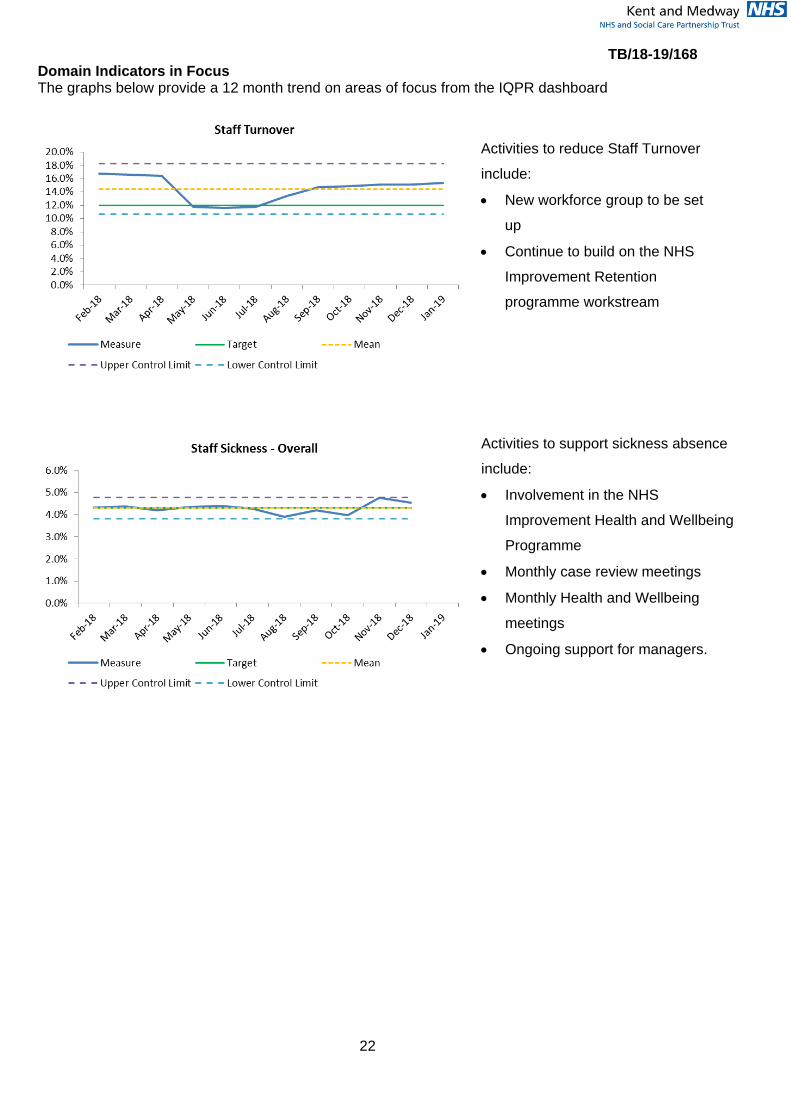
Executive Commentary Staff Sickness – Overall (001.W-W) Sickness for the month is running at 4.53%, against an annual target of 4.3%. There is a decrease
overall of 0.33% driven by a decrease in short term sickness.
Activities to support sickness absence reductions are; being part of NHS Improvement Health and
Wellbeing Programme and accessing their best practice guidelines, monthly case review meetings,
monthly Health and Wellbeing meetings, preventative work and contact within first 7 days, working
with CCG on a ‘Manage Your Mind’ workshop approach. We are also reviewing the sickness
absence policy to a keeping people at work policy with more emphasis on preventing people going off
sick.
Staff Turnover (004.W-W) Staff turnover is 15.4%, a further small increase since last month and remains above the annual
target of 12%. Care Group recruitment and retention plans are in place for key hotspot areas which
are regularly reviewed. The first meeting of the new Workforce Group ‘Brilliant People’ is meeting in
February and this group will support this work. This group will build on the NHS Improvement
Retention programme work stream. Through the delivery of retirement workshops we are supporting
staff approaching retirement to provide information for options to remain at KMPT. The highest
number of unplanned leavers is due to opportunities/development in other organisations/higher pay or
band. We continue to work on developing career pathways and have developed specific workbooks
to support our staff.
Appraisals and Personal development Plans (005. W-W)
Appraisals remain at 98.6% and Care Groups continue to review non-compliant to be 100%. Older
Adults have achieved the 100% compliance rate. All outstanding areas have been escalated to the
appropriate Executive.
Vacancy Gap (006–009.W-W)
TB/18-19/168
20
There is a small decrease of 0.2% in vacancy rate from December 2018 to January 2019. Medical
staffing has shown an increase in rate whereas nursing has achieved a decrease of 0.3%. In total,
there are 58.1 WTE Band 5 and 6 nurses in the recruitment pipeline.
To support the recruitment of medical staff we have advertised a programme for specialty doctors to
progress through portfolio to consultant roles (Certificate of Eligibility for Specialist Registration
Fellowship). We received 28 applications and interviews were held at the end of January, with 4
offers made and a 2nd round of interviews planned.
We are exploring how a neighbouring Trust has used an ‘Academy’ model to recruit and train Nursing
Associates and Registered Nurses, the STP are also looking at this model.
Staff survey - Response rate and engagement score (010 & 011W-W)
Our published response rate is 57.7%. Due to unforeseen circumstances our leavers have not been
removed from the eligible sample. We have calculated this figure and as a result of this the response
rate will increase to 59.5%. This compares with the highest performing mental health trust at 60.5%.
To achieve 60.6% we would have only needed another 34 people to complete the survey.
This compares favourably to the response rate in 2017 which was 41.7%, an increase of 16%
Essential Training for Role (012. W-W)
The compliance remains at 93%, as last month, against a target of 85%. The non-compliant areas
have reduced in number and are the following subjects:
Handcuff/softcuff training – there are training courses available for forensic staff in this and managers
are aware of these as well as the staff who are not compliant.
M&H is being addressed with extra training sessions being done for required link workers.
Safeguarding –This is under close discussion between the L&D and Safeguarding team and we are
working to arrange extra sessions.
The subjects which have shown the most increase in compliant rates in the last year are:
- CPR and AED: Up 17%
- Immediate Life Support: Up 16%
- Fire Safety (Inpatient Staff): Up 14%
- Data Security: Up 6%
- Mental Health Act: Up 5%
Freedom to Speak Up (013.W-W)
3 new Freedom to Speak Up issues reported in December 2018 and January 2019 and 14 Green
Buttons were raised. All issues are being addressed and individuals supported accordingly. We have
successfully recruited to the FTSU guardian role, anticipated mid-March 2019 start date.
IQPR Dashboard: Well Led (Workforce)
Ref MeasureSoF Target
Local / National
TargetFeb-18 Mar-18 Apr-18 May-18 Jun-18 Jul-18 Aug-18 Sep-18 Oct-18 Nov-18 Dec-18 Jan-19
001.W-W Staff Sickness - Overall 4.3% L 4.3% 4.4% 4.2% 4.3% 4.4% 4.3% 3.9% 4.2% 4.0% 4.8% 4.5%
002.W-W Staff Sickness - Short term 2.3% L 1.9% 1.6% 1.3% 1.5% 1.5% 1.4% 1.4% 1.7% 2.2% 2.4% 2.2%
003.W-W Staff Sickness - Long term 2.0% L 2.5% 2.7% 2.9% 2.9% 2.9% 2.9% 2.5% 2.5% 1.8% 2.3% 2.4%
004.W-W Staff Turnover 12.0% L 16.8% 16.6% 16.4% 11.8% 11.6% 11.8% 13.4% 14.7% 14.9% 15.1% 15.2% 15.4%005.W-W Appraisals And Personal Development Plans 95% L 85.0% 84.8% 9.9% 21.8% 54.8% 96.7% 96.7% 96.7% 98.1% 98.6% 98.6% 98.6%006.W-W Vacancy Gap - Overall 14% L 12.3% 12.6% 12.1% 7.0% 7.5% 12.4% 13.1% 12.4% 12.3% 12.9% 13.6% 13.4%007.W-W Vacancy Gap - Medical 25.2% 25.7% 26.4% 29.0% 28.7% 28.8% 28.8% 28.8% 26.9% 29.9%008.W-W Vacancy Gap - Nursing 11.6% 9.5% 11.2% 14.0% 14.0% 12.4% 11.5% 12.6% 13.5% 13.2%009.W-W Vacancy Gap - Other 11.1% 4.0% 3.8% 10.0% 11.1% 10.7% 10.9% 11.3% 12.2% 11.9%010.W-W Staff Survey Response Rate 36.3% 54.7% 57.7% 57.7%
011.W-W Staff Survey Engagement Score 012.W-W Essential Training For Role 85% L 93.0% 93.2% 93.8% 93.9% 93.9% 93.8% 92.8% 91.7% 93.0% 93.0% 93.1% 93.4%013.W-W Freedom to speak up issues 0.1% 0.2% 0.1% 0.0% 0.2% 0.0% 0.1% 0.0% 0.0% 0.0% 0.1% 0.0%
TB/18-19/168
22
Domain Indicators in Focus The graphs below provide a 12 month trend on areas of focus from the IQPR dashboard
Activities to reduce Staff Turnover
include:
• New workforce group to be set
up
• Continue to build on the NHS
Improvement Retention
programme workstream
Activities to support sickness absence
include:
• Involvement in the NHS
Improvement Health and Wellbeing
Programme
• Monthly case review meetings
• Monthly Health and Wellbeing
meetings
• Ongoing support for managers.

TB/18-19/168
23
CQC Domain Well led – Finance Trust Strategic Objective & Board Assurance Framework
• Deliver financial balance and organisational sustainability
• Develop our core business and enter new markets through increased partnership working
Executive Lead(s): Executive Director of Finance Lead Executive Committee: Finance and Performance Committee
Executive Commentary
Please see the financial performance report included as a separate agenda item for the detailed
financial performance. The below commentary summarises the key points as at month 10.
The Trust financial rating for use of resources is an annual target of a 3. The YTD actual is currently a
3. The Trust has scored a rating of a 4 in the following areas; capital service capacity and I&E margin.
The agency spend performance has worsened this month, where the Trust is rated a 2. Following the
sale of a property in December, liquidity is rated a 1. This is due to cash in excess of plan.
Income And Expenditure Margin YTD (%) (003.W-F)
The Trust is reporting a Year to Date (YTD) deficit of £2.2m which is in line with plan. Included within
the deficit is a contingency of £1.6m. The Trust are currently forecasting to deliver the year end
control total of £1.8m, this however is not without risk. To deliver the control total the Trust has been
deploying a number of non-recurrent benefits to support the financial position in the latter two quarters
of the financial year. More of this has been used in month 10 as identified within the Trust forecast.
The YTD financial performance is rated a 3 for Use of Financial Resources under the SOF, with the
annual plan rating a 3.
The key factors impacting on the YTD position include:
• Agency spend, which is £0.2m above cap YTD
• Non recurrent vacancies, which are mitigating the agency overspend
• Pay award costs exceeding income allocation (£430k full year effect)
• Additional income from NHS England for Forensic Community team (costs already included in
the baseline which were previously unfunded)
Agency Spend (007.W-F-010.W-F)
The Trust has been set an agency cap of £6.1m for the financial year. The YTD cap is £5.2m and the
Trust is currently reporting spend of £5.4m, £0.2m above the cap. Spend has not reduced this month
and is marginally above cap, which puts added pressure into the final two months of the year.
Particular pressure is coming from medical vacancies, which have increased again in January and are
being covered using agency staff to maintain safe and effective care.
TB/18-19/168
24
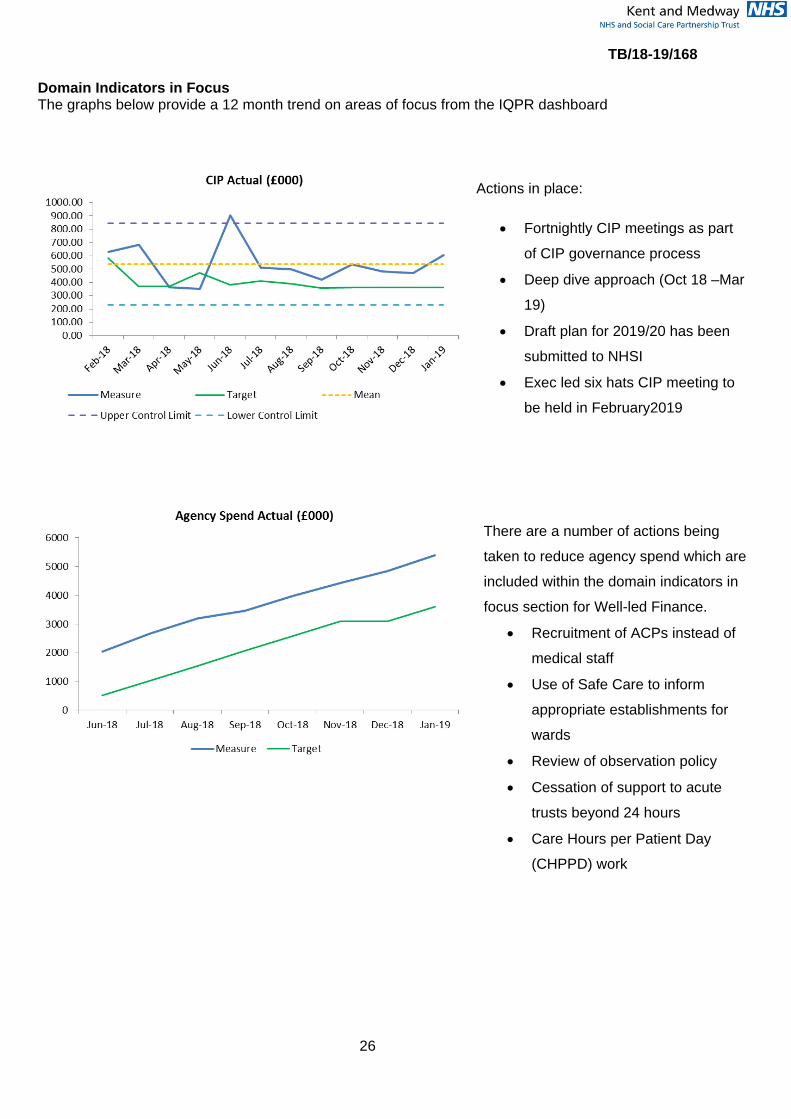
CIPs (011.W-F-013.W-F)
The Trust has a CIP plan of £6.7m this year (4%). In order to deliver the annual deficit of £1.8m the
full CIP plan will need to be achieved. In addition to this the Trust needs to deliver a further £4.6m of
efficiencies through operational productivity to tackle the underlying deficit. Therefore a total of
£11.4m efficiencies are required.
The Trust has delivered savings of £5.2m YTD, which is on plan. There is an ongoing focus on
identifying further schemes as £3m of plans this year are non-recurrent, and will therefore place
pressure on next year’s financial position when these unwind. The current forecast for CIP delivery is
£6.1m against the annual target of £6.7m. Of the £4.6m operational productivity schemes, £1m is
forecast to deliver in 2018/19. This is in part due to delays in schemes being developed, such as Back
Office and Patient Pathways.
Long Term Financial Sustainability The finance team submitted the draft plan submission on 12th February to NHS Improvement. This
was based on the acceptance of the published control total of breakeven for KMPT in 2019/20, after
receipt of £5.9m of additional support funding. This is in line with the Trust’s financial strategy and
emphasises the importance of delivering recurrent efficiencies and improving patient pathways to
eliminate waste. The final plan will be submitted to Trust Board in March.
CIP plans for next year are underway, with a target of £6m required to deliver the control total. Of this,
£4m has been identified in schemes developed by Care Groups and Support Services. Detailed
sessions are being held in February and March to firm up plans and assess the robustness of
schemes before including in the final plan submission in April.
The Trust has an underlying deficit of c£7m per annum. Plans to reduce the deficit are being
addressed utilising the Deep Dive approach referenced in last month’s report and the Operational
Productivity programme.

IQPR Dashboard: Well Led (Finance)
Ref MeasureSoF Target
Local / National
TargetFeb-18 Mar-18 Apr-18 May-18 Jun-18 Jul-18 Aug-18 Sep-18 Oct-18 Nov-18 Dec-18 Jan-19
001.W-F Capital Service Capacity 1.1 N 1.2 1.4 0.6 0.6 0.4 0.5 0.5 0.5 0.8 1.0 1.1 1.2
002.W-F Liquidity (Days) -11.4 N -10.5 -8.2 -10.8 -5.4 -11.6 -13.5 -12.4 -13.4 -12.2 -12.7 1.0 1.0
003.W-F Income And Expenditure Margin YTD (%) -1.0% N -1.7% -0.7% -4.2% -4.1% -4.1% -4.1% -4.1% -4.0% -3.1% -2.5% -1.9% -1.4%004.W-F Planned Surplus/(Deficit) YTD (£000) (1,800) N (2,779) (2,834) (621) (1,211) (1,815) (2,437) (3,065) (3,561) (3,300) (2,909) (2,563) (2,166)
005.W-F Actual Surplus/(Deficit) YTD (£000) (2,717) (1,223) (621) (1,211) (1,815) (2,437) (3,064) (3,555) (3,298) (2,908) (2,561) (2,165)
006.W-F Distance From Financial Plan YTD (%) 0.0% N 0.00% 0.91% 0.00% 0.00% 0.00% 0.00% 0.00% -0.17% -0.04% 0.03% -0.08% -0.05%007.W-F Agency Cap YTD (£000) 6.1m N 6,383 6,951 515 1,030 1,545 2,060 2,575 3,090 3,605 4,129 4,644 5,159008.W-F Agency Spend Actual (£000) 6,325 6,924 702 1,454 2,046 2,660 3,193 3,448 3,971 4,416 4,830 5,380009.W-F Agency Variance from Cap (£000) (58) (27) 187 424 501 600 618 358 366 287 186 221010.W-F Agency Spend Against Cap YTD (%) 0.0% N -3.2% -2.8% 36.2% 41.1% 32.4% 29.1% 24.0% 11.6% 10.1% 7.0% 4.0% 4.5%
011.W-F CIP Plan (£000) 6.7m L 369 472 381 411 391 356 360 468 669 671 697 779012.W-F CIP Actual (£000) 630 682 365 350 904 512 500 419 537 482 470 604013.W-F CIP Variance (£000) (262) (210) (16) (61) 513 156 140 (48) (132) (189) (227) (175)
TB/18-19/168
26
Domain Indicators in Focus The graphs below provide a 12 month trend on areas of focus from the IQPR dashboard
Actions in place:
• Fortnightly CIP meetings as part
of CIP governance process
• Deep dive approach (Oct 18 –Mar
19)
• Draft plan for 2019/20 has been
submitted to NHSI
• Exec led six hats CIP meeting to
be held in February2019
There are a number of actions being
taken to reduce agency spend which are
included within the domain indicators in
focus section for Well-led Finance.
• Recruitment of ACPs instead of
medical staff
• Use of Safe Care to inform
appropriate establishments for
wards
• Review of observation policy
• Cessation of support to acute
trusts beyond 24 hours
• Care Hours per Patient Day
(CHPPD) work

TB/18-19/168
27
CQC Domain Caring Trust Strategic Objective & Board Assurance Framework
• Consistently deliver an outstanding quality of care
Executive Lead(s): Executive Director of Nursing & Quality Lead Executive Committee: Quality Committee
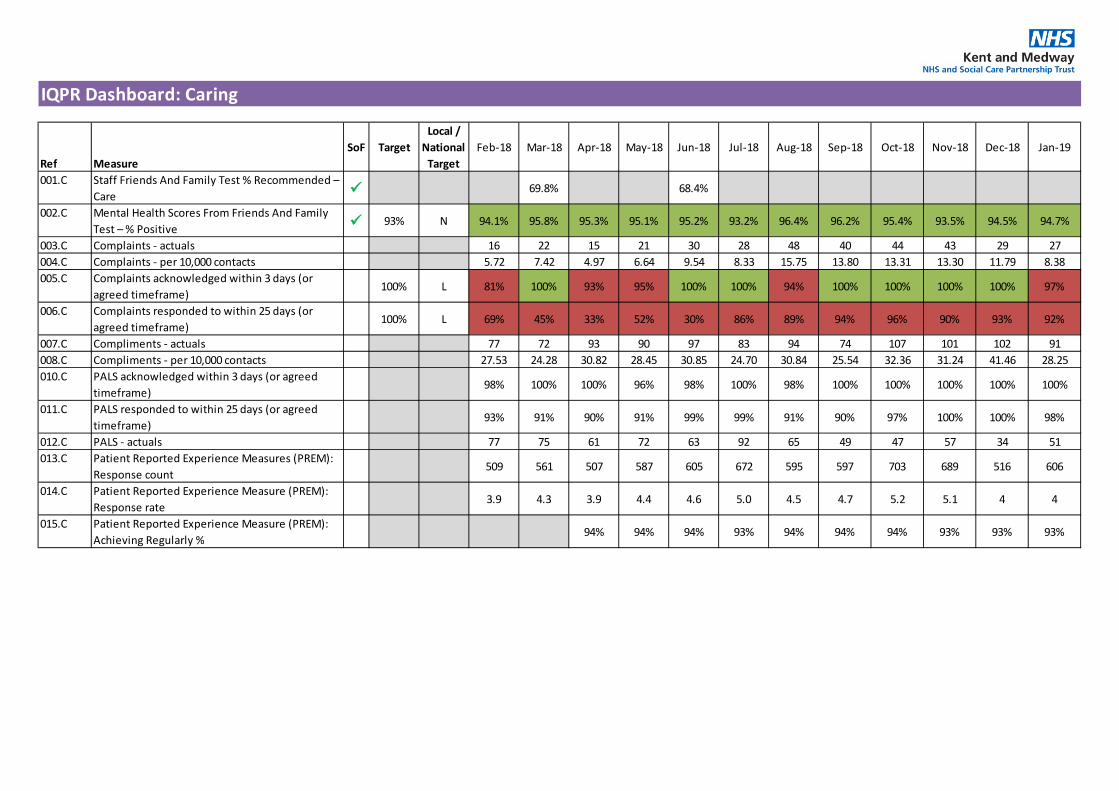
Executive Commentary Our performance in this area is mostly positive and reflects the observations from the Care Quality
Commission in their judgement of our services. The Patients, Friends and Family test continues to be
above the local target of 93% and also above national average. Similarly the feedback from PREM
remains positive and the overall responses increased in January, following a significant reduction
noted in December. Areas requiring further improvement on PREM include care planning and
involving families, friends and relatives in care plans. They will be considered for a Patient experience
Quality Account objective for 2019/2020. We will continue to work on encouraging responses as the
feedback is critical in providing assurance about people’s experiences.
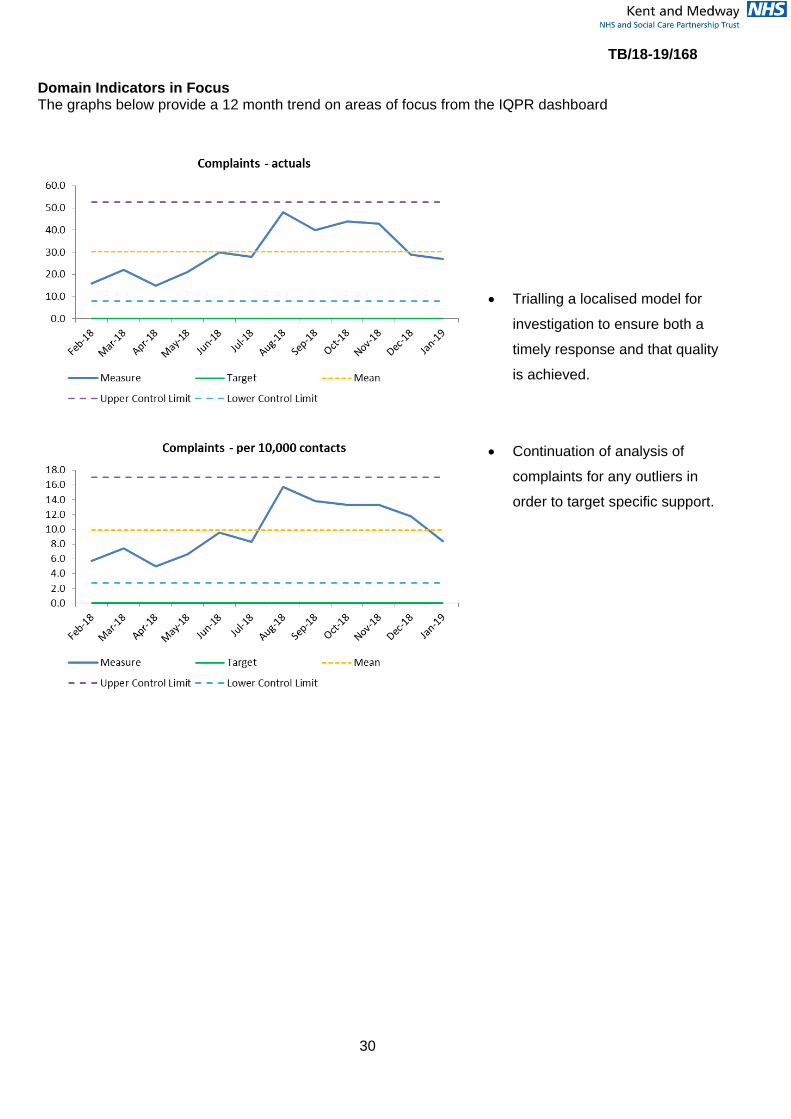
Complaints - per 10,000 contacts (004.C)
Following a record high of complaints reported in August 2018 (48), there has been a gradual decline
in complaints in the past six months to (27) in January. There is evidence that there is more proactive
and quick, local resolution through PALS which is contributing to a reduction in formal complaints. The
previous theme of difficulty in accessing services has significantly reduced over the last few months
as signalled in previous reports. The top theme continues to be “all aspects of care and treatment”
and learning from closed complaints indicated that additional work and monitoring is required in
respect of effectiveness of communication about community appointments. This will be overseen at
TWPCEG and Quality Performance Review meetings with Care groups.
Of the 39 closed complaints in January, 17 were not upheld, 8 were partially upheld and 12 were
upheld, the remaining two were out of time. The learning from these findings are shared with Care
Groups and associated changes monitored for improvement at relevant governance meetings.
Overall the Complaints and PALS team have been able to acknowledge all formal complaints within
three working days from September to December however January was an exception with 97%
achieved. This equates to 2 complaints acknowledged after the three days which was due to one
being dealt with under local resolution and therefore an opportunity missed to formally acknowledge
as per process.
Providing complaints responses within the agreed timeframe continue to be challenging, only 92%
was achieved in January. This is in part due to the complexity of the complaint and sometimes the
TB/18-19/168
28
quality of the response which may require further work before final sign off. The delays are necessary
in order to ensure we have fully responded to the specific concerns raised, in these cases, the
complainant is kept updated. Although the performance metric is not met, however the number of
reopened complaints or those referred to the PHSO has significantly reduced.
There are no teams that appear as outliers in respect of complaints and PALS.
The Complaints and PALS team will be trialling a localised model for investigation which will involve a
member from the central team taking over the investigations and responses for complaints and PALS
on behalf of the CMHT service manager. This should provide additional capacity as it relates to teams
that are also challenged by the KMPT/KCC transition. If this model works, it will be applied to team
bases which tend to have high numbers of complaints.
IQPR Dashboard: Caring
Ref MeasureSoF Target
Local / National
TargetFeb-18 Mar-18 Apr-18 May-18 Jun-18 Jul-18 Aug-18 Sep-18 Oct-18 Nov-18 Dec-18 Jan-19
001.C Staff Friends And Family Test % Recommended – Care 69.8% 68.4%
002.C Mental Health Scores From Friends And Family Test – % Positive 93% N 94.1% 95.8% 95.3% 95.1% 95.2% 93.2% 96.4% 96.2% 95.4% 93.5% 94.5% 94.7%
003.C Complaints - actuals 16 22 15 21 30 28 48 40 44 43 29 27004.C Complaints - per 10,000 contacts 5.72 7.42 4.97 6.64 9.54 8.33 15.75 13.80 13.31 13.30 11.79 8.38005.C Complaints acknowledged within 3 days (or
agreed timeframe)100% L 81% 100% 93% 95% 100% 100% 94% 100% 100% 100% 100% 97%
006.C Complaints responded to within 25 days (or agreed timeframe)
100% L 69% 45% 33% 52% 30% 86% 89% 94% 96% 90% 93% 92%
007.C Compliments - actuals 77 72 93 90 97 83 94 74 107 101 102 91008.C Compliments - per 10,000 contacts 27.53 24.28 30.82 28.45 30.85 24.70 30.84 25.54 32.36 31.24 41.46 28.25010.C PALS acknowledged within 3 days (or agreed
timeframe)98% 100% 100% 96% 98% 100% 98% 100% 100% 100% 100% 100%
011.C PALS responded to within 25 days (or agreed timeframe)
93% 91% 90% 91% 99% 99% 91% 90% 97% 100% 100% 98%
012.C PALS - actuals 77 75 61 72 63 92 65 49 47 57 34 51013.C Patient Reported Experience Measures (PREM):
Response count509 561 507 587 605 672 595 597 703 689 516 606
014.C Patient Reported Experience Measure (PREM): Response rate
3.9 4.3 3.9 4.4 4.6 5.0 4.5 4.7 5.2 5.1 4 4
015.C Patient Reported Experience Measure (PREM): Achieving Regularly %
94% 94% 94% 93% 94% 94% 94% 93% 93% 93%
TB/18-19/168
30
Domain Indicators in Focus The graphs below provide a 12 month trend on areas of focus from the IQPR dashboard
• Trialling a localised model for
investigation to ensure both a
timely response and that quality
is achieved.
• Continuation of analysis of
complaints for any outliers in
order to target specific support.
TB/18-19/168
31
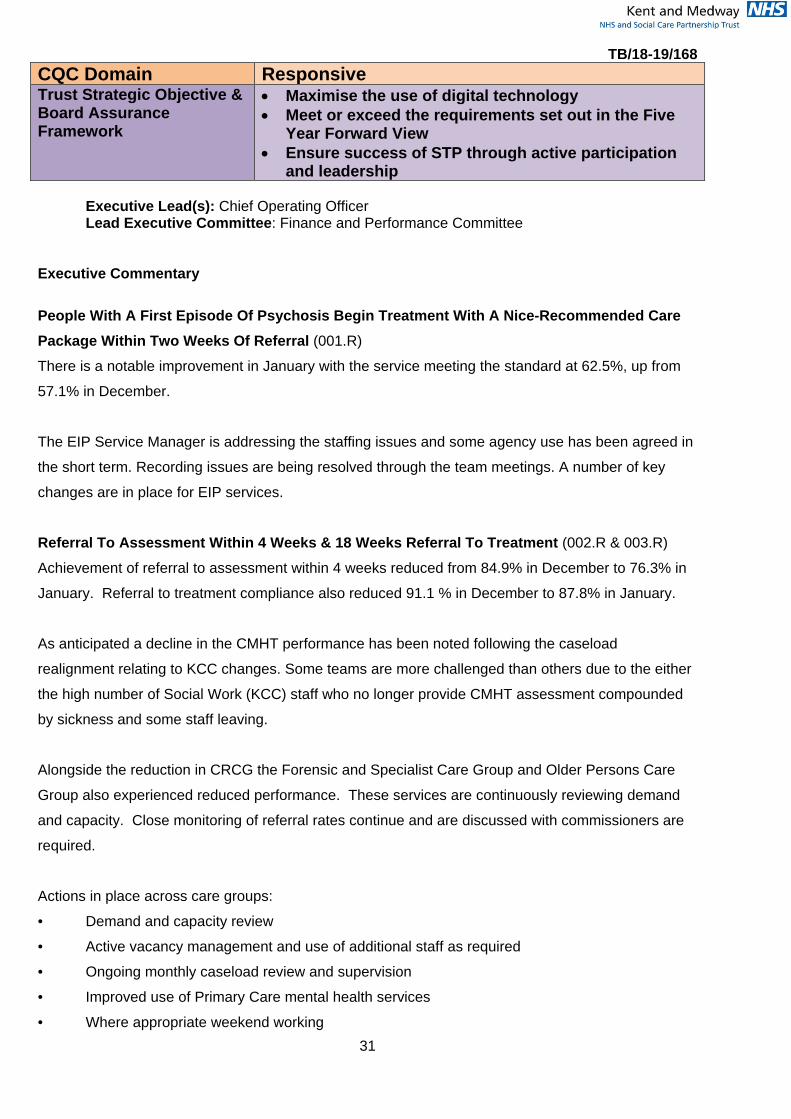
CQC Domain Responsive Trust Strategic Objective & Board Assurance Framework
• Maximise the use of digital technology • Meet or exceed the requirements set out in the Five
Year Forward View • Ensure success of STP through active participation
and leadership
Executive Lead(s): Chief Operating Officer Lead Executive Committee: Finance and Performance Committee
Executive Commentary
People With A First Episode Of Psychosis Begin Treatment With A Nice-Recommended Care Package Within Two Weeks Of Referral (001.R)
There is a notable improvement in January with the service meeting the standard at 62.5%, up from
57.1% in December.
The EIP Service Manager is addressing the staffing issues and some agency use has been agreed in
the short term. Recording issues are being resolved through the team meetings. A number of key
changes are in place for EIP services.
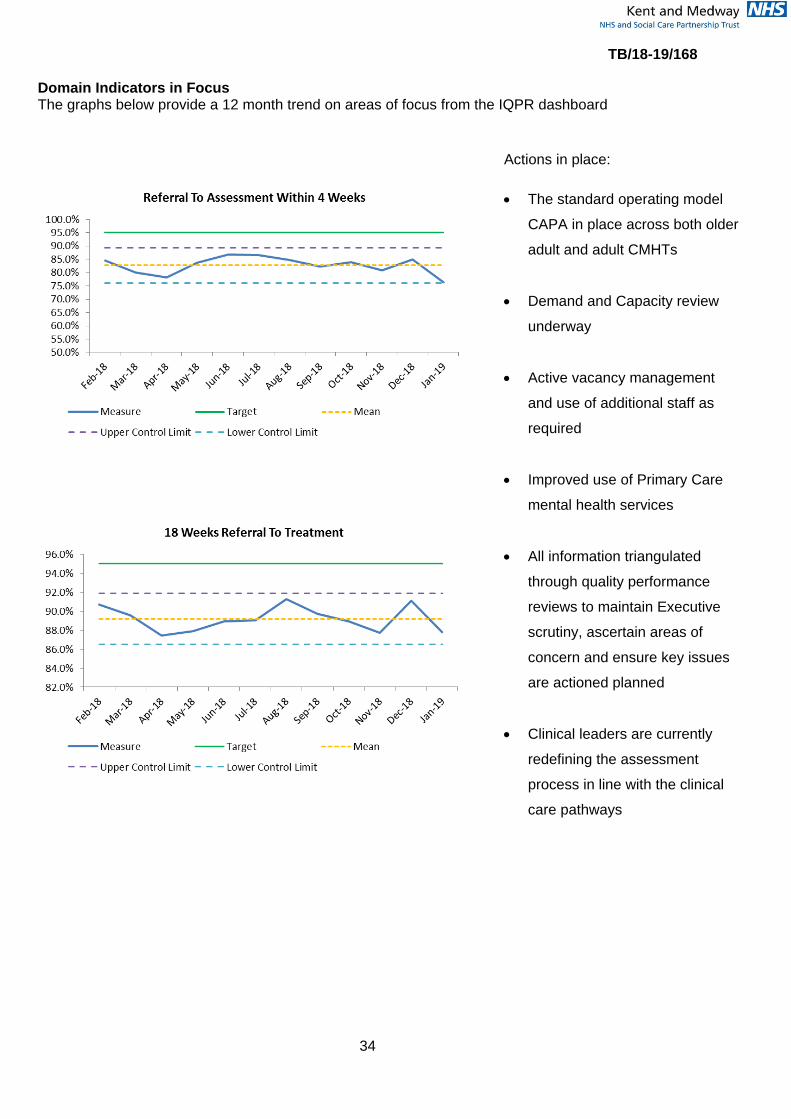
Referral To Assessment Within 4 Weeks & 18 Weeks Referral To Treatment (002.R & 003.R)
Achievement of referral to assessment within 4 weeks reduced from 84.9% in December to 76.3% in
January. Referral to treatment compliance also reduced 91.1 % in December to 87.8% in January.
As anticipated a decline in the CMHT performance has been noted following the caseload
realignment relating to KCC changes. Some teams are more challenged than others due to the either
the high number of Social Work (KCC) staff who no longer provide CMHT assessment compounded
by sickness and some staff leaving.
Alongside the reduction in CRCG the Forensic and Specialist Care Group and Older Persons Care
Group also experienced reduced performance. These services are continuously reviewing demand
and capacity. Close monitoring of referral rates continue and are discussed with commissioners are
required.
Actions in place across care groups:
• Demand and capacity review
• Active vacancy management and use of additional staff as required
• Ongoing monthly caseload review and supervision
• Improved use of Primary Care mental health services
• Where appropriate weekend working
TB/18-19/168
32
• On-going clinical care pathways development.
• Review of required documentation for those persons not subject to CPA.
With the recent changes the Chief Operating Officer and Director of Finance are escalating the
demand and capacity requirements regarding the CMHTs with commissioners. The 19/20 contract
round and the 10 year plan offer opportunities to ensure the community teams are effectively funded
and fully established to cope with the changes and increasing demand.
DNA 1st Appointment, DNA Follow up Appointment, Patient Cancellations (007.R-010.R)
A task and finish group has been set up; led by a senior clinical practitioner, working across all Care
Groups with a focus on understanding both DNA and cancellations with a requirement to complete a
report with recommendations back to the Executive Assurance Committee in June 2019.
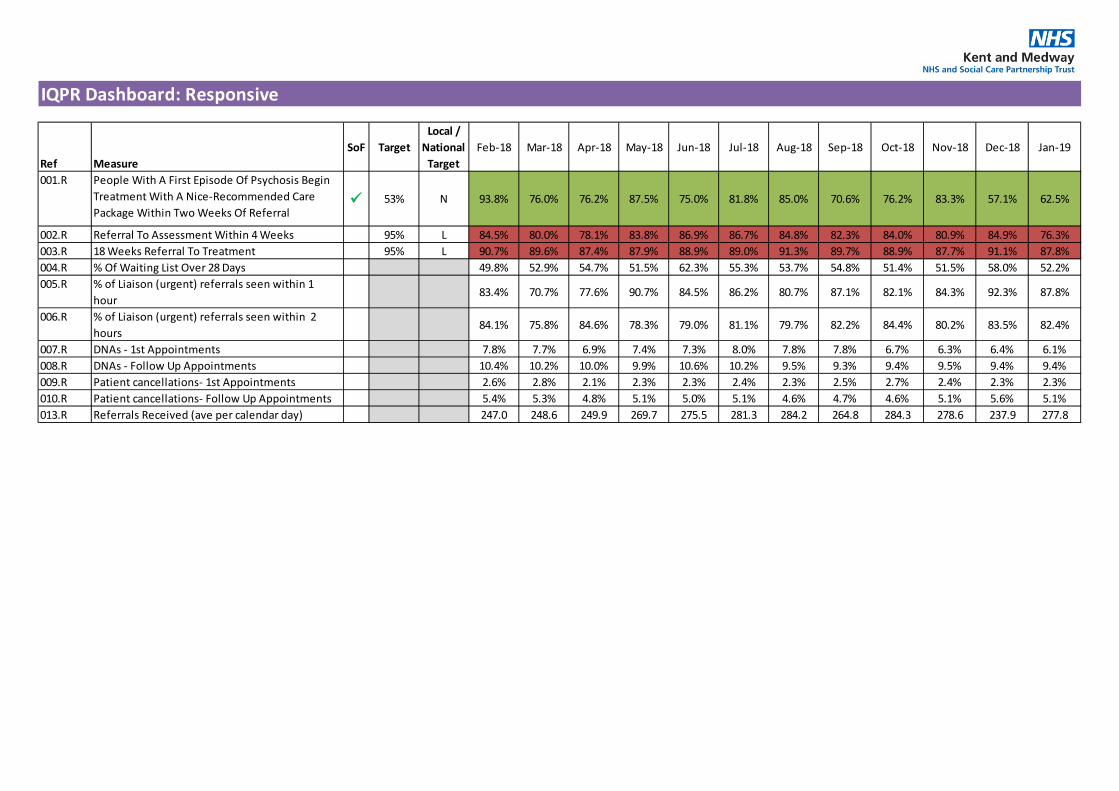
IQPR Dashboard: Responsive
Ref MeasureSoF Target
Local / National
TargetFeb-18 Mar-18 Apr-18 May-18 Jun-18 Jul-18 Aug-18 Sep-18 Oct-18 Nov-18 Dec-18 Jan-19
001.R People With A First Episode Of Psychosis Begin Treatment With A Nice-Recommended Care Package Within Two Weeks Of Referral
53% N 93.8% 76.0% 76.2% 87.5% 75.0% 81.8% 85.0% 70.6% 76.2% 83.3% 57.1% 62.5%
002.R Referral To Assessment Within 4 Weeks 95% L 84.5% 80.0% 78.1% 83.8% 86.9% 86.7% 84.8% 82.3% 84.0% 80.9% 84.9% 76.3%003.R 18 Weeks Referral To Treatment 95% L 90.7% 89.6% 87.4% 87.9% 88.9% 89.0% 91.3% 89.7% 88.9% 87.7% 91.1% 87.8%004.R % Of Waiting List Over 28 Days 49.8% 52.9% 54.7% 51.5% 62.3% 55.3% 53.7% 54.8% 51.4% 51.5% 58.0% 52.2%005.R % of Liaison (urgent) referrals seen within 1
hour83.4% 70.7% 77.6% 90.7% 84.5% 86.2% 80.7% 87.1% 82.1% 84.3% 92.3% 87.8%
006.R % of Liaison (urgent) referrals seen within 2 hours
84.1% 75.8% 84.6% 78.3% 79.0% 81.1% 79.7% 82.2% 84.4% 80.2% 83.5% 82.4%
007.R DNAs - 1st Appointments 7.8% 7.7% 6.9% 7.4% 7.3% 8.0% 7.8% 7.8% 6.7% 6.3% 6.4% 6.1%008.R DNAs - Follow Up Appointments 10.4% 10.2% 10.0% 9.9% 10.6% 10.2% 9.5% 9.3% 9.4% 9.5% 9.4% 9.4%009.R Patient cancellations- 1st Appointments 2.6% 2.8% 2.1% 2.3% 2.3% 2.4% 2.3% 2.5% 2.7% 2.4% 2.3% 2.3%010.R Patient cancellations- Follow Up Appointments 5.4% 5.3% 4.8% 5.1% 5.0% 5.1% 4.6% 4.7% 4.6% 5.1% 5.6% 5.1%013.R Referrals Received (ave per calendar day) 247.0 248.6 249.9 269.7 275.5 281.3 284.2 264.8 284.3 278.6 237.9 277.8
TB/18-19/168
34
Domain Indicators in Focus The graphs below provide a 12 month trend on areas of focus from the IQPR dashboard
Actions in place: • The standard operating model
CAPA in place across both older
adult and adult CMHTs
• Demand and Capacity review
underway
• Active vacancy management
and use of additional staff as
required
• Improved use of Primary Care
mental health services
• All information triangulated
through quality performance
reviews to maintain Executive
scrutiny, ascertain areas of
concern and ensure key issues
are actioned planned
• Clinical leaders are currently
redefining the assessment
process in line with the clinical
care pathways
35
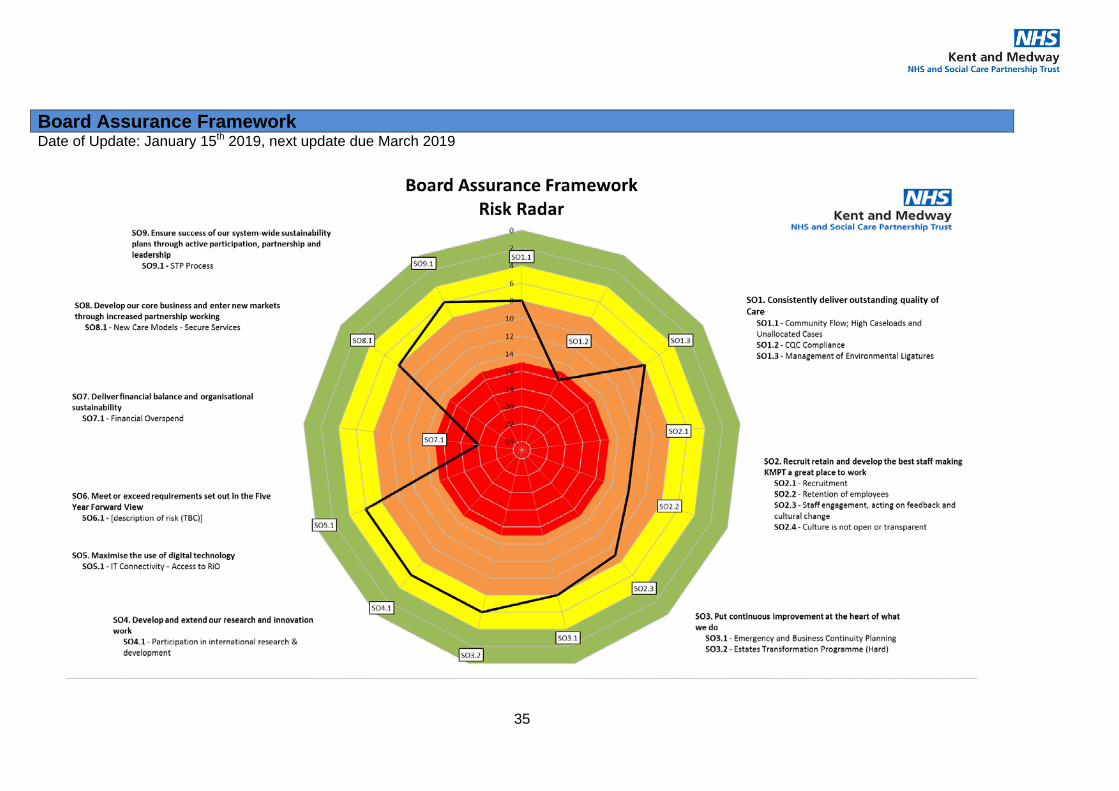
Date of Update: January 15th 2019, next update due March 2019
Board Assurance Framework
36
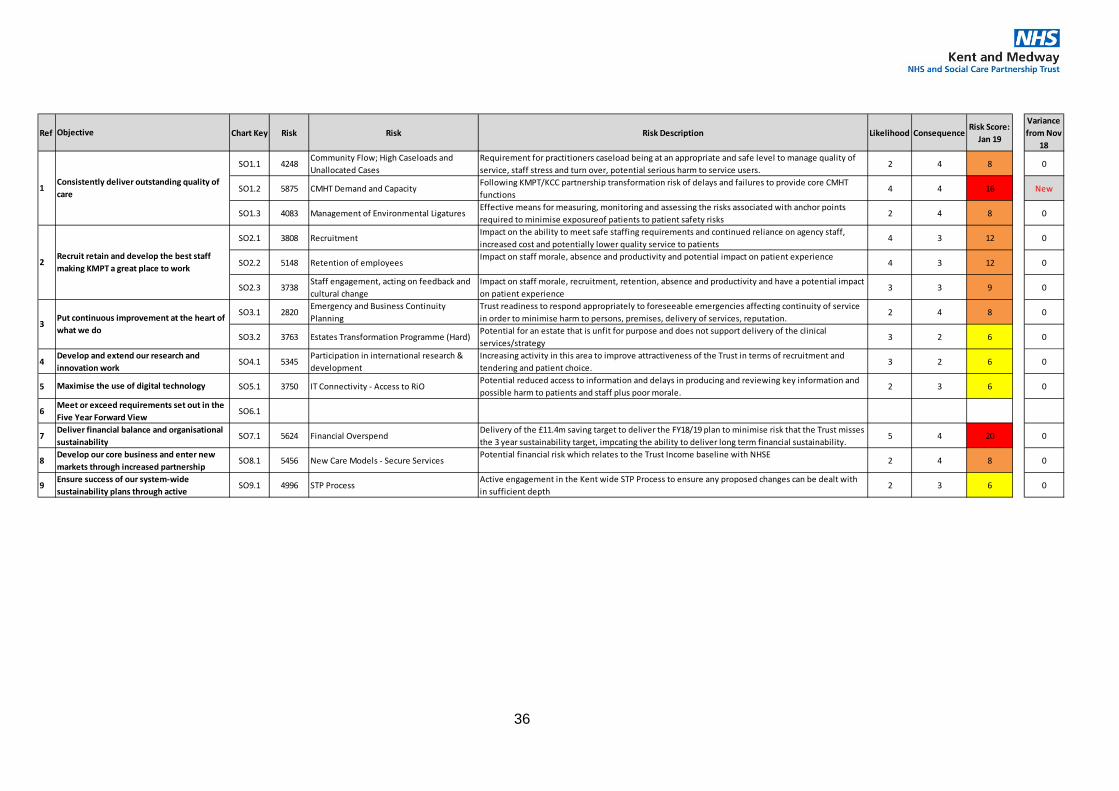
Ref Chart Key Risk Risk Risk Description Likelihood ConsequenceRisk Score:
Jan 19
Variance from Nov
18
SO1.1 4248Community Flow; High Caseloads and Unallocated Cases
Requirement for practitioners caseload being at an appropriate and safe level to manage quality of service, staff stress and turn over, potential serious harm to service users.
2 4 8 0
SO1.2 5875 CMHT Demand and CapacityFollowing KMPT/KCC partnership transformation risk of delays and failures to provide core CMHT functions
4 4 16 New
SO1.3 4083 Management of Environmental LigaturesEffective means for measuring, monitoring and assessing the risks associated with anchor points required to minimise exposureof patients to patient safety risks
2 4 8 0
SO2.1 3808 RecruitmentImpact on the ability to meet safe staffing requirements and continued reliance on agency staff, increased cost and potentially lower quality service to patients
4 3 12 0
SO2.2 5148 Retention of employeesImpact on staff morale, absence and productivity and potential impact on patient experience
4 3 12 0
SO2.3 3738Staff engagement, acting on feedback and cultural change
Impact on staff morale, recruitment, retention, absence and productivity and have a potential impact on patient experience
3 3 9 0
SO3.1 2820Emergency and Business Continuity Planning
Trust readiness to respond appropriately to foreseeable emergencies affecting continuity of service in order to minimise harm to persons, premises, delivery of services, reputation.
2 4 8 0
SO3.2 3763 Estates Transformation Programme (Hard)Potential for an estate that is unfit for purpose and does not support delivery of the clinical services/strategy
3 2 6 0
4 SO4.1 5345Participation in international research & development
Increasing activity in this area to improve attractiveness of the Trust in terms of recruitment and tendering and patient choice.
3 2 6 0
5 SO5.1 3750 IT Connectivity - Access to RiOPotential reduced access to information and delays in producing and reviewing key information and possible harm to patients and staff plus poor morale.
2 3 6 0
6 SO6.1
7 SO7.1 5624 Financial OverspendDelivery of the £11.4m saving target to deliver the FY18/19 plan to minimise risk that the Trust misses the 3 year sustainability target, impcating the ability to deliver long term financial sustainability.
5 4 20 0
8 SO8.1 5456 New Care Models - Secure ServicesPotential financial risk which relates to the Trust Income baseline with NHSE
2 4 8 0
9 SO9.1 4996 STP ProcessActive engagement in the Kent wide STP Process to ensure any proposed changes can be dealt with in sufficient depth
2 3 6 0Ensure success of our system-wide sustainability plans through active
Objective
1Consistently deliver outstanding quality of care
2Recruit retain and develop the best staff making KMPT a great place to work
3Put continuous improvement at the heart of what we do
Develop and extend our research and innovation work
Maximise the use of digital technology
Meet or exceed requirements set out in the Five Year Forward ViewDeliver financial balance and organisational sustainabilityDevelop our core business and enter new markets through increased partnership
37
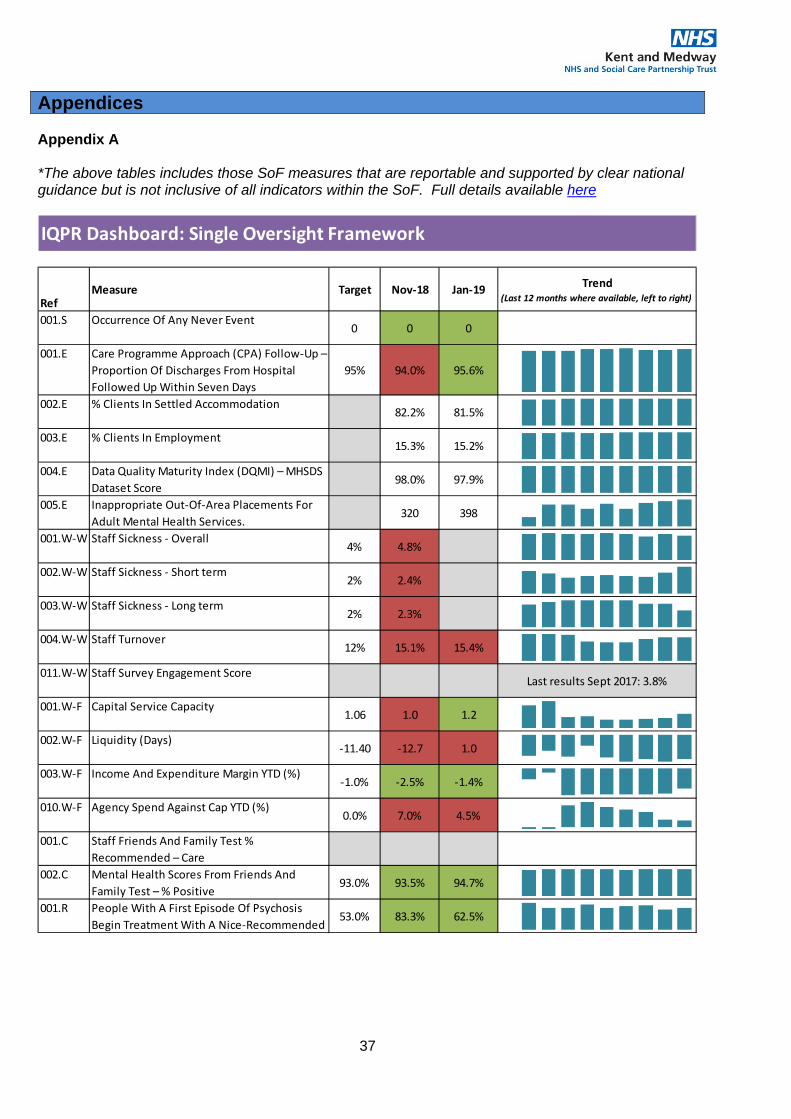
Appendices Appendix A *The above tables includes those SoF measures that are reportable and supported by clear national guidance but is not inclusive of all indicators within the SoF. Full details available here
IQPR Dashboard: Single Oversight Framework
RefMeasure Target Nov-18 Jan-19 Trend
(Last 12 months where available, left to right)
001.S Occurrence Of Any Never Event0 0 0
001.E Care Programme Approach (CPA) Follow-Up – Proportion Of Discharges From Hospital Followed Up Within Seven Days
95% 94.0% 95.6%
002.E % Clients In Settled Accommodation82.2% 81.5%
003.E % Clients In Employment15.3% 15.2%
004.E Data Quality Maturity Index (DQMI) – MHSDS Dataset Score
98.0% 97.9%
005.E Inappropriate Out-Of-Area Placements For Adult Mental Health Services.
320 398
001.W-W Staff Sickness - Overall4% 4.8%
002.W-W Staff Sickness - Short term2% 2.4%
003.W-W Staff Sickness - Long term2% 2.3%
004.W-W Staff Turnover12% 15.1% 15.4%
011.W-W Staff Survey Engagement ScoreLast results Sept 2017: 3.8%
001.W-F Capital Service Capacity1.06 1.0 1.2
002.W-F Liquidity (Days)-11.40 -12.7 1.0
003.W-F Income And Expenditure Margin YTD (%)-1.0% -2.5% -1.4%
010.W-F Agency Spend Against Cap YTD (%)0.0% 7.0% 4.5%
001.C Staff Friends And Family Test % Recommended – Care
002.C Mental Health Scores From Friends And Family Test – % Positive
93.0% 93.5% 94.7%
001.R People With A First Episode Of Psychosis Begin Treatment With A Nice-Recommended
53.0% 83.3% 62.5%
38
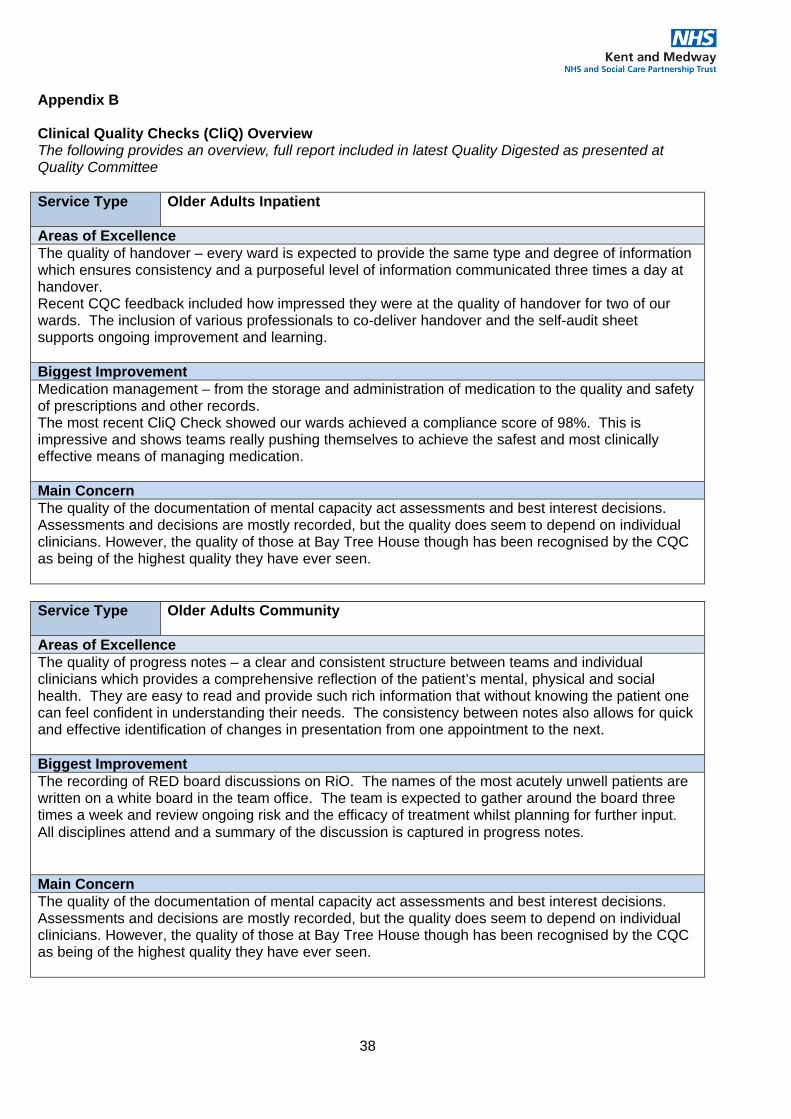
Appendix B Clinical Quality Checks (CliQ) Overview The following provides an overview, full report included in latest Quality Digested as presented at Quality Committee Service Type Older Adults Inpatient
Areas of Excellence The quality of handover – every ward is expected to provide the same type and degree of information which ensures consistency and a purposeful level of information communicated three times a day at handover. Recent CQC feedback included how impressed they were at the quality of handover for two of our wards. The inclusion of various professionals to co-deliver handover and the self-audit sheet supports ongoing improvement and learning. Biggest Improvement Medication management – from the storage and administration of medication to the quality and safety of prescriptions and other records. The most recent CliQ Check showed our wards achieved a compliance score of 98%. This is impressive and shows teams really pushing themselves to achieve the safest and most clinically effective means of managing medication. Main Concern The quality of the documentation of mental capacity act assessments and best interest decisions. Assessments and decisions are mostly recorded, but the quality does seem to depend on individual clinicians. However, the quality of those at Bay Tree House though has been recognised by the CQC as being of the highest quality they have ever seen. Service Type Older Adults Community
Areas of Excellence The quality of progress notes – a clear and consistent structure between teams and individual clinicians which provides a comprehensive reflection of the patient’s mental, physical and social health. They are easy to read and provide such rich information that without knowing the patient one can feel confident in understanding their needs. The consistency between notes also allows for quick and effective identification of changes in presentation from one appointment to the next. Biggest Improvement The recording of RED board discussions on RiO. The names of the most acutely unwell patients are written on a white board in the team office. The team is expected to gather around the board three times a week and review ongoing risk and the efficacy of treatment whilst planning for further input. All disciplines attend and a summary of the discussion is captured in progress notes. Main Concern The quality of the documentation of mental capacity act assessments and best interest decisions. Assessments and decisions are mostly recorded, but the quality does seem to depend on individual clinicians. However, the quality of those at Bay Tree House though has been recognised by the CQC as being of the highest quality they have ever seen.
39
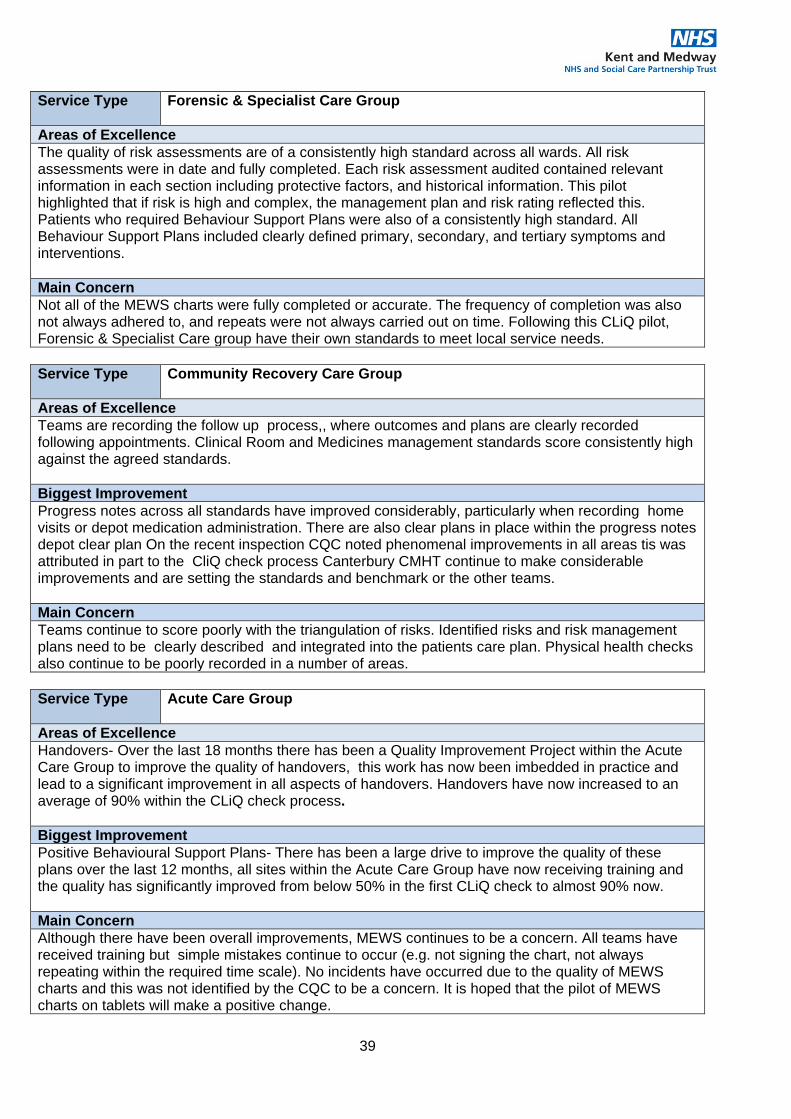
Service Type Forensic & Specialist Care Group
Areas of Excellence The quality of risk assessments are of a consistently high standard across all wards. All risk assessments were in date and fully completed. Each risk assessment audited contained relevant information in each section including protective factors, and historical information. This pilot highlighted that if risk is high and complex, the management plan and risk rating reflected this. Patients who required Behaviour Support Plans were also of a consistently high standard. All Behaviour Support Plans included clearly defined primary, secondary, and tertiary symptoms and interventions. Main Concern Not all of the MEWS charts were fully completed or accurate. The frequency of completion was also not always adhered to, and repeats were not always carried out on time. Following this CLiQ pilot, Forensic & Specialist Care group have their own standards to meet local service needs. Service Type Community Recovery Care Group
Areas of Excellence Teams are recording the follow up process,, where outcomes and plans are clearly recorded following appointments. Clinical Room and Medicines management standards score consistently high against the agreed standards. Biggest Improvement Progress notes across all standards have improved considerably, particularly when recording home visits or depot medication administration. There are also clear plans in place within the progress notes depot clear plan On the recent inspection CQC noted phenomenal improvements in all areas tis was attributed in part to the CliQ check process Canterbury CMHT continue to make considerable improvements and are setting the standards and benchmark or the other teams. Main Concern Teams continue to score poorly with the triangulation of risks. Identified risks and risk management plans need to be clearly described and integrated into the patients care plan. Physical health checks also continue to be poorly recorded in a number of areas. Service Type Acute Care Group
Areas of Excellence Handovers- Over the last 18 months there has been a Quality Improvement Project within the Acute Care Group to improve the quality of handovers, this work has now been imbedded in practice and lead to a significant improvement in all aspects of handovers. Handovers have now increased to an average of 90% within the CLiQ check process. Biggest Improvement Positive Behavioural Support Plans- There has been a large drive to improve the quality of these plans over the last 12 months, all sites within the Acute Care Group have now receiving training and the quality has significantly improved from below 50% in the first CLiQ check to almost 90% now. Main Concern Although there have been overall improvements, MEWS continues to be a concern. All teams have received training but simple mistakes continue to occur (e.g. not signing the chart, not always repeating within the required time scale). No incidents have occurred due to the quality of MEWS charts and this was not identified by the CQC to be a concern. It is hoped that the pilot of MEWS charts on tablets will make a positive change.
Copyright © 2022 FDOKUMEN