Integrated Performance Management System in Hasan Sadikin General Hospital
71
“To be the Indonesian Regional Class Hospital that shows Excellence in Services” As a Final Assignment in Corporate Performance Management Course Proposed by : Syndicate 4 Ananto Veryadesa Azolla Degita Azis Corry Lamria D Hutahaean Fikhi Adrian Laurien Verschuur Maurice Nibbelink Stefanus Indra Integrated Performance Management System Proposal in Hasan Sadikin General Hospital
Transcript of Integrated Performance Management System in Hasan Sadikin General Hospital

“To be the Indonesian Regional Class Hospital that shows
Excellence in Services”
As a Final Assignment in Corporate
Performance Management Course
Proposed by :
Syndicate 4
Ananto Veryadesa
Azolla Degita Azis
Corry Lamria D Hutahaean
Fikhi Adrian
Laurien Verschuur
Maurice Nibbelink
Stefanus Indra
Integrated Performance Management
System Proposal in Hasan Sadikin
General Hospital

Stage 1
Basic Information
1.1 Preliminary
Dr. HasanSadikin Hospital,or in bahasa Rumah Sakit Hasan Sadikin (RSHS), located at Jalan
Pasteur No.38 Bandung and is one of the technical units under the Medical Department. Therefore,
it is directly responsible to Direktur Jenderal Bina Pelayanan Medik of the Medical Department of
Republic Indonesia. RSHS is a class A referral hospital which is the best of health services for the
people of West Java.
RSHS is serves as an education hospital for medical workers and also as a national center of
excellence in the field of nuclear medicine. More specifically, RSHS serves as the only nuclear
medicine specialist education provider in Indonesia.
1.1.1 Brief History of Dr. Hasan Sadikin Hospital (RSHS)
RSHS was built by the Dutch government in 1920 and inaugurated on 15 October 1923
under the name of ‘Het Ziekenhuis Algemeene Bandoengche’. On 30 April 1927 its name was
changed to Het GemeenteZiekenhuis Juliana with a capacity of 300 beds. During the Japanese
occupation, the hospital was used as a military hospital by the name Rigukun Byoin, and in 1948 the
hospital's function returned to general hospital with the name “Ranca Badak Hospital”, whose
management is under the township of Bandung.
In 1954, Ranca Badak Hospital served as a provincial hospital. Two years later, in 1956, it
was established as a general hospital center. This coincided with the establishment of the Faculty of
Medicine, University of Padjadjaran. RSHS started working with the Medicine Faculty of
Padjadjaran University for a medical education.
On October 8, 1967, the name of Ranca Badak Hospital changed to General Hospital Dr.
HasanSadikin as a tribute to Dr. Hasan Sadikin who passed away while holding the position of
director of the hospital. Dr Hasan Sadikin was one of the founders of the Faculty of Medicine,
University of Padjadjaran (FKUP) and also served as the second Dean of FKUP.
Since itsestablishment in 1923, RSHS has developed into a large hospital in West Java which
serves as a referral hospitaland Pinnacle Peak of the West-Java province. Moreover, RSHS is a
teaching hospital for FKUP and other educational institutions for medical workers. Because of its
capability of providing specialist services and offering a broad range of sub-specialty services,

RSHS was set as a Class A Hospital in accordance with the PP No. 23 of 2003by the Department of
Health and by SK Menkes RI No. 861/Menkes/VI/2005 on October 18, 2004. RSHS has changed
the status of the Company Bureau (Perjan) into an institution that applies to Financial Management
of Public Service Agency (BLU-PPK).
1.2 Industry, Government and Society
In carrying out its functions, Hasan Sadikin Hospital cannot be separated from its Politic,
Economic, Technology, and Social Culture conditions and environment. These conditions could
impact the HS Hospital strategies positively, causing the hospital to improve their competency to
provide healthcare services quality to their customers/patient.
1.2.1 PEST Analysis
Start from their foundation until now, HS hospital has experienced some changes in their
status.Starting in the form of Swadana, Pendapatan Negara Bukan Pajak, Perusahaan Jawatan it
now is a Hospital for Public Service. This change is due to government policy. As a Government-
run Hospital, there are some policies which create opportunities for the hospital and also some
policies that limit the hospital’s activity and reduces the flexibility of managing the hospital.
The growth of the economic rate also impacted the Hasan Sadikin hospital. The purchasing
power of people and inflation rate affect operational and planning system of the hospital.
Moreover, the technology development influences the development of doctor’s technological
knowledge, the improvement of the quality of service and an increase in the costs that hospitals and
patients have to pay. The development of supporting technology systems has to be followed
significantly with the capability of hospital’s human resources to match this development and
increase the positive value of the hospital.
1.2.2 Indonesia Demographic and Economic Conditions
The population of Indonesia is around 242,3 Million on 2011, and is dominated by the
middle-income segment as the largest and fastest growing segment of Indonesia’s population, with
GDP growth in Indonesia being around 6,5%.
Based on BPS Statistic Data, the middle income consumer segment in Indonesia spends
17,8% of their expenses on Goods & Services that include toiletries & personal care, books &
stationeries, medical & healthcare, education, transportation and recreation. Around 51% of their
expenses is spend on Food and Beverages.

Figure 1.1. Indonesia Demographic by Income, 2012 (in Million) (Source: The World Bank,
Ministry of Health, BPS)
Based on BPS Data Statistic, the total population in West Java Province is around 44 million
people, and that makes West Java having the largest population in Indonesia in 2011. Bandung has
the 3rd
largest population in West Java Province, which is around 2,5 million people.
The Ministry of Health of the Republic Indonesia has allocated a budget for health in West
Java Province which is only Rp 2,3 Trillion for the whole of 2011. However, the realization budget
that was actually allocated on thehealth areaby the Government of West Java Province was only Rp
743 Million. This budget is for running the Jamkesmas/Jamkesda program, Puskesmas facilities,
Health Research, Health Development Program for mother care and baby birth, and Medicine
(Generics).
To provide the Health Care Facilities in West Java Province, there are Hospitals and
Puskesmas in West Java Province.The total number of Hospitals is 251, which includes 32 hospitals
in Bandung area. There are 1.050 Puskesmas in the West Java Province, with 62 Puskesmas in
Bandung area to serve citizens with low-level economic conditions. 95,2% of the population has
already rights to have a very low-payment of health care facilities provided by ASKES Insurance,
Jamkesmas, and Jamkesda from the Government.
High income segment (19.4 Mn) Monthly income per household: >USD 1,000
Mid-high income segment (29.1 Mn) Monthly income per household: USD 550–1,000
Mid-low income segment (126 Mn) Monthly income per household: USD 150–550
Low income segment (67.8 Mn) Monthly income per household: <USD 150
8%100%
2011
28%
52%
12%
242.3 Mn

Figure 1.2. Proportion of Health Insurance for Indonesian People, 2011 (Source: P2JK)
Some customers that have ASKES, Jamkesmas, and Jamkesda feel that there is a gap
between the services supplied to them and the customers that are using non-governmental insurance,
such as long queuing time, Health Care Equipment, room facilities, and capability of the doctors.
With the big total population and just a small number of Health Care Services in the West
Java Province, the government still needs a bigger number of Hospitals and Puskesmas to satisfy the
demands of patients which increases every year, especially for the sub-urban areas in the West Java
Province.
1.2.3 Political-Legal environment for Government Health Industry
With the issuance of Law No. 20 of 1997, in 1998 the revenue status of a government
hospital like RSHS is one of the Non-Tax Revenue (PNBP) of the Indonesian country, meaning that
all income and expenses must be recorded into the government within 24 hours. It was felt that this
condition strongly inhibits smooth operations, leading to delays in the provision of laboratory
reagents which were compounded by rising U.S. dollar exchange rates sharply, almost causing the
Clinical Pathology Laboratory services to collapse in 1998.
In the next period, the limitation of the government in financing hospital services has
declined, because the hospital was required to improve the quality of service. It made a big change
in paradigm of the government to act more as a catalyst by removing operations that can be done by
the hospital itself (steering rather than rowing). Thus, the Government issued a new Law No.
.119/2000 that made RSHS a Bureau Company (Perjan).
With having autonomy and greater flexibility in managing the hospital because of this new
status, RSHS perceived performance improved. The status of Perjan hospitals was constrained by
new legislation, so that since 2005RSHS, with the other 12 hospitals in Indonesia, transformed into
the new status of Financial Management of Public Service Agency (BLU-PPK).
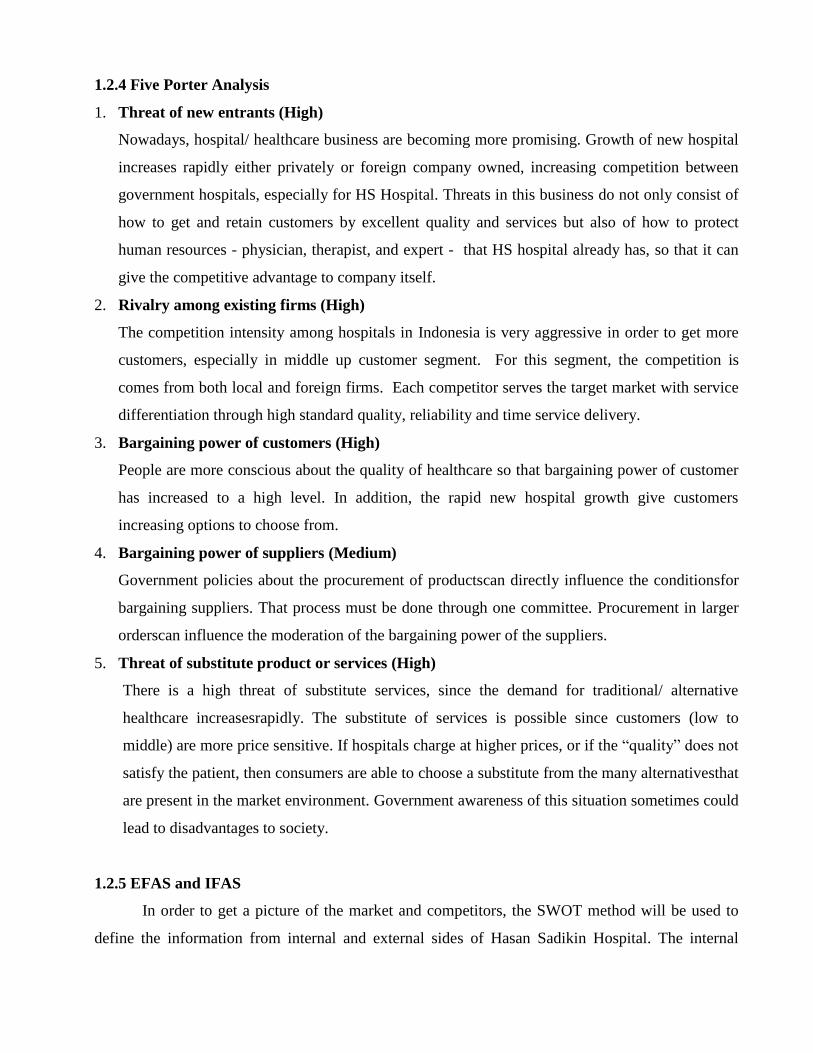
1.2.4 Five Porter Analysis
1. Threat of new entrants (High)
Nowadays, hospital/ healthcare business are becoming more promising. Growth of new hospital
increases rapidly either privately or foreign company owned, increasing competition between
government hospitals, especially for HS Hospital. Threats in this business do not only consist of
how to get and retain customers by excellent quality and services but also of how to protect
human resources - physician, therapist, and expert - that HS hospital already has, so that it can
give the competitive advantage to company itself.
2. Rivalry among existing firms (High)
The competition intensity among hospitals in Indonesia is very aggressive in order to get more
customers, especially in middle up customer segment. For this segment, the competition is
comes from both local and foreign firms. Each competitor serves the target market with service
differentiation through high standard quality, reliability and time service delivery.
3. Bargaining power of customers (High)
People are more conscious about the quality of healthcare so that bargaining power of customer
has increased to a high level. In addition, the rapid new hospital growth give customers
increasing options to choose from.
4. Bargaining power of suppliers (Medium)
Government policies about the procurement of productscan directly influence the conditionsfor
bargaining suppliers. That process must be done through one committee. Procurement in larger
orderscan influence the moderation of the bargaining power of the suppliers.
5. Threat of substitute product or services (High)
There is a high threat of substitute services, since the demand for traditional/ alternative
healthcare increasesrapidly. The substitute of services is possible since customers (low to
middle) are more price sensitive. If hospitals charge at higher prices, or if the “quality” does not
satisfy the patient, then consumers are able to choose a substitute from the many alternativesthat
are present in the market environment. Government awareness of this situation sometimes could
lead to disadvantages to society.
1.2.5 EFAS and IFAS
In order to get a picture of the market and competitors, the SWOT method will be used to
define the information from internal and external sides of Hasan Sadikin Hospital. The internal

information captures strengths and weaknesses that Hasan Sadikin Hospital has, where the external
information provides the opportunities and threats Hasan Sadikin Hospital might face.
Strengths
Tabel 1.1 Internal Strengths Analysis (Source : Renstra 2007 until 2011)
No Description Factor Sub-Factor Rating Value Total
a
Services
0,35
1,30
Sub specialis services increase both quantity and
quality aspect 0,25 4 0,35
Class A Hospital as top recommendation, full
acreditation with full sixteen services 0,2 4 0,28
As hospital for education always update with
IPTEKDOK and education model development in
Indonesia 0,15 3 0,16
Service competency and ability to develop new
product 0,25 4 0,35
Medical committee performs as their roles 0,15 3 0,16
b
Financial
0,2
0,78
Government subsidy 0,2 4 0,16
Increasing of cost recovery 0,4 4 0,32
Financial management assisted by banking services 0,1 3 0,06
Using system development central service
admnistration (PPTARS) with SIMRS 0,1 4 0,08
Hospital rate including unit cost 0,2 4 0,16
c
Human Resources and Organization
0,3
1,09
Appropriate quantity and quality of medical
employee 0,24 4 0,29
Variability of education background in human
resources to support serbices, education and
research requirement 0,28 4 0,34
The ability of paramedic, functional employee , and
administration non functional increase 0,13 3 0,12
The attitude, loyality and motivation of specialist
physican increase 0,13 3 0,12
Organization structure inline with BLU concept 0,12 4 0,14
Corporation between HasanSadikin Hospitaland
medical faculty of Padjajaran University about
health resarch 0,1 3 0,09
d
Facilities, Infrastructure and equipment
0,15
0,64
Strategic location 0,25 5 0,19
Has prospectif master plan, already implemented 0,2 4 0,12
Sufficient building and equipment 0,3 4 0,18
Compututerized SIMRS continue to develop 0,25 4 0,15
Total 3,80

Weaknesses
Tabel 1. 2. Internal Weaknesses Analysis (Source : Renstra 2007 until 2011)
No Description Factor Sub-Factor Rating Value Total
a
Services
0,35
1,16
Service procedures not yet oriented with customer
satisfaction 0,3 4 0,42
Long time of delivery 0,25 3 0,26
Marketing not fully utilized 0,25 3 0,26
Intergration of service and education not fully
optimized 0,2 3 0,21
b
Financial
0,2
0,65 Deficit in particular unit services 0,4 3 0,24
Rate applied not as final cost 0,35 3 0,21
HS HOSPITAL's Employee contract payment
financed under hospital 0,25 4 0,20
c
Human resources and organization
0,3
0,90 Number of nurse not sufficient with requirement 0,5 3 0,45
No relation between reward and achievement 0,5 3 0,45
d
Facilities, Infrastructure and equipment
0,15
0,51 Low budget for maintenance cost 0,35 3 0,16
Lack of layout compare to room requirement 0,25 3 0,11
Lack of sophisticated facility and equipment 0,4 4 0,24
Total 3,22
Opportunities
Tabel 1.3. Market Opportunity Analysis (Source : Renstra 2007 until 2011)
No Description Factor Sub-Factor Rating Value Total
a
Law
0,18
0,90 Law No.1 year 2004 about country treasury 0,5 5 0,45
Law No.29 year 2004 abour medical practice
encourage spesialist physicians fully contributed to
HS Hospital
0,5 5 0,45
b
Government Policy
0,18
0,57
Political will, government support the development
of organization performance with PP No.23 year
2005, including possibility of Operational
Corperation (KSO)
0,35 5 0,32
PMK and Kepmekes availability as Juknis PP No.
23 years 2005 0,35 4 0,25
Gakin's patient will be funded by Government under
Askesin program 0,3 4 0,22
c
Competitor
0,16
0,58 Opportunity to have an agreement with other
hospital, both domestic and foreign. 0,6 4 0,38

Tabel 1.3. Market Opportunity Analysis (Source : Renstra 2007 until 2011)
No Description Factor Sub-Factor Rating Value Total
Strategy alliances to share facility and equipment
0,4 3 0,19
d Economy
0,16
0,08
Economic growth in Indonesia 0,16 3 0,08
e
Social and Culture
0,16
0,56
Society tends to push hospital to give best quality 0,5 4 0,32
Society more conscious about quality of health
service especially promotif and preventive health 0,25 3 0,12
Life expectancy rising in line with increasing of
people health awareness 0,25 3 0,12
f
Technology
0,16
0,58
IPTEKDOK as based to develop new
services/products 0,4 3 0,19
Submission for cooperation in services and
sophisticated technology increasing 0,6 4 0,38
Total 3,26
Threats
Tabel 1.4. Threat Analysis (Source : Renstra 2007 until 2011)
No Description Factor Sub-Factor Rating Value Total
a Law
0,18
Taxes regulation increasing hospital expenditure 1 3 0,54 0,54
b
Government Policy
0,18
Complaint for product and service under Kepperes
no.80 year 2003 impacted to long and less flexible
process
1 3 0,54 0,54
c Competitor
0,16
Marketing of private/ Foreign hospital more
aggressive than HS Hospital 1 4 0,64 0,64
d
Economy
0,16
0,72 Increasing of not so unfortunate people in Indonesia
whose not have health assurance from government 0,5 3 0,24
Rupiah depreciation compare to dollar 1 3 0,48
e Social and culture
0,16
People tend to get health service alternatives from
overseas 1 3 0,48 0,48
f Technology
0,16
High investment and maintenance for sophisticated
technology 1 3 0,48 0,48
Total 3,4

Based on the matrix showed below, Hasan Sadikin Hospital strategic position is a growth strategy to
face hospital market in Indonesia.
Figure 1.3. SWOT Analysis Result
1.2.6 Business Issues faced by Hasan Sadikin Hospital
Fierce competitive levels in every business sectorlead tothe critical response of people to
products of goods and services.Furthermore, the threat of new entrants pressures the current
provider to improve their service quality in order to gain trust from their customers.
In order to anticipate to these problems, some companies started to revise their vision,
mission, company strategies and made improvements on their operational activities, which improved
the corporate performance. Also companies are researching and learning from other strategies of
companies that have the best performance. To reach the goal of a company’s vision HS hospital
wants to gain global recognition and to position the hospitals as a world class hospital. HS has to
compete with other hospitals both nationally and internationally and has to answer the challenges
with providing health service quality.
Until this moment tools called “Standar Akreditasi Rumah Sakit”, that are nationally
applicable but not yet usedfor international standardized performance measurement, are usedto
measure the performance of HS Hospital. In order to fulfill the needs, HS Hospital needs to apply
international standard performance measurement tools such as Malcolm Balridge. Malcolm Balridge
provides a special assessment system when applied to the hospital can determine the strategy to win
the competition, adopting structural changes to improve the performance and aim for awardssuch as
the Indonesia Quality Award (IQA).
IFAS = 7,02
EFAS = 6,66
Growth strategy

By using international standard tools to measure the corporate performance, HS Hospitals
might be able to recognize their position within their business environment, particularly with other
hospitals in the regional sectors around Southeast Asia.
1.2.7 Business Solution
In this research an Integrated Performance Management System (IPMS) is used as a system
to develop the business solution that relates to the topic of how the HS Hospital is to achieve and
improve their performance.
1.3 Market and Competitor
Zairi (1992) explain that there are multiple ways to analyze market and competitors
1. Analyze Competitor by using product as starting point to identify strength, weakness, design
capability and technology exploitation.
2. Financial analysis, which gives an indication against competitor, source allocation, business
results, etc.
3. Business environment change.
4. Market dynamic to understand consumer behavior, buying power, etc.
One of the methodologies to gather information regarding the business environment is
environmental scanning. Environmental scanning usesexternal factors information coming from
annual report, books and others to benchmark its capabilities against competitors.
The Ministry of Health divides Indonesian healthcare into public healthcare and private
healthcare, and Hasan Sadikin Hospital provides public healthcare represented by the west java
government.
General hospitals make up for almost 80 percent of the total hospitals in the country. Despite
the rapid increase in non-communicable diseases, specialist hospitals targeting cardiac care and
cancer are considerably low at less than one percent of all hospitals. Conversely, hospitals
specialising in paediatric care, maternity care, and mental health are most common.
The health system in Indonesia relies heavily on the private sector and this should be given
proper importance by the government, deciding which health indicators (infant mortality, maternal
mortality and others) will and will not be improved. Due to lack of infrastructure and skilled
workforce in the public sector, most of the population (even the poor) seek private sector treatment
for critical services as childbirth, paediatric diarrhoea, and acute respiratory diseases.

With globalization, competition is really tight in the hospital industry, not only a national
scale, but also internationally. Hospitals in other countries also effectively become competitors of
Indonesian hospitals. When asurvey was held amongst customers, the main reason why Indonesian
people prefer to take medical treatment abroad than domestically is because they assume hospitals in
another country are more convenient and have more reliable service than hospitals in the Indonesia.
Nevertheless, we can see the number of JCI certified hospitals (Joint Commission
International - an international hospital standards bodies) accredited in Indonesia is only 9 hospitals.
In comparison with Singapore, that already has 22 hospitals that have this accreditation. So, the
customers’ perception is really important, and Indonesian hospitals havethe ability to compete and
to be in the forefront to improve patient care and confidence.
Although RSHS is the only hospital that has a BLU status in West Java Province, RSHS still
competes with other hospitals, especially in Bandung area.
Table 1.5. Hospital in West Java Province (Source: Ministry of Health)
Figure 1.4. Percentage of Hospitals in Indonesia, 2010

In term of financial analysis, public healthcare and private healthcare have increasing trends
for their expenditures, based on research by Frost and Sullivan.
Figure 1.5. Hospital Expenditure in Indonesia
Figure 1.6. Hospital Expenditure Projection in Indonesia
In the past decade, the significant growth of the public health sector underpinned the
majority of the healthcare sector development. In response to the financial and economic crisis, new
emphasis was placed on pro-poor financing, whereby the public sector was bestowed as the primary
sector for delivering accessible and affordable healthcare services to the poor.
Industry competition assessment for Hasan Sadikin Hospital will be done through
comparison with the strongest competitor in Indonesia, which is representedby private healthcare.
According to Frost & Sullivan, PT Siloam International Hospitals is the largest private hospital
group in Indonesia in terms of number of hospital beds as of December 31, 2012. Over the last 17
5,1 5,7 7,8
10,3 12,1 13,6 4,3 4,7
7,3
9,5
11,3 12,8
0,00
5,00
10,00
15,00
20,00
25,00
30,00
2007 2008 2009 2010e 2011e 2012e
Exp
end
itu
re
($ B
illi
on
)
Private Government
2013F 2014F 2015F
Private Expenditure 14,66 16,96 19,95
Government
Expenditure 15,44 17,44 19,95
0,00
5,00
10,00
15,00
20,00
25,00
30,00
35,00
40,00
45,00
Gover
nm
en
t vs
Pri
vate
Hea
lth
Ex
pen
dit
ure
(U
SD
bil
lion
)

years, Siloam Hospital has been a pioneer and been a part of many significant milestones in the
development of healthcare in Indonesia. They received an “excellence” award from the Asian
Hospital Management Award in 2011.
There are some critical success factors that contribute to the success of Siloam Hospital compared to
Hasan Sadikin Hospital such as
1. Infrastructure
2. Finance
3. Technology
4. Services
5. Education
This could be mapped into the following table
Tabel 1.6. Comparison
Aspect Hasan Sadikin Hospital Position compare to Siloam Hospital
Below Average Average Above Average
Infrastructure
Finance
Technology
Service
Education
Base on table above, there are 4 weakness factors that make HasanSadikin Hospital
performance below Siloam Hospital; Infrastructure, Finance, Technology and Service.
As of April 30, 2013, Siloam operated 13 hospitals, providing a comprehensive range of
specialist medical services such as complex surgical procedures, as well as laboratory services,
radiology and imaging services, fertility treatment, general healthcare services and diagnostic and
emergency services. As of April 30, 2013, Siloam has a total bed capacity of 3,436 beds, 1,178
doctors (including 930 specialists) who provided services to patients at the hospitals, and employed
2,607 nurses and other allied health personnel. Siloam plans to further expand their operations and
presence through building new hospitals, expanding their existing hospitals and opportunistic
acquisitions, with the goal of increasing their total bed capacity to 10,000 beds over the next five
years.
In the yearsended December 31, 2010, 2011 and 2012 and the four months ended April 30,
2012 and 2013, Siloam Hospital recorded revenues of Rp.1,030.5 billion, Rp.1,259.3 billion,

Rp.1,788.1 billion (US$183.9 million)2, Rp.534.3 billion (US$55.0 million) and Rp.789.5 billion
(US$81.2 million), respectively, and net operating revenues of Rp.702.0 billion, Rp.881.1 billion,
Rp.1,272.7 billion(US$130.9 million), Rp.380.4 billion (US$39.1 million) and Rp.577.8 billion
(US$59.4 million).
There is one factor that Hasan Sadikin Hospital can compete with Siloam Hospital, which is
Education. Hasan Sadikin Hospital works closely with Pajajaran University, while Siloam Hospital
with Pelita Harapan University. Most of the students from both universities join internships and do
research before they become full time doctors, nurses and any medical health personnel in the
future. HasanSadikinHospitaland Siloam Hospital cooperation with education organization make
them have the same position.
1.4 Product and Services
RSHS has a scope of business that organizes relief and recovery efforts which are
implemented in a harmonious, integrated and continuous environment with health promotion and
prevention efforts as well as efforts to implement the referral, education and research and other
efforts needed.
Hasan Sadikin Hospital is a “Class A” which is the central reference rate of West Java
province, and has facilities adequate to support highly qualified human resource excellence, as a
commitment to always improve quality of service.
Infrastructure is meant as a means of building, medical and non-medical equipment. RSHS
has 715 patient rooms and has emergency room that are divided into 3 rooms of Actions (R.
Surgical, R. Medical, and R. Children), 1 room Resuscitation, 1 Triage Room, 1 Observation
Lounge for class II (RIS B), 1 Observation Lounge for class I (A RIS KLS I), Room 5 Intermediate
Ward (RIS A VIP), 1 room and Perinatology Obgyn action for class I.
In the field of medical services RSHS provides twenty specialist medical services, 127 sub
specialty services and specialized media services.
a) EmergencyDepartment Room, facilitated with Resuscitation Room, Room Triage, Room
Observation, Examination Room and Room of Join Together.
b) Installation of Outpatient
c) RSHS has 13 specialist clinics and 63 clinics for 99 sub specialty, also 10 specialty clinics
for executive class located in the emergency department.
d) HospitalizationDepartment, provided 1,100 bed consists of
121 VIP beds
107 Class I beds
137 Class II beds
650 Class III beds
85 beds for Intensive Care, High Care, Isolated Room, etc.
RSHS assets, which are the property of State (BMN), is managed by a computerized Account
Management Information System (BMN). RSHS assets consist of 130,000 items which are
distributed to 715 rooms.
Ambulances are available 24 hours and equipped with medical equipment that meet the ISO
standards, supported by medical and paramedical professionals according to the needs of the patient.
Currently, RSHS has 12 unit ambulances and 2 hearses. Other common features include lounge,
banks, mosque and cafeteria and these are scattered in several locations in RSHS. Parking area is
equipped with a security system using CCTV 24-hour and supported by 92 security guards. Security
guard officers are divided over the five service areas, covering 27 points guard.
Furthermore, RSHS has services activities that are supported by non-medical services such as
Installation of Laundry, Nutrition Installation, Installation of Maintenance Facility Hospital,
Pharmacy Installation, Installation of Environmental Health Hospital, Hospital Information System
Installation, Installation of Supply, Central Sterile Supply Department (CSSD).
In the process leading to become a superior hospital, RSHS established flagship service, namely:
1. Nuclear Medicine services
- Gamma Camera
Plane gamma camera for nuclear medicine is a system to process the gamma radiation from the
human body to be made in the form of images for purposes of a diagnostic.
- PET CT
PET / CT is a medical imaging diagnostic tool most advanced in the world today, is the only
technology that uses an anatomical way to perform imaging examinations of the function, the
body's metabolism and receptors, can detect correctly without injuring the body, capable of
differentiation and sensitive high to examine the presence of even a small cancerous lesions and
early detection of cancer at an early stage, the level of diagnosis accuracy reached above 90%.
The PET/CT has an important role in determining the subsequent treatment plan.

2. Radiology services
- CT Scan
CT Scan is one radio diagnostic equipment using x-rays. The resulting image is basically a
mapping of objects to the absorption of x-ray.
- MRI
Magnetic Resonance Imaging (MRI) is a technique used to produce a picture of internal organs
in living organisms, as well as to find the amount of water content in the geological structure.
Usually used to describe a pathological or physiological changes in living muscle. On
treatment, MRI is used to distinguish muscle pathologies such as brain tumors compared to
normal muscle
- MSCT 128 Slices Dual - Sources
The latest technology MSCT 128 Dual Sources Slices technology is the most advanced
diagnostic radiology imaging. MSCT has a variety of features to speed up the scan time,
minimize radiation dose, and minimize artifacts .
Faster imaging capabilities as well as the results of image quality make it easier for medical
personnel to get a more accurate diagnostic results. Moreover, in terms of radiation protection ,
this tool is able to reduce the radiation exposure of patients and operators because it has features
that improve the effectiveness of air to the maximum and to minimize radiation exposure
without compromising image quality .
3. Cardiac services
- ESMR
Sophisticated equipment to detect heart blockages
4. Surgical Services Urology
- ESWL
Extracorporeal shock wave lithotripsy (ESWL) is a non - invasive therapy , because it does not
require surgery or infusion device into the patient's body . As the name implies, Extracorporeal
means outside the body , whereas the mean crushing stones Lithotripsy , ESWL literally means
destruction of urinary tract stones using shock waves ( shock wave ) is transmitted from outside
the body .
5. Radiotherapy services
- Linac

This tool helps the process of radiation treatment with radiation source has a distance to the
intended target or are outside the body . Sources used are X-rays or photons that are emitted
electromagnetic waves released by aircraft liner accelerator ( linac ) .
- COBALT 60
Treatment machines include gamma sources for the purposes of external beam radiotherapy
machine called teletherapy . Most of the frequently made isosentris , let the file rotates around
the patient with SAD were determined .
1.4.1 Company Resources
According to the data on December 2008, Human Resources at HasanSadikin Hospital,
consist of a total 3623 of employees, which have different professions. The doctors ratio, including
specialist doctors, with beds are 1,2:1. And ratio of nurses with beds are 1:1, which is considered to
be less than the ideal ratio (1,5:1). Thecurrentnursing shortage problemishandled byusinginterns,
then theratio is increased to1,13:1.
In order to response and to manage their condition in a fierce business, the shortage of number of
employees is continually handled by opening vacancies through Selection of CPNS, internship and
temporary-contracts. To response to their qualifications training programs are established.
1.4.2 Supporting resources
There are several supporting resources which support the activities of HasanSadikin Hospital.
a. Medical instrument
To support the operational activities, HS Hospital provides various medical tools that are
supported by modernized and newly-developed technology calibrated by Authorized Agency of
HealthFacilities. Internationally standardized surgical tools, comprehensive monitoring tools, and
other medical tools that help the hospital create a service system that can be carried out fastly,
quickly and accurately which considers on handling patient safety. There are several high-
technological medical tools provided by Hasan Sadikin Hospital which are; Digital Angiography
machine, CT scan, MRI, Linac, Cobalt, Camet CT, Densitometer, etc. According to the inventory
data of HS Hospital, the value of medical instruments is 45% of the Hospital total assets.
b. Non-medical tools
The tools such as steam sterilizer, medical gas installation, Un-interupted Power Supply (UPS),
boiler, etc. are available supporting tools to enhance healthcare service. These tools are valued as

12% of total assets. Maintenanceprograms that are conducted are important to support the success
of services provided by HS Hospital.
c. Hospital Information System
Master plan applications of the Hospital Information System which reached stage V supports the
integrated patient data, service givens, and cost of services. The continuous program Case Mix/
INA DRG and the development of Bridging Systems between Hospital IS with PT Askes to
support online access will help to easier the current process.
d. Land and building
The Land that usedfor HS Hospital operational activities is 87.000 m2
wide, and buildings take
101.802 m2
. These buildings are used for health care facility, office, warehouse, patient room
building, etc.

Stage 2
Formulation
In the previous stage, basic information is explained about the internal and external
conditions related to the RSHS. This information is an important factor as a base for formulating
the performance management system in RSHS. In the formulation stage, the first step is
identifying RSHS’s vision and mission in order to understand whether RSHS comply with the
performance vision and mission criteria (Wibisono, 2007).
2.1 Formulate Vision and Mission
2.1.1 Vision
RSHS’s vision is to be the Indonesian World Class Hospital that shows Excellence in
Services, Education, and Research. To identify and align with the performance framework,
RSHS vision should be analyzed using vision criteria (Wibisono, 2007), which consists of the
following 11 as mentioned in table 2.1.
Table 2.1 Criteria of Great Vision
A great vision should be Yes No
1. is a single sentence Y
2. Inspire-making employees feel comfortable working in an organization N
3. Written in a good and true without empty words N
4. Easily understood by all employees Y
5. Focus on one or two aspects of the performance only. Not too much N
6. The result can be tested Y
7. Developed by the CEO or leader, not by committee N
8. Once a year, be re-examined its validity Y
9. Realistically, said the company's current position and the limited
resources available N
10. Can be changed, so it should not be carved in the stele Y
11. Employees can easily remember without having to look at a cheat sheet
or brochure Y
Score 54.5%

There are five criteria of RSHS’s vision that are not complying with the vision criteria
(Wibisono, 2007), and therefore the total score is 54.5%. There are multiple problems that can be
improved for RSHS’s vision. The first problem is that RSHS is a government hospital; they
should prioritize and focus on regional services, which is West-Java. The second problem is that
RSHS’s vision have three performance indicators, while based on vision criteria no.5 of
(Wibisono, 2007), there should only be one or two performance indicator(s). The third subject to
improve is that the vision of world class leader seems to be unrealistic; while the RSHS is not
even a public listed company which is registered in Indonesian stock exchange.
Based on the previous analysis, the recommendation for RSHS vision is
“To be the Indonesian Regional Class Hospital that shows Excellence in Services”
2.1.2 Mission
Based on the current RSHS website, RSHS has the mission to Held Comprehensive
Health Excellence and to be Integrated with Education and Research. To identify and align with
the performance framework, RSHS mission should be analyzed using the mission criteria
(Wibisono, 2007), which consists of the following 16 criteria, listed in table 2.2.
Table 2.2 Criteria of Great Mission
A great mission should be Yes No
1. Clearly distinguish between your organization with competitors N
2. Defining what organization doing and, more importantly, what is not doing N
3. Identify the key skills and competencies Y
4. Encourage organizations to make better decisions, which involve
opportunities in the future Y
5. Define the product or service without being too narrow N
6. No longer than one paragraph Y
7. Can be clearly understood by employees Y
8. Written in a good and correct sentence without including the blank sentences Y
9. Focus on current conditions and are not mixed / combined with a vision
statement for the future N
10. Reviewed and rewritten if the scope of organizational change Y

Table 2.2 Criteria of Great Mission
A great mission should be Yes No
11. Specific to influence the behavior of individuals within the company Y
12. Reflects the company's real excellence and recognition based on the
strengths and weaknesses of the company N
13. Realistic and achievable Y
14. Flexible enough so that it can respond to changes in the environment Y
15. Referring to the competitive advantage N
16. Includes some logical statements and the values behind the statement, to
evoke the spirit of and facilitating communication within and outside the
organization / company
Y
Score 62.5%
There are six criteria of RSHS’s mission that are not complying with the mission criteria
(Wibisono, 2007), and therefore it has a total score of 62.5%. There are several options to
improve RSHS’s mission analysis, the first is that RSHS is a government hospital, they should
prioritize and focus on public services in West-Java instead of mention Health Excellence. The
second, RSHS’s mission does not focus on their competitive advantages such as nuclear
technology, meanwhile they focus more on the integration of operational processes; education
and research. The hospital should have a core competence in services with advanced technology
to get the more customer satisfaction.
Based on the previous analysis, the recommendation for RSHS mission is
“To Held Comprehensive Service Health Excellence for Public, combined with an
advanced Hospital technology and to be Integrated with Education and Research.”
2.2 Formulate RSHS Strategy
After the organization’s vision and mission is determined, the next stage is the
completion of strategies. It is essential for organizational strategies to be current and relevant
based on EFAS and IFAS results, which are discussed in the previous stage. The strategic plan is
reviewed to determine where they fit within the four Balanced Scorecard perspectives: Learning

and Growth, Internal Processes, Customers, and Financial. In this section, our team made a
Kaplan and Norton’s strategy map. A strategy map represents how the organization creates value
and visually shows the detailed objectives in each of the four perspectives required for success as
figure 2.1 shows. See next page because of landscape mode.

Figure 2.1 Balanced Scorecard Strategy Map

2.3 Performance Management Framework
2.3.1 Performance Variable
Table 2.3 Organisational Results
Perspective Strategy Aspect Variable
Grouping
Performance
Variable Measurement
Organisational
Result
1
Financial
Hospital
cost
recovery
Net revenue increase Net revenue increase compare to previous year
2 Operating profit
margin Operating results as a percent of total operating revenue
3,4 Salary and benefit
expense Total RSHS earned comparing to employee costs
3,4 Debtors Patient debtor days
6,7,8,9
Non
Financial
Health
Excellence
Patient satisfaction
rate
Patients' overall rating of their physician and services by
using survey questionnaire
10,11,15,
17 Patient Treatment Number of patients on the elective surgery waiting list
10,11,15,
16 Patient safety RSHS concern to maximizee patient safety
9 Patient control Patient engagement ratio in decision making process
5,
6,7,8,9,13
,14
Patience loyalty Number of loyal patients interacts with RSHS across
multiple service lines
10,11,15,
17
Emergency
treatment
Percentage of patients treat immediately based on triage
category
6,10,13,1
5
Completeness of
health care type
provided
Number of services that RSHS provided
6 Community quality
image
Community view of RSHS's service quality by using
survey questionnaire or awards
7
Service
Excellence
Patients complaints
and resolution rate
Percentage of number of complaints resolved per total
complaints
20 Regulatory and legal
goals
RSHS concern to government's regulation i.e Gakin's
patients funded by Askesin Prog
12,13 Laboratory service Services related to laboratory activities

Table 2.3 Organisational Result
Perspective Strategy Aspect Variable
Grouping
Performance
Variable Measurement
Organisational
Result
14
Non
Financial
Service
Excellence
Patient related
administrative
failures
Number of incidents/failures related to services
12,21,22
Education
Excellence
Research based
hospital
Number of significant medical and non medical research
held by RSHS
18,19 Model teaching
hospital Role model Hospital especially for teaching method
19 Recognition in
education hospital Number of recognition received by RSHS
Table 2.4 Internal Processes
Perspective Aspect Performance Variable Measurement
Internal
Processes
Innovation
Employees participation in professional
association and community events Percentage of employees participation
Number of research Total number of significant medical and non medical
research held by RSHS
Operation
Processes
Employee productivity Ratio of personel/ hospital stay
Medical error rate Ratio that measure errors in medical treatment
Patient waiting time
Length of time since patient comes and get medical
treatment
Denials time due to no authorization
Emergency waiting time Length of time to get immediate treatment for each
triage category
Completeness of health care type provided Number of services that RSHS provided
Courtesy and respect Care and respect shown by employee
Physicians competency Competency assessment and performance appraisal for
physicans
Nurses responsiveness Responsiveness given by nurses include
communication,empathy and efficiency

Table 2.4 Internal Processes
Perspective Aspect Performance Variable Measurement
Internal
Processes
Operation
Processes
Patient Engagement ratio Engage patient in decision making process
Ratio physicans and nurses Ratio number of medical staff (physicans/nurses) for
each bed
Prudent relationship with pharmaceutical supplier Degree of dependency RSHS for its pharmaceutical
supplier
Staff engagement Engage staff to build cultivate environment of
improvement
Payment process Number of condition discharged but not final billed
Askesin process for Gaskin's patient
Debtors Patient debtor days
Optimized Regional government budget Optimized budget for research and development
Infrastructure effectivity
Effectivity of layout compare to room requirement
Budget for facility maintenance cost
Utilization of parking area
Recognition from patient and independent rating
organization
Number of recognition received by RSHS in providing
services
After
services Customer care services
Percentage of number of complaints resolved per total
complaints
Marketing Marketing effectivity Percentage effectiveness of marketing budget and
benefit
Table 2.5 Resource Availability
Perspective Aspect Performance Variable
Resources
Availability Human Resources
Physician
Nurse and medical staff reliability
Employee participation in R&D
Training and development
Nurse turn over

Table 2.5 Resource Availability
Perspective Aspect Performance Variable
Resources
Availability
Human Resources
Intern from Padjajaran University
Employee Absenteeism
Employee well trained with technology
Nurse productivity
Organisational Resources
Bureaucratic culture
Conventional thingking
Government subsidy
Technology Resources
Nuclear technology
Central administration with SIMRS
Modernized medical technology
2.3.2 Variable Linkage
Variable linkage from the organizational output perspective; internal process and resource capabilities are described on the
next page. From figure 2.6, we can see that increasing the performance of an organization will be done much easier if we already
know which variables contribute to the output of the organization itself.
In order to find the variable linkages, we brainstormed with the fishbone diagram using the secondary data that was already
collected before due to limited research time and bureaucratic research process in RSHS. As a result we found 21 variables in internal
process that may significantly affect the organization’s results. Let us take one example to show a linkage, if RSHS want to improve in
health excellence, then first of all RSHS have to see the current condition of the medical error rate, i.e. number of patient falls in bed.
Moreover, medical process also shows linkage in resource availability like physicians and nurses that need to be improved by RSHS.

Fishbone is a team-brainstorming tool used to identify potential root causes to the problem, which may disturb RSHS to reach
the desired goals. Because of its function it may be referred to as a cause and effect diagram. The main goal why we used the fishbone
diagram is to illustrate the relationship between a given outcome and all the factors that influence that certain outcome. Unfortunately,
our team could not determine the factor that influence outcome more quantitatively since there is no primary data or questionnaire
collected.
Figure 2.2 Fishbone of Hospital Cost Increase Causes

Figure 2.3 Fishbone of Medical Quality Decrease
Figure 2.4 Fishbone of Education not well developed

Figure 2.5 Fishbone of Service and administration failure

Figure 2.6 Variable Linkage

2.3.3 Benchmark
External Benchmark with Indonesian Hospital
Basu and Wright (1007) define benchmarking as a measurement of business practice of a
company against competitor or the industry leader. As RSHS business is in the healthcare and
hospital industry, it is better for RSHS to compare their own performance with the industry
leader. In Indonesia According to Frost & Sullivan, the largest hospital is PT Siloam
International Hospitals.
In order for RSHS to pursue its vision and mission “To be the Indonesian Regional Class
Hospital that Excellence in Services” and “To Held Comprehensive Service Health Excellence
for Public, combine with advanced Hospital technology and Integrated with Education and
Research.”, RSHS needs to benchmark their performance to meet standard of the industry leader,
which in this case are Siloam hospital as private hospital and RSCM as government hospital.
There are some aspects that RSHS could benchmark against Siloam hospital, such as;
infrastructure, technology, service and education as below table
Table 2.18 External Benchmark
Aspect Measurement Siloam RSHS
Infrastructure - Number of hospital 13 1
- Number of bed 3436 1100
Technology
- Number of speciality
service 8 4
Service - Number of employee 3785 3623
- Employee/Bed 1.1 3.3
Education
- Number of collaboration
with medical and nursing
school
13 1
In table above, Siloam has operated 13 hospitals with a total bed of 3436. Meanwhile
RSHS only operate 1 hospital with 1100 number of bed. RSHS has more employee utilization
per bed as they have 3623 employees, which consist of different positions (doctors, nurses, etc.)
that results in that on average 3.3 employees handle 1 bed. Compare with Siloam that run more
effective by having 1.1 employees on average to handle 1 bed. Siloam has 1,178 doctors
(including 930 specialists) and employed 2,607 nurses and other allied health personnel. In the
number of collaboration with medical and nursing school, Siloam has actively collaborate with
suitable local, regional universities and research institute such as Universitas Pelita Harapan

School of Medicine, Mochtar Riady Institute of nanotechnology, Universitas Hasanuddin School
of Medicine and 10 others. Meanwhile RSHS only collaborate with Universitas Pajajaran in
Bandung.
Siloam has twice more than RSHS in speciality services, which includes several
technologies such as cardiology, urology, radiology, orthopedics, fertility treatment,
endocrinology, gastroenterology, cancer and liver. RSHS has nuclear medicine services that
Siloam does not have it in either of their hospitals. Based on figure 2.43, we could identify the
standard that RSHS could measure as their competitive priorities.
Figure 2.43 External Benchmark
We minimize into 3 categories only, as RSHS only have 1 hospital to be operated.
Table 2.19 Standard of Performance
Competitive Priorities Standard of Performance
Employee/Bed Poor Average Excellent
> 3 2 1
Collaboration with
medical and nursing
school
Poor Average Excellent
< 5 5 - 10 > 10
Speciality Service Poor Average Excellent
1 2 - 5 > 5
0
2
4
6
8
10
12
14
#hospital #speciality
service
#collaboration
w/school
#(employee/bed)
Am
ou
nt
Measurement Aspect
Benchmark
Siloam
RSHS

In the employee/bed and collaboration with medical and nursing school, RSHS
performance is poor as RSHS has a score of only 3.3 for employee/bed and they collaboration
only with 1 university. RSHS has average performance in speciality services, by having 4
technologies such as cardiology, urology, radiology and nuclear medicine.
As RSHS is government hospital, it need also to be compared with other government
hospital in Indonesia. For this case, Rumah Sakit Cipto Mangunkusumo (RSCM) in Jakarta is
used as comparison (see table below).
Figure 2.44 Comparisons with RSCM
RSHS and RSCM typically similar in term of number collaboration and number of
hospital, as RSCM collaborate with Universitas Indonesia and they only have one hospital in
Jakarta. RSCM is one point better in the number of speciality services, but due as RSCM
employee number is higher of 3708 people, compare to RSHS of 3623 employee, the ratio of
employee per bed is 3.7, about 0.4 higher.
External Benchmark with Foreign Hospital
Siloam seems to be the best hospital in Indonesia. So for benchmarking, Siloam is 100%
or 1, while other hospitals have a score between 0%-100% or a score between 0 and 1. The
number of beds Siloam has is 3436, divided over 13 hospitals. While the Hasan Sadikin Hospital
0
1
2
3
4
5
6
Am
ou
nt
Measurement Aspect
Comparison with RSCM
RSCM
RSHS

has 1100 beds and there is only 1 hospital. The main difference is that there are government
(public) and private hospitals in Indonesia.
The usual hospitals in the Netherlands are like a medical specialist center that is (partly)
funded by the government. There are university hospitals (for example the UMCG, University
Medical Centre Groningen), general hospitals and specialized hospitals (for example the
Rotterdam Eye Hospital or the Sofia Child hospital, which focuses only on children).
However, when we look at the UMCG, the main hospital in Groningen (where all foreign
students come from) in particular, which is one of the biggest hospitals in the Netherlands, we
can see that they have around 1300 beds and more than 10000 employees.
In Indonesia there seems to be an increase in hospitals, where in the Netherlands the
number of hospitals are actually decreasing. An example is Admiral the Ruyter hospital, which
had 3 full-running hospitals but almost fully shut down one because of the cuts in costs, so the
third hospital is only policlinic, which means that you cannot stay there for the night, since the
hospital is only open during normal opening hours (monday-saturday 9:00 am - 17:00 pm).
Furthermore, benchmarking with the number 1 ranked medical facilitator in the US will
be done. This provider is the Johns Hopkins Hospital. This hospital is part of Johns Hopkins
Medicines, which covers an entire medical enterprise consisting of 4 hospitals, 1 children’s
hospital, 1 medical center and 5 health care and surgery centers and Johns Hopkins Schools such
as the University School of Medicine or University School of Nursing. However, for the
benchmarking we will focus upon the one hospital itself. The hospital opened in 1889 and after
four years opened the School of Medicine, which would lead to the concept of combining
research, teaching and patient care. This model would earn the hospital a national and
international reputation for excellence and discovery.
JHH=Johns Hopkins Hospital
JHM=Johns Hopkins Medicine
Table 2.20 External Benchmark with US Hospital
Aspect Measurement JHH JHM
Medicines
Infrastructure
- Number of hospital 1 6
- Number of bed 1059 2677
Technology - Number of speciality service 15 15

Table 2.20 External Benchmark with US Hospital
Aspect Measurement JHH JHM
Medicines
Service
- Number of employee 9704 19436
- Employee/Bed efficiency rate 9.2 7.3
Education - Number of collaboration with
medical and nursing school 5 5

Stage 3
Implementation
3.1 Measurement / Variable Score Card
RSHS executives must perform the complex task of keeping pace with the dynamic
government healthcare environment such as changing patient volumes, stringent government
policy, employee shortages, etc .To take the informed decisions that help the RSHS maintain a
competitive advantage, the executives need real time actionable information at their finger tips.
Team present our point of view on the information and features hospital that executives need to
help them make informed decisions.
a. Key Result Indicator
Table 3.1 Key Result Indicator
KRI How does it help a executives
Hospital
cost
recovery
Revenue Revenue and expense control would provide real time snap shot of the RSHS
performance
Debtor days would provide insight into how payor are performing and which
one needs re-negotiations
Cost/bed
Employee cost/
Rev
Debtor days
Health
Excellence
Hospital
incidents or
safety
An executive gets a quick snapshot on how the hospital is performing with
regard the quality of care. The drill down will linkage with KPI and PI to
provide insight on factors that need immidiate corrective actions
Patient satisfaction data provide valuable insights into making adjustment in
areas that need improvement
Patient wait time directly influences the patient satisfaction level. Such
insight allows directors to target for improvement areas with higher wait
times. Thus, staff can be added, training conducted to increase efficiency,
and technology support provided for enhanced productivity
Patient
satisfaction
Patient wait
time
Emergency
room treatment
Service
Excellence
Average process
time Average process time and complain resolved have a very high impact to
maintain customer satisfaction. Effort should be made to maintain these
area.
Percentage
complaint rate
resolved
Bed Occupancy
Education
Excellence
Number of
research Number of research and its budget provide details on how RSHS performing
in education sector based on their Vission and mission. This insight will help
an executive to allocate the budget in order to provide the employee involved
in education Budget
Research

b. Key Performance Indicator
In this section, team explore the variables that represent a set of measures focusing on
organizational performance that are the most critical for the current and future success of the
organization :
Table 3.2 Key Performance Indicator
No
Key
Performance
Indicator
Formula Units Source Time
Frame PIC Target
1 Actual
Revenue
(Actual Revenue current
year - Revenue from
previous year) / Revenue
from previous year x 100
Percentage Historical
Data
Update
quartely Finance >20 %
2 Average Total
cost per bed
Total hospital costs/ Total
number of hospital beds Number
Historical
Data
Update
monthly Finance N/A
3
Salary and
benefit
expense
Total Revenue / Total
Employee Cost Percentage
Historical
Data
Update
quartely
Finance &
HR 30%
4 Debtors Patient debtor days Days Historical
Data
Update
monthly Finance 30 days
5
Patient
satisfaction
rate
Patients' overall rating of
their physician and
services
Rate Survey Update
yearly
Operational
& CS 90%
6 Patient
Treatment
a.Number of patients on
the elective surgery*
waiting list who were
treated within the
clinically recommended
timeframe for their
urgency category
Number
Historical
Data
Update
daily
Medical and
Nursing
See
table 3.3
b.Average long of stay Days Update
quartely
6 – 9
days
c.Bed occupancy rate Percentage 85%
d. Death Rate Percentage 1%
7 Patient safety
a. Number of patients get
minor accident (i.e fall
from bed)
Number
Historical
Data
Update
daily
Medical and
Nursing
Zero
accident
b. Number of patient get
moderate accident (i.e
infection, transfusion
reaction)
Number Zero
accident
c. Number of patient get
malpractice Number
Zero
accident
d. Length time responding
to emergency calls from
patient room
Time 10
minutes
8 Patient control
Total patient signing the
surgery contract / total
number of surgery x 100
Percentage Historical
Data
Update
quartely Operational 100%

Table 3.2 Key Performance Indicator
No
Key
Performance
Indicator
Formula Units Source Time
Frame PIC Target
9 Patience loyalty
Number of loyal
patients interacts with
HSGH across
multiple service lines
Number Survey Update
yearly
Operational
& CS
> 1.5
times
10 Emergency
treatment
Number of patients
treat immediately /
Number of patients in
Emergency Treatment
based on triage
category* x 100
Percentage Historical
Data
Update
daily
Medical
and Nursing
See table
3.4
11
Completeness
of health care
type provided
Number of services
that HSGH provided
comparing to Number
of average hospital
provided
Number Benchmark Update
quartely Operational 1
12 Community
quality image
Community view of
HSGH’s service
quality
Rank Survey Update
yearly CS Excellence
13
Patients
complaints and
resolution rate
Number of complaints
resolved per total
complaints based by
complaint category x
100
Percentage Historical
Data
Update
weekly CS 0,9
14 Regulatory and
legal goals
Number of Gakin’s
Patients funded by
Askesis Prog get
services / Number of
Gakin’s Patient x 100
Percentage Historical
Data
Update
monthly Finance 0,99
15 Laboratory
service
Laboratory test
accuracy / Desired
Test accuracy x 100
Percentage Historical
Data
Update
quartely
Medical
and Nursing 0,99
16 Administrative
process time
Average patient wait
due to administration
process
Number Historical
Data
Update
daily Operational 20 minutes
17
Patient related
administrative
failures
Number of
incidents/failures
related to services
based on failures
category
Number Historical
Data
Update
weekly Operational 0,2
18 Research based
hospital
Number of significant
medical and non
medical research held
by HSGH
Number Research Update
yearly DIKLAT > 5 / years
19 Model teaching
hospital
Number of
collaboration with
medical and nursing
school
Number Partnership Update
yearly DIKLAT > 1

Table 3.2 Key Performance Indicator
No Key Performance
Indicator Formula Units Source
Time
Frame PIC Target
20 Recognition in
education hospital
Number of recognition
received by HSGH Number Award
Update
yearly DIKLAT
>5 /
years
*Table 3.3 KPI for Elective Surgery
Key
Performance
Indicator
Category Formula Units Target
Elective
Surgery
Cat 1 admit % of urgency category 1 elective surgery patients admitted
within 30 days Percentage 100%
Cat 2 admit % of urgency category 2 elective surgery patients admitted
within 90 days Percentage 80%
Cat 3 admit % of urgency category 2 elective surgery patients admitted
within 365 days Percentage 95%
Number of
patients on the
elective surgery
waiting list
% of triage category minimal seen within clinically
recommended times Number N/A
*Table 3.4 KPI for Emergency Room
Key
Performance
Indicator
Category Formula Units Target
Emergency
Care
Bypass % of operating time on hospital bypass Percentage 3%
Red Triage % of triage category 1 patients seen immediately Percentage 100%
Yellow Triage % of triage category delayed seen within clinically
recommended times Percentage 80%
Green Triage % of triage category minimal seen within clinically
recommended times Percentage 80%
Black Triage % of triage category expextant seen with clinically
treatment Percentage 100%
24 hours Number of patients with a length of stay in the ER greater
than 24 hours Number 0
3.2 Evaluation
a. Current Condition
With purpose for evaluation , we evaluated RSHS’s effort by using the Malcolm Baldrige
National Quality Award. In this framework we conducted a self-assessment from a business
results perspective based on data of 2006 up to 2008.

1. Product Outcomes
How does the level and trend looks like, base on measurement and key performance indicator
that are important for a customer?
a. Outpatient visits, figure 2.7:
Outpatient numbers in year 2007 increase with 26,5% compared to 2006. In 2008 it increased
with 34,6% compared to 2007, but if it is compared to the yearly target in 2008, it was decreased
with 1,7%.
Figure 3.1 Outpatient trend from year 2006 to 2008
b. Outpatient visits based on payments, see table 2.6:
Visitor for outpatient were categorized into six types based on how visitors made the payment to
the RSHS hospital. The type of patient that is increasing is public, askes (government insurance
protected) and honorary. Meanwhile the decreasing group of patients are the ones that are not
capable to pay, the contractor and the foundation.
Table 3.5 Outpatient visits based on their payment
No
Type of
Payment 2007 2008 %
1 Public 118367 146215 24%
2 Askes 213581 220740 3%
3 Honorary 432 689 59%
4 Not capable 155597 142781 -8%

Table 3.5 Outpatient visits based on their payment
No
Type of
Payment 2007 2008 %
5 Contractor 19560 15376 -21%
6 Foundation 2560 1970 -23%
Total 510097 527771 3%
c. Number of outpatient referrals in percentages, figure 2.8:
Number of outpatient referrals in year 2007 and 2008 were above RSHS’s targets, which were
47,8% and 26,03% more, respectively.
Figure 3.2 Number of Outpatient Referrals
d. Polyclinic Specialist and Medical Check Up visits, see figure 2.9 for more information:
Number of Polyclinic specialist has increase to 36,34% and Medical Check Up (MCU) visits
increased to 28,64%.
Figure 3.3 Number of Polyclinic Specialist and MCU visit
41 43 45 48 50 60
55
0
20
40
60
80
2007 2008 2009 2010 2011
Ou
tpati
ent
Ref
erra
ls
Year
Number of Outpatient Referrals
Target
Actual
26084 27032
4281 5507
0
10000
20000
30000
2007 2008
Vis
its
Year
Polyclinic and MCU visitor
Polyclinic Specialist
Medical Check Up

e. Emergency patients, figure 2.10:
Number of emergency patients in 2008 decreased to 5,38% compared to 2007 and if compared to
the target it a decrease of 25,57%.
Figure 3.4 Number of Emergency Patient
f. Bed Occupancy Rate (BOR), figure 2.11:
Bed Occupancy Rate (BOR) from year 2006 to 2008 was within the ideal BOR target, which
currently is around 70%. Ideal upper BOR is 85% and ideal bottom BOR is 60%.
Figure 3.5 Bed Occupancy Rates (BOR) from year 2006 to 2008
g. Average Long of Stay (ALOS), for more information see figure 2.12:
Average Long of Stay (ALOS) overall seen is already between the ideal targets, in actual it was 7
to 8 days (Ideal target is 6-9 days). Meanwhile for ALOS in class 3, it has an average of 11 days
of stay.
44500 50003
61963 45350 48678 46059
0
20000
40000
60000
80000
2006 2007 2008 Nu
mb
er o
f P
ati
ent
Year
Emergency Patient
Target
Actual
80 82
78 78
74 73
65
70
75
80
85
2006 2007 2008
BO
R (
%)
Year
Bed Occupancy Rate
Target
Actual

Figure 3.6 Average Long of Stay (ALOS) from year 2006 to 2008
h. Turn Over Interval (TOI), figure 2.13:
Turn Over Interval (TOI) ideally should be between 1 to 3 days. In 2008, TOR increased from
previously 2,47 days to 2,51 days. However, this is still below the target of 2,87 days.
Figure 3.7 Turn Over Interval (TOI) from year 2007 to 2008
i. Gross Date Rate (GDR), figure 2.14 provides us more information:
Gross Date Rate in 2007 and 2008 was above ideal standards of 4,5%.
Figure 3.8 Gross Date Rate (GDR) from year 2007 to 2008
11 11 10 8 8 7
0
5
10
15
2006 2007 2008 D
ay
s
Year
Average Long of Stay
ALOS class 3
Actual
2,87 2,87
2,47 2,51
2,00
2,50
3,00
2007 2008
Days
Year
Turn Over Interval
Target
Actual
4,50 4,50
4,90 5,10
4,00
4,50
5,00
5,50
2007 2008
Per
cen
tag
e (
%)
Year
Gross Date Rate
Ideal
Actual

j. Delivery Time in Emergency Room, see figure 2.15:
Delivery time in Emergency Room for year 2008 was 10.5 hours, which was below the target of
10.53 hours.
Figure 3.9 Delivery Time for Emergency Room from year 2007 to 2008
k. Net Death Rate (NDR), figure 2.16:
Net Death Rate (NDR) was above standard for year 2007 as well as for year 2008.
Figure 3.10 Net Death Rate from year 2007 to 2008
l. Surgery Service, also figure 2.17:
Number of surgeries done in 2008 increased to 7,45% compared to 2007 and almost met the
targets of 2008.
Figure 3.11 Number of Surgery from year 2007 to 2008
12,00 10,53 9,96 7,59 6,00 11,33 10,50
0,00
20,00
2007 2008 2009 2010 2011
Ho
urs
Year
Delivery Time for Emergency Room
Target
Actual
4,28 3,98 3,68 3,34 3,00 4,12 4,43
2,50 2,50 2,50 2,50 2,50
0,00
5,00
2007 2008 2009 2010 2011
Rate
Year
Net Death Rate
Target
Actual
Standard
14417 15480 15320 17100 18000
14352 15421
0
10000
20000
2007 2008 2009 2010 2011
Nu
mb
er o
f S
urg
ery
Year
Surgery Service
Target
Actual

m. Hemodialysis Action, showed in figure 2.18:
Number of Hemodialysis actions increased every year with 7,34% and 8,29% for year 2007 and
2008 respectively, which was an increase of 5,11% from the RSHS target.
Figure 3.12 Number of Hemodialysis Action from year 2006 to 2008
n. Radiology and Radiotherapy Services, shown in figure 2.19:
Number of radiology services decreased in 2008 with 4,18% and it was 24,02% below RSHS’s
target for that year. Meanwhile radiotherapy service was increasing continuously 55,25% and
7,59% over the year 2007 and 2008 compared to the previous year.
Figure 3.13 Number of Radiology and Radiotherapy Service from year 2006 to 2008
o. Pathology Anatomy Service, figure 2.20:
Number of pathology anatomy service has an increasing trend from year 2006 to 2008
continuously. However, it was still 2,63% below year 2008’s target.
11930 10788 11580 12540
8000 10000 12000 14000
2006 2007 2008
Nu
mb
er o
f
Act
ion
s
Year
Hemodialysis Action
Target
Actual
129815 156421
94652 124035 118849
16407 25471 27403
0
50000
100000
150000
200000
2006 2007 2008
Nu
mb
er o
f S
ervic
es
Year
Radiology and Radiotherapy Service
Target Radiology
Radiology
Radiotherapy

Figure 3.14 Number of Pathology Anatomy Service from year 2006 to 2008
p. Examination of Clinical Psychology
Number of Clinical Pathology Examination of 6.86% below target in 2008
Figure 3.15. Number of Anatomy Pathology Examination 2006 – 2008
q. Forensic Medicine
Number of bodies received Forensic Medicine in 2008 has decreased by 0.12% and 4.05% below
the 2008 target.
Figure 3.16. Number of Corpses Examination 2006 – 2008
r. Nuclear Medicine
Number of Nuclear Medicine examinations from 2006 to 2008 successively decreased
6.03% and increased 6.11% but 14.78% below the 2007 and 0.07% below the 2008 target.
9813 12036
9289 10954 11719
0
5000
10000
15000
2006 2007 2008
Nu
mb
er o
f S
erv
ices
Year
Pathology Anatomy Service
Target
Actual

Figure 3.17 Number of Nuclear Medicine Examination 2006 – 2008
s. Pharmacy
Number of prescription items were served in 2006 and 2008 increased 17.45% and 4.62%
and 2.41% above the target in 2008.
Figure 3.18. Number of prescription items were served 2006 – 2008
t. Assisted Reproductive Technology
Number of IVF examination in 2007 decreased 18.17% and increased 7.25% in 2008
Figure 3.19. Number of examinations with assisted reproductive technology 2006 – 2008
u. Surgery Room Utilization
In 2008 the surgery room utilization was 15.24% above the target of Strategic Plan

Figure 3.20 . The surgery room utilization compared to the target of Strategic Plan
How do these results compare with the performance of your competitors and other companies
that offer similar products?
Performance comparisons with competitors yet done.
2. Customer Outcomes
a. Focus Results to Customers
How’s it like the current level and trend of the main indicators of the size or customer
satisfaction and dissatisfaction?
1. Based on the results of measurements obtained in 2009 IKM data is as follows:
Table 3.6. Customer Satisfaction based on IKM Measurement on 2009
Work Unit
Performance Services Unit
Very
Bad Not Good Good Very Good
25 -
43,75
43,76 -
62,50
62,51 -
81,25
81,26 -
100,00
IRJ 74,05
IGD 71,06
OBG 75,95
IPD 75,28
Anak 74,53
Surgery 76,12

2. Customer satisfaction per room on 2008
Highest patient satisfaction in Intensive Room, High Care and Child Care and the lowest in the
RIK Room and Orchids Room
Figure 3.21. Patient Satisfaction Per Room in 2008
3. SMS Hot Line
SMS is 69.7% which followed the rest in the form of suggestions and awards
Figure 3.22. Number of SMS Hot Line per month
How does this compare with the results of the customer satisfaction level competitors and other
companies that offer similar products?
RSHS for this item has not yet implemented.

3. Financial and Market Outcomes
a. Financial Result
How does the current level and trend of size or financial key indicators including measures of
aggregate returns, activity / financial activities (financial viability) or the performance of the
budget?
Indicator, target and financial realisation are:
Table 3.7. Financial Indicator 2007 - 2008
Indicator 2007 2008
Target Realisation Target Realisation
LIKUIDITY
Cash Ratio (%) 98.62 364.92 109.09 39.58
Acid Test Ratio (Quick Ratio) 290.02 979.3 77.08 35.2
Current Ratio (%) 423.08 1221.14 436.36 284.08
Net Working Capital of Sales 7.9 27.2 9.1 32.47
RATIO LEVERAGE
Debt to Total asset (%) 1.49 1.74 1.51 9.13
RATIO SOLVABILITY
Solvability (%) 6730.8 5731.5 6006.47 194.69
Debt to Equity Ratio (%) 1.5 1.78 1.68 10.05
RATIO RENTABILITY
Gross Profit Margin (%) 2.92 2.5 -4.56 -3.98
Base Cost Productivity (Base Pro) (%) 91.46 93.19 98.3 99.25
Net Profit Margin (%) 2.92 2.5 -4.56 -3.98
Net Return on Investment(%) 2.19 1.89 -3.64 -3.03
Return on Capital Employed (%) 2.9 1.89 -50.12 -3.03
Net Return on Equity (%) 0.22 1.92 -3.7 3.34
Based on the level of health in 2007 and 2008, RSHS are in the AA category or
HEALTHY. Total score of 2008 decreased 3.2 compared to 2007 as shown in Table 2:9 below:
Table 3.8. Health Rate of RSHS 2007 – 2008
No Performance Indicator Value
2007 2008
1 Finance 17.5 16.1
2 Operational 34.65 32.35
3 Quality and Benefits 32.5 33
Total 84.65 81.45

Based on graph below, RSHS actual revenue compared with Renstra target show a good
signal within period shown ,however RSHS revenue in 2008 decreased about 43% than previous
year. This is the case when RSHS can control the cost until 40,3% of cost in 2007, it shows in
figures below :
b. Market Result
RSHS using indicator number of new health service provided to the community in order
to determine the level and trend from size and indicator of health hospitality market, including
market share, positioning in market, market growth , and market conditions to penentrate the
new market.
In 2007, RSHS conform Renstra target with introduce five new health service in on year,
but this number decreased in 2008
4. Workforce Outcomes
In order to increase the employee satisfaction for RSHS’s employee, some policies of
workforce that have been implemented by RSHS are :
Figure 3.23 Actual Revenue compared with
Renstra Target
Figure 3.24 Cost Control compared with
Renstra Target
Figure 3.25 Number of New Health Service

Table 3.9 Workforce Result
Description 2007 2008
Target Actual Target Actual
DUPAK settlement 2370 2551 2401 2552
SK PAK completion 325 340 330 407
Promotion proposal 429 429 398 364
Realization promotion 414 380 419 388
Salary increase periodically 1168 1168 1180 1212
Improving civil servants status 139 109 228 82
ID Card production 619 668 778 606
Reward from Presiden and health ministry 255 222 510 467
Pension 82 91
Recruitment for non civil servants 83 84
Recruitment for civil servant candidates 77 77
a. Recruitment and Promotion
In 2007 was a year when RSHS hired the highest number of employee through
promotion from employee honorers become civil servant candidates, while nurses, computer
operator, medical record staff, parmacist assistant and accounting staff comes from employee
contract.
b. Employee Transfer
Employee transfer commonly due to employees follow the placement of their spouse.
Figure 3.27 Number of Employee Transfer
Figure 3.26 Recruitment
and Promotion

c.Employee Sanction
Employee guidance because of santions given in form of verbal and writtern warnings
Figure 3.28 Number of Employee due to Saction
d. Accumlated Salary Payment
Accumlated salary payment are below the target due to constraints of new regulations
Table 3.10 Accumulated Salary Payment
Accumlated Salary Type 2008
Remarks Target Actual
Adjustment of functional
position 1075 222
Remains 79,34% from target, need to
complete the document ie Inpassion decision
letter and SPMT conform with allowance
Promotions 896 422 Remains 53% from target, need to adjust
based on decision letter and base salary
Salary adjustment 2068 2068 As target
e. Employee Composition based on Education
Table 3.11 Employee Composition based on Education
Education 2007 2008
Target Actual Target Actual
Formal Education
Diploma Nursing 33 0 30 29
Midwifery Diploma 3 3 3 3
Others Diplome 0 0 0 5
Analyst& Radiotherapy scholars 0 0 0 8
Health scholars 0 0 2 1
Midwifery scholars 0 0 1 0
Bachelor of Nursing 4 4 8 10

Table 3.11 Employee Composition based on Education
Education 2007 2008
Target Actual Target Actual
Others Bachelor 0 0 0 10
Master of Nursing 1 0 2 2
Master of Management 0 0 3 2
Others Master 0 0 3 4
Master of Specialization of medical 0 0 2 2
Doctoral 0 0 1 1
Certificate of adjustment 6 4 4 1
Pre-service, Category 1, 2 and 3 111 28 0 0
Total 158 39 59 78
f. Employee Training and Development
Training and development for employee in 2007 reached 42.5% of the target, while the
year 2008 was 9.25% above the target. For clinical training in 2007 was not specified a target
while in 2008 it reached 59.64% above the target. The setting of target in 2008 better than the
target of 2007. Education and training tables are listed in the table below
Table 3.12 Employee Training and Development
Training and Development
Activities
2007 2008
Target Actual Target Actual
RSHS Training
a Management 635 participants 270 Participants 530 participants 579 participants
b Clinical - 306 Participants 425 participants 667 participants
Research 1 title - 11 titles 9 titles
Research Socialization - - 11 titles 9 titles
Library 1 Package - - -
Seminar and Workshop - - - -
a in-house 12 activities 7 Activities - 185 participants
b out-house (domestic and abroad)
- - 80 participants
Training outside RSHS - - -
a Management 1 participant - 44 participants 16 participants
b Clinical - - 21 participants 4 participants
Seminar and Workshop - - 45 participants 20 participants
a Case mix - - - -
b IRSPI - - - -
c PERSI - - - -
Comparative study - - 36 participants 12 participants

g. Accidents
2007: 22 peoples got needle stick
2008: 5 peoples got needle stick
h. Health checks
2006: all of the employees
2007: staff of nuclear specialist doctor, radiologic, pharmacy, nutrists, and laundry
2008: medical check-up for all of the employees
i. K3 training : 100 peoples/year based on target
Fire-accident training: 100 peoples/year based on target
Yearly inspection tools by fire department
Fire-simulation: from 2004 to 2008, including 300 employees
5. Process Outcomes
Forecasting the current level and trend at this period from the size and important
performance indicator work system, including the readiness of work system and work
environment in emergency moment.
a. Nutrition services
The number of patient’s portion is decreasing to 0,6%, the doctor increasing 23%, and
employee increasing 17,6%
Figure 3.29 nutrition services for the patient, doctor, and employee
0
200000
400000
600000
800000
1000000
2007 2008
834071 879071
92271 113488
258.192 303527
Patient
Doctor
Employee

b. Food budgets for the year 2008 increasing at 23,22% compared to 2007. 77,93% percent of the
food are distributed for the patient.
c. Nutrition care service
Nutrition care service hospitalization were increases in a row from 52.95% to 22.3% ,
and for outpatient decrease 4,28% and increases 7,55%
Figure 3.30 Number of Nutrition Care Service
d. Survey of customer satisfaction to food quality and food acceptance shows 86,44% of
respondents says that the food quality is good, and 42,22% respondents says that the food can be
spent off.
e. Maintenance of infrastructure and equipment
In 2007, 83.02% numbers of proposals were realized, and in 2008 increases to 89,06%.
Compared to 2007 numbers of maintenance proposals were increased to 19,46%.
Figure 3.31 Number of Infrastructure and Maintenance
2381 2279 2451
8004
12242
14792
0
5000
10000
15000
20000
2006 2007 2008
Outpatient
Hospitalization
0
1000
2000
3000
4000
2007 2008
3145
3757
2611
3346
proposal
realization

f. Usage of electricity and telephone
The level of electricity usage is increases 22,2%, but the usage of telephone is decrease at
16,27%
Figure 3.32 Level of electricity & telephone usage
g. The usage of diesel and water
The level of diesel usage is increases at 13,45%, and water is increases at 19,54%
Figure 3.33 level of diesel and water usage
h. The performance valuation of cleaning service
The performance of cleaning service staff from 2007 to 2008 was relatively stable. Since
the pathology building (IPD) started the operation in 2008, there’s no data collected in 2007
Figure 3.34 Performance of cleaning service 2007-2008
0
2000
4000
6000
2007 2008
4522,4 4622,9
189,3 158,5
Electricity
Telephone
0
500000
Diesel (Lt) Water (m3)
237949 269985 385579
460922
2007
2008
0
20
40
60
80
100
Old EU-COT IPD RIK IRJ
79,79 74,9 73,12 75,58 83,4
76,35 79,3
64,14
80,59
2007
2008

i. Control level of wild animals
The controlling process of wild animal routinely per month with the following data:
Table 3.13 data of wild animals controlled in 2007-2008
activity standard 2007 2008
Wiggler 0 0 0
Cats 115 27
Roach 4273 2523
j.Measurement of environment quality
The water quality sourced from PDAM, commonly were under the determined threshold,
whereas the environmental quality were at the bottom of the determined threshold. Table 3.53
shows the data of environment quality
Table 3.14 measurement of environment quality 2007-2008
activity standard 2007 2008
Clean water Once a month 9 times, 72
points, fulfill the
NAB
12 times, 108
point, fulfill the
NAB
Environment Quality:
- Noise
- Temperature
- Humidity
- Lightning
- Dusty
- Number of bacterium
< 45 Dba
22 - 26 C
35 – 60%
100 – 200 lux
1200 CFU/m3
50 mcg
100% > Dba
17.46% > NAB
48.57% > NAB
51.52% > NAB
5.71% > NAB
40% > NAB
Swab of eating utensils Once a month 9 times, 19 points
< NAB
12 times, 36
points < NAB
Waste of medic 2500 kg/month 63933 kg 62368 Kg
Waste of non-medic 3642 m3 3606 m3
Quality of wasting water 10 times, < NAB

k. Linen
In 2008 the production of linen were decreases because were forced to allocate in reparation.
Figure 3.35 Laundry performance 2007-2008
l. The development of SIMRS phase V according to Master Plan SIMRS (%)
Figure 3.36 Development of SIMRS phase V 2007-2008
9958
13642
9741
6395
9209
16071
364
0
2000
4000
6000
8000
10000
12000
14000
16000
18000
2006 2007 2008
linen
reparation
depreciation
20
40
60
80
100
25
38
0
20
40
60
80
100
120
2007 2008 2009 2010 2011
target
realization

m. Procurement
Procurement conducted by RSHS were operated from RBA and DIPA
Figure 3.37 Procurement financed by RBA and DIPA
n. Income from ambulance were increased 113.03% compared than in 2007
6. Leadership and Social Responsibility Outcomes
6.1 The result of important indicator from strategy achievement and organization plan work
a. Arranging bed utilization and improving the composition of the third class beds. Bed
composition improvement from 962 to 1100 with composition shown in table below:
Table 3.15. Bed Capacity per Treatment Class
Treatment Class Bed Capacity %
VIP Class 121 11,00
First Class 107 9,73
Second Class 137 12,45
Third Class 650 59,09
Intensive Care Unit 31 2,82
High Care Unit 41 3,73
Isolation Room 13 1,18
Total 1100 100
In addition it is also being done Gakin Building construction that has reached the final stage
with a capacity of 440 beds.
0
10
20
30
40
50
60
70
2007 2008
RBA Gd Gakin
RBA Routine
DIPA

b. NDR lowered from 4.28% to 3.0% with the strategy of increasing professionalism and
integrity through education and training along with maintenance and development of SPA in
particular special care unit.
Education and training are listed in Table 2.12 and 2.13 , while for the maintenance and
development of the SPA:
- Realization of the proposed maintenance increased from 83.02% to 89.06%
- Total maintenance costs increased 12.6%
- Total maintenance cost is 2.88% of the total revenue
c. ALOS lowering surgical services from 13 days to 8 days to fix the strategy of preoperative
and administrative procedures through the development of pre-surgical clinical and
administrative system improvements. The results of this are:
- Enforcement of operating standards Installation Central Surgical
- The implementation of guidelines for implementation of the central sterilization of
operating room
- Enforcement of quality of nursing care
- Operating room utilization increased from 2.55 to 2.69 over the target set. (Figure 3.29)
- Number of surgeries increased by 7.45% compared to 2007
d. Lowering the delivery time of 13 hours in the ER to 6 hours with strategies to increase the
professionalism and integrity as well as improve the management of services in the ED
through education, training and professional development as well as the improvement of
coordination arrangement service management system in the ER. The results of this are:
- Delivery time in the ER has decreased, ie 11.33 hours in 2007 to 10.5 hours in 2008
- In 2008, all employees have been trained PPGD ER
6.2 The result of significant size or indicators of ethical behavior and stakeholder confidence in
senior leadership and governance of the organization
In 2008, RSHS expressed as:
a. Hospital with the title 'Accredited Full Full Rate' for the second time with 16 services and
include patient safety program.

b. Expressed as a hospital that provides excellent service to its customers. It is characterized by
Prima Citra exerts from the President.
c. Pilot Project bridging program with PT Askes.
6.3 The result of an important indicator of the size or customer behavior?
For this item, the indicators are:
- Informed consent incomplete
- Negligence or fault of the clerk of the patient information
- Number misconduct or drug delivery
- Public complaints against the services provided RSHS associated with mal
practice
For it can not be obtained because the data is confidential.
6.4 The result of an important indicator of the size or the fulfillment of social responsibility and
organizational support to the main community
Indicators of compliance responsibilities to the community:
a. The establishment of Hospital Patient Safety Committee as a major form of support to the
patient and the hospital.
b. Print and electronic media visits typically served greatly influenced by the cases that are
being handled or health news that are happening in the community crowded. The mass
media visits that occurred in 2007 and 2008 are:
Table 2.16 Print and Electronic Media visits in 2007 and 2008
Uraian 2007 2008
Print Media 615 419
Electronic Media
and Radio 1193 498
Radio Media 1808 917
c. Community outreach programs conducted by extension in the internal part RSHS was 390
times in 2007 and 400 times in 2008. A similar extension activities carried out separately
by uni-related units and integrated yet unreported.

d. Social Activity program, conducted in 2007 RSHS is 10 times and in 2008 as many as 9
times. Including not including the amount of social assistance and disaster conducted by
units working separately and never reported to the Public Relations Section.
b. Process Modification
To achieve the target emergency department’s KPI, team employed DMAIC
methodology and engaged key stakeholders throughout the hospital, including ED physicians,
ED nursing, unit nursing, Transportation and nurse Administrative section.
Team only focus on improving emergency department (ED) process after define and
measure why the variable of patient satisfaction in emergency department is below 60 %. This
fact was the impetus to examine how to reduce the time between an admission order and the time
the patient was transported to get immidiate treatment. Moreove low of satisfaction rate resulting
from misdiagnosis and a delay in physician intervention. By using Lean Six Sigma, Hasan
Sadikan can improve patient satisfaction as target, reduced emergency department length of
service, and recovered cost.
Figure 3.38 Emergency Process (Current Process)

Figure 3.39 Emergency Process (Proposed)
Based on figure 3.39 , there are some improvement for new triage system :
1. Quick Registration Process
2. Medical Doctor is the 1st person a patient sees
3. Physician, Registration Associate and Nurse assess patient together in triage area
4. Ability to discharge non-emergent patients from triage
5. Bed- side registration
6. Registration is now back end of process
By changing the emergency process in ED it is expected that new process minimize wait
times to treatment, elimited initial waiting since registration completed at bedside. As the result,
new conditions could lead better services to patient and improve patient satisfaction scores. In
service excellence perspective result, new process can increase volume 10 – 12%.

3.3 Diagnosis
a. Training
Training at RSHS needs to be provided include a general understanding of the issue
management system with all the attributes that related to the hospital, especially with the regard
of handling issue performance management systems, and an introduction to how to use the
application management issue itself. Special training will be given to the Head of Hospital which
is the highest decision-maker in the system, and general training will be given to the employees
who will probably be PL and PIC on project management issues. At the training, participants
will be given a lesson on how to use the management system issues .
b. Allocation of resources
Issue management system is a tool for RSHS to do their job. As for daily routine work –
day employees including doctor, nurse, and other staff have the pile of work to be done. For the
existence of this system does not interfere with the existing jobs, the allocation of time to get
used to the employees in the use is depending on their work hours per week. While that will be
responsible for measuring, analyzing, and evaluating fund performance results is the head of the
RSHS to make a decision.
3.4 Display
a. Reporting Key Results Indicators in a “Dashboard” to the board
SWOT Analysis of Current Balance Score Card RSHS
Strength Weaknesses
1. Trend highlighted against monthly, quarterly,
yearly performance
2. Represented by departement
3. Report and chart should be easy to e-mail and
print.
4. Capability to access data feeds from other devices
5. Anytime anywhere access by allowing users to
access screens over mobile
1. Hard to evaluate and make program focus
strategy from the problem of RSHS to have
more improvement next year
2. KPIs that available to evaluate less than 5
measurement
3. Only indicator from balance score card that
using for the performance tools

Opportunities Threats
Update the performance tools that can be integrated
with the system and more capable for RSHS needed
New system cannot be applied immediately
because of HR capability and cost to re-update
the performance tools
The dashboard as shown in figures below will help RSHS dramatically accelerate the
speed and quality decision making cycle
Figure 3.40 Current Dashboard BSC RSHS
b. IPMS Tools Suggested
Based on the new vision and mision, we can build the variable measurement for each
department, so we can have the problem that needed to improve by RSHS through program
focus strategy by having a good synergy in each department. To create this tools, we
combine KPI Measurement from BSC, IPMS, MBNQA as potrait, and Six Sigma.
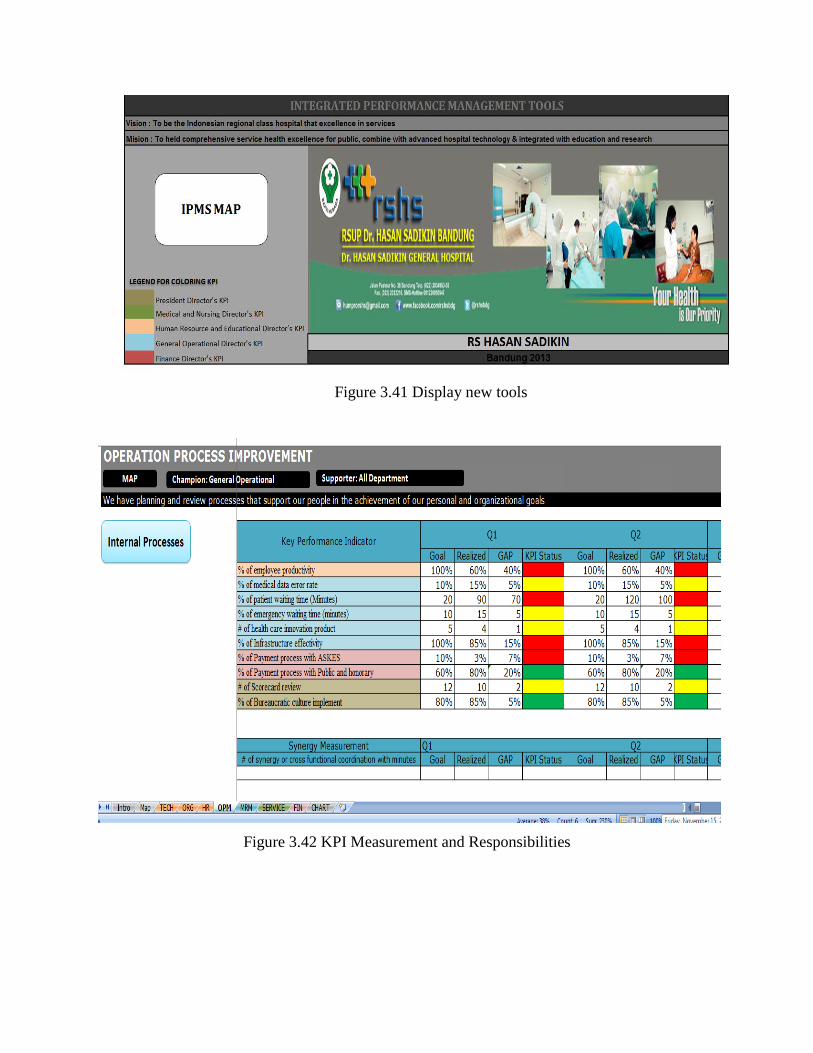
Figure 3.41 Display new tools
Figure 3.42 KPI Measurement and Responsibilities

Figure 3.43 Result IPMS Map for RSHS
Figure 3.44 RSHS Organizational Output
Based on the result, RSHS still needed improvement on operational and high quality of
their facilities and hospitality to achieve higher organizational result in finance and non-finance
such as, patient satisfaction.

Stage 4
Review and Update
In developing Performance Management System, there are four principles that could be use as a
foundation guideline; (1) Partnership, (2) Empowerment, (3) Integrated performance
improvement and (4) Independent. Here are the analyses for each principle, base on their
previous or existing condition and then compare with proposed condition
No. Principles Previous or Existing Proposed
1. Partnership Only within RSHS
organization
Linkage between
RSHS, customer
and supplier
2. Empowerment Management level Management top
down to employee
level
3. Integrated performance improvement Administration division Linkage between
division
4. Independent Internal RSHS Outside RSHS (use
consultant)
After understanding the four principles, there are five rules that need to be highlighted in
formulation of performance management system
No. Rules Previous Proposed
1. Ease of understanding ISO 9001:2008 Integrated
Performance
Management System
2. Long term orientation Mainly focus on financial
performance
Performance on
finance, customers,
internal process and
learning & growth
3. Time base Yearly to quarterly Weekly to real time
(online)
4. Focus in continuous improvement Internal benchmark External benchmark
5. Quantitative approach Performance variable related
mostly on financial aspect
side
Detail performance
variable and KPI