Inferring Skill from Tests of Programming Performance: Combining Time and Quality
10
Inferring Skill from Tests of Programming Performance: Combining Time and Quality Gunnar R. Bergersen Department of Informatics, University of Oslo and Simula Research Laboratory, Norway [email protected] Jo E. Hannay Simula Research Laboratory, P.O. Box 134, NO-1325 Lysaker, Norway [email protected] Dag I. K. Sjøberg Department of Informatics, University of Oslo, P.O. Box 1080, NO-0316 Oslo, Norway [email protected] Tore Dybå Department of Informatics, University of Oslo and SINTEF, Norway [email protected] Amela Karahasanović SINTEF and Department of Informatics, University of Oslo P.O. Box 124 Blindern, NO-0314 Oslo, Norway [email protected] Abstract—The skills of software developers are crucial to the success of software projects. Also, controlling for individual differences is important when studying the general effect of a method or a tool. However, the way skill is determined in industry and research settings is often ad hoc or based on unvalidated methods. According to established test theory, validated tests of skill should infer skill levels from well- defined performance measures on multiple small, representative tasks. We show how time and quality can be meaningfully combined to a well-defined measure of small-task performance, and hence a measure of programming skill. Our results show significant and positive correlations between our proposed measures of skill and variables such as seniority or self-evaluated expertise. These methods for combining time and quality are a promising first step to measuring programming skill in industry and research settings. Programming; skill; performance; time; quality; productivity I. INTRODUCTION The skills of individual software developers may have a dramatic impact on the success of software projects. The large differences in programming performance, reported in the late 1960s, indicated performance differences of orders of magnitude and more. Although more recent analysis [32] and studies [13] indicate somewhat more conservative estimates, companies that succeed in hiring the best people will nevertheless achieve great economic and competitive benefits [17,34,37]. Individual differences in skill also affect the outcome of empirical studies in software engineering. When evaluating alternative processes, methods, tools or other technologies, skill levels may temper with the relative effect of using a specific alternative. For example, in an experiment on the effect of a centralized versus delegated control style, the purportedly most skilled developers performed better on the delegated control style than on the centralized one, while the less skilled developers performed better on the centralized one than on the delegated one [5]. In another experiment, skill levels had a moderating effect on the benefits of pair programming [4]. However, determining the skill level of software developers is far from trivial. In the work life, there are common-sense guidelines from experienced practitioners on how to distinguish the good from the bad [37]. But there seems to be consensus that this crucial human resource management task remains hard. Often, job recruitment personnel use tests that purport to measure a variety of traits such as general cognitive abilities (intelligence), work and life values, interests, as well as personality [20] to predict job performance [11]. Research has, however, established that work sample tests in combination with General Mental Ability (GMA) are among the best predictors of job performance [34]. GMA is a general aspect of intelligence and is best suited for predicting performance on entry-level jobs or job-training situations. This stands in contrast to work sample tests that are task specific and are integrated in the concept of job skill [15]. Although the predictive validity of standardized work samples exceed that of GMA alone [11], these predictors seem to yield the best results when they are combined [34]. In the context of empirical studies in software engineering, the notion of programming skill is generally not well founded. This has led to studies that failed in adequately correcting for bias in quasi-experimental studies [23]. Often the more general concept of programming expertise is used, with little validation. For example, in a recent study [20], we conceptualized programming expertise as the level of seniority (junior, intermediate, senior) of the individual programmer as set by their superior manager. While bearing some relevance to the consultancy market, this conceptuali- zation is not sufficient to capture the skill of individual programmers. The concepts of expertise and skill are operationalized in vicarious ways in also other domains; see [22] for a survey of operationalizations in IT management. Whether the purpose of determining programming skill is to recruit the best developers or to assess the usefulness of a software engineering technology relative to levels of skill, This is a preprint version of: Bergersen, G. R., Hannay, J. E., Sjøberg, D. I. K., Dybå, T., & Karahasanovic, A. (2011). Inferring skill from tests of programming performance: Combining quality and time. In 3rd IEEE International Symposium on Empirical Software Engineering and Measurement (ESEM'2011) (pp. 305-314). Banff, Canada: IEEE Computer Society. doi:10.1109/ESEM.2011.39 Accepted 2011-May-15 Not suitable for citation Copyright IEEE 2011
Transcript of Inferring Skill from Tests of Programming Performance: Combining Time and Quality

Inferring Skill from Tests of Programming Performance: Combining Time and Quality
Gunnar R. Bergersen Department of Informatics,
University of Oslo and Simula Research Laboratory, Norway
Jo E. Hannay Simula Research Laboratory,
P.O. Box 134, NO-1325 Lysaker, Norway
Dag I. K. Sjøberg Department of Informatics,
University of Oslo, P.O. Box 1080, NO-0316 Oslo, Norway
Tore Dybå Department of Informatics,
University of Oslo and SINTEF, Norway
Amela Karahasanović SINTEF and Department of Informatics,
University of Oslo P.O. Box 124 Blindern, NO-0314 Oslo, Norway
Abstract—The skills of software developers are crucial to the success of software projects. Also, controlling for individual differences is important when studying the general effect of a method or a tool. However, the way skill is determined in industry and research settings is often ad hoc or based on unvalidated methods. According to established test theory, validated tests of skill should infer skill levels from well-defined performance measures on multiple small, representative tasks. We show how time and quality can be meaningfully combined to a well-defined measure of small-task performance, and hence a measure of programming skill. Our results show significant and positive correlations between our proposed measures of skill and variables such as seniority or self-evaluated expertise. These methods for combining time and quality are a promising first step to measuring programming skill in industry and research settings.
Programming; skill; performance; time; quality; productivity
I. INTRODUCTION The skills of individual software developers may have a dramatic impact on the success of software projects. The large differences in programming performance, reported in the late 1960s, indicated performance differences of orders of magnitude and more. Although more recent analysis [32] and studies [13] indicate somewhat more conservative estimates, companies that succeed in hiring the best people will nevertheless achieve great economic and competitive benefits [17,34,37].
Individual differences in skill also affect the outcome of empirical studies in software engineering. When evaluating alternative processes, methods, tools or other technologies, skill levels may temper with the relative effect of using a specific alternative. For example, in an experiment on the effect of a centralized versus delegated control style, the purportedly most skilled developers performed better on the delegated control style than on the centralized one, while the less skilled developers performed better on the centralized one than on the delegated one [5]. In another experiment,
skill levels had a moderating effect on the benefits of pair programming [4].
However, determining the skill level of software developers is far from trivial. In the work life, there are common-sense guidelines from experienced practitioners on how to distinguish the good from the bad [37]. But there seems to be consensus that this crucial human resource management task remains hard. Often, job recruitment personnel use tests that purport to measure a variety of traits such as general cognitive abilities (intelligence), work and life values, interests, as well as personality [20] to predict job performance [11]. Research has, however, established that work sample tests in combination with General Mental Ability (GMA) are among the best predictors of job performance [34]. GMA is a general aspect of intelligence and is best suited for predicting performance on entry-level jobs or job-training situations. This stands in contrast to work sample tests that are task specific and are integrated in the concept of job skill [15]. Although the predictive validity of standardized work samples exceed that of GMA alone [11], these predictors seem to yield the best results when they are combined [34].
In the context of empirical studies in software engineering, the notion of programming skill is generally not well founded. This has led to studies that failed in adequately correcting for bias in quasi-experimental studies [23]. Often the more general concept of programming expertise is used, with little validation. For example, in a recent study [20], we conceptualized programming expertise as the level of seniority (junior, intermediate, senior) of the individual programmer as set by their superior manager. While bearing some relevance to the consultancy market, this conceptuali-zation is not sufficient to capture the skill of individual programmers. The concepts of expertise and skill are operationalized in vicarious ways in also other domains; see [22] for a survey of operationalizations in IT management.
Whether the purpose of determining programming skill is to recruit the best developers or to assess the usefulness of a software engineering technology relative to levels of skill,
This is a preprint version of: Bergersen, G. R., Hannay, J. E., Sjøberg, D. I. K., Dybå, T., & Karahasanovic, A. (2011). Inferring skill from tests of programming performance: Combining quality and time. In 3rd IEEE International Symposium on Empirical Software Engineering and Measurement (ESEM'2011) (pp. 305-314). Banff, Canada: IEEE Computer Society. doi:10.1109/ESEM.2011.39
Accepted 2011-May-15 Not suitable for citation Copyright IEEE 2011

the most viable approach seems to be that candidates solve a collection of small programming tasks. We used a single task for this purpose in [5], but it was uncertain to what degree bias may be present as a result of only using one task. Generally, it seems non-trivial to identify the appropriate collection of tasks from which one can infer a reasonably accurate level of programming skill in an acceptable amount of time. We are working on this challenge at present, but this is not the focus of this paper.
The focus of this paper is as follows. Given a small set of programming tasks, how does one infer the candidates’ programming skill from both the quality of the task solutions and the time (effort) spent performing the tasks? It is well recognized that the combination of quality and time task is essential to define skill [15,16], but how to combine them in practice is challenging. For example, how does one rank programmers who deliver high quality slowly relative to those who deliver lesser quality quicker? This paper addresses such challenges and proposes a method for combining quality and time for a task solution into a single ordinal score of performance (i.e., low, medium, high). Multiple performance scores are then aggregated to form a ordinal approximation of programming skill. The method is demonstrated by using data from two existing experiments.
Section 2 gives the theoretical and analytical background for skill as a subdomain of expertise. Section 3 discusses how quality and time are dealt with at present and describes how to combine them when measuring performance. Section 4 reanalyzes existing data sets according to the arguments given in the previous sections. Sections 5 discuss the results and Section 6 concludes.
II. BACKGROUND
A. Expertise Expertise is one of the classic concepts of social and behavioral science. Expertise is usually related to specific tasks within a given domain and does not in general transfer across domains or tasks [15]. Expertise has several aspects; we present five of these in Fig. 1 (a). The aspects are all related. For example, in the usual descriptions of skill acquisition [1,14,16], which is a subdomain of expertise, a person starts by acquiring declarative knowledge which for experts is qualitatively different in representation and organization compared to novices [15,38]. Further, through practice, declarative knowledge is transformed into procedural skill, which at first is slow and error prone [16]. However, though extended experience, performance improves and experts should converge on their understanding of the domain for which they are an expert as well [36] (i.e., consensual agreement). Experts should also regard themselves as being experts, for example, through the use of self-assessments. Overall, the desired effect of expertise is superior performance on the tasks on which one is an expert. In our context, this is performance on real-world programming tasks, i.e., job tasks. It is, however, unreliable and inefficient to predict future job performance by observing actual job performance [11]. This is why it is
desirable to design quick tests based on how well an individual reliably performs on representative tasks [15].
B. Skill It is in the aspect of performance on small representative tasks that we generally understand skill. Note that inferring skill from a reliable level of performance on representative tasks is not the same as defining it in terms of performance on the job. Representative tasks in our context denote smaller tasks which represent real-world tasks, and for which there are well-defined measures of performance [15]. The inference from performance on small representative tasks to performance on the job requires an understanding of key mechanisms at play shared between tasks in the two settings. This is theory-driven generalization [33], based on the economy of artificiality [21]. In the absence of, or as a complement to strong theory, it is useful to seek confirmation in how well skill measures coincide with other aspects of expertise. This is relevant for skill in programming.
Programming skill was investigated by Anderson et al. [1,2] from a psychological perspective. They reported that coding time and as well as the number of programming errors decreased as skill improved. Further, programming in LISP required the learning of approximately 500 if-then rules. The acquisition of these rules followed a power-law learning curve; the improvement in performance was largest at first and then decelerated until an asymptote was reached. Thus, the relationship between amount of practice (extended experience) and performance was non-linear. However, if
Figure 1 Expertise (a) and skill as one aspect of expertise (b). The desired effect of expertise is superior job performance.
This is a preprint version of: Bergersen, G. R., Hannay, J. E., Sjøberg, D. I. K., Dybå, T., & Karahasanovic, A. (2011). Inferring skill from tests of programming performance: Combining quality and time. In 3rd IEEE International Symposium on Empirical Software Engineering and Measurement (ESEM'2011) (pp. 305-314). Banff, Canada: IEEE Computer Society. doi:10.1109/ESEM.2011.39
Accepted 2011-May-15 Not suitable for citation Copyright IEEE 2011
amount of practice and performance were log-transformed, an approximate linear trend was observed. This phenomenon is widely observed and is therefore often referred to as the log-log law of practice [31].
Fits and Posner [16] has extensively studied skill acquisition. Within many different domains of expertise, they found that with increased skill, the amount of errors in performance decreases and the speed of which a task is executed improves. Regarding measures of skill, they state: “[t]he measure should take into account the length of time taken to perform a skill as well as the accuracy with which it is performed” [16, p. 85]. Therefore, the time and the more general term for accuracy—namely quality—is intimately linked to skill. At the same time, the term “performance” is linked to all three concepts. Because skill, by its very definition, affects performance, we can hierarchically structure the five concepts expertise, skill, performance, time and quality as in Fig. 1 (b). From the top, expertise, which should affect job performance, is a generalization of skill. Further, skill is inferred from multiple performances; as already stated, reliably superior performance on representative tasks is a requirement. At the bottom, time and quality in combination dictate whether we regard performance overall as, for example, high or low.
C. Measures of programming performamce It is common in empirical software engineering to deal with quality and time separately when analyzing results; i.e., one studies performance in terms of quality and then in terms of time, often under the assumption that the solution meets some kind of criterion for correctness (see [4,5,7] for examples). We acknowledge that for many studies, this is acceptable. However, when the purpose is to characterize individual differences, problems may occur.
Time is a ratio variable with an inverse relation to performance (i.e., little time implies good performance). Quality, on the other hand, may consist of plethora of variables where each one may have complex relations to each other and where all often cannot be optimized simultaneously (see, e.g., [30]). Further, depending on how quality is operationalized, these variables may have different scale properties (i.e., nominal, ordinal, interval or ratio) or other different propensities. Therefore, when aiming to characterize individual differences, one is (a) forced to disregard quality and report differences in time spent or (b) only analyze time for observations that surpass some specific level of quality (often correctness), thereby adhering to the basic principle delineated by Thorndike and others in the 1920s: “the more quickly a person produces the correct response, the greater is his [ability]” [12, p. 440, emphasis added]. It is also possible to (c) devise acceptance tests that forces everyone to work until an acceptable solution is achieve. Generally, we regard this as, perhaps, the most viable approach today, because individual variability is expressed through time spent in total. However, by using (b) or (c), large portions of the dataset may be excluded from analysis, in particular when the proportion of correct solutions is low.
At the most fundamental level of the time/quality tradeoff problem, it is not given how to place programmers who deliver high quality slowly relative to those who deliver lesser quality quicker. In the datasets that are available to us, correctness and time are often negatively correlated. This indicates that the longer it takes to submit a task, the lower is the likelihood of the solution being correct. Although this may seem contrary to what may be expected (i.e., higher quality requires more time, lower quality requires less time), there are two important distinctions to be made: First, there is a difference between quality in general and correctness specifically. Second, there is also a difference between within-subject and between-subject interpretations; when a correct solution can be identified, a highly skilled individual can arrive at this solution in less time and with higher quality than a less capable individual (an inter-individual interpretation). But given more time, a single individual can generally improve an existing solution (intra-individual interpretation).
Another challenge is to what degree an individual’s performance in a study is reliable at a specific level or incidentally high or low from time to time. One way to address such concerns it to use multiple indicators of performance [6,18]. Based on the same principles for combining time and quality as performance which is delineated in this article, we have already advanced the measurement of skill using multiple indicators of performance [9]. But, a detailed discussion on the principles involved is needed and we will illustrate the approach using larger datasets here.
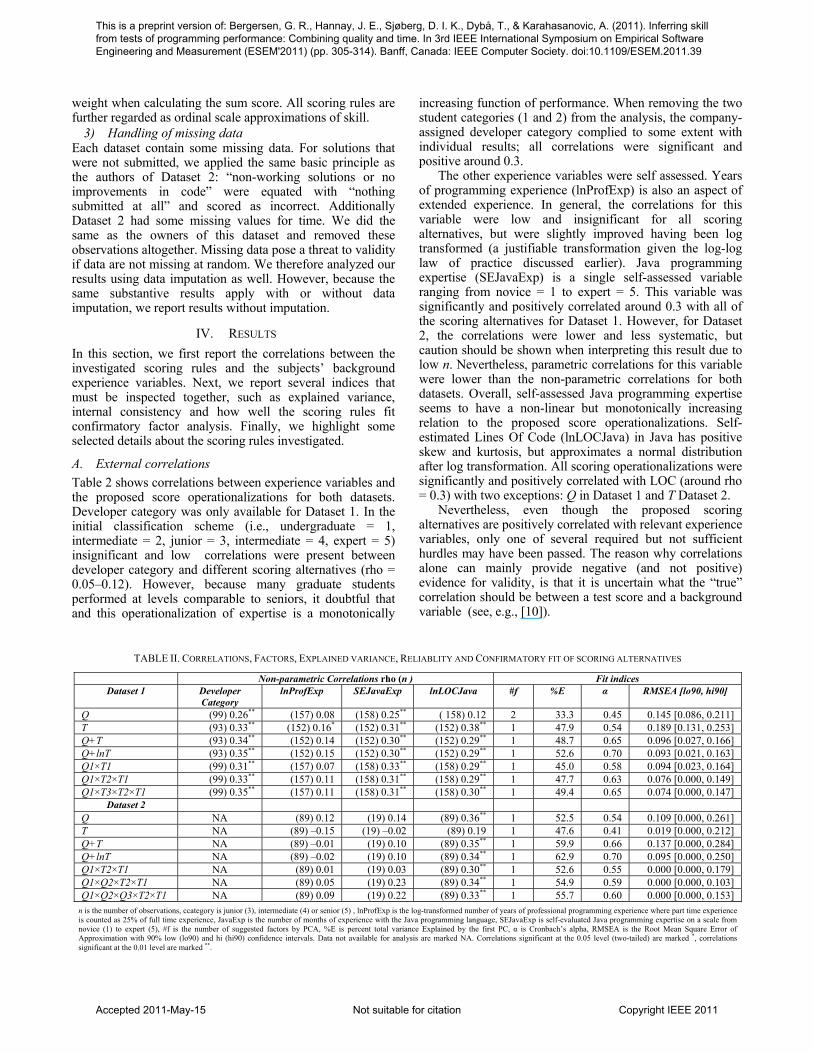
D. Using the Guttman structure for time and quality The two-by-two matrix in Fig. 2 has two possible values
for quality (low, high) and two possible values for time (slow, fast). It should be easy to agree that in this simplified example, “high performance” is represented by the upper right quadrant (fast and high quality) whereas “low performance” is represented by the lower left quadrant (slow and low quality). Further, it should also be possible to agree that the two remaining quadrants lie somewhere between these two extremes, say, “medium performance”. However, which one of the two alternatives one would rate as the better one (or whether they should be deemed equal), is a value judgment: In some instances, “fast and low quality” may be
Time
Quality
high
low
fast slow
Fast and high quality
Slow and low quality
Fast and low quality
Slow and high quality
Figure 2. Examples of scoring based on value judgments favoring time and quality for “medium performances”.
This is a preprint version of: Bergersen, G. R., Hannay, J. E., Sjøberg, D. I. K., Dybå, T., & Karahasanovic, A. (2011). Inferring skill from tests of programming performance: Combining quality and time. In 3rd IEEE International Symposium on Empirical Software Engineering and Measurement (ESEM'2011) (pp. 305-314). Banff, Canada: IEEE Computer Society. doi:10.1109/ESEM.2011.39
Accepted 2011-May-15 Not suitable for citation Copyright IEEE 2011

deemed superior performance compared to “slow and high quality”. To address how performance should relate to different values for time and quality, we propose to use principles as delineated by Louis Guttman.
The Guttman scale was originally developed to determine whether a set of attitude statements is unidimensional [19]. In Guttman’s sense, a perfect scale exists if a respondent who agrees with a certain statement also agrees with milder statements of the same attitude. The Guttman structured scoring rules we propose, utilize the same underlying principle as the Guttman scale, albeit at a lower level of abstraction (a scale is an aggregation of indicators, whereas the structure we employ refers to the indicators themselves). The approach utilizes general principles as delineated by others [3], but which have only somewhat informally been addressed by us so far [8]; overall the benefits of using the Guttman structure is fundamental for some modern measurement models which we address in Section 5 C as further work.
With a Guttman structure it is possible to rank combinations of quality and time relatively to each other as well as being explicit about how different tradeoffs in time and quality are scored. Performance on a programming task is thus determined by a series of thresholds that are rank ordered. Combined, these thresholds constitute a set of ordered response categories (i.e., an ordinal variable). Surpassing a given threshold implies all thresholds below has been passed as well. This implies that for a score of, say 3 (of 5 possible), the thresholds for obtaining scores of 0, 1, and 2 must have been passed, while the threshold for obtaining score 4 has failed.
One may, further, express performance in terms of quality and time by adding and adjusting score categories. For example, a task that differentiates more on quality aspects may be scored on multiple quality categories and a task that also differentiates more on time aspects may have more time categories. Conversely, one may deliberately emphasize quality over time (or vice versa) by adjusting score categories accordingly.
III. RESEARCH METHODS In this section we describe how we combined time and quality using multiple indicators; each indicator is the performance as time and quality combined on a single task. We show how we operationalized and reanalyzed two different data sets, using different principles for score operationalizations.
A. Data set 1 The first data set we reanalyzed is from a controlled quasi-experiment [5]. In a one-day experiment, 99 consultants from eight different software consultancy companies and 59 undergraduate and graduate students were paid to participate. The treatment in the experiment was the control style of the code (centralized versus delegated). Five programming tasks were presented in succession to the subjects during the experiment, which lasted one day. The first task i1 (pretest) was identical for both treatment conditions. The four next tasks, i2–i5 contained the treatment. We analyze only the first
four tasks here due to challenges present in using the last task for our purpose (see Section 5 B).
For a Guttman-structured scoring rule, we used the following approach for each task i1–i4: Let Q1, T1, T2 and T3 be dichotomous variables, scored as requirement not met = 0, requirement met = 1. Let Q1 be functional correctness (as reported by the original authors), scored as incorrect = 0 or correct = 1. Let T3 be time < 3rd quartile, T2 be time < median, T1 be time < 1st quartile. A Guttman structure for an ordinal performance score for a single task that combines quality and time is then defined by the Cartesian product Q1×T3×T2×T1 as follows (x denotes either of 0, 1):
(0,x,x,x) = 0 (i.e., incorrect, time is irrelevant) (1,0,x,x) = 1 (i.e., correct and very slow) (1,1,0,x) = 2 (i.e., correct and slow) (1,1,1,0) = 3 (i.e., correct and fast) (1,1,1,1) = 4 (i.e., correct and very fast) The matrix representation of this scoring rule is
illustrated in Table 1 (a). By using this structure, a solution must be correct before time is taken into consideration. Increasing scores for time are, further, only passed in order (T3 before T2 and T2 before T1). Hence, for a single task i, time and quality combined define an ordered response category of performance. And the precedence of quality in this type of scoring rule reflects the view that, for this study, we do not consider a non-working solution to reflect high or medium performance, even when it is developed quickly.
We also constructed two alternative Guttman-based scoring rules to Q1×T3×T2×T1 that differentiate less on time, but that is still based on the same Q1 as above: Q1×T2×T1 uses three categories for time based on the 33rd (T2) or 67th (T1) percentile; Q1×T1 only uses two categories for time, which is above versus below the median. The range of the overall performance score in all instances is equal to the number of dichotomous score variables plus one, e.g., Q1×T3×T2×T1 has one variable for quality and three for time, implying a total of five well ordered performance score categories with a range of 0–4.
The procedure we have described so far for just described was repeated for all four tasks. Because of different time distribution for each task, the quartiles and medians for time is calculated on a task-by-task basis. The resulting score vector consist of four Guttman-structured score variables and the sum of these, the sum score, is the ordinal skill scale.
TABLE I. SCORE ACCORDING TO TIME AND QUALITY THRESHOLDS
Score T3=0 T3=1 T2=1 T1=1 Q1=1 1 2 3 4 Q1=0 0 0 0 0
(a) Dataset 1
Score T2=0 T2=1 T1=1 Q2=1 2 3 4 Q1=1 1 1 1 Q1=0 0 0 0
(b) Dataset 2
This is a preprint version of: Bergersen, G. R., Hannay, J. E., Sjøberg, D. I. K., Dybå, T., & Karahasanovic, A. (2011). Inferring skill from tests of programming performance: Combining quality and time. In 3rd IEEE International Symposium on Empirical Software Engineering and Measurement (ESEM'2011) (pp. 305-314). Banff, Canada: IEEE Computer Society. doi:10.1109/ESEM.2011.39
Accepted 2011-May-15 Not suitable for citation Copyright IEEE 2011

For comparison, we also devised two alternative scoring rules that combined quality and time for tasks by addition (additive scoring rules). On a task–by-task basis, we standardized quality and time (mean 0 and standard deviation 1) before adding the standardized variables as a composite score of performance. This was a manifestation of treating “slow and high quality” as roughly equal to “fast and low quality” (in Fig. 2), but where the continuous properties of time is not forced into discrete categories. We name these scoring rules Q+T and Q+lnT. Here, time was negated in both instances and for the latter variable, time was log transformed as well before negation. Finally, we constructed scoring rules on the four quality variables alone (Q) and the four time variables alone (T). (See Section 5 B for other alternatives that we choose not to report).
It should be noted that the relation between the performance score vector, i.e., the score of on each task, and skill score, i.e., sum of performance scores, is a many-to-one (surjective) function. For example, when using Q1×T3×T2×T1, an individual with correct but very slow solutions for all four tasks receives the sum score of 4. One correct solution with very fast time and the other three tasks incorrect, also receive the same sum score. But it is problematic to talk about the latter instance as “reliably (superior) performance” because such a response structure exhibits superior performance on only a single task.
B. Data set 2 The second data set stems from three different quasi-experiments which all used the same programming tasks. During of one day, the subjects were required to perform three different change tasks in a 3600 LOC library application system that contains 26 Java classes. Two of the studies used students as subjects; one study used professionals. The study in [25] investigated the effects of different comprehension strategies using 38 subjects; the study in [24] compared feedback collection and think-aloud methods for 34 subjects; and the study in [27] studied the effects of expertise and strategies on program comprehension for 19 subjects. Additionally, the same pretest task as in Dataset 1 (i1) was used. However, one of the studies had missing data for the last change task, thereby reducing the number of available tasks for analysis from four to three. Human graders scored the quality of each task on a five-point scale using the following scheme:
0: nothing done on the task (no code changes) 1: failure, does not compile or no discernible functional
progress toward solution 2: functional anomalies, one or more subtasks are
achieved 3: functionally correct, major visual anomalies 4: functionally correct, only minor cosmetic anomalies 5: functionally correct, visually correct, i.e. “perfect
solution'” We defined a Guttman structure Q1×Q2×Q3 for quality
dimension as follows: We decided that the original categories 0 and 1 should be collapsed into a single category,
because neither might be preferred over the other. Thus, variable Q1 was defined as “one or more subtasks achieved'' (category 2 above). Next, the Q2 variable was “functionally correct, but with major visual anomalies allowed” (category 3), and Q3 was functionally correct with only minor visual anomalies allowed (categories 4 and 5). For the time dimension, we used T1×T2 to partition the time for those individuals who passed Q3 into three groups. The matrix representation of this scoring rule, denoted Q1×Q2×Q3×T1×T2, is provided in Table 1 (b).
We also devised scoring rules using one and two dichotomous quality variables as well: Q1×Q2×T2×T1 does not separate between major and minor visual anomalies that are otherwise correct. Further, Q1×T2×T1 only separate between functionally correct solutions with major (or better) visual anomalies from those that are not functionally correct. Finally, we devised scoring rules for Q+T, Q+lnT, Q and T using the same procedure as in Dataset 1, but using three tasks instead of four.
C. Analysis method and handling of missing data The analysis method for the two data sets, each using six different score operationalizations, included the same four basic steps. All time variables were negated (for T) or log transformed and then negated (for Q+lnT, QlnT) in order to increase interpretability so that high values indicate high performance:
1) Use exploratory factor analysis. We extracted the main signal in the data for each scoring rule by Principal Component Analysis (PCA) using the analysis software PASWTM 18.0. We used listwise deletion of missing variables, regression for calculating the factor score, and an unrotated (orthogonal) factor solution to maximize interpretability of each factor. All factors with eigenvalues above 1 are reported.
2) Inspect external and internal results Operationalizations of the scoring rules were compared with several experience variables. We report non-parametric correlations (Spearman’s ρ, “rho”) unless otherwise noted. We assumed that a valid scoring rule should correlate moderately and positively with relevant background variables such as developer category or and length of experience. Because such variables are not influenced by our investigated score operationalizations, we refer to this analysis as external results.
Conversely, all the reported internal results are influenced by how each scoring rule was constructed. For internal results, we used the proportion of explained variance for the first Principal Component (PC), which is analogue to the sum score, as the signal-to-noise ratio for each scoring rule. Cronbach’s α was used as a reliability coefficient which expresses the internal consistency of the scores. To ascertain the applicability of each score operationalization, we used Root Mean Square Error of Approximation (RMSEA) as reported in the analysis software AmosTM 18.0. This is a parsimony-adjusted index in the sense that it favors models with fewer parameters in a confirmatory model. We used a tau-equivalent reflective measurement model with multiple indicators [29]. This implies that all tasks receive the same
This is a preprint version of: Bergersen, G. R., Hannay, J. E., Sjøberg, D. I. K., Dybå, T., & Karahasanovic, A. (2011). Inferring skill from tests of programming performance: Combining quality and time. In 3rd IEEE International Symposium on Empirical Software Engineering and Measurement (ESEM'2011) (pp. 305-314). Banff, Canada: IEEE Computer Society. doi:10.1109/ESEM.2011.39
Accepted 2011-May-15 Not suitable for citation Copyright IEEE 2011
weight when calculating the sum score. All scoring rules are further regarded as ordinal scale approximations of skill.
3) Handling of missing data Each dataset contain some missing data. For solutions that were not submitted, we applied the same basic principle as the authors of Dataset 2: “non-working solutions or no improvements in code” were equated with “nothing submitted at all” and scored as incorrect. Additionally Dataset 2 had some missing values for time. We did the same as the owners of this dataset and removed these observations altogether. Missing data pose a threat to validity if data are not missing at random. We therefore analyzed our results using data imputation as well. However, because the same substantive results apply with or without data imputation, we report results without imputation.
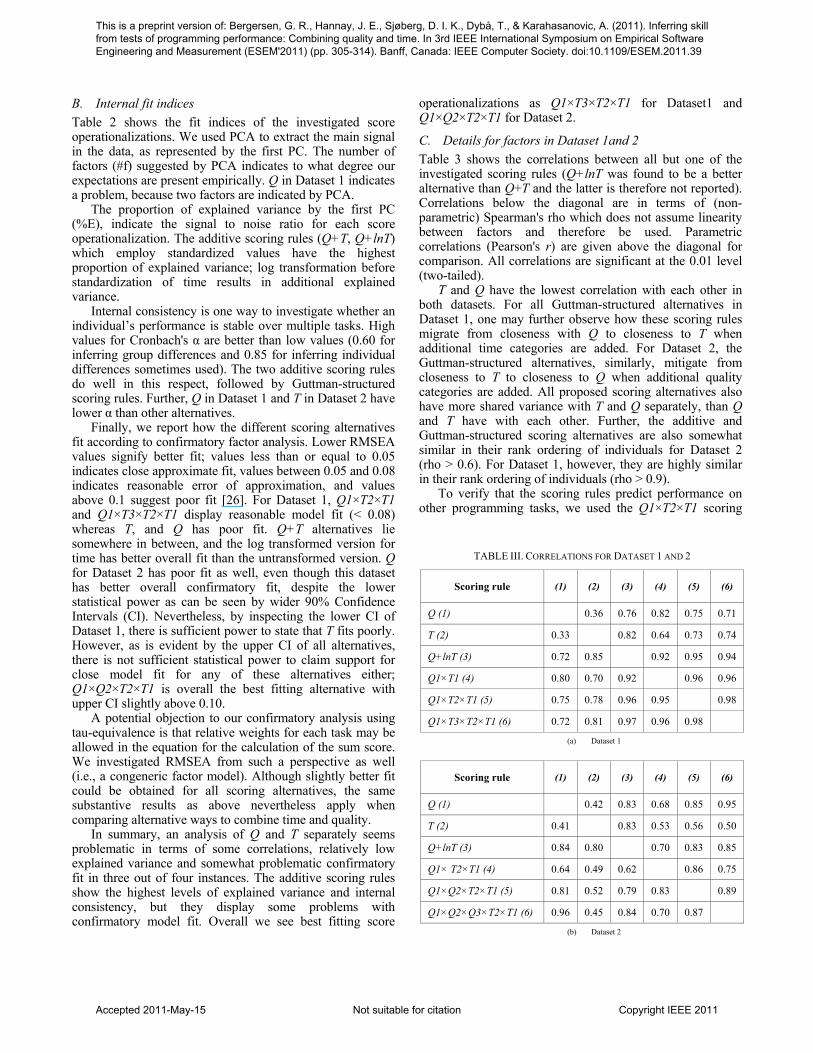
IV. RESULTS In this section, we first report the correlations between the investigated scoring rules and the subjects’ background experience variables. Next, we report several indices that must be inspected together, such as explained variance, internal consistency and how well the scoring rules fit confirmatory factor analysis. Finally, we highlight some selected details about the scoring rules investigated.
A. External correlations Table 2 shows correlations between experience variables and the proposed score operationalizations for both datasets. Developer category was only available for Dataset 1. In the initial classification scheme (i.e., undergraduate = 1, intermediate = 2, junior = 3, intermediate = 4, expert = 5) insignificant and low correlations were present between developer category and different scoring alternatives (rho = 0.05–0.12). However, because many graduate students performed at levels comparable to seniors, it doubtful that and this operationalization of expertise is a monotonically
increasing function of performance. When removing the two student categories (1 and 2) from the analysis, the company-assigned developer category complied to some extent with individual results; all correlations were significant and positive around 0.3.
The other experience variables were self assessed. Years of programming experience (lnProfExp) is also an aspect of extended experience. In general, the correlations for this variable were low and insignificant for all scoring alternatives, but were slightly improved having been log transformed (a justifiable transformation given the log-log law of practice discussed earlier). Java programming expertise (SEJavaExp) is a single self-assessed variable ranging from novice = 1 to expert = 5. This variable was significantly and positively correlated around 0.3 with all of the scoring alternatives for Dataset 1. However, for Dataset 2, the correlations were lower and less systematic, but caution should be shown when interpreting this result due to low n. Nevertheless, parametric correlations for this variable were lower than the non-parametric correlations for both datasets. Overall, self-assessed Java programming expertise seems to have a non-linear but monotonically increasing relation to the proposed score operationalizations. Self-estimated Lines Of Code (lnLOCJava) in Java has positive skew and kurtosis, but approximates a normal distribution after log transformation. All scoring operationalizations were significantly and positively correlated with LOC (around rho = 0.3) with two exceptions: Q in Dataset 1 and T Dataset 2.
Nevertheless, even though the proposed scoring alternatives are positively correlated with relevant experience variables, only one of several required but not sufficient hurdles may have been passed. The reason why correlations alone can mainly provide negative (and not positive) evidence for validity, is that it is uncertain what the “true” correlation should be between a test score and a background variable (see, e.g., [10]).
TABLE II. CORRELATIONS, FACTORS, EXPLAINED VARIANCE, RELIABLITY AND CONFIRMATORY FIT OF SCORING ALTERNATIVES
Non-parametric Correlations rho (n ) Fit indices Dataset 1 Developer
Category lnProfExp SEJavaExp lnLOCJava #f %E α RMSEA [lo90, hi90]
Q (99) 0.26** (157) 0.08 (158) 0.25** ( 158) 0.12 2 33.3 0.45 0.145 [0.086, 0.211] T (93) 0.33** (152) 0.16* (152) 0.31** (152) 0.38** 1 47.9 0.54 0.189 [0.131, 0.253] Q+T (93) 0.34** (152) 0.14 (152) 0.30** (152) 0.29** 1 48.7 0.65 0.096 [0.027, 0.166] Q+lnT (93) 0.35** (152) 0.15 (152) 0.30** (152) 0.29** 1 52.6 0.70 0.093 [0.021, 0.163] Q1×T1 (99) 0.31** (157) 0.07 (158) 0.33** (158) 0.29** 1 45.0 0.58 0.094 [0.023, 0.164] Q1×T2×T1 (99) 0.33** (157) 0.11 (158) 0.31** (158) 0.29** 1 47.7 0.63 0.076 [0.000, 0.149] Q1×T3×T2×T1 (99) 0.35** (157) 0.11 (158) 0.31** (158) 0.30** 1 49.4 0.65 0.074 [0.000, 0.147]
Dataset 2 Q NA (89) 0.12 (19) 0.14 (89) 0.36** 1 52.5 0.54 0.109 [0.000, 0.261] T NA (89) –0.15 (19) –0.02 (89) 0.19 1 47.6 0.41 0.019 [0.000, 0.212] Q+T NA (89) –0.01 (19) 0.10 (89) 0.35** 1 59.9 0.66 0.137 [0.000, 0.284] Q+lnT NA (89) –0.02 (19) 0.10 (89) 0.34** 1 62.9 0.70 0.095 [0.000, 0.250] Q1×T2×T1 NA (89) 0.01 (19) 0.03 (89) 0.30** 1 52.6 0.55 0.000 [0.000, 0.179] Q1×Q2×T2×T1 NA (89) 0.05 (19) 0.23 (89) 0.34** 1 54.9 0.59 0.000 [0.000, 0.103] Q1×Q2×Q3×T2×T1 NA (89) 0.09 (19) 0.22 (89) 0.33** 1 55.7 0.60 0.000 [0.000, 0.153]
n is the number of observations, ccategory is junior (3), intermediate (4) or senior (5) , lnProfExp is the log-transformed number of years of professional programming experience where part time experience is counted as 25% of full time experience, JavaExp is the number of months of experience with the Java programming language, SEJavaExp is self-evaluated Java programming expertise on a scale from novice (1) to expert (5), #f is the number of suggested factors by PCA, %E is percent total variance Explained by the first PC, α is Cronbach’s alpha, RMSEA is the Root Mean Square Error of Approximation with 90% low (lo90) and hi (hi90) confidence intervals. Data not available for analysis are marked NA. Correlations significant at the 0.05 level (two-tailed) are marked *, correlations significant at the 0.01 level are marked **.
This is a preprint version of: Bergersen, G. R., Hannay, J. E., Sjøberg, D. I. K., Dybå, T., & Karahasanovic, A. (2011). Inferring skill from tests of programming performance: Combining quality and time. In 3rd IEEE International Symposium on Empirical Software Engineering and Measurement (ESEM'2011) (pp. 305-314). Banff, Canada: IEEE Computer Society. doi:10.1109/ESEM.2011.39
Accepted 2011-May-15 Not suitable for citation Copyright IEEE 2011
B. Internal fit indices Table 2 shows the fit indices of the investigated score operationalizations. We used PCA to extract the main signal in the data, as represented by the first PC. The number of factors (#f) suggested by PCA indicates to what degree our expectations are present empirically. Q in Dataset 1 indicates a problem, because two factors are indicated by PCA.
The proportion of explained variance by the first PC (%E), indicate the signal to noise ratio for each score operationalization. The additive scoring rules (Q+T, Q+lnT) which employ standardized values have the highest proportion of explained variance; log transformation before standardization of time results in additional explained variance.
Internal consistency is one way to investigate whether an individual’s performance is stable over multiple tasks. High values for Cronbach's α are better than low values (0.60 for inferring group differences and 0.85 for inferring individual differences sometimes used). The two additive scoring rules do well in this respect, followed by Guttman-structured scoring rules. Further, Q in Dataset 1 and T in Dataset 2 have lower α than other alternatives.
Finally, we report how the different scoring alternatives fit according to confirmatory factor analysis. Lower RMSEA values signify better fit; values less than or equal to 0.05 indicates close approximate fit, values between 0.05 and 0.08 indicates reasonable error of approximation, and values above 0.1 suggest poor fit [26]. For Dataset 1, Q1×T2×T1 and Q1×T3×T2×T1 display reasonable model fit (< 0.08) whereas T, and Q has poor fit. Q+T alternatives lie somewhere in between, and the log transformed version for time has better overall fit than the untransformed version. Q for Dataset 2 has poor fit as well, even though this dataset has better overall confirmatory fit, despite the lower statistical power as can be seen by wider 90% Confidence Intervals (CI). Nevertheless, by inspecting the lower CI of Dataset 1, there is sufficient power to state that T fits poorly. However, as is evident by the upper CI of all alternatives, there is not sufficient statistical power to claim support for close model fit for any of these alternatives either; Q1×Q2×T2×T1 is overall the best fitting alternative with upper CI slightly above 0.10.
A potential objection to our confirmatory analysis using tau-equivalence is that relative weights for each task may be allowed in the equation for the calculation of the sum score. We investigated RMSEA from such a perspective as well (i.e., a congeneric factor model). Although slightly better fit could be obtained for all scoring alternatives, the same substantive results as above nevertheless apply when comparing alternative ways to combine time and quality.
In summary, an analysis of Q and T separately seems problematic in terms of some correlations, relatively low explained variance and somewhat problematic confirmatory fit in three out of four instances. The additive scoring rules show the highest levels of explained variance and internal consistency, but they display some problems with confirmatory model fit. Overall we see best fitting score
operationalizations as Q1×T3×T2×T1 for Dataset1 and Q1×Q2×T2×T1 for Dataset 2.
C. Details for factors in Dataset 1and 2 Table 3 shows the correlations between all but one of the investigated scoring rules (Q+lnT was found to be a better alternative than Q+T and the latter is therefore not reported). Correlations below the diagonal are in terms of (non-parametric) Spearman's rho which does not assume linearity between factors and therefore be used. Parametric correlations (Pearson's r) are given above the diagonal for comparison. All correlations are significant at the 0.01 level (two-tailed).
T and Q have the lowest correlation with each other in both datasets. For all Guttman-structured alternatives in Dataset 1, one may further observe how these scoring rules migrate from closeness with Q to closeness to T when additional time categories are added. For Dataset 2, the Guttman-structured alternatives, similarly, mitigate from closeness to T to closeness to Q when additional quality categories are added. All proposed scoring alternatives also have more shared variance with T and Q separately, than Q and T have with each other. Further, the additive and Guttman-structured scoring alternatives are also somewhat similar in their rank ordering of individuals for Dataset 2 (rho > 0.6). For Dataset 1, however, they are highly similar in their rank ordering of individuals (rho > 0.9).
To verify that the scoring rules predict performance on other programming tasks, we used the Q1×T2×T1 scoring
TABLE III. CORRELATIONS FOR DATASET 1 AND 2
Scoring rule (1) (2) (3) (4) (5) (6)
Q (1) 0.36 0.76 0.82 0.75 0.71
T (2) 0.33 0.82 0.64 0.73 0.74
Q+lnT (3) 0.72 0.85 0.92 0.95 0.94
Q1×T1 (4) 0.80 0.70 0.92 0.96 0.96
Q1×T2×T1 (5) 0.75 0.78 0.96 0.95 0.98
Q1×T3×T2×T1 (6) 0.72 0.81 0.97 0.96 0.98
(a) Dataset 1
Scoring rule (1) (2) (3) (4) (5) (6)
Q (1) 0.42 0.83 0.68 0.85 0.95
T (2) 0.41 0.83 0.53 0.56 0.50
Q+lnT (3) 0.84 0.80 0.70 0.83 0.85
Q1× T2×T1 (4) 0.64 0.49 0.62 0.86 0.75
Q1×Q2×T2×T1 (5) 0.81 0.52 0.79 0.83 0.89
Q1×Q2×Q3×T2×T1 (6) 0.96 0.45 0.84 0.70 0.87
(b) Dataset 2
This is a preprint version of: Bergersen, G. R., Hannay, J. E., Sjøberg, D. I. K., Dybå, T., & Karahasanovic, A. (2011). Inferring skill from tests of programming performance: Combining quality and time. In 3rd IEEE International Symposium on Empirical Software Engineering and Measurement (ESEM'2011) (pp. 305-314). Banff, Canada: IEEE Computer Society. doi:10.1109/ESEM.2011.39
Accepted 2011-May-15 Not suitable for citation Copyright IEEE 2011

rule of Dataset 1 to separate individuals into high versus low groups. Using the results for task i5, which is not a part of the investigated scoring rules, as a dependent variable and above/below mean sum score of tasks i1–i4 as the independent variable, we found that the high group performed much better than the low group: 67.1% had correct solutions for i5 whereas the corresponding results for the low group was 27.8% correct (time could not be analyzed this way for i5, see [5] for why). We could further confirm that the high group had written significantly more LOC in Java and had more programming and Java experience as well. Moreover, by using three groups instead of two, similar results were obtained: the three groups are well ordered according to external background variables as well as on performance for i5. For Dataset 2, we performed the same analysis, using the quality of task i4 as the dependent variable and the sum score of i1–i3 as the independent variable. All correlations between the Guttman-structured scoring rules and the quality of i4 were large (n = 52, rho = 0.51–0.53) and significant the 0.001 level.
We were also able to identify the treatment effect of Dataset 1. The dichotomous treatment variable was significantly and moderately correlated with the second PC of Q1×T3×T2×T1 (rho = 0.42) and for the two additive scoring rules (rho = 0.36) as well. Further, the treatment effect was not correlated with any of the first PC of the proposed scoring rules. This may indicate that the effect of the treatment in this study is less than individual variability.
V. DISCUSSION We start with discussing the implications for research and practice when combining time and quality in empirical studies on programmers. Next, we discuss limitations of the present analysis. Finally, we address multiple dimensions for how this work can be expanded in the future.
A. Implications for research and practice First, this study demonstrates the importance of taking into consideration experiment constraints when analyzing individual variability of performance. When leisure time limits are used and most subjects solve a task correctly, it is plausible that between-subject variability is mostly present in the time variable (after accounting for correct solutions). Conversely, if few subjects are able to finish on time at all, subjects vary mainly with respect to quality (as they would in, e.g., an exam). Hence, the scoring of time and quality as a combined variable is both dependent on the instrumentation as well as empirical results. This also implies that no “universal” scoring rule exist that applies equally well to all tasks. Also, as attested by the reported correlations and fit indices for Q in Dataset 1 and T in Dataset 2, some problems seem present when multiple indicators are used.
For time as a variable, we generally obtained stronger and more consistent correlations according to theoretical expectations when using either non-parametric correlations and untransformed experience variables or parametric correlations and log transformed experience. We concede that other transformations, such as 1/time may be applicable as well. Nevertheless, variables analyzed in this manner
should almost always be plotted first and verified again theoretical expectations; there is often little theoretical rationale for expecting a priori that variables are linearly related, even though each variable displays an (approximate) normal distribution. A similar caution should be raised when analyzing variables of quality as well. For example, for Dataset 2, it is problematic to assume that an increase in score from 2 to 3 (a difference of 1) amounts to the same increase as from 3 to 4; improving a correct solution from “major” to “minor visual anomalies” may require negligible time, whereas the improvement from one to multiple subtasks may require substantial effort. Hence, quality variables should be treated as ordinal when in doubt and they are, further, most likely non-linearly related to other variables as well. Therefore, non-parametric correlations should be the first, not last, resort.
For the scoring rules that combined time and quality, we see two main competing alternatives in the present analysis: the additive scoring rules treated “slow and high quality” and “fast and low quality” (Fig. 2) as “medium performance”. The Guttman-structured alternatives treated “fast and low quality” differently; quality had to be at an (operationally defined) acceptable level, before additional score points were awarded for time. Nevertheless, both alternatives are highly similar in terms of overall results, but confirmatory model fit is slightly better for the Guttman-based scoring rules. There are, however, some challenges with using the additive scoring rules; partial scores of performance are awarded for fast solutions even though no improvement may be present. This implies that an individual who choose to not seriously participate in a study, would still get a higher skill score than an individual who seriously attempts all task, but fails.
Given that some merit for the use of Guttman structures is established at this point, a practical issue then becomes how many scoring score variables for time and quality should be used? Because neither quality alone, nor time alone, fits the data particularly well in most instances, a sensible choice is to start at the extremes and work towards a compromise using the indices and recommendations reported here. Based on our experience, different alternative scoring rules will usually display a peak in terms of overall fit at some point; for example, when adding a new Q3 to Q1×Q2×T2×T1 in Dataset 2, confirmatory model fit start to decrease while the proportion of explained variance is only marginally better. Finally, we recommend the use of scoring rules that converge in terms of measurement while being parsimonious and interpretable.
B. Limitations There are threats to the present analysis regarding the two sources of data as well as the methods we have used analyze time and quality as an aggregated variable of performance.
The experimental treatment used in both datasets add noise to the data which probably entails that all investigated scoring rules show worse fit than they would in data sets where no treatment was present. However, for this threat, at least the conditions were equal for all in our comparisons. Second, there are also statistical independency problems between tasks. When a new tasks expands upon the solution
This is a preprint version of: Bergersen, G. R., Hannay, J. E., Sjøberg, D. I. K., Dybå, T., & Karahasanovic, A. (2011). Inferring skill from tests of programming performance: Combining quality and time. In 3rd IEEE International Symposium on Empirical Software Engineering and Measurement (ESEM'2011) (pp. 305-314). Banff, Canada: IEEE Computer Society. doi:10.1109/ESEM.2011.39
Accepted 2011-May-15 Not suitable for citation Copyright IEEE 2011

of the previous task (i.e., a testlet-structure), this constitute one observation.
We also used factor analysis on discrete ordinal variables as well as dichotomous variables for quality. Optimally, one should use Bayesian estimation [28] or polychoric correlation matrices if the aim is to conclude more strongly than we do here. It is nevertheless somewhat common to see e.g., Likert scale variables analyzed using factor analysis and claiming that the resulting scale has interval properties.
Other, perhaps, justifiable objections to our approach may be that multiple-factor (e.g., two rotated factors) or simplex-structured models should have been investigated as well. For Dataset 1, we have already done these analyses, but with inconclusive overall results and poor confirmatory fit. Therefore, we have chosen not to report these here. A further limitation for such models is that they may be difficult to interpret and apply in practical situations. Better, and more recent, measurement models also exist than the one we have used here. We now turn to such improvements where patterns in the aggregated score variable imposes additional constraints on what scoring rules can be considered well-fitting overall.
C. Reccomendations for future research In software engineering it is somewhat common to read about differences in programming performance in orders of magnitude or more (i.e., 1:10 and above). However, as illustrated previously in Fig 1., these differences pertain to performance per se, and not to individuals. For ratio comparisons of individuals, a quantitative scale is required where units are separated by equal distances and where zero is well defined. This may be achieved though axiomatic measurement, but we regard it as unlikely that advances in this direction will happen anytime soon (see [10] for present challenges). Nevertheless, we consider Rasch analysis using a polytomous model (i.e., using ordinal integers as scores) [3] as a useful intermediary step to interval-scale measures of programmers. In this model, task difficulty is also an integral part of the measurement process, something the current model we employ (i.e., classical test theory) is lacking. Either way, Guttman-structured scoring is a requirement for the Rasch model.
We have identified some additional directions for future work. For example, two or more internally consistent scoring perspectives based on the same data could be devised where more score points are awarded either to quality or to time. By estimating skill for an individual based on these two approaches separately, it may be possible to make inferences about an individual’s preferred working style during an experiment. If an individual is ranked higher on one score operationalization than the other, the relative difference may inform what value system an individual has for “fast and low quality” versus “slow and high quality” solutions. Further, it should be noted that although we applied the same scoring principle to all tasks in this study, there should be no a priori reason for claiming that a scoring rule should fit equally well to all tasks to be valid; more work is also therefore needed on how to use different score operationalizations on a task-by-task basis.
Future work using Guttman-structured scoring rules for time and quality may also be directed at how to avoid the degradation of time as a continuous variable into discrete categories. However, any solution to this problem must somehow account for that time is likely to have skewed distributions. Although the additive scoring rule solves this problem by log transforming time, we believe that any solution to this problem should additionally present several competing alternatives for different measurement models as well as different score operationalizations.
VI. CONCLUSION In a reanalysis of two existing studies, we have shown through multiple score operationalizations how time and quality may be meaningfully combined in a single ordinal performance variable. By aggregating performance variables that combine time and quality for multiple tasks into an ordinal skill score, we obtained significant and positive correlations with relevant experience variables for all score alternatives that combined time and quality. Some degree of internal consistency was present, but only at a level high enough to roughly characterize group differences. We showed that, from correlations alone, it was difficult to choose what the “best” scoring alternative was. However, by using confirmatory factor analysis, we found some support for favoring Guttman-structured scoring rules over other alternatives, such as analyzing time or quality independently. Nevertheless, statistical power in our reanalysis was not sufficient to conclude strongly, even though upper confidence intervals almost indicated reasonable model fit for some alternatives.
Because alternative score operationalizations where time and quality are combined often were highly similar, the most pressing decision at present is how to advance the understanding of what is measured by the proposed scoring rules. We call for others to reanalyze their existing datasets where time and quality variables have been collected, scoring time and quality as a combined variable of performance. Such new datasets might even contain relevant background variables that can be used further to inform the strength of relations with performance and background variables, thereby making meta-analytic studies feasible in the future as well.
In closing, it may very well be that the time and quality of such new analysis may be an indicator of skill in factor analysis as well. But, as we have argued here, we consider a correct and slowly conducted analysis of more merit than a fast and incorrect analysis; the former should therefore be scored higher than the latter. Nevertheless, we would regard it as prudent to have multiple independent indicators of performance before voicing any more strongly formulated claims about this matter.
ACKNOWLEDGMENT The authors are grateful to Erik Arisholm, Kaja Kværn, Anette Levine, Richard Thomas, and Gøril Tømmerberg for use of their data, and to Jan-Eric Gustafsson for detailed feedback on an earlier analysis of Dataset 1.
This is a preprint version of: Bergersen, G. R., Hannay, J. E., Sjøberg, D. I. K., Dybå, T., & Karahasanovic, A. (2011). Inferring skill from tests of programming performance: Combining quality and time. In 3rd IEEE International Symposium on Empirical Software Engineering and Measurement (ESEM'2011) (pp. 305-314). Banff, Canada: IEEE Computer Society. doi:10.1109/ESEM.2011.39
Accepted 2011-May-15 Not suitable for citation Copyright IEEE 2011

REFERENCES [1] J. R. Anderson. Acquisition of cognitive skill. Psychological Review,
89(4):369–406, 1982. [2] J. R. Anderson, F. G. Conrad, and A. T. Corbett. Skill acquisition and
the LISP tutor. Cognitive Science, 13:467–505, 1989. [3] D. Andrich. Rasch Models for Measurement. Sage Publications,
1988. [4] E. Arisholm, H. Gallis, T. Dybå, and D. I. K. Sjøberg. Evaluating pair
programming with respect to system complexity and programmer expertise. IEEE Trans. Software Eng., 33:65–86, Feb. 2007.
[5] E. Arisholm and D. I. K. Sjøberg. Evaluating the effect of a delegated versus centralized control style on the maintainability of object-oriented software. IEEE Trans. Software Eng., 30:521–534, Aug. 2004.
[6] A. Basilevsky. Statistical Factor Analysis and Related Methods: Theory and Applications. John Wiley and Sons, Inc., 1994.
[7] A. C. Benander, B. A. Benander, and J. Sang. An empirical analysis of debugging performance differences between iterative and recursive constructs. J. Systems and Software, 54(1):17–28, Sept. 2000.
[8] G. R. Bergersen. Combining time and correctness in the scoring of performance on items. In Probabilistic Models for Measurement in Education, Psychology, Social Science and Health, 2010. https://conference.cbs.dk/index.php/rasch/Rasch2010/paper/view/596
[9] G.R. Bergersen and J.-E. Gustafsson. “Programming skill, knowledge and working memory among professional software developers from an investment theory perspective, “ J. Indiv. Diff, in press.
[10] Borsboom, D., Measuring the mind: Conceptual issues in contemporary psychometrics. New York, Cambridge University Press, 2005.
[11] J. P. Campbell. Modeling the performance prediction problem in industrial and organizational psychology. In M. D. Dunnette and L. M. Hough, editors, Handbook of Industrial and Organizational Psychology, volume 1, pages 687–732. Consulting Psychologists Press, Inc., second edition, 1990.
[12] Carroll, J. B. (1993). Human Cognitive Abilities: A survey of factor-analytic studies, Cambridge University Press.
[13] T. DeMarco and T. Lister, Peopleware: Productive Projects and Teams (Second Edition), Dorset House Publishing Company, 1999.
[14] H. L. Dreyfus and S. E. Dreyfus. Mind over Machine. The Free Press, 1988.
[15] K. A. Ericsson, N. Charness, P. J. Feltovich, and R. R. Hoffman, editors, The Cambridge Handbook of Expertise and Expert Performance. Cambridge Univ.Press, 2006.
[16] P. M. Fitts and M. I. Posner. Human Performance. Brooks/Cole Publishing Co., 1967.
[17] R. L. Glass. Facts and Fallacies of Software Engineering.Addison-Wesley Professional, 2002.
[18] R. L. Gorsuch. Factor Analysis. Lawrence Erlbaum Associates, second edition, 1983.
[19] L. L. Guttman. The basis for scalogram analysis. In G. M. Maranell, editor, Scaling: A Sourcebook for Behavioral Scientists, chapter 13, pages 142–171. Transaction Publishers, 2007.
[20] J. E. Hannay, E. Arisholm, H. Engvik, and D. I. K. Sjøberg. Personality and pair programming. Transactions on Software Engineering, 36(1):61–80, January/February 2010.
[21] J. E. Hannay and M. Jørgensen. The role of deliberate articial design elements in software engineering experiments. IEEE Trans. Software Eng., 34:242–259, Mar/Apr 2008.
[22] T. Hærem. Task Complexity and Expertise as Determinants of Task Perceptions and Performance: Why Technology Structure Research has been Unreliable and Inconclusive. PhD thesis, Norwegian School of Management BI, 2002.
[23] V. B. Kampenes, T. Dybå, J. E. Hannay, and D. I. K. Sjøberg. A systematic review of quasi-experiments in software engineering. Information and Software Technology, 51:71–82,2009.
[24] A. Karahasanović, A. K. Levine, and R. C. Thomas. Comprehension strategies and difficulties in maintaining object-oriented systems: An explorative study. J. Systems and Software, 80:1541--1559, 2007.
[25] A. Karahasanović and R. C. Thomas. Difficulties experienced by students in maintaining object-oriented systems: An empirical study. In S. Mann, editor, Proc. Ninth Australasian Computing Education Conference (ACE2007), Conferences in Research and Practice in Information Technology (CRPIT), vol. 66, pages 81--87. Australian Computer Society, Inc., 2007.
[26] R. B. Kline. Principles and Practice of Structural Equation Modeling. The Guilford Press, second edition, 2005.
[27] K. Kværn. Effects of expertise and strategies on program comprehension in maintenance of object-oriented systems: A controlled experiment with professional developers. Master's thesis, Institutt for Informatikk, Universitetet i Oslo, 2006.
[28] S.-Y. Lee. Structural Equation Modelling. A Bayesian Approach. Wiley, 2007.
[29] J. C. Loehlin. Latent Variable Models: An Introduction to Factor, Path, and Structural Equation Analysis. Lawrence Erlbaum Associates, fourth edition, 2003.
[30] J. McCall, Quality factors, In J. J. Marciniak, editor, Encyclopedia of Software Engineering, vol. 2, pp. 958–969, 1994.
[31] A. Newell and P. Rosenbloom. Mechanisms of skill acquisition and the law of practice. In J. R. Anderson, editor, Cognitive Skills and their Acquisition, chapter 1, pages 1–56. Lawrence Erlbaum Associates, Inc., 1981
[32] L. Prechelt and F. F. Informatik. An empirical study of working speed differences between software engineers for various kinds of task, 2000. Technical report
[33] W. R. Shadish, T. D. Cook, and D. T. Campbell. Experimental and Quasi-Experimental Designs for Generalized Causal Inference. Houghton Mifflin, 2002.
[34] F. L. Schmidt and J. E. Hunter. The validity and utility of selection methods in personnel psychology: Practical and theoretical implications of 85 years of research findings. Psychological Bulletin, 124(2):262–274, 1998.
[35] J. Shanteau. Competence in experts: The role of task characteristics. Organizational Behavior and Human Decision Processes, 53:252–266, 1992.
[36] J. Shanteau, D. J. Weiss, R. P. Thomas, J. C. Pounds, “Performance-based assessment of expertise: How to decide if someone is an expert or not,” European Journal of Operational Research 136: 253–263, 2002.
[37] J. Spolsky. Smart & Gets Things Done. Apress, 2007. [38] S. Wiedenbeck, V. Fix, and J. Scholtz, “Characteristics of the mental
representations of novice and expert programmers: An empirical study,” Int. J. Man-Machine Studies, vol. 39:793–812, 1993.
This is a preprint version of: Bergersen, G. R., Hannay, J. E., Sjøberg, D. I. K., Dybå, T., & Karahasanovic, A. (2011). Inferring skill from tests of programming performance: Combining quality and time. In 3rd IEEE International Symposium on Empirical Software Engineering and Measurement (ESEM'2011) (pp. 305-314). Banff, Canada: IEEE Computer Society. doi:10.1109/ESEM.2011.39
Accepted 2011-May-15 Not suitable for citation Copyright IEEE 2011