Integrated Genomic Analysis Identifies Clinically Relevant Subtypes of Glioblastoma Characterized by...
25
An integrated genomic analysis identifies clinically relevant subtypes of glioblastoma characterized by abnormalities in PDGFRA, IDH1, EGFR and NF1 Roel G.W. Verhaak 1,2,* , Katherine A. Hoadley 3,4,* , Elizabeth Purdom 5 , Victoria Wang 6 , Yuan Qi 4,7 , Matthew D. Wilkerson 4,7 , C. Ryan Miller 4,8 , Li Ding 9 , Todd Golub 1,10 , Jill P. Mesirov 1 , Gabriele Alexe 1 , Michael Lawrence 1,2 , Michael O’Kelly 1,2 , Pablo Tamayo 1 , Barbara A. Weir 1,2 , Stacey Gabrie 1 , Wendy Winckler 1,2 , Supriya Gupta 1 , Lakshmi Jakkula 11 , Heidi S. Feiler 11 , J. Graeme Hodgson 12 , C. David James 12 , Jann N. Sarkaria 13 , Cameron Brennan 14 , Ari Kahn 15 , Paul T. Spellman 11 , Richard K. Wilson 9 , Terence P. Speed 5,16 , Joe W. Gray 11 , Matthew Meyerson 1,2 , Gad Getz 1 , Charles M. Perou 3,4,8 , D. Neil Hayes 4,7,‡ , and The Cancer Genome Atlas Research Network 1 The Eli and Edythe L. Broad Institute of Massachusetts Institute of Technology and Harvard University, Cambridge, Massachusetts 02142, USA. 2 Department of Medical Oncology, Dana-Farber Cancer Institute, Boston, Massachusetts 02115, USA. 3 Department of Genetics, University of North Carolina at Chapel Hill, Chapel Hill, NC 27599, USA. 4 Department of Lineberger Comprehensive Cancer Center, University of North Carolina at Chapel Hill, Chapel Hill, NC 27599, USA. 5 Department of Statistics, University of California, Berkeley, California 94720, USA. 6 Group in Biostatistics, University of California, Berkeley, California 94720, USA. 7 Department of Internal Medicine, Division of Medical Oncology, University of North Carolina at Chapel Hill, Chapel Hill, NC 27599, USA. 8 Department of Pathology and Laboratory Medicine, University of North Carolina at Chapel Hill, Chapel Hill, NC 27599, USA. 9 The Genome Center at Washington University, Department of Genetics, Washington University School of Medicine, St. Louis, Missouri 63108, USA. 10 Department of Pediatric Oncology, Center for Cancer Genome Discovery, Dana-Farber Cancer Institute, Boston, Massachusetts 02115, USA. 11 Life Sciences Division, Lawrence Berkeley National Laboratory, Berkeley, California 94720, USA. © 2009 Elsevier Inc. All rights reserved. ‡Corresponding Author. * These authors contributed equally to the work. Publisher's Disclaimer: This is a PDF file of an unedited manuscript that has been accepted for publication. As a service to our customers we are providing this early version of the manuscript. The manuscript will undergo copyediting, typesetting, and review of the resulting proof before it is published in its final citable form. Please note that during the production process errors may be discovered which could affect the content, and all legal disclaimers that apply to the journal pertain. SUPPLEMENTAL DATA The Supplemental Data include Supplemental Experimental Procedures, seven tables, and seven figures. Additional files are on TCGA website [http://tcga-data.nci.nih.gov/docs/publications/gbm_exp/]. NIH Public Access Author Manuscript Cancer Cell. Author manuscript; available in PMC 2011 January 19. Published in final edited form as: Cancer Cell. 2010 January 19; 17(1): 98. doi:10.1016/j.ccr.2009.12.020. NIH-PA Author Manuscript NIH-PA Author Manuscript NIH-PA Author Manuscript
-
Upload
independent -
Category
Documents
-
view
0 -
download
0
Transcript of Integrated Genomic Analysis Identifies Clinically Relevant Subtypes of Glioblastoma Characterized by...
An integrated genomic analysis identifies clinically relevantsubtypes of glioblastoma characterized by abnormalities inPDGFRA IDH1 EGFR and NF1
Roel GW Verhaak12 Katherine A Hoadley34 Elizabeth Purdom5 Victoria Wang6 YuanQi47 Matthew D Wilkerson47 C Ryan Miller48 Li Ding9 Todd Golub110 Jill PMesirov1 Gabriele Alexe1 Michael Lawrence12 Michael OrsquoKelly12 Pablo Tamayo1Barbara A Weir12 Stacey Gabrie1 Wendy Winckler12 Supriya Gupta1 LakshmiJakkula11 Heidi S Feiler11 J Graeme Hodgson12 C David James12 Jann N Sarkaria13Cameron Brennan14 Ari Kahn15 Paul T Spellman11 Richard K Wilson9 Terence PSpeed516 Joe W Gray11 Matthew Meyerson12 Gad Getz1 Charles M Perou348 D NeilHayes47Dagger and The Cancer Genome Atlas Research Network1The Eli and Edythe L Broad Institute of Massachusetts Institute of Technology and HarvardUniversity Cambridge Massachusetts 02142 USA2Department of Medical Oncology Dana-Farber Cancer Institute Boston Massachusetts 02115USA3Department of Genetics University of North Carolina at Chapel Hill Chapel Hill NC 27599 USA4Department of Lineberger Comprehensive Cancer Center University of North Carolina at ChapelHill Chapel Hill NC 27599 USA5Department of Statistics University of California Berkeley California 94720 USA6Group in Biostatistics University of California Berkeley California 94720 USA7Department of Internal Medicine Division of Medical Oncology University of North Carolina atChapel Hill Chapel Hill NC 27599 USA8Department of Pathology and Laboratory Medicine University of North Carolina at Chapel HillChapel Hill NC 27599 USA9The Genome Center at Washington University Department of Genetics Washington UniversitySchool of Medicine St Louis Missouri 63108 USA10Department of Pediatric Oncology Center for Cancer Genome Discovery Dana-Farber CancerInstitute Boston Massachusetts 02115 USA11Life Sciences Division Lawrence Berkeley National Laboratory Berkeley California 94720 USA
copy 2009 Elsevier Inc All rights reservedDaggerCorresponding AuthorThese authors contributed equally to the workPublishers Disclaimer This is a PDF file of an unedited manuscript that has been accepted for publication As a service to our customerswe are providing this early version of the manuscript The manuscript will undergo copyediting typesetting and review of the resultingproof before it is published in its final citable form Please note that during the production process errors may be discovered which couldaffect the content and all legal disclaimers that apply to the journal pertainSUPPLEMENTAL DATAThe Supplemental Data include Supplemental Experimental Procedures seven tables and seven figures Additional files are on TCGAwebsite [httptcga-datancinihgovdocspublicationsgbm_exp]
NIH Public AccessAuthor ManuscriptCancer Cell Author manuscript available in PMC 2011 January 19
Published in final edited form asCancer Cell 2010 January 19 17(1) 98 doi101016jccr200912020
NIH
-PA Author Manuscript
NIH
-PA Author Manuscript
NIH
-PA Author Manuscript
12Department of Neurological Surgery University of California San Francisco CA 94143 USA13Department of Radiation Oncology Mayo Clinic Rochester MN 55905 USA14Department of Neurosurgery Memorial Sloan-Kettering Cancer Center New York NY 10065USA15SRA International Fairfax Virginia 22033 USA16Walter and Eliza Hall Institute Parkville Victoria 3052 Australia
SUMMARYThe Cancer Genome Atlas Network recently catalogued recurrent genomic abnormalities inglioblastoma (GBM) We describe a robust gene expression-based molecular classification of GBMinto Proneural Neural Classical and Mesenchymal subtypes and integrate multi-dimensionalgenomic data to establish patterns of somatic mutations and DNA copy number Aberrations andgene expression of EGFR NF1 and PDGFRAIDH1 each define Classical Mesenchymal andProneural respectively Gene signatures of normal brain cell types show a strong relation betweensubtypes and different neural lineages Additionally response to aggressive therapy differs bysubtype with greatest benefit in Classical and no benefit in Proneural We provide a framework thatunifies transcriptomic and genomic dimensions for GBM molecular stratification with importantimplications for future studies
Glioblastoma multiforme (GBM) is the most common form of malignant brain cancer in adultsAffected patients have a uniformly poor prognosis with a median survival of one year (Ohgakiand Kleihues 2005) thus advances on all scientific and clinical fronts are needed In an attemptto better understand glioblastoma many groups have turned to high dimensional profilingstudies Several examples include studies examining copy number alterations (Beroukhim etal 2007 Ruano et al 2006) and gene expression profiling studies identifying gene signaturesassociated with EGFR overexpression clinical features and survival (Freije et al 2004 Lianget al 2005 Mischel et al 2003 Murat et al 2008 Nutt et al 2003 Phillips et al 2006Shai et al 2003 Tso et al 2006)
The Cancer Genome Atlas (TCGA) Research Network (2008) has been established to generatethe comprehensive catalogue of genomic abnormalities driving tumorigenesis TCGAprovided a detailed view of the genomic changes in a large GBM cohort containing 206 patientsamples Sequence data of 91 patients and 601 genes were used to describe the mutationalspectrum of GBM confirming previously reported TP53 and RB1 mutations and identifyingGBM-associated mutations in genes such as PIK3R1 NF1 and ERBB2 Projecting copy numberand mutation data on the TP53 RB and receptor tyrosine kinase pathways showed that themajority of GBM tumors harbor abnormalities in all of these pathways suggesting that this isa core requirement for GBM pathogenesis
Currently only a few molecular factors show promise for prognosis or prediction of responseto therapy (Curran et al 1993 Kreth et al 1999 Scott et al 1998) An emerging prognosticfactor is the methylation status of the MGMT promoter (Hegi et al 2005) The TCGA GBMstudy (2008) suggested that MGMT methylation shifts the GBM mutation spectrum in contextof alkylating treatment a finding with potential clinical implications The inability to definedifferent patient outcomes based upon histopathological features illustrates a larger problemin our understanding of the classification of GBM
In the current study we leverage the full scope of TCGA data to paint a coherent portrait ofthe molecular subclasses of GBM
Verhaak et al Page 2
Cancer Cell Author manuscript available in PMC 2011 January 19
NIH
-PA Author Manuscript
NIH
-PA Author Manuscript
NIH
-PA Author Manuscript
RESULTSConsensus Clustering Identifies Four Subtypes of GBM
Factor analysis a robust method to reduce dimensionality was used to integrate data from 200GBM and two normal brain samples assayed on three gene expression platforms (AffymetrixHuEx array Affymetrix U133A array and Agilent 244K array) into a single unified datasetUsing the unified dataset we filtered the data to 1740 genes with consistent but highly variableexpression across the platforms Consensus average linkage hierarchical clustering (Monti etal 2003) of 202 samples and 1740 genes identified four robust clusters with clustering stabilityincreasing for k = 2 to k = 4 but not for k gt 4 (Figure 1A B) Cluster significance was evaluatedusing SigClust (Liu et al 2008) and all class boundaries were statistically significant (Figure1C) Samples most representative of the clusters hereby called ldquocore samplesrdquo (n=173 of 202)were identified based on their positive silhouette width (Rousseeuw 1987) indicating highersimilarity to their own class than to any other class member (Figure 1D) Genes correlated witheach subtype were selected using SAM and ROC methods ClaNC a nearest centroid-basedclassifier that balances the number of genes per class identified signature genes for all foursubtypes (Dabney 2006) An 840 gene signature (210 genes per class) was established fromthe smallest gene set with the lowest cross validation (CV) and prediction error Each of thesignatures was highly distinctive (Figure 2A signatures and gene lists for all analyses areavailable at [httptcga-data ncinihgovdocspublicationsgbm_exp])
These analyses were repeated on the three individual datasets demonstrating that unifying thedata improved CV error rates (Figure S1AndashE) Limiting the analysis to core samples reducedthe CV error rate from 89 to 46 validating their use as most representative of the cluster(Figure S1A B) Importantly our findings did not correlate with confounding factors wellknown to interfere with gene expression analysis such as batch sample purity or sample quality(Table 1 Figure S2) An exception was the sample collection center However the collectioncenters drew from different patient populations and the relationship to subtype is largely dueto strong clinical differences in their patients most notably age as discussed below
Validation of Subtypes in an Independent DatasetAn independent set of 260 GBM expression profiles was compiled from the public domain toassess subtype reproducibility (Beroukhim et al 2007 Murat et al 2008 Phillips et al2006 Sun et al 2006) The subtype of all samples was predicted using ClaNC and data werevisualized using the 840 classifying gene list (Figure 2A) Applying a similar ordering in thevalidation set clearly recapitulated the gene sample groups (Figure 2B) Importantly the foursubtypes were similarly proportioned in the validation and TCGA dataset as well as in all fourindividual validation dataset cohorts (Figure S2GndashL) Accounting for differences in samplesize and analytic techniques obvious concordance was seen between our classification and theresults from earlier studies (Supplemental Experimental Procedures and Figure S3) To relatetumor subtype to a relevant model system we obtained gene expression data from a collectionof xenografts The xenografts were established by direct implant of patient surgical specimensin athymic nullnull mice (Hodgson et al 2009) Proneural Classical and Mesenchymalsubtypes were also reflected in the xenografts (Figure 2C) By contrast attempts to detectcomparable transcriptional subtypes in immortalized cell lines were uninformative (data notshown)
Functional Annotation of SubtypesSubtype names were chosen based on prior naming and the expression of signature genesProneural Neural Classical and Mesenchymal To get insight into the genomic eventsdifferentiating the subtypes we used copy number data of 170 core samples which wererecently described by the TCGA Network (2008) Sequence data were available for 601 genes
Verhaak et al Page 3
Cancer Cell Author manuscript available in PMC 2011 January 19
NIH
-PA Author Manuscript
NIH
-PA Author Manuscript
NIH
-PA Author Manuscript
on 116 core samples 73 samples were previously described Fourteen amplifications and sevenhomozygous or hemizygous deletion events both broad and focal were found to be significantby the GISTIC methodology of which twelve events showed subtype associations (Table 2Figure S4) Several mutations correlated with subtype (Table 3)
ClassicalmdashChromosome 7 amplification paired with chromosome 10 loss is a highlyfrequent event in GBMs and was seen in 100 of the Classical subtype (Table 2) Whilechromosome 7 amplification was seen in tumors of other classes high level EGFRamplification was observed in 97 of the Classical and infrequently in other subtypes (plt001adjusted two-sided Fisherrsquos Exact test Table S1 Table 2 Figure 3) A corresponding andstatistically significant fourfold increase in EGFR expression was observed as compared to theremainder of the samples (plt001 two-sided Studentrsquos t-test) Twelve of twenty-two Classicalsamples contained a point or vIII EGFR mutation (Table 3 Figure 3) While alterations ofEGFR are likely important in many GBMs the Classical subtype demonstrates a focusedpredilection for genomic alteration of the gene as revealed by the integrated analysis In tandemwith high rates of EGFR alteration there was a distinct lack of TP53 mutations in the subsetof Classical samples sequenced (p=004 adjusted two-sided Fisherrsquos Exact test Table S2) eventhough TP53 is the most frequently mutated gene in GBM (TCGA 2008) Focal 9p213homozygous deletion targeting CDKN2A (encoding for both p16INK4A and p14ARF) was afrequent and significantly associated event in the Classical subclass (plt001 adjusted two-sided Fisherrsquos Exact test Table S1 Table 2) co-occurring with EGFR amplification in 94of the Classical subtype (Figure 3) Homozygous 9p213 deletion was almost mutuallyexclusive with aberrations of other RB pathway components such as RB1 CDK4 andCCDN2 This suggests that in samples with focal EGFR amplification the RB pathway isalmost exclusively affected through CDKN2A deletion Neural precursor and stem cell markerNES as well as Notch (NOTCH3 JAG1 LFNG) and Sonic hedgehog (SMO GAS1 GLI2)signaling pathways were highly expressed in the Classical subtype (Table S3A)
MesenchymalmdashFocal hemizygous deletions of a region at 17q112 containing the geneNF1 predominantly occurred in the Mesenchymal subtype (plt001 adjusted two-sidedFisherrsquos Exact test Table S1 Table 2) and the majority of samples had lower NF1 expressionlevels (plt001 two-sided Studentrsquos t-test Figure 3) Although methylation profiles wereavailable no methylation probes were present in or adjacent to the NF1 locus NF1 mutationswere found in 20 samples 14 of which were classified as Mesenchymal adding up to 53 ofsamples with NF1 abnormalities in this class Six of seven co-mutations of NF1 and PTENboth intersecting with the AKT pathway were observed in the Mesenchymal subtype (TableS4) The Mesenchymal subtype displayed expression of mesenchymal markers previouslydescribed such as CHI3L1 (also known as YKL40) and MET (Phillips et al 2006) Thecombination of higher activity of mesenchymal and astrocytic markers (CD44 MERTK) isreminiscent of a epithelial-to-mesenchymal transition that has been linked to dedifferentiatedand transdifferentiated tumors (Thiery 2002) Genes in the tumor necrosis factor super familypathway and NF-κB pathway such as TRADD RELB TNFRSF1A are highly expressed in thissubtype potentially as a consequence of higher overall necrosis and associated inflammatoryinfiltrates in the Mesenchymal class (Table 1 Table S3B)
ProneuralmdashTwo major features of the Proneural class were alterations of PDGFRA and pointmutations in IDH1 Focal amplifications of the locus at 4q12 harboring PDGFRA were seenin all subtypes of GBM but at a much higher rate in Proneural samples (p=001 adjusted two-sided Fisherrsquos Exact test Table S1 Table 2) The characteristic signature of PDGFRA inProneural samples however is best described as the concomitant focal amplification inconjunction with high levels of PDGFRA gene expression which is seen almost exclusively inthis tumor type (plt001 two-sided Studentrsquos t-test Figure 3) Four of the Proneural samples
Verhaak et al Page 4
Cancer Cell Author manuscript available in PMC 2011 January 19
NIH
-PA Author Manuscript
NIH
-PA Author Manuscript
NIH
-PA Author Manuscript
amplifying PDGFRA also harbor a PDGFRA mutation While a rare in frame deletion of theIg-domain of PDGFRA has been described in GBM (Kumabe et al 1992Rand et al 2005)the multiple PDGFRA point mutations observed here were in the Ig-domain potentiallydisrupting ligand interaction (Figure S5) Interestingly eleven out of twelve mutations in theisocitrate dehydrogenase 1 gene IDH1 were found in this class (plt001 adjusted two-sidedFisherrsquos Exact test Table S2Table 2) most of which did not have a PDGFRA abnormality(Figure 3) TP53 mutations and loss of heterozygosity were frequent events in this subtype(Table 3Figure 3) The majority of the TP53 mutations (2036 p=01 adjusted two-sidedFisherrsquos Exact test Table S2) as well as TP53 LOH (1015) were located in Proneural samplesThe classical GBM event chromosome 7 amplification paired with chromosome 10 loss wasdistinctly less prevalent and occurred in only 54 of Proneural samples (chromosome 7plt001 chromosome 10 p=002 adjusted two-sided Fisherrsquos Exact test Table S1Table 2)The Proneural group showed high expression of oligodendrocytic development genes such asPDGFRA NKX2-2 and OLIG2 (Noble et al 2004) underlining its status as atypical GBMsubtype High expression of OLIG2 has shown to be able to downregulate the tumor suppressorp21 (CDKN1A) thereby increasing proliferation (Ligon et al 2007) and CDKN1A expressionis indeed lower in this class (data not shown) Ten of sixteen PIK3CAPIK3R1 mutationsidentified were found in the Proneural subtype and were mostly observed in samples with noPDGFRA abnormalities The Proneural signature further contained several proneuraldevelopment genes such as SOX genes as well as DCX DLL3 ASCL1 and TCF4 (Phillips etal 2006) Gene ontology (GO) categories identified for the Proneural subtype involveddevelopmental processes and a previously-identified cell cycleproliferation signature(Whitfield et al 2002) (Table S3C)
NeuralmdashThe Neural subtype was typified by the expression of neuron markers such as NEFLGABRA1 SYT1 and SLC12A5 GO categories associated with the Neural subtype includedneuron projection and axon and synaptic transmission (Table S3D) The two normal braintissue samples used in this dataset were both classified as the Neural subtype The majority(2533) of the Neural samples contained few normal cells on two pathology slides Pathologyslides for three samples of each subtype were re-reviewed and diagnosis of GBM wasconfirmed (Figure S6)
Glioblastoma Subtypes are Reminiscent of Distinct Neural Cell TypesTo gain insight into the biological meaning of the subtypes we used data from the braintranscriptome database presented by Cahoy et al (Cahoy et al 2008) to define gene setsassociated with neurons oligodendrocytes astrocytes and cultured astroglial cells Thesemature cells may be of interest both for their primary associations with tumor subtypes as wellas inherent signatures retained from progenitor cells Using these four gene sets a single-sample GSEA enrichment score was calculated for all samples (Figure 4) (Barbie et al2009) The enrichment score indicates how closely the expression in a sample reflects theexpected expression pattern of the gene set In this exploratory analysis we observed a numberof patterns associating each subtype with expression patterns from purified murine neural celltypes The Proneural class was highly enriched with the oligodendrocytic signature but not theastrocytic signature while the Classical group is strongly associated with the murine astrocyticsignature The Neural class shows association with oligodendrocytic and astrocyticdifferentiation but additionally had a strong enrichment for genes differentially expressed byneurons The Mesenchymal class was strongly associated with the cultured astroglial signatureInterestingly the majority of immortalized cell lines evaluated also demonstrated expressionpatterns most similar to the Mesenchymal subtype (data not shown) Additionally welldescribed microglia markers such as CD68 PTPRC and TNF are highly expressed in theMesenchymal class and the set of murine astroglial samples
Verhaak et al Page 5
Cancer Cell Author manuscript available in PMC 2011 January 19
NIH
-PA Author Manuscript
NIH
-PA Author Manuscript
NIH
-PA Author Manuscript
Subtypes and Clinical CorrelationsWe analyzed the associations between the subtypes and clinical and tumor characteristics forthe core samples (Table 1 Table S5) Median survival was 12 months for TCGA patients and15 months for the validation set representative of surgical case series Karnofsky performancescore (KPS) was high in the TCGA dataset with a median value of 90 The median age atdiagnosis for both the TCGA samples (57 years) and the validation samples (53 years) waslower than for United States population (64 years [httpwwwcbtrusorg]) likely reflectingbias of surgical resections All four tumor subtypes were found in each of the public datasetsused in the validation set and were distributed at similar proportion (Figure S2)
Three of four tumors known to be secondary GBMs were found in the Proneural group afinding consistent with the overall younger age of this subtype Recurrent tumors were foundin all subtypes and in three out of four paired primary-recurrent pairs from the Murat dataset(Murat et al 2008) suggest that tumors did not change class at recurrence (data not shown)The trend between prior treatment and a hypermutator phenotype as reported previously(TCGA 2008 Hunter et al 2006) is reflected in the observation that four of sevenhypermutated samples three of which were secondary GBMs were classified as ProneuralThere was no association of subtype with the percentage of tumor nuclei The finding of genesassociated with inflammation in the Mesenchymal subtype was consistent with a higher overallfraction of necrosis evident in these tumors (Table 1 and Figure S2)
The most consistent clinical association for tumor subtypes was age with younger patientsover-represented in the Proneural subtype (Figure S2) We note that the age distribution ofpatients differed across TCGA collection centers with MD Anderson having younger patients(median 53 years) and greater representation in the Proneural subtype Controlling for thisconfounder did not remove the link between age and subtype in TCGA samples (Table S5)Furthermore the trend with age was confirmed in the validation samples indicating that theage-subtype relationship was not due to an artifact introduced by the collection centersAlthough not statistically significant there was a trend toward longer survival for patients witha Proneural GBM in a combined analysis of TCGA and validation samples (HRgt1 for allsubtypes relative to Proneural) (Figure S7A) A significantly-improved outcome for patientswith a Proneural classification was achieved when grade II and III gliomas from two of thefour validation datasets were included in the analysis (Figure S7B) (Phillips et al 2006 Sunet al 2006)
Treatment Efficacy Differs per SubtypeWe examined the effect of more intensive treatment defined as concurrent chemo- andradiotherapy or more than three subsequent cycles of chemotherapy on survival Using theMurat data and TCGA data intensively treated patients were compared to patients with non-concurrent regimens or short chemotherapy regimens While aggressive treatment significantlyreduced mortality in Classical (HR=045 p=002) and Mesenchymal (HR=054 p=002)subtypes and efficacy was suggested in Neural (HR=056 p=01) it did not alter survival inProneural (HR=08 p=04 Figure 5) Dichotomous methylation status of the DNA repair geneMGMT which has been positively linked to response to therapy (Hegi et al 2005) was notassociated with subtype (Table 1)
DISCUSSIONHere we show that genomic profiling defined four subtypes of tumors with a commonmorphologic diagnosis of GBM The reproducibility of this classification was demonstratedin an independent validation set suggesting that it is highly unlikely that these GBM tumorsubtypes are a spurious finding due to technical artifact chance or bias in TCGA sample
Verhaak et al Page 6
Cancer Cell Author manuscript available in PMC 2011 January 19
NIH
-PA Author Manuscript
NIH
-PA Author Manuscript
NIH
-PA Author Manuscript
qualification criteria The importance of detecting these subtypes lies in the differenttherapeutic approaches that different subtypes may require Furthermore it is possible thatGBMs in specific subtypes develop as the result of different etiologies or different cells oforigin Studying GBMs in the light of subtypes therefore may accelerate our understanding ofGBM pathology A larger sample set might describe additional subtypes for which we lack thepower to detect Additionally we provide the community with the means to identify the tumorsubtypes prospectively [httptcga-data ncinihgovdocspublicationsgbm_exp]
In addition to validating the subtype in other human GBM datasets we identified geneexpression patterns of xenografts highly comparable to Proneural Classical and Mesenchymaltumors However identification of comparable cell line models was not as easily achievable(data not shown) For example there is a relative lack of EGFR amplification and EGFRvIIImutants in cell lines models potentially lost or selected against during the culturing processThe identification of valid subtype counterparts in xenografts represents an importantcontribution toward our ability of studying GBM subtypes in particular for modeling andpredicting therapeutic response
One of the most important aspects of this work is the unprecedented ability to examinemolecularly-defined tumor subtypes for correlations with both genome-wide DNA copynumber events and sequence-based mutation detection for 601 genes While a mechanisticexplanation of subtype is beyond the scope of this manuscript our cross-platform analyseshighlight a number of important characteristics of each subtype and hint at cell of origin Forexample the Proneural subtype was associated with younger age PDGFRA abnormalitiesIDH1 and TP53 mutations all of which have previously been associated with secondary GBM(Arjona et al 2006 Furnari et al 2007 Kleihues and Ohgaki 1999 Watanabe et al 1996Yan et al 2009) Most known secondary GBMs classified as Proneural (Table 1) In a previousstudy most grade III gliomas as well as 75 of lower grade gliomas from the validation setsclassified as Proneural or Neural (Phillips et al 2006) While it is outside the scope of thecurrent manuscript to establish the etiology of the classes the Proneural TCGA class wasenriched both for secondary GBM established by prior lower-grade histology and for IDH1mutations which are known to be prevalent in secondary GBM Other tumors in this classwhich appear to be clinically de novo (primary) may share common pathogenesis withsecondary GBM and might arise from lower grade lesions which are clinically silentAlternatively Proneural GBM tumors may arise from a progenitor or neural stem cell that canalso give rise to oligodendrogliomas thereby sharing similar characteristics High similaritywith a purified oligodendrocytic signature and previous work identifying high expression ofPDGFRA in cells of the SVZ give credence to this hypothesis (Jackson et al 2006)
The identity of the Classical subtype is defined by the constellation of the most commongenomic aberrations seen in GBM with 93 of samples harboring chromosome 7amplifications and 10 deletions 95 showing EGFR amplification and 95 showinghomozygous deletion spanning the Ink4aARF locus This class also shows a distinct lack ofadditional abnormalities in TP53 NF1 PDGFRA or IDH1
In the current study we also confirm the presence of a Mesenchymal subtype characterized byhigh expression of CHI3L1 and MET (Phillips et al 2006) A striking characteristic of thisclass was the strong association with the recently reported high frequency of NF1 mutationdeletion and low levels of NF1 mRNA expression overall Inherited NF1 mutations areassociated with a variety of tumors including neurofibromas which reportedly have a Schwanncell-like origin (Zhu et al 2002) Although Schwann cells are not present in the central nervoussystem the Mesenchymal class expresses Schwann cell markers such as the family S100A aswell as microglial markers The higher percentage necrosis and associated inflammation
Verhaak et al Page 7
Cancer Cell Author manuscript available in PMC 2011 January 19
NIH
-PA Author Manuscript
NIH
-PA Author Manuscript
NIH
-PA Author Manuscript
present in these samples is potentially linked to the mesenchymal phenotype through anexpression signature including genes from wound healing and NF-κB signaling
Samples in the Neural subtype are unequivocally GBMs by morphology by light microscopyand contain mutation and DNA copy number alterations Their expression patterns arerecognizable as the most similar to samples derived from normal brain tissue and theirsignature is suggestive of a cell with a differentiated phenotype This is confirmed by theassociation with neural astrocytic and oligodendrocytic gene signatures
Cellular organization and differentiation in the brain has been intensively investigated yet thereis much to be discovered It is therefore striking to find the clear relationships between subtypesof GBM and cellular lineages as demonstrated here (Figure 4) It is possible that a commoncell of origin such as the previously proposed neural stem cell (Galli et al 2004) exists forall GBMs and that the classes presented here result from distinct differentiation pathsHowever the presence of precursor cells with self replicating ability in the brain such as cellsexpressing stem cell markers and PDGFRA or EGFR (Jackson et al 2006) suggests thatmultiple stem cell-like populations exist While there is a clear need for conclusive evidencesupporting this hypothesis it is at least striking to find the same genes as markers of two ofthe four classes lending support for a difference in cell of origin This is further supported bythe specific characteristics of the Mesenchymal and Neural class Establishing the cell of originof GBM is critical for establishing effective treatment regimens (Sanai et al 2005)
Given the set of characteristic subtype abnormalities we deem it unlikely that patientstransition between subtypes during different stages of their disease This is substantiated byseveral samples in the Murat et al dataset that did not switch between subtype after recurrence
An association was observed between the Proneural subtype and age and a trend towards longersurvival Furthermore our data suggest that Proneural samples do not have a survival advantagefrom aggressive treatment protocols Importantly a clear treatment effect was observed in theClassical and Mesenchymal subtypes Profiling-based classification may therefore havehighest clinical relevance in suggesting different therapeutic strategies It appears that thesimple classification into these four subtypes carries a rich set of associations for which thereis no existing diagnostic test We envision that the next generation of biomarker assays forGBM could include a molecular test for subtype and linked molecular genetics for key geneticevents including NF1 and PTEN loss IDH1 and PI3K mutation PDGFRA and EGFRamplification (ie genetic events that are best assayed on the DNA level) and MGMTmethylation status Additionally early evidence suggests that subclasses differ measurably bysignal transduction pathways such that protein biomarkers might be easily measured (Brennanet al 2009) Future studies should further elucidate the intricate relationship between tumorsubtypes treatment sensitivity and MGMT methylation status
GBM is one of the most feared of all of human diseases both for its near uniformly fatalprognosis and associated loss of cognitive function as part of the disease process For thosefacing the diagnosis there are few biomarkers of favorable prognosis and accordingly fewtherapies strongly influencing disease outcome This comprehensive genomic- and genetic-based classification of GBM should lay the groundwork for an improved molecularunderstanding of GBM pathway signaling that could ultimately result in personalized therapiesfor groups of GBM patients
Verhaak et al Page 8
Cancer Cell Author manuscript available in PMC 2011 January 19
NIH
-PA Author Manuscript
NIH
-PA Author Manuscript
NIH
-PA Author Manuscript
EXPERIMENTAL PROCEDURESPatients and Tumor Samples
Glioblastomas and normal brain samples were collected and processed through the TCGABiospecimens Core Resource at the International Genomics Consortium Phoenix Arizona asdescribed (TCGA 2008) Two hundred GBMs and two normal samples were selected byfollowing the subsequent criteria 1) an average percent necrosis less than 40 on top andbottom slides 2) microarray quality controls within standards and 3) high-quality data on eachof the three gene expression platforms used All specimens were collected using IRB-approvedprotocols and de-identified to ensure patient confidentiality Patient characteristics aredescribed in Table 1 and S7 In the TCGA dataset each sample represents a unique case Thetwo normal samples were from epilepsy patients
Microarray ExperimentsEach specimen was assayed on three different microarray platforms Affymetrix Human Exon10 ST GeneChips Affymetrix HT-HG-U133A GeneChips and custom designed Agilent244000 feature Gene Expression Microarrays Microarray labeling and hybridizationprotocols and quality control measures for each platform were performed as described(TCGA 2008) Probes on all three platforms were aligned to a transcript database consistingof RefSeq (361) and complete coding sequences from GenBank (v161) Gene centricexpression values were generated for every gene with at least five perfect-match probes(Affymetrix) On the Agilent platform a minimum of three probes (60mers) per gene wasrequired (each unique probe was spotted in triplicate) This resulted in expression values for12042 (HT-HG-U133A) 18632 (Exon) and 18623 (Agilent) genes Affymetrix HT-HG-U133A and Exon platforms were normalized and summarized using robust multichip average(RMA) Agilent data were lowess normalized log transformed and the mean was used tocalculate gene level summaries All data are MAGE-TAB compliant with all raw and processeddata investigation description files sample data relationship files and array description filesavailable through the TCGA Data Portal at [httptcga-datancinihgov] For a detaileddescription of the data see the TCGA Data Primer[httptcga-data ncinihgovdocsTCGA_Data_Primerpdf] as well as supplementarymethods from the TCGA Network Manuscript (2008)
Integrating Gene Expression PlatformsEach microarray platform provides an estimate of the gene expression taking advantage ofthis we used factor analysis to integrate these measurements together into a single estimate ofthe relative gene expression that is more robust than any single platform-based measurement(Mardia et al 1979) All data were log transformed and median centered for analysis To ensureconsistency in measurements of gene expression probes for all platforms were mapped to thesame transcript database and gene centric probe sets were created as described (TCGA2008) Data from each platform were normalized and summarized separately resulting in geneexpression estimates for each sample and gene on each platform relative gene expressionvalues were calculated per platform by subtracting from the gene estimate the mean expressionvalue across patients and then dividing it by its standard deviation across patients We verifiedthat the three datasets were generally detecting similar transcript levels The factor analysismodel assumes that for each gene the relative gene expression measured on each platform hasan unknown linear relationship with the true relative gene expression with platform-dependenterror this relationship is assumed to be the same for every sample Factor analysis thencalculates estimates of this true relative gene expression for each sample We applied factoranalysis to genes present on all three platforms this resulted in a unified gene estimate for eachsample for 11861 genes (Supplemental Experimental Procedures)
Verhaak et al Page 9
Cancer Cell Author manuscript available in PMC 2011 January 19
NIH
-PA Author Manuscript
NIH
-PA Author Manuscript
NIH
-PA Author Manuscript
The factor analysis provided estimates only of relative gene expression scaled to have the sameunderlying variation among patients for all genes We rescaled the unified gene expression ofeach gene by estimates of the standard deviation across patients To obtain a single estimateof standard deviation per gene we took the Median Absolute Deviation (MAD) for eachplatform and then averaged these estimates restricting to those platforms with high correlationto the unified gene estimates (Supplemental Experimental Procedures) This gave a singleestimate of variation per gene that we then used to rescale the unified gene estimates
Data FilteringSeveral filters were applied to eliminate unreliably-measured genes and limit the clustering torelevant genes The first filter removed genes that had poor unified gene measurements bykeeping only genes in which at least two of the three platformsrsquo original measurements hadcorrelation with the unified gene estimate of at least 07 resulting in 9255 genes The secondfilter eliminated genes with low variability across patients 1903 variably-expressed geneswere retained by selecting genes with a MAD on each original platform (restricting to platformswith high correlation to the unified estimate) higher than 05 The final filter excluded genesby comparing the MAD on each individual platform and the combined estimate of variationdescribed above and rejecting genes for which these measures differed by more than a factorof 15 for any platform again restricting to platforms with high correlation with the unifiedestimate Implementation of these three filters resulted in 1740 genes (SupplementalExperimental Procedures) All data including the individual gene expression estimates unifiedestimates and filtered datasets can be found at[httptcga-data ncinihgovdocspublicationsgbm_exp]
Identification of Gene Expression-based SubtypesWe applied hierarchical clustering with agglomerative average linkage as our basis forconsensus clustering to detect robust clusters (Monti et al 2003) The distance metric was 1-(Pearsonrsquos correlation coefficient) and the procedure was run over 1000 iterations and asubsampling ratio of 08 using the 200 GBM samples and two normal samples and 1740reliably-expressed genes SigClust was performed to establish the significance of the clustersin a pairwise fashion (Liu et al 2008) Because we cannot know the true number of classesand it is possible that some samples do not accurately represent their pathogenic class weidentified the ldquocorerdquo members of each subtype by calculating silhouette width values for allsamples (Rousseeuw 1987) Silhouette width is defined as the ratio of each samplersquos averagedistance to samples in the same cluster to the smallest distance to samples not in the samecluster Only samples with positive silhouette values were retained for further analysis as theybest represented each subtype (R-package Silhouette)
Signature Gene Identification and Class PredictionWe applied Significance Analysis of Microarrays (SAM) and receiver operating characteristic(ROC) curves methods to identify marker genes of each subtype (Tusher et al 2001) Eachclass was compared to the other three classes combined and each class was compared to theother three individual classes in a pairwise manner (Supplemental Experimental Procedures)We provide both rank order and test statistic for all of these analyses to allow independentconfirmation of our findings on future analyses and datasets ClaNC a nearest centroid-basedclassification algorithm was used to find signatures of each class to assess class crossvalidation error and to predict subtype in the validation set (Dabney 2006)
Association with Gene OntologyGene ontology was assessed for each subtype using the Database for Annotation Visualizationand Integrated Discovery (DAVID Dennis et al 2003) For each subtype highly-expressed
Verhaak et al Page 10
Cancer Cell Author manuscript available in PMC 2011 January 19
NIH
-PA Author Manuscript
NIH
-PA Author Manuscript
NIH
-PA Author Manuscript
genes per class were compared to the background gene list (n=11861 genes) to discoverenriched GO terms
Validation DatasetTo verify class signatures in independent samples expression profiles of GBM samples from260 patients were collected from four published studies that used the HG-U133A or HG-U133plus2 GeneChip platforms (Beroukhim et al 2007 Murat et al 2008 Phillips et al2006 Sun et al 2006) Probes on these platforms were mapped to the transcript database asused for TCGA samples and the data were combined (Liu et al 2007) The 260 samples werenormalized together using quantile normalization and the matchprobes package (Huber andGentleman 2004) Probe intensities were summarized as expression levels using RMA(Irizarry et al 2003) We then used ClaNC to predict the subtype of the samples in this publicvalidation dataset To confirm copy number events related to the subtypes we used copynumber data available for 43 samples in the validation set (Beroukhim et al 2007) Copynumber profiles for these 43 samples were generated using Affymetrix 100K arrays and wereprocessed analogous to the TCGA dataset
Correlation with Copy Number EventsCopy number data were available for 170 of the 173 core GBM samples and were examinedfor correlations with subtype Genome wide copy number was estimated using four datasetsrepresenting three platforms as described (TCGA 2008) Briefly the circular binarysegmentation algorithm (Olshen et al 2004) was used to estimate raw copy number forgenomic segments Thresholds derived from the amount of noise in each platform were thenapplied to identify broad low level copy number events High level gains and homozygousdeletions were assessed using sample specific thresholds based on the maximum and minimumof medians observed for each chromosome arm plus a small buffer The GISTIC algorithmwas then applied to thresholds to detect regions of shared copy number aberration (Beroukhimet al 2007) Copy number alterations were considered to be present when identified on at leasttwo out of four datasets
Mutation AnalysesExon sequence data were available for 601 genes and 116 out of 173 core samples through theTCGA web portal [httptcga-datancinihgov] Sequence data were used from the followingarchives (hgscbcmedu_GBMABI1230 2008-31-10 broadmitedu_GBMABI12902008-10-31 genomewustledu_GBMABI53100 2008-10-31) Somatic mutations wereassessed analogous to the TCGA Network manuscript (2008) and only validated or verifiedmutations by at least one additional technique were considered Gene coverage per sample isin Table S6
Statistical Analysis of Copy Number and MutationsAssociation of copy number alterations or mutations was determined by comparing eachsubtype versus the rest using a two-tailed Fishers exact test correcting for multiple testingusing the Hochberg method implemented in padjust (R Development Core Team 2008) forcontrolling the Family-wise Error rate For mutation analysis only mutations found in at leastfour samples were tested Detailed table with p-values and all copy number regions analyzedand mutations are in Table S1 and Table S2
Gene Sets and Single Sample GSEAGene sets were generated using the transcriptome database presented in Cahoy at al (Cahoyet al 2008) (GEO ID GSE9566) Expression values for 17021 murine genes were generatedusing gene centric probe set definitions (Liu et al 2007) Hierarchical clustering of 38 normal
Verhaak et al Page 11
Cancer Cell Author manuscript available in PMC 2011 January 19
NIH
-PA Author Manuscript
NIH
-PA Author Manuscript
NIH
-PA Author Manuscript
murine brain samples in this dataset resulted in four clusters associated with the four differentsample types described SAM analysis resulted in signatures of four neural differentiationstages which were translated to human signatures through mapping gene names to EnsemblIDs
For a given GBM sample gene expression values were rank-normalized and rank-ordered TheEmpirical Cumulative Distribution Functions (ECDF) of the genes in the signature and theremaining genes were calculated A statistic was calculated by an integration of the differencebetween the ECDFs which is similar to the one used in Gene Set Enrichment Analysis butbased on absolute expression rather than differential expression (Barbie et al 2009)
The details of the procedure are as follows for a given signature G of size NG and single sampleS of the dataset of N genes the genes are replaced by their ranks according to their absoluteexpression L = r1 r2 r3helliprN and rank ordered An enrichment score ES(G S) is obtainedby a weighted sum (integration) of the difference between the ECDF of the genes in thesignature PG and the ECDF of the remaining genes PNG
This calculation was repeated for the four signatures and each sample in the dataset Noticethat this quantity is signed and that the exponent frac14 adds a slight weight proportional to therank
Statistical Analysis of Clinical ParametersAll analyses were done in R (R Development Core Team 2008) Statistical significance ofdifferential representation of sequence mutations and copy number alterations in the fourgenomically-defined subtypes was calculated using chi-square analysis and Fisherrsquos exact testFor the continuous variables age and Karnofsky score we used ANOVA to assess differencesamong subtypes Possible effects due to the specimen collection center were controlled byincluding both collection center and subtype identification in a 2-way ANOVA Sun et al(Sun et al 2006) categorized time dependent variables in 5 year bins which for comparabilitywere transformed to median values of the interval with lsquogt60rsquo being coded as censored forsurvival data We determined whether these variables were significant in predicting subtypeby using a multinomial generalized linear model For the categorical variables sex collectioncenter TCGA batch and tumor type (primary versus secondary or recurrent) the chi-squaredtest of independence was used to assess their relationship to subtype For the pathological dataon the tumors the results from the bottom and top slides were averaged to get the percentnecrosis and percent tumor nuclei in the sample Their association to subtype was assessedusing a 2-way ANOVA after logit transformation while controlling for collection center Toassess the relationship of survival to subtype we performed the Mantel-Haenszel testimplemented in the package survival in R
SIGNIFICANCE
This work expands upon previous glioblastoma classification studies by associating knownsubtypes with specific alterations in NF1 and PDGFRAIDH1 and by identifying two
Verhaak et al Page 12
Cancer Cell Author manuscript available in PMC 2011 January 19
NIH
-PA Author Manuscript
NIH
-PA Author Manuscript
NIH
-PA Author Manuscript
additional subtypes one of which is characterized by EGFR abnormalities and wild typep53 In addition the subtypes have specific differentiation characteristics which combinedwith data from recent mouse studies suggest a link to alternative cells of origin Togetherthis provides a framework for investigation of targeted therapies Temozolomide andradiation a common treatment for glioblastoma has demonstrated a significant increase insurvival Our analysis illustrates that a survival advantage in heavily treated patients variesby subtype with Classical or Mesenchymal subtypes having significantly delayed mortalitythat was not observed in Proneural
Supplementary MaterialRefer to Web version on PubMed Central for supplementary material
AcknowledgmentsWe thank the members of TCGA Research Network in particular Lynda Chin for reviewing this manuscript Wethank Michele Hayward for editorial assistance This work was supported by the following grants from the UnitedSates Department of Energy and the United States National Institutes of Health U54HG003067 U54HG003079(RKW) U54HG003273 U24CA126543 U24CA126544 (CMP) U24CA126546 (MM) U24CA126551 (JWG)U24CA126554 U24CA126561 U24CA126563 P50CA58223 (CMP) RR023248 (DNH) CA108961 (JNS)CA127716 (JNS) NS49720 (CDJ) CA097257 (CDJ) DE-AC02-05CH11231 (JWG) RGWV is supported by aFellowship from the Dutch Cancer Society KWF
REFERENCESArjona D Rey JA Taylor SM Early genetic changes involved in low-grade astrocytic tumor
development Curr Mol Med 20066645ndash650 [PubMed 17022734]Barbie DA Tamayo P Boehm JS Kim SY Moody SE Dunn IF Schinzel AC Sandy P Meylan E
Scholl S et al Systematic RNA interference reveals that oncogenic KRAS-driven cancers requireTBK1 Nature 2009 in press
Beroukhim R Getz G Nghiemphu L Barretina J Hsueh T Linhart D Vivanco I Lee JC Huang JHAlexander S et al Assessing the significance of chromosomal aberrations in cancer methodologyand application to glioma Proc Natl Acad Sci U S A 200710420007ndash20012 [PubMed 18077431]
Brennan C Momota H Hambardzumyan D Ozawa T Tandon A Pedraza A Holland E Glioblastomasubclasses can be defined by activity among signal transduction pathways and associated genomicalterations PLoS One 2009 101371journalpone0007752
Cahoy JD Emery B Kaushal A Foo LC Zamanian JL Christopherson KS Xing Y Lubischer JL KriegPA Krupenko SA et al A transcriptome database for astrocytes neurons and oligodendrocytes anew resource for understanding brain development and function J Neurosci 200828264ndash278[PubMed 18171944]
Curran WJ Jr Scott CB Horton J Nelson JS Weinstein AS Fischbach AJ Chang CH Rotman M AsbellSO Krisch RE et al Recursive partitioning analysis of prognostic factors in three Radiation TherapyOncology Group malignant glioma trials J Natl Cancer Inst 199385704ndash710 [PubMed 8478956]
Dabney AR ClaNC point-and-click software for classifying microarrays to nearest centroidsBioinformatics 200622122ndash123 [PubMed 16269418]
Dennis G Jr Sherman BT Hosack DA Yang J Gao W Lane HC Lempicki RA DAVID Database forAnnotation Visualization and Integrated Discovery Genome Biol 20034P3 [PubMed 12734009]
Freije WA Castro-Vargas FE Fang Z Horvath S Cloughesy T Liau LM Mischel PS Nelson SF Geneexpression profiling of gliomas strongly predicts survival Cancer Res 2004646503ndash6510 [PubMed15374961]
Furnari FB Fenton T Bachoo RM Mukasa A Stommel JM Stegh A Hahn WC Ligon KL Louis DNBrennan C et al Malignant astrocytic glioma genetics biology and paths to treatment Genes Dev2007212683ndash2710 [PubMed 17974913]
Verhaak et al Page 13
Cancer Cell Author manuscript available in PMC 2011 January 19
NIH
-PA Author Manuscript
NIH
-PA Author Manuscript
NIH
-PA Author Manuscript
Galli R Binda E Orfanelli U Cipelletti B Gritti A De Vitis S Fiocco R Foroni C Dimeco F VescoviA Isolation and characterization of tumorigenic stem-like neural precursors from humanglioblastoma Cancer Res 2004647011ndash7021 [PubMed 15466194]
Hegi ME Diserens AC Gorlia T Hamou MF de Tribolet N Weller M Kros JM Hainfellner JA MasonW Mariani L et al MGMT gene silencing and benefit from temozolomide in glioblastoma N EnglJ Med 2005352997ndash1003 [PubMed 15758010]
Hodgson JG Yeh RF Ray A Wang NJ Smirnov I Yu M Hariono S Silber J Feiler HS Gray JW etal Comparative analyses of gene copy number and Mrna expression in GBM tumors and GBMxenografts Neuro Oncol 2009
Huber W Gentleman R matchprobes a Bioconductor package for the sequence-matching of microarrayprobe elements Bioinformatics 2004201651ndash1652 [PubMed 14988118]
Hunter C Smith R Cahill DP Stephens P Stevens C Teague J Greenman C Edkins S Bignell GDavies H et al A hypermutation phenotype and somatic MSH6 mutations in recurrent humanmalignant gliomas after alkylator chemotherapy Cancer Res 2006663987ndash3991 [PubMed16618716]
Irizarry RA Bolstad BM Collin F Cope LM Hobbs B Speed TP Summaries of Affymetrix GeneChipprobe level data Nucleic Acids Res 200331e15 [PubMed 12582260]
Jackson EL Garcia-Verdugo JM Gil-Perotin S Roy M Quinones-Hinojosa A VandenBerg S Alvarez-Buylla A PDGFR alpha-positive B cells are neural stem cells in the adult SVZ that form glioma-likegrowths in response to increased PDGF signaling Neuron 200651187ndash199 [PubMed 16846854]
Kleihues P Ohgaki H Primary and secondary glioblastomas from concept to clinical diagnosis NeuroOncol 1999144ndash51 [PubMed 11550301]
Kreth FW Berlis A Spiropoulou V Faist M Scheremet R Rossner R Volk B Ostertag CB The roleof tumor resection in the treatment of glioblastoma multiforme in adults Cancer 1999862117ndash2123[PubMed 10570440]
Kumabe T Sohma Y Kayama T Yoshimoto T Yamamoto T Amplification of alpha-platelet-derivedgrowth factor receptor gene lacking an exon coding for a portion of the extracellular region in aprimary brain tumor of glial origin Oncogene 19927627ndash633 [PubMed 1314366]
Liang Y Diehn M Watson N Bollen AW Aldape KD Nicholas MK Lamborn KR Berger MS BotsteinD Brown PO Israel MA Gene expression profiling reveals molecularly and clinically distinctsubtypes of glioblastoma multiforme Proc Natl Acad Sci U S A 20051025814ndash5819 [PubMed15827123]
Ligon KL Huillard E Mehta S Kesari S Liu H Alberta JA Bachoo RM Kane M Louis DN DepinhoRA et al Olig2-regulated lineage-restricted pathway controls replication competence in neural stemcells and malignant glioma Neuron 200753503ndash517 [PubMed 17296553]
Liu H Zeeberg BR Qu G Koru AG Ferrucci A Kahn A Ryan MC Nuhanovic A Munson PJ ReinholdWC et al AffyProbeMiner a web resource for computing or retrieving accurately redefinedAffymetrix probe sets Bioinformatics 2007232385ndash2390 [PubMed 17660211]
Liu Y Hayes DN Nobel A Marron J Statistical significance of clustering for high dimension low samplesize data Journal of the American Statistical Association 20081031281ndash1293
Mardia KV Kent JT Bibby JM Multivariate Analysis London Academic Press 1979Mischel PS Shai R Shi T Horvath S Lu KV Choe G Seligson D Kremen TJ Palotie A Liau LM et
al Identification of molecular subtypes of glioblastoma by gene expression profiling Oncogene2003222361ndash2373 [PubMed 12700671]
Monti S Tamayo P Mesirov J Golub TR Consensus Clustering A Resampling-Based Method for ClassDiscovery and Visualization of Gene Expression Microarray Data Machine Learning 20035291ndash118
Murat A Migliavacca E Gorlia T Lambiv WL Shay T Hamou MF de Tribolet N Regli L Wick WKouwenhoven MC et al Stem cell-related self-renewal signature and high epidermal growth factorreceptor expression associated with resistance to concomitant chemoradiotherapy in glioblastoma JClin Oncol 2008263015ndash3024 [PubMed 18565887]
Noble M Proschel C Mayer-Proschel M Getting a GR(i)P on oligodendrocyte development Dev Biol200426533ndash52 [PubMed 14697351]
Verhaak et al Page 14
Cancer Cell Author manuscript available in PMC 2011 January 19
NIH
-PA Author Manuscript
NIH
-PA Author Manuscript
NIH
-PA Author Manuscript
Nutt CL Mani DR Betensky RA Tamayo P Cairncross JG Ladd C Pohl U Hartmann C McLaughlinME Batchelor TT et al Gene expression-based classification of malignant gliomas correlates betterwith survival than histological classification Cancer Res 2003631602ndash1607 [PubMed 12670911]
Ohgaki H Kleihues P Epidemiology and etiology of gliomas Acta Neuropathol 200510993ndash108[PubMed 15685439]
Olshen AB Venkatraman ES Lucito R Wigler M Circular binary segmentation for the analysis of array-based DNA copy number data Biostatistics 20045557ndash572 [PubMed 15475419]
Phillips HS Kharbanda S Chen R Forrest WF Soriano RH Wu TD Misra A Nigro JM Colman HSoroceanu L et al Molecular subclasses of high-grade glioma predict prognosis delineate a patternof disease progression and resemble stages in neurogenesis Cancer Cell 20069157ndash173 [PubMed16530701]
Rand V Huang J Stockwell T Ferriera S Buzko O Levy S Busam D Li K Edwards JB Eberhart Cet al Sequence survey of receptor tyrosine kinases reveals mutations in glioblastomas Proc NatlAcad Sci U S A 200510214344ndash14349 [PubMed 16186508]
Rousseeuw PJ Silhouettes A graphical aid to the interpretation and validation of cluster analysis JComput Appl Math 19872053ndash65
Ruano Y Mollejo M Ribalta T Fiano C Camacho FI Gomez E de Lope AR Hernandez-Moneo JLMartinez P Melendez B Identification of novel candidate target genes in amplicons of glioblastomamultiforme tumors detected by expression and CGH microarray profiling Mol Cancer 2006539[PubMed 17002787]
Sanai N Alvarez-Buylla A Berger MS Neural stem cells and the origin of gliomas N Engl J Med2005353811ndash822 [PubMed 16120861]
Scott CB Scarantino C Urtasun R Movsas B Jones CU Simpson JR Fischbach AJ Curran WJ JrValidation and predictive power of Radiation Therapy Oncology Group (RTOG) recursivepartitioning analysis classes for malignant glioma patients a report using RTOG 90-06 Int J RadiatOncol Biol Phys 19984051ndash55 [PubMed 9422557]
Shai R Shi T Kremen TJ Horvath S Liau LM Cloughesy TF Mischel PS Nelson SF Gene expressionprofiling identifies molecular subtypes of gliomas Oncogene 2003224918ndash4923 [PubMed12894235]
Sun L Hui AM Su Q Vortmeyer A Kotliarov Y Pastorino S Passaniti A Menon J Walling J BaileyR et al Neuronal and glioma-derived stem cell factor induces angiogenesis within the brain CancerCell 20069287ndash300 [PubMed 16616334]
The Cancer Genome Atlas (TCGA) Research Network Comprehensive genomic characterization defineshuman glioblastoma genes and core pathways Nature 20084551061ndash1068 [PubMed 18772890]
R Development Core Team R A language and environment for statistical computing Vienna AustriaR Foundation for Statistical Computing 2008
Thiery JP Epithelial-mesenchymal transitions in tumour progression Nat Rev Cancer 20022442ndash454[PubMed 12189386]
Tso CL Freije WA Day A Chen Z Merriman B Perlina A Lee Y Dia EQ Yoshimoto K Mischel PSet al Distinct transcription profiles of primary and secondary glioblastoma subgroups Cancer Res200666159ndash167 [PubMed 16397228]
Tusher VG Tibshirani R Chu G Significance analysis of microarrays applied to the ionizing radiationresponse Proc Natl Acad Sci U S A 2001985116ndash5121 [PubMed 11309499]
Watanabe K Tachibana O Sata K Yonekawa Y Kleihues P Ohgaki H Overexpression of the EGFreceptor and p53 mutations are mutually exclusive in the evolution of primary and secondaryglioblastomas Brain Pathol 19966217ndash223 discussion 223-224 [PubMed 8864278]
Whitfield ML Sherlock G Saldanha AJ Murray JI Ball CA Alexander KE Matese JC Perou CM HurtMM Brown PO Botstein D Identification of genes periodically expressed in the human cell cycleand their expression in tumors Mol Biol Cell 2002131977ndash2000 [PubMed 12058064]
Yan H Parsons DW Jin G McLendon R Rasheed BA Yuan W Kos I Batinic-Haberle I Jones SRiggins GJ et al IDH1 and IDH2 mutations in gliomas N Engl J Med 2009360765ndash773 [PubMed19228619]
Zhu Y Ghosh P Charnay P Burns DK Parada LF Neurofibromas in NF1 Schwann cell origin and roleof tumor environment Science 2002296920ndash922 [PubMed 11988578]
Verhaak et al Page 15
Cancer Cell Author manuscript available in PMC 2011 January 19
NIH
-PA Author Manuscript
NIH
-PA Author Manuscript
NIH
-PA Author Manuscript
Figure 1Identification of four GBM subtypes (A) Consensus clustering matrix of 202 TCGA samplesfor k=2 to k=5 (B) Consensus clustering CDF for k=2 to k=10 (C) SigClust p-values for allpair wise comparisons of clusters (D) Silhouette plot for identification of core samples Alsosee Figure S1
Verhaak et al Page 16
Cancer Cell Author manuscript available in PMC 2011 January 19
NIH
-PA Author Manuscript
NIH
-PA Author Manuscript
NIH
-PA Author Manuscript
Figure 2Gene expression data identify four gene expression subtypes (A) Using the predictive 840gene list samples were ordered based on subtype predictions and genes were clustered usingthe core set of 173 TCGA GBM samples (B) Gene order from the TCGA samples wasmaintained in the validation dataset (n=260) which is comprised of GBMs from fourpreviously published datasets (C) Ordered gene expression for 24 xenograft samples Samplesare ordered based on their predicted identity using the 840 gene list Selected genes aredisplayed for each gene expression subtype Also see FigureS3 and TableS3
Verhaak et al Page 17
Cancer Cell Author manuscript available in PMC 2011 January 19
NIH
-PA Author Manuscript
NIH
-PA Author Manuscript
NIH
-PA Author Manuscript
Figure 3Integrated view of gene expression and genomic alterations across glioblastoma subtypesGene expression data (ge) was standardized (mean equal to zero standard deviation equal to1) across the 202 dataset data are shown for the 116 samples with both mutation and copynumber data Mutations (mut) are indicated by a red cell a white pipe indicates loss ofheterozygosity and a yellow cell indicates the presence of an EGFRvIII mutation Copynumber events (cn) are illustrated by bright green for homozygous deletions green forhemizygous deletions black for copy number neutral red for low level amplification andbright red for high level amplifications A black cell indicates no detected alteration
Verhaak et al Page 18
Cancer Cell Author manuscript available in PMC 2011 January 19
NIH
-PA Author Manuscript
NIH
-PA Author Manuscript
NIH
-PA Author Manuscript
Figure 4Single sample GSEA scores of GBM subtypes show a relation to specific cell types Geneexpression signatures of oligodendrocytes astrocytes neurons and cultured astroglial cellswere generated from murine brain cell types (Cahoy et al 2008) Single sample GSEA wasused to project the four gene sets on samples on the Proneural Classical Neural andMesenchymal subtypes A positive enrichment score indicates a positive correlation betweengenes in the gene set and the tumor sample expression profile a negative enrichment scoreindicates the reverse Also see FigureS6
Verhaak et al Page 19
Cancer Cell Author manuscript available in PMC 2011 January 19
NIH
-PA Author Manuscript
NIH
-PA Author Manuscript
NIH
-PA Author Manuscript
Figure 5Survival by treatment type and tumor subtype Patients from TCGA and Murat (Murat et al2008) were classified by therapy regimen red more intensive therapy concurrentchemotherapy and radiation or greater than four cycles of chemotherapy black less intensivetherapy non-concurrent chemotherapy and radiation or less than four cycles of chemotherapy(A) Proneural (B) Neural (C) Classical (D) Mesenchymal Also see Figure S7 and Table S7
Verhaak et al Page 20
Cancer Cell Author manuscript available in PMC 2011 January 19
NIH
-PA Author Manuscript
NIH
-PA Author Manuscript
NIH
-PA Author Manuscript
NIH
-PA Author Manuscript
NIH
-PA Author Manuscript
NIH
-PA Author Manuscript
Verhaak et al Page 21
Tabl
e 1
Clin
ical
and
phe
noty
pica
l cha
ract
eris
tics o
f TC
GA
and
val
idat
ion
data
sets
Pron
eura
lN
eura
lC
lass
ical
Mes
ench
ymal
Tot
als
(Cor
e)T
otal
s(A
ll)
Num
ber o
fPa
tient
sA
ll57
3354
5820
2
Cor
e54
2737
5517
3
TC
GA
Pat
ient
Phe
noty
pe (C
ore
Sam
ples
)
Age
(in y
ears
)
Med
ian
518
638
557
577
572
571
(LQ
UQ
)(3
43
66
0)(5
17
68
2)(4
97
67
5)(5
28
66
7)(4
80
66
5)(4
72
66
4)
Num
ber le
40
181
32
2430
Surv
ival
(in M
onth
s)M
edia
nDagger11
313
112
211
812
212
2
(CI)
(93
14
7)(9
80
18
0)(1
108
18
0)(9
57
15
4)(1
11
14
0)(1
11
14
1)
Kar
nofs
kySc
ore
dagger
100
84
37
2225
9012
45
1031
36
70ndash8
07
35
1025
30
lt70
16
01
810
Sex
Fem
ale
218
1915
6374
Mal
e33
1618
4010
712
4
TC
GA
Tum
or C
hara
cter
istic
s (C
ore
Sam
ples
)
MG
MT
met
hyla
ted
daggerY
es15
812
1146
50
No
3619
2342
120
143
Non
-Pri
mar
yTu
mor
sR
ecur
rent
43
22
1114
Seco
ndar
y3
01
04
5
Cancer Cell Author manuscript available in PMC 2011 January 19
NIH
-PA Author Manuscript
NIH
-PA Author Manuscript
NIH
-PA Author Manuscript
Verhaak et al Page 22
Pron
eura
lN
eura
lC
lass
ical
Mes
ench
ymal
Tot
als
(Cor
e)T
otal
s(A
ll)
T
umor
Nuc
lei
Med
ian
988
975
100
097
097
597
5
Mea
n95
892
396
694
995
295
2
N
ecro
sis
Med
ian
75
50
75
150
75
75
(LQ
UQ
)(5
0 1
25)
(13
88
)(5
0 1
50)
(75
20
0)(5
0 1
50)
(50
15
0)
Col
lect
ion
Cen
ter
daggerdagger
MD
And
erso
n28
518
2172
84
Hen
ry F
ord
1418
823
6367
UC
SF10
411
934
42
Val
idat
ion
Sam
ples
Num
ber o
fPa
tient
s69
4063
7424
6sect
Stud
y
Ber
oukh
im e
t al
107
918
44
Mur
at e
t al
199
2022
70
Phill
ips e
t al
1912
817
56
Sun
et a
l21
1226
1776
Age
(in y
ears
)
Med
ian
485
5557
5353
(LQ
UQ
)(3
7 5
7)(4
65
63)
(49
62)
(44
25 5
9)(4
4 6
1)
Num
ber le
4023
53
839
Surv
ival
(in M
onth
s)M
edia
nDagger16
215
012
215
015
(CI)
(14
3 2
24)
(12
2 2
19)
(10
5 1
50)
(13
6 2
04)
(14
16)
Sex
Fem
ale
1814
1415
61
Mal
e37
2130
4513
3
LQ=rdquo
Low
er Q
uarti
lerdquo
UQ
=rdquoU
pper
Qua
rtile
rdquo C
I=rdquoC
onfid
ence
Inte
rval
rdquo A
lso
see
Figu
re S
2 an
d Ta
bles
S5
and
S7
Cancer Cell Author manuscript available in PMC 2011 January 19
NIH
-PA Author Manuscript
NIH
-PA Author Manuscript
NIH
-PA Author Manuscript
Verhaak et al Page 23 in
dica
tes s
tatis
tical
ly si
gnifi
cant
rela
tions
hip
betw
een
clus
ter c
ateg
ory
and
phen
otyp
e at
a 0
10
leve
l (se
e te
xt a
nd S
uppl
emen
tary
Tab
le 1
0 fo
r det
ails
) Fo
r TC
GA
sam
ples
onl
y th
e co
re sa
mpl
es w
ere
used
for s
igni
fican
ce te
stin
g
dagger Indi
cate
s cat
egor
ies w
ith la
rge
amou
nts o
f mis
sing
dat
a O
nly
101
patie
nts (
86 lsquoc
orersquo
pat
ient
s) h
ad a
Kar
nofs
ky sc
ore
and
only
193
pat
ient
s (16
6 lsquoc
orersquo
pat
ient
s) h
ad m
ethy
latio
n da
ta a
vaila
ble
daggerdaggerFi
ve sa
mpl
es fr
om D
uke
are
not i
tem
ized
her
e to
pro
tect
pat
ient
con
fiden
tialit
y
Dagger Med
ian
surv
ival
and
cor
resp
ondi
ng c
onfid
ence
inte
rval
s est
imat
ed fr
om K
apla
n-M
eier
cur
ve u
sing
the
surv
ival
pac
kage
in R
sect Nor
mal
and
recu
rren
t pat
ient
s wer
e ex
clud
ed fr
om th
e an
alys
is
Cancer Cell Author manuscript available in PMC 2011 January 19
NIH
-PA Author Manuscript
NIH
-PA Author Manuscript
NIH
-PA Author Manuscript
Verhaak et al Page 24
Tabl
e 2
Cop
y nu
mbe
r alte
ratio
ns c
orre
late
with
GB
M su
btyp
e
RO
IPr
oneu
ral
(n=5
4)N
eura
l(n
=24)
Cla
ssic
al(n
=37)
Mes
ench
ymal
(n=5
5)T
otal
Sa
mpl
esA
ltere
d
Kno
wn
Can
cer
Gen
e in
Reg
ion
A L
ow a
nd H
igh
Leve
l Am
plifi
ed E
vent
s
7p11
229
(54
)23
(96
)37
(100
)
52 (9
5)
141
EGFR
7q21
225
(46
)23
(96
)34
(92
)49
(89
)13
1C
DK
6
7q31
229
(54
)22
(92
)32
(86
)50
(91
)13
1M
ET
7q34
28 (5
2)
22 (9
2)
32 (8
6)
50 (9
1)
132
-
B H
igh
Leve
l Am
plifi
catio
n Ev
ents
7p11
29
(17
)16
(67
)35
(95
)16
(29
)76
EGFR
4q12
19 (3
5)
3 (1
3)
2 (5
)
5 (9
)
29PD
GFR
ADagger
C H
omoz
ygou
s and
Hem
izyg
ous D
elet
ion
Even
ts
17q1
12
3 (6
)
4 (1
7)
2 (5
)
21 (3
8)
28N
F1
10q2
337
(69
)23
(96
)37
(100
)
48 (8
7)
145
PTEN
9p21
330
(56
)17
(71
)35
(95
)37
(67
)11
9C
DK
N2A
CD
KN
2B
13q1
428
(52
)11
(46
)6
(16
)29
(53
)74
RB
1
D H
omoz
ygou
s Del
etio
n Ev
ents
9p21
322
(40
)13
(54
)34
(92
)29
(53
)98
CD
KN
2AC
DK
N2B
Abb
revi
atio
ns R
OI
regi
on o
f int
eres
t
Dagger The
peak
of t
he a
mpl
ifica
tion
is a
djac
ent t
o PD
GFR
A S
igni
fican
ce o
f the
diff
eren
ce in
num
ber o
f eve
nts b
etw
een
subt
ypes
and
rem
aind
er o
f the
subt
ypes
was
test
ed u
sing
a tw
o si
ded
Fish
errsquos
exa
ct te
st
corr
ecte
d fo
r mul
tiple
test
ing
usin
g a
Fam
ily W
ise
Erro
r Rat
e B
olde
d en
tries
indi
cate
p-v
alue
s sig
nific
ant a
t 01
leve
l A
n as
teris
k in
dica
tes p
-val
ues s
igni
fican
t at 0
01
leve
l A
lso
see
Figu
re S
4 an
d Ta
ble
S1
Cancer Cell Author manuscript available in PMC 2011 January 19
NIH
-PA Author Manuscript
NIH
-PA Author Manuscript
NIH
-PA Author Manuscript
Verhaak et al Page 25
Tabl
e 3
Dis
tribu
tion
of fr
eque
ntly
-mut
ated
gen
es a
cros
s GB
M su
btyp
es
Gen
ePr
oneu
ral
(n=3
7)N
eura
l(n
=19)
Cla
ssic
al(n
=22)
Mes
ench
ymal
(n=3
8)T
otal
Mut
TP5
320
(54
)4
(21
)0
(0
)12
(32
)36
PTE
N6
(16
)4
(21
)5
(23
)12
(32
)27
NF1
2 (5
)
3 (1
6)
1 (5
)
14 (3
7)
20
EG
FR6
(16
)5
(26
)7
(32
)2
(5
)20
IDH
111
(30
)1
(5
)0
(0
)0
(0
)12
PIK
3R1
7 (1
9)
2 (1
1)
1 (5
)
0 (0
)
10
RB
11
(3
)1
(5
)0
(0
)5
(13
)7
ER
BB
22
(5
)3
(16
)1
(5
)1
(3
)7
EG
FRvI
II1
(3
)0
(0
)5
(23
)1
(3
)7
PIK
3CA
3 (8
)
1 (5
)
1 (5
)
1 (3
)
6
PDG
FRA
4 (1
1)
0 (0
)
0 (0
)
0 (0
)
4
Sign
ifica
nce
of th
e di
ffer
ence
in n
umbe
r of e
vent
s bet
wee
n su
btyp
es a
nd re
mai
nder
of t
he su
btyp
es w
as d
eter
min
ed u
sing
a tw
o si
ded
Fish
errsquos
exa
ct te
st c
orre
cted
for m
ultip
le te
stin
g us
ing
a Fa
mily
Wis
e Er
ror
Rat
e B
olde
d en
tries
indi
cate
p-v
alue
s sig
nific
ant a
t 01
leve
l A
n as
teris
k in
dica
tes p
-val
ues s
igni
fican
t at 0
01
leve
l A
lso
see
Figu
re S
5 an
d Ta
bles
S2
S4
and
S6
Cancer Cell Author manuscript available in PMC 2011 January 19
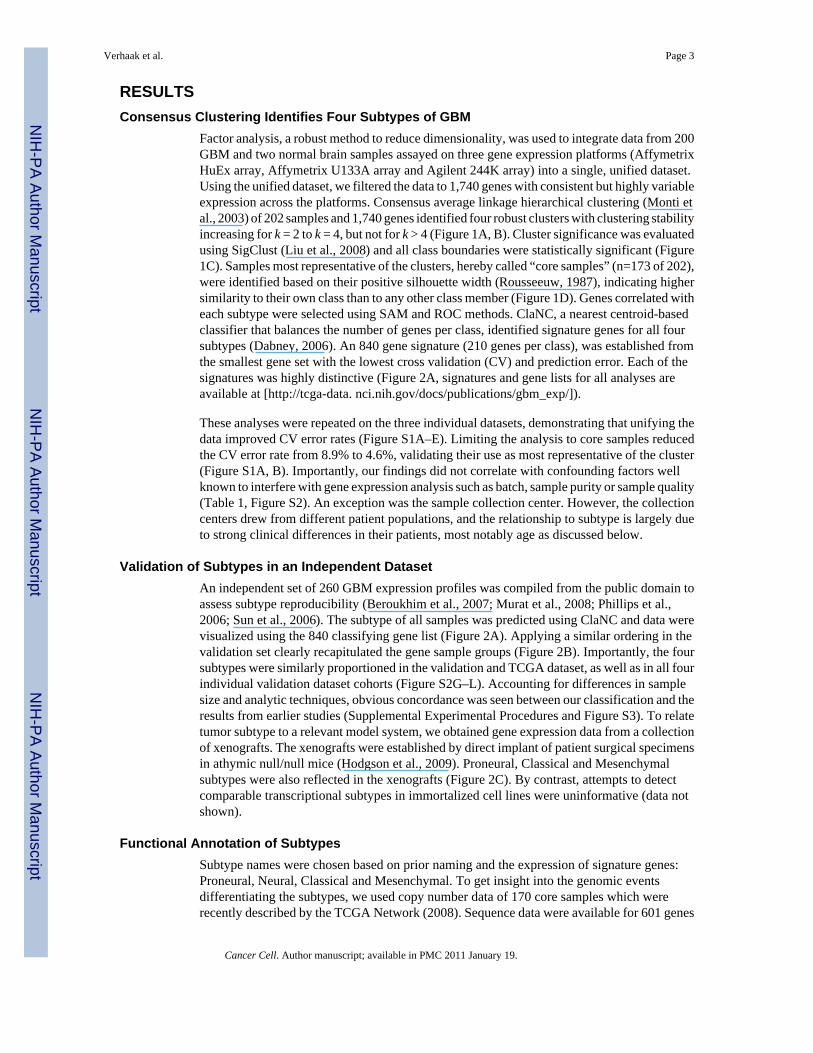
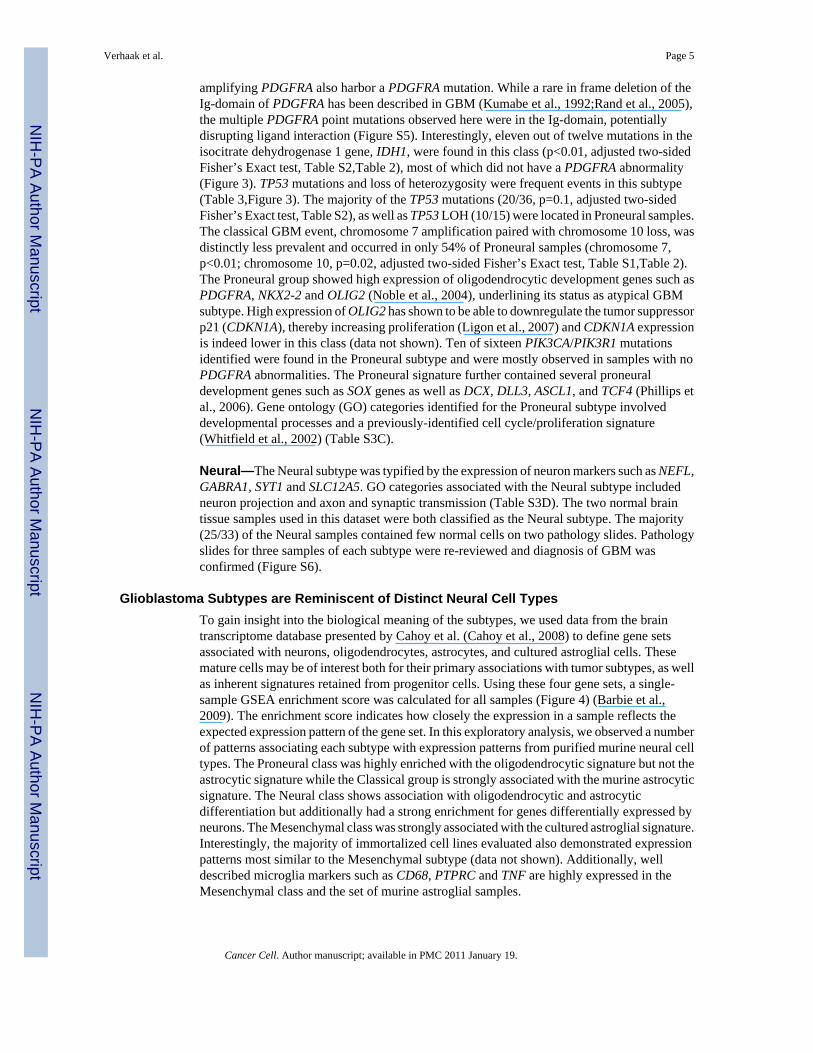
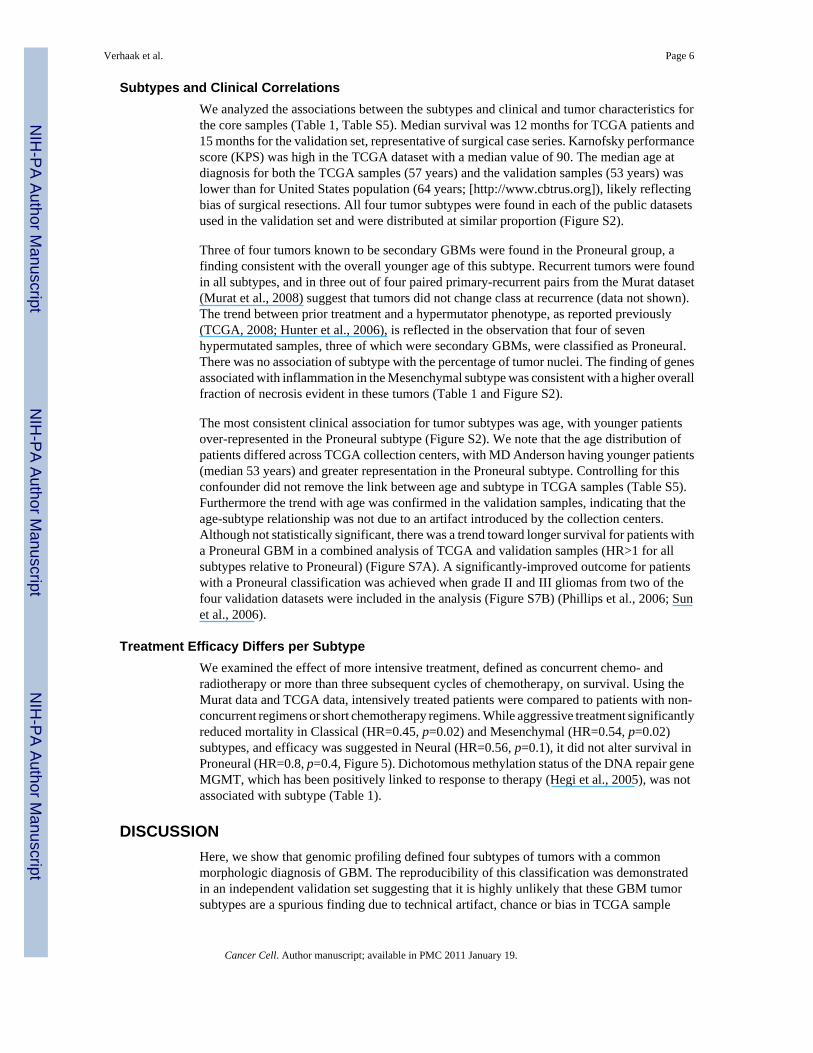
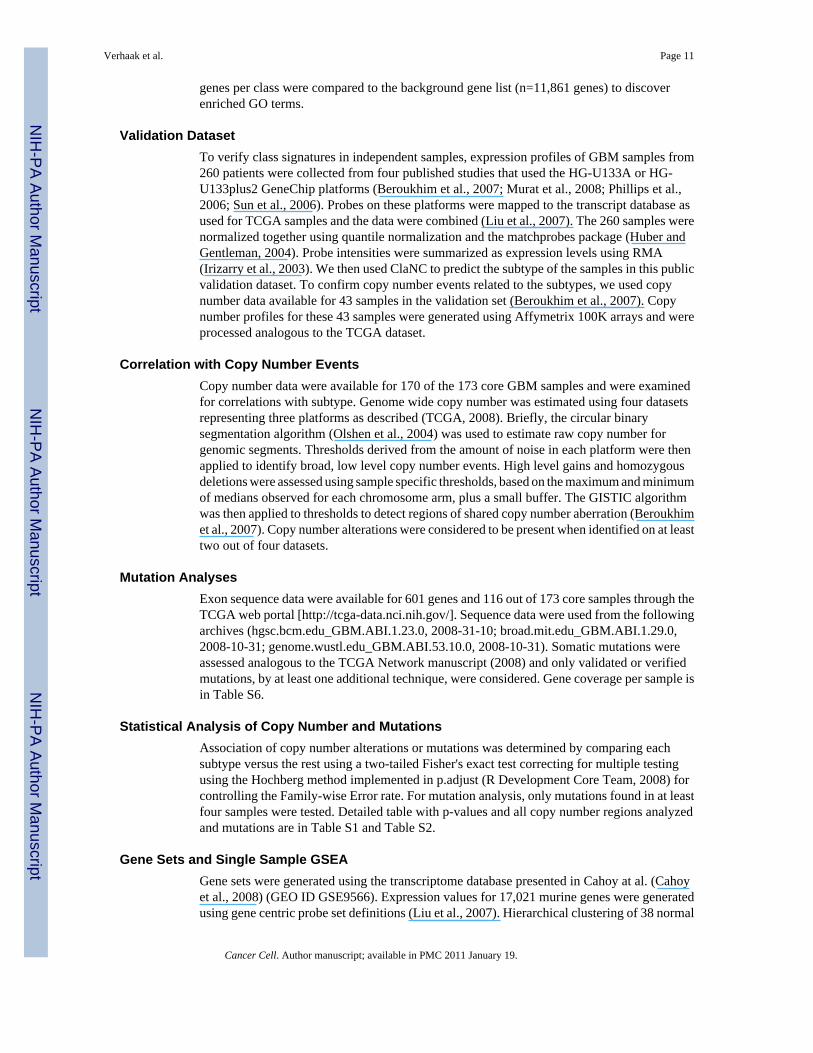
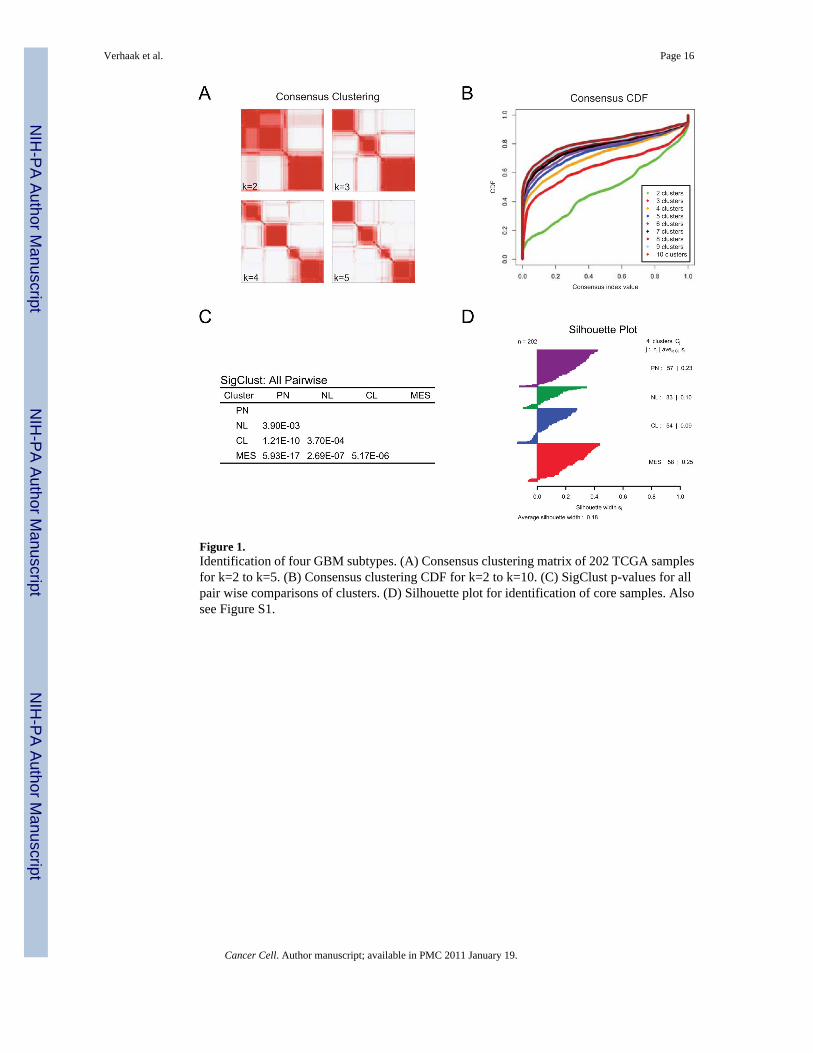
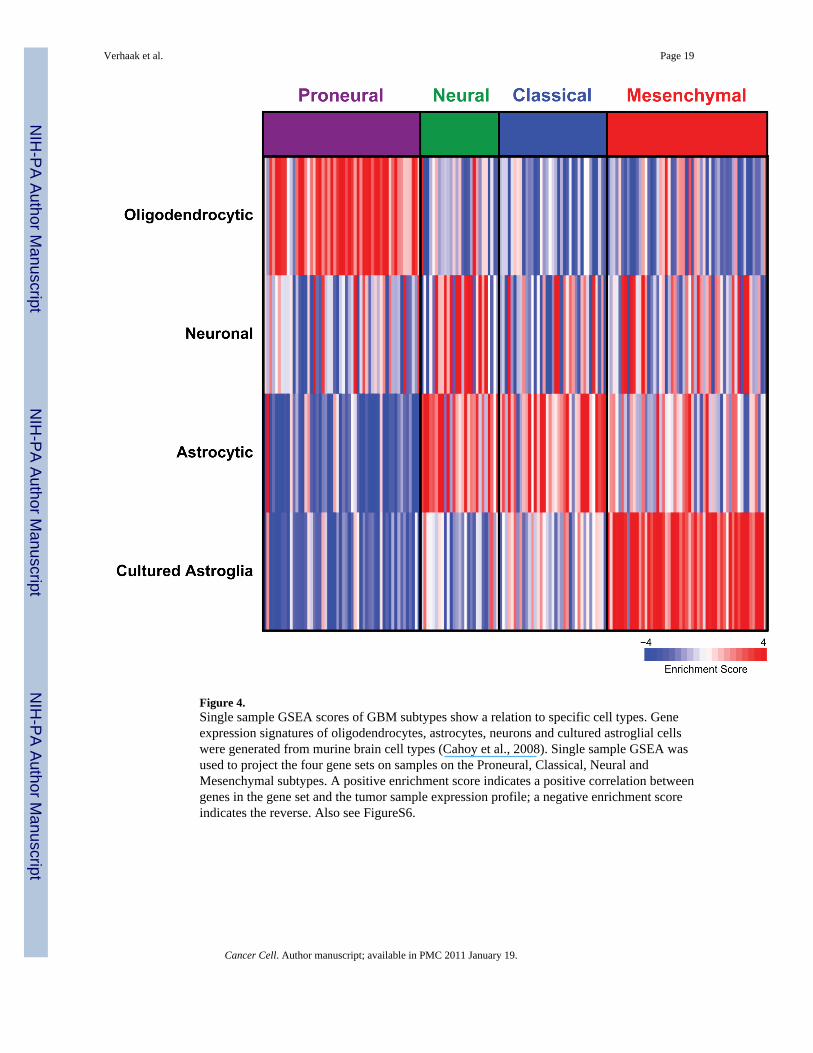
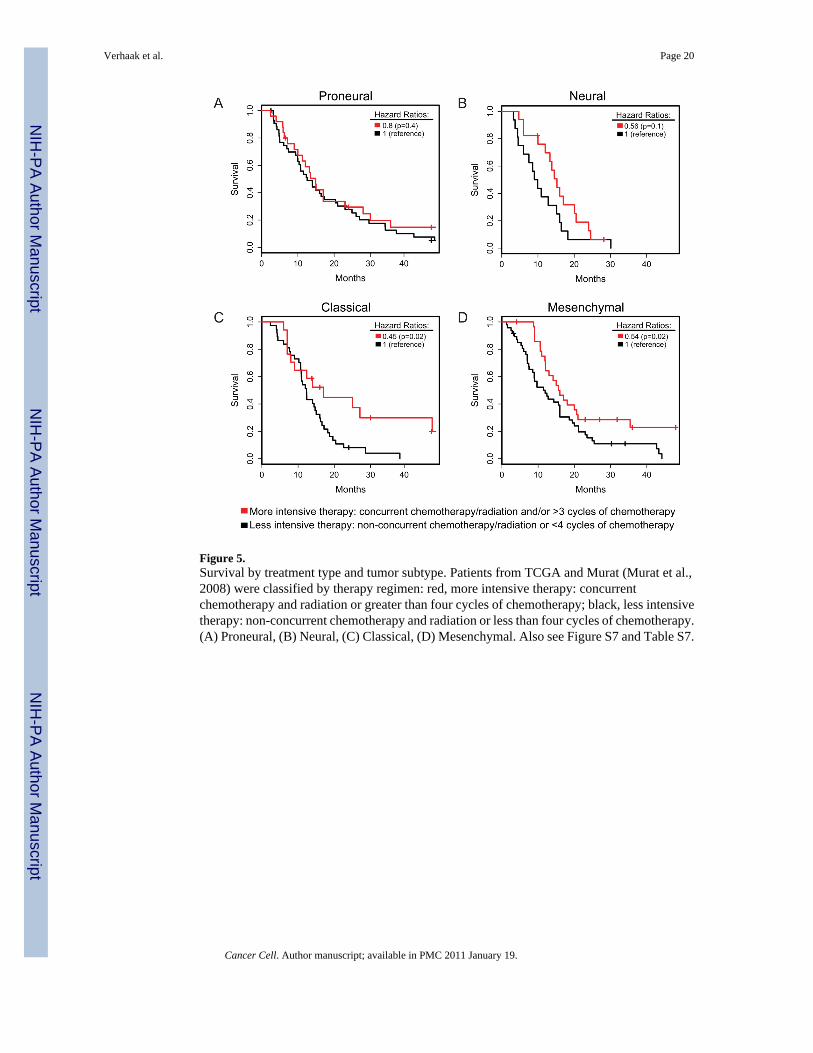

NIH
-PA Author Manuscript
NIH
-PA Author Manuscript
NIH
-PA Author Manuscript
Verhaak et al Page 21
Tabl
e 1
Clin
ical
and
phe
noty
pica
l cha
ract
eris
tics o
f TC
GA
and
val
idat
ion
data
sets
Pron
eura
lN
eura
lC
lass
ical
Mes
ench
ymal
Tot
als
(Cor
e)T
otal
s(A
ll)
Num
ber o
fPa
tient
sA
ll57
3354
5820
2
Cor
e54
2737
5517
3
TC
GA
Pat
ient
Phe
noty
pe (C
ore
Sam
ples
)
Age
(in y
ears
)
Med
ian
518
638
557
577
572
571
(LQ
UQ
)(3
43
66
0)(5
17
68
2)(4
97
67
5)(5
28
66
7)(4
80
66
5)(4
72
66
4)
Num
ber le
40
181
32
2430
Surv
ival
(in M
onth
s)M
edia
nDagger11
313
112
211
812
212
2
(CI)
(93
14
7)(9
80
18
0)(1
108
18
0)(9
57
15
4)(1
11
14
0)(1
11
14
1)
Kar
nofs
kySc
ore
dagger
100
84
37
2225
9012
45
1031
36
70ndash8
07
35
1025
30
lt70
16
01
810
Sex
Fem
ale
218
1915
6374
Mal
e33
1618
4010
712
4
TC
GA
Tum
or C
hara
cter
istic
s (C
ore
Sam
ples
)
MG
MT
met
hyla
ted
daggerY
es15
812
1146
50
No
3619
2342
120
143
Non
-Pri
mar
yTu
mor
sR
ecur
rent
43
22
1114
Seco
ndar
y3
01
04
5
Cancer Cell Author manuscript available in PMC 2011 January 19
NIH
-PA Author Manuscript
NIH
-PA Author Manuscript
NIH
-PA Author Manuscript
Verhaak et al Page 22
Pron
eura
lN
eura
lC
lass
ical
Mes
ench
ymal
Tot
als
(Cor
e)T
otal
s(A
ll)
T
umor
Nuc
lei
Med
ian
988
975
100
097
097
597
5
Mea
n95
892
396
694
995
295
2
N
ecro
sis
Med
ian
75
50
75
150
75
75
(LQ
UQ
)(5
0 1
25)
(13
88
)(5
0 1
50)
(75
20
0)(5
0 1
50)
(50
15
0)
Col
lect
ion
Cen
ter
daggerdagger
MD
And
erso
n28
518
2172
84
Hen
ry F
ord
1418
823
6367
UC
SF10
411
934
42
Val
idat
ion
Sam
ples
Num
ber o
fPa
tient
s69
4063
7424
6sect
Stud
y
Ber
oukh
im e
t al
107
918
44
Mur
at e
t al
199
2022
70
Phill
ips e
t al
1912
817
56
Sun
et a
l21
1226
1776
Age
(in y
ears
)
Med
ian
485
5557
5353
(LQ
UQ
)(3
7 5
7)(4
65
63)
(49
62)
(44
25 5
9)(4
4 6
1)
Num
ber le
4023
53
839
Surv
ival
(in M
onth
s)M
edia
nDagger16
215
012
215
015
(CI)
(14
3 2
24)
(12
2 2
19)
(10
5 1
50)
(13
6 2
04)
(14
16)
Sex
Fem
ale
1814
1415
61
Mal
e37
2130
4513
3
LQ=rdquo
Low
er Q
uarti
lerdquo
UQ
=rdquoU
pper
Qua
rtile
rdquo C
I=rdquoC
onfid
ence
Inte
rval
rdquo A
lso
see
Figu
re S
2 an
d Ta
bles
S5
and
S7
Cancer Cell Author manuscript available in PMC 2011 January 19
NIH
-PA Author Manuscript
NIH
-PA Author Manuscript
NIH
-PA Author Manuscript
Verhaak et al Page 23 in
dica
tes s
tatis
tical
ly si
gnifi
cant
rela
tions
hip
betw
een
clus
ter c
ateg
ory
and
phen
otyp
e at
a 0
10
leve
l (se
e te
xt a
nd S
uppl
emen
tary
Tab
le 1
0 fo
r det
ails
) Fo
r TC
GA
sam
ples
onl
y th
e co
re sa
mpl
es w
ere
used
for s
igni
fican
ce te
stin
g
dagger Indi
cate
s cat
egor
ies w
ith la
rge
amou
nts o
f mis
sing
dat
a O
nly
101
patie
nts (
86 lsquoc
orersquo
pat
ient
s) h
ad a
Kar
nofs
ky sc
ore
and
only
193
pat
ient
s (16
6 lsquoc
orersquo
pat
ient
s) h
ad m
ethy
latio
n da
ta a
vaila
ble
daggerdaggerFi
ve sa
mpl
es fr
om D
uke
are
not i
tem
ized
her
e to
pro
tect
pat
ient
con
fiden
tialit
y
Dagger Med
ian
surv
ival
and
cor
resp
ondi
ng c
onfid
ence
inte
rval
s est
imat
ed fr
om K
apla
n-M
eier
cur
ve u
sing
the
surv
ival
pac
kage
in R
sect Nor
mal
and
recu
rren
t pat
ient
s wer
e ex
clud
ed fr
om th
e an
alys
is
Cancer Cell Author manuscript available in PMC 2011 January 19
NIH
-PA Author Manuscript
NIH
-PA Author Manuscript
NIH
-PA Author Manuscript
Verhaak et al Page 24
Tabl
e 2
Cop
y nu
mbe
r alte
ratio
ns c
orre
late
with
GB
M su
btyp
e
RO
IPr
oneu
ral
(n=5
4)N
eura
l(n
=24)
Cla
ssic
al(n
=37)
Mes
ench
ymal
(n=5
5)T
otal
Sa
mpl
esA
ltere
d
Kno
wn
Can
cer
Gen
e in
Reg
ion
A L
ow a
nd H
igh
Leve
l Am
plifi
ed E
vent
s
7p11
229
(54
)23
(96
)37
(100
)
52 (9
5)
141
EGFR
7q21
225
(46
)23
(96
)34
(92
)49
(89
)13
1C
DK
6
7q31
229
(54
)22
(92
)32
(86
)50
(91
)13
1M
ET
7q34
28 (5
2)
22 (9
2)
32 (8
6)
50 (9
1)
132
-
B H
igh
Leve
l Am
plifi
catio
n Ev
ents
7p11
29
(17
)16
(67
)35
(95
)16
(29
)76
EGFR
4q12
19 (3
5)
3 (1
3)
2 (5
)
5 (9
)
29PD
GFR
ADagger
C H
omoz
ygou
s and
Hem
izyg
ous D
elet
ion
Even
ts
17q1
12
3 (6
)
4 (1
7)
2 (5
)
21 (3
8)
28N
F1
10q2
337
(69
)23
(96
)37
(100
)
48 (8
7)
145
PTEN
9p21
330
(56
)17
(71
)35
(95
)37
(67
)11
9C
DK
N2A
CD
KN
2B
13q1
428
(52
)11
(46
)6
(16
)29
(53
)74
RB
1
D H
omoz
ygou
s Del
etio
n Ev
ents
9p21
322
(40
)13
(54
)34
(92
)29
(53
)98
CD
KN
2AC
DK
N2B
Abb
revi
atio
ns R
OI
regi
on o
f int
eres
t
Dagger The
peak
of t
he a
mpl
ifica
tion
is a
djac
ent t
o PD
GFR
A S
igni
fican
ce o
f the
diff
eren
ce in
num
ber o
f eve
nts b
etw
een
subt
ypes
and
rem
aind
er o
f the
subt
ypes
was
test
ed u
sing
a tw
o si
ded
Fish
errsquos
exa
ct te
st
corr
ecte
d fo
r mul
tiple
test
ing
usin
g a
Fam
ily W
ise
Erro
r Rat
e B
olde
d en
tries
indi
cate
p-v
alue
s sig
nific
ant a
t 01
leve
l A
n as
teris
k in
dica
tes p
-val
ues s
igni
fican
t at 0
01
leve
l A
lso
see
Figu
re S
4 an
d Ta
ble
S1
Cancer Cell Author manuscript available in PMC 2011 January 19
NIH
-PA Author Manuscript
NIH
-PA Author Manuscript
NIH
-PA Author Manuscript
Verhaak et al Page 25
Tabl
e 3
Dis
tribu
tion
of fr
eque
ntly
-mut
ated
gen
es a
cros
s GB
M su
btyp
es
Gen
ePr
oneu
ral
(n=3
7)N
eura
l(n
=19)
Cla
ssic
al(n
=22)
Mes
ench
ymal
(n=3
8)T
otal
Mut
TP5
320
(54
)4
(21
)0
(0
)12
(32
)36
PTE
N6
(16
)4
(21
)5
(23
)12
(32
)27
NF1
2 (5
)
3 (1
6)
1 (5
)
14 (3
7)
20
EG
FR6
(16
)5
(26
)7
(32
)2
(5
)20
IDH
111
(30
)1
(5
)0
(0
)0
(0
)12
PIK
3R1
7 (1
9)
2 (1
1)
1 (5
)
0 (0
)
10
RB
11
(3
)1
(5
)0
(0
)5
(13
)7
ER
BB
22
(5
)3
(16
)1
(5
)1
(3
)7
EG
FRvI
II1
(3
)0
(0
)5
(23
)1
(3
)7
PIK
3CA
3 (8
)
1 (5
)
1 (5
)
1 (3
)
6
PDG
FRA
4 (1
1)
0 (0
)
0 (0
)
0 (0
)
4
Sign
ifica
nce
of th
e di
ffer
ence
in n
umbe
r of e
vent
s bet
wee
n su
btyp
es a
nd re
mai
nder
of t
he su
btyp
es w
as d
eter
min
ed u
sing
a tw
o si
ded
Fish
errsquos
exa
ct te
st c
orre
cted
for m
ultip
le te
stin
g us
ing
a Fa
mily
Wis
e Er
ror
Rat
e B
olde
d en
tries
indi
cate
p-v
alue
s sig
nific
ant a
t 01
leve
l A
n as
teris
k in
dica
tes p
-val
ues s
igni
fican
t at 0
01
leve
l A
lso
see
Figu
re S
5 an
d Ta
bles
S2
S4
and
S6
Cancer Cell Author manuscript available in PMC 2011 January 19
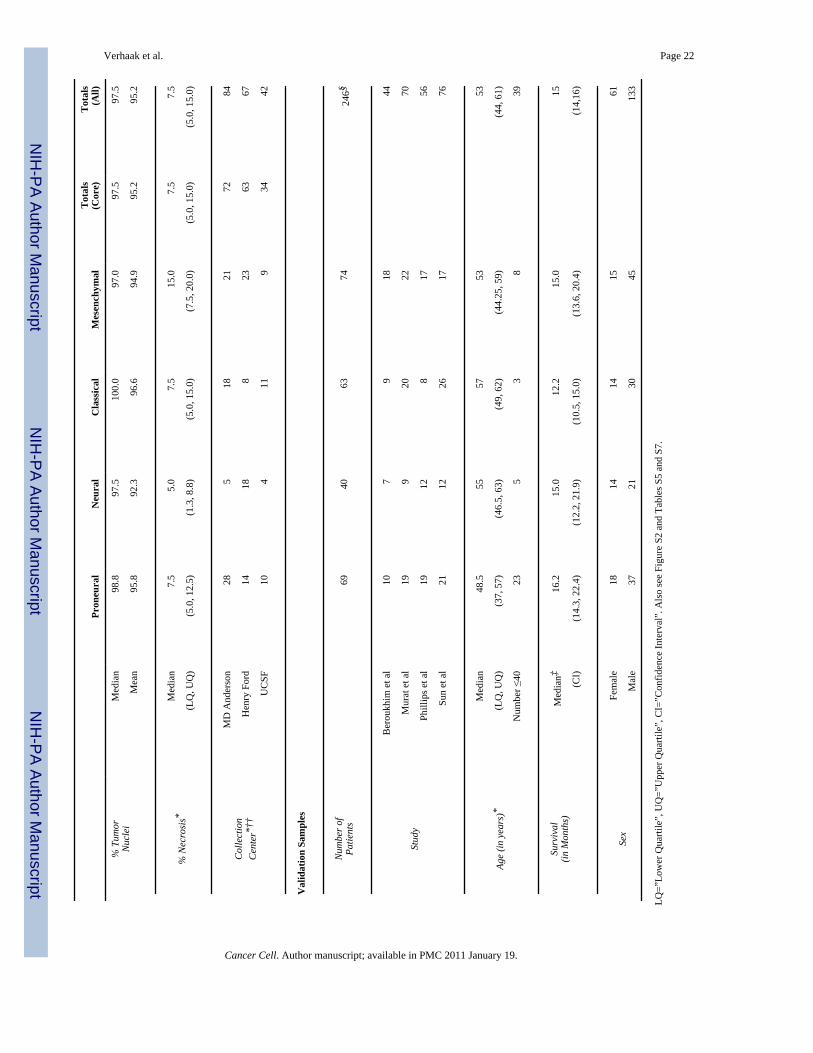
NIH
-PA Author Manuscript
NIH
-PA Author Manuscript
NIH
-PA Author Manuscript
Verhaak et al Page 23 in
dica
tes s
tatis
tical
ly si
gnifi
cant
rela
tions
hip
betw
een
clus
ter c
ateg
ory
and
phen
otyp
e at
a 0
10
leve
l (se
e te
xt a
nd S
uppl
emen
tary
Tab
le 1
0 fo
r det
ails
) Fo
r TC
GA
sam
ples
onl
y th
e co
re sa
mpl
es w
ere
used
for s
igni
fican
ce te
stin
g
dagger Indi
cate
s cat
egor
ies w
ith la
rge
amou
nts o
f mis
sing
dat
a O
nly
101
patie
nts (
86 lsquoc
orersquo
pat
ient
s) h
ad a
Kar
nofs
ky sc
ore
and
only
193
pat
ient
s (16
6 lsquoc
orersquo
pat
ient
s) h
ad m
ethy
latio
n da
ta a
vaila
ble
daggerdaggerFi
ve sa
mpl
es fr
om D
uke
are
not i
tem
ized
her
e to
pro
tect
pat
ient
con
fiden
tialit
y
Dagger Med
ian
surv
ival
and
cor
resp
ondi
ng c
onfid
ence
inte
rval
s est
imat
ed fr
om K
apla
n-M
eier
cur
ve u
sing
the
surv
ival
pac
kage
in R
sect Nor
mal
and
recu
rren
t pat
ient
s wer
e ex
clud
ed fr
om th
e an
alys
is
Cancer Cell Author manuscript available in PMC 2011 January 19
NIH
-PA Author Manuscript
NIH
-PA Author Manuscript
NIH
-PA Author Manuscript
Verhaak et al Page 24
Tabl
e 2
Cop
y nu
mbe
r alte
ratio
ns c
orre
late
with
GB
M su
btyp
e
RO
IPr
oneu
ral
(n=5
4)N
eura
l(n
=24)
Cla
ssic
al(n
=37)
Mes
ench
ymal
(n=5
5)T
otal
Sa
mpl
esA
ltere
d
Kno
wn
Can
cer
Gen
e in
Reg
ion
A L
ow a
nd H
igh
Leve
l Am
plifi
ed E
vent
s
7p11
229
(54
)23
(96
)37
(100
)
52 (9
5)
141
EGFR
7q21
225
(46
)23
(96
)34
(92
)49
(89
)13
1C
DK
6
7q31
229
(54
)22
(92
)32
(86
)50
(91
)13
1M
ET
7q34
28 (5
2)
22 (9
2)
32 (8
6)
50 (9
1)
132
-
B H
igh
Leve
l Am
plifi
catio
n Ev
ents
7p11
29
(17
)16
(67
)35
(95
)16
(29
)76
EGFR
4q12
19 (3
5)
3 (1
3)
2 (5
)
5 (9
)
29PD
GFR
ADagger
C H
omoz
ygou
s and
Hem
izyg
ous D
elet
ion
Even
ts
17q1
12
3 (6
)
4 (1
7)
2 (5
)
21 (3
8)
28N
F1
10q2
337
(69
)23
(96
)37
(100
)
48 (8
7)
145
PTEN
9p21
330
(56
)17
(71
)35
(95
)37
(67
)11
9C
DK
N2A
CD
KN
2B
13q1
428
(52
)11
(46
)6
(16
)29
(53
)74
RB
1
D H
omoz
ygou
s Del
etio
n Ev
ents
9p21
322
(40
)13
(54
)34
(92
)29
(53
)98
CD
KN
2AC
DK
N2B
Abb
revi
atio
ns R
OI
regi
on o
f int
eres
t
Dagger The
peak
of t
he a
mpl
ifica
tion
is a
djac
ent t
o PD
GFR
A S
igni
fican
ce o
f the
diff
eren
ce in
num
ber o
f eve
nts b
etw
een
subt
ypes
and
rem
aind
er o
f the
subt
ypes
was
test
ed u
sing
a tw
o si
ded
Fish
errsquos
exa
ct te
st
corr
ecte
d fo
r mul
tiple
test
ing
usin
g a
Fam
ily W
ise
Erro
r Rat
e B
olde
d en
tries
indi
cate
p-v
alue
s sig
nific
ant a
t 01
leve
l A
n as
teris
k in
dica
tes p
-val
ues s
igni
fican
t at 0
01
leve
l A
lso
see
Figu
re S
4 an
d Ta
ble
S1
Cancer Cell Author manuscript available in PMC 2011 January 19
NIH
-PA Author Manuscript
NIH
-PA Author Manuscript
NIH
-PA Author Manuscript
Verhaak et al Page 25
Tabl
e 3
Dis
tribu
tion
of fr
eque
ntly
-mut
ated
gen
es a
cros
s GB
M su
btyp
es
Gen
ePr
oneu
ral
(n=3
7)N
eura
l(n
=19)
Cla
ssic
al(n
=22)
Mes
ench
ymal
(n=3
8)T
otal
Mut
TP5
320
(54
)4
(21
)0
(0
)12
(32
)36
PTE
N6
(16
)4
(21
)5
(23
)12
(32
)27
NF1
2 (5
)
3 (1
6)
1 (5
)
14 (3
7)
20
EG
FR6
(16
)5
(26
)7
(32
)2
(5
)20
IDH
111
(30
)1
(5
)0
(0
)0
(0
)12
PIK
3R1
7 (1
9)
2 (1
1)
1 (5
)
0 (0
)
10
RB
11
(3
)1
(5
)0
(0
)5
(13
)7
ER
BB
22
(5
)3
(16
)1
(5
)1
(3
)7
EG
FRvI
II1
(3
)0
(0
)5
(23
)1
(3
)7
PIK
3CA
3 (8
)
1 (5
)
1 (5
)
1 (3
)
6
PDG
FRA
4 (1
1)
0 (0
)
0 (0
)
0 (0
)
4
Sign
ifica
nce
of th
e di
ffer
ence
in n
umbe
r of e
vent
s bet
wee
n su
btyp
es a
nd re
mai
nder
of t
he su
btyp
es w
as d
eter
min
ed u
sing
a tw
o si
ded
Fish
errsquos
exa
ct te
st c
orre
cted
for m
ultip
le te
stin
g us
ing
a Fa
mily
Wis
e Er
ror
Rat
e B
olde
d en
tries
indi
cate
p-v
alue
s sig
nific
ant a
t 01
leve
l A
n as
teris
k in
dica
tes p
-val
ues s
igni
fican
t at 0
01
leve
l A
lso
see
Figu
re S
5 an
d Ta
bles
S2
S4
and
S6
Cancer Cell Author manuscript available in PMC 2011 January 19
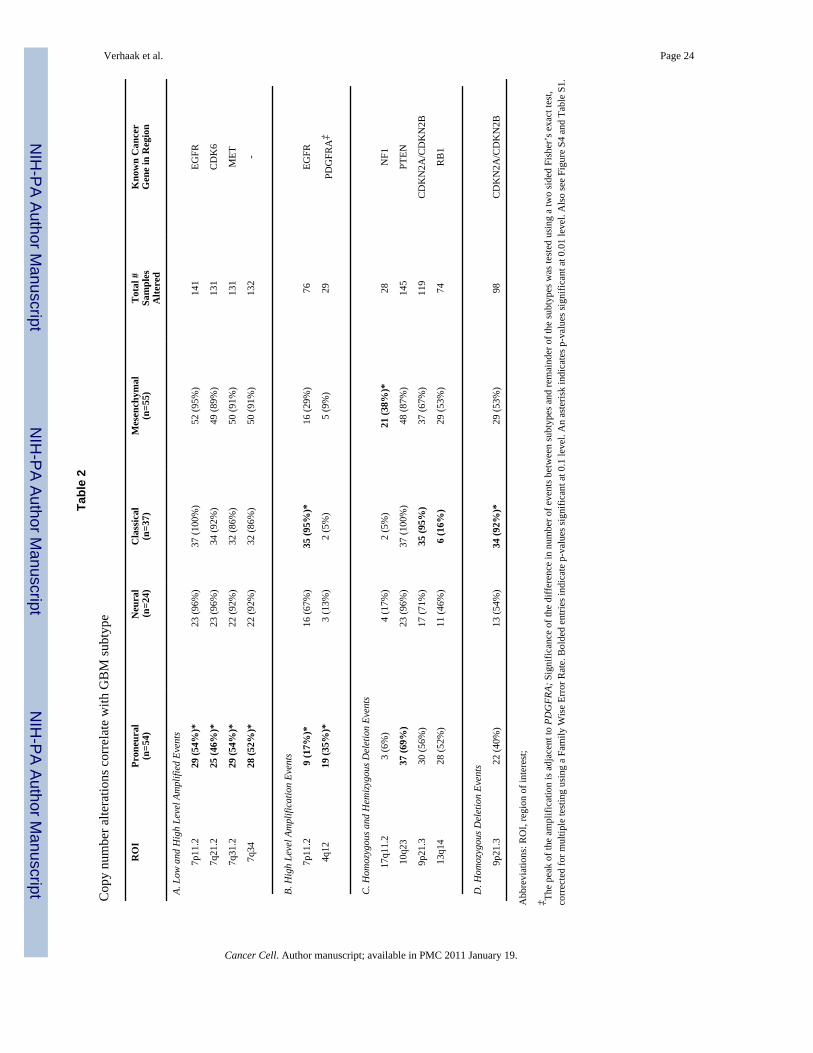
NIH
-PA Author Manuscript
NIH
-PA Author Manuscript
NIH
-PA Author Manuscript
Verhaak et al Page 25
Tabl
e 3
Dis
tribu
tion
of fr
eque
ntly
-mut
ated
gen
es a
cros
s GB
M su
btyp
es
Gen
ePr
oneu
ral
(n=3
7)N
eura
l(n
=19)
Cla
ssic
al(n
=22)
Mes
ench
ymal
(n=3
8)T
otal
Mut
TP5
320
(54
)4
(21
)0
(0
)12
(32
)36
PTE
N6
(16
)4
(21
)5
(23
)12
(32
)27
NF1
2 (5
)
3 (1
6)
1 (5
)
14 (3
7)
20
EG
FR6
(16
)5
(26
)7
(32
)2
(5
)20
IDH
111
(30
)1
(5
)0
(0
)0
(0
)12
PIK
3R1
7 (1
9)
2 (1
1)
1 (5
)
0 (0
)
10
RB
11
(3
)1
(5
)0
(0
)5
(13
)7
ER
BB
22
(5
)3
(16
)1
(5
)1
(3
)7
EG
FRvI
II1
(3
)0
(0
)5
(23
)1
(3
)7
PIK
3CA
3 (8
)
1 (5
)
1 (5
)
1 (3
)
6
PDG
FRA
4 (1
1)
0 (0
)
0 (0
)
0 (0
)
4
Sign
ifica
nce
of th
e di
ffer
ence
in n
umbe
r of e
vent
s bet
wee
n su
btyp
es a
nd re
mai
nder
of t
he su
btyp
es w
as d
eter
min
ed u
sing
a tw
o si
ded
Fish
errsquos
exa
ct te
st c
orre
cted
for m
ultip
le te
stin
g us
ing
a Fa
mily
Wis
e Er
ror
Rat
e B
olde
d en
tries
indi
cate
p-v
alue
s sig
nific
ant a
t 01
leve
l A
n as
teris
k in
dica
tes p
-val
ues s
igni
fican
t at 0
01
leve
l A
lso
see
Figu
re S
5 an
d Ta
bles
S2
S4
and
S6
Cancer Cell Author manuscript available in PMC 2011 January 19