Insulin, Insulin-Like Growth Factor-I, and Risk of Breast Cancer in Postmenopausal Women
13
48 Articles | JNCI Vol. 101, Issue 1 | January 7, 2009 Breast cancer is the most common malignancy among women in the United States. Approximately 182 000 new cases of breast can- cer and more than 40 000 breast cancer–related deaths are expected in 2008 (1). One of the established risk factors for postmenopausal breast cancer, obesity (2–7), has reached epidemic proportions in the United States, and with more than one-third of women older than 40 years currently classified as obese (defined as a body mass index [BMI] ≥30 kg/m 2 ) (8), breast cancer incidence rates could soon rise. It is widely hypothesized that the association between obesity and postmenopausal breast cancer partly reflects the higher than average circulating estrogen levels present in obese women (9). However, obesity has additional endocrinologic effects that could play a role in breast cancer development. Hyperinsulinemia —a consequence of insulin resistance or the impaired responsiveness of cells to insulin —is also more common in obese women than in normal-weight women (defined as a BMI of 18.5–25.0 kg/m 2 ) (10). Insulin has been shown to stimulate cell proliferation in normal breast tissue and in human breast cancer cell lines (11,12), and administration of exogenous insulin Affiliations of authors: Department of Epidemiology and Population Health, Albert Einstein College of Medicine, Bronx, New York, NY (MJG, SW-S, TER, GYFH, XX, RCK, TGH, JW-R, RDB, HDS); Department of Statistics, Rutgers University, New Brunswick, NJ (DRH, JL); Division of Chronic Disease Epidemiology, Yale University School of Medicine, New Haven, CT (HY); Brigham and Women’s Hospital, Harvard Medical School, Boston, MA (JEM); Public Health Sciences Division, Fred Hutchinson Cancer Research Center, Seattle, WA (GLA); MedStar Research Institute, Hyattsville, MD (BVH). Correspondence to: Marc J. Gunter, PhD, Department of Epidemiology and Population Health, Albert Einstein College of Medicine, 1300 Morris Park Ave, Bronx, New York, NY 10461 (e-mail: [email protected]). See “Funding” and “Notes” following “References.” DOI: 10.1093/jnci/djn415 © The Author 2008. Published by Oxford University Press. All rights reserved. For Permissions, please e-mail: [email protected]. ARTICLE Insulin, Insulin-Like Growth Factor-I, and Risk of Breast Cancer in Postmenopausal Women Marc J. Gunter, Donald R. Hoover, Herbert Yu, Sylvia Wassertheil-Smoller, Thomas E. Rohan, JoAnn E. Manson, Jixin Li, Gloria Y. F. Ho, Xiaonan Xue, Garnet L. Anderson, Robert C. Kaplan, Tiffany G. Harris, Barbara V. Howard, Judith Wylie-Rosett, Robert D. Burk, Howard D. Strickler Background The positive association between obesity and postmenopausal breast cancer has been attributed, in part, to the fact that estrogen, a risk factor for breast cancer, is synthesized in adipose tissue. Obesity is also associated with high levels of insulin, a known mitogen. However, no prospective studies have directly assessed associations between circulating levels of insulin and/or insulin-like growth factor (IGF)-I, a related hormone, and the risk of breast cancer independent of estrogen level. Methods We conducted a case–cohort study of incident breast cancer among nondiabetic women who were enrolled in the Women’s Health Initiative Observational Study (WHI-OS), a prospective cohort of 93 676 postmenopausal women. Fasting serum samples obtained at study entry from 835 incident breast cancer case subjects and from a subcohort of 816 randomly chosen WHI-OS subjects were tested for levels of insulin, glucose, total IGF-I, free IGF-I, insulin-like growth factor binding protein-3, and estradiol. Multivariable Cox proportional hazards models were used to estimate associations between levels of the serologic factors and baseline characteristics (including body mass index [BMI]) and the risk of breast cancer. All statistical tests were two-sided. Results Insulin levels were positively associated with the risk of breast cancer (hazard ratio [HR] for highest vs lowest quartile of insulin level = 1.46, 95% confidence interval [CI] = 1.00 to 2.13, P trend = .02); however, the association with insulin level varied by hormone therapy (HT) use ( P interaction = .01). In a model that con- trolled for multiple breast cancer risk factors including estradiol, insulin level was associated with breast cancer only among nonusers of HT (HR for highest vs lowest quartile of insulin level = 2.40, 95% CI = 1.30 to 4.41, P trend < .001). Obesity (BMI ≥30 kg/m 2 ) was also associated with the risk of breast cancer among nonusers of HT (HR for BMI ≥30 kg/m 2 vs 18.5 to <25 kg/m 2 = 2.12, 95% CI = 1.26 to 3.58, P trend = .003); however, this association was attenuated by adjustment for insulin ( P trend = .40). Conclusion These data suggest that hyperinsulinemia is an independent risk factor for breast cancer and may have a substantial role in explaining the obesity–breast cancer relationship. J Natl Cancer Inst 2009;101:48–60 by guest on May 18, 2011 jnci.oxfordjournals.org Downloaded from
Transcript of Insulin, Insulin-Like Growth Factor-I, and Risk of Breast Cancer in Postmenopausal Women

48 Articles | JNCI Vol. 101, Issue 1 | January 7, 2009
Breast cancer is the most common malignancy among women in the United States. Approximately 182 000 new cases of breast can-cer and more than 40 000 breast cancer – related deaths are expected in 2008 ( 1 ). One of the established risk factors for postmenopausal breast cancer, obesity ( 2 – 7 ), has reached epidemic proportions in the United States, and with more than one-third of women older than 40 years currently classifi ed as obese (defi ned as a body mass index [BMI] ≥ 30 kg/m 2 ) ( 8 ), breast cancer incidence rates could soon rise. It is widely hypothesized that the association between obesity and postmenopausal breast cancer partly refl ects the higher than average circulating estrogen levels present in obese women ( 9 ). However, obesity has additional endocrinologic effects that could play a role in breast cancer development.
Hyperinsulinemia — a consequence of insulin resistance or the impaired responsiveness of cells to insulin — is also more common in obese women than in normal-weight women (defi ned as a BMI
of 18.5 – 25.0 kg/m 2 ) ( 10 ). Insulin has been shown to stimulate cell proliferation in normal breast tissue and in human breast cancer cell lines ( 11 , 12 ), and administration of exogenous insulin
Affiliations of authors: Department of Epidemiology and Population Health, Albert Einstein College of Medicine, Bronx, New York, NY (MJG, SW-S, TER, GYFH, XX, RCK, TGH, JW-R, RDB, HDS); Department of Statistics, Rutgers University, New Brunswick, NJ (DRH, JL); Division of Chronic Disease Epidemiology, Yale University School of Medicine, New Haven, CT (HY); Brigham and Women ’ s Hospital, Harvard Medical School, Boston, MA (JEM); Public Health Sciences Division, Fred Hutchinson Cancer Research Center, Seattle, WA (GLA); MedStar Research Institute, Hyattsville, MD (BVH) .
Correspondence to: Marc J. Gunter, PhD, Department of Epidemiology and Population Health, Albert Einstein College of Medicine, 1300 Morris Park Ave, Bronx, New York, NY 10461 (e-mail: [email protected] ).
See “Funding” and “Notes” following “References.”
DOI: 10.1093/jnci/djn415
© The Author 2008. Published by Oxford University Press. All rights reserved. For Permissions, please e-mail: [email protected].
ARTICLE
Insulin, Insulin-Like Growth Factor-I, and Risk of Breast Cancer in Postmenopausal Women Marc J. Gunter , Donald R. Hoover , Herbert Yu , Sylvia Wassertheil-Smoller , Thomas E. Rohan , JoAnn E. Manson , Jixin Li , Gloria Y. F. Ho , Xiaonan Xue , Garnet L. Anderson , Robert C. Kaplan , Tiffany G. Harris , Barbara V. Howard , Judith Wylie-Rosett , Robert D. Burk , Howard D. Strickler
Background The positive association between obesity and postmenopausal breast cancer has been attributed, in part, to the fact that estrogen, a risk factor for breast cancer, is synthesized in adipose tissue. Obesity is also associated with high levels of insulin, a known mitogen. However, no prospective studies have directly assessed associations between circulating levels of insulin and/or insulin-like growth factor (IGF)-I, a related hormone, and the risk of breast cancer independent of estrogen level.
Methods We conducted a case – cohort study of incident breast cancer among nondiabetic women who were enrolled in the Women’s Health Initiative Observational Study (WHI-OS), a prospective cohort of 93 676 postmenopausal women. Fasting serum samples obtained at study entry from 835 incident breast cancer case subjects and from a subcohort of 816 randomly chosen WHI-OS subjects were tested for levels of insulin, glucose, total IGF-I, free IGF-I, insulin-like growth factor binding protein-3, and estradiol. Multivariable Cox proportional hazards models were used to estimate associations between levels of the serologic factors and baseline characteristics (including body mass index [BMI]) and the risk of breast cancer. All statistical tests were two-sided.
Results Insulin levels were positively associated with the risk of breast cancer (hazard ratio [HR] for highest vs lowest quartile of insulin level = 1.46, 95% confidence interval [CI] = 1.00 to 2.13, P trend = .02); however, the association with insulin level varied by hormone therapy (HT) use ( P interaction = .01). In a model that con-trolled for multiple breast cancer risk factors including estradiol, insulin level was associated with breast cancer only among nonusers of HT (HR for highest vs lowest quartile of insulin level = 2.40, 95% CI = 1.30 to 4.41, P trend < .001). Obesity (BMI ≥ 30 kg/m 2 ) was also associated with the risk of breast cancer among nonusers of HT (HR for BMI ≥ 30 kg/m 2 vs 18.5 to <25 kg/m 2 = 2.12, 95% CI = 1.26 to 3.58, P trend = .003); however, this association was attenuated by adjustment for insulin ( P trend = .40).
Conclusion These data suggest that hyperinsulinemia is an independent risk factor for breast cancer and may have a substantial role in explaining the obesity – breast cancer relationship.
J Natl Cancer Inst 2009;101: 48 – 60
by guest on May 18, 2011
jnci.oxfordjournals.orgD
ownloaded from

jnci.oxfordjournals.org JNCI | Articles 49
promotes breast tumor growth in animal models ( 13 – 15 ). Insulin may also increase the risk of breast cancer via alterations in circu-lating estrogen levels. For example, chronic hyperinsulinemia is associated with increased ovarian estrogen production, reduced hepatic secretion of sex hormone – binding globulin, and increased free estradiol levels ( 16 , 17 ).
Epidemiological data regarding the association between circu-lating insulin levels and the risk of breast cancer are limited. To our knowledge, only three small prospective studies (N < 200 cases each) have directly assessed the association between insulin levels and the risk of postmenopausal breast cancer ( 18 – 20 ). Two of these studies, both of which included women who were using hor-mone therapy (HT), reported no association ( 19 , 20 ), and the third study, which was conducted among nonusers of HT, found a posi-tive association between hyperinsulinemia and postmenopausal breast cancer only among women who had a BMI that was greater than 25 kg/m 2 ( 18 ). In several other prospective investigations that lacked blood specimens from fasting patients, the circulating C-peptide level, a marker of insulin secretion, was positively asso-ciated with the risk of postmenopausal breast cancer ( 21 – 23 ). However, although in nonfasting patients, C-peptide levels are more stable than insulin levels, they do increase substantially post-prandially ( 24 ), and the levels of C-peptide and insulin are not perfectly correlated (Spearman r = .77, P < .001), even when assessed in blood specimens from fasting patients ( 25 ). Given these considerations, further investigation of the insulin – breast cancer relationship is warranted.
Insulin-like growth factor (IGF)-I is a hormone related to insu-lin that has also attracted interest as an endocrine risk factor for breast cancer. Insulin-like growth factor-I and insulin share exten-sive sequence homology and downstream signaling pathways, but IGF-I exhibits stronger mitogenic and antiapoptotic effects ( 26 ). Insulin-like growth factor-I is a potent mitogen for both normal and transformed breast epithelial cells ( 27 ), and serum IGF-I level is associated with the development of mammary gland hyperplasia and cancer in a primate model ( 28 ). Most of the IGF-I in the cir-culation is produced by the liver and is bound to insulin-like growth factor binding proteins (IGFBPs); at least 75% of circulat-ing IGF-I is bound to IGFBP-3 ( 29 ). Although only 1% of total serum IGF-I is unbound, this free fraction may be the most bio-logically active form of IGF-I ( 30 ).
Four systematic reviews and meta-analyses on IGF-I, IGFBP-3, and breast cancer ( 31 – 35 ) concluded that there was no overall association between total IGF-I or IGFBP-3 levels and the risk of postmenopausal breast cancer. Recently, results from two large prospective studies reported positive associations between total IGF-I levels and the risk of breast cancer only among women older than 50 years ( 36 , 37 ). The only prospective study to our knowl-edge to measure free IGF-I in serum reported a strong positive association between free IGF-I levels and postmenopausal breast cancer risk among overweight women not using HT, albeit on the basis of a small number of breast cancer cases ( 18 ). However, none of the investigations that prospectively investigated circulating IGF-I concentrations and breast cancer risk controlled for endog-enous estrogen levels, which, given the strong association between estrogen level and breast cancer and the extensive overlap between the insulin – IGF and the sex hormone signaling pathways ( 38 ), may
be necessary to assess the independent associations between insulin and IGF-I levels and the risk of breast cancer.
We investigated associations between incident breast cancer and fasting levels of insulin, total and free IGF-I, and estradiol in a large, prospective cohort of postmenopausal women. In addition, we assessed the degree to which these factors might explain the obesity – breast cancer relationship.
Subjects and Methods Study Population
Women’s Health Initiative. This study was conducted among women enrolled in the Women’s Health Initiative Observational Study (WHI-OS), a prospective cohort of 93 676 postmenopausal women aged 50 – 79 years who were recruited through 40 clinical centers across the United States between October 1, 1993, and December 31, 1998 ( 39 , 40 ). At study entry (ie, baseline), WHI-OS participants provided written informed consent and completed questionnaires regarding demographic and behavioral factors, medical history, and use of medications (including HT). Each woman underwent a physical examination that included waist, hip, height, and weight measurements, and provided a blood sample following an overnight fast of at least 8 hours; the blood samples
CONTEXT AND CAVEATS
Prior knowledge
O besity has been linked to high circulating levels of insulin and estrogen and to an increased risk of postmenopausal breast can-cer. However, it is unclear whether circulating levels of insulin and/or insulin-like growth factor-I (IGF-I), a related hormone, are associ-ated with the risk of breast cancer independent of estrogen level.
Study design
A prospective case – cohort study among nondiabetic postmeno-pausal women enrolled in the Women’s Health Initiative Observational Study (WHI-OS) to examine associations between levels of serologic factors (including insulin, total and free IGF-I, and estradiol) in fasting serum samples, baseline characteristics (including body mass index and hormone therapy use), and the risk of breast cancer.
Contribution
Hyperinsulinemia and high endogenous estradiol levels were inde-pendent risk factors for postmenopausal breast cancer and largely explained the association between obesity and the risk of breast cancer in postmenopausal women.
Implications
Interventions aimed at lowering fasting insulin levels or circulating estrogen levels may reduce the risk of breast cancer in postmeno-pausal women.
Limitations
Only baseline levels of the serologic factors were assessed. Some case subjects may have had subclinical breast cancer at WHI-OS recruitment. The observational study design does not establish a cause-and-effect association between the measured serum levels and breast cancer.
From the Editors
by guest on May 18, 2011
jnci.oxfordjournals.orgD
ownloaded from

50 Articles | JNCI Vol. 101, Issue 1 | January 7, 2009
were centrifuged at 1300 g and the separated sera stored at � 70°C within 2 hours of collection ( 41 ). Most cancer outcomes (including breast cancer) among cohort members were initially ascertained through annual self-administered questionnaires; breast case status and the detailed diagnosis were subsequently formally determined through centralized review of all pathology reports, discharge and consultant summaries, operative and radiology reports, and tumor registry abstracts. Clinical and pathological characteristics of the breast tumors (eg, status of estrogen receptor [ER] and progester-one receptor [PR]) were obtained by Women’s Health Initiative from the pathology reports. Breast cancer cases were coded according to the National Cancer Institute’s Surveillance, Epidemiology, and End Results program guidelines ( 42 , 43 ). As of February 29, 2004, the date when the subjects included in this breast cancer case – cohort study were selected, the mean follow-up time for WHI-OS participants was 77 months; 1.6% of the women had been lost to follow-up, and 4.7% were deceased.
Study Subjects. A case of incident breast cancer was defined as the diagnosis of disease after more than 1 year of follow-up in a woman with no history of breast cancer at baseline. We randomly selected 900 of the approximately 1800 case subjects who met these criteria at the time this study was initiated. We excluded diabetic patients (determined through self-report or self-reported use of diabetes medications or who had a fasting glucose level >125 mg/dL) as in previous studies ( 18 , 19 ) because of the uncertain effects of an abnormal (ie, diabetic) hormonal milieu on the rela-tionship between breast cancer and the serologic factors being measured. After we excluded the diabetic patients (n = 65), our study included 835 case subjects, including 10 with in situ cancer. The comparison group was a subcohort of 816 subjects who were randomly chosen from among all WHI-OS subjects who met the same inclusion and exclusion criteria as the case subjects and excluded the 835 case subjects.
Laboratory Methods
Serum insulin and glucose levels were measured by the Medical Research Laboratories (Highland Heights, KY) using assays with sensitivities of 0.26 µ IU/mL and 0.5 mg/dL, respectively. We used the homeostasis model assessment – insulin resistance (HOMA-IR) index to estimate insulin resistance (HOMA-IR index = fasting insulin [ µ IU/mL] × fasting glucose [mg/dL]/22.5) ( 44 ). Hyperinsulinemia was defined as a value in the highest quartile of fasting insulin levels among nondiabetic individuals ( 45 ). Serum estradiol levels were measured at the Esoterix Center for Clinical Trials (Calabasas Hills, CA) with the use of a Vitros-Eci Immunodiagnostic assay (Ortho-Clinical Diagnostics, High Wycombe, UK) with a sensitivity of 5 pg/mL. Serum concentra-tions of total IGF-I, free IGF-I, and IGFBP-3 were measured using enzyme-linked immunosorbent assays (Diagnostic Systems Laboratories, Webster, TX) with sensitivities of 0.01, 0.015, and 0.04 ng/mL, respectively, as previously described ( 46 , 47 ). The estradiol assays were completed in a single batch. All of the other assays were completed in two separate batches with equal propor-tions of case subjects and subcohort members distributed across each batch. All assays were conducted once in duplicate, and the mean value for each duplicate pair was used as the unit of analysis.
Tests with intra-assay coefficients of variation (CVs) greater than 10% were repeated. For the assay of free IGF-I, a CV of greater than 20% was used as the threshold for repeating the assay, because free IGF-I levels are typically low, and from a purely mathematical perspective, the CV becomes sensitive to small changes in SD when the mean value of a parameter is low. The Esoterix Center for Clinical Trials conducted its own quality control tests and repeated any tests that had a CV of greater than 20%. We retested approxi-mately 5% of the WHI-OS samples chosen at random in a blinded fashion and found that the assay values determined in the replicates were highly correlated with the values from initial testing (Pearson r values: total IGF-I = .96, free IGF-I = .90, IGFBP-3 = .90, insulin = .98, glucose = .95, and estradiol = .99). Average interassay CVs, which were determined using the 5% blinded replicates, were as follows: total IGF-I = 8.2%, free IGF-I = 11.2%, IGFBP-3 = 3.6%, insulin = 3.4%, glucose = 4.2%, and estradiol = 5.9%.
Statistical Analysis
Differences in the distributions of baseline characteristics between the case subjects and the subcohort members (limited to those who did not later become case subjects) were compared using the Wilcoxon rank sum test (for continuous data) or the Pearson X 2 test (for categorical data). All serologic variables were expressed as quartiles or tertiles based on the distributions of the data in the subcohort, as was done in previous studies of insulin and IGF levels and breast cancer ( 20 , 21 , 23 , 36 , 37 ). For the assays that were con-ducted in two separate batches, the quartiles were determined sepa-rately for each batch to minimize the possibility that unrecognized variations in laboratory results across batches might affect our find-ings. Correlations between these categorical serologic data, age, and BMI (calculated as weight [kg] divided by [height in meters] 2 ) were assessed using the Spearman correlation coefficient. To assess the impact of current use of HT on each of the measured serologic fac-tors, we categorized the mean values for the factor according to three HT strata — users of unopposed estrogen, users of combined estrogen and progestin, or nonusers of HT — and compared these values using analysis of variance (ANOVA).
To examine the associations between the serologic factors and the risk of breast cancer, we estimated hazard ratios using Cox proportional hazard regression models that used the Self – Prentice method ( 48 ) for computing robust SE estimates (to account for the case – cohort design), with time from WHI-OS enrollment (in days) as the underlying time metric. Proportionality of the data was veri-fi ed by graphical inspection. All models were adjusted for the fol-lowing established breast cancer risk factors (chosen before data analysis): age (50 – 54 [referent], 55 – 59, 60 – 64, 65 – 69, 70 – 74, or 75 – 79 years); smoking status (never [referent], former, or current smoker); race and/or ethnicity (white [referent], black, Hispanic, or Asian or other); usual physical activity, assessed as metabolic equivalent tasks per hour per week (defi ned as the caloric need per kilogram of body weight per hour of activity divided by the caloric need per kilogram of body weight per hour at rest) and categorized as quartiles (<3.75, 3.75 – 9.82, 9.83 – 18.74, ≥ 18.75); BMI (<18.5, 18.5 to <25.0 [referent], 25.0 to <30.0, or ≥ 30.0 kg/m 2 ); alcohol consumption, assessed as the number of servings per week during the preceding 3 months (none [referent], <3, or ≥ 3); current use of nonsteroidal anti-infl ammatory drugs (NSAIDs; yes or no); family
by guest on May 18, 2011
jnci.oxfordjournals.orgD
ownloaded from

jnci.oxfordjournals.org JNCI | Articles 51
history of breast cancer (defi ned as having a fi rst-degree relative with breast cancer; yes or no); ever use of oral contraceptives (yes or no); parity (0 [referent], 1, or ≥ 2 live births); age at fi rst child’s birth (<20 [referent], 20 – 24, 25 – 29, or ≥ 30 years); age at menarche ( ≤ 10 [referent], 11 – 12, or ≥ 13 years); age at menopause ( ≤ 42 [refer-ent], 43 – 48, 49 – 51, or ≥ 52 years); and the highest education level (high school or lower [referent], college, or postgraduate educa-tion). The cut points for the risk factors were chosen based on those used in previous studies in which these variables were inves-tigated in relation to breast cancer ( 4 , 21 ) or by visually inspecting the data and distributing the data evenly across categories. Endogenous estradiol levels were assessed only in current nonusers of HT because standard estradiol assays cannot accurately measure the equine hormones present in most HT preparations. We there-fore stratifi ed the analyses of serum estradiol by creating fi ve non-overlapping groups, namely, nonusers of HT with low (referent), moderate, or high estradiol levels (defi ned in tertiles); users of unopposed estrogen; and users of combined estrogen and proges-tin. These groups were then parameterized as separate dummy variables, with low estradiol as the common referent, which allowed us to assess potentially different associations with estrogen use, estrogen and progestin use, and high endogenous estradiol (among nonusers of HT) in a single model.
Subgroup analyses included stratifi cation by current HT use (nonuser of HT, unopposed estrogen user, or estrogen and pro-gestin user), endogenous estradiol level (stratifi ed as higher vs lower than the median value in the subcohort because insuffi cient data were available to stratify by tertile), and BMI (categorized as normal [<25 kg/m 2 ] and overweight/obese [ ≥ 25 kg/m 2 ] according to World Health Organization criteria) ( 49 ). These stratifi ed analyses were conducted by introducing interaction terms into multivariable models that also included the main effect variables. In addition, we conducted separate analyses for ER-positive and ER-negative breast cancer and for PR-positive and PR-negative breast cancer; however, the resulting hazard ratios could not be formally compared using standard tests of heterogeneity because the ER-positive and ER-negative breast cancers (and the PR-positive and PR-negative breast cancers) have a common com-parison group (the representative subcohort), and therefore, the hazard ratios for the two breast cancer subtypes are not indepen-dent. Instead, the hazard ratios were compared qualitatively based on the point estimates and 95% confi dence intervals.
All tests of statistical signifi cance were two-sided, and P values less than .05 were considered statistically signifi cant.
Results Baseline Characteristics
Compared with women in the subcohort, the selected case sub-jects were older, had a later onset of menopause, had greater alcohol consumption, had a higher frequency of NSAID use, and more often reported being a former smoker ( Table 1 ). They also were more likely than women in the subcohort to have a first-degree relative with breast cancer and to have been using HT at baseline ( Table 1 ). The baseline characteristics of the randomly selected breast cancer case subjects were not statistically signifi-cantly different from those of the remaining breast cancer case
subjects who were eligible for but not included in this study (data not shown).
Correlations between levels of each of the serologic factors, age, and BMI were estimated using Spearman correlation coeffi -cients ( Table 2 ). Among nonusers of HT, total IGF-I level was moderately positively correlated with the levels of free IGF-I ( r = .17, P < .001) and IGFBP-3 ( r = .40, P < .001) but not with BMI, whereas insulin level was strongly positively correlated with BMI ( r = .57, P < .001). The level of endogenous estradiol had a mod-erately strong positive correlation with BMI ( r = .32, P < .001) and insulin level ( r = .17, P < .001) but was inversely correlated with free IGF-I level ( r = � .34, P < .001). Among the users of unop-posed estrogen, total IGF-I level was inversely correlated with age ( r = � .30, P < .001) and positively correlated with free IGF-I ( r = .24, P < .001) and IGFBP-3 ( r = .45, P < .001) levels. Insulin level was strongly correlated with BMI ( r = .58, P < .001) and moder-ately positively correlated with level of IGFBP-3 ( r = .21, P = .006). Finally, among the women using estrogen and progestin, BMI was positively correlated with levels of free IGF-I ( r = .23, P = .002), IGFBP-3 ( r = .25, P < .001), and insulin ( r = .58, P < .001), whereas insulin level was also correlated with free IGF-I ( r = .16, P = .03) and IGFBP-3 ( r = .25, P < .001) levels.
We also examined associations between current HT use and the serologic parameters. The levels of total IGF-I, free IGF-I, and IGFBP-3 were highest in women not using HT, intermediate in those using estrogen and progestin, and lowest in those using unopposed estrogen. For example, the mean level (SD) of free IGF-I was 0.47 ng/mL (0.39) in nonusers of HT, 0.40 ng/mL (0.39) in women who used estrogen and progestin, and 0.32 ng/mL (0.25) in those who used unopposed estrogen ( P < .001, ANOVA). Mean insulin levels (SD) were also higher in nonusers of HT than in HT users (7.1 µ IU/mL [5.0] for nonusers vs 6.0 µ IU/mL [4.3] in estrogen-alone users and 5.7 µ IU/mL [4.2] in estrogen and progestin users; P < .001, ANOVA).
Associations Between Incident Breast Cancer and
Serologic Parameters and Obesity
Table 3 shows the associations between breast cancer and our major exposure variables in age-adjusted multivariable models that adjusted for established breast cancer risk factors. Fasting levels of insulin and endogenous estradiol were associated with a statistically signifi-cantly increased risk of incident breast cancer (hazard ratio [HR] for highest vs lowest quartile of insulin = 1.46, 95% confidence interval [CI] = 1.00 to 2.13, P trend = .02; HR for highest vs lowest tertile of endogenous estradiol = 1.59, 95% CI = 1.00 to 2.55, P trend = .04). Fasting levels of total IGF-I, free IGF-I, IGFBP-3, or glucose, and BMI were not associated with the risk of breast cancer in these models. The associations of levels of total and free IGF-I with breast cancer risk were not altered by adjustment for fasting levels of IGFBP-3 (data not shown). The magnitude of the association between the HOMA-IR index and the risk of breast cancer (HR for highest vs lowest quartile of HOMA-IR index = 1.35, 95% CI = 0.92 to 1.98, P trend = .05) was similar to that for the association between fasting insulin level and breast cancer risk (data not shown).
We detected no statistically signifi cant heterogeneity (all P s > .10) when we stratifi ed the aforementioned results by BMI or by endogenous estradiol level (among nonusers of HT). The results
by guest on May 18, 2011
jnci.oxfordjournals.orgD
ownloaded from

52 Articles | JNCI Vol. 101, Issue 1 | January 7, 2009
Table 1 . Distributions of selected baseline characteristics among the selected case subjects and subcohort members *
Variable Case subjects † (n = 841) Subcohort members (n = 810) P ‡
Median age, y (IQR) 64.0 (54.0 – 74.0) 63.0 (51.0 – 75.0) .01 Race/ethnicity, No. (%) .28 White 737 (87.6) 695 (85.8) Black 56 (6.7) 51 (6.3) Hispanic 25 (3.0) 32 (4.0) Asian/other 19 (2.3) 29 (3.6) Missing 4 (0.4) 3 (0.3) Median weight, kg (IQR) 68.6 (49.6 – 87.6) 68.4 (51.5 – 85.3) .36 Median body mass index, kg/m 2 (IQR) 25.8 (18.8 – 32.8) 26.0 (19.8 – 32.3) .83 Median waist circumference, cm (IQR) 82.0 (65.0 – 99.0) 82.0 (65.1 – 98.9) .23 Median waist-to-hip ratio (IQR) 0.8 (0.7 – 0.9) 0.8 (0.7 – 0.9) .28 Age at menarche in y, No. (%) .62 ≤ 10 66 (7.8) 55 (6.8) 11 – 12 347 (41.3) 328 (40.5) ≥ 13 424 (50.4) 423 (52.2) Missing 4 (0.5) 4 (0.5) Age at menopause in y, No. (%) .001 ≤ 42 122 (14.5) 175 (21.6) 43 – 48 182 (21.6) 192 (23.7) 49 – 51 206 (24.5) 177 (21.9) ≥ 52 253 (30.1) 200 (24.7) Missing 78 (9.3) 66 (8.1) Parity, No. (%) .48 0 120 (14.3) 119 (14.7) 1 62 (7.4) 72 (8.9) ≥ 2 655 (77.9) 613 (75.7) Missing 4 (0.4) 6 (0.7) Age at first child’s birth in y, No. (%) .03 <20 78 (9.3) 78 (9.6) 20 – 24 278 (33.1) 308 (38.0) 25 – 29 228 (27.1) 171 (21.1) ≥ 30 71 (8.4) 65 (8.0) Nulliparous/missing 186 (22.1) 188 (23.3) Ever use of oral contraceptives, No. (%) 345 (41.0) 328 (40.5) .83 Current use of hormone therapy, No. (%) .003 Currently using unopposed estrogen therapy 214 (25.9) 187 (23.1) Currently using combined estrogen + progestin therapy 228 (27.6) 181 (22.4) Currently not using hormone therapy 380 (45.5) 436 (53.8) Missing 13 (1.0) 6 (0.7) Current NSAID use, No. (%) 357 (42.5) 293 (36.2) .01 First-degree relative with breast cancer, No. (%) 209 (25.0) 155 (19.0) .02 Smoking status, No. (%) .003 Never 405 (48.2) 435 (53.7) Former 387 (46.0) 311 (38.4) Current 37 (4.4) 53 (6.5) Missing 12 (1.4) 11 (1.4) Highest education level, No. (%) .07 High school or less 209 (24.9) 253 (31.2) College 348 (41.4) 306 (37.8) Postgraduate education 268 (31.9) 244 (30.1) Missing 16 (1.8) 7 (0.9) Median alcohol consumption, servings per week (IQR) 0.7 (0 – 4.5) 0.4 (0 – 3.1) .02 Median physical activity, METs h � 1 wk � 1 (IQR) 10.50 (0 – 27) 10.00 (0 – 26.3) .99 Estrogen receptor status, No. (%) NA Positive 533 (63) NA Negative 243 (29) NA Missing 65 (8) NA
* IQR = interquartile range; NSAID = nonsteroidal anti-inflammatory drug; METs = metabolic equivalent tasks (defined as the caloric need per kilogram of body weight per hour of activity divided by the caloric need per kilogram of body weight per hour at rest); NA = not applicable.
† Includes the six cases of breast cancer that arose in the subcohort.
‡ P values derived from the Wilcoxon rank sum test for continuous data or the Pearson chi-square test for categorical data.
by guest on May 18, 2011
jnci.oxfordjournals.orgD
ownloaded from

jnci.oxfordjournals.org JNCI | Articles 53
were also essentially unchanged when we excluded women with in situ breast tumors (n = 10) or those who were diagnosed with breast cancer during an additional 2 years of follow-up (and hence, within 3 years of study entry, n = 140; data not shown). Endogenous estra-diol level was the only major exposure variable that showed a dif-ferential association with breast cancer risk according to ER or PR status. Estradiol level was more strongly associated with ER-positive breast cancer (HR for highest vs lowest tertile of estradiol = 2.07, 95% CI = 1.16 to 3.67, P trend = .01) than with ER-negative breast cancer (HR for highest vs lowest tertile of estradiol = 1.00, 95% CI = 0.50 to 2.05, P trend = .98) and more strongly associated with PR-positive breast cancer (HR for highest vs lowest tertile of estra-diol = 1.93, 95% CI = 1.09 to 3.82, P trend = .01) than with PR-negative breast cancer (HR for highest vs lowest tertile of estradiol = 0.97, 95% CI = 0.46 to 2.09, P trend = .96; data not shown).
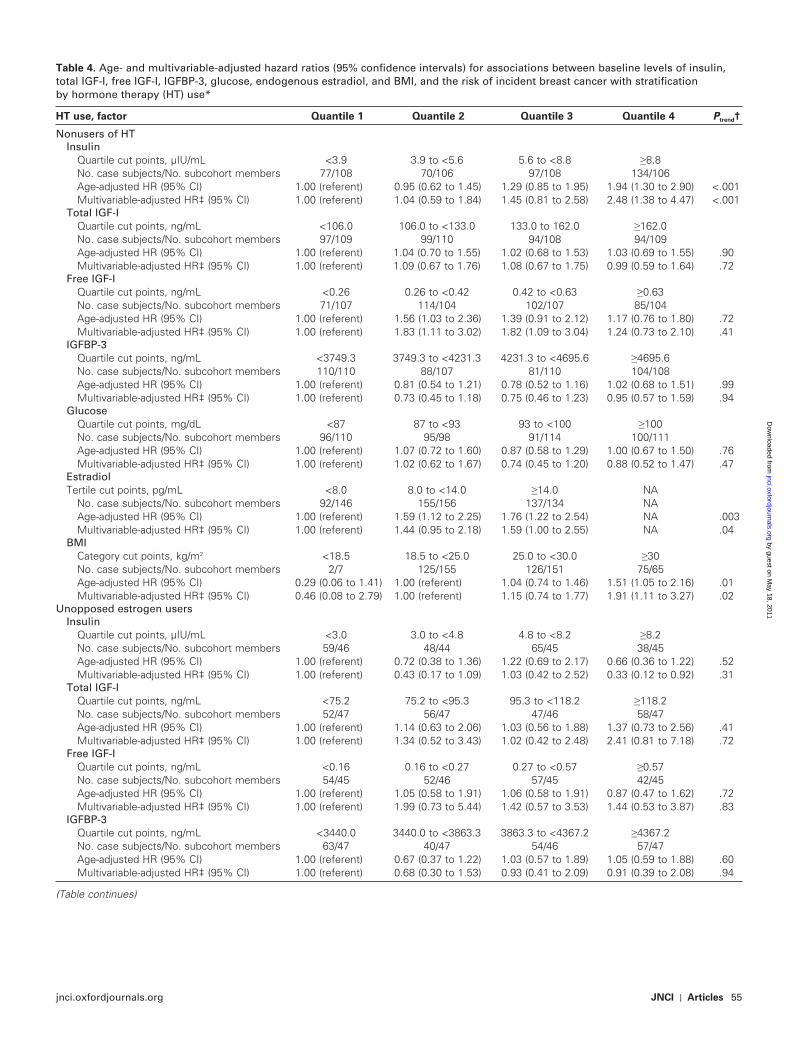
Results Stratified by Current HT Use. Fasting insulin level was associated with a statistically significantly increased risk of inci-dent breast cancer among nonusers of HT (HR for highest vs low-est quartile of insulin = 2.48, 95% CI = 1.38 to 4.47, P trend < .001;
Table 4 ), even after concurrent adjustment for BMI and levels of estradiol and free IGF-I (HR for highest vs lowest quartile of insu-lin = 2.40, 95% CI = 1.30 to 4.41, P trend < .001; Table 5 ). The asso-ciation between risk of breast cancer and insulin level differed statistically significantly among HT users ( P interaction = .01). We observed no association between fasting insulin level and incident breast cancer among women who used estrogen and progestin (HR for highest vs lowest quartile of insulin = 1.15, 95% CI = 0.34 to 3.84, P trend = .40) and a possible inverse association among those who used estrogen alone (HR for highest vs lowest quartile of insu-lin = 0.33, 95% CI = 0.12 to 0.92, P trend = .31; Table 4 ). Among nonusers of HT, insulin levels were more strongly associated with ER-positive breast cancer (HR for highest vs lowest quartile of insulin = 3.23, 95% CI = 1.62 to 6.49, P trend = .001) than with ER-negative breast cancer (HR for highest vs lowest quartile of insulin = 1.37, 95% CI = 0.57 to 3.25, P trend = .99); however, as dis-cussed earlier, we could not formally test the results for heterogene-ity (data not shown).
The association between BMI and the risk of incident breast cancer also varied by HT use, although this variation was not
Table 2 . Spearman correlation matrix for age, BMI, and levels of the serologic factors among the representative subcohort members with stratification by current HT use *
Factor Age BMI Total IGF-I Free IGF-I IGFBP-3 Insulin Glucose HOMA-IR index
Nonusers of HT Age 1.00 BMI � 0.11 1.00 Total IGF-I � 0.13 � 0.08 1.00 Free IGF-I 0.01 � 0.01 0.17 † 1.00 IGFBP-3 � 0.09 � 0.01 0.40 † 0.03 1.00 Insulin � 0.04 0.57 † 0.07 0.05 0.05 1.00 Glucose 0.02 0.25 0.03 0.05 0.08 0.42 † 1.00 HOMA-IR � 0.02 0.57 † � 0.06 0.05 0.06 0.99 † 0.53 † 1.00 Estradiol � 0.05 0.32 † 0.04 � 0.34 † � 0.12 0.17 † 0.06 0.16 † Unopposed estrogen users Age 1.00 BMI � 0.07 1.00 Total IGF-I � 0.30 † � 0.08 1.00 Free IGF-I � 0.06 0.03 0.24 † 1.00 IGFBP-3 � 0.12 � 0.01 0.45 † 0.32 † 1.00 Insulin � 0.05 0.58 † 0.12 0.09 0.21 § 1.00 Glucose 0.02 0.20 ‡ 0.11 0.12 0.08 0.45 † 1.00 HOMA-IR � 0.05 0.56 † 0.13 0.09 0.20 || 0.99 † 0.55 † 1.00 Estrogen + progestin users Age 1.00 BMI � 0.03 1.00 Total IGF-I � 0.13 0.01 1.00 Free IGF-I 0.03 0.23 ¶ 0.05 1.00 IGFBP-3 � 0.02 0.25 † 0.39 † 0.06 1.00 Insulin 0.07 0.58 † 0.10 0.16 # 0.25 † 1.00 Glucose 0.17 0.13 0.16 0.14 0.15 0.31 † 1.00 HOMA-IR 0.10 0.58 † 0.11 0.17 0.25 † 0.99 † 0.43 † 1.00
* All P values are two-sided. BMI = body mass index; HT = hormone therapy; IGF-I = insulin-like growth factor-I; IGFBP-3 = insulin-like growth factor binding protein-3; HOMA-IR = homeostasis model assessment – insulin resistance.
† P < .001.
‡ P = .005.
§ P = .006.
|| P = .007.
¶ P = .002.
# P = .03.
by guest on May 18, 2011
jnci.oxfordjournals.orgD
ownloaded from

54 Articles | JNCI Vol. 101, Issue 1 | January 7, 2009
statistically signifi cant ( P interaction = .07). Among nonusers of HT, high BMI was associated with an increased risk of breast cancer in multivariable models that adjusted for breast cancer risk factors (HR for BMI ≥ 30 kg/m 2 vs 18.5 to <25.0 kg/m 2 = 2.12, 95% CI = 1.26 to 3.58, P trend = .003) ( Table 5 ). Incorporating estradiol levels into these models resulted in only a modest (ie, 10%) reduction in the BMI – breast cancer association (HR for BMI ≥ 30 kg/m 2 vs 18.5 to <25.0 kg/m 2 = 1.91, 95% CI = 1.11 to 3.27, P trend = .02), whereas adjustment for insulin levels attenuated this association by 30% (HR for BMI ≥ 30 kg/m 2 vs 18.5 to <25.0 kg/m 2 = 1.50, 95% CI = 0.80 to 2.83, P trend = .40; Table 5 ). By contrast, among HT users, the association between BMI and the risk of breast cancer was highly variable according to the subgroup analyzed and not statistically
signifi cant for either estrogen and progestin users (HR for BMI ≥ 30 kg/m 2 vs 18.5 to <25.0 kg/m 2 = 0.41, 95% CI = 0.17 to 1.00, P trend = .21) or users of estrogen alone (HR for BMI ≥ 30 kg/m 2 vs 18.5 to <25.0 kg/m 2 = 1.42, 95% CI = 0.64 to 3.14, P trend = .97; Table 4 ). The association of obesity with breast cancer was of similar magni-tude when BMI was categorized as quartiles or when waist circum-ference was used as the measure of obesity (data not shown).
We observed no statistically signifi cant linear trends in the association between free IGF-I level and the risk of breast cancer, regardless of HT stratum (nonuser, unopposed estrogen user, estrogen and progestin user). However, among the nonusers of HT, compared with women in the lowest quartile of free IGF-I, those in the second and third highest quartiles were at increased
Table 3 . Age- and multivariable-adjusted HR (95% CI) for associations of baseline levels of insulin, total IGF-I, free IGF-I, IGFBP-3, glucose, endogenous estradiol, and BMI with the risk of incident breast cancer *
Factor Quantile 1 Quantile 2 Quantile 3 Quantile 4 P trend †
Insulin Quartile cut points, µ IU/mL <3.6 3.6 to <5.7 5.7 to <9.5 ≥ 9.5 No. case subjects/No. subcohort members 185/197 184/190 236/205 222/202 Age-adjusted HR (95% CI) 1.00 (referent) 1.04 (0.78 to 1.39) 1.24 (0.94 to 1.65) 1.21 (0.92 to 1.61) .10 Multivariable-adjusted HR ‡ (95% CI) 1.00 (referent) 1.14 (0.81 to 1.59) 1.55 (1.09 to 2.20) 1.46 (1.00 to 2.13) .02 Total IGF-I Quartile cut points, ng/mL <94.2 94.2 to <119.6 119.6 to <151.0 ≥ 151.0 No. case subjects/No. subcohort members 211/202 259/204 176/202 192/202 Age-adjusted HR (95% CI) 1.00 (referent) 1.22 (0.93 to 1.60) 0.86 (0.65 to 1.15) 0.94 (0.71 to 1.25) .25 Multivariable-adjusted HR ‡ (95% CI) 1.00 (referent) 1.30 (0.95 to 1.77) 0.92 (0.65 to 1.28) 1.21 (0.85 to 1.72) .92 Free IGF-I Quartile cut points, ng/mL <0.21 0.21 to <0.36 0.36 to <0.55 ≥ 0.55 No. case subjects/No. subcohort members 192/195 238/195 210/195 166/195 Age-adjusted HR (95% CI) 1.00 (referent) 1.24 (0.93 to 1.65) 1.11 (0.83 to 1.47) 0.86 (0.64 to 1.15) .23 Multivariable-adjusted HR ‡ (95% CI) 1.00 (referent) 1.33 (0.96 to 1.85) 1.30 (0.93 to 1.81) 1.09 (0.77 to 1.54) .67 IGFBP-3 Quartile cut points, ng/mL <3604.0 3604.0 to <4053.6 4053.6 to <4583.5 ≥ 4583.5 No. case subjects/No. subcohort members 243/203 203/202 192/201 201/203 Age-adjusted HR (95% CI) 1.00 (referent) 0.86 (0.65 to 1.13) 0.82 (0.62 to 1.09) 0.84 (0.64 to 1.11) .20 Multivariable-adjusted HR ‡ (95% CI) 1.00 (referent) 0.80 (0.59 to 1.10) 0.77 (0.56 to 1.07) 0.77 (0.55 to 1.08) .26 Glucose Quartile cut points, mg/dL <86.0 86.0 to <91.5 91.5 to <100 ≥ 100 No. case subjects/No. subcohort members 206/198 233/209 196/194 201/205 Age-adjusted HR (95% CI) 1.00 (referent) 1.06 (0.80 to 1.40) 0.95 (0.72 to 1.26) 0.92 (0.69 to 1.21) .40 Multivariable-adjusted HR ‡ (95% CI) 1.00 (referent) 1.14 (0.82 to 1.59) 0.99 (0.70 to 1.38) 0.92 (0.65 to 1.29) 0.50 Estradiol § Tertile cut points, pg/mL <8.0 8.0 to <14.0 ≥ 14.0 NA No. case subjects/No. subcohort members 92/146 155/156 137/134 NA Age-adjusted HR (95% CI) 1.00 (referent) 1.59 (1.12 to 2.25) 1.76 (1.22 to 2.54) NA .003 Multivariable-adjusted HR ‡ (95% CI) 1.00 (referent) 1.44 (0.95 to 2.18) 1.59 (1.00 to 2.55) NA .04 BMI Category cut points, kg/m 2 <18.5 18.5 to <25.0 25.0 to <30.0 ≥ 30 No. case subjects/No. subcohort members 10/14 341/308 269/290 211/180 Age-adjusted HR (95% CI) 0.56 (0.23 to 1.32) 1.00 (referent) 0.84 (0.66 to 1.05) 1.10 (0.85 to 1.42) .47 Multivariable-adjusted HR ‡ (95% CI) 0.68 (0.27 to 1.69) 1.00 (referent) 0.81 (0.62 to 1.04) 1.13 (0.83 to 1.55) .31
* The total numbers of case subjects and subcohort members vary for each serologic variable due to assay failure for some serum specimens. HR = hazard ratio; CI = confidence interval; IGF-I = insulin-like growth factor-I; IGFBP-3 = insulin-like growth factor binding protein-3; BMI = body mass index; NA = not applicable.
† Statistical tests for trend (two-sided) were calculated using ordinal quantile variables (1 – 4 for quartiles and 1 – 3 for tertiles) entered into the model as a single continuous variable.
‡ Multivariable model adjusted for age, race, alcohol consumption, smoking, family history of breast cancer, parity, age at menopause, age at menarche, age at first child’s birth, use of oral contraceptives, use of nonsteroidal anti-inflammatory drugs, use of estrogen replacement therapy, use of hormone replacement therapy (estrogen and progestin), educational attainment, endogenous estradiol levels (in nonusers of HT) parameterized as described in the text, BMI, and physical activity.
§ Among nonusers of HT only.
by guest on May 18, 2011
jnci.oxfordjournals.orgD
ownloaded from
jnci.oxfordjournals.org JNCI | Articles 55
Table 4 . Age- and multivariable-adjusted hazard ratios (95% confidence intervals) for associations between baseline levels of insulin, total IGF-I, free IGF-I, IGFBP-3, glucose, endogenous estradiol, and BMI, and the risk of incident breast cancer with stratification by hormone therapy (HT) use *
HT use, factor Quantile 1 Quantile 2 Quantile 3 Quantile 4 P trend †
Nonusers of HT Insulin Quartile cut points, µ IU/mL <3.9 3.9 to <5.6 5.6 to <8.8 ≥ 8.8 No. case subjects/No. subcohort members 77/108 70/106 97/108 134/106 Age-adjusted HR (95% CI) 1.00 (referent) 0.95 (0.62 to 1.45) 1.29 (0.85 to 1.95) 1.94 (1.30 to 2.90) <.001 Multivariable-adjusted HR ‡ (95% CI) 1.00 (referent) 1.04 (0.59 to 1.84) 1.45 (0.81 to 2.58) 2.48 (1.38 to 4.47) <.001 Total IGF-I Quartile cut points, ng/mL <106.0 106.0 to <133.0 133.0 to 162.0 ≥ 162.0 No. case subjects/No. subcohort members 97/109 99/110 94/108 94/109 Age-adjusted HR (95% CI) 1.00 (referent) 1.04 (0.70 to 1.55) 1.02 (0.68 to 1.53) 1.03 (0.69 to 1.55) .90 Multivariable-adjusted HR ‡ (95% CI) 1.00 (referent) 1.09 (0.67 to 1.76) 1.08 (0.67 to 1.75) 0.99 (0.59 to 1.64) .72 Free IGF-I Quartile cut points, ng/mL <0.26 0.26 to <0.42 0.42 to <0.63 ≥ 0.63 No. case subjects/No. subcohort members 71/107 114/104 102/107 85/104 Age-adjusted HR (95% CI) 1.00 (referent) 1.56 (1.03 to 2.36) 1.39 (0.91 to 2.12) 1.17 (0.76 to 1.80) .72 Multivariable-adjusted HR ‡ (95% CI) 1.00 (referent) 1.83 (1.11 to 3.02) 1.82 (1.09 to 3.04) 1.24 (0.73 to 2.10) .41 IGFBP-3 Quartile cut points, ng/mL <3749.3 3749.3 to <4231.3 4231.3 to <4695.6 ≥ 4695.6 No. case subjects/No. subcohort members 110/110 88/107 81/110 104/108 Age-adjusted HR (95% CI) 1.00 (referent) 0.81 (0.54 to 1.21) 0.78 (0.52 to 1.16) 1.02 (0.68 to 1.51) .99 Multivariable-adjusted HR ‡ (95% CI) 1.00 (referent) 0.73 (0.45 to 1.18) 0.75 (0.46 to 1.23) 0.95 (0.57 to 1.59) .94 Glucose Quartile cut points, mg/dL <87 87 to <93 93 to <100 ≥ 100 No. case subjects/No. subcohort members 96/110 95/98 91/114 100/111 Age-adjusted HR (95% CI) 1.00 (referent) 1.07 (0.72 to 1.60) 0.87 (0.58 to 1.29) 1.00 (0.67 to 1.50) .76 Multivariable-adjusted HR ‡ (95% CI) 1.00 (referent) 1.02 (0.62 to 1.67) 0.74 (0.45 to 1.20) 0.88 (0.52 to 1.47) .47 Estradiol Tertile cut points, pg/mL <8.0 8.0 to <14.0 ≥ 14.0 NA No. case subjects/No. subcohort members 92/146 155/156 137/134 NA Age-adjusted HR (95% CI) 1.00 (referent) 1.59 (1.12 to 2.25) 1.76 (1.22 to 2.54) NA .003 Multivariable-adjusted HR ‡ (95% CI) 1.00 (referent) 1.44 (0.95 to 2.18) 1.59 (1.00 to 2.55) NA .04 BMI Category cut points, kg/m 2 <18.5 18.5 to <25.0 25.0 to <30.0 ≥ 30 No. case subjects/No. subcohort members 2/7 125/155 126/151 75/65 Age-adjusted HR (95% CI) 0.29 (0.06 to 1.41) 1.00 (referent) 1.04 (0.74 to 1.46) 1.51 (1.05 to 2.16) .01 Multivariable-adjusted HR ‡ (95% CI) 0.46 (0.08 to 2.79) 1.00 (referent) 1.15 (0.74 to 1.77) 1.91 (1.11 to 3.27) .02 Unopposed estrogen users Insulin Quartile cut points, µ IU/mL <3.0 3.0 to <4.8 4.8 to <8.2 ≥ 8.2 No. case subjects/No. subcohort members 59/46 48/44 65/45 38/45 Age-adjusted HR (95% CI) 1.00 (referent) 0.72 (0.38 to 1.36) 1.22 (0.69 to 2.17) 0.66 (0.36 to 1.22) .52 Multivariable-adjusted HR ‡ (95% CI) 1.00 (referent) 0.43 (0.17 to 1.09) 1.03 (0.42 to 2.52) 0.33 (0.12 to 0.92) .31 Total IGF-I Quartile cut points, ng/mL <75.2 75.2 to <95.3 95.3 to <118.2 ≥ 118.2 No. case subjects/No. subcohort members 52/47 56/47 47/46 58/47 Age-adjusted HR (95% CI) 1.00 (referent) 1.14 (0.63 to 2.06) 1.03 (0.56 to 1.88) 1.37 (0.73 to 2.56) .41 Multivariable-adjusted HR ‡ (95% CI) 1.00 (referent) 1.34 (0.52 to 3.43) 1.02 (0.42 to 2.48) 2.41 (0.81 to 7.18) .72 Free IGF-I Quartile cut points, ng/mL <0.16 0.16 to <0.27 0.27 to <0.57 ≥ 0.57 No. case subjects/No. subcohort members 54/45 52/46 57/45 42/45 Age-adjusted HR (95% CI) 1.00 (referent) 1.05 (0.58 to 1.91) 1.06 (0.58 to 1.91) 0.87 (0.47 to 1.62) .72 Multivariable-adjusted HR ‡ (95% CI) 1.00 (referent) 1.99 (0.73 to 5.44) 1.42 (0.57 to 3.53) 1.44 (0.53 to 3.87) .83 IGFBP-3 Quartile cut points, ng/mL <3440.0 3440.0 to <3863.3 3863.3 to <4367.2 ≥ 4367.2 No. case subjects/No. subcohort members 63/47 40/47 54/46 57/47 Age-adjusted HR (95% CI) 1.00 (referent) 0.67 (0.37 to 1.22) 1.03 (0.57 to 1.89) 1.05 (0.59 to 1.88) .60 Multivariable-adjusted HR ‡ (95% CI) 1.00 (referent) 0.68 (0.30 to 1.53) 0.93 (0.41 to 2.09) 0.91 (0.39 to 2.08) .94
(Table continues)
by guest on May 18, 2011
jnci.oxfordjournals.orgD
ownloaded from

56 Articles | JNCI Vol. 101, Issue 1 | January 7, 2009
HT use, factor Quantile 1 Quantile 2 Quantile 3 Quantile 4 P trend †
Glucose Quartile cut points, mg/dL <85 85 to <89 89 to <96 ≥ 96 No. case subjects/No. subcohort members 49/49 55/46 62/45 47/46 Age-adjusted HR (95% CI) 1.00 (referent) 1.42 (0.77 to 2.59) 1.48 (0.83 to 2.63) 1.21 (0.66 to 2.21) .48 Multivariable-adjusted HR ‡ (95% CI) 1.00 (referent) 1.93 (0.76 to 4.89) 2.11 (0.86 to 5.19) 1.29 (0.48 to 3.44) .83 BMI Category cut points, kg/m 2 <18.5 18.5 to <25.0 25.0 to <30.0 ≥ 30 No. case subjects/No. subcohort members 2/1 88/70 74/80 47/35 Age-adjusted HR (95% CI) 0.99 (0.08 to 11.59) 1.00 (referent) 0.67 (0.41 to 1.08) 1.16 (0.65 to 2.07) .99 Multivariable-adjusted HR ‡ (95% CI) 8.99 (0.30 to 267.7) 1.00 (referent) 0.77 (0.40 to 1.48) 1.42 (0.64 to 3.14) .97 Estrogen + progestin users Insulin Quartile cut points, µ IU/mL <3.1 3.1 to <4.5 4.5 to <7.8 ≥ 7.8 No. case subjects/No. subcohort members 54/44 50/45 79/46 41/45 Age-adjusted HR (95% CI) 1.00 (referent) 0.93 (0.51 to 1.68) 1.55 (0.87 to 2.75) 0.78 (0.42 to 1.44) .96 Multivariable-adjusted HR ‡ (95% CI) 1.00 (referent) 1.22 (0.45 to 3.29) 2.43 (0.90 to 6.52) 1.15 (0.34 to 3.84) .40 Total IGF-I Quartile cut points, ng/mL <91.1 91.1 to <114.4 114.4 to <138.7 ≥ 138.7 No. case subjects/No. subcohort members 50/46 78/45 43/45 55/45 Age-adjusted HR (95% CI) 1.00 (referent) 1.58 (0.88 to 2.83) 0.91 (0.48 to 1.72) 1.08 (0.58 to 1.99) .70 Multivariable-adjusted HR ‡ (95% CI) 1.00 (referent) 2.39 (0.97 to 5.90) 0.88 (0.37 to 2.14) 1.18 (0.49 to 2.85) .97 Free IGF-I Quartile cut points, ng/mL <0.20 0.20 to <0.36 0.36 to <0.52 ≥ 0.52 No. case subjects/No. subcohort members 58/43 62/42 58/43 36/43 Age-adjusted HR (95% CI) 1.00 (referent) 1.12 (0.62 to 2.04) 1.12 (0.61 to 2.06) 0.62 (0.32 to 1.19) .21 Multivariable-adjusted HR ‡ (95% CI) 1.00 (referent) 1.33 (0.52 to 3.37) 1.60 (0.62 to 4.10) 1.38 (0.43 to 4.42) .99 IGFBP-3 Quartile cut points, ng/mL <3615.4 3615.4 to <4075.7 4075.7 to <4559.2 ≥ 4559.2 No. case subjects/No. subcohort members 66/46 71/45 52/46 38/44 Age-adjusted HR (95% CI) 1.00 (referent) 1.12 (0.63 to 1.96) 0.84 (0.47 to 1.51) 0.56 (0.31 to 1.02) .04 Multivariable-adjusted HR ‡ (95% CI) 1.00 (referent) 1.29 (0.52 to 3.20) 0.47 (0.18 to 1.24) 0.25 (0.08 to 0.80) .10 Glucose Quartile cut points, mg/dL <85 85 to <90 90 to <96 ≥ 96 No. case subjects/No. subcohort members 55/45 67/47 39/43 65/46 Age-adjusted HR (95% CI) 1.00 (referent) 1.16 (0.65 to 2.06) 0.76 (0.41 to 1.40) 1.03 (0.57 to 1.84) .75 Multivariable-adjusted HR ‡ (95% CI) 1.00 (referent) 1.12 (0.48 to 2.62) 0.62 (0.22 to 1.75) 1.16 (0.51 to 2.65) .99 BMI Category cut points, kg/m 2 <18.5 18.5 to <25.0 25.0 to <30.0 ≥ 30 No. case subjects/No. subcohort members 6/6 122/81 64/57 32/33 Age-adjusted HR (95% CI) 0.50 (0.12 to 1.98) 1.00 (referent) 0.76 (0.46 to 1.24) 0.65 (0.35 to 1.18) .26 Multivariable-adjusted HR ‡ (95% CI) 0.43 (0.05 to 3.67) 1.00 (referent) 0.48 (0.23 to 0.99) 0.41 (0.17 to 1.00) .21
* The total numbers of case subjects and subcohort members vary for each serologic variable due to assay failure for some serum specimens. IGF-I = insulin-like growth factor-I; IGFBP-3 = insulin-like growth factor binding protein-3; BMI = body mass index; HT = hormone therapy; HR = hazard ratio; CI = confidence interval; NA = not applicable.
† Statistical tests for trend (two-sided) were calculated using ordinal quantile variables (1 – 4 for quartiles and 1 – 3 for tertiles) entered into the model as a single continuous variable.
‡ Multivariable model adjusted for age, race, alcohol consumption, smoking, family history of breast cancer, parity, age at menopause, age at menarche, age at first child’s birth, use of oral contraceptives, use of nonsteroidal anti-inflammatory drugs, use of estrogen replacement therapy, use of hormone replacement therapy (estrogen and progestin), educational attainment, endogenous estradiol levels (in nonusers of HT) parameterized as described in the text, BMI, and physical activity.
Table 4 (continued).
risk of breast cancer (HR for quartile 2 vs quartile 1 = 1.83, 95% CI = 1.11 to 3.02; HR for quartile 3 vs quartile 1 = 1.82, 95% CI = 1.09 to 3.04), whereas those in the highest quartile of free IGF-I were not (HR for quartile 4 vs quartile 1 = 1.24, 95% CI = 0.73 to 2.10), suggesting a possible curvilinear association between free IGF-I level and the risk of breast cancer ( Table 4 ). However, inclusion of insulin levels in the multivariable model attenuated this association (HR for quartile 2 vs quartile 1 = 1.55, 95% CI = 0.94 to 2.57; HR for quartile 3 vs quartile 1 = 1.50, 95% CI = 0.91 to 2.49) (Table 5). Nevertheless, in a multivariable model that
included BMI and estradiol and insulin levels as well as established breast cancer risk factors, the curvilinear association between free IGF-I level and the risk of breast cancer (assessed by including a quadratic term for free IGF-I in the multivariable model) was nearly statistically signifi cant ( P curvilinearity = .05).
Discussion We observed a strong positive association between the risk of breast cancer and fasting insulin levels in postmenopausal women
by guest on May 18, 2011
jnci.oxfordjournals.orgD
ownloaded from

jnci.oxfordjournals.org JNCI | Articles 57
Table 5 . Multivariable hazard ratios (95% confidence intervals) of incident breast cancer among women not using hormone therapy for baseline levels of insulin, free IGF-I, endogenous estradiol, and BMI *
Factor, model Quantile 1 Quantile 2 Quantile 3 Quantile 4 P trend †
Insulin Quartile cut points, µ IU/mL <3.9 3.9 to <5.6 5.6 to <8.8 ≥ 8.8 No. case subjects/No. subcohort members
77/108 70/106 97/108 134/106
Multivariable ‡ 1.00 (referent) 1.00 (0.60 to 1.67) 1.59 (0.96 to 2.62) 2.65 (1.61 to 4.36) <.001 Multivariable + BMI 1.00 (referent) 1.00 (0.57 to 1.75) 1.39 (0.79 to 2.46) 2.42 (1.35 to 4.31) <.001 Multivariable + estradiol 1.00 (referent) 1.02 (0.60 to 1.73) 1.57 (0.94 to 2.62) 2.56 (1.54 to 4.25) <.001 Multivariable + free IGF-I 1.00 (referent) 1.04 (0.61 to 1.79) 1.62 (0.96 to 2.72) 2.64 (1.58 to 4.43) <.001 Full model § 1.00 (referent) 1.03 (0.56 to 1.89) 1.40 (0.76 to 2.57) 2.40 (1.30 to 4.41) <.001 Free IGF-I Quartile cut points, ng/mL <0.26 0.26 to <0.42 0.42 to <0.63 ≥ 0.63 No. case subjects/No. subcohort members
71/107 114/104 102/107 85/104
Multivariable ‡ 1.00 (referent) 1.74 (1.08 to 2.80) 1.65 (1.01 to 2.68) 1.19 (0.72 to 1.96) .52 Multivariable + BMI 1.00 (referent) 1.72 (1.06 to 2.79) 1.68 (1.02 to 2.76) 1.17 (0.70 to 1.97) .52 Multivariable + estradiol 1.00 (referent) 1.85 (1.13 to 3.01) 1.77 (1.08 to 2.92) 1.24 (0.75 to 2.06) .44 Multivariable + insulin 1.00 (referent) 1.55 (0.94 to 2.57) 1.50 (0.91 to 2.49) 1.10 (0.65 to 1.85) .77 Full model § 1.00 (referent) 1.67 (0.98 to 2.85) 1.72 (1.00 to 2.93) 1.24 (0.72 to 2.14) .47 Estradiol Tertile cut points, pg/mL <8.0 8.0 to <14.0 ≥ 14.0 No. case subjects/No. subcohort members
92/146 155/156 137/134 NA
Multivariable ‡ 1.00 (referent) 1.53 (1.02 to 2.27) 1.85 (1.19 to 2.89) NA .004 Multivariable + BMI 1.00 (referent) 1.44 (0.95 to 2.18) 1.59 (1.00 to 2.55) NA .04 Multivariable + insulin 1.00 (referent) 1.55 (1.02 to 2.37) 1.77 (1.11 to 2.84) NA .02 Multivariable + free IGF-I 1.00 (referent) 1.55 (1.03 to 2.33) 2.03 (1.27 to 3.22) NA .003 Full model § 1.00 (referent) 1.59 (1.02 to 2.49) 1.87 (1.11 to 3.15) NA .03 BMI Category cut points, kg/m 2 <18.5 18.5 to <25.0 25.0 to <30.0 ≥ 30.0 No. case subjects/No. subcohort members
2/7 125/155 126/151 75/65
Multivariable ‡ 0.40 (0.07 to 2.40) 1.00 (referent) 1.20 (0.78 to 1.83) 2.12 (1.26 to 3.58) .003 Multivariable + estradiol 0.46 (0.08 to 2.79) 1.00 (referent) 1.15 (0.74 to 1.77) 1.91 (1.11 to 3.27) .02 Multivariable + insulin 0.80 (0.12 to 5.43) 1.00 (referent) 0.97 (0.60 to 1.57) 1.50 (0.80 to 2.83) .40 Multivariable + free IGF-I 0.52 (0.08 to 3.30) 1.00 (referent) 1.24 (0.80 to 1.94) 2.19 (1.27 to 3.77) .004 Full model § 1.19 (0.14 to 10.29) 1.00 (referent) 0.94 (0.56 to 1.58) 1.36 (0.70 to 2.67) .80
* The total numbers of case subjects and subcohort members vary for each serologic variable due to assay failure in some serum specimens. IGF-I = insulin-like growth factor-I; BMI = body mass index; NA = not applicable.
† Statistical tests for trend (two-sided) were calculated using ordinal quantile variables (1 – 4 for quartiles and 1 – 3 for tertiles) entered into the model as a single continuous variable.
‡ Multivariable model adjusted for age, race, alcohol consumption, smoking, family history of breast cancer, parity, age at menopause, age at menarche, age at first child’s birth, use of oral contraceptives, educational attainment, use of nonsteroidal anti-inflammatory drugs, and physical activity.
§ Multivariable model with adjustment for free IGF-I, insulin, estradiol, and BMI.
who were neither diabetic nor using HT. In these women, breast cancer incidence rates were 2.4-fold greater among those in the highest quartile compared with the lowest quartile of fasting insu-lin level, even after controlling for estradiol levels, BMI, free IGF-I level, and established breast cancer risk factors. Estradiol level was associated with ER-positive and PR-positive breast cancers only, and an initially strong association between BMI and postmeno-pausal breast cancer was greatly attenuated by adjustment for insulin level and, to a lesser degree, for estradiol level. Together, insulin and estradiol levels appeared to largely explain the associa-tion between obesity and postmenopausal breast cancer among the women in this study.
Obesity is a well-established risk factor for postmenopausal breast cancer ( 2 – 7 ). Results of previous studies have indicated that this association may be partly explained by the high levels of circu-
lating estrogen in obese women. For example, two large prospec-tive studies ( 50 , 51 ) demonstrated that the association between BMI and the risk of breast cancer was substantially reduced by control-ling for estrogen levels. In this study, the association between BMI and the risk of breast cancer was attenuated more by controlling for insulin level than by controlling for estradiol level. Laboratory data support a direct role for insulin in the etiology of breast can-cer. For example, the binding of insulin to the insulin receptor activates the mitogen-activated protein kinase (MAPK) and phos-phatidylinositol-3-kinase pathways, which leads to an increase in cell proliferation ( 52 , 53 ). In addition, insulin stimulates cell growth in both normal and neoplastic breast tissue ( 11 , 12 , 27 , 54 , 55 ) and promotes breast tumor growth in animal models ( 13 – 15 , 28 ). Insulin may also play a role in breast carcinogenesis via the extensive cross talk that occurs between the insulin – IGF and the
by guest on May 18, 2011
jnci.oxfordjournals.orgD
ownloaded from

58 Articles | JNCI Vol. 101, Issue 1 | January 7, 2009
estrogen signaling pathways in breast tissue. Insulin and estradiol can act in concert to promote cell cycle progression in breast cancer cells ( 56 ), and insulin activates estrogen receptor alpha – mediated transcription in breast cancer cell lines ( 57 , 58 ), even in the absence of estradiol ( 59 ), whereas estrogen stimulates the insu-lin signaling pathway by enhancing MAPK activation ( 60 ).
A strength of this study was our ability to control for endogenous estradiol levels, which allowed us to evaluate the association between insulin level and postmenopausal breast cancer independent of estradiol level. A previous investigation conducted among European women that measured C-peptide levels and adjusted for levels of estradiol and other sex hormones found that the association between C-peptide levels and the risk of postmenopausal breast cancer was attenuated after controlling for free estradiol level ( 21 ). By contrast, we observed a positive association between fasting insulin levels and the risk of postmenopausal breast cancer that was unaffected by adjustment for endogenous estradiol levels, supporting a mecha-nism that is independent of circulating estradiol. Similarly, the posi-tive association of estradiol levels with breast cancer risk was unaltered by controlling for insulin levels, suggesting that hyperin-sulinemia and high estrogen may represent two distinct mechanisms that underlie the obesity – breast cancer relationship. Although we directly measured fasting insulin levels, unlike the European study, we did not control for free estradiol level, which may be the more bioactive estradiol component in circulation. However, in previous studies ( 50 , 51 ), adjustment for free estradiol level resulted in only a slightly greater attenuation of the obesity – breast cancer association than adjustment for total estradiol level. Moreover, the association between fasting insulin level and the risk of breast cancer observed in this study was much more robust than that between C-peptide level and breast cancer risk reported by the European study.
Our fi nding that there was no association between total IGF-I level and breast cancer risk was largely consistent with that in ear-lier reports ( 31 – 35 ). However, we found a modest positive associa-tion between the level of free IGF-I and the risk of breast cancer among nonusers of HT in our study population. Free IGF-I is purported to be the main bioactive component of circulating IGF-I ( 30 ), and in two previous studies ( 18 , 46 ), the level of free IGF-I was more strongly associated with the risk of postmenopausal breast cancer than the level of total IGF-I. We did not fi nd evidence for a linear association between free IGF-I levels and breast cancer risk; however, we observed a possible curvilinear association between free IGF-I levels and the risk of breast cancer in nonusers of HT. However, we note that this association was attenuated fol-lowing adjustment for insulin levels, suggesting that the strong relation between insulin levels and breast cancer observed in this study may underlie the association between free IGF-I levels and breast cancer risk. Furthermore, given that we had not hypothe-sized a curvilinear association and the paucity of prospective data regarding the relationship between free IGF-I level and breast cancer risk, these data should be interpreted with caution.
We found no association between the risk of incident breast cancer and BMI, the fasting levels of insulin, or free IGF-I among women who used HT. This fi nding is consistent with data from several large prospective cohort studies that found that HT use interacts with the association between obesity and postmenopausal breast cancer ( 4 – 7 ). However, this interaction was not confi rmed
in subsequent clinical trials ( 61 , 62 ). It is possible that an associa-tion between insulin level and the risk of breast cancer may have been obscured by the high estrogen levels in the HT users. However, other physiologic changes that arise as a consequence of HT use may also explain why an association between insulin and breast cancer was not observed among HT users. In particular, orally administered HT exposes the liver to a large bolus of estro-gen, which alters hepatic protein synthesis ( 63 ). Indeed, in this study, the levels of IGF-I and IGFBP-3, both of which are pro-duced in the liver ( 63 , 64 ), were statistically signifi cantly lower among the women who used HT (which in the WHI-OS is almost exclusively orally administered HT) than in those who did not. Insulin levels were also statistically signifi cantly lower among the HT users than among the nonusers of HT in our dataset. The use of HT therefore complicates the interpretation of our data on the associations between insulin and IGF-I levels and breast cancer risk, and greater knowledge of the effects of orally administered HT on hepatic protein synthesis may be needed to better under-stand the associations between these factors and the risk of breast cancer among HT users.
Our study has some important limitations. First, we assessed only baseline serum levels of insulin, glucose, total IGF-I, free IGF-I, IGFBP-3, and estradiol. Measuring these factors over time may have allowed us to classify the study participants more precisely with respect to their circulating levels of these factors. However, plasma levels of insulin, total IGF-I, free IGF-I, IGFBP-3, and estradiol in postmenopausal women have been shown to be stable over at least 3 years ( 65 ), suggesting that any misclassifi cation of study subjects according to levels of these factors is likely to have been limited. Second, we cannot exclude the possibility that some case subjects had subclinical breast cancer at WHI-OS recruitment and that the associations we observed were due in part to reverse causality. However, we limited this study to women who developed breast cancer after at least 12 months of follow-up, thereby mini-mizing the potential bias due to breast cancers that were undiag-nosed at baseline. Although the latency period for the breast cancers in this study cannot be known with certainty, we subsequently con-ducted an exploratory analysis that included only women who developed breast cancer 3 or more years after the baseline blood draw and found that the results were essentially unaltered.
In summary, our data indicate that hyperinsulinemia and high endogenous estradiol levels are independent risk factors for post-menopausal breast cancer and largely explain the association between obesity and the risk of breast cancer in postmenopausal women. Interventions aimed at lowering fasting insulin levels or circulating estrogen levels — either through weight loss or increased physical activity or via pharmacologic approaches — may reduce the risk of breast cancer in postmenopausal women.
References 1. American Cancer Society . Cancer Facts and Figures 2008. Available at
http://www.cancer.org/docroot/STT/stt_0.asp. Accessed October 2008 . 2. van den Brandt PA , Spiegelman D , Yaun SS , et al . Pooled analysis of
prospective cohort studies on height, weight, and breast cancer risk . Am J Epidemiol . 2000 ; 152 ( 6 ): 514 – 527 .
3. Vainio H , Kaaks R , Bianchini F . Weight control and physical activity in cancer prevention: international evaluation of the evidence . Eur J Cancer Prev . 2002 ; 11 ( suppl 2 ): S94 – S100 .
by guest on May 18, 2011
jnci.oxfordjournals.orgD
ownloaded from

jnci.oxfordjournals.org JNCI | Articles 59
4. Ahn J , Schatzkin A , Lacey JV Jr , et al . Adiposity, adult weight change, and postmenopausal breast cancer risk . Arch Intern Med . 2007 ; 167 ( 19 ): 2091 – 2102 .
5. Lahmann PH , Hoffmann K , Allen N , et al . Body size and breast cancer risk: fi ndings from the European Prospective Investigation into Cancer and Nutrition (EPIC) . Int J Cancer . 2004 ; 111 ( 5 ): 762 – 771 .
6. Li CI , Malone KE , Daling JR . Interactions between body mass index and hormone therapy and postmenopausal breast cancer risk (United States) . Cancer Causes Control . 2006 ; 17 ( 5 ): 695 – 703 .
7. Morimoto LM , White E , Chen Z , et al . Obesity, body size, and risk of postmenopausal breast cancer: the Women’s Health Initiative (United States) . Cancer Causes Control . 2002 ; 13 ( 8 ): 741 – 751 .
8. Ogden CL , Carroll MD , Curtin LR , McDowell MA , Tabak CJ , Flegal KM . Prevalence of overweight and obesity in the United States, 1999-2004 . JAMA . 2006 ; 295 ( 13 ): 1549 – 1555 .
9. Judd HL , Shamonki IM , Frumar AM , Lagasse LD . Origin of serum estra-diol in postmenopausal women . Obstet Gynecol . 1982 ; 59 ( 6 ): 680 – 686 .
10. Lazarus R , Sparrow D , Weiss S . Temporal relations between obesity and insulin: longitudinal data from the Normative Aging Study . Am J Epidemiol . 1998 ; 147 ( 2 ): 173 – 179 .
11. Chappell J , Leitner JW , Solomon S , Golovchenko I , Goalstone ML , Draznin B . Effect of insulin on cell cycle progression in MCF-7 breast cancer cells. Direct and potentiating infl uence . J Biol Chem. 2001 ; 276 ( 41 ): 38023 – 38028 .
12. Ish-Shalom D , Christoffersen CT , Vorwerk P , et al . Mitogenic properties of insulin and insulin analogues mediated by the insulin receptor . Diabetologia . 1997 ; 40 ( suppl 2 ): S25 – S31 .
13. Shafi e SM , Grantham FH . Role of hormones in the growth and regression of human breast cancer cells (MCF-7) transplanted into athymic nude mice . J Natl Cancer Inst . 1981 ; 67 ( 1 ): 51 – 56 .
14. Shafi e SM , Hilf R . Insulin receptor levels and magnitude of insulin-induced responses in 7,12-dimethylbenz(a)anthracene-induced mammary tumors in rats . Cancer Res. 1981 ; 41 ( 3 ): 826 – 829 .
15. Heuson JC , Legros N . Infl uence of insulin deprivation on growth of the 7,12-dimethylbenz(a)anthracene-induced mammary carcinoma in rats subjected to alloxan diabetes and food restriction . Cancer Res. 1972 ; 32 ( 2 ): 226 – 232 .
16. Pugeat M , Crave JC , Elmidani M , et al . Pathophysiology of sex hormone binding globulin (SHBG): relation to insulin . J Steroid Biochem Mol Biol. 1991 ; 40 ( 4 – 6 ): 841 – 849 .
17. Poretsky L , Kalin MF . The gonadotropic function of insulin . Endocr Rev. 1987 ; 8 ( 2 ): 132 – 141 .
18. Muti P , Quattrin T , Grant BJ , et al . Fasting glucose is a risk factor for breast cancer: a prospective study . Cancer Epidemiol Biomarkers Prev . 2002 ; 11 ( 11 ): 1361 – 1368 .
19. Mink PJ , Shahar E , Rosamond WD , Alberg AJ , Folsom AR . Serum in -sulin and glucose levels and breast cancer incidence: the atherosclerosis risk in communities study . Am J Epidemiol . 2002 ; 156 ( 4 ): 349 – 352 .
20. Kaaks R , Lundin E , Rinaldi S , et al . Prospective study of IGF-I, IGF-binding proteins, and breast cancer risk, in northern and southern Sweden . Cancer Causes Control . 2002 ; 13 ( 4 ): 307 – 316 .
21. Verheus M , Peeters PH , Rinaldi S , et al . Serum C-peptide levels and breast cancer risk: results from the European Prospective Investigation into Cancer and Nutrition (EPIC) . Int J Cancer . 2006 ; 119 ( 3 ): 659 – 667 .
22. Toniolo P , Bruning PF , Akhmedkhanov A , et al . Serum insulin-like growth factor-I and breast cancer . Int J Cancer . 2000 ; 88 ( 5 ): 828 – 832 .
23. Keinan-Boker L , Bueno De Mesquita HB , Kaaks R , et al . Circulating levels of insulin-like growth factor I, its binding proteins -1,-2, -3, C-peptide and risk of postmenopausal breast cancer . Int J Cancer . 2003 ; 106 ( 1 ): 90 – 95 .
24. Bonser AM , Garcia-Webb P . C-peptide measurement: methods and clini-cal utility . Crit Rev Clin Lab Sci. 1984 ; 19 ( 4 ): 297 – 352 .
25. Chu NF , Spiegelman D , Rifai N , Hotamisligil GS , Rimm EB . Glycemic status and soluble tumor necrosis factor receptor levels in relation to plasma leptin concentrations among normal weight and overweight US men . Int J Obes Relat Metab Disord . 2000 ; 24 ( 9 ): 1085 – 1092 .
26. Zapf J , Schmid C , Froesch ER . Biological and immunological properties of insulin-like growth factors (IGF) I and II . Clin Endocrinol Metab . 1984 ; 13 ( 1 ): 3 – 30 .
27. Lee AV , Lee D . Role of the IGF system in breast cancer proliferation and progression . Endocrinol Breast Cancer . 1999 ; 11 : 187 – 203 .
28. Ng ST , Zhou J , Adesanya OO , Wang J , LeRoith D , Bondy CA . Growth hormone treatment induces mammary gland hyperplasia in aging pri-mates . Nat Med . 1997 ; 3 ( 10 ): 1141 – 1144 .
29. Jones JI , Clemmons DR . Insulin-like growth factors and their binding proteins: biological actions . Endocr Rev. 1995 ; 16 ( 1 ): 3 – 34 .
30. Juul A , Holm K , Kastrup KW , et al . Free insulin-like growth factor I serum levels in 1430 healthy children and adults, and its diagnostic value in patients suspected of growth hormone defi ciency . J Clin Endocrinol Metab . 1997 ; 82 ( 8 ): 2497 – 2502 .
31. Renehan AG , Egger M , Minder C , O’Dwyer ST , Shalet SM , Zwahlen M . IGF-I, IGF binding protein-3 and breast cancer risk: comparison of 3 meta-analyses . Int J Cancer . 2005 ; 115 ( 6 ): 1006 – 1007 ; author reply 1008 .
32. Renehan AG , Zwahlen M , Minder C , O’Dwyer ST , Shalet SM , Egger M . Insulin-like growth factor (IGF)-I, IGF binding protein-3, and cancer risk: systematic review and meta-regression analysis . Lancet . 2004 ; 363 ( 9418 ): 1346 – 1353 .
33. Shi R , Yu H , McLarty J , Glass J . IGF-I and breast cancer: a meta-analysis . Int J Cancer . 2004 ; 111 ( 3 ): 418 – 423 .
34. Sugumar A , Liu YC , Xia Q , Koh YS , Matsuo K . Insulin-like growth factor (IGF)-I and IGF-binding protein 3 and the risk of premenopausal breast cancer: a meta-analysis of literature . Int J Cancer . 2004 ; 111 ( 2 ): 293 – 297 .
35. Fletcher O , Gibson L , Johnson N , et al . Polymorphisms and circulating levels in the insulin-like growth factor system and risk of breast cancer: a systematic review . Cancer Epidemiol Biomarkers Prev . 2005 ; 14 ( 1 ): 2 – 19 .
36. Rinaldi S , Peeters PH , Berrino F , et al . IGF-I, IGFBP-3 and breast cancer risk in women: the European Prospective Investigation into Cancer and Nutrition (EPIC) . Endocr Relat Cancer . 2006 ; 13 ( 2 ): 593 – 605 .
37. Baglietto L , English DR , Hopper JL , Morris HA , Tilley WD , Giles GG . Circulating insulin-like growth factor-I and binding protein-3 and the risk of breast cancer . Cancer Epidemiol Biomarkers Prev . 2007 ; 16 ( 4 ): 763 – 768 .
38. Hamelers IH , Steenbergh PH . Interactions between estrogen and insulin-like growth factor signaling pathways in human breast tumor cells . Endocr Relat Cancer . 2003 ; 10 ( 2 ): 331 – 345 .
39. The Women’s Initiative Study Group Design of the Women’s Health Initiative clinical trial and observational study . Control Clin Trials . 1998 ; 19 ( 1 ): 61 – 109 .
40. Hays J , Hunt JR , Hubbell FA , et al . The Women’s Health Initiative recruit-ment methods and results . Ann Epidemiol . 2003 ; 13 ( 9 suppl ): S18 – S77 .
41. The Women’s Health Initiative Scientifi c Resources Website. Available at http://www.whiscience.org/about/biospecimen.php . Accessed October 2008 .
42. The SEER Program Code Manual . NIH Publication No. 92 – 1999. Cancer Statistics Branch, Surveillance Program, Division of Cancer Prevention and Control, National Cancer Institute, US Department of Health and Human Services, Public Health Service, National Institutes of Health; 1992 .
43. SEER Program: Comparative Staging Guide for Cancer, version 1.1 . Washington, DC : US Department of Health and Human Services, Public Health Service . NIH Publication No. 93 – 3640 .
44. Matthews DR , Hosker JP , Rudenski AS , Naylor BA , Treacher DF , Turner RC . Homeostasis model assessment: insulin resistance and beta-cell function from fasting plasma glucose and insulin concentrations in man . Diabetologia . 1985 ; 28 ( 7 ): 412 – 419 .
45. Balkau B , Charles MA . Comment on the provisional report from the WHO consultation. European Group for the Study of Insulin Resistance (EGIR) . Diabet Med . 1999 ; 16 ( 5 ): 442 – 443 .
46. Li BD , Khosravi MJ , Berkel HJ , et al . Free insulin-like growth factor-I and breast cancer risk . Int J Cancer . 2001 ; 91 ( 5 ): 736 – 739 .
47. Gunter MJ , Hoover DR , Yu H , et al . Insulin, insulin-like growth factor-I, endogenous estradiol, and risk of colorectal cancer in postmenopausal women . Cancer Res. 2008 ; 68 ( 1 ): 329 – 337 .
48. Prentice RL . A case-cohort design for epidemiologic studies and disease prevention trials . Biometrika . 1986 ; 73 : 1 – 11 .
49. World Health Organization Global Database on Body Mass Index. Available at http://www.who.int/bmi/index.jsp?introPage=intro_3.html . Accessed October 2008 .
50. Key TJ , Appleby PN , Reeves GK , et al . Body mass index, serum sex hor-mones, and breast cancer risk in postmenopausal women . J Natl Cancer Inst . 2003 ; 95 ( 16 ): 1218 – 1226 .
by guest on May 18, 2011
jnci.oxfordjournals.orgD
ownloaded from

60 Articles | JNCI Vol. 101, Issue 1 | January 7, 2009
51. Rinaldi S , Key TJ , Peeters PH , et al . Anthropometric measures, endoge-nous sex steroids and breast cancer risk in postmenopausal women: a study within the EPIC cohort . Int J Cancer . 2006 ; 118 ( 11 ): 2832 – 2839 .
52. Antoine PJ , Bertrand F , Auclair M , Magre J , Capeau J , Cherqui G . Insulin induction of protein kinase C alpha expression is independent of insulin receptor Tyr1162/1163 residues and involves mitogen-activated protein kinase kinase 1 and sustained activation of nuclear p44MAPK . Endocrinology . 1998 ; 139 ( 7 ): 3133 – 3142 .
53. White MF , Kahn C.R . Mechanisms of insulin action . In: Moller ED , edi-tor. Insulin resistance . New York, NY : John Wiley and Sons ; 1993 : 9 – 47 .
54. Milazzo G , Giorgino F , Damante G , et al . Insulin receptor expression and function in human breast cancer cell lines . Cancer Res. 1992 ; 52 ( 14 ): 3924 – 3930 .
55. Cullen KJ , Yee D , Sly WS , et al . Insulin-like growth factor receptor expression and function in human breast cancer . Cancer Res. 1990 ; 50 ( 1 ): 48 – 53 .
56. Mawson A , Lai A , Carroll JS , Sergio CM , Mitchell CJ , Sarcevic B . Estrogen and insulin/IGF-1 cooperatively stimulate cell cycle progression in MCF-7 breast cancer cells through differential regulation of c-Myc and cyclin D1 . Mol Cell Endocrinol . 2005 ; 229 ( 1 – 2 ): 161 – 173 .
57. Moschos SJ , Mantzoros CS . The role of the IGF system in cancer: from basic to clinical studies and clinical applications . Oncology . 2002 ; 63 ( 4 ): 317 – 332 .
58. Sachdev D , Yee D . The IGF system and breast cancer . Endocr Relat Cancer . 2001 ; 8 ( 3 ): 197 – 209 .
59. Jackson JG , Zhang X , Yoneda T , Yee D . Regulation of breast cancer cell motility by insulin receptor substrate-2 (IRS-2) in metastatic variants of human breast cancer cell lines . Oncogene . 2001 ; 20 ( 50 ): 7318 – 7325 .
60. Lee AV , Jackson JG , Gooch JL , et al . Enhancement of insulin-like growth factor signaling in human breast cancer: estrogen regulation of insulin receptor substrate-1 expression in vitro and in vivo . Mol Endocrinol . 1999 ; 13 ( 5 ): 787 – 796 .
61. Chlebowski RT , Hendrix SL , Langer RD , et al . Infl uence of estrogen plus progestin on breast cancer and mammography in healthy postmenopausal women: the Women’s Health Initiative Randomized Trial . JAMA . 2003 ; 289 ( 24 ): 3243 – 3253 .
62. Stefanick ML , Anderson GL , Margolis KL , et al . Effects of conjugated equine estrogens on breast cancer and mammography screening in post-menopausal women with hysterectomy . JAMA . 2006 ; 295 ( 14 ): 1647 – 1657 .
63. Weissberger AJ , Ho KK , Lazarus L . Contrasting effects of oral and transdermal routes of estrogen replacement therapy on 24-hour growth hormone (GH) secretion, insulin-like growth factor I, and GH-binding protein in postmenopausal women . J Clin Endocrinol Metab . 1991 ; 72 ( 2 ): 374 – 381 .
64. Campagnoli C , Abba C , Ambroggio S , Peris C . Differential effects of progestins on the circulating IGF-I system . Maturitas . 2003 ; 46 ( suppl 1 ): S39 – S44 .
65. Hankinson SE , Manson JE , Spiegelman D , Willett WC , Longcope C , Speizer FE . Reproducibility of plasma hormone levels in postmenopausal women over a 2-3-year period . Cancer Epidemiol Biomarkers Prev . 1995 ; 4 ( 6 ): 649 – 654 .
Funding This study was funded by the National Cancer Institute grant R01-CA93881-01 (to H.D.S). Dr M. J. Gunter and Dr H. D. Strickler are supported, in part, by the Albert Einstein Cancer Center, New York. The Women’s Health Initiative program is funded by the National Heart, Lung, and Blood Institute; National
Institutes of Health; US Department of Health and Human Services through contracts N01WH22110, 24152, 32100 – 2, 32105 – 6, 32108 – 9, 32111 – 13, 32115, 32118 – 32119, 32122, 42107 – 26, 42129 – 32, and 44221.
Notes The study sponsors had no role in the design of the study; the collection, analy-sis, and interpretation of the data; the writing of the manuscript; or the decision to submit the manuscript for publication.
The authors thank the following key investigators involved in this research — Program Offi ce : Elizabeth Nabel, Jacques Rossouw, Shari Ludlam, Linda
Pottern, Joan McGowan, Leslie Ford, and Nancy Geller (National Heart, Lung, and Blood Institute, Bethesda, MD).
Clinical Coordinating Center : Ross Prentice, Garnet Anderson, Andrea LaCroix, Charles L. Kooperberg, Ruth E. Patterson, Anne McTiernan (Fred Hutchinson Cancer Research Center, Seattle, WA); Sally Shumaker (Wake Forest University School of Medicine, Winston-Salem, NC); Evan Stein (Medical Research Labs, Highland Heights, KY); Steven Cummings (University of California at San Francisco, San Francisco, CA).
Clinical Centers : Sylvia Wassertheil-Smoller (Albert Einstein College of Medicine, Bronx, NY); Jennifer Hays (Baylor College of Medicine, Houston, TX); JoAnn Manson (Brigham and Women’s Hospital, Harvard Medical School, Boston, MA); Annlouise R. Assaf (Brown University, Providence, RI); Lawrence Phillips (Emory University, Atlanta, GA); Shirley Beresford (Fred Hutchinson Cancer Research Center, Seattle, WA); Judith Hsia (George Washington University Medical Center, Washington, DC); Rowan Chlebowski (Los Angeles Biomedical Research Institute at Harbor — UCLA Medical Center, Torrance, CA); Evelyn Whitlock (Kaiser Permanente Center for Health Research, Portland, OR); Bette Caan (Kaiser Permanente Division of Research, Oakland, CA); Jane Morley Kotchen (Medical College of Wisconsin, Milwaukee, WI); Barbara V. Howard (MedStar Research Institute/Howard University, Washington, DC); Linda Van Horn (Northwestern University, Chicago/Evanston, IL); Henry Black (Rush Medical Center, Chicago, IL); Marcia L. Stefanick (Stanford Prevention Research Center, Stanford, CA); Dorothy Lane (State University of New York at Stony Brook, Stony Brook, NY); Rebecca Jackson (The Ohio State University, Columbus, OH); Cora E. Lewis (University of Alabama at Birmingham, Birmingham, AL); Tamsen Bassford (University of Arizona, Tucson/Phoenix, AZ); Jean Wactawski-Wende (University at Buffalo, Buffalo, NY); John Robbins (University of California at Davis, Sacramento, CA); F. Allan Hubbell (University of California at Irvine, CA); Howard Judd (University of California at Los Angeles, Los Angeles, CA); Robert D. Langer (University of California at San Diego, LaJolla/Chula Vista, CA); Margery Gass (University of Cincinnati, Cincinnati, OH); Marian Limacher (University of Florida, Gainesville/Jacksonville, FL); David Curb (University of Hawaii, Honolulu, HI); Robert Wallace (University of Iowa, Iowa City/Davenport, IA); Judith Ockene (University of Massachusetts/Fallon Clinic, Worcester, MA); Norman Lasser (University of Medicine and Dentistry of New Jersey, Newark, NJ); Mary Jo O’Sullivan (University of Miami, Miami, FL); Karen Margolis (University of Minnesota, Minneapolis, MN); Robert Brunner (University of Nevada, Reno, NV); Gerardo Heiss (University of North Carolina, Chapel Hill, NC); Lewis Kuller (University of Pittsburgh, Pittsburgh, PA); Karen C. Johnson (University of Tennessee, Memphis, TN); Robert Brzyski (University of Texas Health Science Center, San Antonio, TX); Gloria E. Sarto (University of Wisconsin, Madison, WI); Mara Vitolins (Wake Forest University School of Medicine, Winston-Salem, NC); Susan Hendrix (Wayne State University School of Medicine/Hutzel Hospital, Detroit, MI).
Manuscript received May 6 , 2008 ; revised September 25 , 2008 ; accepted October 14 , 2008 .
by guest on May 18, 2011
jnci.oxfordjournals.orgD
ownloaded from