Insights on How the Activity of an Endoglucanase Is Affected by Physical Properties of Insoluble...
9
Insights on How the Activity of an Endoglucanase Is Affected by Physical Properties of Insoluble Celluloses Juliano Bragatto, Fernando Segato, Junio Cota, Danilo B. Mello, Marcelo M. Oliveira, Marcos S. Buckeridge, Fabio M. Squina, and Carlos Driemeier* Laborató rio Nacional de Ciê ncia e Tecnologia do Bioetanol, CTBE, Caixa Postal 6170, 13083-970 Campinas, Sã o Paulo, Brazil * S Supporting Information ABSTRACT: Cellulose physical properties like crystallinity, porosity, and particle size are known to influence cellulase activity, but knowledge is still insufficient for activity prediction from such measurable substrate characteristics. With the aim of illuminating enzyme− substrate relationships, this work evaluates a purified hyperthermophilic endo-1,4-beta- glucanase (from Pyrococcus f uriosus) acting on 13 celluloses characterized for crystallinity and crystal width (by X-ray diffraction), wet porosity (by thermoporometry), and particle size (by light scattering). Activities are analyzed by the Michaelis−Menten kinetic equation, which is justified by low enzyme−substrate affinity. Michaelis−Menten coefficients K m and k cat are reinterpreted in the context of heterogeneous cellulose hydrolysis. For a set of as- received and milled microcrystalline celluloses, activity is successfully described as a function of accessible substrate concentration, with accessibility proportional to K m −1 . Accessibility contribution from external particle areas, pore areas, and crystalline packing are discriminated to have comparable magnitudes, implying that activity prediction demands all these substrate properties to be considered. Results additionally suggest that looser crystalline packing increases the lengths of released cello-oligomers as well as the maximum endoglucanase specific activity (k cat ). 1. INTRODUCTION Cellulosic biomass will substitute a significant share of fossil resources currently used for materials, chemicals, and fuels. Enzymatic saccharification is one of the most studied strategies to convert the recalcitrant and insoluble cellulosic feedstocks into simple sugars that are reactive soluble intermediates. 1,2 A major use for glucose obtained from cellulose hydrolysis is its fermentation to ethanol, which is already a widespread transportation fuel. 3 Three different types of cellulases are involved in cellulose hydrolysis: endoglucanases (EC 3.2.1.4), cellobiohydrolases (EC 3.2.1.91, EC 3.2.1.176), and β-glucosidases (EC 3.2.1.21). Current paradigm states that endoglucanases randomly hydro- lyzes β-1,4 bonds within cellulose amorphous regions. At the chain ends created by endoglucanases, cellobiohydrolases can start the processive deconstruction of crystalline cellulose, releasing soluble cellobiose that β-glucosidases hydrolyze to glucose. 4−6 As reviewed extensively by many authors, 5−9 enzymatic hydrolysis of cellulosic substrates is complex. There are synergies between the different types of enzymes. Reactions are inhibited by accumulation of hydrolysis products. Realistic cellulosic resources have, in addition to cellulose, hemicellulose and lignin; these other components compete for enzyme adsorption, hinder access to cellulose, and ultimately require other enzymes such as xylanases and ligninases. Finally, cellulosic substrates are insoluble in water, implying heteroge- neous reactions that depend on substrates’ tridimensional organization. The complexity from substrate structure is partly summar- ized in the concept of accessibility. 10,11 This concept highlights that only a fraction of the substrate mass is actually reachable by cellulases, whose movements are restricted by their sizes of about 5 nm. Measurable substrate properties like surface areas and porosity 12−14 have been proposed to modulate accessibility and, in this way, affect hydrolysis rate. There is also the issue of cellulose crystallinity. 7,15,16 Understanding its effect on hydrolysis rates faces two fundamental challenges. First, cellulose crystallinity measure- ments are somewhat ambiguous, 16 and unfortunately, careless crystallinity measurements are common. For instance, X-ray diffraction (XRD) factors significant for cellulose crystallinity measurements 17 are often neglected. Second, there are cellulases specialized in crystalline as well as in noncrystalline cellulose. 5 Hence, relationships between substrate crystallinity and hydrolysis rate are a function of the cellulase system. Against this background of complexity, this article inves- tigates enzymatic hydrolysis in rather simple systems with the aim of illuminating mechanisms in complex realistic systems. Hydrolysis was performed with a single purified cellulase, the hyperthermophilic endo-1,4-beta-glucanase from Pyrococcus f uriosus (EglA). 18,19 EglA activities were compared on 13 insoluble cellulosic substrates with extensive characterization of physical properties (crystallinity, crystal width, wet porosity, and particle size). Activities were analyzed by Michaelis− Received: March 6, 2012 Revised: May 2, 2012 Published: May 11, 2012 Article pubs.acs.org/JPCB © 2012 American Chemical Society 6128 dx.doi.org/10.1021/jp3021744 | J. Phys. Chem. B 2012, 116, 6128−6136
Transcript of Insights on How the Activity of an Endoglucanase Is Affected by Physical Properties of Insoluble...
Insights on How the Activity of an Endoglucanase Is Affected byPhysical Properties of Insoluble CellulosesJuliano Bragatto, Fernando Segato, Junio Cota, Danilo B. Mello, Marcelo M. Oliveira,Marcos S. Buckeridge, Fabio M. Squina, and Carlos Driemeier*
Laboratorio Nacional de Ciencia e Tecnologia do Bioetanol, CTBE, Caixa Postal 6170, 13083-970 Campinas, Sao Paulo, Brazil
*S Supporting Information
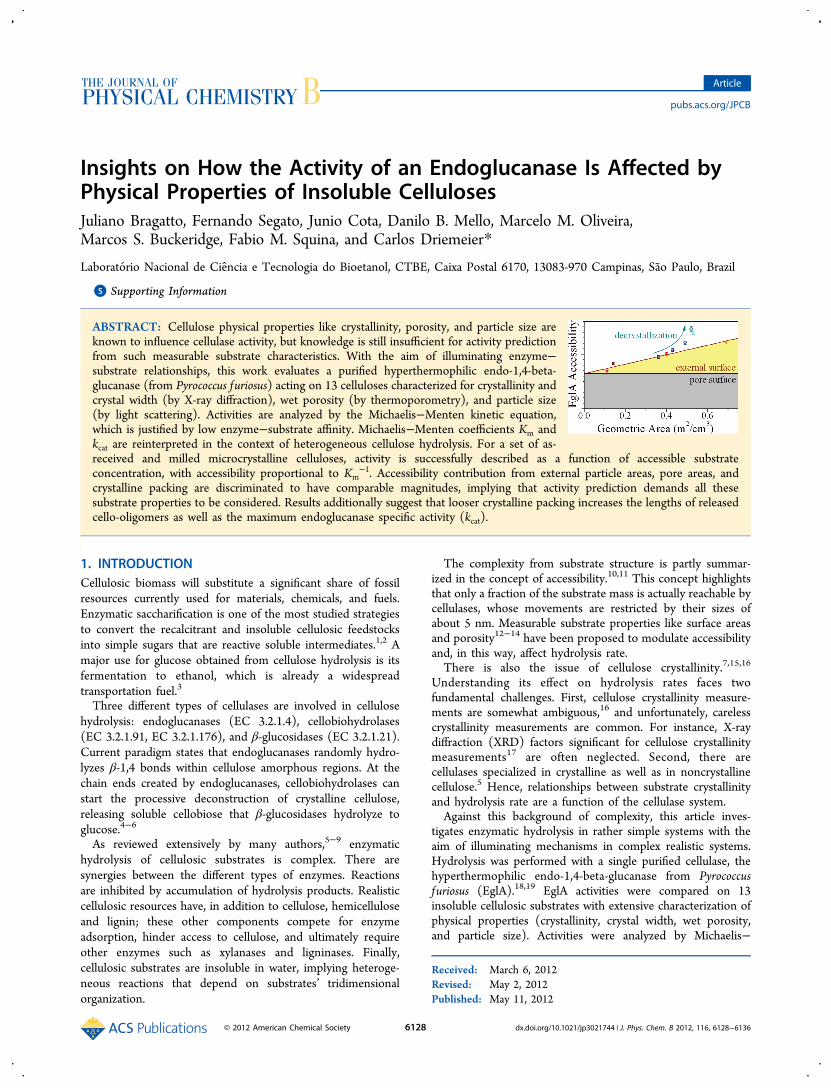
ABSTRACT: Cellulose physical properties like crystallinity, porosity, and particle size areknown to influence cellulase activity, but knowledge is still insufficient for activity predictionfrom such measurable substrate characteristics. With the aim of illuminating enzyme−substrate relationships, this work evaluates a purified hyperthermophilic endo-1,4-beta-glucanase (from Pyrococcus furiosus) acting on 13 celluloses characterized for crystallinity andcrystal width (by X-ray diffraction), wet porosity (by thermoporometry), and particle size(by light scattering). Activities are analyzed by the Michaelis−Menten kinetic equation,which is justified by low enzyme−substrate affinity. Michaelis−Menten coefficients Km andkcat are reinterpreted in the context of heterogeneous cellulose hydrolysis. For a set of as-received and milled microcrystalline celluloses, activity is successfully described as a function of accessible substrateconcentration, with accessibility proportional to Km
−1. Accessibility contribution from external particle areas, pore areas, andcrystalline packing are discriminated to have comparable magnitudes, implying that activity prediction demands all thesesubstrate properties to be considered. Results additionally suggest that looser crystalline packing increases the lengths of releasedcello-oligomers as well as the maximum endoglucanase specific activity (kcat).
1. INTRODUCTIONCellulosic biomass will substitute a significant share of fossilresources currently used for materials, chemicals, and fuels.Enzymatic saccharification is one of the most studied strategiesto convert the recalcitrant and insoluble cellulosic feedstocksinto simple sugars that are reactive soluble intermediates.1,2 Amajor use for glucose obtained from cellulose hydrolysis is itsfermentation to ethanol, which is already a widespreadtransportation fuel.3
Three different types of cellulases are involved in cellulosehydrolysis: endoglucanases (EC 3.2.1.4), cellobiohydrolases(EC 3.2.1.91, EC 3.2.1.176), and β-glucosidases (EC 3.2.1.21).Current paradigm states that endoglucanases randomly hydro-lyzes β-1,4 bonds within cellulose amorphous regions. At thechain ends created by endoglucanases, cellobiohydrolases canstart the processive deconstruction of crystalline cellulose,releasing soluble cellobiose that β-glucosidases hydrolyze toglucose.4−6
As reviewed extensively by many authors,5−9 enzymatichydrolysis of cellulosic substrates is complex. There aresynergies between the different types of enzymes. Reactionsare inhibited by accumulation of hydrolysis products. Realisticcellulosic resources have, in addition to cellulose, hemicelluloseand lignin; these other components compete for enzymeadsorption, hinder access to cellulose, and ultimately requireother enzymes such as xylanases and ligninases. Finally,cellulosic substrates are insoluble in water, implying heteroge-neous reactions that depend on substrates’ tridimensionalorganization.
The complexity from substrate structure is partly summar-ized in the concept of accessibility.10,11 This concept highlightsthat only a fraction of the substrate mass is actually reachable bycellulases, whose movements are restricted by their sizes ofabout 5 nm. Measurable substrate properties like surface areasand porosity12−14 have been proposed to modulate accessibilityand, in this way, affect hydrolysis rate.There is also the issue of cellulose crystallinity.7,15,16
Understanding its effect on hydrolysis rates faces twofundamental challenges. First, cellulose crystallinity measure-ments are somewhat ambiguous,16 and unfortunately, carelesscrystallinity measurements are common. For instance, X-raydiffraction (XRD) factors significant for cellulose crystallinitymeasurements17 are often neglected. Second, there arecellulases specialized in crystalline as well as in noncrystallinecellulose.5 Hence, relationships between substrate crystallinityand hydrolysis rate are a function of the cellulase system.Against this background of complexity, this article inves-
tigates enzymatic hydrolysis in rather simple systems with theaim of illuminating mechanisms in complex realistic systems.Hydrolysis was performed with a single purified cellulase, thehyperthermophilic endo-1,4-beta-glucanase from Pyrococcusfuriosus (EglA).18,19 EglA activities were compared on 13insoluble cellulosic substrates with extensive characterization ofphysical properties (crystallinity, crystal width, wet porosity,and particle size). Activities were analyzed by Michaelis−
Received: March 6, 2012Revised: May 2, 2012Published: May 11, 2012
Article
pubs.acs.org/JPCB
© 2012 American Chemical Society 6128 dx.doi.org/10.1021/jp3021744 | J. Phys. Chem. B 2012, 116, 6128−6136
Menten kinetic equation, whose parameters Km and kcat werereinterpreted in the context of heterogeneous cellulosehydrolysis. For a set of as-received and milled microcrystallinecelluloses, activity contributions from external particle areas,pore areas, and decrystallization could be discriminated to havesimilar magnitudes, implying that activity prediction demandsall these substrate properties to be considered.
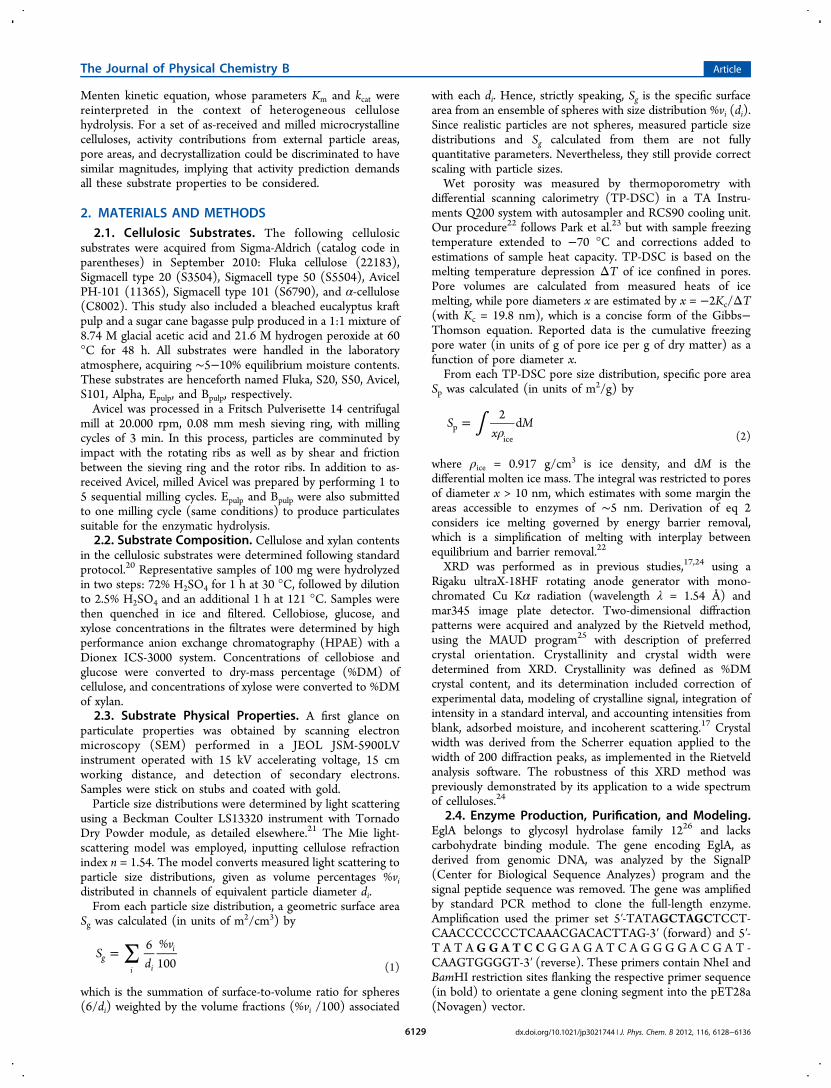
2. MATERIALS AND METHODS2.1. Cellulosic Substrates. The following cellulosic
substrates were acquired from Sigma-Aldrich (catalog code inparentheses) in September 2010: Fluka cellulose (22183),Sigmacell type 20 (S3504), Sigmacell type 50 (S5504), AvicelPH-101 (11365), Sigmacell type 101 (S6790), and α-cellulose(C8002). This study also included a bleached eucalyptus kraftpulp and a sugar cane bagasse pulp produced in a 1:1 mixture of8.74 M glacial acetic acid and 21.6 M hydrogen peroxide at 60°C for 48 h. All substrates were handled in the laboratoryatmosphere, acquiring ∼5−10% equilibrium moisture contents.These substrates are henceforth named Fluka, S20, S50, Avicel,S101, Alpha, Epulp, and Bpulp, respectively.Avicel was processed in a Fritsch Pulverisette 14 centrifugal
mill at 20.000 rpm, 0.08 mm mesh sieving ring, with millingcycles of 3 min. In this process, particles are comminuted byimpact with the rotating ribs as well as by shear and frictionbetween the sieving ring and the rotor ribs. In addition to as-received Avicel, milled Avicel was prepared by performing 1 to5 sequential milling cycles. Epulp and Bpulp were also submittedto one milling cycle (same conditions) to produce particulatessuitable for the enzymatic hydrolysis.2.2. Substrate Composition. Cellulose and xylan contents
in the cellulosic substrates were determined following standardprotocol.20 Representative samples of 100 mg were hydrolyzedin two steps: 72% H2SO4 for 1 h at 30 °C, followed by dilutionto 2.5% H2SO4 and an additional 1 h at 121 °C. Samples werethen quenched in ice and filtered. Cellobiose, glucose, andxylose concentrations in the filtrates were determined by highperformance anion exchange chromatography (HPAE) with aDionex ICS-3000 system. Concentrations of cellobiose andglucose were converted to dry-mass percentage (%DM) ofcellulose, and concentrations of xylose were converted to %DMof xylan.2.3. Substrate Physical Properties. A first glance on
particulate properties was obtained by scanning electronmicroscopy (SEM) performed in a JEOL JSM-5900LVinstrument operated with 15 kV accelerating voltage, 15 cmworking distance, and detection of secondary electrons.Samples were stick on stubs and coated with gold.Particle size distributions were determined by light scattering
using a Beckman Coulter LS13320 instrument with TornadoDry Powder module, as detailed elsewhere.21 The Mie light-scattering model was employed, inputting cellulose refractionindex n = 1.54. The model converts measured light scattering toparticle size distributions, given as volume percentages %vidistributed in channels of equivalent particle diameter di.From each particle size distribution, a geometric surface area
Sg was calculated (in units of m2/cm3) by
∑=Sd
v6 %100g
i i
i
(1)
which is the summation of surface-to-volume ratio for spheres(6/di) weighted by the volume fractions (%vi /100) associated
with each di. Hence, strictly speaking, Sg is the specific surfacearea from an ensemble of spheres with size distribution %vi (di).Since realistic particles are not spheres, measured particle sizedistributions and Sg calculated from them are not fullyquantitative parameters. Nevertheless, they still provide correctscaling with particle sizes.Wet porosity was measured by thermoporometry with
differential scanning calorimetry (TP-DSC) in a TA Instru-ments Q200 system with autosampler and RCS90 cooling unit.Our procedure22 follows Park et al.23 but with sample freezingtemperature extended to −70 °C and corrections added toestimations of sample heat capacity. TP-DSC is based on themelting temperature depression ΔT of ice confined in pores.Pore volumes are calculated from measured heats of icemelting, while pore diameters x are estimated by x = −2Kc/ΔT(with Kc = 19.8 nm), which is a concise form of the Gibbs−Thomson equation. Reported data is the cumulative freezingpore water (in units of g of pore ice per g of dry matter) as afunction of pore diameter x.From each TP-DSC pore size distribution, specific pore area
Sp was calculated (in units of m2/g) by
∫ ρ=S
xM
2dp
ice (2)
where ρice = 0.917 g/cm3 is ice density, and dM is thedifferential molten ice mass. The integral was restricted to poresof diameter x > 10 nm, which estimates with some margin theareas accessible to enzymes of ∼5 nm. Derivation of eq 2considers ice melting governed by energy barrier removal,which is a simplification of melting with interplay betweenequilibrium and barrier removal.22
XRD was performed as in previous studies,17,24 using aRigaku ultraX-18HF rotating anode generator with mono-chromated Cu Kα radiation (wavelength λ = 1.54 Å) andmar345 image plate detector. Two-dimensional diffractionpatterns were acquired and analyzed by the Rietveld method,using the MAUD program25 with description of preferredcrystal orientation. Crystallinity and crystal width weredetermined from XRD. Crystallinity was defined as %DMcrystal content, and its determination included correction ofexperimental data, modeling of crystalline signal, integration ofintensity in a standard interval, and accounting intensities fromblank, adsorbed moisture, and incoherent scattering.17 Crystalwidth was derived from the Scherrer equation applied to thewidth of 200 diffraction peaks, as implemented in the Rietveldanalysis software. The robustness of this XRD method waspreviously demonstrated by its application to a wide spectrumof celluloses.24
2.4. Enzyme Production, Purification, and Modeling.EglA belongs to glycosyl hydrolase family 1226 and lackscarbohydrate binding module. The gene encoding EglA, asderived from genomic DNA, was analyzed by the SignalP(Center for Biological Sequence Analyzes) program and thesignal peptide sequence was removed. The gene was amplifiedby standard PCR method to clone the full-length enzyme.Amplification used the primer set 5′-TATAGCTAGCTCCT-CAACCCCCCCTCAAACGACACTTAG-3′ (forward) and 5′-T A T A G G A T C C G G A G A T C A G G G G A C G A T -CAAGTGGGGT-3′ (reverse). These primers contain NheI andBamHI restriction sites flanking the respective primer sequence(in bold) to orientate a gene cloning segment into the pET28a(Novagen) vector.
The Journal of Physical Chemistry B Article
dx.doi.org/10.1021/jp3021744 | J. Phys. Chem. B 2012, 116, 6128−61366129
The resulting enzyme, which has a 6× HisTag tail, waspurified by Ni2+-chelating affinity followed by size-exclusionchromatography.27 Concentration of the purified enzyme wasdetermined by the Bradford method.28 Enzyme purity wasverified by sodium dodecyl sulfate-polyacrylamide gel electro-phoresis.EglA protein sequence was modeled on Swiss-prot29 against
the endo-1,4-beta-glucanase from Thermotoga maritima proteinstructure30 (also belonging to glycosyl hydrolase family 12),showing 77% similarity on structures. On the basis of thismodeling, EglA (34 kDa) has a size of 6.5 × 5.5 × 6.3 nm3 andactive site inside a cleft.2.5. Enzymatic Hydrolysis. Enzymatic hydrolysis was
performed in 2 mL sealed microtubes shaken at 1000 rpm in anEppendorf 21516-172 Thermomixer. This mixing conditionssuspended cellulose particulates in a solution prepared with 1mL of 50 mmol/L citrate/phosphate buffer.31 Target solidmasses were 10, 30, 50, or 100 mg. Actual solid masses weredetermined gravimetrically, correcting for moisture contents inthe solids. Hydrolysis conditions were 0.023 mg of EglA, 15 h,85 °C, and pH 7.5. This temperature and pH was optimal forhydrolysis of carboxymethyl cellulose, as determined by testingthe range 70−90 °C × pH 4.0−9.0. All hydrolyses reactionswere done in triplicates.Reducing sugar concentration in supernatants from enzy-
matic hydrolysis was determined by dinitrosalicylic acid assay(DNS),32 measuring absorbance at 540 nm (in a Tecan InfiniteM200 instrument) and referencing to calibration curves fromglucose solutions. To calculate specific enzymatic activities (inunits of μmol h−1 mg−1), reducing sugar concentration (in unitsof mol/L) was multiplied by solution volume (1 mL) anddivided by hydrolysis time (15 h) and enzyme loading (0.023mg). To convert activity to hydrolyzed mass, one notes that,with the aforementioned conditions, 1 mg of celluloseconverted to glucose corresponds to an activity of 17.9 μmolh−1 mg−1. HPAE was also employed to discriminate hydrolysateconcentrations of glucose, cellobiose, xylose, arabinose, andgalactose, but this HPAE analysis was limited to supernatantsfrom hydrolysis with ∼10 mg of solids.2.6. Data Analysis. Measured specific enzymatic activity Y
as a function of substrate concentration [S] was analyzed withthe equation
=+
Yk S
K S[ ]
[ ]cat
m (3)
which is the Michaelis−Menten kinetics equation,33 with fittingcoefficients Km and kcat. Fitting was done by precision-weightedleast-squares, using the linearized coordinates [S]/Y × [S].Substrate sets were fitted with a Km for each substrate and asingle kcat for the whole set. With these fitting conditions, a setof Y × [S] curves collapse into a single curve with Km
−1 [S] inthe abscissa.All reported uncertainties are 1σ precisions. For enzymatic
activities analyzed by eq 3, precisions were calculated as thestandard deviation of the mean (from triplicate measurements).Nevertheless, a lower limit of 2% relative precision was imposedto avoid fitting bias from measurements presenting uncommonrepeatability within the triplicates.
3. RESULTS AND DISCUSSIONS3.1. Substrate Properties. The cellulosic substrates of the
present study were grouped according to shared characteristics.
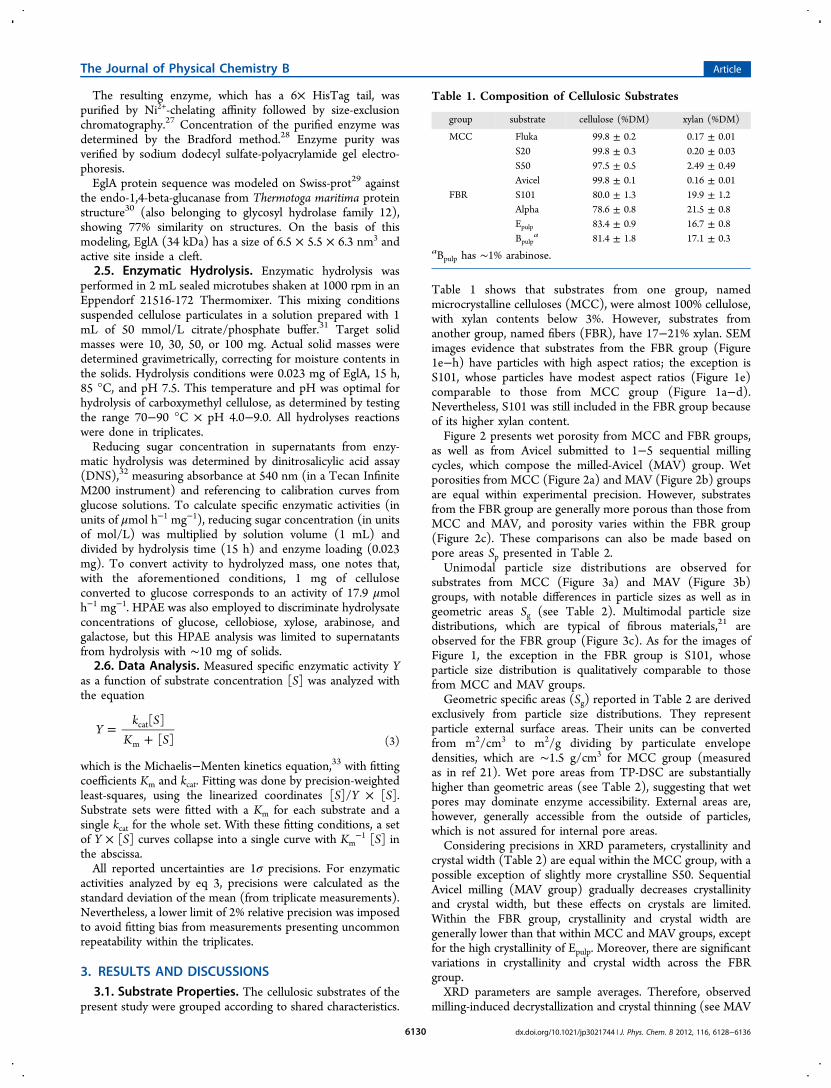
Table 1 shows that substrates from one group, namedmicrocrystalline celluloses (MCC), were almost 100% cellulose,with xylan contents below 3%. However, substrates fromanother group, named fibers (FBR), have 17−21% xylan. SEMimages evidence that substrates from the FBR group (Figure1e−h) have particles with high aspect ratios; the exception isS101, whose particles have modest aspect ratios (Figure 1e)comparable to those from MCC group (Figure 1a−d).Nevertheless, S101 was still included in the FBR group becauseof its higher xylan content.Figure 2 presents wet porosity from MCC and FBR groups,
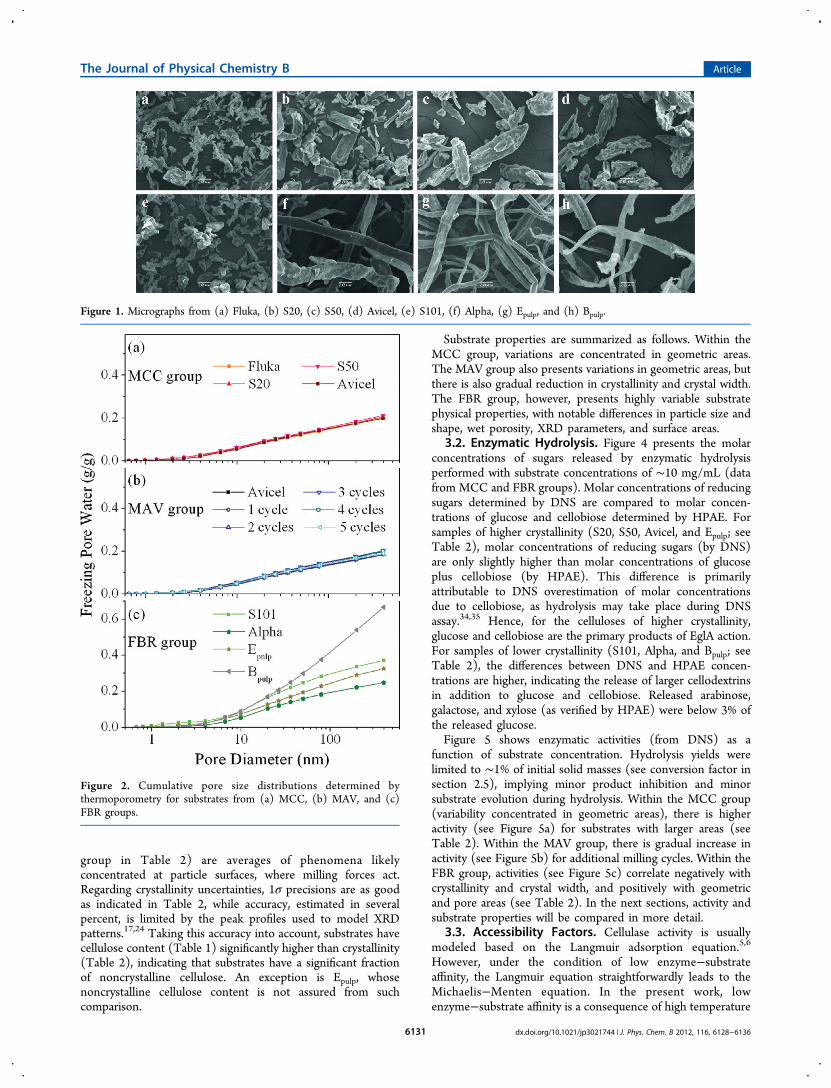
as well as from Avicel submitted to 1−5 sequential millingcycles, which compose the milled-Avicel (MAV) group. Wetporosities from MCC (Figure 2a) and MAV (Figure 2b) groupsare equal within experimental precision. However, substratesfrom the FBR group are generally more porous than those fromMCC and MAV, and porosity varies within the FBR group(Figure 2c). These comparisons can also be made based onpore areas Sp presented in Table 2.Unimodal particle size distributions are observed for
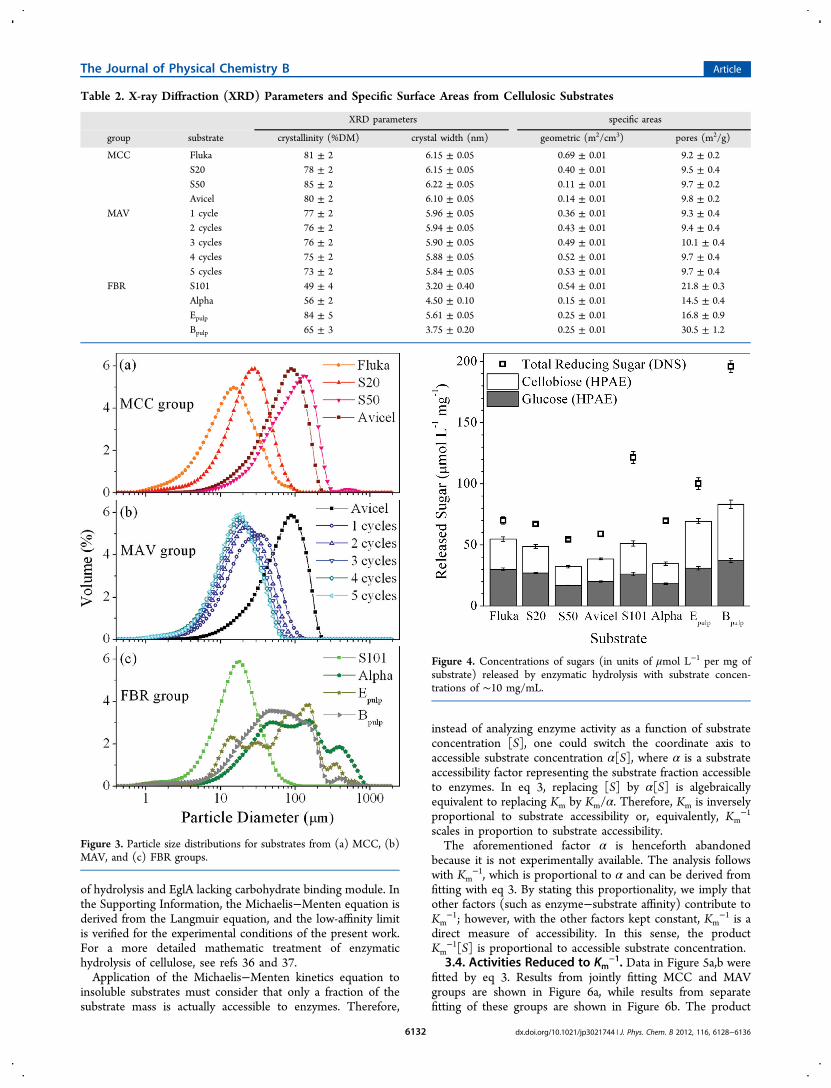
substrates from MCC (Figure 3a) and MAV (Figure 3b)groups, with notable differences in particle sizes as well as ingeometric areas Sg (see Table 2). Multimodal particle sizedistributions, which are typical of fibrous materials,21 areobserved for the FBR group (Figure 3c). As for the images ofFigure 1, the exception in the FBR group is S101, whoseparticle size distribution is qualitatively comparable to thosefrom MCC and MAV groups.Geometric specific areas (Sg) reported in Table 2 are derived
exclusively from particle size distributions. They representparticle external surface areas. Their units can be convertedfrom m2/cm3 to m2/g dividing by particulate envelopedensities, which are ∼1.5 g/cm3 for MCC group (measuredas in ref 21). Wet pore areas from TP-DSC are substantiallyhigher than geometric areas (see Table 2), suggesting that wetpores may dominate enzyme accessibility. External areas are,however, generally accessible from the outside of particles,which is not assured for internal pore areas.Considering precisions in XRD parameters, crystallinity and
crystal width (Table 2) are equal within the MCC group, with apossible exception of slightly more crystalline S50. SequentialAvicel milling (MAV group) gradually decreases crystallinityand crystal width, but these effects on crystals are limited.Within the FBR group, crystallinity and crystal width aregenerally lower than that within MCC and MAV groups, exceptfor the high crystallinity of Epulp. Moreover, there are significantvariations in crystallinity and crystal width across the FBRgroup.XRD parameters are sample averages. Therefore, observed
milling-induced decrystallization and crystal thinning (see MAV
Table 1. Composition of Cellulosic Substrates
group substrate cellulose (%DM) xylan (%DM)
MCC Fluka 99.8 ± 0.2 0.17 ± 0.01S20 99.8 ± 0.3 0.20 ± 0.03S50 97.5 ± 0.5 2.49 ± 0.49Avicel 99.8 ± 0.1 0.16 ± 0.01
FBR S101 80.0 ± 1.3 19.9 ± 1.2Alpha 78.6 ± 0.8 21.5 ± 0.8Epulp 83.4 ± 0.9 16.7 ± 0.8Bpulp
a 81.4 ± 1.8 17.1 ± 0.3aBpulp has ∼1% arabinose.
The Journal of Physical Chemistry B Article
dx.doi.org/10.1021/jp3021744 | J. Phys. Chem. B 2012, 116, 6128−61366130
group in Table 2) are averages of phenomena likelyconcentrated at particle surfaces, where milling forces act.Regarding crystallinity uncertainties, 1σ precisions are as goodas indicated in Table 2, while accuracy, estimated in severalpercent, is limited by the peak profiles used to model XRDpatterns.17,24 Taking this accuracy into account, substrates havecellulose content (Table 1) significantly higher than crystallinity(Table 2), indicating that substrates have a significant fractionof noncrystalline cellulose. An exception is Epulp, whosenoncrystalline cellulose content is not assured from suchcomparison.
Substrate properties are summarized as follows. Within theMCC group, variations are concentrated in geometric areas.The MAV group also presents variations in geometric areas, butthere is also gradual reduction in crystallinity and crystal width.The FBR group, however, presents highly variable substratephysical properties, with notable differences in particle size andshape, wet porosity, XRD parameters, and surface areas.
3.2. Enzymatic Hydrolysis. Figure 4 presents the molarconcentrations of sugars released by enzymatic hydrolysisperformed with substrate concentrations of ∼10 mg/mL (datafrom MCC and FBR groups). Molar concentrations of reducingsugars determined by DNS are compared to molar concen-trations of glucose and cellobiose determined by HPAE. Forsamples of higher crystallinity (S20, S50, Avicel, and Epulp; seeTable 2), molar concentrations of reducing sugars (by DNS)are only slightly higher than molar concentrations of glucoseplus cellobiose (by HPAE). This difference is primarilyattributable to DNS overestimation of molar concentrationsdue to cellobiose, as hydrolysis may take place during DNSassay.34,35 Hence, for the celluloses of higher crystallinity,glucose and cellobiose are the primary products of EglA action.For samples of lower crystallinity (S101, Alpha, and Bpulp; seeTable 2), the differences between DNS and HPAE concen-trations are higher, indicating the release of larger cellodextrinsin addition to glucose and cellobiose. Released arabinose,galactose, and xylose (as verified by HPAE) were below 3% ofthe released glucose.Figure 5 shows enzymatic activities (from DNS) as a
function of substrate concentration. Hydrolysis yields werelimited to ∼1% of initial solid masses (see conversion factor insection 2.5), implying minor product inhibition and minorsubstrate evolution during hydrolysis. Within the MCC group(variability concentrated in geometric areas), there is higheractivity (see Figure 5a) for substrates with larger areas (seeTable 2). Within the MAV group, there is gradual increase inactivity (see Figure 5b) for additional milling cycles. Within theFBR group, activities (see Figure 5c) correlate negatively withcrystallinity and crystal width, and positively with geometricand pore areas (see Table 2). In the next sections, activity andsubstrate properties will be compared in more detail.
3.3. Accessibility Factors. Cellulase activity is usuallymodeled based on the Langmuir adsorption equation.5,6
However, under the condition of low enzyme−substrateaffinity, the Langmuir equation straightforwardly leads to theMichaelis−Menten equation. In the present work, lowenzyme−substrate affinity is a consequence of high temperature
Figure 1. Micrographs from (a) Fluka, (b) S20, (c) S50, (d) Avicel, (e) S101, (f) Alpha, (g) Epulp, and (h) Bpulp.
Figure 2. Cumulative pore size distributions determined bythermoporometry for substrates from (a) MCC, (b) MAV, and (c)FBR groups.
The Journal of Physical Chemistry B Article
dx.doi.org/10.1021/jp3021744 | J. Phys. Chem. B 2012, 116, 6128−61366131
of hydrolysis and EglA lacking carbohydrate binding module. Inthe Supporting Information, the Michaelis−Menten equation isderived from the Langmuir equation, and the low-affinity limitis verified for the experimental conditions of the present work.For a more detailed mathematic treatment of enzymatichydrolysis of cellulose, see refs 36 and 37.Application of the Michaelis−Menten kinetics equation to
insoluble substrates must consider that only a fraction of thesubstrate mass is actually accessible to enzymes. Therefore,
instead of analyzing enzyme activity as a function of substrateconcentration [S], one could switch the coordinate axis toaccessible substrate concentration α[S], where α is a substrateaccessibility factor representing the substrate fraction accessibleto enzymes. In eq 3, replacing [S] by α[S] is algebraicallyequivalent to replacing Km by Km/α. Therefore, Km is inverselyproportional to substrate accessibility or, equivalently, Km
−1
scales in proportion to substrate accessibility.The aforementioned factor α is henceforth abandoned
because it is not experimentally available. The analysis followswith Km
−1, which is proportional to α and can be derived fromfitting with eq 3. By stating this proportionality, we imply thatother factors (such as enzyme−substrate affinity) contribute toKm
−1; however, with the other factors kept constant, Km−1 is a
direct measure of accessibility. In this sense, the productKm
−1[S] is proportional to accessible substrate concentration.3.4. Activities Reduced to Km
−1. Data in Figure 5a,b werefitted by eq 3. Results from jointly fitting MCC and MAVgroups are shown in Figure 6a, while results from separatefitting of these groups are shown in Figure 6b. The product
Table 2. X-ray Diffraction (XRD) Parameters and Specific Surface Areas from Cellulosic Substrates
XRD parameters specific areas
group substrate crystallinity (%DM) crystal width (nm) geometric (m2/cm3) pores (m2/g)
MCC Fluka 81 ± 2 6.15 ± 0.05 0.69 ± 0.01 9.2 ± 0.2S20 78 ± 2 6.15 ± 0.05 0.40 ± 0.01 9.5 ± 0.4S50 85 ± 2 6.22 ± 0.05 0.11 ± 0.01 9.7 ± 0.2Avicel 80 ± 2 6.10 ± 0.05 0.14 ± 0.01 9.8 ± 0.2
MAV 1 cycle 77 ± 2 5.96 ± 0.05 0.36 ± 0.01 9.3 ± 0.42 cycles 76 ± 2 5.94 ± 0.05 0.43 ± 0.01 9.4 ± 0.43 cycles 76 ± 2 5.90 ± 0.05 0.49 ± 0.01 10.1 ± 0.44 cycles 75 ± 2 5.88 ± 0.05 0.52 ± 0.01 9.7 ± 0.45 cycles 73 ± 2 5.84 ± 0.05 0.53 ± 0.01 9.7 ± 0.4
FBR S101 49 ± 4 3.20 ± 0.40 0.54 ± 0.01 21.8 ± 0.3Alpha 56 ± 2 4.50 ± 0.10 0.15 ± 0.01 14.5 ± 0.4Epulp 84 ± 5 5.61 ± 0.05 0.25 ± 0.01 16.8 ± 0.9Bpulp 65 ± 3 3.75 ± 0.20 0.25 ± 0.01 30.5 ± 1.2
Figure 3. Particle size distributions for substrates from (a) MCC, (b)MAV, and (c) FBR groups.
Figure 4. Concentrations of sugars (in units of μmol L−1 per mg ofsubstrate) released by enzymatic hydrolysis with substrate concen-trations of ∼10 mg/mL.
The Journal of Physical Chemistry B Article
dx.doi.org/10.1021/jp3021744 | J. Phys. Chem. B 2012, 116, 6128−61366132
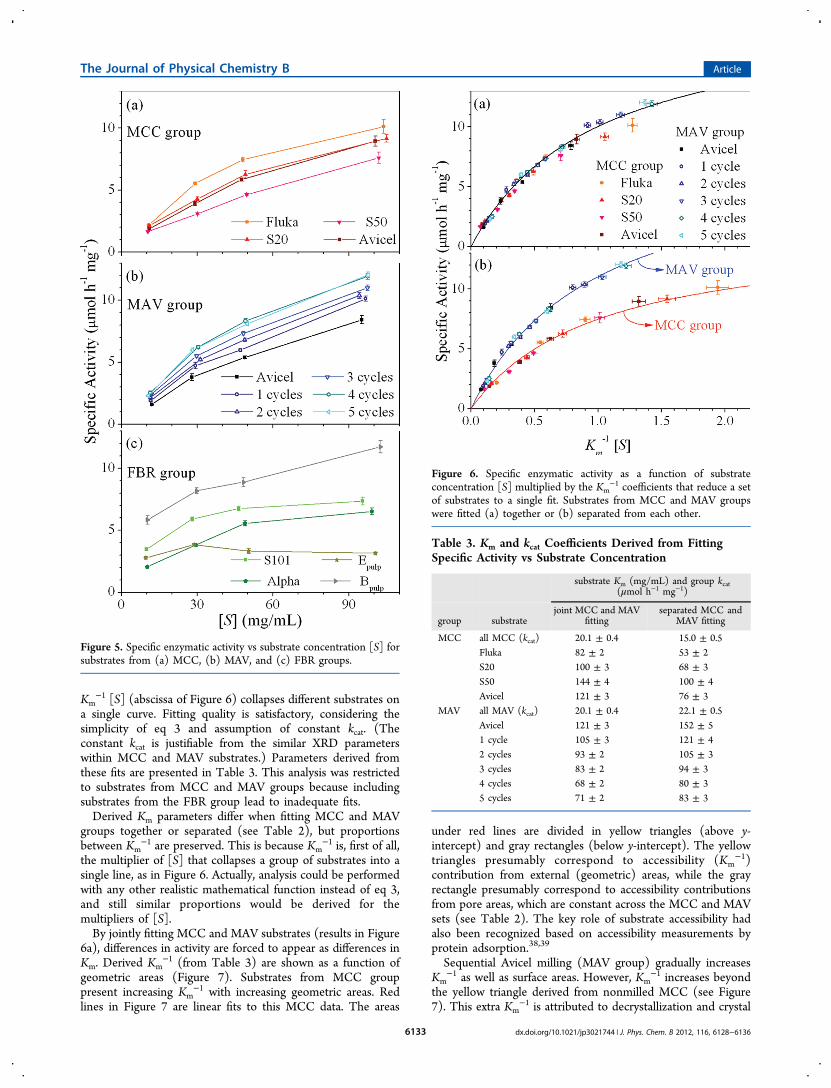
Km−1 [S] (abscissa of Figure 6) collapses different substrates on
a single curve. Fitting quality is satisfactory, considering thesimplicity of eq 3 and assumption of constant kcat. (Theconstant kcat is justifiable from the similar XRD parameterswithin MCC and MAV substrates.) Parameters derived fromthese fits are presented in Table 3. This analysis was restrictedto substrates from MCC and MAV groups because includingsubstrates from the FBR group lead to inadequate fits.Derived Km parameters differ when fitting MCC and MAV
groups together or separated (see Table 2), but proportionsbetween Km
−1 are preserved. This is because Km−1 is, first of all,
the multiplier of [S] that collapses a group of substrates into asingle line, as in Figure 6. Actually, analysis could be performedwith any other realistic mathematical function instead of eq 3,and still similar proportions would be derived for themultipliers of [S].By jointly fitting MCC and MAV substrates (results in Figure
6a), differences in activity are forced to appear as differences inKm. Derived Km
−1 (from Table 3) are shown as a function ofgeometric areas (Figure 7). Substrates from MCC grouppresent increasing Km
−1 with increasing geometric areas. Redlines in Figure 7 are linear fits to this MCC data. The areas
under red lines are divided in yellow triangles (above y-intercept) and gray rectangles (below y-intercept). The yellowtriangles presumably correspond to accessibility (Km
−1)contribution from external (geometric) areas, while the grayrectangle presumably correspond to accessibility contributionsfrom pore areas, which are constant across the MCC and MAVsets (see Table 2). The key role of substrate accessibility hadalso been recognized based on accessibility measurements byprotein adsorption.38,39
Sequential Avicel milling (MAV group) gradually increasesKm
−1 as well as surface areas. However, Km−1 increases beyond
the yellow triangle derived from nonmilled MCC (see Figure7). This extra Km
−1 is attributed to decrystallization and crystal
Figure 5. Specific enzymatic activity vs substrate concentration [S] forsubstrates from (a) MCC, (b) MAV, and (c) FBR groups.
Figure 6. Specific enzymatic activity as a function of substrateconcentration [S] multiplied by the Km
−1 coefficients that reduce a setof substrates to a single fit. Substrates from MCC and MAV groupswere fitted (a) together or (b) separated from each other.
Table 3. Km and kcat Coefficients Derived from FittingSpecific Activity vs Substrate Concentration
substrate Km (mg/mL) and group kcat(μmol h−1 mg−1)
group substratejoint MCC and MAV
fittingseparated MCC and
MAV fitting
MCC all MCC (kcat) 20.1 ± 0.4 15.0 ± 0.5Fluka 82 ± 2 53 ± 2S20 100 ± 3 68 ± 3S50 144 ± 4 100 ± 4Avicel 121 ± 3 76 ± 3
MAV all MAV (kcat) 20.1 ± 0.4 22.1 ± 0.5Avicel 121 ± 3 152 ± 51 cycle 105 ± 3 121 ± 42 cycles 93 ± 2 105 ± 33 cycles 83 ± 2 94 ± 34 cycles 68 ± 2 80 ± 35 cycles 71 ± 2 83 ± 3
The Journal of Physical Chemistry B Article
dx.doi.org/10.1021/jp3021744 | J. Phys. Chem. B 2012, 116, 6128−61366133
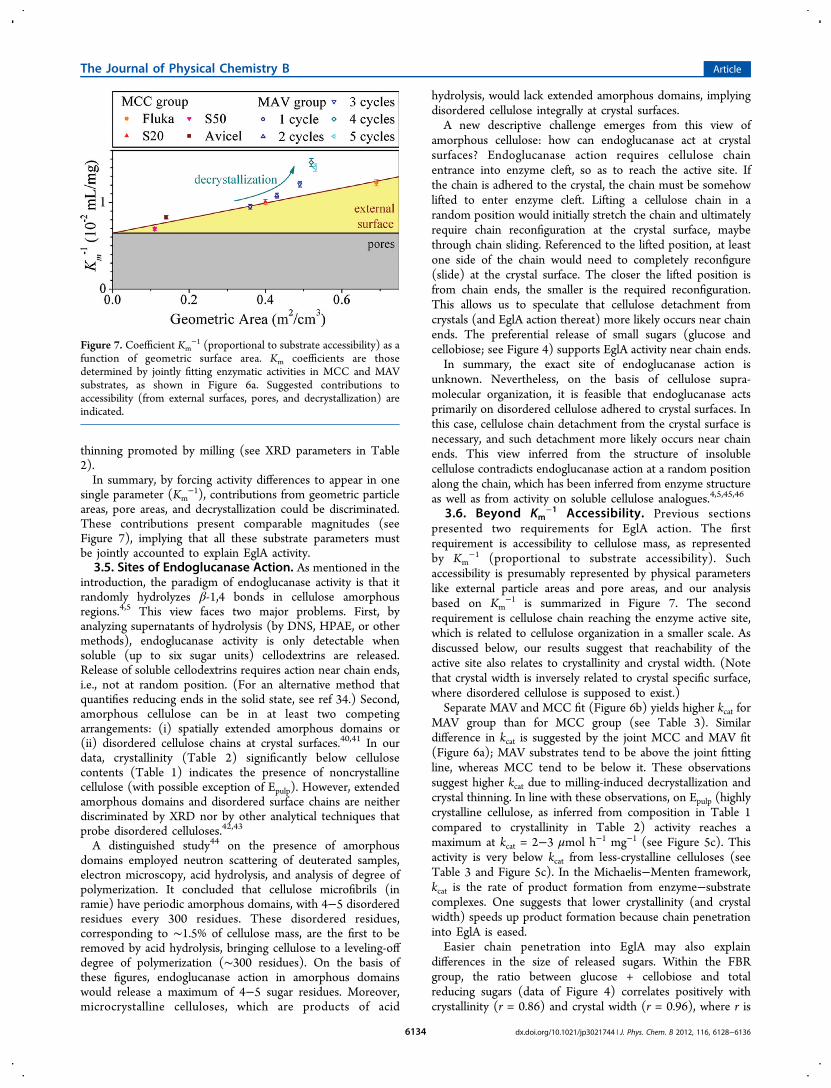
thinning promoted by milling (see XRD parameters in Table2).In summary, by forcing activity differences to appear in one
single parameter (Km−1), contributions from geometric particle
areas, pore areas, and decrystallization could be discriminated.These contributions present comparable magnitudes (seeFigure 7), implying that all these substrate parameters mustbe jointly accounted to explain EglA activity.3.5. Sites of Endoglucanase Action. As mentioned in the
introduction, the paradigm of endoglucanase activity is that itrandomly hydrolyzes β-1,4 bonds in cellulose amorphousregions.4,5 This view faces two major problems. First, byanalyzing supernatants of hydrolysis (by DNS, HPAE, or othermethods), endoglucanase activity is only detectable whensoluble (up to six sugar units) cellodextrins are released.Release of soluble cellodextrins requires action near chain ends,i.e., not at random position. (For an alternative method thatquantifies reducing ends in the solid state, see ref 34.) Second,amorphous cellulose can be in at least two competingarrangements: (i) spatially extended amorphous domains or(ii) disordered cellulose chains at crystal surfaces.40,41 In ourdata, crystallinity (Table 2) significantly below cellulosecontents (Table 1) indicates the presence of noncrystallinecellulose (with possible exception of Epulp). However, extendedamorphous domains and disordered surface chains are neitherdiscriminated by XRD nor by other analytical techniques thatprobe disordered celluloses.42,43
A distinguished study44 on the presence of amorphousdomains employed neutron scattering of deuterated samples,electron microscopy, acid hydrolysis, and analysis of degree ofpolymerization. It concluded that cellulose microfibrils (inramie) have periodic amorphous domains, with 4−5 disorderedresidues every 300 residues. These disordered residues,corresponding to ∼1.5% of cellulose mass, are the first to beremoved by acid hydrolysis, bringing cellulose to a leveling-offdegree of polymerization (∼300 residues). On the basis ofthese figures, endoglucanase action in amorphous domainswould release a maximum of 4−5 sugar residues. Moreover,microcrystalline celluloses, which are products of acid
hydrolysis, would lack extended amorphous domains, implyingdisordered cellulose integrally at crystal surfaces.A new descriptive challenge emerges from this view of
amorphous cellulose: how can endoglucanase act at crystalsurfaces? Endoglucanase action requires cellulose chainentrance into enzyme cleft, so as to reach the active site. Ifthe chain is adhered to the crystal, the chain must be somehowlifted to enter enzyme cleft. Lifting a cellulose chain in arandom position would initially stretch the chain and ultimatelyrequire chain reconfiguration at the crystal surface, maybethrough chain sliding. Referenced to the lifted position, at leastone side of the chain would need to completely reconfigure(slide) at the crystal surface. The closer the lifted position isfrom chain ends, the smaller is the required reconfiguration.This allows us to speculate that cellulose detachment fromcrystals (and EglA action thereat) more likely occurs near chainends. The preferential release of small sugars (glucose andcellobiose; see Figure 4) supports EglA activity near chain ends.In summary, the exact site of endoglucanase action is
unknown. Nevertheless, on the basis of cellulose supra-molecular organization, it is feasible that endoglucanase actsprimarily on disordered cellulose adhered to crystal surfaces. Inthis case, cellulose chain detachment from the crystal surface isnecessary, and such detachment more likely occurs near chainends. This view inferred from the structure of insolublecellulose contradicts endoglucanase action at a random positionalong the chain, which has been inferred from enzyme structureas well as from activity on soluble cellulose analogues.4,5,45,46
3.6. Beyond Km−1 Accessibility. Previous sections
presented two requirements for EglA action. The firstrequirement is accessibility to cellulose mass, as representedby Km
−1 (proportional to substrate accessibility). Suchaccessibility is presumably represented by physical parameterslike external particle areas and pore areas, and our analysisbased on Km
−1 is summarized in Figure 7. The secondrequirement is cellulose chain reaching the enzyme active site,which is related to cellulose organization in a smaller scale. Asdiscussed below, our results suggest that reachability of theactive site also relates to crystallinity and crystal width. (Notethat crystal width is inversely related to crystal specific surface,where disordered cellulose is supposed to exist.)Separate MAV and MCC fit (Figure 6b) yields higher kcat for
MAV group than for MCC group (see Table 3). Similardifference in kcat is suggested by the joint MCC and MAV fit(Figure 6a); MAV substrates tend to be above the joint fittingline, whereas MCC tend to be below it. These observationssuggest higher kcat due to milling-induced decrystallization andcrystal thinning. In line with these observations, on Epulp (highlycrystalline cellulose, as inferred from composition in Table 1compared to crystallinity in Table 2) activity reaches amaximum at kcat = 2−3 μmol h−1 mg−1 (see Figure 5c). Thisactivity is very below kcat from less-crystalline celluloses (seeTable 3 and Figure 5c). In the Michaelis−Menten framework,kcat is the rate of product formation from enzyme−substratecomplexes. One suggests that lower crystallinity (and crystalwidth) speeds up product formation because chain penetrationinto EglA is eased.Easier chain penetration into EglA may also explain
differences in the size of released sugars. Within the FBRgroup, the ratio between glucose + cellobiose and totalreducing sugars (data of Figure 4) correlates positively withcrystallinity (r = 0.86) and crystal width (r = 0.96), where r is
Figure 7. Coefficient Km−1 (proportional to substrate accessibility) as a
function of geometric surface area. Km coefficients are thosedetermined by jointly fitting enzymatic activities in MCC and MAVsubstrates, as shown in Figure 6a. Suggested contributions toaccessibility (from external surfaces, pores, and decrystallization) areindicated.
The Journal of Physical Chemistry B Article
dx.doi.org/10.1021/jp3021744 | J. Phys. Chem. B 2012, 116, 6128−61366134
the Pearson correlation coefficient. That is, longer cellulosefragments are released from less organized cellulose.
4. CONCLUSIONSThe activity of a hyperthermophilic endo-1,4-beta-glucanasefrom Pyrococcus furiosus was evaluated on 13 insoluble cellulosicsubstrates, including as-received and milled microcrystallinecelluloses, as well as fibers with significant xylan contents. Inaddition to substrate composition, several substrate physicalparameters were measured: particle size (and associatedexternal particle area), wet porosity (and associated porearea), crystallinity, and crystal width. Influences of substrateproperties on endoglucanase activity were investigated in theframework of Michaelis−Menten kinetics. Km and kcatcoefficients were reinterpreted in the context of insolublecellulosic substrates.In general, enzymatic activity correlated positively with
surface areas, and negatively with crystallinity and crystal width.For a set of as-received and milled microcrystalline celluloses,differences in activity could be expressed as differences in Km
−1,shown to proportionally represent substrate accessibility. Withthis approach, accessibility contributions from external particleareas, pore areas, and decrystallization were discriminated; theircomparable magnitudes implied that these substrate propertiesmust be jointly accounted to predict endoglucanase activity.Finally, the sites of endoglucanase action were discussed,
contradicting random attack within amorphous regions. It wasargued that noncrystalline cellulose is primarily adhered tocrystal surfaces. This configuration restrains chain entrance intoenzyme cleft and likely favors action near chain ends.Supporting this view, there was preferential release of shortcellulose fragments, with longer fragments (and higher kcat)observed in less-crystalline celluloses.
■ ASSOCIATED CONTENT*S Supporting InformationMichaelis−Menten equation derived from the Langmuirequation under the condition of low enzyme−substrate affinity;this limit case shown to apply to the experimental conditions ofthe present work. This material is available free of charge via theInternet at http://pubs.acs.org.
■ AUTHOR INFORMATIONCorresponding Author*Phone: +55 19 3518 3180. Fax: +55 19 3518 3164. E-mail:[email protected] authors declare no competing financial interest.
■ ACKNOWLEDGMENTSResearch supported by PNPD (project 560489/2010-2),FAPESP (projects 08/58037-9 and 2010/05523-3), and byLNNano, LNLS, and LNBio (proposals SEM-LV 11507 andGAR 12392).
■ REFERENCES(1) Himmel, M. E.; Ding, S.-Y.; Johnson, D. K.; Adney, W. S.;Nimlos, M. R.; Brady, J. W.; Foust, T. D. Science 2007, 315, 804−807.(2) Lynd, L. R.; Laser, M. S.; Bransby, D.; Dale, B. E.; Davison, B.;Hamilton, R.; Himmel, M.; Keller, M.; McMillan, J. D.; Sheehan, J.;Wyman, C. E. Nat. Biotechnol. 2008, 26, 169−172.(3) Cortez, L. A. B., Ed. Sugarcane Bioethanol: R&D for Productivityand Sustainability; Blucher: Sao Paulo, Brazil, 2010.
(4) Beguin, P.; Aubert, J. P. FEMS Microbiol. Rev. 1994, 13, 25−58.(5) Lynd, L. R.; Weimer, P. J.; Van Zyl, W. H.; Pretorius, I. S.Microbiol. Mol. Biol. Rev. 2002, 66, 506−577.(6) Zhang, Y.-H. P.; Lynd, L. R. Biotechnol. Bioeng. 2004, 88, 797−824.(7) Mansfield, S. D.; Mooney, C.; Saddler, J. N. Biotechnol. Prog.1999, 15, 804−816.(8) Henning, J.; Kristensen, J. B.; Felby, C. Biofuels, Bioprod. Biorefin.2007, 1, 119−134.(9) Bhat, M. K. Biotechnol. Adv. 2000, 18, 355−383.(10) Jeoh, T.; Ishizawa, C. I.; Davis, M. F.; Himmel, M. E.; Adney, W.S.; Johnson, D. K. Biotechnol. Bioeng. 2007, 98, 112−122.(11) Arantes, V.; Saddler, J. N. Biotechnol. Biofuels 2010, 3, 4.(12) Grethlein, H. E. Nat. Biotechnol. 1985, 3, 155−160.(13) Gama, F. M.; Teixeira, J. A.; Mota, M. Biotechnol. Bioeng. 1994,43, 381−387.(14) Ishizawa, C. I.; Davis, M. F.; Schell, D. F.; Johnson, D. K. J.Agric. Food Chem. 2007, 55, 2575−2581.(15) Hall, M.; Bansal, P.; Lee, J. H.; Realff, M. J.; Bommarius, A. S.FEBS J. 2010, 277, 1571−1582.(16) Park, S.; Baker, J. O.; Himmel, M. E.; Parilla, P. A.; Johnson, D.K. Biotechnol. Biofuels 2010, 3, 10.(17) Driemeier, C.; Calligaris, G. A. J. Appl. Crystallogr. 2011, 44,184−192.(18) Bauer, M. W.; Driskill, L. E.; Callen, W.; Snead, M. A.; Mathur,E. J.; Kelly, R. M. J. Bacteriol. 1999, 181, 284−290.(19) Wang, H.; Squina, F.; Segato, F.; Mort, A.; Lee, D.; Pappan, K.;Prade, R. Appl. Environ. Microbiol. 2011, 77, 5199−5206.(20) ASTM E1758−01: Standard Test Method for Determination ofCarbohydrates in Biomass by High Performance Liquid Chromatography;American Society for Testing and Materials: West Conshohocken, PA,2001.(21) Driemeier, C.; Oliveira, M. M.; Mendes, F. M.; Gomez, E. O.Powder Technol. 2011, 214, 111−116.(22) Driemeier, C.; Mendes, F. M.; Oliveira, M. M. Cellulose 2012,submitted for publication.(23) Park, S.; Venditti, R. A.; Jameel, H.; Pawlak, J. J. Carbohydr.Polym. 2006, 66, 97−103.(24) Driemeier, C.; Pimenta, M. T. B.; Rocha, G. J. M.; Oliveira, M.M.; Mello, D. B.; Maziero, P.; Goncalves, A. R. Cellulose 2011, 18,1509−1519.(25) Lutterotti, L.; Matthies, S.; Wenk, H.-R.; Schultz, A. S.;Richardson, J. W., Jr. J. Appl. Phys. 1997, 81, 594−600.(26) CAZy: Carbohydrate Active Enzymes. www.cazy.org.(27) Squina, F. M.; Santos, C. R.; Ribeiro, D. A.; Cota-Silva, J.; deOliveira, R. R.; Ruller, R.; Mort, A.; Murakami, M. T.; Prade, R. A.Biochem. Biophys. Res. Commun. 2010, 399, 505−511.(28) Bradford, M. M. Anal. Biochem. 1976, 72, 248−254.(29) ExPASy: SIB Bioinformatics Resource Portal. www.expasy.org.(30) Cheng, Y. S.; Ko, T. P.; Wu, T. H.; Ma, Y.; Huang, C. H.; Lai, H.L.; Wang, A. H.; Liu, J. R.; Guo, R. T. Proteins 2011, 74, 1193−204.(31) McIlvaine, T. C. J. Biol. Chem. 1921, 49, 183−186.(32) Miller, G. L. Anal. Chem. 1959, 31, 426−428.(33) Michaelis, L.; Menten, M. L. Biochem. Z. 1913, 49, 333−69.(34) Kongruang, S.; Han, M. J.; Breton, C. I. G.; Penner, M. H. Appl.Biochem. Biotechnol. 2004, 113, 213−231.(35) Zhang, Y.-H. P.; Lynd, L. R. Biomacromolecules 2005, 6, 1510−1515.(36) Okazaki, M.; Moo-Young, M. Biotechnol. Bioeng. 1978, 20, 637−663.(37) Zhang, Y.-H. P.; Lynd, L. R. Biotechnol. Bioeng. 2006, 94, 888−898.(38) Hong, J.; Ye, X.; Zhang, Y.-H. P. Langmuir 2007, 23, 12535−12540.(39) Wang, Q. Q.; He, Z.; Zhu, Z.; Zhang, Y.-H. P.; Ni, Y.; Luo, X.L.; Zhu, J. Y. Biotechnol. Bioeng. 2012, 109, 381−389.(40) Engstrom, A.-C.; Ek, M.; Henriksson, G. Biomacromolecules2006, 7, 2027−2031.(41) Nishiyama, Y. J. Wood Sci. 2009, 55, 241−249.
The Journal of Physical Chemistry B Article
dx.doi.org/10.1021/jp3021744 | J. Phys. Chem. B 2012, 116, 6128−61366135

(42) Wickholm, K.; Larsson, P. T.; Iversen, T. Carbohydr. Res. 1998,312, 123−129.(43) Muller, M.; Czihak, C.; Schober, H.; Nishiyama, Y.; Vogl, G.Macromolecules 2000, 33, 1834−1840.(44) Nishiyama, Y.; Kim, U.-J.; Kim, D.-Y.; Katsumata, K. S.; May, R.P.; Langan, P. Biomacromolecules 2003, 4, 1013−1017.(45) Reese, E. T.; Siu, R. G. H.; Levinson, H. S. J. Bacteriol. 1950, 59,485−497.(46) Kleywegt, G. J.; Zou, J.-Y.; Divne, C.; Davies, G. J.; Sinning, I.;Stahlberg, J.; Reinikainen, T.; Srisodsuk, M.; Teeri, T. T.; Jones, T. A.J. Mol. Biol. 1997, 272, 383−397.
The Journal of Physical Chemistry B Article
dx.doi.org/10.1021/jp3021744 | J. Phys. Chem. B 2012, 116, 6128−61366136