Insights into the development of major rift-related unconformities from geologically constrained...
22
Insights into the development of major rift-related unconformities from geologically constrained subsidence modelling: HaltenTerrace, offshore mid Norway R. E. Bell, * C. A-L. Jackson, * G. M. Elliott, * ,1 R. L. Gawthorpe, † Ian R Sharp 2 and Lisa Michelsen 3 *Basins Research Group (BRG) Department of Earth Science & Engineering, Imperial College London, London, SW7 2AZ, UK †Department of Earth Sciences, University of Bergen, P.O. Box 7803, Bergen, Norway 1 Present address LUKOIL Overseas UK Limited, London, SW1Y 4LR, UK 2 Statoil Research Centre, Sandsliveien 90, Bergen, Norway 3 Statoil ASA, Mølnholtet 42, Harstad, Norway ABSTRACT Due to the effects of sediment compaction, thermal subsidence and ‘post-rift’ fault reactivation, the present-day geometry of buried, ancient rift basins may not accurately reflect the geometry of the basin at any stage of its syn-rift evolution. An understanding of the geometry of a rift basin through time is crucial for resolving the dynamics of continental rifting and in assessing the hydrocarbon prospectivity of such basins. In this study, we have restored the Late Jurassic–Early Cretaceous geometry of the southern Halten Terrace, offshore mid Norway, using a combination of well log- and core-derived, sedimentological and stratigraphic data, seismic-stratigraphic observations and reverse subsidence modelling. This integrated geological and geophysical approach has allowed the large number of input parameters involved in flexural backstripping and post-rift thermal subsidence modelling to be constrained. We have thus been able to determine the regional structure of the basin at the end of the Late Jurassic–Early Cretaceous rift phase and the associated amount of crustal stretching. Our basin geometry reconstructions reveal that, during the latest syn-rift period in the Late Jurassic–Early Cretaceous, the Halten Terrace was characterized by a series of isolated depo- centres, located between footwall islands, which were not connected into a single depocentre until the Late Cretaceous (Coniacian). We show that two major unconformities, which are now vertically offset by ca. 2 km and located ca. 60 km apart, formed at similar subaerial elevations in the Late Jurassic–Early Cretaceous and were subsequently vertically offset by thermally induced tilting of the basin margin. Cretaceous sediments were deposited in a single, relatively unconfined basin in water depths of 1–1.5 km. The b profile that best restores palaeobathymetry to match our geological con- straints is the same as that derived from summing visible post-Late Triassic heave on faults plus 25– 60% additional extension to account for sub-seismic deformation. This indicates that, at least in the southern part of the Halten Terrace, the amount of upper-crustal stretching during the Late Juras- sic–Early Cretaceous rift phase is comparable to the total amount of lithospheric stretching, support- ing a uniform pure-shear stretching model. INTRODUCTION Due to the effects of sediment compaction, thermal subsi- dence and ‘post-rift’ fault reactivation, the present-day geometry of buried, ancient rift basins may not accurately reflect the geometry of the basin at any stage of its evolu- tion. Imaging the final geometry and understanding the sequential development of rift basins is critical, however, because they can provide fundamental information regarding rift evolution and lithospheric extension mech- anisms (e.g. Shillington et al., 2008; Roberts et al., 2009). Furthermore, an understanding of the geometry of a basin through time is crucial for the hydrocarbon industry to determine the timing and location of source rock matura- tion, the distribution of reservoir rocks, trap geometry at the time of hydrocarbon migration and the timing and location of hydrocarbon migration (e.g. Roberts et al., 2009). Correspondence: R. E. Bell, Basins Research Group (BRG) Department of Earth Science & Engineering, Imperial College London, Prince Consort Rd, London, SW7 2BP, UK. E-mail: [email protected] © 2014 The Authors Basin Research © 2014 John Wiley & Sons Ltd, European Association of Geoscientists & Engineers and International Association of Sedimentologists 203 Basin Research (2014) 26, 203–224, doi: 10.1111/bre.12049 EAGE
Transcript of Insights into the development of major rift-related unconformities from geologically constrained...

Insights into the development ofmajor rift-relatedunconformities fromgeologically constrainedsubsidencemodelling:HaltenTerrace, offshoremidNorwayR. E. Bell,* C. A-L. Jackson,* G. M. Elliott,*,1 R. L. Gawthorpe,† Ian R Sharp 2 andLisa Michelsen 3
*Basins Research Group (BRG) Department of Earth Science & Engineering, Imperial College London,London, SW7 2AZ, UK†Department of Earth Sciences, University of Bergen, P.O. Box 7803, Bergen, Norway1 Present address LUKOIL Overseas UK Limited, London, SW1Y 4LR, UK2 Statoil Research Centre, Sandsliveien 90, Bergen, Norway3 Statoil ASA, Mølnholtet 42, Harstad, Norway
ABSTRACT
Due to the effects of sediment compaction, thermal subsidence and ‘post-rift’ fault reactivation, the
present-day geometry of buried, ancient rift basins may not accurately reflect the geometry of the
basin at any stage of its syn-rift evolution. An understanding of the geometry of a rift basin through
time is crucial for resolving the dynamics of continental rifting and in assessing the hydrocarbon
prospectivity of such basins. In this study, we have restored the Late Jurassic–Early Cretaceousgeometry of the southern Halten Terrace, offshore mid Norway, using a combination of well log-
and core-derived, sedimentological and stratigraphic data, seismic-stratigraphic observations and
reverse subsidence modelling. This integrated geological and geophysical approach has allowed the
large number of input parameters involved in flexural backstripping and post-rift thermal subsidence
modelling to be constrained. We have thus been able to determine the regional structure of the basin
at the end of the Late Jurassic–Early Cretaceous rift phase and the associated amount of crustal
stretching. Our basin geometry reconstructions reveal that, during the latest syn-rift period in the
Late Jurassic–Early Cretaceous, the Halten Terrace was characterized by a series of isolated depo-
centres, located between footwall islands, which were not connected into a single depocentre until
the Late Cretaceous (Coniacian). We show that two major unconformities, which are now vertically
offset by ca. 2 km and located ca. 60 km apart, formed at similar subaerial elevations in the Late
Jurassic–Early Cretaceous and were subsequently vertically offset by thermally induced tilting of the
basin margin. Cretaceous sediments were deposited in a single, relatively unconfined basin in water
depths of 1–1.5 km. The b profile that best restores palaeobathymetry to match our geological con-
straints is the same as that derived from summing visible post-Late Triassic heave on faults plus 25–60% additional extension to account for sub-seismic deformation. This indicates that, at least in the
southern part of the Halten Terrace, the amount of upper-crustal stretching during the Late Juras-
sic–Early Cretaceous rift phase is comparable to the total amount of lithospheric stretching, support-
ing a uniform pure-shear stretching model.
INTRODUCTION
Due to the effects of sediment compaction, thermal subsi-
dence and ‘post-rift’ fault reactivation, the present-day
geometry of buried, ancient rift basins may not accurately
reflect the geometry of the basin at any stage of its evolu-
tion. Imaging the final geometry and understanding the
sequential development of rift basins is critical, however,
because they can provide fundamental information
regarding rift evolution and lithospheric extension mech-
anisms (e.g. Shillington et al., 2008; Roberts et al., 2009).Furthermore, an understanding of the geometry of a basin
through time is crucial for the hydrocarbon industry to
determine the timing and location of source rock matura-
tion, the distribution of reservoir rocks, trap geometry at
the time of hydrocarbon migration and the timing and
location of hydrocarbon migration (e.g. Roberts et al.,2009).
Correspondence: R. E. Bell, Basins Research Group (BRG)Department of Earth Science & Engineering, Imperial CollegeLondon, Prince Consort Rd, London, SW7 2BP, UK. E-mail:[email protected]
© 2014 The AuthorsBasin Research © 2014 John Wiley & Sons Ltd, European Association of Geoscientists & Engineers and International Association of Sedimentologists 203
Basin Research (2014) 26, 203–224, doi: 10.1111/bre.12049
EAGE

At the kilometre to tens-of-kilometre (i.e. ‘seismic’)
scale, estimates of palaeo-basin structure can be derived
from seismic-stratigraphic analysis of seismic reflection
data (e.g. Vail et al., 1977). Seismic-stratigraphic indica-
tors of palaeo-water depth, such as coastal onlap, clino-
forms and unconformities, are commonly observed at the
margins of sedimentary basins; however, there are often
fewer useful seismic-stratigraphic indicators of palaeo-
water depth towards the deeper-water basin axis (e.g.
Kjennerud & Vergara, 2005; Bell et al., 2008). Sedimen-
tological and biostratigraphic analysis of well data can also
be used to determine palaeobathymetry; however, these
well-based methods can only typically provide estimates
of palaeo-water depth at a single location (e.g. Van Hinte,
1978; Gradstein & Backstrom, 1996). Therefore, both
seismic-stratigraphic and well data methods have limita-
tions in terms of the spatial constraints they can provide
on palaeo-water depth.
An alternative method to estimate palaeo-basin
structure at the margin- or regional-scale involves ‘back-
stripping’ stratigraphy and comparing the results to geo-
dynamic basin models (e.g. Kusznir et al., 2004;
Shillington et al., 2008; Roberts et al., 2009). However,
flexural backstripping and reverse post-rift thermal subsi-
dence modelling methods require knowledge of a number
of often unknown or hard-to-determine parameters, such
as the effective elastic thickness of the lithosphere (Te)
and the amount of extension across the rift, which is often
expressed as the beta (b) stretching factor (McKenzie,
1978). Such reverse subsidence modelling studies are
often conducted at the margin scale, and tens-of-kilome-
tre scale features, such as individual fault blocks, are often
smoothed-out in the analysis and ignored as ‘noise’ in
favour of understanding larger scale lithospheric pro-
cesses (e.g. Roberts et al., 2009). To reconstruct basin
structure at the scale of individual fault blocks the input
parameters involved in reverse subsidence modelling need
to be constrained to a finer level of detail than is often
required for margin-scale studies.
In this contribution, we integrate geological (sedimen-
tology and stratigraphy) and geophysical datasets (seismic
reflection and refraction) to resolve the magnitude and
distribution of extension that occurred during Late Juras-
sic–Early Cretaceous rifting in the Halten Terrace area,
offshore Mid Norway (Fig. 1). The mid-Norwegian
margin has experienced multiple rifting events, and the
geometry of the basin following rifting in the Late Juras-
sic–Early Cretaceous is currently poorly understood. In
particular, the age and processes associated with the gen-
eration of major unconformities in the region are not well
constrained and we propose that basin geometry recon-
structions will allow us to determine not only the eleva-
tions and/or water depth at which they developed, but
also when they formed. However, a key issue related to
this approach is that the distribution and amount of litho-
spheric extension that occurred during the Late Jurassic–Early Cretaceous rift event is also unknown. This study
aims to: i) constrain the detailed, Late Jurassic–Early
Cretaceous structure of the Halten Terrace by integrating
palaeo-water depth information derived from geological
data with the results of reverse subsidence modelling
based on the interpretation of high-quality 2D seismic
reflection data, ii) determine whether major Late
Jurassic–Early Cretaceous unconformities developed in a
subaerial or submarine environment, iii) assess the post-
formation tectonic processes that have resulted in the
unconformities occurring at their current burial depths;
and to iv) determine the likely lithospheric extension
mechanism operating in the Late Jurassic–Early Creta-
ceous rift event. Furthermore, we outline a systematic
workflow that may be applicable to other rifted margins
along which complementary geophysical and geological
data are available.
REGIONAL SETTING
Tectonic background
The Halten Terrace is located between 64° and 65°30′Non the mid-Norwegian continental shelf; together with
the Trøndelag Platform, which lies to the east, the Halten
Terrace represents the eastern margin of the Vøring Basin
(Fig. 1a). The area has a complex tectonic history, which
is characterized by multiple rift events that likely initiated
in the Devonian (Blystad et al., 1995; Dor�e et al., 1997).Permo–Triassic rifting has affected some parts of the
mid-Norwegian shelf, particularly the Trøndelag
Platform and Froan Basin, however, the true extent and
magnitude of Permo–Triassic rifting is now difficult to
resolve as the associated structures and sediments are now
deeply buried, poorly imaged on seismic data and not
penetrated by wells (Blystad et al., 1995; Scheck-Wende-
roth et al., 2007).The post-Triassic structural evolution of the northern
part of the Halten Terrace has been strongly influenced
by a thick sequence of Triassic evaporites, which have
resulted in the formation of a range of complex, rift- and
halokinesis-related structural styles (Pascoe et al., 1999;Corfield & Sharp, 2000; Marsh et al., 2010; Elliott et al.,2012). The Triassic evaporites are thin and largely immo-
bile in the southern part of the Halten Terrace and thick-
skinned, basement-involved faulting dominates the
structural style and results in the formation of a large,
east-dipping half-graben (Figs 1b and 2). Major, although
as yet unquantified, rifting occurred in the Halten Terrace
area in the Late Jurassic to Early Cretaceous (ca. 140 Ma,
Roberts et al., 2009), resulting in the formation of large
normal faults and rotated fault blocks (Figs 1b and 2).
The most significant fault complexes in the study area
include the west-dipping Vingleia fault complex (VFC) in
the east, and the west-dipping Klakk Fault Complex
(KFC) in the west, which separates the Halten Terrace
from the deeper R�as Basin (Figs 1c and 2). Highly reflec-
tive, planar surfaces are present in the footwalls of both
the Vingleia and KFCs, and the structures capped by
these features are known as the Frøya High and the Skl-
© 2014 The AuthorsBasin Research © 2014 John Wiley & Sons Ltd, European Association of Geoscientists & Engineers and International Association of Sedimentologists204
R. E. Bell et al.

inna Ridge respectively (Fig. 2). Both erosional surfaces
truncate Jurassic stratigraphy, although the Sklinna Ridge
is now buried 2 km deeper than the Frøya High (Fig. 2).
The absolute elevation of these surfaces at the time of
their formation, and therefore the processes responsible
for their creation are unknown.
The mid-Norwegian margin experienced further rif-
ting during the Early Tertiary (ca. 65 Ma; Roberts et al.,2009). This rift phase largely influenced the region to the
west of the Vøring and Møre basins, and eventually led to
continental break-up and the opening of the NE Atlantic
Ocean (e.g. Dor�e, 1991; Scheck-Wenderoth et al., 2007;Fig. 1b). Away from the rift axis, this rift event is also
responsible for basin inversion and the formation of large
domes such as the Helland-Hansen Arch (e.g. Blystad
et al., 1995). In the Halten Terrace, however, there is no
observable evidence that early Tertiary extensional fault-
ing or inversion occurred and this is supported by calcula-
tions of b stretching factor by Roberts et al. (2009), whichshow values of b = 1. Westward thickening of Cenozoic
(a) (c)
(b)
Fig. 1. (a) Simplified structural elements map of the mid-Norwegian Shelf (after Elliott et al., 2012). Profile 3-03 is an ocean bottomseismometer profile from Breivik et al. (2011). (b) Regional cross section across the Halten Terrace and Vøring margin simplified from
Faleide et al. (2010). b factor information across the profile is taken from Roberts et al. (2009). (c) Map displaying the depth to the
Base Cretaceous Unconformity in the Halten Terrace region, together with fault polygons mapped by Elliott et al., 2012. Seismic
reflection profiles and wells used in this study are labelled. Hydrocarbon fields are shown as white polygons. Selected fields for refer-
ence; 1 = Draugen, 2 = Mikkel, and 3 = �Asgard. KFC, Klakk Fault Complex; BFC, Bremstein Fault Complex; VFC, Vingleia Fault
Complex; SR, Sklinna Ridge; FH, Frøya High.
© 2014 The AuthorsBasin Research © 2014 John Wiley & Sons Ltd, European Association of Geoscientists & Engineers and International Association of Sedimentologists 205
Geologically constrained subsidence modelling

sediments across the Halten Terrace may be related to
flexure associated with Early Tertiary stretching focused
further to the west (Fig. 2), or it may be related to gentle
thermally driven subsidence of the crust following the
Late Jurassic to Early Cretaceous rift event (Figs 1c and
2, Dor�e et al., 2008).
Stratigraphy
Evaporites and non-marine clastics were deposited across
the Halten Terrace during the Triassic (Fig. 3; Dalland
et al., 1988; Richardson et al., 2005). Early to early-Mid-
dle Jurassic stratigraphy in the southern Halten Terrace is
dominated by a series of paralic-to-shallow-marine, sand-
stone (Garn and Ile formations) and mudstone-rich (e.g.
Not Formation) formations (Fig. 3; Dalland et al., 1988).Drowning of the Halten Terrace during the Late Jurassic
was associated with the deposition of the deep marine,
mudstone-dominated, Melke and Spekk formations,
which form a semi-continuous drape over the underlying
rift-related relief across much of the basin (Fig. 3;
Dalland et al., 1988; Elliott et al., 2012). Seismic and well
data suggest that some of the largest, most prominent
basement highs, such as the Frøya High and Sklinna
Ridge, may, however, have remained subaerial during the
Late Jurassic and represented a source of coarse clastic
material (Fig. 2). For example, well data indicate that,
during the Late Jurassic, a sand-rich, shallow marine
system developed on the Frøya High, in the immediate
footwall of the VFC (Rogn Formation; Dalland et al.,1988; Provan, 1992).
The Base Cretaceous Unconformity (BCU) is a promi-
nent stratigraphic horizon and seismic reflection that
separates Jurassic from Cretaceous sediments across the
Halten Terrace (Figs 1c, 2 and 3). The Cretaceous Cro-
mer Knoll and Shetland groups overlie the BCU and are
primarily composed of claystones, which contain thin
beds of carbonate and sandstone that were deposited in a
deep water marine environment (Dalland et al., 1988).The Early Cretaceous (Beriasian to Cenomanian; Dalland
1
2
3
4
5
6
7
8
TWT
(s)
0 6406/8-1 6407/7-5 6407/8-1 6407/9-6 6407/9-3
10 km
Vingleia FaultComplex
Sklinna Ridge
Klakk Fault Complex
Frøya High
F7
F1F2
F3
F4
F5F6
W E
1
2
3
4
5
8
TWT
(s)
0
Draugen(a)
6406/8-1 6407/7-5 6407/8-1 6407/9-6 6407/9-3
10 km
10080604020 120Distance along profile (km)
Halten Terrace
(b)
6
7
Nordland Group
Hordaland GroupRogaland Group
Upper Shetland Group
Lower Shetland Group
Cromer Knoll
Jurassic
Pre-Jurassic
Rås Basin
*
* See Fig. 4 for detailed Cretaceous stratigraphy in footwall of Vingleia Fault Complex
Top Triassic
BCU
Fig. 2. (a) Uninterpreted and (b) interpreted seismic reflection profile MNR07-7135 across the Halten Terrace (location shown in
Fig. 1c). Interpreted horizons are colour coded as shown in the stratigraphic column presented in Fig. 3. The labelled distances along
the profile correspond with distances along the profile used for reverse subsidence modelling (e.g. Figs 5 and 6). There is no correlat-
able reflector across the profile which may be the base Triassic, however, the thickness of Triassic sediments are discussed further in
the text using information from wells away from this profile.
© 2014 The AuthorsBasin Research © 2014 John Wiley & Sons Ltd, European Association of Geoscientists & Engineers and International Association of Sedimentologists206
R. E. Bell et al.

et al., 1988) Lange Formation onlaps the BCU on the
eastern flank of the Sklinna Ridge, and is restricted to the
hanging wall of the KFC and the main Halten Terrace de-
pocentre. The Late Cretaceous Kvintos Formation (Tu-
ronian–Coniacian; Dalland et al., 1988) forms a
continuous drape across the Sklinna Ridge (Fig. 2). The
Kvintos Formation also drapes the Frøya High (Fig. 4;
6407/9-9), although the Lange formation has been
penetrated on the dip slope of the Frøya High, where it
thickens southwards from 27 m (6407/9-4) to 40 m
(6407/9-5).
The Rogaland Group consists of claystones, which
contain thin siltstone beds and, within the Tare Forma-
tion, tuffs (Dalland et al., 1988). The Tertiary Hordaland
Cre
tace
ous
Jura
ssic
Tria
ssic
Upp
erLo
wer
Mid
dle
Low
erU
pper
Group Lithostratigraphy
Base CretaceousUnconformity
Intra-MelkeUnconformity
ILE
GARNNOT
TOFTE RORTILJE
ÅRE
GREY/RED BEDSUPPER SALT
LOWER SALT
RED BEDS
MELKE
SPEKK
LYR
LANGE
LYSING
BÅ
TFA
NG
ST
VIK
ING
GR
OU
PC
RO
ME
R K
NO
LL
ROGN
Upp
er
Period Epoch
KVITNOS
NISE
SPRINGAR
TANG
Base CenozoicUnconformity
SH
ETL
AN
D
Seismic StratigraphicFramework
Top Springar
Top Lange
BCU
Top GarnTop NotTop Ile
Mudstone dominated Sandstone dominated Evaporites
Top Triassic
Pal
eoge
neN
eo-
ROGA-LAND
TARE
Q
HO
RD
A-
LAN
D
gene
Cen
ozoi
c NO
RD
-LA
ND
BRYGGE
KAI
NAUST
Top Hordaland
Top Rogaland
Mid-Kvintos
Åre coal
Tectonics
Syn
-Rift
Pos
t-Rift
‘Pre
-RIft
’
Stage
Pliocene
Miocene
Oligocene
Eocene
Palaeocene
Maastricht.
Campanian
Santonian
Coniacian
Albian
Aptian
Barremian
Beriasian
Turonian
Cenomanian
Hauterivian
Valanginian
Tithonian
Kimmeridg.
Oxfordian
Callovian
Bathonian
Bajocian
Aalenian
Toarcian
Pliensbach.
Sinemurian
Hettangian
Rheatian
Norian
Carnian
Age(Ma)
23
56
65
140
165
175
201
Red Beds
Global sea-level Local sea-level
95
Local sea-levelbasins structural highs
0 100 200-100risefall
estimate (m)marine
continental
Dee
p m
arin
e
Shal
low
mar
ine
marinecontinental
2
1
Nordland Group
Hordland Group
Rogaland Group
U. Shetland Group
L. Shetland Group
Cromer Knoll
Jurassic
Pre-Jurassic
?
177.325 mm
Fig. 3. Stratigraphic column for the Halten Terrace, modified after Dalland et al., 1988 and Elliott et al., 2012. The ‘Global sea-level
estimate’ column provides a smoothed version of the Haq et al. (1987) eustatic sea level. The ‘Local sea-level basins’ column provides
an estimate of relative sea level in the Halten Terrace and R�as Basins determined from sedimentary facies information. The curve in
the ‘Local sea-level structural highs’ column shows an estimate of relative sea level in the vicinity of the Frøya High and Sklinna Ridge
determined from sedimentary and seismic facies (see text for details). The blue stars indicate the following constraints on palaeo water
depth in the Frøya High and Sklinna Ridge areas: star 1 = the Draugen field area must be in shallow water depths in the Kimmerid-
gian and star 2 = the Sklinna Ridge must be submarine by the Turonian–Coniacian.
© 2014 The AuthorsBasin Research © 2014 John Wiley & Sons Ltd, European Association of Geoscientists & Engineers and International Association of Sedimentologists 207
Geologically constrained subsidence modelling
Group is composed of claystones, which contain thin beds
of sandstone. The Tertiary–Quaternary Nordland Group
is composed of claystones, siltstone and sandstone
(Dalland et al., 1988).
Previousmid-Norwegianmargin geometryreconstructions
Several studies have attempted to reconstruct the struc-
ture of the Vøring and Møre basins associated with the
Early Tertiary rift phase (ca. 65 Ma) (Kusznir et al.,2004; Ceramicola et al., 2005; Kjennerud & Vergara,
2005; Roberts et al., 2009). These studies have high-
lighted an apparent discrepancy between the estimates of
palaeobathymetry derived from geodynamic models and
those provided by geological data (Kusznir et al., 2004,2005; Ceramicola et al., 2005), which cannot be explained
by varying the values of input parameters in the geody-
namic modelling within realistic limits. This discrepancy
has been used to support a depth-dependent stretching
model for the Early Tertiary rift phase in the Møre and
Vøring basins (Kusznir et al., 2005).Although a substantial amount of work has focused on
restoring basin structure associated with Early Tertiary
rifting, variations in basin geometry associated with the
earlier, Late Jurassic–Early Cretaceous rift phase in the
Halten Terrace area have received considerably less atten-
tion. Using regional maps of sediment thickness, Scheck-
Wenderoth et al. (2007) propose that the rift axis of LateJurassic–Early Cretaceous rifting was focused in the Møre
and Vøring Basin areas, with an estimated b stretching
factor of 1.7–2. They also propose that an apparent lack ofpre-Cretaceous age syn-rift sediments beneath the Vøring
and Møre Basins points to minimal upper-crustal exten-
sion during the Late Jurassic–Early Cretaceous rift phase,and they thus favour a depth-dependent stretching
model.
Roberts et al. (2009) suggest that Late Jurassic–EarlyCretaceous rifting occurred by uniform stretching across
the rift, with an average beta stretching factor of 1.4
(Fig. 1b), but recognize it was probably closer to 1.1 on
the eastern basin margin and 2 towards the western rift
axis. A more detailed understanding of the distribution
and amount of Late Jurassic–Early Cretaceous rift phase
extension will provide us with improved restorations of
basin geometry and will allow us to investigate the syn-
chroneity between and causes of major unconformity
development in the region. Furthermore, the results of
this study will shed light on the dominant lithospheric
stretching mechanism (i.e. depth dependent vs. uniform)
that drove Late Jurassic–Early Cretaceous normal faulting
and subsidence.
DATASET
The data used in this study include high-quality, time-
migrated, 2D seismic reflection profiles that were
acquired by TGS-Nopec in 2005 and 2007 (Figs 1c and
2). These data have a record length of 0–8 s two-way time
Fig. 4. Stratigraphic correlation across five wells in the region of the Draugen oil field. The stratigraphic correlation has been
flattened on the Base Cretaceous Unconformity.
© 2014 The AuthorsBasin Research © 2014 John Wiley & Sons Ltd, European Association of Geoscientists & Engineers and International Association of Sedimentologists208
R. E. Bell et al.

(TWT) and provide good quality imaging down to lower
Mesozoic (i.e. Triassic) levels. Interpretation of these
seismic reflection profiles has been aided by the availabil-
ity of stratigraphic data from nine key wells, which have
been tied to the seismic data through synthetic seismo-
grams (Fig. 1c). In this contribution, we focus on line
MNR07-7135 from the southern Halten Terrace, and in
‘Geological constraints on palaeo-water depth’ section
discuss the information these datasets provide on water
depths in the area through time.
METHODOLOGY
Eight key horizons have been interpreted along the seis-
mic profiles (Seabed, top Hordaland Group, top Rogaland
Group, top Springar Formation, intra-Kvintos Forma-
tion, top Lange Formation, BCU and top Triassic; Figs 2
and 3). The tops of the Garn, Not, Ile and�Are formations
have also been locally interpreted (Fig. 2). The thickness
of the underlying Triassic unit in the immediate vicinity
of MNR07-7135 is unknown because it has not been fully
penetrated by wells and there is no obvious candidate
base-Triassic reflection on seismic data (Fig. 2). Lithol-
ogy information in wells was provided by final well
reports and wireline log data, and this allowed us to deter-
mine the likely depositional environments for the various
stratigraphic units. However, biostratigraphic data are
lacking in the Upper Jurassic to Lower Cretaceous suc-
cession, thus we cannot directly constrain palaeo-water
depths in the corresponding time periods. The lack of
these data was a primary motivation for this study.
In this study, we reconstruct the basin geometry along
line MNR07-7135 using reverse-basin modelling tech-
niques, and compare the basin reconstructions with infor-
mation on palaeo-water depths derived from well and
seismic data. Reverse-basin models that can reconstruct
the basin geometry to meet the geological constraints on
palaeo-water depth are deemed viable solutions, and those
that do not are not considered further. In this way we
develop a suite of viable basin reconstructions for the
study area.
The reconstruction of Late Jurassic–Early Cretaceous
basin structure in the southern Halten Terrace requires
the removal of the effects of post-BCU sediment loading
and post-rift thermal subsidence (Fig. 2). The depth to
the BCU, after the removal of sediment loading and
tectonic subsidence, will provide an estimate of the
bathymetry and basin structure at the end of the Late
Jurassic–Early Cretaceous rift event. To remove basin
subsidence caused by sediment loading we undertake
sequential 2D flexural backstripping and decompaction
(Watts et al., 1982; Roberts et al., 1993, 1998; Kusznir
et al., 1995; Nadin & Kusznir, 1995). The ‘backstripping’
procedure involves first removing the youngest sedimen-
tary layer and allowing the lithosphere to isostatically
rebound in response to the load removal. In addition, the
structure of the basin is also modified by the decompac-
tion of underlying sediments in response to the removal
of this load. After these adjustments have been made the
next sedimentary layer can be removed, and so on, until
the target horizon, the BCU, is reached.
The subsidence history of the Halten Terrace is not
only controlled by sediment loading, but also by thermal
subsidence following rifting. To accurately reproduce
palaeobathymetry, the thermal subsidence occurring dur-
ing the deposition of each sedimentary layer must also be
considered. With the removal of each sedimentary layer
in the backstripping procedure, a ‘thermal uplift correc-
tion’ must also be applied to correct for thermal subsi-
dence. The value of this thermal correction is determined
from lithospheric stretching models, such as that pro-
posed by McKenzie (1978), and depends on the time
since rifting ceased and the magnitude, in terms of total
stretching, of the rift event.
The modelling software we have chosen to use in the
study is Flex-Decompaction developed by Badley Geosci-
ence Ltd and details of the methodology are provided by
Roberts et al. (1997, 1998, 2009) and Ceramicola et al.(2005). In summary, the workflow involves: i) removal of
the water layer and calculation of the flexural-isostatic
response to this removal; ii) removal of the shallowest
stratigraphic unit and decompaction of the remaining sed-
iment units. Decompaction is conducted by calculating
near-surface porosity, decay constants and matrix densi-
ties for lithologies observed in wells using relationships
from Sclater & Christie (1980) (see Table 1); iii) calcula-
tion of the flexural-isostatic response to the removal of the
sediment load; iv) modelling of thermal uplift using the
McKenzie (1978) post-rift thermal subsidence model;
Table 1. Relative palaeo-water depths at different time periods within Halten Terrace basins and across structural highs, estimated
from sedimentology and seismic stratigraphy. See Fig. 3 for approximate relative sea-level curves
Period Epoch Basins (R�as, Halten, Trøndelag) Structural highs (Sklinna Ridge, Frøya high)
Cenozoic Deep marine Deep marine
Cretaceous Upper Deep marine Sklinna Ridge and Frøya High submarine by Turonian/Coniacian
(ca. 95 Ma)
Lower Deep marine No Lower Cretaceous sediment is observed on top of the Sklinna
Ridge or Frøya High
Jurassic Upper Draugen field area in shallow
marine conditions (0–100 m)
Sklinna Ridge unknown water depth. Jurassic stratigraphy eroded
over a width of ca. 16 km
© 2014 The AuthorsBasin Research © 2014 John Wiley & Sons Ltd, European Association of Geoscientists & Engineers and International Association of Sedimentologists 209
Geologically constrained subsidence modelling

and v) a correction for long-term eustatic variations in sea
level before the model is water loaded, using flexural isos-
tasy to compute the isostatic response. The workflow is
then repeated for the removal of other sediment units
down to the target horizon.
The use of 2D flexural backstripping, rather than 3D
flexural backstripping, is only permissive if there are lim-
ited lateral variations in sediment thickness. In the case of
seismic profile MNR07-7135, the thickness of sediments
deposited since the earliest Cretaceous is relatively consis-
tent over length scales of ca. 15 km to the north and south
of the profile (Fig. 1c), thus justifying the 2D flexural
backstripping method used here.
Reverse subsidence modelling requires a number of
sediment and crustal input parameters to be specified: i) a
velocity model; ii) lithology information (i.e. age, surface
porosity, decompaction coefficient, and sediment density
of sedimentary units); iii) depth to notional basement; iv)
lithospheric effective elastic thickness (Te); and v) stretch-
ing history (i.e. age of rift events and stretching factors).
Eustatic sea-level variations are also required in the
reverse-basin modelling and, following the work of
Ceramicola et al. (2005) and Roberts et al. (2009), weassume that the sea-level curve presented by Haq et al.(1987) is appropriate for the Halten Terrace. Eustatic sea
level is, however, still a controversial topic. M€uller et al.(2008) presented an update to the eustatic sea-level curve
of Haq et al. (1987), taking into account ocean basin
dynamics. This sea-level curve is within error of the Haq
et al. (1987) curve for pre-Tertiary time periods (i.e.
>65 Ma), which is the time period we primarily focus on
in this study. We have therefore elected to use the Haq
et al. (1987) curve in our reconstruction. In the ‘Sensitiv-
ity testing’ section we undertake a series of sensitivity
tests to investigate the likely range of error that may be
introduced into our analysis as a function of realistic vari-
ations in these input parameters. In the section ‘Refining
estimates of crustal input parameters’ we then justify a
preferred set of input parameters by comparing recon-
structed basin geometry with the estimates of palaeo-
water depths suggested by geological data (Geological
constraints on palaeo-water depth section and Table 1).
GEOLOGICALCONSTRAINTS ONPALAEO-WATERDEPTH
The HaltenTerraceand R�as Basin
Sedimentary facies information from wells drilled on the
Halten Terrace and in the adjacent R�as Basin to the NW
provide constraints on water depth within these basins
from the Triassic to the present day (see ‘Local sea-level
basins’ column in Fig. 3 and Table 1). No palaeo-water
depth information from biostratigraphy was available for
this study (see above), although the sedimentary succes-
sions present within these basins clearly indicate that
relative sea level has risen consistently since the Triassic;
this resulted in the deposition of marginal marine-to-shal-
low marine sediments in the Early–Middle Jurassic, and
deep water marine sediments in the Late Jurassic, Creta-
ceous and Cenozoic. This overall stratigraphic succession
broadly reflects the general pattern of global (eustatic)
sea-level change during this time (Fig. 3; Haq et al.,1987). An additional important constraint on palaeo-water
depths in the Late Jurassic–Early Cretaceous is provided
by well 6407/7-5, which is located in the south-east of the
Halten Terrace. This well terminates in the Lower Juras-
sic �Are Formation and penetrates a complete Jurassic–Cretaceous stratigraphic succession (Figs 1c and 2). This
suggests that this location was submarine throughout the
Jurassic and Early Cretaceous, although we cannot quan-
tify the water depth from the available well data.
The Frøya High
The Frøya High forms the footwall block to the west-
ward-dipping VFC, which forms the eastern margin of
the Halten Terrace (Fig. 2). The top of the Frøya High is
defined by a flat, very gently westward-dipping surface,
which is ca. 5 km wide. Seismic data indicate that Upper
Cretaceous (Turonian to Coniacian; Kvintos Formation)
strata directly overlie a thin (ca. 10 m), Upper Jurassic
(Beriasian; Spekk Formation) interval across this surface;
the Upper Jurassic interval itself unconformably overlies
a severely truncated, Middle Jurassic (Bathonian; Melke
Formation) succession (Fig. 3). Several wells have been
drilled to the east of the crest of the Frøya High, downdip
of this surface, and they penetrated a more-or-less com-
plete, relatively thick (150–200 m), Middle to Upper
Jurassic succession, which is overlain by Lower Creta-
ceous strata (Fig. 4; Lange Formation, Berriasian–Albian). Downdip to the east of the Frøya High, the
Upper Jurassic succession contains the shallow marine
Rogn Formation, which is absent on the crest of the updip
structure (i.e. in wells 6407/8-4S and 6407/9-9) and
which thickens south–south-eastwards to 40 m (i.e.
6407/9-5, Fig. 4). Well data from 6407/8-4S indicate
that the Rogn Formation was not deposited in the hang-
ing wall of the VFC (Fig. 4). Provan (1992) suggests that
the Rogn Formation was deposited in an offshore sand
bar in a shallow marine environment. These observations
collectively suggest that uplift and broadly eastward tilt-
ing of the Frøya High occurred during the Middle–LateJurassic, and that this resulted in erosion of the upper,
sand-rich part of the Middle Jurassic succession. This
erosion delivered sand to the hanging wall dipslope and
caused the deposition of the fully marine Rogn Formation
in shallow water depths that likely ranged from 0 to
100 m. Flooding of the Frøya High and draping of the
lower Middle Jurassic succession by a thin interval of
deep marine mudstone then occurred during the Late
Jurassic. This was followed by sediment deposition down-
dip of the crest of the Frøya High in the Early Cretaceous,
and eventual flooding of the Frøya High and draping by
deep marine deposits in the Turonian to Coniacian
(Fig. 4).
© 2014 The AuthorsBasin Research © 2014 John Wiley & Sons Ltd, European Association of Geoscientists & Engineers and International Association of Sedimentologists210
R. E. Bell et al.

Not only do these observations provide important
insights into the general tectono-stratigraphic develop-
ment of the Frøya High, but also they provide an excel-
lent palaeobathymetric constraint. More specifically, they
suggest that the Draugen field area, which is located
100 km along MNR07-7135 in the footwall of the VFC
(Fig. 2), and ca. 5 km to the east of the Frøya High ero-
sional unconformity, was in 0–100 m of water in the Late
Jurassic (Table 1). Furthermore, the crest of the Frøya
High must have been submarine by the Turonian–Conia-cian to allow the deposition of deep marine deposits of the
Kvintos Formation (Fig. 4). The lack of sediment deposi-
tion on the Frøya High between the Late Jurassic and
Late Cretaceous (i.e. Berriasian to Turonian/Coniacian)
suggests that it may have been subaerial or close to sea
level at this time. We do not use this inference as a con-
straint in our modelling, but instead investigate if the
Frøya High is restored to be subaerial at this time.
The Sklinna Ridge
The Sklinna Ridge, now buried to a depth of ca. 5 km,
has not been penetrated by boreholes in this area of inter-
est, thus seismic-stratigraphic observations are used to
constrain the likely palaeo-water depth and/or elevation
of this structure through time. The seismic expression of
the Sklinna Ridge is similar to that of the Frøya High; it
too is defined at BCU level by a prominent planar surface,
which is tilted gently to the west (seismic profile MNR07-
7135; Fig. 2). This ca. 16 km wide erosion surface trun-
cates eastward-tilted, Early–Middle Jurassic stratigraphy
(Fig. 2). Due to a lack of well data, it is uncertain if this
erosion occurred in a shallow marine realm in response to
the action of waves and/or tides, and/or if the erosion
occurred subaerially due to fluvial processes.
The eastern margin of the Sklinna Ridge is onlapped
by Early Cretaceous strata (Lange Formation) and the
structure is capped by Turonian to Coniacian age (Kvin-
tos Formation) strata (Fig. 2). This observation provides
another important palaeobathymetric constraint: by at
least ca. 95 Ma, the Sklinna Ridge was submerged
(Table 1; Fig. 3).
SENSITIVITY TESTING
In this study, we attempt to constrain the input parame-
ters for reverse subsidence modelling using observations
from geological and geophysical datasets. Inevitably, there
will still be a significant range in the possible values for
each of these parameters and we have therefore conducted
sensitivity tests to assess the role that each parameter
plays in controlling the restored palaeobathymetry. In this
section, we simply explore what effect variations in each
input parameter have on the restored palaeo-water
depths, without attempting to fit the geological con-
straints described in the section ‘Geological constraints
on palaeo-water depth’. In the section ‘Refining estimates
of crustal input parameters’ we then consider which com-
bination of input parameter values can best recreate a
basin structure that satisfies the water depth constraints
from sedimentological data and seismic-stratigraphic
observations (Table 1).
Parameter 1:Velocitymodel for depthconversion
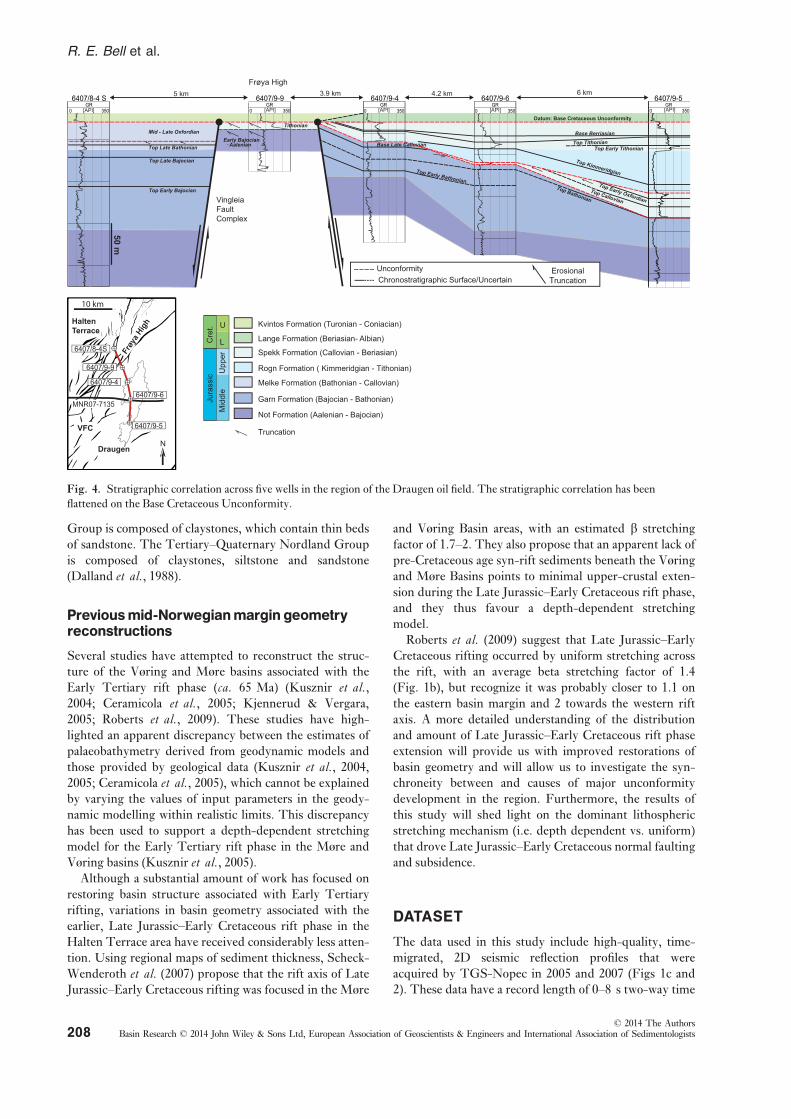
Five wells that contain check-shot data lie within 10 km
of the modelled seismic profile (MNR07-7135; Fig. 1c).
The check-shot data from each of these wells are plotted
in the inset in Fig. 5 and they reveal very similar time-
depth relationships. A best-fit, second-order polynomial
relationship can be fitted to these time-depth curves such
that, for a particular TWT value, the depth in all of the
wells is within 5% of this best-fit polynomial (grey enve-
lope in Fig. 5).
The best-fit, second-order polynomial relationship has
been used to depth-convert our seismic interpretation and
they are shown together with estimates of the likely maxi-
mum and minimum depth to the horizons based on
potential �5% errors (Fig. 5b). Wells 6407/9-3 and
6407/9-6, which lie directly on MNR07-7135, reveal that
the depth conversion produces a very good fit to true
depth data (the best-fit polynomial relationship recreates
the correct depth to within 0–5% error, Fig. 5).
We have reconstructed the Late Jurassic–Early Creta-
ceous palaeobathymetry (i.e. back to the BCU surface)
using the minimum, maximum and preferred depth con-
versions presented in Fig. 5. In this sensitivity test, which
focuses solely on the impact of depth conversion on the
restoration, all other parameters shown in Fig. 6a have
been held constant. For this sensitivity analysis we choose
an arbitrary Te of 3 km, assume that there has been no
thermal subsidence since the creation of the BCU surface,
and that the Top Triassic horizon represents the notional
basement (Fig. 6a).
This model shows that variations in the resulting Late
Jurassic–Early Cretaceous palaeobathymetry due to varia-
tions in our depth conversion approach are minimal. The
depth to the Frøya High and Sklinna High in each of the
three reconstructions is almost identical (<20 m varia-
tion), and although there is some variation in water depth
on the Halten Terrace and in the R�as Basin, these are
<200 m.
We conclude that likely errors introduced into the pal-
aeobathymetry restorations due to inaccuracies in depth
conversion are minimal, particularly in the vicinity of
palaeo structural highs. We select the best-fit second-
order polynomial relationship between time and depth to
produce a preferred depth-converted model that will be
used throughout this study (i.e. Fig. 5a).
Parameter 2:Lithology
The post-rift stratigraphy of the study area has been
divided into six units that are sequentially backstripped in
© 2014 The AuthorsBasin Research © 2014 John Wiley & Sons Ltd, European Association of Geoscientists & Engineers and International Association of Sedimentologists 211
Geologically constrained subsidence modelling
the restoration (Cromer Knoll, lower Shetland, upper
Shetland, Rogaland, Hordaland and Nordland; Figs 2
and 3). The ages of the horizons that bound these units
have been determined from data provided by the Norwe-
gian Petroleum Directorate and are shown in Table 2 and
Fig. 3 (http://www.npd.no/en/).
The lithology of each of the six post-rift units has been
determined from an analysis of gamma ray logs from five
wells located within 10 km of MNR07-7135 (Fig. 1c),
and core descriptions from the Norwegian Petroleum
Directorate (http://www.npd.no/en/) and Dalland et al.(1988). The percentage of sand, shale and limestone in
each unit is summarized in Table 2. Generally, the Ter-
tiary succession is shale-dominated, the Cretaceous sedi-
ments have a small carbonate component that has been
estimated at 10%, and pre-BCU Jurassic and Triassic
sediments have a slightly higher (20%) sand component
(Table 2). Compaction parameters for each of the six
post-rift units with these given lithologies have been cal-
culated using Flex-Decompaction’s sediment properties
calculator, which uses the porosity-depth relationships of
Sclater & Christie (1980).
In addition to these six post-rift units, we have also
interpreted, where possible, seismic horizons that corre-
spond to the tops of the Garn, Not, Ile and �Are forma-
tions; these are used as marker beds, to investigate how
their structure changes during the restoration (Fig. 2).
The Flex-Decompaction software assumes that the
lithology of each sedimentary layer is laterally continuous
across the basin. This software-imposed assumption is
potentially valid in some stratigraphic units, but demon-
strably not valid in others, thus we investigate the sensi-
tivity of the restored Late Jurassic–Early Cretaceous
basin structure to variations in lithology, while keeping all
other parameters constant (Fig. 6b).
Changes in lithology, which vary between 100% sand
and 100% shale, result in 150 m variations in restored
palaeobathymetry in the Frøya High area, and 500 m
variations in the vicinity of the Sklinna Ridge (Fig. 6b);
more specifically, deeper water depths are predicted by a
basin-fill succession that is composed of 100% sand. Well
data indicate that the lithology does not vary laterally by
such large extents across the study area and our preferred
lithology estimates, which are presented in Table 2, result
in a restored Late Jurassic–Early Cretaceous palaeobathy-metry that is very similar to the 100% shale case. Varia-
tions in lithology in the order of 10–20%, which is the
maximum variation permissible from well data along
MNR07-7135, will therefore not introduce significant
variations in restored basin structure and we are confident
that lateral variations in facies will only have a minimal
effect on the restored palaeobathymetry. We use the
lithology information provided in Table 2 throughout the
rest of the study.
Parameter 3:Depth to thenotional basement
The reverse subsidence modelling method requires the
insertion of a notional basement, below which no sedi-
ment compaction occurs. Ideally, the depth to the base-
ment used in the model should be the depth to
crystalline basement; in the southern Halten Terrace,
however, due to a lack of well penetrations, it is not pos-
sible to constrain the depth to top crystalline basement.
There is also no obvious seismic reflection candidate for
the crystalline basement (Fig. 2), however, estimates of
the depth to basement in the region have been provided
by seismic refraction experiments (e.g. Scheck-Wende-
roth et al., 2007; Breivik et al., 2011; Fig. 7a). In the
sensitivity analyses described in ‘Parameter 1: Velocity
model for depth conversion’ and in ‘Parameter 2:
Lithology’ sections we have used the Top Triassic
reflection as the notional basement and have implicitly
assumed that the Triassic strata does not decompact
10 km
1
2
3
4
5
6
7
8
9
Top Triassic
BCU
Top Lange
Top SpringarTop Rogaland
Top Hordaland
Seabed
Dep
th (k
m)
0
TWT (ms)500 1500 2500 3500 4500
1000
2000
3000
4000
5000
6000
Dep
th (m
)
770901.0790581.0055.9 ++−= xxEy 2
6407/9-36407/9-6
6407/7-56407/7-26408/8-1
W EDraugen
10080604020 120
Distance along profile (km)
R2=0.9981
0
Best fit time-depth relationshipBest fit time-depth relationship + 5%
Best fit time-depth relationship - 5% Likely range of horizon depthsdue to errors in depth conversion
(a)
(b)
Fig. 5. (a) Check-shot information for five wells within 10 km of seismic profile MNR07-7135 (see Fig. 1c for location). The depth-
time relationships for each of these wells are very similar and a best-fit second-order polynomial curve can be constructed through the
data. All time-depth information from these wells can be fit within 5% of this best-fit curve. (b) Each of the eight interpreted horizons
in this study have been depth converted three times using the best-fit second-order polynomial relationship, and relationships where
depths deviate by +5% and -5% from this best-fit polynomial. This gives maximum and minimum bounds on the likely depth to the
horizon. Only seven horizons are shown here for clarity in this figure.
© 2014 The AuthorsBasin Research © 2014 John Wiley & Sons Ltd, European Association of Geoscientists & Engineers and International Association of Sedimentologists212
R. E. Bell et al.

during reverse-basin modelling. In this subsection, we
explore what influence the depth to the notional base-
ment has on the restored Late Jurassic–Early Cretaceous
basin geometry by testing notional basements defined by
the Top Triassic, and also notional top basement depths
located 1 km, 2 km and 3 km deeper than our assumed
Top Triassic reflection. The properties of Triassic
sediments used in these reconstructions are shown in
Table 2.
Deeper notional basements result in shallower recon-
structed palaeo-water depths, due to the decompaction of
the Triassic succession. Although the difference in recon-
structed palaeo-water depths resulting from a 0 m thick
and a 1 km thick Triassic succession are up to 250 m, the
difference in reconstructed palaeo-water depths for a
2 km and 3 km thick Triassic succession is less (<100 m;
Fig. 6C).
Although seismic data alone do not allow us to con-
strain the thickness of Triassic sediments in the southern
Halten Terrace region, well 6407/10-3 (Fig. 1) indicates
that a 1.1 km thick Triassic succession is present above a
granitic basement. Well 6507/12-2, which is located fur-
ther to the north on the Trøndelag Platform, penetrates a
Triassic succession that is at least 2.4 km thick. Seismic
refraction studies suggest the basement depth in the
Halten Terrace and R�as Basin could vary from 7–15 km,
leading to Triassic sediment thicknesses of 2 km in the
Halten Terrace, and potentially as great as 5 km in the
R�as Basin (Breivik et al., 2011; compare Fig. 7a and the
interpretation presented in Fig. 5b). In our restorations
of basin geometry, in the section ‘Refining estimates of
crustal input parameters’ we opt for a notional basement
depth 2 km beneath the Top Triassic horizon (i.e.
Triassic stratigraphic thickness of 2 km), although we are
Best-fit 2nd order polynomialBest-fit 2nd order polynomial + 5% depthBest-fit 2nd order polynomial - 5% depth
100% sand100% shale50% sand, 50% shaleLithology from Table 2
Te = 0 kmTe = 1.5 kmTe = 3 kmTe = 10 km
β determined from crustal thinning (Fig. 7)β determined from fault heave (Fig. 7)β profile D (Fig. 7)
0.0
1.0
2.0
3.0
0.0
1.0
2.0
3.0
0.0
1.0
2.0
3.0
0.0
1.0
2.0
3.0
0 20 40 60 80 100 120 140
Dep
th b
elow
sea
leve
l (km
)D
epth
bel
ow s
ea le
vel (
km)
Dep
th b
elow
sea
leve
l (km
)D
epth
bel
ow s
ea le
vel (
km)
Distance along MNR07-7135 (km)
Draugen
−1.0(a)
(b)
(c)
(d)
(e)
Depth conversion = variableLithology = from Table 2Depth to notional basement = Top TriassicTe = 3 kmRift history= no rift event
Depth conversion = best-fit 2nd order polynomialLithology = variableDepth to notional basement = Top TriassicTe = 3 kmRift history= no rift event
Depth conversion = best-fit 2nd order polynomialLithology = from Table 2Depth to notional basement = Top TriassicTe = variableRift history= no rift event
Depth conversion = best-fit 2nd order polynomialLithology = from Table 2Depth to notional basement = Top TriassicTe = 3 kmRift history= variable
Sklinna Ridge Halten TerraceRås Basin Frøya High Trøndelag Platform
VFCKFC
W E
0.0
1.0
2.0
3.0
Dep
th b
elow
sea
leve
l (km
)
Top Triassic Top Triassic + 1 km Top Triassic + 2 km Top Triassic + 3 km
Depth conversion = best-fit 2nd order polynomialLithology = variableDepth to notional basement = variableTe = 3 kmRift history= no rift event
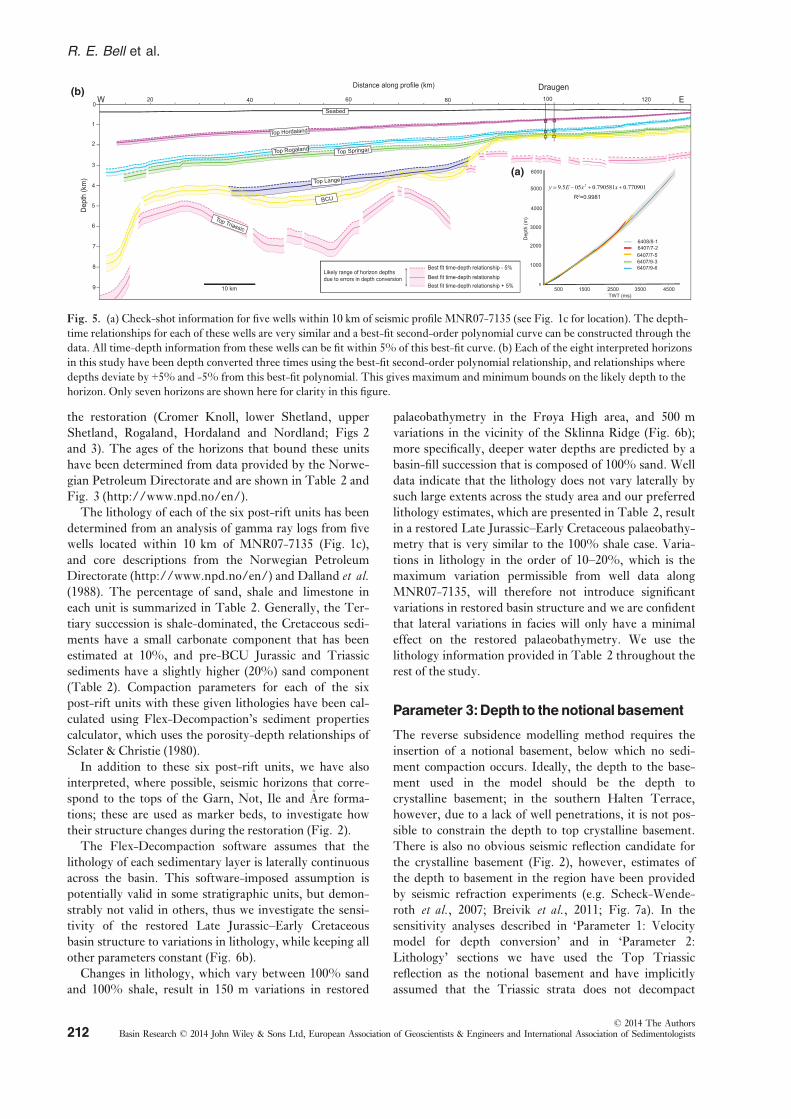
Fig. 6. (a) Sensitivity test to investigate
the effect that the use of maximum, mini-
mum or best-fit depth-conversion rela-
tionships (presented in Fig. 5) has on the
restored Late Jurassic–Early Cretaceoussea floor geometry. All other parameters
are held constant and are described
within Fig. 6a. Sensitivity tests to inves-
tigate the effect (b) lithology, (c) depth to
notional basement, (d) effective elastic
thickness (Te), and (e) lithospheric
stretching factor (b) have on recon-structed Late Jurassic–Early Cretaceoussea floor geometry. VFC, Vingleia Fault
Complex, KFC, Klakk Fault Complex.
© 2014 The AuthorsBasin Research © 2014 John Wiley & Sons Ltd, European Association of Geoscientists & Engineers and International Association of Sedimentologists 213
Geologically constrained subsidence modelling

aware that errors in reconstructed palaeo-water depth, of
the order of 100 m, may occur due to unknown Triassic
sediment thickness.
Parameter 4:Effective elastic thickness
The strength of the lithosphere controls how much iso-
static rebound will occur as the result of the removal of a
sediment load. The flexural-isostatic response of the lith-
osphere is determined by the flexural rigidity, which is
commonly expressed as the effective elastic thickness or
Te (Watts, 1992, 2001). If the lithosphere has zero or little
strength (Te < 5 km) loads are supported locally (Airy
isostasy), whereas if the lithosphere is strong (Te > 5 km)
loads are supported regionally over longer wavelengths
(Watts, 1992, 2001).
The long-term strength of extended continental litho-
sphere remains controversial. Some studies have sug-
gested that extended continental crust is weakened
during rifting, and remains weak after rifting (e.g.
Watts, 1992). Other studies suggest that the lithosphere
may regain its strength after rifting (e.g. England, 1983;
Bertotti et al., 1997; Manatschal & Bernoulli, 1999; van
Wijk & Cloetingh, 2002; Close et al., 2009). We may
therefore expect Te to vary laterally between the rift axis
and margin (e.g. Watts, 1992; Bertotti et al., 1997; Re-emst & Cloetingh, 2000; P�erez-Gussiny�e et al., 2009;
Ferraccioli et al., 2011), and also with time (e.g. Eng-
land, 1983; Karner et al., 1983; Karner & Watts, 1983;
e.g. Bertotti et al., 1997; Manatschal & Bernoulli, 1999;
van Wijk & Cloetingh, 2002; Close et al., 2009). Elasticthickness is typically calculated using two methods:
i) forward modelling of lithospheric deformation using
geological and gravity data (e.g. Karner & Watts, 1983;
Stewart & Watts, 1997); and ii) determining the ‘coher-
ence function’ by cross-correlating topography and grav-
ity (e.g. McKenzie, 2003; P�erez-Gussiny�e et al., 2004).These two methods have been found to give very differ-
ent estimates of the elastic thickness for the same mar-
gin (reviewed by Sacek & Ussami, 2009).
The elastic thickness in the vicinity of the Vøring and
Møre basins is often taken as a low but finite value of
1–5 km (e.g. Roberts et al., 1998, 2009; Ceramicola et al.,2005), which is based on 2D forward flexural-cantilever
modelling (Kusznir et al., 2005). Roberts et al. (2009)
justify the use of a low Te value even when considering
the restoration of Tertiary stratigraphy, because the wave-
length of Tertiary sediment loads in the Vøring Basin is
large and shows little sensitivity to Te. Reynisson et al.(2010), in contrast, through the use of forward gravity
modelling, determine that a Te of 5 km during rifting,
increasing to 25 km during the Tertiary post-rift period,
is more appropriate to recreate the structure of the mid-
Norwegian margin. Reemst & Cloetingh (2000) have also
argued for higher values of Te in the Vøring and Møre
basin areas, opting to use a value of Te equal to the depth
to the 400 °C isotherm (ranging from 10 to 35 km),
following the work of van der Beek et al. (1994). van der
Beek (1997) argues that flexural-cantilever models will
underestimate Te, and pure-shear necking and pure-
shear/simple-shear detachment models are therefore
more appropriate to estimate Te.
Variations in the value of Te used in the reverse subsi-
dence modelling impact reconstructed palaeo-water
Table 2. Summary of lithological parameters used in flexural backstripping
Horizon
age (Ma) Horizon name Unit name Lithology
Near-surface
porosity (%)
Decay constant
(1/km)
Matrix
density (g/cc)
0 Seabed
Nordland Group 90% Shale
10% Sand
61.6 0.49 2.71
~20 Top Hordaland
Hordaland Group 100% Shale 63 0.51 2.72
~55 Top Rogaland
Rogaland Group 100% Shale 63 0.51 2.72
~65 Top Springar
Upper Shetland Group 90% Shale
10% Limest
63.7 0.53 2.72
~88 Mid-Kvintos
Lower Shetland Group 90% Shale
10% Limest
63.7 0.53 2.72
~95 Top Lange
Cromer Knoll 90% Shale
10% Limest
63.7 0.53 2.72
~140 Base Cretaceous Unconformity
Jurassic 80% Shale
20% Sand
60.2 0.46 2.71
~200~250
Top Triassic
Notional Basement
Triassic 80% Shale
20% Sand
60.2 0.46 2.71
© 2014 The AuthorsBasin Research © 2014 John Wiley & Sons Ltd, European Association of Geoscientists & Engineers and International Association of Sedimentologists214
R. E. Bell et al.

depths significantly (Fig. 6d). Low values of Te
(0–1.5 km) effectively ‘iron-out’ relief on the buried hori-
zons when the palaeobathymetry is restored; for example,
the Halten Terrace is defined by a westward-dipping
slope and the relief of the Sklinna Ridge and Frøya High
are eliminated (Fig. 6d). This restoration clearly does not
fit the seismic-stratigraphic observation that Early Creta-
ceous sediments onlap against the Sklinna Ridge, indicat-
ing significant topography must have existed in the Early
Cretaceous (Fig. 2).
Larger values of Te (>5 km) produce restored palaeo-
bathymetry that maintains the rift-related relief and indi-
cate that the Frøya High and Sklinna Ridge were
significant, positive structural features in the Late Juras-
sic–Early Cretaceous (Fig. 6d). When a Te of 10 km is
applied, the Sklinna Ridge and Frøya High are restored to
the same elevation. Despite the controversy regarding the
correct elastic thickness to use along the Norwegian mar-
gin, our initial sensitivity testing suggests higher Te values
(>5 km) may be more appropriate for Late Jurassic–EarlyCretaceous palaeobathymetry restorations in the Halten
Terrace.
Parameter 5:Stretchinghistory
The southern Halten Terrace experienced rifting in the
Permo-Triassic and Late Jurassic–Early Cretaceous, and
there is no evidence for active faulting during the Tertiary
(e.g. Blystad et al., 1995; Dor�e et al., 1997). Both the
Permo–Triassic and Late Jurassic–Early Cretaceous rift
episodes would have been followed by periods of thermal
subsidence. Thermal subsidence, as defined by McKenzie
(1978), decays as the rift cools, in an exponential manner
with a time constant of ca. 65 Myr. This means that ther-
mal subsidence occurs during the ca. 150–200 Myr after
the cessation of rifting. The timing of initiation and the
duration of the Permo–Triassic rift episode is still contro-versial, although Reemst & Cloetingh (2000) suggest it
began in the Early Permian (290 Ma) and ended in the
Late Triassic (235 Ma). Therefore, depending on when
the major phase of rifting ended there has been a duration
of 95–150 Myr between the end of the Permo–Triassicand the onset of the Late Jurassic–Early Cretaceous rift
phase. In this case, the magnitude of thermal subsidence
due to Permo–Triassic rifting at the onset of Late Juras-
sic–Early Cretaceous rifting 140 Ma may be negligible to
moderate. The amount of stretching that occurred during
the Permo–Triassic is difficult to directly determine
within the study area because Permian and Triassic strata
are too deep to be well imaged; this problem becomes
even more significant further west, towards the rift axis,
where these units are even more deeply buried. In our
reconstructions, we therefore ignore the effects of thermal
subsidence related to the earlier Permo-Triassic rift phase
on the overall amount of Late Jurassic–Early Cretaceous
subsidence, however, we consider the implications of this
assumption further in the section ‘Refining estimates of
crustal input parameters’.
To apply the appropriate thermal correction in our res-
toration, the amount of stretching that occurred in the
Late Jurassic–Early Cretaceous rift phase must be quanti-
fied, and expressed in terms of the b stretching factor
(McKenzie, 1978). Extension may be quantified in three
ways: i) upper-crustal extension from faulting; ii) whole-
crustal extension from crustal thinning; and iii) litho-
spheric extension from post-rift thermal subsidence
(reviewed in Bell et al., 2011). Calculating extension from
the degree of post-rift thermal subsidence assumes that
the palaeobathymetry is known. In our case, this is the
parameter we are attempting to restore, thus we do not
apply method (iii).
Upper-crustal extension can be estimated by summing
fault heave, which assumes that all upper-crustal
0 50 100 150
1
2
β
W EDistance along model profile (km)
β from crustal thinning
β from fault heave + 25, 40 and 60% for sub-seismic scale faulting
Sklinna Ridge Halten TerraceRås Basin Frøya High Trøndelag Platform
VFCKFC
FE
D
C
B
A
–35
–30
–25
–20
–15
–10
–5
Dep
th (k
m)
0 50 100 150 200 250 300Distance (km)
Loca
tion
of th
e B
rem
stei
n Fa
ult C
ompl
ex
Basement
Moho
Crust
0
1
2
3
4
5
6
Froan BasinBFC
Halten TerraceRås Basin
KFC
0
β
β from crustal thinning
(a)
(b)
extent of profile shown in 7b
Fig. 7. (a) Basement and Moho depth along profile 3-03 from
Breivik et al. (2011) (see Fig. 1a for location). The b profile
displayed has been calculated assuming an initial crustal thick-
ness of 35 km. KFC, Klakk Fault complex, BFC, Bremstein
Fault Complex. (b) Summary of the b profiles determined from
a measure of crustal thickness and fault heave along
MNR07-7135 (see text for details). The dashed, dotted and solid
grey lines show b profiles calculated from fault heave plus an
extra 25, 40 and 60% extension, respectively, to account for
sub-seismic deformation. KFC, Klakk Fault Complex, VFC,
Vingleia Fault Complex.
© 2014 The AuthorsBasin Research © 2014 John Wiley & Sons Ltd, European Association of Geoscientists & Engineers and International Association of Sedimentologists 215
Geologically constrained subsidence modelling

extension is accommodated on planar faults that are
observed in the seismic section. Due to the difficulty in
picking fault planes and hence constraining fault dips on
seismic sections, it is typically more accurate to measure
vertical throw from seismic sections and assess fault heave
for a range of fault dips (Lamarche et al., 2006; Bell et al.,2011). Using this method, the extension related to differ-
ent rift episodes can be isolated, by only considering
throw related to the rift event of interest.
In this study, we have measured throw on each of the
major faults offsetting the Top Triassic horizon (Fig. 2)
and these values are presented in Table 3. Using a range
of fault dips (40–60°) we calculate minimum and maxi-
mum estimates of fault heave from these throw values,
which provide extension estimates of 5–11 km. These
estimates, however, do not include sub-seismic scale
faulting, which may add as much as an additional 25–60%to estimates of extension (Marrett & Allmendinger,
1992). If this extra 25–60% extension is applied to the
heave values we have determined, this provides a revised
estimate of 6.25–17.6 km for upper-crustal extension. We
convert our estimates of fault heave to a b profile using
Badley Geoscience Ltd’s forward modelling software
‘Stretch’, which allows the heave on individual faults to
be input and pure-shear stretching envelopes for each
fault to be summed to create a b profile (Roberts et al.,2009). This has been conducted for the maximum fault
heave values (based on the assumption of 40° fault dip,
deemed favourable from depth conversion in Fig. 5) plus
25%, 40% and 60% extra extension, uniformly distrib-
uted along the profile to account for sub-seismic deforma-
tion. This results in b profiles ranging from b = ~1 on
the Trøndelag Platform, to b = ~1.2 in the R�as Basin
(Table 3 and Fig. 7b). The addition of 25%, 40% and
60% additional extension results in variations in the bprofiles of only�0.03 (Fig. 7b).
Total crustal extension can also be derived from the
magnitude of crustal thinning. Crustal thinning-derived
estimates of extension will, however, provide the cumula-
tive extension for all the rift episodes that have occurred
since basin formation started. In the case of the Halten
Terrace, crustal thinning is a function of the cumulative
effects of the Devonian, Permo–Triassic, Jurassic and,
potentially, Tertiary rift events. b stretching factors
determined from crustal thinning will therefore be an
overestimate for the amount of rifting that was exclusively
associated with the Late Jurassic–Early Cretaceous rift
phase.
Crustal structure studies across the Halten Terrace
have used seismic and potential field data, and have inter-
preted the depth to the basement and Moho along profiles
close to MNR07-7135 (Breivik et al., 2011; Fig. 7a). Byassuming an initial crustal thickness of 35 km, the crustal
thickness across profile 3-03 can be used to determine a bprofile across the Halten Terrace (Fig. 7a). This b profile
ranges from values of 1 on the eastern margin to 6 in the
western R�as Basin. The VFC occurs around 185 km
along profile 3-03 and, if we position profile MNR07-
7135 with the VFC at the same location, we can use these
data to provide another estimate of b along our line of sec-
tion (Fig. 7b). We expect this b profile to overestimate
the amount of stretching that occurred in the Late Juras-
sic–Early Cretaceous rift event; this profile, therefore,
represents maximum b values.
The fault heave and crustal thickness derived b profiles
have both been used to reconstruct palaeobathymetry,
using the assumption that the Late Jurassic–Early Creta-
ceous rift event ended at ca. 140 Ma (Roberts et al., 2009;Fig. 6e). These reconstructions, which now correct for
thermal subsidence, restore the Frøya High to water
depths of 100–200 m and come closer to fitting one of our
key geological constraints (Table 1). The restoration that
uses the b profile derived from crustal thinning predicts
that the Sklinna Ridge was subaerial in the Late Jurassic–Early Cretaceous by 400 m above sea level. In contrast,
the restoration that uses the b profile derived from fault
heave predicts that the Sklinna Ridge would have been
submarine in the Late Jurassic–Early Cretaceous in water
depths of 300 m.
The preceding sensitivity analysis has demonstrated
that uncertainty in velocity and lithology values deter-
mined from well data will not introduce large variations in
the restored palaeo- water depths (Fig. 6a, b). The uncer-
tainty in the thickness of Triassic sediments will likely
introduce errors in the range of �100 m. Although we
have been able to constrain a maximum and likely mini-
mum estimate of b stretching factor across MNR07-7135,
the variation in restored Late Jurassic–Early Cretaceous
palaeo water depths for this range of b values is significant
(up to 350 m variation), and allows the Sklinna Ridge to
be submarine or subaerial in the Late Jurassic–EarlyCretaceous for the same estimate of Te (Fig. 6e). The use
of crustal thickness- or fault heave-determined b profiles
results in differences in the restored Late Jurassic depth
to the Frøya High of 200 m. Most significantly, estimates
of Te are not well constrained in the Halten Terrace and
this results in extreme variability in restored Late
Jurassic–Early Cretaceous basin geometry (Fig. 6d).
Therefore, Te and b stretching factor are still relatively
poorly constrained and require further refinement.
Table 3. Summary of fault throw and heave values across the
Top Triassic reflector for the numbered faults in Fig. 2
Fault
number Throw (m)
Max. Heave
for 40o
faults (m)
Min. Heave
for 60°faults (m)
1 222 265 128
2 270 321 156
3 3320 3957 1917
4 263 313 152
5 421 502 243
6 500 596 289
7 4434 5285 2560
Total heave 11239 5445
Total heave + 40% 15734 7623
© 2014 The AuthorsBasin Research © 2014 John Wiley & Sons Ltd, European Association of Geoscientists & Engineers and International Association of Sedimentologists216
R. E. Bell et al.

REFINING ESTIMATESOF CRUSTALINPUT PARAMETERS
In this section, we consider which pairings of Te and bprofile can restore palaeo-water depths to meet our key
geological constraints (Table 1), namely: i) the Draugen
field area must have resided in 0–100 m water depth in
the Late Jurassic–Early Cretaceous (ca. 140 Ma); ii) the
Sklinna Ridge was submarine in the Early Cretaceous (ca.95 Ma); and iii) the site of well 6407/7-5 must have been
submarine at ca. 140 Myr. Combinations of Te and b pro-
file that do not restore palaeo-water depths to meet these
criteria can be disregarded. We then attempt to refine our
parameter estimates further by considering the other ‘sec-
ondary’ water depth constraints shown in Table 1. We
have performed 54 reverse subsidence models for various
combinations of Te and b profile values. In our analysis
we have varied Te from 1 to 25 km, and we have used six
b profiles that follow the trend but lie within of the b pro-
file ‘envelope’ derived from fault heave and crustal thin-
ning (Fig. 7b).
Figure 8a shows the restored water depth for the Drau-
gen area (100 km along MNR07-7135) at ca. 140 Ma
(backstripped to the BCU) for each of the 54 b profile and
Te pairings. Only b and Te pairs that can restore the
Draugen area to within 0–100 m water depth are permis-
sible. This geological constraint significantly reduces the
possible combinations of b and Te values to those that fall
between the 0 and 100 m water depth contours (bound by
thick lines in Fig. 8a). The fact that we have identified
other palaeo-water depth constraints (Table 1) means
that we can attempt to constrain b and Te values further
still. Figure 8b shows the shallowest restored depth of the
Sklinna Ridge in the Turonian (ca. 95 Ma) and Fig. 8c
shows the depth to the site of well 6407/7-5 (73 km along
the profile, west of the VFC, Fig. 2) in the latest Jurassic
(ca. 140 Ma). Only b and Te pairings that can restore the
Sklinna Ridge and well site 6407/7-5 so that they are sub-
marine during these time periods are permissible (area
below the thick lines in Fig. 8b, c).
Only Te and b combinations that satisfy all of these pri-
mary geological constraints are permissable, thus by com-
bining the results presented in Fig. 8a–c we have
drastically reduced the range of possible Te and b values;
Te values can only range between 3 and 13 km, and the
true b profile must lie between D–F. The possible rangeof Late Jurassic–Early Cretaceous basin geometries and,
more specifically, water depths that are produced by this
range of parameter values, are presented in Fig. 9. All of
these parameter combinations also satisfy the constraints
on Halten Terrace basin water depth from the Late Juras-
sic to the present day (see Table 1). We find that all resto-
rations using permissible combinations of Te and bindicate that the Sklinna Ridge was subaerial during the
Late Jurassic–Early Cretaceous.The range of Te and b parameter values that satisfy
constraints 1, 2 and 3 all produce similar elevations of
the Frøya High and Sklinna Ridge, although in detail
they vary in the extent to which the Sklinna Ridge was
subaerial. The Sklinna Ridge unconformity ca. 16 km
wide (Fig. 2), suggesting that the Sklinna Ridge was
exposed to prolonged subaerial erosion processes only
over an extent of ca. 16 km at this location. We, there-
fore, may have more confidence in b profile and Te
parameter pairings that uplift the Sklinna Ridge such
that it was only subaerial over a width of around 16 km
(Table 1). Figure 10a illustrates the width of the Skl-
inna Ridge that was shallower than 50 m below sea level
(effectively subaerial or exposed to wave-base erosion
processes) for the total range of Te and b pairings. The
application of this constraint further restricts the possi-
ble range of Te and b pairings to Te values between 4
B
C
D
E
F
Water depth in Draugen area ~140 Ma (km)
Te
β pr
ofile
(Fig
. 7)
Incr
easi
ng s
tretc
hing
0 10 20 Te
Depth of Sklinna Ridge by ~95 Ma (km)
Increasing lithosphere strength Increasing lithosphere strength
Incr
easi
ng s
tretc
hing
A
B
C
D
E
F
A
(a) (b)
subaerialsubmarine
0 10 20
Constraint 1: Draugen field area must be in 0 - 100 m water depth ~140 Ma
Constraint 2: The Sklinna Ridge must be submarine by ~95 Ma
subaerialsubmarine
−0.7−0.6
−0.5
−0.4
−0.3−0.2
−0.1
0
−0.2
−0.1
0
0
0.1
0.1
0.2
0.2
0.3
0.3
0.4
2 4 6 8 10 12 14 16 18 20 22 24
(c)
B
C
D
E
F
A
Te
Incr
easi
ng s
tretc
hing
Increasing lithosphere strength
β pr
ofile
(Fig
. 7)
0 10 20
Constraint 3: Well site 6407/7-5 must besubmarine ~140 Myr
Water depth in well site 6407/7-5 ~140 Ma (km)
subaerialsubmarine
−0.1
0
0
0.1
0.1
0.2
0.2
0.3
0.4
0.5
0.6 0.4 0.2 0.0 –0.2 –0.4 –0.6 0.8 0.6 0.4 0.2 0 –0.2 –0.40.6 0.4 0.2 0 –0.2 –0.4 –0.6
Fig. 8. (a) Restored Late Jurassic (ca. 140 Ma) water depth in the Draugen oil field area, (b) shallowest depth of the Sklinna Ridge in
the Early Cretaceous (ca. 95 Ma) and (c) restored Late Jurassic (ca. 140 Myr) water depth at the location of well 6407/7-5. In all of
these reconstructions the preferred time-depth relationship presented in Fig. 5 has been used for depth conversion, the lithology
values provided in Table 2 and a notional basement 2 km below the Top Triassic horizon.
© 2014 The AuthorsBasin Research © 2014 John Wiley & Sons Ltd, European Association of Geoscientists & Engineers and International Association of Sedimentologists 217
Geologically constrained subsidence modelling

and 9 km and b profiles E and F (hatched area in
Fig. 10b). We suggest that a Te of 8 km and b profile F
may be the most representative of the true values of
these crustal parameters, as these parameters bring the
subaerial width of the Sklinna Ridge closest to 16 km
(Fig. 10b). However, we stress that this study only con-
siders the elastic thickness of the rift in the Halten Ter-
race region, and the Te values suggested from our
analysis will likely only be appropriate for the rift mar-
gin area. The full restoration for Te = 8 km and b pro-
file F is shown in Fig. 11.
In this study, we have interrogated the key parameters
that are required for reverse subsidence modelling of
time-migrated seismic reflection data: velocity, lithology,
depth to notional basement, Te and b. Using four geologi-
cal constraints on palaeo-water depth we have been able
to constrain a preferred set of b and Te values, which,
although non-unique, all do result in basin restorations
which have similar geometries (Fig. 9). There are, how-
ever, a number of parameters that could plausibly impact
the restoration but have not been fully explored in this
study, these are: i) the choice of eustatic sea-level curve,
−1.0
0.0
1.0
2.0
3.0
0 20 40 60 80 100 120 140
β profile D, Te = 3 kmβ profile E, Te = 6 kmβ profile F, Te = 7 km
Dep
th b
elow
sea
leve
l (km
)
Distance along MNR07-7135 (km)
Depth conversion = best-fit 2nd order polynomialLithology = from Table 2Depth to notional basement = 2 km below Top TriassicTe = variableRift history= variable
Sklinna ridgeFrøya high
β profile F, Te = 13 km
Fig. 9. Reconstructed Late Jurassic–Early Cretaceous (ca. 140 Ma) seafloor
geometries for the full range of possible
Te and b profile values that satisfy geo-
logical constraints 1, 2 and 3 (from
Fig. 8).
30
22
24
26
28
3030
Increasing lithosphere strength
Incr
easi
ng s
tretc
hing
0 10 20
Constraint 1 satisfied
Constraint 2 satisfied
Constraint 3 satisfied
Constraint 4 satisfied
Constraints 1,2 & 3 satisfied
Constraints 1,2,3& 4 satisfied
Width of Sklinna Ridge shallower than 50 m b.s.l by ~140 Ma (km)
2 4 6 8 10 12 14 16 18 20 22 24
(a)
B
C
D
E
F
A
Te
Incr
easi
ng s
tretc
hing
Increasing lithosphere strength
β pr
ofile
(Fig
. 7)
0 10 20
Constraint 4: The width of the Sklinna Ridge thatis subaerial ~96 Ma must be between 16 - 20 km
0 4 8 12 16 20 24 28 32
(b)
Fig 10. (a) Width of the Sklinna Ridge that is subaerial in the Late Jurassic (ca. 140 Ma), for various combinations of Te and bprofile.(b) The Te and b combinations that satisfy each of the geological constraints presented in Fig. 8 are shaded. The pink, blue,
yellow and green areas show the range of Te and b profiles where constraints 1, 2, 3 and 4 are satisfied respectively. The region marked
with diagonal lines indicates parameter pairings that can satisfy constraints 1, 2 and 3, and the hatched area shows parameter values
that are capable of satisfying all four of the geological constraints.
© 2014 The AuthorsBasin Research © 2014 John Wiley & Sons Ltd, European Association of Geoscientists & Engineers and International Association of Sedimentologists218
R. E. Bell et al.

ii) the effect of Permo-Triassic thermal subsidence and
iii) the role of erosion.
M€uller et al. (2008) review a number of sea-level
curves generated using a range of methods. Their com-
parison reveals that the Haq et al. (1987) curve, which we
used in this study, generally predicts higher sea level than
many other curves by as much as ca. 200 m (c.f. Miller
et al., 2005). If the global eustatic sea level during the
Late Jurassic–Early Cretaceous (140 Ma) was lower than
that suggested by Haq et al. (1987), this would mean
lower Te values and lower b factors would be required to
restore the Draugen area to a water depth of 0–100 m
(Fig. 8a). However, this study has shown that a b profile
derived from fault heave observed on seismic profiles,
plus an additional 25% to account for sub-seismic defor-
mation (i.e. b profile F), can restore the Draugen area to
the correct depth. We cannot have less stretching across
the area than that observed on seismic sections, therefore
it may be unlikely that sea level in the Late Jurassic–Early
Cretaceous was much less than that suggested by Haq
et al. (1987).In the restoration presented here it has been assumed
that thermal subsidence following the Permo–Triassic riftphase by 140 Ma was negligible. However, if a compo-
nent of thermal subsidence from this earlier rift phase did
still affect the Halten Terrace during the Late Jurassic–Early Cretaceous, our estimates of b would be an overesti-
mate, simply because some of the subsidence we are mod-
elling and attributing to the Late Jurassic–EarlyCretaceous rift phase is actually driven by thermal subsi-
dence from the earlier rift phase. Again, due to the fact we
already only require extension observed on post-Triassic
faults plus 25% for sub-seismic deformation; that is bprofile F to restore the area to the correct depth at this
time, may indicate that thermal subsidence following the
Permo–Triassic rift phase was indeed negligible.Finally, Cenozoic strata along the eastern basin margin
have been partly eroded (Fig. 2), and the true magnitude
0
2
4
6
8
10
Dep
th (k
m)
–2
0 20W
40 60Distance (km)
80 100 120E
Sklinna Ridge Halten TerraceRås Basin Frøya High Trøndelag Platform
VFCKFC
Jurassic
Cromer KnollLower Shetland GroupUpper Shetland Group
Hordaland GroupNordland Group
0 Ma
0
2
4
6
8
10
Dep
th (k
m)
–2
~65 Ma
0
2
4
6
8
10
Dep
th (k
m)
–2
~95 Ma
Lower Cretaceous sediments deposited in deep marine conditionsSklinna Ridge submarine
Dep
th (k
m)
–2
0
2
4
6
8
10 ~140 Ma
Upper Cretaceous sediments deposited in deep marine conditions in basins and above palaeo-structrual highs
Draugen area in shallowmarine conditions (20 m)
Triassic
Notional basement
VFCKFC
VFCKFC
VFCKFC
VFCKFC
(a)
(b)
(c)
(d)
Ther
mal
Subs
iden
ce(k
m)
00.20.40.6
Ther
mal
Subs
iden
ce(k
m)
00.20.40.6
Ther
mal
Subs
iden
ce(k
m)
00.20.40.6
Thermal subsidence between 65 - 0 Ma
Thermal subsidence between 95 - 65 Ma
Thermal subsidence between 140 - 95 Ma
water
Fig. 11. Restoration of line MNR07-
7135 back to the Late Jurassic–EarlyCretaceous syn-rift geometry using the
preferred reverse subsidence modelling
input parameters described in the text. In
this restoration the best-fit polynomial
relationship has been used for depth
conversion (Fig. 5), and the lithology
information derived from wells described
in Table 2 is used. A Te value of 8 km
and b profile F, which increases from 1 to
1.2 from east to west across the profile
has been applied (Fig. 8e). KFC, Klakk
Fault Complex, VFC, Vingleia Fault
Complex. The inset graphs in Fig. 11a, b
and c show the magnitude of thermal
subsidence during the period
140–95 Ma, 95–65 Ma and 65–0 Ma
respectively. See Fig. 3 for legend of
stratigraphic units.
© 2014 The AuthorsBasin Research © 2014 John Wiley & Sons Ltd, European Association of Geoscientists & Engineers and International Association of Sedimentologists 219
Geologically constrained subsidence modelling

of subsidence at the eastern end of the model may have
therefore been underestimated (i.e. subsidence associated
with this now-missing load has not been taken into
account). Therefore, the estimates of b at the eastern end
of the modelled profile should be considered as minimum
values.
INTERPRETATION AND DISCUSSION
HaltenTerrace rift-basin geometry since theLate Jurassic
Figure 11 shows the full basin structure reconstruction
for seismic profile MNR07-7135 based on our preferred
parameter values of Te 8 km and b profile F. This restora-
tion satisfies all of the palaeo-water depth constraints that
have been derived from sedimentological and seismic-
stratigraphic methods (Table 1).
Rift Geometry ca. 140 Ma
The restoration indicates that, at the end of the Late
Jurassic–Early Cretaceous rift phase, the Sklinna Ridge
and Frøya High were both subaerial footwall islands,
confirming that the high-amplitude, planar reflections
observed in the footwalls of the Vingleia and Klakk Fault
systems are likely the result of subaerial erosion
(Fig. 11a). The restorations also suggest that the Sklinna
Ridge may have reached a greater elevation (i.e. above sea
level) than the Frøya High. At this time, the footwall
islands represented by the Sklinna Ridge and Frøya High
were surrounded by marine basins that had maximum
water depths of 1–2 km (Fig. 11a).
Rift Geometry ca. 95 Ma
In the Early Cretaceous (ca. 95 Ma), the Sklinna Ridge
and Frøya High were located at water depths of 0.2–0.25 km due to post-rift thermal subsidence following the
Late Jurassic–Early Cretaceous rift phase (Fig. 11b). Sed-iment deposition at this time was still restricted to isolated
depocentres between the footwall islands, which were
sites of non-deposition and/or erosion.
Rift Geometry ca. 65 Ma
By the end of the Cretaceous (ca. 65 Ma), the Sklinna
Ridge was buried by sediments and the R�as Basin,
Sklinna Ridge and Halten Terrace area had become a
single, interconnected depocentre (Fig. 11c). Due to the
eastward decrease in thermal subsidence caused by
lower levels of precursor, rift-related extension to the
east, the Frøya High was not flooded and buried until
the Coniacian (Fig. 11c). At this time, the entire south-
ern Halten Terrace became a single depocentre and Late
Cretaceous sediments were deposited in water depths of
1–1.5 km (Fig. 11c). This confirms the hypothesis
presented in a number of publications that Cretaceous
sedimentation in this area occurred in a deep marine
environment (Færseth & Lien, 2002; Scheck-Wenderoth
et al., 2007).
Rift Geometry 0 Ma
Despite the fact that the Sklinna Ridge is currently buried
>2 km deeper than the Frøya High (Fig. 11d), our recon-
structions indicate that, at the end of the Late Jurassic–Early Cretaceous rift event, they were at similar elevations
and were both subaerially exposed (Figs 9 and 11). This
is due, primarily, to the greater levels of post-rift thermal
subsidence that occurred in the R�as Basin-Sklinna Ridgearea compared to the Frøya High-Trøndelag Platform,
related to the westward increase in b stretching factor
during the Late Jurassic–Early Cretaceous (see inset
graphs that show the thermal subsidence component in
Fig. 11a–c).The results of our restorations of the geometry of the
Halten Terrace and bounding fault complexes reveal that
the present-day geometry of an ancient rift basin may not
accurately reflect the palaeostructure of the basin. Simple
geometric flattening techniques will not reproduce realis-
tic ancient fault block geometries; sediment compaction,
flexural loading and thermal subsidence must also be
accounted for.
Late Jurassic–Early Cretaceous rift eventstretchingmechanism
Previous studies in the Vøring and Møre basins have
found that palaeobathymetric estimates derived from
reverse-basin modelling using upper-crustal-derived bfactors for the Early Tertiary rift event often underesti-
mate the palaeo-water depth implied by geological evi-
dence, in some cases by up to 1 km (Ceramicola et al.,2005). These studies account for the missing tectonic
subsidence by invoking depth-dependent stretching
models for the Early Tertiary rift event, whereby the
lithosphere stretches more than the upper crust (Cerami-
cola et al., 2005; Kusznir et al., 2005). Prior to our study,Late Jurassic–Early Cretaceous lithospheric extension
was unquantified, although some authors have suggested
that this rift event too may have been controlled by
depth-dependent stretching (Scheck-Wenderoth et al.,2007).
To the contrary, our study supports the hypothesis that
the Late Jurassic–Early Cretaceous rift event, at least on
the inboard, proximal part of the margin, was controlled
by uniform, pure-shear stretching. We have found that
the amount and distribution of extension that can best
restore palaeo-water depths in the southern Halten Ter-
race and match the available geological constraints is very
similar to the b profile suggested from summing extension
on 40° dipping upper-crustal faults, with the addition of
25–60% extra extension to account for sub-seismic fault-
ing. This indicates that upper-crustal stretching factors
are adequate to explain the degree of post-rift thermal
© 2014 The AuthorsBasin Research © 2014 John Wiley & Sons Ltd, European Association of Geoscientists & Engineers and International Association of Sedimentologists220
R. E. Bell et al.

subsidence associated with the Late Jurassic–Early Creta-ceous rift event in the southern Halten Terrace. Further-
more, we have demonstrated that the larger b factors
determined from crustal thinning (Fig. 7a) are too large
to correctly restore palaeobathymetry in the Halten Ter-
race (Fig. 8), principally because this value also includes
extension associated with the Devonian and Permo-Trias-
sic rift events.
The results of the basin reconstruction presented in
this contribution show that geologically derived estimates
of palaeo-water depth can only be reconstructed using a
variable b profile which ranges from values of 1 in the
east, to 1.2–1.6 (depending on the Te value employed) in
the west. Although in detail this b profile is affected by
the location of fault blocks (Fig. 7b), in general it shows
increasing stretching to the west, indicating significant
Late Jurassic–Early Cretaceous rifting occurred further
west in the Møre and Vøring basins, an observation that,
is supported by the great thickness of Cretaceous sedi-
ments preserved within these basins (Scheck-Wenderoth
et al., 2007). The apparent lack of pre-Cretaceous stratig-raphy or direct evidence of Late Jurassic–Early Creta-
ceous fault activity in the axis of the Møre and Vøring
basins (Scheck-Wenderoth et al., 2007), is likely to be theresult of poor seismic reflection imaging below recording
times of 8 s, and lack of well control in determining the
depth to the BCU and basement, rather than the true
absence of structures and stratigraphy of this age.
In summary, the Late Jurassic–Early Cretaceous rift
event may have had a different lithospheric stretching
mechanism to the Early Tertiary rift event that led to
the opening of the NE Atlantic. This study supports a
growing body of evidence that mildly extended conti-
nental rifts (b < 2) tend to have equal crustal and litho-
sphere extension, implying rifting prior to break-up
occurs by largely uniform, pure-shear thinning of the
continental lithosphere (e.g. the North Sea, White,
1990; Gulf of Corinth, Bell et al., 2011; Beibu Gulf
Basin, South China, Clift & Lin, 2001). It has been sug-
gested that uniform pure-shear stretching may be com-
mon to the early stage of rift margin development, with
a transition to non-uniform simple-shear extension dur-
ing advanced rifting and seafloor spreading (Manatschal
& Bernoulli, 1999; Whitmarsh et al., 2001). Subsidenceanalysis in the Black Sea, where stretching factors up to
5 have been estimated, also reveal pure-shear stretching
mechanisms may be applicable (Shillington et al., 2008).Other recent studies have suggested that break-up
between rift margins may similarly be the result of uni-
form stretching between the upper and lower crust, but
with complex brittle deformation, related to sequential
multi-phase faulting, accounting for the apparent dis-
crepancy between upper and lower crustal extension
(Reston, 2009; Ranero & Perez-Gussinye, 2010). The
depth-dependent extension model, which is often pre-
scribed to the Early Tertiary break-up rift phase off-
shore mid Norway, may also need to be reassessed in
the light of the new results presented here.
IMPLICATIONSAND CONCLUSIONS
In this study, we have restored the Late Jurassic–EarlyCretaceous geometry of the southern Halten Terrace
along 2D seismic reflection profiles using a combination
of sedimentology, seismic stratigraphy and reverse post-
rift thermal subsidence modelling. We have investigated
the influence that seismic velocity, lithology, depth to
basement, effective elastic thickness and rift history have
on fault block-scale reconstructions of rift basin geometry
and have demonstrated that, despite the wide range of
possible input parameter values that could be used in
reverse subsidence modelling, the availability of four
major palaeo-water depth constraints from geological data
allows the range of viable combinations of input parame-
ter values to be significantly reduced (Fig. 10b). The vari-
ation in reconstructed basin geometry brought about by
this restricted range of possible parameter values is low
(Fig. 9), and we suggest that the fully integrated geophys-
ical and geological approach described here can be used to
reconstruct ancient rift-basin geometries with confidence
in other settings.
Late Jurassic–Early Cretaceous rift phase stretching
factors across the southern Halten Terrace derived from
fault heave range from b = 1 to 1.25 from east to west,
and stretching factors derived from crustal thinning range
from b = 1 to 2.1. These estimates provide minimum and
maximum bounds, respectively, for Late Jurassic–EarlyCretaceous stretching in the southern Halten Terrace.
Halten Terrace lithospheric elastic thickness since the
Late Jurassic–Early Cretaceous is largely unconstrained
from previous studies and may range from 1 to 25 km.
The variation in Late Jurassic and Early Cretaceous palae-
o-water depths brought about by these variations in b and
Te is extreme.
Sedimentological data from wells and seismic-strati-
graphic observations provide important constraints on
palaeobathymetry in the Late Jurassic and Early Creta-
ceous. b and Te parameter pairings that can restore palae-
obathymetry to comply with all of these constraints are
restricted between Te’s of 3–13 km and b profiles ranging
from b = 1 to 1.2 and 1 to 1.6 from east to west. The
availability of more palaeo-water depth constraints may
allow these parameters to be more tightly constrained.
Alternatively, independent estimates of Te could be made
using stratigraphic forward modelling (e.g. Kusznir et al.,1995) or process-orientated gravity modelling (e.g. Watts
& Fairhead, 1999).
For the full range of possible Te and b values the
Sklinna Ridge and Frøya High are restored to subaerial
footwall islands at the end of the Late Jurassic–EarlyCretaceous rift phase (Fig. 9), despite the Sklinna Ridge
presently residing over 2 km deeper than the Frøya High
(Fig. 2). Therefore, the present-day geometry of fault
blocks can be misleading when considering the geometry
of ancient fault blocks. To restore late syn-rift geometry
at the ‘seismic-line’ scale with confidence sediment com-
paction, flexural loading and thermal subsidence should
© 2014 The AuthorsBasin Research © 2014 John Wiley & Sons Ltd, European Association of Geoscientists & Engineers and International Association of Sedimentologists 221
Geologically constrained subsidence modelling
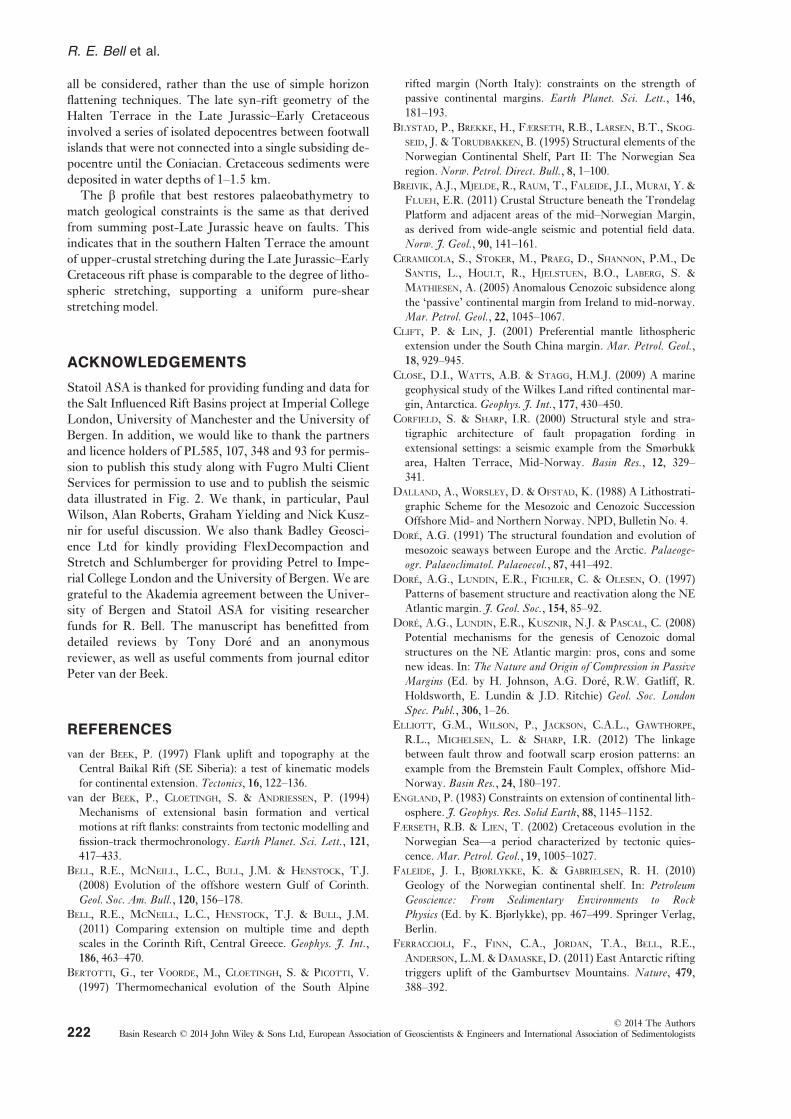
all be considered, rather than the use of simple horizon
flattening techniques. The late syn-rift geometry of the
Halten Terrace in the Late Jurassic–Early Cretaceous
involved a series of isolated depocentres between footwall
islands that were not connected into a single subsiding de-
pocentre until the Coniacian. Cretaceous sediments were
deposited in water depths of 1–1.5 km.
The b profile that best restores palaeobathymetry to
match geological constraints is the same as that derived
from summing post-Late Jurassic heave on faults. This
indicates that in the southern Halten Terrace the amount
of upper-crustal stretching during the Late Jurassic–EarlyCretaceous rift phase is comparable to the degree of litho-
spheric stretching, supporting a uniform pure-shear
stretching model.
ACKNOWLEDGEMENTS
Statoil ASA is thanked for providing funding and data for
the Salt Influenced Rift Basins project at Imperial College
London, University of Manchester and the University of
Bergen. In addition, we would like to thank the partners
and licence holders of PL585, 107, 348 and 93 for permis-
sion to publish this study along with Fugro Multi Client
Services for permission to use and to publish the seismic
data illustrated in Fig. 2. We thank, in particular, Paul
Wilson, Alan Roberts, Graham Yielding and Nick Kusz-
nir for useful discussion. We also thank Badley Geosci-
ence Ltd for kindly providing FlexDecompaction and
Stretch and Schlumberger for providing Petrel to Impe-
rial College London and the University of Bergen. We are
grateful to the Akademia agreement between the Univer-
sity of Bergen and Statoil ASA for visiting researcher
funds for R. Bell. The manuscript has benefitted from
detailed reviews by Tony Dor�e and an anonymous
reviewer, as well as useful comments from journal editor
Peter van der Beek.
REFERENCESvan der BEEK, P. (1997) Flank uplift and topography at the
Central Baikal Rift (SE Siberia): a test of kinematic models
for continental extension. Tectonics, 16, 122–136.van der BEEK, P., CLOETINGH, S. & ANDRIESSEN, P. (1994)
Mechanisms of extensional basin formation and vertical
motions at rift flanks: constraints from tectonic modelling and
fission-track thermochronology. Earth Planet. Sci. Lett., 121,417–433.
BELL, R.E., MCNEILL, L.C., BULL, J.M. & HENSTOCK, T.J.
(2008) Evolution of the offshore western Gulf of Corinth.
Geol. Soc. Am. Bull., 120, 156–178.BELL, R.E., MCNEILL, L.C., HENSTOCK, T.J. & BULL, J.M.
(2011) Comparing extension on multiple time and depth
scales in the Corinth Rift, Central Greece. Geophys. J. Int.,186, 463–470.
BERTOTTI, G., ter VOORDE, M., CLOETINGH, S. & PICOTTI, V.
(1997) Thermomechanical evolution of the South Alpine
rifted margin (North Italy): constraints on the strength of
passive continental margins. Earth Planet. Sci. Lett., 146,
181–193.BLYSTAD, P., BREKKE, H., FÆRSETH, R.B., LARSEN, B.T., SKOG-
SEID, J. & TORUDBAKKEN, B. (1995) Structural elements of the
Norwegian Continental Shelf, Part II: The Norwegian Sea
region.Norw. Petrol. Direct. Bull., 8, 1–100.BREIVIK, A.J., MJELDE, R., RAUM, T., FALEIDE, J.I., MURAI, Y. &
FLUEH, E.R. (2011) Crustal Structure beneath the Trøndelag
Platform and adjacent areas of the mid–Norwegian Margin,
as derived from wide-angle seismic and potential field data.
Norw. J. Geol., 90, 141–161.CERAMICOLA, S., STOKER, M., PRAEG, D., SHANNON, P.M., De
SANTIS, L., HOULT, R., HJELSTUEN, B.O., LABERG, S. &
MATHIESEN, A. (2005) Anomalous Cenozoic subsidence along
the ‘passive’ continental margin from Ireland to mid-norway.
Mar. Petrol. Geol., 22, 1045–1067.CLIFT, P. & LIN, J. (2001) Preferential mantle lithospheric
extension under the South China margin. Mar. Petrol. Geol.,18, 929–945.
CLOSE, D.I., WATTS, A.B. & STAGG, H.M.J. (2009) A marine
geophysical study of the Wilkes Land rifted continental mar-
gin, Antarctica. Geophys. J. Int., 177, 430–450.CORFIELD, S. & SHARP, I.R. (2000) Structural style and stra-
tigraphic architecture of fault propagation fording in
extensional settings: a seismic example from the Smørbukk
area, Halten Terrace, Mid-Norway. Basin Res., 12, 329–341.
DALLAND, A., WORSLEY, D. & OFSTAD, K. (1988) A Lithostrati-
graphic Scheme for the Mesozoic and Cenozoic Succession
Offshore Mid- and Northern Norway. NPD, Bulletin No. 4.
DOR�E, A.G. (1991) The structural foundation and evolution of
mesozoic seaways between Europe and the Arctic. Palaeoge-ogr. Palaeoclimatol. Palaeoecol., 87, 441–492.
DOR�E, A.G., LUNDIN, E.R., FICHLER, C. & OLESEN, O. (1997)
Patterns of basement structure and reactivation along the NE
Atlantic margin. J. Geol. Soc., 154, 85–92.DOR�E, A.G., LUNDIN, E.R., KUSZNIR, N.J. & PASCAL, C. (2008)
Potential mechanisms for the genesis of Cenozoic domal
structures on the NE Atlantic margin: pros, cons and some
new ideas. In: The Nature and Origin of Compression in PassiveMargins (Ed. by H. Johnson, A.G. Dor�e, R.W. Gatliff, R.
Holdsworth, E. Lundin & J.D. Ritchie) Geol. Soc. LondonSpec. Publ., 306, 1–26.
ELLIOTT, G.M., WILSON, P., JACKSON, C.A.L., GAWTHORPE,
R.L., MICHELSEN, L. & SHARP, I.R. (2012) The linkage
between fault throw and footwall scarp erosion patterns: an
example from the Bremstein Fault Complex, offshore Mid-
Norway. Basin Res., 24, 180–197.ENGLAND, P. (1983) Constraints on extension of continental lith-
osphere. J. Geophys. Res. Solid Earth, 88, 1145–1152.FÆRSETH, R.B. & LIEN, T. (2002) Cretaceous evolution in the
Norwegian Sea—a period characterized by tectonic quies-
cence.Mar. Petrol. Geol., 19, 1005–1027.FALEIDE, J. I., BJØRLYKKE, K. & GABRIELSEN, R. H. (2010)
Geology of the Norwegian continental shelf. In: PetroleumGeoscience: From Sedimentary Environments to RockPhysics (Ed. by K. Bjørlykke), pp. 467–499. Springer Verlag,Berlin.
FERRACCIOLI, F., FINN, C.A., JORDAN, T.A., BELL, R.E.,
ANDERSON, L.M. & DAMASKE, D. (2011) East Antarctic rifting
triggers uplift of the Gamburtsev Mountains. Nature, 479,388–392.
© 2014 The AuthorsBasin Research © 2014 John Wiley & Sons Ltd, European Association of Geoscientists & Engineers and International Association of Sedimentologists222
R. E. Bell et al.

GRADSTEIN, F. & BACKSTROM, S. (1996) Cainozoic biostrati-
graphy and palaeobathymetry, northern North Sea and
Haltenbanken.Nor. Geol. Tidsskr., 76, 3–32.HAQ, B.U., HARDENBOL, J. & VAIL, P.R. (1987) Chronology of
fluctuating sea levels since the triassic. Science, 235, 1156–1167.
KARNER, G.D. & WATTS, A.B. (1983) Gravity anomalies and
flexure of the lithosphere at mountain ranges. J. Geophys.Res., 10, 10449–10477.
KARNER, G.D., STECKLER, M.S. & THORNE, J.A. (1983) Long-
term mechanical properties of the continental lithosphere.
Nature, 304, 250–253.KJENNERUD, T. & VERGARA, L. (2005) Cretaceous to Palaeogene
3D palaeobathymetry and sedimentation in the Vøring Basin,
Norwegian Sea. Geol. Soc. London Petrol. Geol. Conf. Ser., 6,815–831.
KUSZNIR, N.J., ROBERTS, A.M. & MORLEY, C.K. (1995) Forward
and reverse modelling of rift basin formation. Geol. Soc.London Spec. Publ., 80, 33–56.
KUSZNIR, N.J., HUNSDALE, R. & ROBERTS, A.M. (2004) Timing
of depth-dependent lithosphere stretching on the S.Lofoten
riftedmargin offshoremid-norway: pre-breakup or post-
breakup? Basin Res., 16, 279–296.KUSZNIR, N.J., HUNSDALE, R., ROBERTS, A.M. & TEAM, I. (2005)
Norwegian margin depth-dependent strethcing. In: PetroleumGeology: North-West Europe and Global Perspectives,Proceedings of the 6th Petroleum Geology Conference (Ed. by
A.G. Dor�e & B.A. Vining), pp. 767–783. Geological Society,
London.
LAMARCHE, G., BARNES, P. M. & BULL, J. M. (2006) Faulting
and extension rate over the last 20,000 years in the offshore
Whakatane Graben, New Zealand continental shelf. Tectonics,25, TC4005.
MANATSCHAL, G. & BERNOULLI, D. (1999) Architecture and tec-
tonic evolution of nonvolcanic margins: present-day Galicia
and ancient Adria. Tectonics, 18, 1099–1119.MARSH, N., IMBER, J., HOLDSWORTH, R. E., BROCKBANK, P. &
RINGROSE, P. (2010) The structural evolution of the Halten
Terrace, offshore Mid-Norway: extensional fault growth and
strain localisation in a multi-layer brittle–ductile system.
Basin Research, 22, 195–214.MARRETT, R. & ALLMENDINGER, R.W. (1992) Amount of exten-
sion on “small” faults: an example from the viking graben.
Geology, 20, 47–50.MCKENZIE, D. (1978) Some remarks on the development of sed-
imentary basins. Earth Planet. Sci. Lett., 40, 25–32.MCKENZIE, D. (2003) Estimating T E in the presence of internal
loads. J. Geophys. Res., 108, 2438.MILLER, K.G., KOMINZ, M.A., BROWNING, J.V., WRIGHT, J.D.,
MOUNTAIN, G.S., KATZ, M.E., SUGARMAN, P.J., CRAMER,
B.S., CHRISTIE-BLICK, N. & PEKAR, S.F. (2005) The phanero-
zoic record of global sea-level change. Science, 310, 1293–1298.
M€ULLER, R.D., SDROLIAS, M., GAINA, C., STEINBERGER, B. &
HEINE, C. (2008) Long-term sea-level fluctuations driven by
ocean basin dynamics. Science, 319, 1357–1362.NADIN, P.A. & KUSZNIR, N.J. (1995) Palaeocene uplift and
eocene subsidence in the northern North Sea Basin from 2D
forward and reverse stratigraphic modelling. J. Geol. Soc.,152, 833–848.
PASCOE, R., HOOPER, R., STORHAUG, K. & HARPER, H. (1999,
January). Evolution of extensional styles at the southern ter-
mination of the Nordland Ridge, Mid-Norway: a response to
variations in coupling above Triassic salt. In: GeologicalSociety, London, Petroleum Geology Conference Series Vol. 5,pp. 83–90. Geological Society of London.
P�EREZ-GUSSINY�E, M., LOWRY, A.R., WATTS, A.B. & VELICOGNA,
I. (2004) On the recovery of effective elastic thickness using
spectral methods: examples from synthetic data and from the
fennoscandian shield. J. Geophys. Res., 109, B10409.P�EREZ-GUSSINY�E, M., METOIS, M., FERN�ANDEZ, M., VERG�ES, J.,
FULLEA, J. & LOWRY, A. (2009) Effective elastic thickness of
Africa and its relationship to other proxies for lithospheric
structure and surface tectonics. Earth Planet. Sci. Lett., 287,152–167.
PROVAN, D. (1992) Draugen oil field, Haltenbanken Province,
Offshore Norway. In:Giant Oil and Gas Fields of the Last Dec-ade 1978-1988 (Ed. by M.T. Halbouty) AAPG Spec. Vol., 54,371–382.
RANERO, C.R. & PEREZ-GUSSINYE, M. (2010) Sequential faulting
explains the asymmetry and extension discrepancy of conju-
gate margins.Nature, 468, 294–299.REEMST, P. & CLOETINGH, S. (2000) Polyphase rift evolution of
the Vøring margin (mid-Norway): constraints from forward
tectonostratigraphic modeling. Tectonics, 19, 225–240.RESTON, T.J. (2009) The structure, evolution and symmetry of
the magma-poor rifted margins of the North and Central
Atlantic: a synthesis. Tectonophysics, 468, 6–27.REYNISSON, R.F., EBBING, J., LUNDIN, E.R. & OSMUNDSEN, P.T.
(2010) Properties and distribution of lower crustal bodies on
the mid-Norwegian margin. In: Petroleum Geology: FromMature Basins to New Frontiers (Ed. by B.A. Vining & S.C.
Pickering), pp. 843–854. Geological Society, London.
RICHARDSON, N.J., UNDERHILL, J.R. & LEWIS, G. (2005) The role
of evaporite mobility in modifying subsidence patterns during
normal fault growth and linkage, Halten Terrace, mid-
Norway. Basin Res., 17, 203–223.ROBERTS, A.M., YIELDING, G., KUSZNIR, N.J., WALKER, I. &
DORN-LOPEZ, D. (1993) Mesozoic extension in the North Sea:
constraints from flexural backstripping, forward modelling
and fault populations. Geol. Soc. London Petrol. Geol. Conf.Ser., 4, 1123–1136.
ROBERTS, A.M., LUNDIN, E.R. & KUSZNIR, N.J. (1997) Subsi-
dence of the Vøring Basin and the influence of the Atlantic
continental margin. J. Geol. Soc., 154, 551–557.ROBERTS, A.M., KUSZNIR, N.J., YIELDING, G. & STYLES, P.
(1998) 2D flexural backstripping of extensional basins: the
need for a sideways glance. Petrol. Geosci., 4, 327–338.ROBERTS, A.M., CORFIELD, R.I., KUSZNIR, N.J., MATTHEWS,
S.J., HANSEN, E.-K. & HOOPER, R.J. (2009) Mapping palaeo-
structure and palaeobathymetry along the Norwegian Atlantic
continental margin: Møre and Vøring Basins. Petrol. Geosci.,15, 27–43.
SACEK, V. & USSAMI, N. (2009) Reappraisal of the effective
elastic thickness for the sub-Andes using 3-D finite element
flexural modelling, gravity and geological constraints.
Geophys. J. Int., 179, 778–786.SCHECK-WENDEROTH, M., RAUM, T., FALEIDE, J.I., MJELDE, R.
& HORSFIELD, B. (2007) The transition from the continent to
the ocean: a deeper view on the Norwegian margin. J. Geol.Soc., 164, 855–868.
SCLATER, J.G. & CHRISTIE, P.A.F. (1980) Continental stretching:
an explanation of the Post-Mid-Cretaceous subsidence of the
central North Sea Basin. J. Geophys. Res., 85, 3711–3739.SHILLINGTON, D.J., WHITE, N.J., MINSHULL, T.A., EDWARDS,
G.R.H., JONES, S.M., EDWARDS, R.A. & SCOTT, C.L. (2008)
© 2014 The AuthorsBasin Research © 2014 John Wiley & Sons Ltd, European Association of Geoscientists & Engineers and International Association of Sedimentologists 223
Geologically constrained subsidence modelling

Cenozoic evolution of the eastern Black Sea: a test of depth-
dependent stretching models. Earth Planet. Sci. Lett., 265,360–378.
STEWART, J. & WATTS, A.B. (1997) Gravity anomalies and
spatial variations of flexural rigidity at mountain ranges.
J. Geophys. Res., 102, 5327–5352.VAIL, P., MITCHUM, R. & THOMPSON, S. (1977) Seismic stratig-
raphy and global changes of sea level, part 3: relative changes
of sea level from coastal onlap. In: Seismic Stratigraphy –Applications to Hydrocarbon Exploration (Ed. by C.E. Clay-
ton), AAPGMem. 26, 63–81.Van HINTE, J.E. (1978) Geohistory analysis; application of
micropaleontology in exploration geology. AAPG Bull., 62,201–222.
WATTS, A.B. (1992) The effective elastic thickness of the litho-
sphere and the evolution of foreland basins. Basin Res., 4,169–178.
WATTS, A.B. (2001) Isostasy and Flexure of the Lithosphere.Cambridge University Press, Cambridge.
WATTS, A.B. & FAIRHEAD, J.D. (1999) A process-orientated
approach to modeling the gravity signature of continental
margins. Lead. Edge, 18, 258–263.WATTS, A.B., KARNER, G.D. & STECKLER, M.S. (1982) Litho-
spheric flexure and the evolution of sedimentary basins. Phil.Trans. Roy. Soc. London, 305, 249–281.
WHITMARSH, R.B., MANATSCHAL, G. & MINSHULL, T.A. (2001)
Evolution of magma-poor continental margins from rifting to
seafloor spreading.Nature, 413, 150–154.van WIJK, J.W. & CLOETINGH, S.A.P.L. (2002) Basin migration
caused by slow lithospheric extension. Earth Planet. Sci. Lett.,198, 275–288.
Manuscript received 25 April 2013; In revised form 20August 2013; Manuscript accepted 05 September 2013.
© 2014 The AuthorsBasin Research © 2014 John Wiley & Sons Ltd, European Association of Geoscientists & Engineers and International Association of Sedimentologists224
R. E. Bell et al.