Innovations in Data Collection on Kinship - uaps2015
22
1 Moving Beyond the Household: Innovations in Data Collection on Kinship Sangeetha Madhavan University of Maryland Shelley Clark McGill University Donatien Beguy African Population and Health Research Center Caroline Kabiru African Population and Health Research Center Mark Gross University of Maryland We are indebted to Collins Jume for field management support and the APHRC interviewers. We also thank Mike Wagner and Malcom Egan for their assistance with data management and analysis of geo spatial data. This project was funded by a grant from the Eunice Shriver National Institutes of Child Health (1R21-HD078763-01A1).
-
Upload
khangminh22 -
Category
Documents
-
view
0 -
download
0
Transcript of Innovations in Data Collection on Kinship - uaps2015

1
Moving Beyond the Household: Innovations in Data Collection on Kinship
Sangeetha Madhavan
University of Maryland
Shelley Clark
McGill University
Donatien Beguy
African Population and Health Research Center
Caroline Kabiru
African Population and Health Research Center
Mark Gross
University of Maryland
We are indebted to Collins Jume for field management support and the APHRC interviewers. We also
thank Mike Wagner and Malcom Egan for their assistance with data management and analysis of geo
spatial data. This project was funded by a grant from the Eunice Shriver National Institutes of Child
Health (1R21-HD078763-01A1).
2
Abstract
It has now been established that the co-residential household is an insufficient measure of family structure
and family support. However, it continues to be the primary means of data collection in surveys, which, in
turn, results in an incomplete understanding of familial influences on children’s well-being. To address
this problem, we have developed a survey instrument – Kinship Support Tree (KST) – to collect kinship
structure and support data for single mothers and their children in one slum community in Nairobi,
Kenya. This survey instrument is unique in four important ways: 1) it is not limited to the co-residential
household; 2) it distinguishes potential from functional kin; 3) it incorporates geospatial measures; and 4)
it collects data from the perspective of children. In this paper, we describe the KST instrument; assess the
data collected and compare it to the type of data collected from standard household rosters and consider
the feasibility of administering the KST. We believe that this instrument and the lessons learned from
testing it will greatly advance our ability to capture critical data on the role of family and kinship in
influencing child outcomes in rapidly urbanizing contexts in Africa and can also be adapted to other
contexts further afield.

3
Children born in the slums of Nairobi are significantly more likely to die by age 5 than children in the rest
of Kenya (APHRC 2014). Moreover, high rates of nonmarital childbearing, union dissolution, and adult
mortality result in a large proportion of children raised by single mothers (Clark and Hamplova 2013). As
in many sub-Saharan African contexts, however, these single mothers are assumed to receive
considerable economic support and childcare assistance from their residential and non-residential
extended kin. However, kinship support is potentially declining due to three processes under way in much
of sub-Saharan Africa: 1) increased distance between children and extended kin due to high rates of
female and male migration, particularly from rural areas to informal settlements in urban locations; 2)
pervasive poverty which limits the ability of kin to provide support; and 3) the transformations of views
on marriage, women’s roles, and family norms, with a greater reliance on conjugal bonds than kinship
ties. As a result, there is likely to be substantial variation in the type and amount of kinship support that
children of poor, urban, single mothers receive which, in turn, could put their health and well-being at
risk. This hypothesis, however, has not been examined carefully because of inadequate data collection
instruments.
Family demographers have long recognized that the co-residential household is but one site to
understand the influence of family structure and family support on children’s well-being. Families
transcend time and space and defy easy categorization because of the complexities inherent in defining
membership and roles. In the US context, this has taken on renewed urgency because of the attention paid
to “family complexity” as a result of increases in divorce, remarriage, cohabitation and nonmarital
childbearing (Cancian et al. 2011; Manning et al. 2014). In urban contexts in sub-Saharan Africa, similar
shifts are underway with additional complexity brought on by migration and premature adult death. These
changes, coupled with acute financial pressures, have brought about family structures that are dispersed
over households, regions and even countries and limited and more fluid forms of family based support.
Yet the tool to collect data in both contexts continues to be centered around the household roster.
Methodological innovations in research on migration (Collinson 2010; Hosegood & Timaeus 2005) and
social networks (Kohler 1997; White & Watkins 2000) have advanced our understanding of the
importance of social relationships beyond household boundaries, but this work has not paid sufficient
attention to kinship, nor are these studies typically child-focused. Moreover, the growing use of spatial
statistics in disease and health surveillance (Rushton 2003), as well as in human geography (Kwan 2000),
have yet to be applied to assess kinship ties despite the promises that they offer.
To address this problem, we have developed a new survey instrument – Kinship Support Tree - to
collect kinship structure and support data for single mothers and their children in one slum community in
Nairobi, Kenya. In this paper, we 1) describe the current state of data collection on familial support; 2)
describe the KST instrument; 3) assess the data collected and compare it to the type of data collected from
4
standard household rosters and 4) assess the feasibility of administering the KST. We believe that this
instrument can be adapted to not just other sub-Saharan African contexts undergoing similar demographic
shifts but also to Western contexts where seismic changes in family structure present a timely opportunity
to consider new data collection approaches.
Current State of Data Collection on Family Structure and Support in SSA
The primary sources of quantitative data on family structure and family support in sub-Saharan Africa
come from four main sources: 1) Demographic and Health Surveys (DHS); 2) Demographic Surveillance
Sites (DSS); 3) censuses and 4) specialized data sets focused on specific issues and populations. DHS
data have long been used to examine issues related to family and child well-being (Clark and Hamplova
2012; Gage 1997; Parker & Short 2009; Smith-Greenaway & Madhavan 2015; Smith-Greenaway &
Trinitapoli 2014). The main strengths are that they are nationally representative and use standardized
questionnaires to facilitate comparison across countries – over 100 surveys exist in Africa alone.
Moreover, they are public use and, are, for the most part, easy to use for analysis. However, they are
limited in a number of important ways. First, the only measure of family structure and support is the co-
residential household leaving out important non-residential linkages. Second, household rosters collect
data from the perspective of household heads, not the child. Under some conditions, these relationships
can be easily transformed into reflecting relationships with children but quite often we are left with best
guess classification. Third, co-residence is assumed to be an adequate proxy for family support.
DSS data which are found in a number of countries in all parts of the Africa (e.g. Navrongo in
Ghana, Niakhar in Senegal, Agincourt in South Africa) offer some advantages over DHS but have their
own weaknesses. There are two main features of the DSS that contribute to their appeal. One is the
longitudinal dimension which enables deeper understanding of household change. Two is their approach
to data collection on households. At least some DSS sites use the elemental kinship terminology to
classify relationships (H (usband), W (ife), M (other), F(ather), (B)rother, (Z) sister, (S)on, D (aughter)) –
instead of culturally dependent terminology such as “uncle” -- which facilitates comparison across sites.
However, these data are also collected from the perspective of household head similar to the DHS.
Moreover, residence is usually the only measure of support. DSS sites make a greater effort to reflect the
complexities of lived experience. For example the Agincourt site includes temporary migrants as
household members even if they are not physically present because of their social and financial link to the
household (Collinson 2010). The Hlabisa site in KwaZulu Natal, South Africa, goes one step further by
allowing members to have more than one residence (Hosegood and Timaeus 2006). These benefits have
enabled analysis of familial structure and support in innovative ways (Hosegood et al. 2004; Schatz et al.

5
2014; Townsend et al. 2002). Some sites collect data quarterly which allows even more opportunity to
capture dynamism in shorter time intervals. This is particularly crucial in areas with high levels of
mobility. However, the downside of such intensive follow-up is that it can only be done in localized
communities whereby making it difficult to generalize to larger populations. Moreover, the resources
needed to maintain a DSS site are considerable.
Censuses, while underutilized because of the challenges of access, do offer some advantages as
described in van de Walle’s (2002) volume1 and by Garenne (2011). Moreover, the IPUMS project
housed at the University of Minnesota has greatly increased access to census data. However, they are
extremely limited in data about family structure and support and are at the mercy of political stability and
government interest. The South African censuses conducted under apartheid, for example, suffer from
substantial undercounting of the Black population because of apartheid era policies of counting
“bantustans” as independent homelands (Khalfani and Zuberi 2001). Lastly, there are a number of
specialized projects that have produced high quality data on a number of topics and targeted particular
populations, particularly in Malawi. However, most projects of this nature focus on transitions to
adulthood and HIV/AIDS. None that we are aware of has attempted to consider, as a core question, the
structure and function of kinship networks. Our survey instrument is, therefore, unique in four important
ways: 1) it is not limited to the co-residential household; 2) it distinguishes potential from functional kin;
3) it incorporates geospatial measures; and 4) it collects data from the perspective of children. We
describe it in detail in the following section.
Design and Administration of Kinship Support Tree (KST)
The design of our instrument is informed by kinship and life course theories, particularly the principle of
“linked lives,” which emphasizes the interconnectedness of lives over the life course (Elder 1987). We
also draw on Bourdieu’s (1977) distinction between theoretical kinship (the genealogically mapped
universe of kin) and practical kinship (those kin who provide support). We refer to these categories as
“potential kin” which refers to the child’s biological relationships with surviving kin and “functional kin”
which identifies those kin who provide one or more forms of support. The emphasis on functionality and
interconnectedness are in line with recent calls to view families not as a fixed social institution but rather
as a dynamic set of family activities (Finch and Mason 2000; Finch 2007; Morgan 1996). In other words,
Finch (2007) introduces the term “display” which she defines as:
1 It should be noted that the African Census Analysis project housed at the University of Pennsylvania
(http://www.acap.upenn.edu/) – which served as the basis for van de Walle’s volume, is intended to facilitate access
to African censuses.
6
‘process by which individuals, and groups of individuals, convey to each other and relevant
audiences, that certain of their actions do constitute ‘doing family things’ and thereby confirm
that these relationships are ‘family’ relationships.’ (Finch 2007: 67)’
Our domains of actions or kinship support provided by functional kin – economic support, childcare
provision, and emotional closeness – are based on general theories of the importance of social capital
(Coleman 1988) and draw specifically from Weisner’s (1997) work on children’s support networks in
Kenya. Moreover, we also draw extensively on ethnographic research on kinship connectivity conducted
by the research team in South Africa (Madhavan et al. 2014; Madhavan & Gross 2013). We are interested
in uncovering how, when, and why functional kin are selected from potential kin. Moreover, we
recognize that people may have several kinship support groups that are functionally distinct, change over
time, and vary across space and other factors. By examining kinship structure and support at two time
points and incorporating multiple geospatial measures, we will be able to observe how changes in
circumstances and geographical proximity of particular kin affect their ability to provide particular types
of support to single mothers and their children.
Our instrument offers a quantitative option to the qualitative toolkit that Finch (2007) describes to capture
“display.” It has the following components:
1) Child’s kinship tree: includes the names and relationship of all closest kin – regardless of whether they
provide support – starting with biological parents, full siblings, grandparents, aunts and uncles on both
maternal and paternal sides. In addition, we record all step parents (including co-wives), half and step
siblings. Inclusion of the complete set of full, half, and step siblings will allow us to examine both the
resource dilution effect (with younger siblings) and the care provision effect (by older female siblings).
2) Distant kin and non-biological sources of support: includes names and relationship of kin who are
distantly related (e.g. third cousins) or not related but provide some form of support to the child;
3) Demographic data: For each individual kin and non-kin support provider, we gather data on survival status,
age, age of death if dead, gender, ethnicity, educational attainment, and employment status. It should be noted that
these data are collected regardless of whether the kin member provides support so that we can examine the factors
that increase the likelihood of being a “functional kin member”
4) Geo spatial data: Because of the interest in the role of geographical location and kin based support in this
project, we collect location data in four ways: 1) GPS coordinates to ascertain latitude and longitude and 2) the
7
name of the specific location, 3) self-reported or vernacular reports of distance to kin, cost of travel to and from
kin and the difficulty of travel to the kin location and 4) mode of transport to get to kin.
5) Type of support: For each person named (excluding those age 7 or below), we ask about three types of support
provided to the mother and child: financial, childcare, and emotional.
In addition, we collect demographic data on the respondent including complete union histories and self-
reported measures of health. We also collect physical health and cognitive development data for the focal
child. Finally, we conduct “reliability interviews” using an abridged questionnaire with a small group of
kin members to assess the extent of consistency between mother’s reports and those of her kin.
Study Site and Sample
We are testing the instrument in Korogocho, a slum community in Nairobi, Kenya. The choice of Kenya and
Nairobi, in particular, was driven by three factors. First, Nairobi is experiencing some of the highest rates of
urbanization in Africa made evident by the doubling of Nairobi’s population in the past decade (REF NEEDED).
Two, the proliferation of slum communities that accompanies such rapid urbanization necessitates a better
understanding of how people survive amidst formidable economic insecurity. Carr-Hill (2015) argues that
conventional household surveys are inappropriate for slum communities because of the difficulty in identifying a
household and because of mobility. Three, the slum community is part of the Nairobi Urban Health and
Demographic Surveillance System (NUHDSS), an ongoing longitudinal data collection system in place since
2002 administered by the African Population and Health Research Center (APHRC). The NUHDSS collects
census data every 4 months on fertility, mortality, migration, marital status, educational attainment, ethnicity,
household composition, selected child health indicators, and household socio-economic status from approximately
29,250 people living in 10,260 households. About 25% of Korogocho residents aged 12 years and above were
born in the area. The main ethnic groups include Kikuyu (30%), Luo (29%), Luhya (18%), and Kamba (7%).
Predominantly Kikuyu and Kamba areas are geographically closer to Nairobi compared to Luo and Luhya areas
which are located farther away in western Kenya. Like other slum communities, the areas covered by the
NUHDSS are characterized by a lack of sanitation, limited health care facilities, congested and low-quality
housing, high levels of violence and crime, and widespread unemployment and poverty. Child health outcomes –
nutritional status, vaccination coverage, and educational progress – are very poor (APHRC 2014). Testing the
instrument in this site offers several distinct advantages because of the NUHDSS. First, it provides a
sampling frame, often not available in urban African settings. Two, the ongoing tracking of the population enables
follow-up of the study sample at least within the study site. Three, our project has access to a highly experienced
8
field team, fluent in both Swahili and English. Finally, APHRC’s long history of community involvement greatly
facilitates working in this community.
Our choice of single mothers as the target group was motivated by substantive and practical reasons. As
mentioned earlier, the well-being of single mothers and their children continues to be an understudied
topic because of inadequate data collection instruments. Moreover, single mothers may be especially
dependent on the support from other family members to help them care for and financially support their
young children. However, the continued use of standard household survey rosters does not advance our
understanding of either the vulnerability or strengths of single mothers with respect to kinship support in
such contexts. Practically, because this project is meant to be an experimental one to test validity and
feasibility of the instrument and, therefore, has resource limitations, it made sense to identify a specific
population of interest. Our target sample for Round 1 was 500 women in Korogocho who were single at
the time of most recent census update and had at least one child born between 2010 and 2015. Single is
defined as not currently married or cohabiting with a partner. To ensure that we could attain our target, we
attempted to reach as many of the 840 women from the NUHDSS who fit these criteria as possible. After
excluding those who were deemed ineligible and those who had left the area, the research team
successfully interviewed 462 women. The KST will be administered again with a six month interval to
capture changes in kinship structure and support and to assess the feasibility of following individuals in a
highly mobile community We have made every attempt to record mobile phone numbers for all
respondents as well as at least one other kin member to facilitate follow-up in Round 2 and to minimize
attrition bias. Retention of samples in highly mobile populations is a perennial challenge and we hope this
project will demonstrate the effectiveness of strategies to minimize attrition. In order to test the reliability
of the instrument, almost all data will be re-collected in Round 2.
Who and what does the KST capture?
How much do people know about their kin?
It is often assumed that we know or should know basic information about our close kin. The KST
instrument allows us to determine the extent to which this assumption is true. The KST attempted to
capture demographic information on a total of 5,333 close kin. In addition, we also asked the respondent
to name any additional distant kin or non-kin who provide her with support which yielded only 36
responses. Given that our primary interest is kin, we exclude them from this analysis. Table 1 shows the
distribution of the levels of knowledge about kin members that respondents have in two ways. The top
9
half shows the distributions for the quantity of information known while the bottom half presents
distributions for not knowing specific types of information. To account for the survey design which did
not ask all questions of everyone, each column shows the figures for only those questions that were asked
for the respective group. For the full sample, respondents are asked for three pieces of data: name,
relationship and survival status, If a kin member is dead, the respondent is again asked for three pieces of
data: name, relationship and age at death If member is alive, the three pieces of information include name,
relationship and current age; For those who are alive and older than 7, we asked five pieces of
information: name, relationship, location, education and employment status.
Insert Table 1 here.
Overall, the quantity and type of knowledge is good. When we examine quantity, we know all the
information needed for the vast majority of kin with the exception of kin who are dead where the highest
percentage of known information is at Level 2. We also find a similar pattern, though not as pronounced,
for kin who are alive. The question that appears to present the greatest difficulty for respondents is age
made clear in the bottom half of the table. Among dead kin, we were not able to ascertain age of death for
almost 78% and for those alive, current age was not available for about 35% of the sample. It is also
interesting that name is not known for 21%, 15% and 38% for full, dead and alive groups respectively, yet
relationship to child is evident in all cases. This may not be particularly surprising in contexts where the
kin relationship is more critical to establishing one’s identity than a given name. Indeed there is a long
tradition of anthropology that supports this observation (Berry 1993; Fortes 1983; Riesman 1992).
Finally, the knowledge about education status is very good with only 3.1% of kin members being listed as
“not known.” The figure for employment status is higher at 9.1%. These are both lower than the figures
using the NUHDSS which has 11% and 20% not known for education and employment status
respectively though it should be noted that the NUHDSS is limited to only co-residential members.
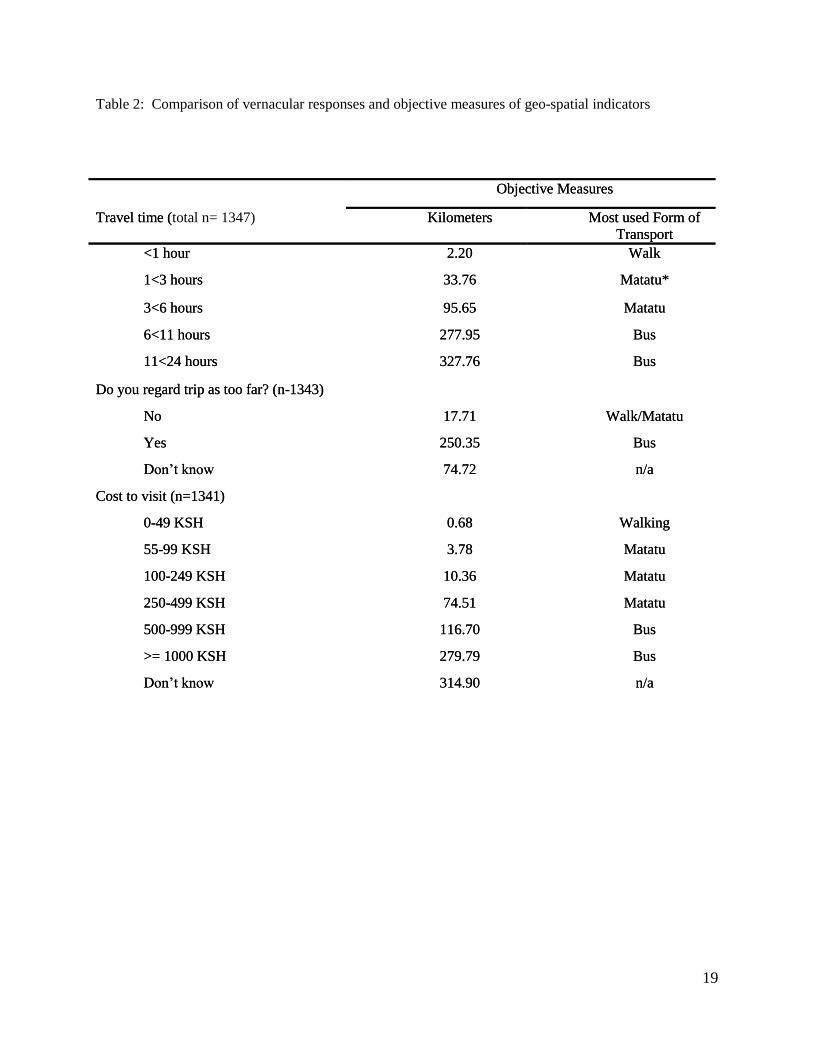
Consistency of geo-spatial data
While Table 1 shows that we were successful in attaining data on location for the vast majority of kin, it
does not tell us how robust these data are. One of the innovative features of the KST is its attempt to
capture multiple types of geo-spatial measures between the respondent and her kin/non-kin. These include
three self-reported or vernacular measures: travel time, cost of travel, perception of distance - and two
objective measures: distance based on geo-codes of location and form of transport. Table 2 shows the
10
bivariate relationship between vernacular and objective measures. The Ns reflect members who are alive,
not co-resident in the respondent’s household and over the age of 7.
Insert Table 2 here.
There appears to be high levels of consistency between vernacular and objective measures. Longer travel
times are in line with longer distances. Similarly the average distance is much greater for those reported
as living too far away. Finally, the cost of transport increases with actual distance. We would expect more
variation in forms of transport but the fact that longer distance, time and cost are all associated with the
use of buses is reassuring. We also tested the hypothesis that women are more likely to over-estimate
vernacular measures for paternal kin because they consider them to be socially more distant than maternal
kin. When we compared consistency of vernacular and objective responses by type of kin, we found no
evidence of this type of bias. However, we did find that out of the 172 kin whose location is reported as
“Don’t Know,” almost are paternal kin. Taken together, this exercise suggests that vernacular measures
are quite robust and, therefore, could serve as the main means of data collection, without the use of
Google Maps, if resource constraints necessitate. However, geo-codes enable a level of precision not
available with the more conventional vernacular measures. In short, the decision to use Google Maps
should be based on 1) level of precision needed to address research questions and 2) practical
considerations such as availability of money and equipment to collect the data.
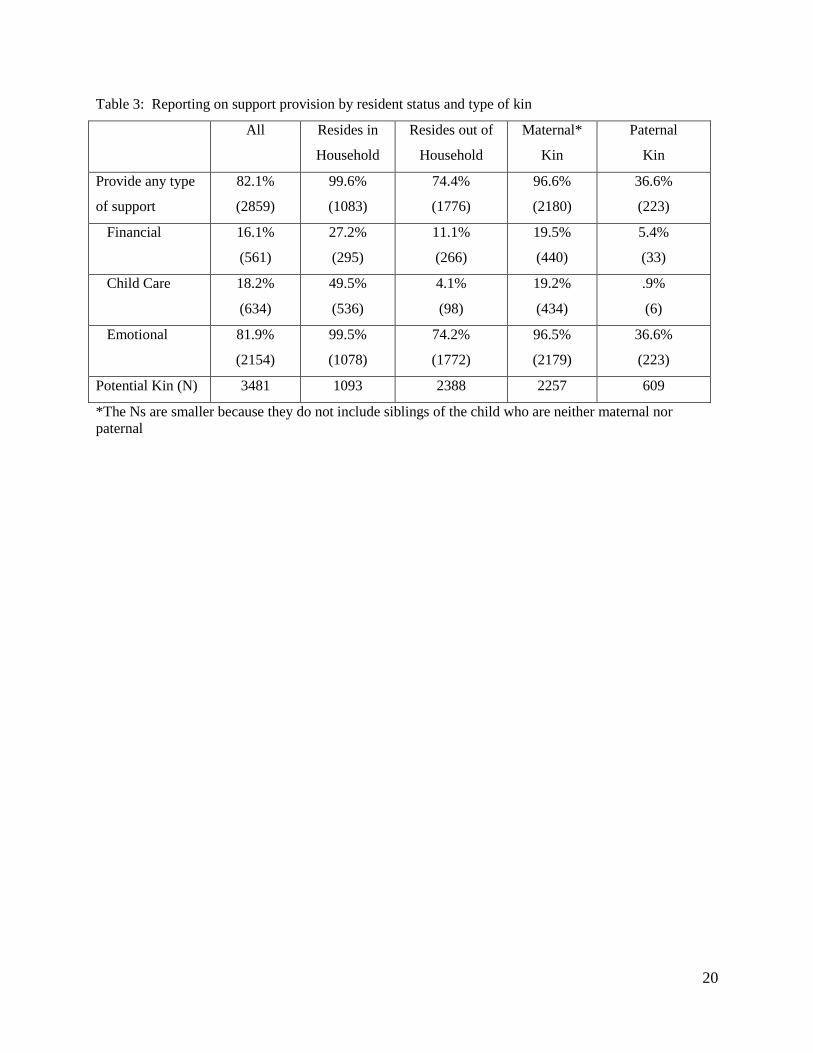
Distinguishing Potential and Functional Kin
One of the main goals of the KST is to ascertain who amongst kin (potential) actually provide support
(functional) or in Finch’s (2007) words, “display” families rather than describing structure alone. Table 3
shows the distribution of reporting on KST members as functional kin and type of support provided by
resident status and type of kinship. Functional kin are those members who the respondent reports as
providing her with financial, child care or emotional support. Potential kin are all surviving members over
the age of 7 (children in this community are expected to and do contribute to child care).
Insert Table 3 here.
In general, these figures are consistent with expectations. Given the high rates of unemployment and
fragile economic conditions, financial support is the least common type of support in all categories. We
would also expect household members to provide more support than those residing outside the household
However, it is surprising that only 18% of all eligible kin provide some form of child care support and
11
even, among household co-residents, it does not exceed 50%. With respect to type of kinship, we might
expect more support from maternal kin, which is what is shown, but it is also possible that single mothers
exaggerate the role of maternal kin and/or underreport the role of paternal kin. Her responses may be
colored by her views on the value of the relationship or perhaps, even more idiosyncratic issues that might
influence her responses at the time of interview. This is likely to occur when discussing the biological
father of the child and, by extension, paternal kin. If the dissolution occurred under particularly
acrimonious circumstances, then the mother might be more likely to underestimate the father’s support or
that of his kin. Alternatively, if the mother is caught in conflict with her sisters or brothers, she might also
downplay their contributions.
In order to assess reliability, we administered an abridged version of the questionnaire (many by phone)
to selected kin to examine the extent of consistency between responses of mother and kin. For example,
does the mother’s reports of financial contribution from her brother match what the brother says he
contributes? We greatly underestimated the difficulty of conducting this assessment. We conducted
reliability interviews with 101 kin linked to 47 mothers. More than half of these reliability respondents
reside in Korogocho. We found fairly high levels of reliability on responses to types and amount of
support provided: 74% for financial support, 83% for child care support and 63% for emotional support.
However, the main challenge with this exercise is accessing those kin who the mother reports as not
providing support who tend to be biological fathers and paternal kin. We had only 7 biological fathers and
only 1 paternal kin because mothers, not surprisingly, are likely to know or would reveal contact
information for those members with whom they have a good relationship who tend to be maternal kin.
Therefore, this exercise basically tells that people who are in supportive relationships respond in similar
ways but it does not tell us the reliability of a mother’s reports of “non-support.”
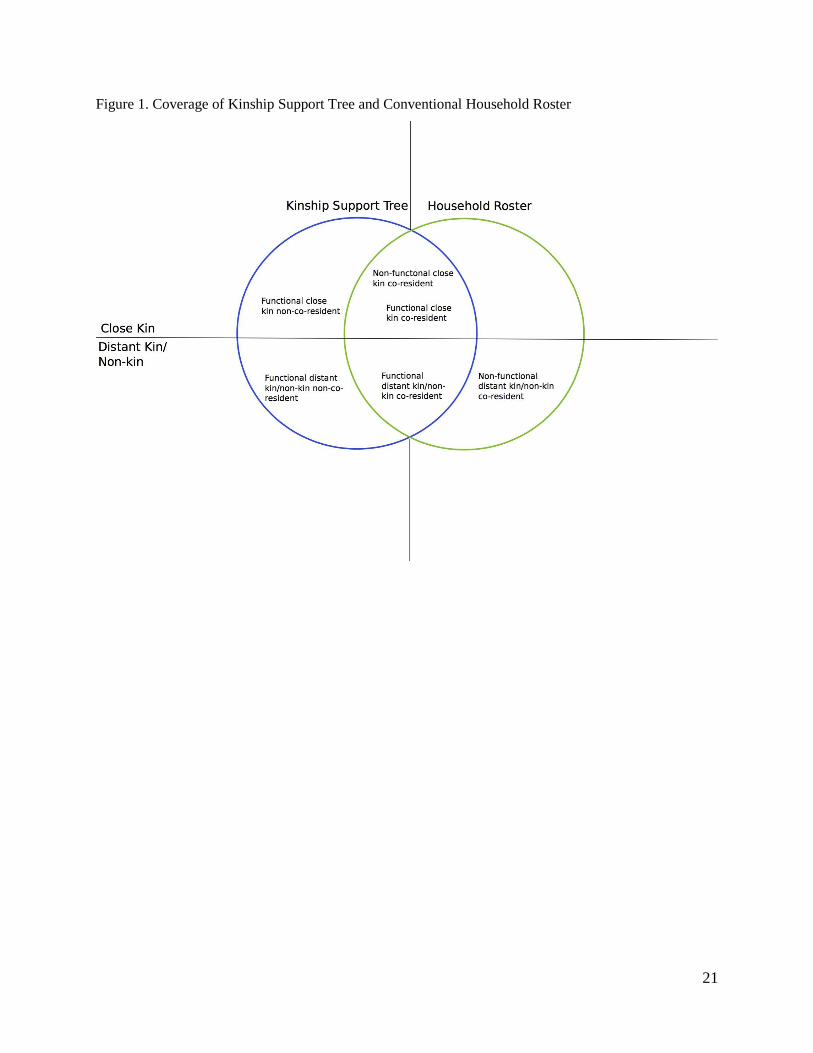
Comparison with Household Roster
To gain another perspective on the utility of the KST, we compare it to the more conventional household
roster. To start with, Figure 1 compares the points of intersection between the KST and the household
roster in terms of residence status, kin status and functionality.
Insert Figure 1 here.
12
The points of intersection show that both instruments capture co-residents who are close kin and distant
kin/non- kin. However, the big difference is in capturing functionality. Because the KST instrument was
designed to distinguish potential from functional kin, it allows us to identify, with far greater precision
and nuance, co-residents who actually provide support rather than assume that all co-residents are support
providers. While it may be true that, in general, most, if not all, co-resident members provide some more
of support, in the context of a slum community with very limited livelihood options, there is good reason
to question this assumption. Perhaps more importantly are the non-intersecting sectors, namely, functional
kin who are not coresident and non-functional distant/non-kin who are co-resident. It could be argued
that knowing sources of support from non-residential members, as the KST does, is critical in
understanding outcomes because it provides a more complete picture of vulnerability. This may be a way
to address Carr-Hill’s (2015) criticism of household surveys being inadequate to capture true poverty in
slum communities. Conversely, not knowing that a distant cousin who provides no support lives in the
household – something the KST does not capture -- undermines the ability to measure the extent of
burden commonly captured through indices like the dependency ratio. Indeed, when we compared
household size of respondents captured by the KST to the matched households in the NUHDSS, we found
the figures to be 4.3 and 5.8 respectively. This difference is also reflected in the different dependency
ratios of 1.05 for the KST and 1.5 for the NUHDSS.
Feasibility and challenges of administration
One of the main concerns about the KST instrument is the time needed to carry out the survey. On average, a
questionnaire required two hours to complete with some going beyond three. The time is directly correlated to the
size of the kin network. While we limited data collection to only close kin, Kenya’s very high fertility in the not
so distant past means that there is likely to be at least 3-4 aunts and uncles on paternal and maternal sides.
Moreover, if the woman is older and or previously married, she is likely to have older children who would also be
included and know more information. The monotony of asking a long list of questions for each member can be
onerous and can affect data quality particularly for members who make up the end of the list. Table 4 shows the
results of analysis of data quality by size of kin network. The column headings refer to the placement of kin in the
kinship roster. In other words, 10-13 refers to those people who appear in lines 10-13 of a kin roster. Therefore,
the higher this number, the longer the duration of the interview.
Insert Table 4 here.
13
Supporting the hypothesis that data quality suffers for those ending up in the end of lists of large
networks, we see that the percentage of “Don’t Know” for name increases substantially across the
columns. Thirty two percent of those ending up in lines 14 and greater have DK for name compared to
about 10% for those in the 2-6 category. No such difference is noted for relationship to child. The
distribution for survival status suggests that length of time may be a factor in data quality with the
proportion DK rising from a low of 9.6% for the those in lines 2-6 to a high of 31.1% for the 14+ group.
Interestingly the proportions of “no” also go up quite dramatically hinting at the possibility of purposeful
wrong reporting to expedite the completion of the survey. More puzzling is the reporting on “location
DK” which appears to increase and then decrease to levels below that of the 2-6 group. Reporting of DK
on educational and employment status increase with line number of placement on the roster. Taken
together, there is suggestive evidence that the length of the survey compromises data quality particularly
for those members who appear at the end of the list. However, any efforts to shorten the length should
weigh out the relative benefits of giving up breath (i.e. type of kin in network) vs. depth (i.e. type of
information collected).
The KST was developed using Open Data Kit (ODK), an open source survey development software and
administered on Android based tablet computers. The advantages of using ODK include that it is free and
readily available, routinely being updated by a community of users, and allows for fairly easy
modification of the survey questions and administration protocol for Round 2 using lessons learned from
Round 1. Perhaps one of its most attractive features is the relatively easy interface with Google Maps
which allows the interviewer to work with the respondent to identify the exact location of the named kin.
Whereas this was not particularly challenging in the Kenyan context, due in no small part to high levels of
digital exposure, it should not be assumed that spatial orientation using a cartographic interface is
meaningful in all contexts. Therefore, the effort taken to collect precise geocoded data, while highly
appealing to researchers who no longer need to conduct time consuming post survey manual coding, may
not actually produce highly reliable data. Moreover, the use of Google Maps takes up both time and
bandwidth which, in the Kenyan context, both come at a premium. Therefore, we would call for more
testing on this aspect of the questionnaire to 1) determine feasibility of using Google Maps and 2) to
identify the optimum geospatial measures for each context. Our own analysis shown earlier suggests that
vernacular data, i.e. self-reports of distance, time and cost are consistent with objective measures based on
geo-codes. At a minimum, geo-coded data should be collected as one form of geo-spatial data.
Tablet computers are becoming fairly standard features in data collection because 1) the questionnaire can
be programmed to minimize data entry error; 2) they allow direct storing of data to a cloud based server;

14
and 3) do away with the need to carry around large amounts of paper. However, our experience with
tablets revealed other types of problems such as accidentally choosing the wrong answer because of the
ease of touch screen and difficulty in returning to an earlier question. Moreover, this project provides an
opportunity to assess the feasibility of using such devices in high crime areas, an issue that has not
garnered much attention. While the use of electronic devices for data collection has obvious advantages, it
is important that we consider the ethical issues of possibly putting interviewers in physical danger due to
theft of devices. The interviewers on this project voiced such concerns during the training even though all
of them have intimate familiarity with the context. Even with common sense precautions, word spreads
quickly in these communities that interviewers are carrying tablets which, in turn, makes them targets for
robberies. Whereas we did lose one table to a robbery in Round One, the interviewers, fortunately, have
not expressed extensive concern about using the tablets.
Discussion
In this paper, we have demonstrated the effectiveness of a new data collection instrument to advance our
understanding of the role of kin in contemporary urban Africa. Specifically, the Kinship Support Roster (KST)
aims to gather demographic data – with multiple measures of geo-spatial location – on all close kin and those
identified by single mothers as providers of support. In addition, we also collect data on three types of support
provided by the kin - financial, child care and emotional - to offer a more complete understanding of the variation
in the quantity and quality of support across kinship type and other demographic attributes. Our main conclusions
are that 1) knowledge about kin is fairly high though respondents had trouble reporting current age or age of death
of kin; 2) vernacular reporting of geo-spatial location has high consistency with objective measures ascertained
from GPS coordinates; and 3) respondents are able to identify those among their kin who actually provide any
form of support though verifying this reporting proved to be a major challenge. While the reliability interviews
with kin members to examine the consistency of reporting between single mothers and their kin yielded high
levels of consistency, we were not able to contact many biological fathers or paternal kin – those who would be
least likely to be reported as support providers. Either because of lack of knowledge or refusal to report, our
reliability interviews were conducted with almost entirely maternal kin who were reported as providing support
by the mother. We are weighing out various options to address this problem including a variant of the “best
friend” technique of asking about a friend’s experience rather than one’s own which has proven effective with
other sensitive topics (Yeatman and Trinitopoli 2011).
In comparing the KST with the more conventional household roster, we fully acknowledge that the two have been
designed for different purposes. Therefore, our discussion should be seen as less of a critique of the household
roster and more of a critical analysis of its limitations amidst a context of high mobility, financial insecurity and

15
changing norms about gender and family. We believe that limiting our data on familial support to the co-
residential household greatly restricts both our conceptual leverage in considering alternative definitions of family
and our methodological/analytical options to examine a fundamental question in family demography: “what is the
mediating role of family in influencing outcomes for low income single mothers and their children?” In order to
answer this question, we must go beyond the co-residential household. While we are greatly encouraged by the
results of the analysis presented in this paper, our enthusiasm is tempered by the practical challenges of
administering the KST, the biggest of which is the length of the survey. Running an average of 2-21/2 hours for a
single interview, the KST necessitates a substantial time commitment for respondents, some of whom are already
juggling various obligations without much support. This also has the potential to compromise data quality as was
shown in Table 4. We are considering various options to shorten the time including more effective programming
of the survey such that responses from an earlier point in the survey can be used to help answer other questions
later in the survey. Despite this significant challenge, we are confident that continued efforts at refining this
instrument will yield data that will greatly advance our understanding of the complexities of family life amidst
social, economic and political change underway not just in sub-Saharan Africa but globally. To that extent, we
hope to see this instrument adapted to and tested in a range of contexts including the US so that we can make
strides in conducting comparative research. Taken together, the data generated from the KST should improve our
ability to develop evidence based interventions and policies aimed at improving the lives of low income families
globally.
16
References
African Population and Health Research Center. 2014: Population and Health Dynamics in Nairobi's Informal
Settlements: Report of the Nairobi Cross-sectional Slums Survey (NCSS) 2012. APHRC.
Berry, S. (1993). No condition is permanent: The social dynamics of agrarian change in sub-Saharan
Africa. University of Wisconsin Pres.
Bourdieu, P. 1977. Outline of a Theory of Practice. Cambridge: Cambridge University Press.
Cancian, M., Meyer, D.R., & Cook, S.T. (2011). The evolution of family complexity from the perspective
of nonmarital children. Demography, 48, 957-982.
Carr-Hill, R. (2015). “Non-Household Populations: Implications for Poverty Globally and in the UK.”
Journal of Social Policy 44(2): 255-275.
Clark, S. and D. Hamplová. 2013. Single motherhood, poverty, and child mortality in sub-Saharan
Africa: A life course perspective. Demography 50(5):1521-1549.
Coleman, J. 1988. Social capital in the creation of human capital. American Journal of Sociology 94(supplement):
95-120.
Collinson, M. 2010. Striving against adversity: the dynamics of migration, health and poverty in rural South
Africa. Global Health Action 3:10.
Elder, G. 1987. Families and lives: Some developments in life-course studies. Journal of Family History 12(1-
3):179-199.
Finch, J. (2007). “Displaying Families.” Sociology 41(1): 65-81.
Fortes, M. (1983). Problems of identity and person. Identity: Personal and socio-cultural, 389-401.
Gage, S. 1997. Familial and socioeconomic influences on children's well-being: An examinatiotion of preschool
children in Kenya. Social Science and Medicine 45(12): 1811-1828.
Garenne, M. (2011). “Fifty years of research in African demography: progresses and challenges.” African
Population Studies 25(2): 151-167.
Hosegood, V. and I. Timaeus. 2006. Household composition and dynamics in KwaZulu Natal, South Africa:
mirroring social reality in longitudinal data collection. In E. Van de Walle (ed.) African Households: Censuses
and Surveys, New York: M.E. Sharpe 58-77.
Hosegood, V., McGrath, N., Herbst, K., & Timæus, I. M. (2004). The impact of adult mortality on
household dissolution and migration in rural South Africa. Aids, 18(11), 1585-1590.
Khalfani, A. K., & Zuberi, T. (2001). Racial classification and the modern census in South Africa, 1911–
1996. Race and society, 4(2), 161-176.
Kohler, H.P. (1997). Learning in social networks and contraceptive choice. Demography 34(3): 369-383.
Kwan, Mei-Po. (2000). Analysis of human spatial behavior in a GIS environment: Recent developments and
future prospects. Journal of Geographical Systems, 2(1), 85-90.
17
Madhavan, S., P. Mee and M. Collinson. (2014). “Kinship in Practice: Spatial Distribution of Children’s
Kin and Care Networks.” Journal of Southern African Studies. 40(15): 401-418. DOI:
10.1080/03057070.2014.906211.
Madhavan, S. and M. Gross. 2013. “Kinwork and Time Use in Rural South Africa.” Journal of
Comparative Family Studies 44(2): 175-191.
Manning, W., S. Brown and B. Stykes. 2014. “Family Complexity among Children in the United States.”
Annals of the American Academy of Political and Social Science 654(1): 48-65.
Morgan, D.H.S (1996). Family Connections. Cambridge: Polity Press.
Parker, E. and S. Short. (2009). “Grandmother co-residence, maternal orphans and school enrollment in sub-
Saharan Africa.” Journal of Family Issues.
Riesman, P. (1992). First find your child a good mother: The construction of self in two African
communities. Rutgers University Press.
Rushton, G. (2003). Public health, GIS, and spatial analytic tools. Annual Review of Public Health, 24 (1): 43-56.
Schatz, E. S. Madhavan, M. Collinson, X. Gomez-Olive and M. Ralston. 2014. "Dependent or
productive?: A look at older persons¹ social position and living arrangements in rural South Africa 2000-
2010." Research on Aging. DOI: 10.1177/0164027514545976.
Smith-Greenway, E. and S. Madhavan. 2015. “Maternal Migration and Child Vaccination in Benin: An Analysis
of Disruption and Adaptation Processes.” Social Science Research 54: 146-158.
Smith-Greenway, E. and J. Trinitapoli. 2014. Polygynous contexts, family structure and infant mortality in sub-
Saharan Africa. Demography 51: 341-366.
Townsend, N., S.Madhavan, M.Garenne, S. Tollman and K. Kahn. 2002. “Children’s Residence Patterns
and Well-Being in Rural South Africa.” Population Studies 56 (2): 215-225.
Van de Walle, E. (ed.) 2006. African Households: Censuses and Surveys, New York: M.E. Sharpe.
Weisner, T.S. 1997. Support for children and the African family crisis. In Weisner, T.S., Bradley, C., & P.
Kilbride. (Eds.) African families and the crisis of social change. Westport, CT: Greenwood Press/Bergin &
Garvey, pp. 20-44.
White, K. and S. Watkins. 2000. Accuracy, stability and reciprocity in informal conversational networks in rural
Kenya. Social Networks 22(4): 337-355.
Yeatman, S., & Trinitapoli, J. (2011). Best-friend reports: A tool for measuring the prevalence of
sensitive behaviors. American journal of public health, 101(9), 1666.

18
Table 1: Extent of knowledge about kin (%)
Full Dead Alive Older than 7*
Amount of Information Known
Level 1 (one piece of information) 16.2 14.3 3.5 1.1
Level 2 (two pieces of information) 8 62.9 31.8 4.2
Level 3 (three pieces of information) 75.7 22.7 64.7 7.8
Level 4 (four pieces of information) n/a n/a n/a 17.9
Level 5 (five pieces of information) n/a n/a n/a 68.3
Type of Information Not Known
Name not known 20.8 14.6 38.1 .34
Relationship to child not known 0 0 0 0
Survival status not known 19.9 n/a n/a n/a
Current age (if alive) not known n/a n/a 34.9 n/a
Age at death (if dead) not known n/a 77.2 n/a n/a
Current location not known** n/a n/a n/a 2.3
Education not known n/a n/a n/a 3.1
Employment status not known n/a n/a n/a 9.1
N 5,333 596 3,672 3,481
* we include those whose ages are listed as unknown based on relationship status which established all
these members as adults
**was only asked if person was non-resident (N=2388)
19
Table 2: Comparison of vernacular responses and objective measures of geo-spatial indicators
Objective Measures
Travel time (total n= 1347) Kilometers Most used Form of
Transport
<1 hour 2.20 Walk
1<3 hours 33.76 Matatu*
3<6 hours 95.65 Matatu
6<11 hours 277.95 Bus
11<24 hours 327.76 Bus
Do you regard trip as too far? (n-1343)
No 17.71 Walk/Matatu
Yes 250.35 Bus
Don’t know 74.72 n/a
Cost to visit (n=1341)
0-49 KSH 0.68 Walking
55-99 KSH 3.78 Matatu
100-249 KSH 10.36 Matatu
250-499 KSH 74.51 Matatu
500-999 KSH 116.70 Bus
>= 1000 KSH 279.79 Bus
Don’t know 314.90 n/a
Objective Measures
Travel time ( Kilometers Most used Form of
Transport
<1 hour 2.20 Walk
1<3 hours 33.76 Matatu*
3<6 hours 95.65 Matatu
6<11 hours 277.95 Bus
11<24 hours 327.76 Bus
Do you regard trip as too far? (n-1343)
No 17.71 Walk/Matatu
Yes 250.35 Bus
Don’t know 74.72 n/a
Cost to visit (n=1341)
0-49 KSH 0.68 Walking
55-99 KSH 3.78 Matatu
100-249 KSH 10.36 Matatu
250-499 KSH 74.51 Matatu
500-999 KSH 116.70 Bus
>= 1000 KSH 279.79 Bus
Don’t know 314.90 n/a
20
Table 3: Reporting on support provision by resident status and type of kin
All Resides in
Household
Resides out of
Household
Maternal*
Kin
Paternal
Kin
Provide any type
of support
82.1%
(2859)
99.6%
(1083)
74.4%
(1776)
96.6%
(2180)
36.6%
(223)
Financial 16.1%
(561)
27.2%
(295)
11.1%
(266)
19.5%
(440)
5.4%
(33)
Child Care 18.2%
(634)
49.5%
(536)
4.1%
(98)
19.2%
(434)
.9%
(6)
Emotional 81.9%
(2154)
99.5%
(1078)
74.2%
(1772)
96.5%
(2179)
36.6%
(223)
Potential Kin (N) 3481 1093 2388 2257 609
*The Ns are smaller because they do not include siblings of the child who are neither maternal nor
paternal
21
Figure 1. Coverage of Kinship Support Tree and Conventional Household Roster

22
Table 4. Distribution of responses to selected questions by placement on roster
2-6 7-9 10-13 14+
All Members (N=5385)
Name DK 9.6% 29.6% 36.4% 32.0%
Relationship to child DK 0.1% 1.0% 0.4% 0.2%
Survival Status
Yes 83.1% 59.8% 50.1% 45.0%
No 7.2% 11.4% 15.6% 23.9%
DK 9.6% 28.8% 34.3% 31.1%
N 2768 1226 922 469
Alive and over age 7 (N= 3483) )
Location DK* 6.5% 7.8% 10.7% 4.5%
Educational Status DK 7.9% 27.1% 38.4% 48.1%
Employment Status DK 19.1% 26.1% 32.5% 35.4%
N 2111 713 453 206
*N = 2388 because this was only asked for non co-residents