
Linking energy efficiency and innovation practices - IRIS ...
Upload
khangminh22Category
view
2download
0
INNOVATION PRACTICES AND PERFORMANCE OF
SMALL AND MEDIUM MANUFACTURING
ENTERPRISES IN KENYA
ESTHER WANJA NYOIKE
DOCTOR OF PHILOSOPHY
(Entrepreneurship)
JOMO KENYATTA UNIVERSITY OF
AGRICULTURE AND TECHNOLOGY
2018

Innovation Practices and Performance of Small and Medium
Manufacturing Enterprises in Kenya
Esther Wanja Nyoike
A Thesis Submitted in Partial Fulfilment for the Degree of Doctor of
Philosophy in Entrepreneurship in the Jomo Kenyatta University of
Agriculture and Technology
2018

ii
DECLARATION
This thesis is my original work and has not been presented for a degree in any other
university.
Signature…………………………………………. Date……………………………
Esther Wanja Nyoike
This thesis has been submitted with our approval as university supervisors.
Signature…………………………………………. Date……………………………
Dr. Patrick Karanja Ngugi, PhD
JKUAT, Kenya
Signature…………………………………………. Date……………………………
Prof. Willy Muturi, PhD
JKUAT, Kenya

iii
DEDICATION
To my husband Joseph, my sons, Kenneth and Erskine and my daughter, Martha. It is
through your support, patience and understanding that I made it.

iv
ACKNOWLEDGEMENT
Thanks to the almighty God without whose blessing this study would not have been
possible. I would like to express my sincere appreciation and thanks to my main
supervisor, Dr. Patrick Karanja for his encouragement, guidance and endless patience
during the program. I also would like to extend my sincere gratitude to my second
supervisor, Prof. Willy Muturi for his guidance, support and advice throughout the
process. I also convey my sincere gratitude to my brothers and sisters, for their best
wishes, prayers and support. Thanks to my friends and colleagues for sharing
knowledge and valuable assistance during my study.

v
TABLE OF CONTENTS
DECLARATION ........................................................................................................ II
DEDICATION .......................................................................................................... III
ACKNOWLEDGEMENT ....................................................................................... IV
TABLE OF CONTENTS ........................................................................................... V
LIST OF TABLES ................................................................................................... XI
LIST OF FIGURES .............................................................................................. XIII
LIST OF APPENDICES ....................................................................................... XIV
LIST OF ACRONYMS AND ABBREVIATIONS .............................................. XV
OPERATIONAL DEFINITION OF TERMS ................................................... XVII
ABSTRACT ............................................................................................................ XIX
CHAPTER ONE ......................................................................................................... 1
INTRODUCTION ....................................................................................................... 1
1.1 Background to the Study ..................................................................................... 1
1.1.1. Global Perspective on Innovation practices and Performance of SMMEs . 3
1.1.2. Kenyan Perspective on Innovation practices and Performance of SMMEs 4
1.1.3. Innovation practices .................................................................................... 5
1.1.4. Firm Performance........................................................................................ 7
1.1.5. Small and Medium Manufacturing Enterprises .......................................... 8
1.2 Statement of the problem .................................................................................. 11
1.3 Research objectives ........................................................................................... 12

vi
1.3.1 General Objective....................................................................................... 12
1.3.2 Specific Objectives..................................................................................... 12
1.4 Statistical Hypotheses ....................................................................................... 12
1.5 Justification of the Study ................................................................................... 13
1.6 Scope of the Study ............................................................................................ 13
1.7 Limitations of the Study .................................................................................... 13
CHAPTER TWO ...................................................................................................... 15
LITERATURE REVIEW ......................................................................................... 15
2.1 Introduction ....................................................................................................... 15
2.2 Theoretical Review ........................................................................................... 15
2.2.1 Creativity .................................................................................................... 16
2.2.2 Organizational Structure ............................................................................ 17
2.2.3 Research and Development ........................................................................ 18
2.2.4 Commercialization ..................................................................................... 19
2.2.5 Entrepreneurial Orientation ........................................................................ 21
2.3 Conceptual Framework ..................................................................................... 22
2.3.1 Creativity .................................................................................................... 24
2.3.2 Organizational Structure ............................................................................ 25
2.3.3 Research and Development Capability ...................................................... 27
2.3.4 Commercialization ..................................................................................... 29
2.3.5 Entrepreneurial Orientation and Firm Performance ................................... 31
2.3.6 Moderating Role of Entrepreneurial Orientation on the Relationship
between Innovation practices and Firm Performance ......................................... 33
2.3.7 Innovation practices concept ...................................................................... 34

vii
2.4 Empirical review ............................................................................................... 35
2.4.1 Creativity .................................................................................................... 35
2.4.2 Organizational Structure ............................................................................ 36
2.4.3 Research and Development ........................................................................ 37
2.4.4 Commercialization ..................................................................................... 38
2.4.5 SMMEs performance ................................................................................. 38
2.5 Critique of the existing literature ...................................................................... 39
2.6 Summary of Literature ...................................................................................... 42
2.7 Research Gaps ................................................................................................... 43
CHAPTER THREE .................................................................................................. 45
RESEARCH METHODOLOGY ............................................................................ 45
3.1 Introduction ....................................................................................................... 45
3.2 Research Design ................................................................................................ 45
3.2.1 Research Philosophy .................................................................................. 46
3.3 Population of the study ..................................................................................... 46
3.4 Sampling Design ............................................................................................... 47
3.5 Data Collection and Instrumentation ................................................................ 51
3.6 Pilot study ......................................................................................................... 51
3.6.1 Reliability of data collection instruments .................................................. 52
3.6.2 Validity of data collection instruments ...................................................... 52
3.7 Data Analysis .................................................................................................... 53
3.7.1 Statistical Modelling .................................................................................. 54
3.7.2 Operationalization of study variables......................................................... 59
3.7.3 Test of significance .................................................................................... 60

viii
CHAPTER FOUR ..................................................................................................... 62
RESEARCH FINDINGS AND DISCUSSION ....................................................... 62
4.1 Introduction ....................................................................................................... 62
4.2 Response Rate ................................................................................................... 62
4.3 Results for the Pilot Study................................................................................. 63
4.3.1 Test for construct validity .......................................................................... 64
4.3.2 Reliability ................................................................................................... 68
4.4 Demographic Profile of Respondents. .............................................................. 69
4.4.1 Gender Distribution .................................................................................... 69
4.4.2 Length of Continuous Service with the Firm ............................................. 69
4.4.3 Level of Education ..................................................................................... 70
4.4.4 Sector Distribution of the Respondents. .................................................... 71
4.4.5 Relationship with the Firm ......................................................................... 72
4.5 Descriptive analysis .......................................................................................... 72
4.5.1 Creativity .................................................................................................... 73
4.5.2 Organizational Structure ............................................................................ 77
4.5.4 Commercialization ..................................................................................... 84
4.5.5 Entrepreneurial orientation......................................................................... 88
4.5.6 SMMEs Performance ................................................................................. 91
4.6 Statistical Modelling ......................................................................................... 93
4.6.1 Linear regression for Creativity and performance of SMMEs................... 93
4.6.2 Linear regression for Organizational Structure and Performance of
SMMEs ............................................................................................................... 96

ix
4.6.3 Linear regression for Research and Development and Performance of
SMMEs ............................................................................................................... 99
4.6.4. Linear regression for Commercialization and Performance of SMMEs . 102
4.6.5 Entrepreneurial Orientation (Moderation Effect Test) ............................. 105
4.7. Hypotheses Testing ........................................................................................ 111
4.8. Multiple Regression (Combined Effect Model) ............................................. 115
4.9 Diagnostic Tests of Variables ......................................................................... 119
4.9.1 Normality ................................................................................................. 120
4.9.2 Autocorrelation ........................................................................................ 121
4.9.3 Homoscedasticity ..................................................................................... 122
4.9.4 Mulitcollinearity ....................................................................................... 123
4.10 Optimal Model .............................................................................................. 124
CHAPTER FIVE ..................................................................................................... 127
SUMMARY, CONCLUSION AND RECOMMENDATIONS ........................... 127
5.1 Introduction ..................................................................................................... 127
5.2 Summary of the Study Findings ...................................................................... 127
5.2.1 The influence of commercialization on performance of SMMEs in Kenya
........................................................................................................................... 128
5.2.2 The effect of an organizational structure on performance of SMMEs in
Kenya ................................................................................................................ 128
5.2.3 The influence of Research and Development on performance of SMMEs
........................................................................................................................... 129
5.2.4 The influence of creativity on performance of SMMEs in Kenya ........... 129

x
5.2.5 Moderating effect of entrepreneurial orientation on the relationship
between innovation practices and performance of SMMEs in Kenya. ............. 130
5.3 Conclusion ...................................................................................................... 130
5.4 Recommendations ........................................................................................... 132
5.5 Contribution of the study to the Body of Knowledge Theory and Practice .... 133
5.5.1 Implication of the study to practice .......................................................... 134
5.5.2 Theoretical implications of the study to the body of knowledge ............. 134
5.6 Areas for Further Research ............................................................................. 135
REFERENCES ........................................................................................................ 136
APPENDICES ......................................................................................................... 172

xi
LIST OF TABLES
Table 3.1: Kenya‘s Manufacturing Firms registered with KAM as at June 2015 ..... 47
Table 3.2: The Sample Size ....................................................................................... 50
Table 3.3: Operationalization of Study Variables ...................................................... 60
Table 4.1: Response Rate ........................................................................................... 63
Table 4.2: Average Variance Extracted ..................................................................... 65
Table 4.3: Correlations ............................................................................................... 66
Table 4.4: Squared correlations and AVE .................................................................. 66
Table 4.5: KMO and Bartlett‘s Test of Sphericity ..................................................... 67
Table 4.6: Reliability .................................................................................................. 68
Table 4.7: Gender ....................................................................................................... 69
Table 4.8: Length of Continuous Service in the Firm ................................................ 70
Table 4.9: Level of Education .................................................................................... 71
Table 4.10: Distribution of respondents by Sector ..................................................... 71
Table 4.11: Relationship with the Firm ...................................................................... 72
Table 4.12: Creativity Indicators ................................................................................ 76
Table 4.13: Organizational Culture ............................................................................ 80
Table 4.14: Research and Development ..................................................................... 83
Table 4.15: Commercialization .................................................................................. 87

xii
Table 4.16: Entrepreneurial orientation ..................................................................... 90
Table 4.17: Performance of SMMEs ......................................................................... 91
Table 4.18: Financial Performance of SMMEs .......................................................... 93
Table 4.19: Regression results for creativity .............................................................. 96
Table 4.20: Regression results for organizational structure ....................................... 99
Table 4.21: Regression results for research and development ................................. 102
Table 4.22: Regression results for commercialization ............................................. 105
Table 4.23: Moderating Effect Model Estimation ................................................... 110
Table 4.24: Summary of Hypotheses Testing .......................................................... 115
Table 4.25: Multiple Regression .............................................................................. 119
Table 4.26: Normality Test ...................................................................................... 121
Table 4.27: Autocorrelation ..................................................................................... 121
Table 4.28: H0: The Residuals Exhibit Homoscedasticity ....................................... 123
Table 4.29: Multicollinearity.................................................................................... 124

xiii
LIST OF FIGURES
Figure 2.1: Hypothesized distribution of adopter categories within a typical
population. ............................................................................................. 21
Figure 2.2: Conceptual Framework ........................................................................... 23
Figure 4.1: Scatter plot for Creativity and Performance ............................................ 94
Figure 4.2: Scatter Plot for Organizational Structure and Performance .................... 97
Figure 4.3: Scatter plot for Research and Development and performance .............. 100
Figure 4.4: Scatter plot for commercialization and performance ............................ 103
Figure 4.5: Moderating effect of EO on the Relationship between Creativity and
Performance. ........................................................................................ 112
Figure 4.6: Moderating Effect of EO on the relationship between Organisational
Structure and Performance. .................................................................. 113
Figure 4.7: Histogram .............................................................................................. 120
Figure 4.8: Scatter plot of Residual Term ................................................................ 122
Figure 4.9: Revised conceptual framework ............................................................. 126

xiv
LIST OF APPENDICES
Appendix I: Questionnaire ....................................................................................... 172
Appendix II: Interview Schedule ............................................................................. 180
Appendix III: Sample Size Calculation Table ......................................................... 182
Appendix IV: Factor loadings matrix ...................................................................... 183
Appendix V: Durbin Watson Tables ........................................................................ 193
Appendix VI: Small and Medium Manufacturing Firms (List of 2017)Building,
Mining and Construction Industry .................................................. 194

xv
LIST OF ACRONYMS AND ABBREVIATIONS
ANAS Agent Network Accelerator Survey
ATMs Automatic Teller Machines
BD Business Daily
BT Business Times
CBK Central Bank of Kenya
CCK Communications Commission of Kenya
CIS Community Innovation Survey
EAC East African Community
EFTA European Free Trade Area
EO Entrepreneurial Orientation
EU European Union
FSD Financial Sector Deepening
GDP Gross Domestic Product
GM General Motors
ICU Industrial and Commercial Union
KAM Kenya Association of Manufacturers
KBA Kenya Bankers Association
KCB Kenya Commercial Bank
KES Kenya Shilling
KIPPRA Kenya Institute for Public Policy and Research and Analysis
MFIs Microfinance Institutions
MMR Moderated Multiple Regression
NCSES National Centre for Science and Engineering Statistics

xvi
NSF National Science Foundation
NTIC National Trends and International Comparisons
NWSC National Water and Sewerage Corporation
OLS Ordinary Least Squares
R&D Research and development
ROA Return on assets
ROE Return on Equity
ROI Return on Investment
RoK Republic of Kenya
SMEs Small and Medium Enterprises
SMMES Small and Medium Manufacturing Enterprises
ULMC Unmeasured Latent Method Construct
USBLS United States Bureau of Labour Statistics
US United States
USD United States Dollar

xvii
OPERATIONAL DEFINITION OF TERMS
Agent banking Agent banking means providing limited scale banking
and financial services to the underserved population
through engaged agents under a valid agency agreement
rather than a teller/cashier (Ndungu & Njeru, 2014).
Commercialization Commercialization is the process of translating research
knowledge into new or improved products, processes and
services and introducing them into the market place to
generate economic benefits (Ardito, 2014).
Creativity Creativity refers to the ability to develop new product,
new ideas and to discover new ways of looking at
problems and opportunities (Hans, 2014).
Daktari 1525 Daktari 1525 is a teletriage service that enables customers
to get information on various medical issues through the
phone on a 24-hour basis (Otieno, 2014).
Entrepreneurial Orientation Entrepreneurial orientation refers to the extent to
which a firm is entrepreneurial (Sandra, 2011).
Manufacturing Manufacturing is the mechanical, physical, or chemical
transformation of materials, substances, or components
into new products (USBLS, 2014).
M-Kopa M-Kopa is a mobile technology company based in
Nairobi that has established an innovative system to
make life changing energy solutions affordable to low
income customers (Mwema, 2015).

xviii
M-Pesa M-Pesa is a short message based money transfer system
that allows individuals to deposit, send and withdraw
funds using their mobile phones (Ignacio & Dan, 2012).
Organizational Structure An organizational structure refers to permanently
distributing work roles and administrative mechanisms to
enable an organization to perform, coordinate and control
its business activities and resource flows (Miller, 2011).
Innovation Innovation refers to the introduction to the market of a
new product/service that is new or significantly improved
with respect to its characteristics or intended uses
(Moses, Sithole, Labadarios, Blankley & Nkobole, 2012).
Research and Development Research and Development (R & D) refers to all
creative work undertaken on a systematic basis in order
to increase the stock of knowledge and the use of this
stock to devise new applications, such as new and
improved products and processes (Andrea & Marco,
2013).
Small and Medium Manufacturing Enterprises (SMMEs) A small and medium
enterprise is a formally registered entity with 5 to
150employees and a turnover of below US dollars 5
million (Maina, Kiragu, Butoyi, Scholastica, Michira &
Nkatha, 2010).

xix
ABSTRACT
In the global economy of the 21st century, competition is complex, challenging and
fraught with competitive opportunities and threats. Innovation practices are
increasingly becoming the main focus for entrepreneurs especially those in the
manufacturing sector. Without effective innovation practices, the capability of a firm
to achieve or sustain a competitive advantage is greatly constrained. Most SMMEs in
Kenya post poor performance and majority of them do not celebrate their third
birthday. Research on innovation practices and its dimensions may lead to improved
performance especially for the manufacturing sector that is supposed to account for
20% of the GDP by the year 2030, as visualized in the Kenya vision2030. This study
examines the influence of innovation practices on the performance of Small and
Medium Manufacturing Enterprises (SMMEs) in Kenya. The objectives of the study
were to determine how creativity, organizational structure, research and development
and commercialization influence SMMEs performance. Entrepreneurial orientation
moderated the relationship between innovation practices and SMMEs performance.
This study would benefit the industry, SMMEs owner managers, financial
institutions, researchers and the government. A representative sample of 254
managers or entrepreneur owner managers was selected from manufacturing firms
registered under Kenya Association of Manufacturers using stratified random
sampling. A self-administered, semi-structured questionnaire was used to collect the
data. The questionnaire was pre-tested to ensure its validity and reliability. The study
collected both qualitative and quantitative data. Qualitative data was analysed using
content analysis while quantitative data was analysed by descriptive and inferential
analysis. The regression analysis model was developed to establish the relationship
between the dependent and the independent variables. Data was presented, from
which inferences were made as well as the conclusion and recommendations. The
study found that commercialization, organizational structure, Research and
Development and creativity were all individually significant predictors of SMMEs
performance. The results also revealed that entrepreneurial orientation significantly
moderated the relationship between innovation practices and SMMEs performance.
Overall, the study demonstrated positive relationship between innovation practices
and SMMEs performance. This study recommends that factors associated with
innovation practices need to be enhanced in SMMEs by including them in the vision
and mission statements as they have the greatest impact on SMMEs performance.
SMMEs should also be encouraged to increase their entrepreneurial intensity levels
for superior performance.

1
CHAPTER ONE
INTRODUCTION
1.1 Background to the Study
This study focused on the influence of innovation practices on performance of small
and medium manufacturing enterprises (SMMEs) in Kenya. The manufacturing
sector plays a critical role in not only improving the overall performance of the global
economy, but also in driving innovation for long-term sustainable economic growth
(Kennedy, 2013). A study by UNIDO (2015) revealed that the world manufacturing
sector has continued to struggle in its growth as a result of the global crisis of the year
2009. The pace of growth of the manufacturing sector has over the past few years
decelerated. Small and medium enterprises (SMEs) in the sector need to constantly
innovate in order to ensure improved performance and success of their enterprises.
Tucker (2011) posited that innovation is the best way of stimulating improved
performance in a firm. The most innovative firms realize higher turnover of products
and services introduced within a period of time. A study by Freeman (1982) asserted
that to choose to be non-innovative is to choose death of an organization. It is for
these reasons that measures should be taken to reduce the challenges defacing the
sector.
The influence of innovation practices on firm performance has been one of the issues
of most importance in recent literature. Innovation refers to the introduction to the
market of a new product or service that is new or significantly improved with respect
to its characteristics or intended uses (Moses, Sithole, Labadarios, Blankley &
Nkobole, 2012). Innovation practices represent the provision of solutions to market
threats and opportunities, thus creating the basis for the survival and success of the
firm into the future (Rick, Andy & Jacob, 2015; Michael, 2012). Several scholars (Li,
Su, and Liu, 2010; Dobbin, Lassen and Nelson, 2015) argued that innovation
practices enabled a company to gain competitive advantage, establish a leadership
position in the market, develop entry barriers, formulate new distribution channels
and gain new customers to advance market position. A study by Fadaee (2014)

2
asserted that innovation practices was market-focused and primarily customer driven
and therefore, had an important performance implications.
A study by Kaya and Agca (2014) posited that creativity is the seed of all
innovations. Amabile (2012) argued that creativity truly enhanced innovation when
senior management provided sufficient resources that included an array of elements:
technological expertise, adequate time for developing novel work, training, teams,
motivation, sufficient funds and material resources. It is widely accepted that creative
activities and the resulting innovations emanating from them were key to driving US
competitiveness and prosperity (Porter & Rivkin, 2012). Several studies (Mihaicz,
2012; Kleinscmidt, Schultz, Salomo, and, De Brentani, 2013) showed that the
structure of a firm is related to innovation. Mihaicz (2012) mentioned eight
dimensions of an organization structure: formalization, specialization,
standardization, centralization, professionalism, complexity, hierarchy of authority
and personal ratios that influence innovation practices. A study by Kleinschmidt et al
(2013) argued that an organizational structure based on formal, functional,
professionalism and formal control may increase innovations in a firm. Formal and
centralized structures had a positive impact on innovation (Andrews, 2012).
Research and development played a vital role in a firm‘s growth, innovation and
development (Pang & Chih, 2012). A study by Cooper (2011) asserted that R & D
were a major source of innovation for more established firms. Proper utilization of
technology by a firm could significantly decrease the time for R & D and promote
innovations significantly (Peled & Dvir, 2012). Commercialization of innovation was
essential for the overall performance of an innovative firm (Walsh, 2012). Albino,
Ardito, Dangelico and Messeni (2013) argued that commercialization is the final
phase of innovation process. The economic benefits of a new innovation are never
fully realised until the innovation is actually introduced to the market (Datta, Reed &
Jessup, 2013). Entrepreneurial orientation is a precursor of innovation and thus
management in firms is encouraged to adopt entrepreneurial orientation in order to
develop innovative capabilities (Rosli, 2015). A study by Killa (2014) found a
positive effect of entrepreneurial orientation on innovation practices which implied
that the higher the level of entrepreneurial orientation of the firm the higher the

3
degree of innovation practices. Entrepreneurial orientation created a favourable
environment in which firms developed innovation practices capabilities and through
these capabilities they enjoyed superior performance outcomes (Kaya & Agca, 2014).
1.1.1. Global Perspective on Innovation practices and Performance of SMMEs
The National Trends and International Comparisons (NTIC) (2012) survey revealed
that the worldwide innovations and Research and Development (R&D) expenditures
totalled an estimated $1, 276 billion in 2009. The United States was by far the largest
innovative and R&D performer ($402 billion) in 2009, accounting for about 31% of
the global total expenditures. However this was a decline from 38% in 1999 to 31%
in 2009. Inadequate investment in innovation practices resulted to negative growth of
SME‘s in the manufacturing sector in many economies of the world. In the United
States (U.S) only 4,098 new agreements to license innovations were registered and
revenue generated from innovations amounted to only $24,452 million. This was far
less below the projected revenue in 2011 (NSF/NCSES, 2011).
Although China is emerging as a powerful economy, there is still a significant wide
variation across provinces regarding new product output, new product intensity and
the share of new product firms. The inland provinces such as Mongolia, Guizhou,
Qinghai and Ningxia had limited new product output. The inner provinces were the
least innovative with growth rate ranging from Mongolia (0.5%), Tibet (0.8%) and
Xinjiang (1.3%). The inner provinces had the lowest percentage of new product firms
at 1.1% to 2.9%. These findings suggested that there were large disparities in
innovation practices across regions in China (Zhang 2014; 2010; Lin, Li & Yang,
2011; Martin, Mayer & Mayneris, 2011). A study on innovation indicators and
performance for Danish firms revealed an insignificant Heckman‘s value. The Mills
ratio was also negative suggesting that there were unobserved characteristics that
increase the probability of being innovative (Cater & Schwab, 2008).
The South Africa innovation survey (2012) revealed that 34.6% of enterprises
reported no innovation activities at all. The non-innovative enterprises accounted for
7,915 firms and only employed about 0.27 million employees. This indicated that
innovation tends to create employment (Moses, Sithole, Labadarios, Blankley &

4
Nkobole, 2012). M-Pesa had notable success where Vodacom Tanzania had 3.6
million M-Pesa customers out of its 11.6 million mobile subscribers as at June 2012,
representing a mobile money penetration rate of 31%, however, this was far much
below the projected market share in 2012 (Jack, William, Suri & Tavneet, 2012;
CCK, 2012; Mutiga 2014; Saylor & Michael, 2012).
In Uganda, ―e.water‖ is a new innovation that enabled water consumers to pay their
bills through their phones. Within four months of the ―e.water‖ launch, in March
2011, over 20,000 of the National Water and Sewage Corporation (NWSC) account
holders had switched to the mobile money option, accounting for 10% of the total
customer base. In excess of USD 300,000 worth of water bills were paid via mobile
money channels, 80% of which derived Kampala. MTN was the dominant player,
accounting for 95% of water service revenue collected through mobile money
channels (KBA, 2012; Equity bank, 2013; Hope, Foster, Krolikowski & Cohen,
2011).
1.1.2. Kenyan Perspective on Innovation practices and Performance of SMMEs
Safaricom was ranked the ninth most innovative company in the world in 2013. A
report entitled ―Global Online Payment Methods, 2014‖ disclosed that, there were 25
million M-Pesa account holders, where more money than Kenya‘s national budget of
KES 2 trillion was transacted annually. The report added that online and mobile
payments worldwide were forecast to KES300 trillion in the next five years (CBK,
2014; Kariuki, 2015; Mutiga, 2014; Saylor & Michael, 2012; Mugo, 2014). The M-
Pesa users increased from 41% in 2009 to 67% currently. The mobile money
contributed 6.59% of the total national payments. Over two thirds of the Kenyan
adult population was subscribed to mobile money transfer services and 78% of this
number used M-Pesa, where Individuals sent money to others via their phone through
a network of over 60,000 local agents (CBK 2014; Kariuki, 2015).
Bank agents conducted over 92 million deals worth KES 500 billion by March 2014
compared to 39 million transactions worth KES 250 billion done from 2010 to march
2013. As at march 2014, there were 14 banks which had appointed 24,645 agents,
who executed over 92.61 million transactions valued at over KES 498.97 billion

5
since 2010 (CBK, 2014; Equity bank, 2013; ANAS, 2013; Nganga & Mwachofi,
2013). A recent study by the Financial Sector Deepening (FSD) Kenya (2014)
showed that agents had significantly increased access to banking services with 52%
of the country‘s population being within three kilometres of an agent compared with
only 22% within three kilometres of a branch.
M-Kopa was ranked the world‘s top ten most innovative companies of 2015 in
Africa. M-Kopa solar introduced a Safaricom-branded solar lighting system which
provided clean lighting solutions to millions of homes at a cost of KES 40 daily. M-
Kopa conected 2000 homes every week and had already connected 90,000 Kenyan
homes (CBK, 2015; Mureithi, 2014). More than 500,000 resource proof farmers
benefited from tissue culture banana technology transfer that earned the Kenyan
farmer an average of KES 5.5 billion. It was expected to hit KES 20 billion by 2015.
The area under banana production increased from 43,000 hectares in 1996 to 96,000
hectares to date and has uplifted Kenyans living beyond the poverty line to earn $3
per day (CBK, 2014; Eijkman, 2013). Daktari 1525 is a 24/7 innovation product that
was launched in 2011. Daktari 1525 is a 24/7 call-in service that for a small fee,
connects callers one-on-one with a doctor. It had a pool of 50 doctors, and it
anticipated to get more customers calling and more Kenyans healthy (ANAS, 2014).
1.1.3. Innovation practices
Innovation practices are fundamental instruments of growth strategies to enter new
markets, increase the existing market share and provide a company with a
competitive edge (Walter 2015; Alex 2014). Innovation is the introduction to the
market of a new product/service that is new or significantly improved with respect to
its characteristics or intended uses (Moses et al, 2012). There are four broad levels of
novelty of innovations that are defined in relation to the firm and the market levels:
innovations that are new only to the firm; innovations that are new to the market of
the firm and its competitors; innovations that are new to the country and innovations
that are a world first (Moses et al, 2012). Several studies (Rosenbuch, Brinckmann &
Bausch, 2011; Chiara et al., 2015) suggested that innovation practices were key
drivers of economic performance and growth of small firms. However many

6
economies in the world reported a declining trend in innovative activities. In the
United States (US) and the European Union (EU) member states there was a decline
in innovations from 1,592,420 in 2008 to 1,152,211 in 2009, a decrease of 28 %
(ICU, 2011).
The ability to pursue innovation practices is increasingly viewed as the single most
important factor in developing and sustaining competitive advantage. It is no longer
adequate to do things better, it is about doing new and better things (Dobin, Mark &
Nelson, 2015). In China, every year organizations spend millions of dollars in
research and development activities due to the fact that the reputation of those
organizations is inexorably associated with innovation practices (Henard & Dacin,
2010). A study by Calvo, (2011) stated that more than half of product innovative
firms in Spanish manufacturing firms did not expend in research and development.
A Survey by the Community Innovation Survey (CIS), covering European Union
(EU) and European Free Trade Association (EFTA) member states, reported that, the
share of innovative enterprises decreased by 3.9% during the period 2010-2012
among the EU member states. The highest shares of innovative enterprises during the
period 2010-2012 was Germany (66.9%), Luxembourg (66.1%), Ireland (58.7%) and
Italy (56.1%) and this was a decline from the previous period (CIS,2012). In Kenya,
only a few firms have introduced innovations that are new to the Kenyan market. In
the Kenyan manufacturing sector only a third of firms have developed their own
innovations (Gichana, Elegwa & Romanus, 2013; Mwangi & Namusonge, 2014).
Although there is availability of innovation literature, most innovation research
ignores SMMEs and only focuses on large firms (Sung, Kim & Choi, 2015; Walter,
2015). Rosli (2015) one of the authorities in innovation research stated that ―not to
innovate is to die‖. On the downside, small firms have limited resources for
innovation initiatives (Mohd, Zuhriah & Norsian, 2014; Alex, 2014). Lack of
financial resources to cover the cost of innovation was identified as a key barrier in
several studies (Suswatika, Ann & Southgate, 2014; Matanda, 2013; Maria, Mario &
Fatima, 2014; Maleya & Muturi, 2013). These constraints exacerbate the risks of
innovation for small firms, which cannot sustain many failures (Mark, 2014; Simiyu,

7
2013). Beside limited financial and other material resources, small firms may lack
technological expertise of their large firms counterparts (Mary & Leslie, 2014; Ali,
2015) especially the R &D and marketing capabilities to exploit new products (Funda
& Cihan, 2014; Jochen, 2014; Mikel, 2014).
1.1.4. Firm Performance
Firm‘s performance is generally defined as the firm‘s level of goal accomplishment
(Miguel & Elena, 2009). The measurement of firm performance in different empirical
researches vary as scholars select concepts of different levels of performance
according to the objective in empirical study, including operating performance
(Simiyu, 2013; Mikel, 2014; Chiara et al, 2015); financial performance, (Mary &
Leslie, 2014; Vittoria et al, 2014; ), new product performance (Dobin et al, 2015; Bin
& Wei-qiang, 2013) and innovation performance (Suwastika et al, 2014; Yan &
McKern, 2013). Performance improvement is the primary goal of all entrepreneurial
firms as it demonstrates the level of success of its business operations (Janine &
Linderman, 2013; Ljiljana & Durdana, 2015; Marie & Alan, 2014). Various firm
performance measurements have been applied in previous studies. However, majority
of these studies did not provide any justification for the selection of measures used,
and there was no agreement among entrepreneurship scholars on the assignment of an
appropriate set of measurements (Madsen, 2007).
You and Liu, (2010) stated that firm performance refers to an organizational
effectiveness in terms of its financial and operational performance, and a number of
indicators were used to measure it, including finance, efficiency, customer
satisfaction, value addition, and market share. To capture different aspects of firm
performance, multiple measures, that is, financial and non-financial were employed.
However, most studies apply only financial measurement to assess performance, with
firm performance being investigated as the dependent variable (Mohd & Syam,
2013). The three dimensions used in the financial measurement were efficiency,
growth and profit. The Sung, Kim, and Choi (2015) model identified several
performance measures including sales, growth, market share, profitability, overall
performance and stakeholders‘ satisfaction. Financial measures of success include

8
Return on Investment (ROI), Return on Equity (ROE), Return on Asset (ROA) or
market share are used as measure of firm performance. This study adopted sales
turnover, profitability and return on investment as performance measures.
1.1.5. Small and Medium Manufacturing Enterprises
Small and Medium Manufacturing Enterprises (SMMEs) play a crucial role in
driving economic growth in both developing and developed economies (Asieh, 2015;
Wanjau, 2010). Their importance is not limited to adding value but also creates jobs
and drives the innovation for long-term sustainable growth. According to UNIDO
(2013) the manufacturing SMEs were struggling to grow as a result of the global
financial crisis of the year 2009 and this resulted in developing countries being the
main engine in the growth of the global manufacturing. In the United States SMEs
represent an overwhelming majority of businesses and account for almost half of the
GDP (Kiprem, Peng & Pollard, 2011). The United States Small Business
Administration (2012) reported that SMMEs created two-thirds of all new jobs and
invested more than half of all technological and innovation products. Similarly in
Thailand, the largest number of businesses was comprised of SMMEs. A study by
Ahu (2015) suggested that the catalytic roles of SMMEs and cottage businesses had
been displayed in many economies of the world such as Japan, South Korea,
Malaysia, Zambia and India among others.
According to Klynveld Peat Goerelder (KPMG) International 2015, China‘s growth
in its GDP slowed down from the year 2013-2014 to stand at 74% partly due to the
challenging environment in the manufacturing sector. The manufacturing sector in
South Africa contributed significantly to its economy but its importance declined
from 19% in 1993 to 17% in 2012. The contribution to GDP was 13.9% lower than
that of the service sector which stood at 73% (Tarboda, 2015). The newly
industrialized countries such as South Korea, Malaysia and Taiwan experienced
development and economic growth because they accorded SMEs the right conditions
to flourish (Nafukho, Machuma & Muyia, 2009).

9
The East African Community (EAC) is one of the regional integration bodies which
comprise of Kenya, Uganda, Tanzania, Rwanda and Burundi (EAC, 2010). It has led
to the expansion of market for manufacturing firms, and also a moderating influence
on performance of manufacturing firms. Regional integration presents a challenge to
firms accustomed to operating within the domestic market. The challenges were in
form of increased number of competing firms, lower production and marketing costs,
larger market and greater pressure on firms to regionalize (Wiklund & Shepherd,
2005). Regionally, Tanzania‘s manufacturing SMEs continued to lag behind than
those of the other countries in the region in terms of quantity and quality of the
industrial goods that were produced and exported due to its reliance on agricultural
sector. In Uganda SMMEs have been struggling and experienced a slow growth
below the Sub-Saharan Average (ROU, 2010). The sector‘s contribution to the
Uganda‘s GDP lagged behind than that of the other countries such as Kenya, Rwanda
and Burundi (KIPPRA, 2014).
In Kenya, Economic Recovery Strategy (ERS) estimated that 500,000 jobs would be
created annually with 88% of those generated by SMES. Christian and Alexander
(2013) observed that SMMEs generated new jobs in the economy and new products
and services that facilitated economic growth. The economic impact of SMMEs can
be measured by their contribution to output, innovations, employment, income
investments, exports and their economic indicators (Jochen, 2014). In Kenya SMMEs
employ 74% of the labour force and contribute over 18% of the country‘s GDP. In
addition, more than 90% of business comes from this sector and this makes up 30%
of total employments (Ndalira, 2013).
The performance of SME‘s in the manufacturing sector is still dismally low. The
manufacturing value added contribution made by MSEs increased, though the
contribution was still low, accounting for 14.2 per cent yet two thirds (67%) of
manufacturing firms are micro and small enterprises (KIPPRA, 2013). This dismal
performance is likely to slow down the path of economic development as envisioned
by vision 2030 strategic plan which encourages adoption of innovation practices. The
Kenyan Vision 2030 (RoK, 2008) envisaged a vibrant manufacturing sector as one of
the key sectors meant to make the economy industrialize by the year 2030. However,

10
the manufacturing sector has recorded poor performance in the past contributing a
dismal 14.2% to the country‘s value addition (Kippra, 2013). This phenomenon not
only paints a gloomy picture of the sector, as a one of the key pillars of economic
growth, but also threatens to slow down the realization of vision 2030 dream. The
manufacturing SME firms outperformed large industries in terms of growth and job
creation (Kippra, 2013). The manufacturing sector‘s contribution to Gross Domestic
Product (GDP) was 10% in 2014 (RoK, 2015). However, the Kenya vision 2030
stipulates that the sector should account for 20% of GDP (RoK 2008). These
manufacturing SME‘s in the country are likely to perform even better when they fully
embrace and get committed to their innovation practices.
Manufacturing sector is vital for Kenya‘s economic growth. Its performance is
measured in growth, employment creation and contribution to the country‘s overall
output and exports (KER, 2012). The share of manufacturing sector‘s employment to
overall formal employment stood at an average of 13%. The contribution of the sector
to the GDP declined since 2011. In the year 2011 the contribution fell from 9.6% to
9.2% in 2012 while growth rate deteriorated from 3.4% in 2011 to 3.1% in 2012.
These changes were attributed to high costs of production, stiff competition from
imported goods, high costs of credit and drought incidences in 2012 (KNBS, 2013).
A study by Sung, Kim and Choi (2015) revealed that SMMEs play a significant role
in promoting economic growth through the introduction of innovative ideas, products
and business methods. In today‘s competitive world, the survival of SMMEs depends
on innovation, creativity and entrepreneurship (Chiara et al, 2015; Rick et al, 2015).
Several studies (Tarus and Nganga, 2013; Mwangi and Namusonge, 2014) revealed
that SMMEs have been facing critical challenges; high level of attrition and negative
performance. In 2014, a number of SMMEs posted a negative growth: Meat and meat
products processing firms declined by 0.4%, leather shoes 0.4%, industrial gas 4.2%,
T-shirts and knitted fabrics 12.1% and 8.6% respectively, fish processing and
preserving firms 17.9% and shoe polish, 12.2% just to name a few (RoK, 2015). This
alarming trend proofed that there is need to focus on SMMEs issues.

11
1.2 Statement of the problem
Small and medium enterprises in Kenya are faced with many challenges. A study by
Tarus and Ng‘ang‘a (2013) revealed that small and medium manufacturing
enterprises in Kenya have been facing critical challenges of low performance,
declining trend in innovative activities and a high level of attrition. This is despite the
fact that they are an important factor in the attainment of the Kenya vision 2030,
which stipulates that the manufacturing sector should account for 20% of the GDP
(RoK, 2007). The manufacturing sector can facilitate the achievement of the Kenya
vision 2030 objective through the introduction of novel products or by significantly
improving the existing products with respect to their characteristics or intended uses.
Although Small and Medium Manufacturing Enterprises (SMMEs) accounted for
70% of Kenya‘s manufacturing sector (KIPPRA, 2014), their performance dropped
from 5.6% in 2013 to 3.4% in 2014 (RoK, 2015). Despite SMME‘s significant
contribution to GDP in Kenya they were still not performing as expected. This was
the reason why in 2014, a number of SMMEs in Kenya: meat and meat products
processing firms, leather shoes, industrial gas, t-shirts and knitted fabrics, and shoe
polish among others all posted negative performance resulting to low sales turnover
and profitability (RoK, 2015). If such failures are not checked, they may lead to
lowering of GDP due to low productivity and consequently low sales turnover and
profit margins for many firms thus resulting to poor performance.
The challenges facing SMMEs may be partly be addressed by innovation practices as
they are suggested as key drivers of economic performance and growth of small firms
(Rosenbunch, Brinckman & Bauch, 2011; Chiara Daniela & Analisa, 2015). A study
by Wanjiku (2011) on industrial innovation in the face of stiff competition from
Chinese imports did not specifically focus on innovation practices. Ndalira (2013)
studied Effects of the type of innovation on the growth of SMMEs in Kenya but did
not specifically study innovation practices in the manufacturing sector. Khiu, Ahmad
and Ramayah (2010) studied innovation among Information and Communication
Technology techno-preneurs in Malaysia but used a small sample of five software
firms and hence their results could not be generalized. Atalay (2013) studied the

12
relationship between innovation and firm performance in Turkey but did not specify
the size of the firms and hence the results could not be generalized. This showed that
limited attention has been paid to innovation practices-SMMEs performance model.
This study addressed these gaps by undertaking an empirical study on the influence
of innovation practices on the performance of SMMEs in Kenya.
1.3 Research objectives
1.3.1 General Objective
To investigate the influence of innovation practices on the performance of Small and
Medium Manufacturing Enterprises in Kenya
1.3.2 Specific Objectives
i. To establish the influence of creativity on performance of SMMEs in Kenya
ii. To determine the effect of an organizational structure on performance of
SMMEs in Kenya
iii. To examine the influence of research and development on performance of
SMMEs in Kenya
iv. To establish the influence of commercialization on performance of SMMEs in
Kenya
v. To determine how entrepreneurial orientation moderates the relationship
between innovation practices and performance of SMMEs in Kenya
1.4 Statistical Hypotheses
H01: Creativity does not influence the performance of SMMEs
H02: An organizational structure does not influence the performance of
SMMEs
H03: Research and Development do not influence the performance of SMMEs
H04: Commercialization does not influence the performance of SMMEs

13
H05: Entrepreneurial orientation does not moderate the relationship between
innovation practices and entrepreneurial performance of SMMEs
1.5 Justification of the Study
This study was for entrepreneurs and managers of Small and Medium Manufacturing
Enterprises in the manufacturing sector. The study provided them with knowledge on
how innovation practices could facilitate the performance of their enterprises. The
findings of the study enabled the government to achieve the broad goals outlined in
the Kenya vision 2030 of making Kenya become the provider of choice for basic
manufactured goods in Eastern and Central Africa before breaking into other markets
(RoK, 2009). Researchers and Scholars benefited from the findings of this study as it
formed a basis for further research in the sector. It also served as a reference material
thus providing an empirical contribution in small and medium manufacturing
enterprises in Kenya.
1.6 Scope of the Study
The study focused on small and medium manufacturing Enterprises registered with
the Kenya Association of Manufacturers (KAM) as at June, 2015. These enterprises
were classified into sectors which ensured that every sector was included through
stratified random sampling. Kenya Association of Manufacturers is a registered
organization representing Kenyan Manufacturing Organizations, and therefore the
results were generalized to the SMMEs in Kenya and other enterprises globally.
1.7 Limitations of the Study
This study examined SMMEs in Kenya. It was anticipated that some respondents
may be reluctant to complete the questionnaires promptly. This was mitigated by
visiting them in person and persuading them to fill the questionnaires. Some
respondents resisted filling the questionnaires due to their busy schedules and fear of
disclosing sensitive issues pertaining to their entities such as revenues. This was
mitigated by engaging two assistants who made a follow-up. In Kenya, the yardsticks
used to measure SMMEs include: the total number of employees in the enterprise,

14
sales turnover, capital investment, the level of inventory or a combination of two or
three of these yardsticks. Entrepreneurial managers or owners may consider financial
aspect confidential and may not disclose it to the researcher. This limited the
researcher to use only the number of employees in determining the firms within the
SMMEs bracket. The companies investigated in this study were SMMEs. This study
specifically focused on SMMEs and a sample of 254 firms was studied. Large
enterprises in the manufacturing sector were not included in the study sample.

15
CHAPTER TWO
LITERATURE REVIEW
2.1 Introduction
This chapter reviewed the relevant literature by various scholars and researchers in
the area of innovation practices in enterprises with a specific focus on Small and
Medium Manufacturing Enterprises. It discussed theoretical review, Conceptual
framework and the empirical review that informed this study. It reviewed innovation
practices as operationalized in the conceptual framework as creativity, organizational
structure, research and development and commercialization as independent variables
and the dependent variable as SMMEs performance. Entrepreneurial orientation was
a moderating variable. Empirical literature, critique of empirical literature and
research gaps were also reviewed.
2.2 Theoretical Review
A theory is a generalization about a phenomenon that explains how or why the
phenomenon occurs (Avolio, Yammarino & Bass, 2009); a theory is a generalization
about a phenomenon, an explanation of how or why something occurs. Indeed, any
statements that explain what is measured or describe-any general statements about
cause or effect-are theory based (Salkind, 2010). This section covered the theories
relevant in explaining the influence of innovation practices and entrepreneurial
orientation on performance of SMMEs in Kenya. Componential theory of creativity,
teleological change theory, organizational learning theory, the rival theory and
diffusion of innovation theory supported this study.

16
2.2.1 Creativity
Componential Theory of Creativity
Componential theory of creativity proposes that organizational creativity appears at
the interplay between organizational components that are deemed necessary for
overall innovation such as organizational resources, management practices and
organizational motivation. This theory was proposed by Amabile (2008). The
componential theory of creativity is grounded in a definition of creativity as the
production of new ideas or outcomes that are both novel and appropriate to
improving the performance of firms. The theory proposes three components that are
necessary for any creative response: domain-relevant skills, task motivation and
teamwork (Amabile, 2012). Domain-relevant skills include Knowledge, technological
expertise, and intelligence in the specific domain where the entrepreneur is focusing
such as product design that eventually boost the sales turnover and profits of SMEs.
These skills comprise the raw materials upon which the individual can draw
throughout the creative process (Ljiljana & Dosen, 2015).
Motivation can be intrinsic or extrinsic in nature. Intrinsic motivation arises from the
individual‘s positive reaction to the qualities of the task itself such as interest,
involvement curiosity and satisfaction while extrinsic motivation arises from sources
outside the task itself such as a promised reward, meeting a deadline or winning a
competition that improves the performance of enterprises in the long run (Amabile,
2012). The social environment dynamics emphasizes creation of teams. Teamwork is
an important element in organizational settings as it facilitates effectiveness and
efficiency in an organization thus boosting sales in a firm (Dul, Celyon & Jaspers,
2011).
The theory is important in this study as most practitioners, and managers have relied
on tools and techniques developed from the theory to stimulate creativity and
innovation within their organizations in order to facilitate performance (Alvaro &
Calvo, 2011). The theory specifies that creativity requires a confluence of all
components. Creativity should be highest when an intrinsically motivated person with
high domain expertise and high skill in creative thinking works in an environment

17
high in support for creativity (Cooper, 2011). This theory is important to this study as
recent evidence showed that some product or process innovation is taking place at
every instant in time (Ljiljana & Dosen, 2015). This theory is also useful in this study
since research shows that firms seeking to be competitive and responsive to
environmental changes need to introduce innovations to boost their performance
(Ndungu, 2014).
2.2.2 Organizational Structure
Teleological change Theory
Teleological change theory proposes that in order to construct the desired state, an
organization should be purposeful and adaptive by itself or in interaction with others
(Van de Ven & Poole, 1995). Changes in organizational structure and the overall
flexibility of the firm, is said to be one of the most vital factors in a firm‘s improved
performance and success (Tuminas, 2013) that are crucial to its existence, because at
initial state departments‘ and job responsibilities, work content and processes, rules
and regulations, communication and co-ordination and distribution of power, are all
in a nascent state (Xiuli & Juan, 2011). At the same time, to increase efficiency over
time, the firm has to create and implement flexible organizational structures in order
to improve routines within an organization, such as constrained employee behaviour,
high levels of formality, tight control and decisions made only by CEO (Ahmad,
2012).
There has been no pre-defined vector of how the company would reach its target, but
there has always been an understanding of where it is going (Tuminas, 2013). The
understanding of the company‘s organizational structure has emerged from the goal
to create and maintain a system that would be capable of dealing with the transition
from a situation of partial definition of risk to complete control of risk related to the
human factor. Together with the main purpose of the firm, the environment of the
company, filled with uncertainty and volatility, has been a determinant of the changes
in structure and attitudes of the organization (Denison, 2000). It becomes clear, that
the company‘s attitude towards changes is in line with teleological school of thought;
thereby an organization might change its structures according to their main goal at the

18
given moment in time to influence better performance. Given the fact that a company
might undergo certain changes in order to reach its goal, affected by external forces, a
very high level of flexibility is always maintained within the company, which can at
the same time be supplemented by more rigid structures in the situation, where cost
efficiency and focus on exploitation of existing opportunities are needed to introduce
new products to increase sales in a firm (Fakhar, Rana, Ayesha & Lalarukh, 2012).
This study adopted teleological change theory to explain how an organizational
structure influences innovation practices in SMMEs in Kenya.
2.2.3 Research and Development
Organizational Learning theory
Organizational learning theory was used to explain the skill sharing motives on R&D
in SMEs. Organizational learning theory is regarded as the key factor in achieving
sustainable competitive advantage. Organizational learning refers to the process by
which the organizational knowledge base is developed and shaped (Stata, 2011). The
ability of firms to acquire knowledge and to transfer it into a competitive weapon has
long been a part of the research agenda (Ardito, 2014). Stata (2011) even predicted
that individual and organizational learning may grow to become the only sustainable
competitive advantage. As Hamel (2011) said, learning through internalization, which
refers to acquiring skills to close the gap between partners, and sustainable learning
helps reapportion the value-creating core competencies in an organization context,
giving partners the ability to match or overtake competition through introduction of
novel products and significantly improving the existing ones. Therefore, learning, be
it related to technology transfer, acquiring skills, or improving learning capability
(Cohen & Levinthal, (2012), is a critical consideration for firms to improve their
performance (Iyer, 2010).
Winners in the global marketplace have been using firms that can demonstrate timely
responsiveness and rapid and flexible innovation practices, coupled with the
management capability to effectively coordinate and redeploy internal and external
competences (Cheung & To, 2011). Teece et al. (2012) have proposed the dynamic
capability approach to Cooperative research and development firm-level advantage

19
suggesting that a firm‘s ability to continually learn, adapt, and upgrade its capabilities
is key to competitive success and performance. The term dynamic refers to the
capacity to renew competences so as to achieve congruence with the changing
business environment; certain innovative responses are required when time-to market
and timing are critical, the rate of technological change is rapid and the nature of
future competition and markets difficult to determine. The term capability
emphasizes the key role of strategic management in appropriately adapting,
integrating, and reconfiguring internal and external organizational skills, resources,
and functional competences to match the requirements of a changing environment so
as to influence better performance (Ferray, 2010). Dynamic capabilities thus reflect
an organization‘s synthetic ability to gain competitive advantage and dynamic
capability can be created and enhanced through experience, learning, investment and
innovation (Andreas, Marina & Klaus, 2015).
As Teece et al. (2012) posited the concept of dynamic capabilities as a coordinative
management process opens the door to the potential for inter-organizational learning.
Firms are viewed by partners as vehicles that provide opportunities to learn to
enhance their strategies and operations. Kogut (2011) argued, based on organizational
learning theory, that firms by their inherent long-term partnering nature provide
opportunities for partners to transfer embedded knowledge between them. This
embedded or tacit knowledge is generally difficult to transfer between firms. Firms
are like a short-circuit method for acquiring critical tacit knowledge (Hamel, (2011).
Learning occurs all along the evolutionary path, and the dynamics of learning and
relationship interactions continuously change as the firm grows in adjusting its sales
positively. So in a sense, the alliance creates a laboratory for learning (Inkpen, 2012).
This study adopted Organizational Learning theory in its study.
2.2.4 Commercialization
The Rival Theory
Rival theory was proposed by Datta. The rival theory explains the ability to
commercialize an innovation by a firm (Dalta, 2011). In the theory, a firm‘s
absorptive capacity and ability to explore and exploit internal and external networks

20
that include structures and collaboration within and between firms influenced its
ability to bring an innovation to the market and reach the mainstream market by
increasing its sales (Dalta, Mukherjee & Jessup, 2015). Jang and Chung (2015)
defined an integrative commercialization of innovation framework based on the
antecedents, mediators and moderators of commercialization: networks, absorptive
capacity and ambidexterity which mean the ability to explore and exploit new
opportunities.
The rival theory sought to identify why some organizations were better than others at
bringing new innovations to the market thus enhancing their performance (Frattini et
al, 2012). Dalta described the ability to commercialize an innovation by a firm‘s
capacity to manage three aspects of the innovation process: identify a market for an
innovation, develop and manufacture the concept into a product and sell the product
through distribution channels. The rival theory of commercialization of innovation is
distinct and examines the commercialization of innovation process from different
levels of analysis (Datta, Reed & Jessup, 2015); Dalta (2011); Frattini, Massis,
Chiesa, Cassia and Campopiano (2012) looked at commercialization of innovation at
the organizational level. However, Dalta (2011) studied commercialization of
innovation from a more of a strategic management of innovation point of view while
Frattini et al. (2012) explored commercialization decisions from a marketing
perspective. Few studies have explored the collective strategic marketing decisions
business leaders make and their combined influence on the commercialization
process (Jang & Chung, 2015).
All the three concepts in the commercialization of innovation framework may affect a
firm‘s ability to launch a new innovation, realize revenue and influence the firm‘s
performance and survival (Frattini et al., 2012). It is therefore critical to understand
the role those strategies played in the commercial success. As applied in this study
the theory holds that the prepositions advanced by the theory model allow technology
development marketing leaders to explore strategies used to commercialize a new
innovation practices in the market (Datta, Mukherjee & Jessup, 2015). This study
adopted the rival theory of commercialization of innovation to explain the influence
of commercialization in enhancing innovation practices in manufacturing SMEs.

21
2.2.5 Entrepreneurial Orientation
Diffusion of innovation theory
Diffusion of innovation theory predicts that media and interpersonal contacts provide
information and influence opinion and judgment. The theory centres on the
conditions which increase or decrease the likelihood that a new idea, product or
practice was adopted by members of a given culture. Rodgers (1995) argued that
innovation occurs in four stages: invention, diffusion (communication) through the
social system, time and consequences. Then the information flows through networks
and the nature of networks and the roles opinion leaders play in the networks
determine the likelihood that innovation was adopted. Innovation diffusion research
explains the variables influencing how and why the users adopt a new information
medium such as the internet, with the opinion leaders personal leaders exerting
influence on audience behaviour. There are five adopter categories: innovators, early
adopters, early majority, late majority and laggards. Innovators adopt innovation in
the beginning at (2.5%) early adopters make up for (13.5%) a short time later the
early majority (34%) the late majority (34%) and after some time the laggards make
up for (16%) (See fig 2.1)
Figure 2.1: Hypothesized distribution of adopter categories within a typical
population (Rogers, 1995).

22
There are five factors that influence adoption of an innovation and each of them is at
play to a different extent in the five adopter categories. They are: Relative advantage
(the degree to which an innovation is seen as better than an idea, program or product
it replaces); compatibility (consistency of the innovation with the values experiences
and needs of the potential adopters); Complexity (the difficulty of the innovation to
understand or use); Tria-bility (extent to which an innovation can be tested or
experimented before a commitment to adopt it is made) and observerbility (extent to
which innovation provides tangible results) (Rodgers, 1995). The theory is important
in this study as previous research shows that firms seeking to be competitive and
performance oriented are responsive to the environmental changes and introduce
innovations (Uzkurt, Kumar, Kimzah, & Eminough, 2013).
2.3 Conceptual Framework
A conceptual framework is a model written or visual presentation that explains either
graphically, or in narrative form, the main things to be studied, the key factors,
concepts or variables and the presumed relationship among them (Roger & Vaughan,
2008). A conceptual framework contains the variables under study (Elsevier, 2009).
This study investigated how creativity, organizational structure, research and
development and commercialization influence SMMEs performance. The relationship
was moderated by entrepreneurial orientation. The variables were extracted from the
studies conducted by the following scholars: (Matanda, 2013; Onzer & Tinaztepe,
2014; Mwangi & Namusonge, 2014; Ljiljana & Durdana, 2015; Jochen, 2013; Daiya,
Koheiand & Hiroshi, 2012; Kaya & Agca, 2012; Otieno, Bwisa & Kihoro, 2012;
Eggers & Hughes, 2013; Lagat; Chepkwony & Kotut, 2012; Borghini, 2009; Gunday,
Ulusoy, Kilicand & Alpkan, 2014; Moses, Sithole, Labadarios, Blankley & Nkobole,
2012). The conceptual framework is shown in figure 2.2.

23
Figure 2.2: Conceptual Framework
Independent variables
Dependent
Variable
Entrepreneuria
l Orientation
Pro-
activenes
s
Risk
taking
Innovati
on
Creativity
Technological
expertise
Team work
Motivation
Organizational
Structure
Centralization
Formalization
Professionalization
Research &
Development
Customer participation
Top management
involvement
Venture capital
Commercialization
Internationalization
Technological
exploitation
Market exploitation
SMMEs
Performance
Sales
turnover
Profitability
Return on
investment
Moderating
variable
Moderating variable Dependent variable

24
2.3.1 Creativity
Creativity was suggested by a number of researchers as one of the strategies that
when adopted may ascertain SMMEs of their survival in the competitive environment
(Lowley, 2011; Rick et al, 2015; Hong et al, 2013). Creativity refers to the ability to
develop a new product, new ideas and to discover new ways of looking at problems
and opportunities (Hans, 2014). The creation and development of creative ideas and
their manifestations as new products were considered the core elements of an
innovation strategy, as creativity motivated the generation of new ideas, which was
one of the key determinants of innovation practices (Edgeman, Andy, & Eskilden,
2015; Naidu, Chand, & Southgate, 2014).
A study by Amabile (2012) identified three components that were necessary for any
creative response: domain-relevant skills, task motivation and teamwork. Domain-
relevant skills included Knowledge, technological expertise, and intelligence in the
specific domain where the entrepreneur is focusing such as product design. The three
types of knowledge that facilitated innovation practices were: acquisition of
substantial knowledge related to product, technological expertise of knowing how to
collaborate with specific relationships and the firms accumulated knowledge about
the product. Moreover, although knowledge and, technological expertise were of
utmost importance for any firm that wishes to improve its performance through
innovation practices (Li & Tang, 2010) empirical literature concerning the impact of
firm knowledge and technological expertise related issues were scarce (Ljiljana &
Durdana, 2015). These skills comprised the raw materials upon which the individual
can draw throughout the creative process (Cooper, 2011).
A study by Amabile (2012) asserted that motivation can be intrinsic or extrinsic in
nature. Intrinsic motivation arises from the individual‘s positive reaction to the
qualities of the task itself such as interest, involvement, curiosity and satisfaction
while extrinsic motivation arises from sources outside the task itself such as a
promised reward, meeting a deadline or winning a competition. The social
environment dynamics emphasizes creation of teams and therefore, an enterprise
needs creative people to support the processes, not only those associated with

25
developing ideas, but also those involving the selection, assessment and execution of
the ideas that can be persued to develop novel products. Teamwork was an important
element in organizational settings as it facilitated effectiveness and efficiency in an
organization that eventually enhances firm performance (Dul, Celyon & Jaspers,
2011).
Creativity lenders a sustainable competitive advantage to a firm as it is a strategic
resource that is available, flexible, rare and imperfectly substitutable (Dul, Ceylon &
Jaspers, 2011). Alvaro and Calvo (2011) pointed out that leaders should possess the
ability to constitute effective work groups (teams) that should reflect on a diversity of
skills and technological expertise, relevant to the firm‘s operations. The teams should
be able to challenge each other‘s ideas in constructive ways and are mutually
supportive in improving SMMEs performance. To achieve desirable results, matching
individuals to work assignments on the basis of both skills and interests, and
technological expertise enhances an employee‘s creative abilities (Clausen,
Korneliussen & Madsen, 2013; Christian & Alexander, 2013). This study adopted
knowledge and technological expertise, teamwork and motivation as the main factors
that enhance creativity. One of the objectives of the study was to investigate the
influence of creativity on the performance of SMMEs in Kenya. The following
hypothesis was proposed:
H01: Creativity does not influence the performance of SMMEs
2.3.2 Organizational Structure
A critical element for companies is the formation of organizational structures that
make cross-functional knowledge and resource sharing possible, ensures strategic
decision making, resolution of disagreements and the active and effective
coordination of the process of innovation (Shaemi, Abzari, Mazraeh & Maleki,
2013). Miller (2011) defined an organizational structure as a way of permanently
distributing work roles and administrative mechanisms to enable an organization to
perform coordinate and control its business activities and resource flows. A study by
(Lewis, 2011) asserted that an organization structure is a significant predictor of
innovation practices with less centralized and less formalized firms innovating with

26
somewhat greater frequency than firms with more rigid structures. Structural
elements that impact on innovation include centralization, formalization and
professionalism (Powley & Nissen, 2012).
Formalization referrs to the extent to which jobs within the organization are fixed to a
certain standard (Teixeria, Koufteros & Peng, 2012). In jobs where the degree of
formalization is low, job behaviours are usually not programmed and employees
have greater freedom and discretion to exercise in their work and under such
circumstances new ideas are likely to be generated (Lewis, 2011). A study by Veisi,
Veisi & Hasanvand, (2012) concluded that low formalization encouraged openness
and flexibility in roles, which was a prerequisite for new ideas. Latifi and
Shooshhtarian (2014) in their study discovered that firms with organic structures that
entail low formalization were more inclined to innovate. Shaemi et al (2013) argued
that successful firms with less formalized and centralized but more professionalized
and managerially intensive organization structures allowed them to be responsive to
innovation.
Several studies (Veisi, Veisi & Hasanvand, 2012; Shaemi et al, 2013) suggested that
centralization tend to encourage the individual to become more opportunistic and
within such a context members were likely to participate and share ideas that were
essential for the success and improved performance of the firm. Centralization is the
extent to which decision making is concentrated at the highest level in an
organization (Teixeria et al, 2012). A highly centralized organization is said to exist
when only the top management makes key decisions in an organization. Powley &
Nissen (2012) reported that flexible organization structures characterized by low
levels of formalization and centralization best promoted innovation within firms. A
study by Lendel and Varmus (2011) suggested that it was necessary to employ low
formalization and low centralization during innovation initiation phases because at
this stage information gathering and processing is crucial for success and improved
sales.

27
The knowledge of workers and their ability to create and share new knowledge
promoted innovation practices in a firm (Mietzner & Kamprath, 2013). Hodgson
(2011) defined professionalization as the accomplishment of the formal internal
organization of the occupation, the promotion of accredited training, the need to
expand credentials within job markets for the professionals and the development of a
core body knowledge that can serve to construct a world in keeping with the outology
espoused by the discipline. Muzio, Brock and Suddaby (2013) agreed that within the
knowledge economy of professionalism there is a broad agreement that innovation
originates in the creativity and innovation capability of people. As Muzio et al (2013)
pointed out that, the first way in which professionals restructure institutions is by
opening up new spaces for their expertise such as the creation of new products. A
study by Capitanio et al (2012) on Italian food firms found a positive relationship
between knowledge based activities and innovation. The following hypothesis was
tested:
H02: An organizational structure does not influence the performance of SMMEs
2.3.3 Research and Development Capability
Research and development is one of the key input factors of innovation practices
(Pang & Chih, 2012). Research and Development (R & D) refers to all creative work
undertaken on a systematic basis in order to increase the stock of knowledge and the
use of this stock to devise new applications, such as new and improved products and
processes (Andrea & Marco, 2013). Lerner (2011) posited that R & D and innovation
were to a greater extent substitutable. Several studies (Dong and Hua, 2011; Sigara,
2012; Bolton, Parasuraman, Hoefnagels and Kabadayi, 2013) concluded that
customer participation in new product development could assist R & D division in
solving customers‘ demands effectively. R & D ability consisted of three main
functions: customer participation in new product development, the level of
cooperation about venture capital in R & D project and the level of top management
involvement in R & D project (Andrea & Marco, 2013).

28
Customer participation in new product development helped create products that
mirror latent needs, decrease costs associated with new product development
activities and developed products that were less easily imitable by competitors (Ali,
Jing & Ahmed, 2015). Jian, Yuan and Wen (2013) defined customer driven
innovation as the process of collecting a particular type of information about the user.
Customers generate innovation ideas potentially beneficial to a firm as those of in-
house professional developers (Sigara, 2012). Service and innovation practicess in
customer involvement attracted new customers, improved customer loyalty, opened
new markets and built profitability of a firm‘s existing product portfolio (Chen, Yang
& Tang, 2013). Peled and Dvir (2012) revealed that customer involvement resulted in
ideas for new innovative and useful products and that customer involvement was
heavily dependent on how involvement was managed. A study by Cooper (2011)
asserted that a significant proportion of innovations in developed countries were
actually developed by the description of customers involved in innovations. The user
involvement not only provided useful information about the users‘ but also increased
the understanding of users values (Djelassi & Decoopman, 2013).
One factor that was critical to the success of major innovations was top management
support (Evansschitzky et al 2012). Evans (2012) defined top management as the
degree of top management support for a new product initiative. Highly educated and
more experienced managers with the required knowledge to innovate and skills,
effective communication skills and ability to develop appropriate programmes were
more successful in opportunity recognition (Jiang, 2012; Koch, 2012) thereby directly
contributing ideas and insights to the firm‘s innovations. Andreas, Marina and Klaus
(2015) pointed out that top management involvement in innovation could speed up R
& D progress. Top managements knowledge was helpful for acquiring resources
(Kleinschmidt, Schultz, Salomo & De Brentani, 2013) which in turn had an impact on
the accumulation of knowledge and skills which enhanced firm performace.
Venture stimulates additional investigations of the relationship between the
institutions through which innovative activities are financed (Bengtsson, 2011).
Venture capital is a form of equity financing in new-born firms often active in new
sectors (Kevin, Blanche & Armand, 2014). A study by Kandel and Harry (2011)

29
indicated that venture capital financing had positive effect on innovation. Several
studies (Vries, 2012; Krishnan, 2011; Kevin et al, 2014) asserted that venture
capitalists provided not only finance but also advice to the entrepreneur on
management matters such as the definition of strategies, financing policies which
help firms to adopt more professional management systems and to access new
financiers and suppliers. Wadhwa, Anu and Sandip (2013) stated that successful
entrepreneurs become venture capitalists in order to invest in the next generation of
entrepreneurs. Most research and development studies have not focused on their
influence on innovation practices. The following hypothesis was tested:
H03: Research and Development do not influence the performance of SMMEs
2.3.4 Commercialization
Commercialization is a critical phase of innovation practices (Walsh, 2012). Without
prior commercialization preparation during the innovation process, new products or
services may fail (Conley, Bican & Ernst, 2013). Commercialization is the process of
translating research knowledge into new or improved products, processes and
services and introducing them into the market place to generate economic benefits
such as increased sales (Ardito, 2014). Several studies (Schroll and Mild, 2011;
Datta, Reed and Jessup, 2013) asserted that the actual launch of a new product or
service was the final stage of new product or service development. At this stage
substantial amount of money needs to be directed towards advertising, sales
promotion and other marketing efforts. Joung, Jin and Woo (2015) suggested that
commercialization needs pre-commercial activities such as a marketing strategy
development and business analysis to achieve success and better performance.
Commercialization of innovation was greatly influenced by market exploitation,
technology exploitation and internalization (Ardito, 2014).
Market exploitation is an important element of marketing strategy that is arguably
among the most relevant success factors in introducing new products (Jaakko, 2013).
A study by Lisboa, Skarmeas and Lages (2013) stated that market exploitation
involves the development of new knowledge about the firm‘s existing markets,
products and abilities based on intensive search and experimentation along an

30
existing knowledge dimension. Simultaneous investments in the exploitation of
existing innovation capabilities of new products helped create a competitive edge.
Chih (2011) suggested that market exploitation has two district phases: use and
development of things that are already known. He defined development as the
expansion of the firm‘s current stock of knowledge while the term use as the
appropriation of economic returns of the current stock of knowledge. Product
development and market-related exploitative capabilities were viewed as the value
creating mechanisms through which entrepreneurial orientation affects performance
(Norazlina, Izaidin, Hasfarizal, Shahrina & Lai, 2013).
Technological exploitation refers to the capability of firms to select the most
appropriate technologies to create value for customers as well as exploit the selected
technologies (Walsh, 2012). Accordingly, value creation is dependent upon firm‘s
capabilities to recombine technologies (Cheng, Chang & Hung, 2011) as well as
understanding the way these components have to be linked together (Li, Smith,
Maggitti, Tesluk & Katila, 2013) in order to offer new products. These skills,
knowledge and experience were acquired and accumulated mainly through
technological exploitation (Li et al, 2013). It was argued that the more explicit and
purposeful the technology was the deeper the capabilities accumulated to produce
new innovations. A study by He and Wong (2011) in Singapore and Malaysia found
out that exploitation innovation activities had significant effects on the rate of sales
increase and exploitation innovation influenced positively both innovation practices
and process innovation.
Internationalization refers to the extent to which firms operate outside their national
boundaries (Hernadez & Torero, 2011). A study by Chih (2011) asserted that
internationalization help firms to develop and acquire new resources to create value
from their technologies. Dispersed R & D teams were facilitated in accessing
information from a wider range of sources and new different markets (Jaakko, 2013).
In addition, creativity was fostered because of the possibility to exchange ideas
between researchers of different countries and cultures (Lisboa et al, 2013) or hire the
most skilled workers (Chih, 2011). Indeed internationalization enabled firms to better
react to changes in needs of their customers (Norazlina et al, 2013). Jaakko (2013)

31
suggested that firms may be more available to invest in exploitation of radical or
more applicable technologies if engaged in external market. In addition the possibility
to obtain complimentary assets increased (Hernadez & Torero, 2011 ) and the risks
related to fluctuations and business cycle specific to a single market were limited
(Conley et al, 2013).The following hypothesis was tested:
H05: Commercialization does not influence the performance of SMMEs
2.3.5 Entrepreneurial Orientation and Firm Performance
The extent to which a firm is entrepreneurial is commonly referred to as its
entrepreneurial orientation (Sandra 2011). The key components of entrepreneurial
orientation are risk taking, pro-activeness, innovativeness, competitive aggressiveness
and autonomy (Ali & Ali 2013; Alegre & Chiva, 2014; Sandra, 2011). Risk taking
refers to the risks individuals take by working for themselves rather than being
employed, but has since been applied to companies. Pro-activeness describes the
characteristic of entrepreneurial actions to anticipate future opportunities, both in
terms of products or technologies, markets and consumer demand; innovativeness
emphasise the importance of technological leadership to the company and its changes
in its product lines; competitive aggressiveness refers to the company‘s way of
engaging with its competitors, autonomy refers to the independent action of an
individual or team in bringing forth an idea or vision and carrying it through to
completion (Sandra 2011).
Entrepreneurial orientation was suggested as a key driver of firm growth (Wouter,
Paul & Koen, 2015; Chiara, Daniela & Annalisa, 2015). Several authors agreed that
entrepreneurial orientation is a construct that is associated with firm success,
particularly in the long run (Hans, Mariann, Isabelle & Rutger, 2012; Alex, 2014).
However, though this relationship was not entirely unambiguous Weibao, Weiwei,
Bo and Check (2015) suggested that the conversion of entrepreneurial orientation into
firm growth remained something of an enigma (Darian, 2011; Rajul, Johnand &
Veera, 2015). The conceptual arguments of previous research suggested that
entrepreneurial orientation lead to higher performance, with some studies asserting
that firms that adopted a strong entrepreneurial orientation performed much better

32
than firms that did not adopt an entrepreneurial orientation (Khadije, Babak &
Mehrdad, 2013; Hamada, Ali & Butler, 2015; Wiklund & Shepherd, 2011).
To overcome the challenges of competition and globalization, eminent scholars
(EAC, 2010; Harun & Veysel, 2014) recommended that manufacturing firms adopt
entrepreneurial orientation. A study by Alegre and Chiva (2014) revealed that all the
entrepreneurial dimensions: pro-activeness, competitive aggressiveness, risk taking,
innovation and autonomy impacted positively on firm performance within the
Australian Automobile Components industry. The domestic demand for automotive
components increased by 12%, turnover by 17.5% and exports accounted for more
than $4.6 billion. SMMEs adopted entrepreneurial orientation to enable them pursues
growth and profitability. Past research studies relating to high growth with a firm‘s
entrepreneurial orientation revealed better performance (Ljiljana & Durdana, 2015;
Walter, 2015).
Several scholars (Kroon, Voorde and Timmers, 2013; Lisboa, Skarmeas and Lages,
2011; Miller, 1983) asserted that entrepreneurial orientation has three core
dimensions: innovativeness, pro-activeness and risk-taking and these three
dimensions have since been used consistently in the literature. The usage of the
entrepreneurial orientation model with all the aforementioned five dimensions has
been rare in the entrepreneurial orientation literature when compared with the use of
the model with three dimensions (Rosli, 2015; Kaya & Agca, 2014). This is because
in some studies, competitive aggressiveness and pro-activeness have been treated as
the same. Past studies showed a direct correlation between entrepreneurial orientation
and firm performance (Egger, Kraus & Hughes 2013, Gathungu, Aiko & Machuki
2014; Mugambi & Wanjau, 2016). This study adopted pro-activeness, risk taking and
innovativeness as the core dimensions of entrepreneurial orientation.
Entrepreneurial orientation was a significant factor for a firm‘s success (Kraus, 2012;
Michael, 2012; Bruton, 2014). Entrepreneurial Orientation was conceptualized as the
process and decision making activities used by entrepreneurs that leads to new entry
and support of business activities (Kaya & Agca, 2014; Simiyu, 2013; Chiara et al,
2015). Entrepreneurial Orientation was conceptualized as comprising three

33
dimensions, innovativeness, risk taking and proactiveness, (Alegre and Chiva, 2014;
Sandras, 2011; Gathunngu, Aiko, and Machuki, 2014) and these three components
were argued by Miller (2011) to comprise basic dimensional strategic orientation.
Innovativeness was the firm‘s ability and willingness to support creativity, new ideas
and experimentation which resulted in new products/services (Weibo, Weiwei, Bo
and Check-Teck, 2015; Kaya and Agca, 2014; Callaghan and Venter, 2011), while
pro-activeness was the pursuit of opportunities and competitive rivalry in anticipation
of future demand to create change and shape the business environment (Eggers,
Kraus, Hughes, Susan & Sean, 2013; Rosli, 2015; Kraus, 2012). Risk taking was the
firm knowingly devoting resources to projects with chance of high returns but also
entailed a possibility of high failure (Miller 2011; Simiyu, 2013)
The relationship between Entrepreneurial Orientation and firm performance has been
studied by a number of scholars (Otieno et al, 2012; Eggers et al, 2013; Ali & Ali,
2015; Kaya & Agca, 2014; Alegre & Chiva, 2014; Gathungu et al, 2014).
Entrepreneurial Orientation was connected to better performance (Fakhrul and
Selvamalar, 2011; Ali and Ali, 2015) and success in terms of firm size and economic
growth (Matanda, 2011; Dobni et al, 2015). Studies also found positive effect of
Entrepreneurial Orientation on growth of small firms (Gathungu et al, 2014; Eggers
et al, 2013) and profitability on firms (Ahu, 2015; Shakil, 2012). Based on this
discussion, the following hypothesis was tested:
H06: Entrepreneurial orientation does not moderate the influence of innovation
practices on performance of SMMEs
2.3.6 Moderating Role of Entrepreneurial Orientation on the Relationship
between Innovation practices and Firm Performance
A moderator variable is a third variable that affects the strength of the relationship
between a dependent and independent variables. The effect of a moderating variable
was characterized statistically as an interaction that affected the direction and/or
strength of the relationship between dependent and independent variables (Fakhrul &
Selvamalar, 2011). The impact of innovation practices on performance depends on

34
firm‘s entrepreneurial orientation. Entrepreneurial orientation when used as a
moderator strengthens the relationship between innovation practices and SMMEs
performance (Boso & Cadogan, 2012).
Several studies have used entrepreneurial orientation as a moderator, Alegre and
Chiva (2014) in their study on entrepreneurial orientation, innovation and firm
performance found out that entrepreneurial orientation with risk taking, pro-
activeness and innovation lead to higher performance; Boso and Cadogan (2012) in
their study on entrepreneurial orientation and market orientation as drivers of
innovation practices success found out that entrepreneurial orientation with risk
taking and innovativeness enhanced firm growth but autonomy did not. Abebe (2014)
in his study on electronic commerce adoption, entrepreneurial orientation and small
medium-sized enterprise (SME) performance found out that entrepreneurial
orientation with risk taking, innovation and pro-activeness promoted firm growth. In
this study entrepreneurial orientation with risk taking, pro-activeness and
innovativeness as its key components moderated the relationship between innovation
practices and SMMEs performance.
2.3.7 Innovation practices concept
Innovation practices is one of the fundamental instruments of growth strategies to
enter new markets, increase the existing market share and provide a company with a
competitive edge (Hitt et al 2001; Kuratko et al., 2011; Walter 2015; Alex 2014).
Innovation practices referred to the introduction to the market of a new
product/service that was new or significantly improved with respect to its
characteristics or intended uses (Moses et al 2012). This included activities such as
technical design, Research and Development (R&D) and commercial activities
involved in the making of a new or improved product (Atalay et al., 2013).
Chen and Liu (2012) defined innovation practices as the planning and realization
process that generate or reconstruct a new technological system and supply the
needful functions to satisfy the customers‘ needs, with the end goal of providing a
solution that can be exploited or accepted by customers. A more analytical definition
of innovation practices was given by Doughtery and Bowman (2011) who described

35
innovation practices as a problem-solving process in three domains of an activity.
The first domain deals with the conceptualization of the product design and then
bring it into existence, the second domain concerns organization of work across
functions and the third domain has to do with the linkage between product and the
firm‘s structure resources and the strategy.
Cormican and O‘sullivian (2013) described innovation practices as a continuous and
cross-functional process involving and encompassing a growing number of various
competences inside and outside the organizational boundaries. Simply stated, it is the
process of transfiguring business opportunities into tangible products and services
(Cormican & O‘Sullivian, 2013). For requirements of this study, the researcher
adopted the definition of innovation practices given by (Moses et al 2012). There was
strong empirical evidence that successful entrepreneurs were more innovative than
non-innovative entrepreneurs (Gurol and Astan, 2011). Lack of innovation in SMEs
lead to stagnation in growth, irrelevancy and eventually call for forced exit of an
enterprise (Freeman & Soete, 2011; Atalay et al 2013).
2.4 Empirical review
2.4.1 Creativity
Ozge and Mette (2011) undertook a study on: Does organization creativity really lead
to innovation? The study was done in a particular region in Denmark to analyse
whether organizational creativity leads to innovation in small firms. A sample of 147
firms was used. They found out that organizational creativity lead to innovation but
only innovation practices. Also encouraging employees for innovative behaviour in a
stimulating work environment, allocating resources and providing idea time played a
crucial role in stimulating creativity and supporting innovation practices. Another
finding was that high levels of freedom were found to be acting against innovation
practices. There was no relationship between organizational creativity and process
innovation
36
Ljiljana and Durdana (2015) investigated enabling innovation practices and creativity
in market-oriented firms. They based their study on seven case studies. Findings
revealed that creativity and product innovativeness suffered due to a dominance of
customer requirements and competitors‘ ideas and creative solutions. Firms get
involved in generating and gathering information in order to use it for various
purposes including innovation practices development. When innovation practices
relied very little on the firms‘ findings about customers and competitors, the firm still
exercised market orientation principles; market orientation principles were
acknowledged for their contribution to innovation practices; the contribution to
market success and commercialization of innovation practices was largely
recognized. This study helped business practitioners interested in fostering innovation
in their firms by implementing market orientation as the findings suggested that they
had to carefully consider how to design those activities since there was more than one
way that lead to success.
2.4.2 Organizational Structure
In Malaysia, Aizzat, Muhammad and Nur (2012) undertook a study to investigate
country of origin effect on organizational innovation in Malaysia: the mediating role
of structure. It looked at the country of origin as the independent variable. The
organizational structure was a mediating variable. A sample of 80 multinational
corporations and 43 locally-owned joint ventures was used. They found out that an
organizational structure had an impact on organizational innovation, specifically
formalization and centralization. Another finding was that formalization and
centralization did not have any impact on technological, process as well as innovation
practices. They also found out that both levels of technological and process
innovations, as well as administrative innovation were high among American
multinationals.
Asieh (2015) investigated the relationship between an organizational structure and
job innovation in employees of an industrial company. The purpose of the study was
to investigate the relationship between dimensions of organizational structure with
innovation. A sample of 313 employees of an industrial company in Iran was

37
selected. The findings revealed a negative relationship between centralization and
innovation. High levels of centralization caused protest and disruptive approaches
and inhibited the development of new ideas. Also there was a negative correlation
between complexity and innovation. He also found out that there was a negative
correlation between recognition and innovation. Another finding was that
organizational structures were significant predictor of innovation.
2.4.3 Research and Development
Andrea and Marco (2013) studied: Succeeding in innovation: Key insights on the role
of R & D and technological acquisition drawn from company data in Italy. A sample
of 3000 Italian manufacturing companies was selected. The findings revealed that R
& D played a significant role only in determining the probability of introducing
innovation practices while Technology acquisition increased the probability of
realizing process innovation. All the four R & D coefficients: large firms, small firms,
high-tech and low-tech sectors were statistically significant and had a greater effect
on innovation practices than process innovation. Technology acquisition had no
effect on innovation practices.
Pang and Chich (2012) studied R & D management on new product development
performance in Taiwan‘s Hi-Tech industries. They used a sample of 210 industries in
Taiwan‘s industrial sector. The research objective for the study was to analyse and
evaluate the influences of R &D management on new product development
performance. The research findings suggested that R & D management ability had
significant influences on new product development performance. Also new product
development performance was more significant when R & D management ability was
stronger. They also found out that the scale of business operations was not a key to
success factor for new product development performance. Also both large and small
business enterprises had strength and there was no significant difference in their new
product development performance. Another finding was that the benefit of R & D
management influenced new product development performance and had a close
relationship with the core technologies in hi-tech industry development in Taiwan.

38
2.4.4 Commercialization
Joung, Jin and Woo (2015) studied the effects of commercialization capability in
small and medium sized businesses performance. The research investigated the
relationship between factors in the process of commercializing transferred technology
and a firm‘s financial and innovation performances. It looked at acquisition/
internalization technological exploitation and market exploitation. A sample of 200
firms in Korea was used. The findings revealed that acquisition/internalization
affected greatly the firm‘s financial and innovation performance. Also technological
exploitation had positive effects on their financial and innovation performance. They
also found out that market exploitation influenced strongly financial and innovative
performances.
Dalta, Reed and Jessup (2013) undertook a study on commercialization of
innovations an overarching framework and research agenda. A sample of 194 articles
was selected to constitute the sample from 62 journals in the fields of Management,
Strategy, Entrepreneurship, Economics and Marketing. They found out that
commercialization of innovations was a critical entrepreneurial activity that lead to
economic development and growth. Also commercialization of innovation required
research expertise from a multitude of disciplines including Management, Strategy,
Entrepreneurship, Economics and Marketing.
2.4.5 SMMEs performance
Masood, Sadia, Muhammad and Sarman (2013) studied effects of innovation types
on firm performance in Pakistan. The main purpose of the study was to explore the
effects of innovation types including product, process, marketing and organizational
innovation on different aspects of firm performance such as innovative, production,
marketing and financial performance in Pakistan manufacturing companies. Data was
collected from 150 respondents mainly from production, R & D and marketing
departments of manufacturing companies. The study found out that higher firm
performance was achieved better from increased innovativeness in manufacturing
firms. Also the effect of organizational innovativeness on process innovation was
stronger than other innovation types. Another finding was that marketing orientation

39
lead to innovation practices. These results were consistent with Gunday et al (2014)
who also found organizational innovativeness to be the strongest driver of innovative
performance.
2.5 Critique of the existing literature
The study by Ozge and Mette (2011) on whether organizing creativity really lead to
innovation in Germany used a small sample size from a relatively homogenous
population that was experiencing severe economic conditions. If more data were
collected in a less severe economic situation statistical analysis may have yielded
more enlightening results. The study used CEO‘s or innovation managers of the firms
as the respondents thereby only capturing the senior management perceptions of the
firms rather than those of employees which did not match the real conditions in the
firm. The study was done in a particular region in Denmark and hence the results
could not be generalized. The managers allowed high levels of freedom that acted
against innovation practices. The managers did not exercise freedom cautiously to
ensure that operations were carried out effectively in order to achieve innovation
practices.
The study by Ljiljana and Durdana (2015) examined enabling innovation practices
and creativity in market oriented firms. The findings depicted perspective and views
of innovation managers that were not necessarily shared by the rest of the employees.
Although the findings were based on successful cases, they did not imply that market-
oriented firms always innovated successfully, regardless of other circumstances and
variables. Although the general principles were applicable for many cases,
characteristics of firms, market and innovation practicess were not considered as
important for using market orientation for enabling creativity. The use of single
informants had a great potential to affect findings on inter-functional coordination
and therefore this component should have been studied separately.
The study by Aizzat, Muhammad and Nur (2012) on the country of origin effect on
organizational innovation in Malaysia utilized a single respondent to capture level
data instead of multiple respondents per organization. Also the investigation made
use of only survey method and failed to conduct personal interviews with the

40
respondents in order to enhance the quality of the findings. The study was also
limited in scope in terms of the number of variables explored. The study only focused
in one country and hence the results could not be generalized. The use of an online
instrument for data collection meant that only persons with valid e-mail addresses
could be recruited for the study, thus affecting the generalizability of the findings.
The study by Asieh (2015) on the relationship between organizational structure and
job innovation in employees of an industrial company in Iran found out that the
amount of direct control of employees on their own affairs in Iran organizations was
lower than similar organizations in other countries and therefore the centralization
factor in Iran organizations was a barrier to progress and innovation. There was also
lack of communication and flow of ideas from the bottom to the top, insufficient
communication from top to bottom and inadequate relationship with the external
environment. High levels of centralization caused protest and disruptive approaches
and this inhibited the development of new ideas.
The study by Andrea and Marco (2013) on: Succeeding innovations used the
Community Innovation Survey data that was subject to sample selection, endogeneity
and simultaneity challenges. The study used a very large sample of 3000 firms that
was only relevant to innovation practices but insignificant to process innovation. The
interaction term between R & D and technology acquisition did not indicate
additional effect due to the joint effect of the two types of expenditures. The
innovative intensity equation included innovative expenditures other than R & D and
technology acquisition as additional repressors. The impact of research and
development over innovative turnover turned out to be smaller and insignificant in
the small and medium companies sub-sample.
Pang and Chih (2012) study on R & D management on new product development
performance in Taiwan‘s Hi-Tech industries discovered that business enterprises
placed different emphasis on each of the five R & D facets. Business enterprises with
different industry backgrounds and corporate status applied different technology R &
D management and hence their focuses on each of the five facets for R & D
management ability naturally varied. The study focused on the relationship between

41
research and development management and performance of new products in
Taiwan‘s Hi- tech industries and thus ignored the multi-dimensionality of innovation
practices processes. The study was done in one country and hence the results could
not be generalized.
The study by Joung, Jin and Woo (2015) on the effects of commercializing capability
in small and medium-sized businesses on business performance lacked sufficient
theories from previous studies and the existing research which led to limitations in
adopting and measuring influence factors. The study did not analyse company
information using objective indicators of the company although the survey questions
required specialized knowledge of the respondents and hence the results were not
reliable. Business performance was not accurately evaluated as the study only
focused on total sales, speed of technology commercialization and the number of new
products developments to assess financial and innovation performance instead of
using various items influencing performance.
Dalta et al. (2013) study on commercialization of innovations used as an assumption
that the fields of Management, Strategy, Entrepreneurship, Economics and Marketing
were sufficient to capture all the themes associated with entrepreneurial activities
surrounding commercialization of innovation was not valid. The frame work used in
the study was not validated which meant that the assumptions and boundary
conditions associated with framework needed to be tested and confirmed as being
realistic before the study was done. The study did not highlight the key elements of
the commercialization-innovation pathway.
Masood et al. (2013) study on the effect of innovation types on firm performance in
Pakistan failed to point out that innovation and innovative firm performance in
organizations vary with sector to sector (Vega-Jurado et al., 2008). The findings did
not factor in the aspect that organizational innovation not only varies with sector but
also with the size of the firm (Evangelista et al., 1997). There was a significant role
of environment on the innovation adoption which was not considered in this study
(Olovamita & Friedmann, 2008). There was also need for future research to consider
cross cultural differences.

42
2.6 Summary of Literature
This chapter reviewed the theories explaining the variables to the study.
Componential theory of creativity proposed production of new ideas or outcomes that
were both novel and appropriate to some goal. This theory was important to this
study as recent evidence showed that some product or process innovation was taking
place at every instant in time (Ljiljana & Durdana, 2015). This theory explained the
first hypothesis. The second hypothesis was explained by Teleological change theory
which holds that in order to construct the desired state; an organization should be
purposeful and adaptive by itself or in interaction with others (Van de Ven & Poole,
1995). Changes in organizational structure and overall flexibility of the firm, which
was said to be one of the most vital factors in a firm‘s development and success
(Tuminas, 2013) were crucial to its existence, because at initial state departments‘
and job responsibilities, work content and processes, rules and regulations,
communication and co-ordination and distribution of power, were all in a nascent
state (Xiuli & Juan, 2011).
Organizational Learning theory explained the third hypothesis. Organizational
Learning theory was used to explain the skill sharing motive in R & D in firms
(Odagiri, 2011). Learning, be it related to technology transfer, acquiring skills, or
improving learning capability was a critical consideration for firms (Iyer, 2012). The
ability of firms to acquire knowledge and to transfer it into competitive weapon had
long been a part of the research agenda. The Rival theory explained the fourth
hypothesis. The theory proposed that a firm‘s absorptive capacity and ambidexterity
and internal and external networks influenced its ability to bring an innovation to the
market and reach the mainstream market (Datta, 2011). All the three concepts in the
commercialization of innovation framework affected the firm‘s ability to launch a
new innovation practices (Frattini et al., 2012).
The empirical review emphasized the view of the componential theory of creativity
that creativity was an important factor for a firm to move towards innovation
practices (Ljiljana & Durdana, 2015). A study by Aizzat, Muhammad and Nur (2012)
had the view that an organizational structure had a positive impact on innovation

43
practices. The critique of the empirical review revealed various shortcomings of the
studies. The study by Ozge and Mette (2011) in Germany used a small sample from
a relatively homogenous population that was experiencing severe economic
conditions. Aizzat et al. (2012) study used a single respondent to capture level data
instead of multiple respondents per organization, while Datta et al. (2013) assumption
that the fields of Management, Strategy, Entrepreneurship, Economics and Marketing
were sufficient to capture all the themes associated with entrepreneurial activities
surrounding commercialization of innovation was not valid. Pang and Chih (2012)
research study linked innovation practices to firm performance.
2.7 Research Gaps
A number of studies have been done on area of innovation practices mostly in the
United States of America, Europe, Asia and Africa. Pang and Chich (2012) studied
Research and development management on new product development in Taiwan‘s
Hi-Tech Industries but the study did not indicate the sizes of the firms in the sample.
A study by Asieh (2015) on the relationship between an organizational structure and
job innovation in Malaysia focused on only one industrial company but failed to
factor in SMES in that country. In the study by Ozge and Mette (2011) on: Does
organizational creativity really lead to Innovation? In Denmark, SMEs were not
factored in the study. Dalta, Reed and Jessup (2013) undertook a study on
Commercialization of innovation an overarching framework and research agenda in
the US but the study did not indicate the sizes of the firms in the sample. A study by
Andrea and Marco (2013) on: Succeeding in innovation: Key insights on the role of
research and development and technological acquisition drawn from a company in
Italy did not indicate the type of innovation pursued by the study and only focused in
one company.
Out of the many studies that have been done, only a few studies have been carried out
in Kenya including Gichana, Ongwae and Romanus (2013) in their study on
innovation activity and firm growth across key sectors of the Kenyan economy but
did not indicate the firm sizes and the sectors involved; Mbogo and Ashika (2013)
who studied the factors influencing innovation practices in micro finance institutions,

44
focused on the service sector but did not study the manufacturing SMEs. Mwangi and
Namusonge (2014) who investigated the influence of innovation on small and
medium enterprise (SME) growth did not study the influence of innovation practices
on manufacturing SMEs. These studies showed that limited attention had been paid to
the influence of innovation practices-SMMEs performance relationship model in
Kenya. This study therefore filled on this existing knowledge gap.

45
CHAPTER THREE
RESEARCH METHODOLOGY
3.1 Introduction
This chapter discusses the research design and the methodology that was used in this
study. The content include research design, population, sampling size and sampling
technique, data collection instruments, data collection procedure, pilot study,
measurement and scaling technique, data analysis and processing, and statistical
model and hypothesis testing.
3.2 Research Design
A research design is a framework for data collection and analysis to answer a study‘s
research questions (Bryman & Bell, 2011). Orodho (2008) asserted that decisions
regarding what, where, how much, by what means concerning an inquiry or research
study constitutes a research design. Cooper and Schindler (2011) and Kothari (2010)
suggested that a research design constitutes the blue print for collection, measurement
and analysis of the data. A research design enables the researcher in allocation of
limited resources by posing crucial choices in methodology (Cooper & Schindler,
2011). This study adopted mixed methods research guided by cross-sectional survey
design. Onwueghbuzie and Turner (2007) and Creswell and Clark (2011) referred to
the integration of qualitative and quantitative research methods as mixed-methods
research. Mixed methods research combines elements of qualitative and quantitative
research approaches for the purposes of the breadth and depth of understanding and
corroboration (Johnson, Onwuegbuzie & Turner, 2007).
The use of mixed-methods research allowed the researcher to compensate for the
weakness of one single approach with the strengths of the other to achieve the best
results (Johnson & Onwueghbuzie, 2004; Creswell & Cark, 2011). Mixed methods
enabled the researcher to provide generalization of data derived from a quantitative
approach and at the same time facilitated the researcher‘s generation of thick and rich
data from qualitative methods (Teddlie & Tashakkori, 2009). Kusumawardhani

46
(2013) used mixed methods in her study on the role of entrepreneurial orientation in
firm performance in Indonesian SMEs in the furniture industry in central Java. This
study adopted cross-sectional survey design, which helped with hypothesis
formulation and testing the analysis of the relationship between variables. A cross-
sectional survey design enabled the researcher to capture information based on data
gathered for a specific point in time (Cooper & Schindler, 2011). Masood, Sadia,
Muhammad and Saman (2013) used cross-sectional survey design in their study on
the effects of innovation types on firm performance.
3.2.1 Research Philosophy
This study was guided by an epistemological research philosophy which related to the
development of knowledge and nature of that knowledge (Saunders, Lewis &
Thornhill 2009). There are three epistemological positions: realism, interpretive and
positivism (Saunders, Lewis & Thornhill, 2009). This study adopted posivitivist
research philosophy. Positivist is characterized by a belief in theory before research
and statistical justification of conclusion from empirically testable hypotheses, the
core of tenets of social sciences (Cooper & Schindler, 2011).
A study by Trochim (2006) stated that positivism‘s position is that the goal of
knowledge is to describe the phenomenon under study by sticking to what is
observable and measurable. Bryman (2012) stated that the question of what is, or
should be regarded as acceptable knowledge as discipline is the main focus of
epistemology. Epistemology focuses on the study of how knowledge develops.
Ndung‘u (2014) in his study on the moderating role of entrepreneurial orientation on
the relationship between information security management and firm performance
used positivist research philosophy.
3.3 Population of the study
Population refers to the entire collection of all subjects from where a sample is drawn
(Zikmund, Babin, Carr & Griffin, 2012). The target population is a group of
individual objects or items from which a sample is taken for a specific study (Kombo
& Tromp, 2009). The target population for this study was SMME‘s registered with

47
the Kenya Association of Manufacturers (KAM, 2015). There were seven hundred
and fifty-two (752) manufacturing firms registered with KAM as at June 2015 as
shown in Table 3.1.
Table 3.1: Kenya’s Manufacturing Firms registered with KAM as at June 2015
Sector Population
Chemical & Allied 79
Energy, Electricals & Electronics 45
Fresh Produce 11
Food & Beverages 187
Leather & Footwear 9
Metal & Allied 83
Motor Vehicle & Accessories 51
Paper & Board 74
Pharmaceutical & Medical Equipment 24
Plastics & Rubber 77
Textile & Apparels 64
Timber, Wood & Furniture
Building, Construction & Mining
19
29
Total 752
(Source: KAM, 2015)
3.4 Sampling Design
Gall and Borg (2012) defined a sample as a carefully selected sub-group that
represents the whole population in terms of characteristics. The sample size depends
on what one wants to know, the purpose of inquiry, what is at stake, what was useful,
what will have credibility and what can be done with available resources and time
(Oso & Onen, 2011). Sampling is the selection of a portion of the population that
represents the said population. Sampling involved selection of units from the
population of interest, which constituted the sample (Trochim, 2006). A sampling
frame is a list of elements from which the sample is actually drawn (Cooper &
Schindler, 2011). The sample frame for this study was KAM directory 2015 for
SMMEs registered with Kenya Association of Manufacturers. Saunders, Lewis and
Thornhill (2007) stated that a good sample has three characteristics: the sample

48
should be representative, result in a small sampling error and the results of the study
can be in general be applied for the universe with a reasonable level of confidence.
Kothari (2011) posited that the sample size should neither be too big nor too small
but optimum which achieves efficiency, flexibility, reliability and representativeness.
A small sample size is unreliable while a large sample size is reliable and precise but
too expensive in terms of resources. Statistically, for the central limit theorem to hold,
a sample of greater than thirty is needed for normal theory approximations for
measures such as standard error of the mean (Kasiulevicius, Sapoka & Filipavicurte,
2006). Kothari (2011) posited that the sample size increases with the degree of
statistical confidence and the precision required. Most studies adopt a confidence
level at 95% and a precision of +/-5% (Gupta, 2012). This study adopted a
confidence level at 95%.
The Kenya Association of Manufacturers did not differentiate the firms in terms of
size. KIPPRA (2013) posited that the SME sector constituted 70% of all the
manufacturing firms in Kenya. The Micro and Small Enterprises Act 2012 defined
the MSE sector as those Firms with an annual turnover not exceeding KES 5,000,000
and not more than 50 employees. This sector included the manufacturing sector
where investment in machinery and plant did not exceed KES 50,000,000 (RoK,
2013). Small and medium manufacturing enterprises in Kenya‘s manufacturing sector
are firms with up to 100 fulltime employees and annual sales turnover not exceeding
KES 150 million (Wanjau, Gakure & Kahiri, 2012). Guitard (2007) pointed out that
there was no common definition of an SME in Kenya. In the report on SME Trade
Finance, reviewing of facilities available in Kenya, the report adopted the SME
solution Center‘s definition of a formally registered entity of 5 to 150 employees and
a turnover of below US dollars 5 million (Maina, Kiragu, Butoyi, Scholastica,
Michira & Nkatha, 2010). This study adopted Maina et al (2010) definition of SME.
Stratified random sampling with a proportional allocation of each stratum was used to
obtain a representative sample in this study. In random sampling, each item in the
population has a probability of selection same as any other item in the population.
Stratified random sampling is used for data which is heterogeneous. The population is

49
divided into sub-groups with common characteristics and the representatives from
each sub-group are to be part of the sample (Kothari, 2010)
Mugenda and Mugenda (2012) posited that at least 30% of the population is adequate
to form the sample size. Hill (2012) suggested that at least 10% sample size of the
population is adequate for a research study, while for a small population, 20%
constitute a sample. The sample for this study was determined using the sample table
developed by Krejcie and Morgan in 1970 as shown in appendix two (Research
Advisors, 2006). The population for this study was between 700 and 800 and
therefore the sample size at 95% confidence level was (248+260)/2=254 representing
34% of the population which was based on the following formula by Krejcie and
Morgan.
s=X2NP (1-P) ÷d
2 (N-1) + X
2P (1-P)……………………….Equation (1)
3.841x752x0.5x0.5
6.05 x0.05 x 751 + 3.841 x 0.5 x 0.5
=722.108
2.83775
= 254
Where,
s=Sample Size
X2= the table value of chi-square for 1 degree of freedom at the desired
confidence level (3.841)
N= Population Size
P= the population proportion (assumed to be 0.5 since this would provide the
maximum sample size).
d= degree of accuracy expressed as a proportion (0.05).

50
This sample formed preliminary research to identify the final sample since SMEs in
each sector are not rightly identified by KAM directory. Ngugi (2012) used
preliminary research to determine the sample of small and medium family enterprises
in Kenya from a large sample of Small and Medium Manufacturing Enterprises.
Questionnaires were administered only to those managers or owner managers who
had registered manufacturing firms with 5 to 150 employees and sales turnover not
exceeding US dollar 5 million. The simple random stratified sampling was
represented in the Table 3.2
Table 3. 2: The Sample Size
Sector Population Sample Size
(Unit of Analysis,
34% of population)
Managers or
Entrepreneur
Owners (Unit of
Observation)
Chemical & Allied 79 27 27
Energy, Electricals &
Electronics
45 15 15
Fresh Produce 11 4 4
Food & Beverages 187 63 63
Leather & Footwear 9 3 3
Metal & Allied 83 28 28
Motor Vehicle &
Accessories
51 17 17
Paper & Board 74 25 25
Pharmaceuticals &
Medical Equipment
24 8 8
Plastics & Rubber 77 26 26
Textile & Apparels 64 22 22
Timber, Wood &
Furniture
19 6 6
Building,
Construction &
Mining
29 10 10
Total 752 254 254

51
3.5 Data Collection and Instrumentation
Kombo and Tromp (2011) defined data collection as the gathering of information to
serve or prove some facts. The researcher collected both primary and secondary data.
The primary data was obtained by administering a questionnaire to the respondents
while the secondary data was collected from published sources such as the internet,
library and research done by other scholars. After data collection, the researcher used
various methods of estimating non- response. There are three methods that are
commonly used: comparison with known values for the population, subjective
estimates and extrapolation
Kothari (2011) stated that data collection instruments are means by which primary
data is collected in social research. The means adopted by the researcher were
influenced by factors such as costs, time and other resources at the disposal of the
researcher (Orodho, 2008). The most commonly used means include observations,
personal interviews, questionnaires, mailed questionnaires and telephone interviews.
This study used an interview schedule and a self-administered, semi-structured
questionnaire to collect primary data. Questionnaires consisted of a series of specific,
short questions that were asked verbally by the interviewer or answered by the
respondents on their own (Cooper & Schindler, 2011). The number of closed-ended
questions in any survey should exceed the number of open-ended questions (Bryman,
2012). Babu, Krishna and Swathi (2013) in their study on the role creativity and
innovation in Entrepreneurship used a semi-structured questionnaire to collect
primary data.
3.6 Pilot study
Before a survey was carried out, all aspects of the questionnaire as a survey
instrument underwent a pilot test (Malhotra et al, 2010). Cooper and Schindler (2011)
explained that a pilot test is conducted to detect weakness in design, instrumentation
and to provide proxy data for selection of probability sample. Pilot test also enables
the researcher to identify and eliminate any problems that may exist in a
questionnaire design (Malhotra et al, 2010) and examine the reliability and validity of
measures used in the questionnaire (Sekaran, 2003). The number in the pilot study

52
was 10% of the sample size (Bryman, 2012), and therefore the study used 25
respondents for the pilot study.
3.6.1 Reliability of data collection instruments
Reliability in qualitative research depends on the quality of recording and
documenting data, and the ability of the researcher to interpret it (Flick, 2006). One
of the methods used to increase the reliability of interviews was by conducting
training for the interviewers (Bryman & Bell, 2011). This study adopted the internal
consistency method. Reliability is consistency of measurement (Bollen, 2012) or
stability of measurement over a variety of conditions in which basically the same
results are obtained. Reliability is the extent to which a given measuring instrument
produces the same result each time it is used (Abbot & McKinney, 2013). The typical
methods used to estimate test reliability in behavioural research are: alternative firms,
test-retest reliability, inter-rater reliability and internal consistency (Drost, 2011).
This study adopted internal consistency method as it was more stable than the other
methods (Bryman, 2012; Cooper & Schindler, 2011). Internal consistency was tested
using the Cranach‘s alpha statistic. Cronbach‘s alpha was computed as follows:
a= K/ (K-1) [1-(1-(∑k2/total
2)]……………………………………Equation (2)
Where; K is the number of items, ∑k 2 is the sum of the k item score variances and
total2 is the variance of scores on the total measurement (Cronbach, 2004). Pallant
(2010) advised that where Cronbach‘s alpha coefficient is used for reliability test, the
value should be above 0.7.
3.6.2 Validity of data collection instruments
Validity is the degree to which results obtained from the analysis of the data actually
represent the phenomenon under study (Mugenda, 2008). A measuring instrument is
valid if it measures what it precepts to measure (Bryman, 2012; Mugenda; 2008).
Validity was therefore concerned with the meaningfulness of research components.
This study adopted construct validity. There are four types of validity; internal
validity, statistical conclusion validity, constructs validity and external validity

53
(Drost, 2011). Construct validity referred to how well the results obtained from the
use of the measures fit the theories around which the test was designed (Trochim,
2006).
Content validity was also adopted in this study. Content validity relates to a direct use
in scientific generalization which is the extent to which one can generalize from a
particular collection of items to all possible items that would be representative of a
specified domain of items (Drost, 2011). A study by Drost (2011) stated that there are
two ways of assessing content validity, through asking a number of questions about
the instruments or test and asking the opinion of expert judges in the field.
3.7 Data Analysis
Zikmund et al. (2012) stated that data analysis is the application of reasoning to
understand the data that have been gathered with the aim of determining consistent
patterns and summarizing the relevant details revealed in the investigation. Data
processing entailed editing, classification and tabulation of data collected so that they
were subjected to analysis (Kothari, 2010). Data entry converted information
gathered by secondary and primary methods to a medium for viewing and
manipulation. This study collected both qualitative and quantitative data.
As Kothari (2011) pointed after questionnaires were received back the raw data was
edited for any errors or omissions and correction made where possible. This was done
to ensure data‘s accuracy and consistency with other gathered facts. Coding and
classification was done for efficient analysis of the data. This study used both
descriptive and inferential statistics to analyse the data. Descriptive statistics
described and summarized the data in a meaningful way using charts, tables and bars
while inferential statistics drew conclusions on the analysed data thus helping in
generalization. Therefore bars and histograms formed part of the analysis for
presentation of results. Predictions based on the results of the analysis were made and
the results generalized on the population of study given that the test sample was part
of the population.

54
The data collected was tested for the assumptions of various analytical models upon
which the most appropriate was selected, for example the diagnostic for the use of
multiple linear regression were that the data was normally distributed.
The function specification for the study was:
FP= f (CR, OSTR, R&D, COMM, ε)
Where;
FP– Firm Performance
β0 - Constant term
β1 β2 β3 and β4 – Constants regression coefficients
CR – Creativity
OSTR – Organizational structure
R & D – Research and Development
COMM – Commercialization
ε – Error term
3.7.1 Statistical Modelling
To draw conclusions on the objectives of the study and test hypotheses, statistical
models were fitted for the specification function showing the influence of innovation
practices on financial performance of SMMEs in Kenya.
3.7.1.1 Regression models
Regression models were fitted to determine the relationship between each
independent variable and performance of SMMEs. Regression models considered the
relationship between two variables at a time without considering the combined joint

55
relationships. The study used the following models to determine the influences of
each independent variable on SMMEs performance.
3.7.1.2 Multivariate models
To test the combined effect of innovation practices (creativity, organisational
structure, research and development and commercialisation) on the dependent
variable, a multiple regression model was fitted. The model estimated the joint
influence of the independent variable on performance. The multiple regression model
was given by the equation below;
………….……….. Equation 3. 1
Where: were the regression coefficients of the predictors in the
model
FP – Firm performance
– The intercept of the equation (Constant term)
X1 – Creativity
X2 – Organisational structure
X3 – Research and development

56
X4 – Commercialization
– The error term
To test whether entrepreneurial orientation moderates the relationship between
innovation practices and SMMEs performance, Moderated Multiple Regression
(MMR) statistical tool was used (Zikmund, Babin & Griffin, 2010). Moderated
Multiple Regression (MMR) enabled the slope of one or more of the independent
variables to vary across values of the moderator variable, thereby facilitating the
investigation of an extensive range of relationships and function forms (Goode &
Harris, 2007). Aguinis and Gottfredson, (2010) posted that estimating interaction
effects using moderated multiple regression usually consisted of creating an Ordinary
Least Squares (OLS) model and a Moderated Multiple Regression (MMR) model
equations involving scores for a continuous predictor variable Y, scores for a
predictor variable X, and scores for a second predictor variable Z hypothesized to be
a moderator. To determine the presence of moderating effect, the OLS model was
then compared with the MMR model. Andreas, Torsten and Rene (2013) used
Moderated Multiple Regression in their study on determinants of radical innovation
practices.
The first equation showed the Ordinary Least Squares (OLS) regression equation
model predicting Y scores from the first-order effects of X and Z observed scores.
………...……Equation 3. 2
Where: were the regression coefficients of the predictors in the
model
FP – Firm performance
– The intercept of the equation (Constant term)

57
X1 – Creativity
X2 – Organisational structure
X3 – Research and development
X4 – Commercialization
– Entrepreneurial Orientation
– The error term
The second equation, the Moderated Multiple Regression (MMR) model was formed
by creating a new set of scores for the two predictors (i.e. X, Z), and including it as a
third term in the equation, which yielded the following model:
……………………………………………………..…………………….Equation 3
Where: were the regression coefficients of the predicts in the model
FP – Firm performance
– The intercept of the equation (Constant term)
X1 – Creativity
X2 – Organisational structure
X3 – Research and development
X4 – Commercialization
– Entrepreneurial Orientation (Moderating variable)

58
Are the interaction terms between the independent variables and the
moderator ( )
– The error term
3.7.1.3 Model Diagnosis
The study adopted Ordinary Least Squares (OLS) estimation to fit the statistical
models specified for drawing conclusions on the study objectives. OLS is a maximum
likelihood estimation technique that is subject to the classical assumptions of
statistical model estimation. The study therefore carried out diagnoses on fitted OLS
models to ensure that they did not violate the assumptions and conditions. The
assumptions diagnosed and tested were the assumption of normality of the residuals,
non-autocorrelation of the residuals, non-multicollinearity of the independent
variables and homoscedasticity of the residual terms. Koong, Merhi and Sun (2013)
tested for the classical assumptions on models in their analyses in their study on Push
and Pull Effects of Homeland Information Security Incentives.
The study tested for normality, autocorrelation, homoscedasticity and
multicollinearity. Normality was important in knowing the shape of the distribution
and helped to predict dependent variables scores (Paul & Zhang, 2009). The study
used Shapiro-Wilk test for normality. A p-value of greater than 0.05 confirmed that
the residuals for the fitted multiple regression model was normally distributed. Freel
and Robson (2012) tested for normality in their study on Small Firms Innovation
growth and performance, evidence from Scotland and Northern England. Auto-
correlation referred to the correlation of a time series with its own past and future
values (Box & Jenkins, 1976). Auto-correlation function was used to detect non-
randomness in data and identified an appropriate time series model if the data were
not random. Auto-correlation was a correlation coefficient but instead of correlation
being between two different variables, the correlation was between two values of the
same variable at times Xi+ Xi+k. The study used Durbin Watson statistic to test for
autocorrelation. Mohd, Zuhriah and Norsiah (2014) tested for auto-correlation in their

59
study on the influence of innovation performance towards manufacturing
sustainability performance.
Homoscedasticity is a situation where the residual terms have a constant variance.
Adoption of OLS model required the residual model to be homoscedastic (Park,
2011). A Breuch-pagan test was done on the residual terms of the overall model to
test the existence of either heteroscedasticity or homoscedasticity. Hans, Mariann,
Isabelle and Rutger (2012) tested for homoscedasticity in their study on innovation
practices process in small firms. Multicollinearity is exhibited if one or more
independent variables were expressed in terms of the other independent variables
(Mart, 2013). Variance Inflation Factor (VIF) was used to test for multicollinearity.
Where no two independent variables were correlated, all the VIFs were 1. If the VIF
for one of the variables was around or greater than 5, then there was multicollinearity
associated with that variable and in this case one of the variables is removed from the
regression model (Cohen, Cohen, West & Aiken, 2013). Alvaro and Calvo (2011)
tested for multicollinearity in their study on the factors that influence innovation
activities of Spanish Big firms.
3.7.2 Operationalization of study variables
Cresswell (2004) defined operationalization as the process of developing indicators or
items for measuring the research constructs. The literature reviewed identified
various variables for this study. The independent variables consisted of four elements
namely; creativity, organizational structure, Research and Development and
commercialization (Table 3.3). The dependent variable was the SMMEs performance
which was composed of sales turnover, profitability and return on investment.

60
Table 3.3: Operationalization of Study Variables
Type of Variable Variable Name Operationalization
Independent
variables
Creativity Technological expertise
Team work
Motivation
Organizational Structure Centralization
Formalization
Professionalization
Research & Development Customer participation
Top management involvement
Venture capital
Commercialization Internationalization
Technological exploitation
Market exploitation
Moderating
Variable
Entrepreneurial
Orientation
Pro-activeness
Risk taking
Innovation
Dependent
Variable
SMMEs Performance Sales turnover
Profitability
Return on investment
3.7.3 Test of significance
To draw conclusions on the objectives, the study tested hypotheses based on statistics
from the results and findings of statistical modelling. The study fitted various OLS
models for and tested for significance at 0.05. On correlation analyses, the correlation
coefficients estimates were tested and concluded to be significant if the p-values were
less than 0.05. Regression models were tested for goodness of fit by computing the R-
square statistics that showed the explanatory power of the models. A large R-square
was associated with high explanatory power implying good fitness. The moderating
effect was tested by computing the R-square, change in its corresponding F-change p-

61
value where a significant moderating effect was associated with a p-value of less than
0.05. Every regression model fitted was tested for general significance by carrying
out ANOVA and calculating the F-statistic, the regression models with p-values of
less than 0.05 were considered significant. Study hypotheses were tested from the
student‘s t-test of the multiple regression coefficients of the variables. Variables with
p-values of less than 0.05 of the t-statistics were concluded to have significant
influence on SMMEs performance.

62
CHAPTER FOUR
RESEARCH FINDINGS AND DISCUSSION
4.1 Introduction
The study adopted different statistical approaches to investigate the influence of
innovation practices on performance of Small and Medium Manufacturing
Enterprises (SMMEs). All constructs were adopted from pre-existing scales of the
literature review. Descriptive statistics, reliability of the variables that comprise this
study were measured using Cronbach alpha coefficient generated by Statistical
Packages for Social Science (SPSS). Cronbach‘s Alpha is a measure of consistency
and checks if the questions in the questionnaire were understood and if the data are
minimally reliable. The findings of the study were presented based on the study
specific objectives and their respective hypotheses tested.
4.2 Response Rate
The researcher collected data from firms registered with Kenya Association of
manufacturers (KAM) as at June 2015. The study had a sample of 254 firms out of
the 752 registered with KAM. The target sample was 254 owner/ senior managers out
of which 215 responses were received accounting for 85% response rate. Sekaran
(2004) argues that any response rate above 75% is classified as best and appropriate
for any study. Mugenda and Mugenda (2012) aver that a response rate of 50% is
adequate, 60% and above good and above 70% very good. The response rate of 85%
found in this study was therefore quite adequate. This was in line with Orodho (2009)
that a response rate above 50% contributes towards gathering of sufficient data that
could be generalized to represent the opinions of respondents about the study problem
in the target population. Table 4.1 shows the response rate in the study.

63
Table 4.1: Response Rate
Sector Populatio
n
Sample
Size
Respons
e
Response
rate
Chemical & Allied 79 27 23 85%
Energy, Electricals & Electronics 45 15 13 87%
Fresh Produce 11 4 3 75%
Food & Beverages 187 63 53 84%
Leather & Footwear 9 3 3 100%
Metal & Allied 83 28 24 86%
Motor Vehicle & Accessories 51 17 14 82%
Paper & Board 74 25 21 84%
Pharmaceutical & Medical
Equipment
24 8 7 88%
Plastics & Rubber 77 26 22 85%
Textile & Apparels 64 22 19 86%
Timber, Wood & Furniture 19 6 5 83%
Building, Construction & Mining 29 10 8 80%
Total 752 254 215 85%
4.3 Results for the Pilot Study
A pilot test was conducted for testing the reliability and validity of the questionnaire.
According to Blumberg, Cooper and Schindler (2011), a pilot test is aimed to
show the duration it will take to complete the questionnaire, confirm clarity and
logical flow of format, confirm if questions are clear and short and test the
questionnaire credibility. The number in the pilot study should be small, about 1% to
10% of the target population (Mugenda & Mugenda, 2012). In this study the
questionnaire was tested on 10% of the entire sample size, which translated to 25
respondents. Atalay (2013) used pilot study in his study on the relationship between
innovation and firm performance: An empirical evidence from Turkish automotive
supplier industry.

64
4.3.1 Test for construct validity
A study by Field (2011) defines factor analysis as an exploratory tool used to help the
researcher make decisions on whether the variables under investigation explain the
dependent variable. Mugenda and Mugenda (2012) define factor validity as the
degree of which results obtained from the analysis of the data actually represent the
phenomenon under study. In this study, validity was concerned with whether the
findings will explain the influence of innovation practices on performance of SMMEs
in Kenya.
To determine the influence of innovation practices on performance of SMMEs in
Kenya, factor analysis was conducted for the variables and the results had factor
loadings of 0.7 and above. Ala, Schaufeli and Hakanen (2010) used factor analysis
which has been widely accepted as reliable in many research studies. A loading factor
of 0.7 and above was considered acceptable and has been used by other researchers
such as Chih (2011). This study showed that all the retained factors related to
creativity, organisation structure, research and development, commercialisation and
entrepreneurial orientation had factor loadings of above 0.7 and were therefore used
for subsequent analysis. They were found to be within the cut-off value of 0.7 and
above as recommended by Hair at el (2012) in their study. This study has therefore
met the requirements of convergent validity. Hans (2014) used a factor loading of 0.7
in his study on innovation practices process and the trade-off between innovation
practices performance and business performance.
4.3.1.1 Convergent validity
The study tested for convergent validity to find out if constructs that were expected to be
related were actually related. To test for convergent validity, the researcher computed
the Average Extracted Variance (AVE) within each construct (John & Veronica, 2010).
Convergent validity is said to be implied if the AVEs are all above 0.5. The results on
the Average Variance Extracted for this pilot study showed that from the retained
factors, all the constructs had an Average Variance Extracted of above 0.5 implying
convergent validity (Kane 2013). This was shown in Table 4.2.

65
Table 4. 2: Average Variance Extracted
Construct AVE
Creativity 0.50296
Organizational Structure 0.50309
Research and Development 0.5019
Commercialization 0.50072
Entrepreneurial Orientation 0.51106
Performance 0.50296
4.3.1.2 Discriminant validity
The study tested for discriminant validity to confirm that constructs that were
expected not to be related were actually not related. To measure discriminant validity,
a comparison of the Average Variance Extracted for each construct and the squared
correlations were computed and tabulated. Table 4.3 below showed the comparison
with the AVEs on the diagonal and highlighted. On comparison, all the AVEs were
greater than the squared correlations between the constructs implying that the
instrument exhibited discriminant validity. A higher AVE than the squared
correlations between constructs implied discriminant validity (Koufteris, 2015). Table
4.3 shows the correlation matrix of the latent constructs.
Correlation among the independent variable was illustrated by correlation matrix
(table 4.3). Correlation explores the relationship among a group of variables (Pallant
2010) in turn helping to test for multicollinearity. The correlation values should not
be close to 1 or -1 as this may be an indication that the factors are different measures
of separate variables (Farndale, Hope-Hailey & Kelliher, 2010). Absence of
multicollinearity allows the study to utilize all the independent variables. Table 4.3
shows that the lowest correlation in this study was between innovation practices and
organizational structure (r= 0.037, .p<0.1). The highest correlation was between
innovation practices and commercialization (r= 0.095, p<0.1). A correlation of 0.9
and above was an indicator that the variables may be measuring the same thing

66
(Tabachnick & Fidell, 2013). In this study all the correlations were less than 0.90,
indicating that all the factors were sufficiently, different measures of separate
variables and therefore the study utilized all the variables.
Table 4.3: Correlations
Creati
vity
Organizationa
l Structure
Research and
Development
Commerci
alization
Entrepreneurial
Orientation
Perfor
mance
Creativity 1 0.073 0.068 0.089 0.05 0.568
Organizationa
l Structure
0.073 1 0.037 0.064 0.091 0.612
Research and
Development
0.068 0.037 1 0.049 0.088 0.512
Commercializ
ation
0.089 0.064 0.049 1 0.095 0.555
Entrepreneuri
al Orientation
0.05 0.091 0.088 0.095 1 0.549
Performance 0.568 0.612 0.512 0.555 0.549 1
Comparison between the AVEs and the squared correlations
Table 4.4: Squared correlations and AVE
Creati
vity
Organizati
onal
Structure
Research and
Development
Comme
rcializa
tion
Entreprene
urial
Orientation
Perform
ance
Creativity 0.503 0.005 0.005 0.008 0.003 0.323
Organizational
Structure
0.005 0.503 0.001 0.004 0.008 0.375
Research and
Development
0.005 0.001 0.502 0.002 0.008 0.262
Commercialization 0.008 0.004 0.002 0.501 0.009 0.308
Entrepreneurial
Orientation
0.003 0.008 0.008 0.009 0.511 0.301
Performance 0.323 0.375 0.262 0.308 0.301 0.535

67
4.3.1.3 KMO and Bartlett’s test
The Kaiser-Meyer-Olkin (KMO) is a measure of sampling adequacy (KMO) and
Bartlett‘s test of sphericity are tests of sampling adequacy. The KMO measures the
variance proportion in variables in relation to the underlying factors. The KMO value
ranges from zero to one where a high KMO value is desired. A value of zero
indicates that the sum of partial correlation is large relative to the sum of correlations
indicating diffusions in the patterns of correlations, and hence, factor analysis is
likely to be inappropriate (Costello & Osborne, 2011). From the Pilot study, the
KMO value was 0.841 which tends to 1 indicating that the patterns of correlations
were relatively compact and so factor analysis should yield distinct and reliable
factors.
The Bartlett‘s test was used to confirm that the relationships between factors were
significant. The p-value of the chi-square statistic of the test was less than 0.05
implying that the relationship between factors was significant and therefore factor
analysis would be useful from the data collected for pilot. Hans (2014) tested for
KMO and Bartlett‘s test of sphericity in his study on innovation practices processes
and the trade-off between innovation practices performance and business
performance. Table 4.5 shows the values of KMO and Bartlett‘s test of Sphericity in
the study.
Table 4.5: KMO and Bartlett’s Test of Sphericity
Test Value
Kaiser-Meyer-Olkin measure of sampling adequacy. 0.841
Bartlett's test of sphericity Approx. Chi-square 3950
Df 3750
sig. 0.011

68
4.3.2 Reliability
Reliability is a consistency of measurements (Bollen, 2012) or stability of
measurements over a variety of conditions in which basically the same results are
obtained. Abbot and Mc Kinney (2013) define reliability as the extent to which a
given measuring instrument produces the same results each time it is used. To assess
the construct reliability, that is the extent of measurement error in a measurement,
this study used Cronbach alpha (Neuman, 2010). This study test of reliability was
based on Cronbach alpha of 0.70 which was generated by Statistical Package for
Social Sciences (SPSS). Zikmund et al. (2010) stated that the coefficient alpha is an
appropriate measure of variance attributed to subjects and variance attributed to the
interaction between subjects and items. The values in Table 4.6 showed the reliability
statistics for creativity as , organisation structure as , research
and development as , commercialisation as , entrepreneurial
orientation as and performance as . These were sufficient
confirmation of the reliability of the data collection tool for all the variables. A
Cronbach alpha of 0.7 is a minimum level of acceptance (Zikmund et al., 2010).
Table 4.6: Reliability
Variable Number of Items
retained
Cronbach’s
Alpha
Comment
Creativity 12 0.751 Accepted
Organizational Structure 9 0.851 Accepted
Research and
Development
8 0.795 Accepted
Commercialization 9 0.744 Accepted
Entrepreneurial
Orientation
9 0.856 Accepted
Performance 7 0.964 Accepted

69
4.4 Demographic Profile of Respondents.
4.4.1 Gender Distribution
The gender of the respondents was sought. The study found out that majority (60%)
of the respondents were male (129) while the rest (40%) were female (86). As shown
in the Table 4.7 the findings imply that majority of the SMMEs managers in the
KAM firms were male. However the distribution represented a fair gender balancing,
an indication of successful efforts of various gender mainstreaming campaigns. The
study results may be attributed to the strong male domineering culture in Kenya
where until recently women were relegated to domestic chores. This culture is dying
off and a large population of women population is now strongly competing with their
male counterparts in most jobs (RoK, 2008; 2010).
Table 4.7: Gender
Gender Number Percentage
Male 129 60%
Female 86 40%
Total 215 100.0%
4.4.2 Length of Continuous Service with the Firm
The length of continuous service in the firm was sought to ensure collection of
credible data. In Table 4.8, Majority (50.7%) of the respondents from the firms had
worked with the firms for 2 to 4 years. 3.5% of the respondents had worked for less
than 2 years while 30.2% had worked for 5 to 7 years. There was 12.6% of the
respondents who had worked for up to over 7 years. This showed that the personnel
who availed the information for the firms had served long enough to acquire
knowledge that enabled them to give credible information. The results indicate that
Majority of the managers of SMMEs in Kenya had served for a considerate period of
time to warrant them to avail credible information. These findings were in line with

70
Braxton (2008) that respondents with a high working experience assist in providing
reliable data on the study problem since they have technical experience on the
problem being investigated by the study. This indicates that 50% of the respondents
had worked in the firms for a long time and thus understood technical issues on
innovation practices and performance of SMMEs in Kenya.
Table 4.8: Length of Continuous Service in the Firm
Period Number Parentage
Less than 2 years 14 6.5%
2-4 years 109 50.7%
5-7 years 65 30.2%
over 7 years 27 12.6%
Total 215 100.0%
4.4.3 Level of Education
The researcher also sought to find the level of education of the respondents from the
firms. Table 4.9 below shows that majority (79.6%) of the respondents from the firms
had at least obtained an undergraduates degree, 16.1% were postgraduate holders and
only 4.3% of the firms had diploma holders responding to the questionnaires. This
was highly expected considering that the respondents selected to respond were at
senior management level where skills, knowledge and competencies was supposed to
be high. These findings implied that most of the respondents were qualified to
understand the nature of the study problem. This concurs with Joppe (2010) that
during research process, respondents with technical knowledge on the study problem
assist in gathering reliable and accurate data on the problem under investigation. This
demonstrated that most of the organization employees were qualified professionals
with technical knowledge and skills on the study problem and thus provided the study
with reliable information on innovation practices and performance of SMMEs in
Kenya

71
Table 4.9: Level of Education
Level Percentage
Diploma 4.3%
Undergraduate 79.6%
Post graduate 16.1%
Total 100.0%
4.4.4 Sector Distribution of the Respondents.
The distribution of respondents per sector as shown in Table 4.10 was an appropriate
representation of all the sectors represented by firms registered with the KAM as at
June 2015. This was an indication that proper stratification of the sector was done.
This demonstrated that all the respondents were directly involved in the execution of
innovation practices and this helped in gathering reliable data on factors affecting the
innovation practices and performance of SMMEs in Kenya. This suggests that the
respondents had wide experience in the work place and consequently they were in a
position to understand most of the innovation practices concepts.
Table 4.10: Distribution of respondents by Sector
Sector Sample Size Response Response rate
Chemical & Allied 27 23 85%
Energy, Electricals & Electronics 15 13 87%
Fresh Produce 4 3 75%
Food & Beverages 63 53 84%
Leather & Footwear 3 3 100%
Metal & Allied 28 24 86%
Motor Vehicle & Accessories 17 14 82%
Paper & Board 25 21 84%
Pharmaceutical & Medical
Equipment
8 7 88%
Plastics & Rubber 26 22 85%
Textile & Apparels 22 19 86%
Timber, Wood & Furniture 6 5 83%
Building, Construction & Mining 10 8 80%
Total 254 215 85%

72
4.4.5 Relationship with the Firm
Respondent‘s relationship with the firm was sought to find out how the managers
were relating with the firms. The unit of observation for the study was senior
managers in the firms registered with the KAM as indicated in the methodology. The
question thus sought to establish the commitment of the respondents in the firm. A
majority (60%) of the respondents were owner managers while 40% of the
respondents were employee managers as indicated in Table 4.11. Aronoff and Ward
(2011) noted that family firms have long been the backbone of worldwide enterprises
and range between 65% and 80% of worldwide businesses. Therefore, the findings of
this study were representative and it can be inferred that, of all small and medium
enterprises in Kenya, approximately 65% belong to the entrepreneurs (owners). This
suggests that the respondents had a wide experience in their business and
consequently they were in a position to understand most of the innovation practices
concepts.
Table 4.11: Relationship with the Firm
Respondent Number Percentage
Owner manager 129 60%
Employee manager 86 40%
Total 215 100%
4.5 Descriptive analysis
The descriptive analysis involved individual analysis of the indicators of each
variables of the study based on the scales of measure. The indicators of the
independent variables and the moderating variable were measured on an ordinal
categorical scale thus the descriptive statistics used the mode as the measure of
central tendency. The dependent variable had different indicators measured either on
a continuous scale or ordinal categorical scale. The categorical indicators of the
dependent variable were analysed with the mode and frequency tables while those
measured continuously analysed with the mean as an average and the standard
deviation as a measure of dispersion.

73
4.5.1 Creativity
Technological Expertise
According to Table 4.12 the variables considered for technological expertise in the
study were the use of internet in the firms operations, new applications for products,
new products developments and whether the firms equipped employees with skills for
their jobs. The questions required the respondents to choose the following responses;
others, not at all, rarely, often, and very often. The results indicated that 35% of the
respondents were of the view that the firms often found new applications for
products, 32% not at all, 27% rarely and 7% very often. The study sought opinion on
the use of the internet, 38% were of the opinion rarely, 31% often, 16% very often
and another 16 % not at all. As to whether the management equips the employees
with skills for their jobs 31% responded often, 29% rarely, 21% not at all and 19%
very often. The respondent‘s opinion summary is shown in Table 4.12.
The study result agrees with the finding of Li and Tang (2010) that creativity factors
include technological expertise, teamwork and motivation. Amabile (2012) also
outlines technological expertise, teamwork and motivation as drivers of creativity. In
view of the above results, it can be concluded that SMMEs are involved in enhancing
new applications of their products, equipping their employees with skills for their
jobs and the use of network in their operations. This confirms that most SMMEs in
Kenya have embraced technological expertise in their operations which in turn
enhance creativity in their operations.
Team work
From the study results in Table 4.12 teamwork variables considered in this study
were brainstorming to stimulate new ideas among employees, development of teams,
employee involvement in decision making and managers‘ involvement in asking
opinions from employees about how to improve the customer services in the firms.
The results of the finding indicated that 35% of the respondents were rarely involved
in decision making, 31% often, 20% not at all and 14% very often. As to whether
brainstorming was used to stimulate new ideas among employees, 33% responded

74
often, 32% rarely, 28% not at all and 5% very often. As to whether managers seek
opinion from employees 37% had the opinion of often, 27% rarely, 22% very often
and 13% not at all.
The results are in agreement with Li and Tang (2010) who concluded that creativity
factors include technological expertise, teamwork and motivation. A study by Rick et
al (2015) asserts that creativity is the driver of innovative activities in business and
that the management of any business enterprise should invest in creative activities if
they have to realize their objectives of improved performance. The findings confirm
that the creation and development of creative ideas and their manifestations as new
products are the core elements of an innovation strategy as creativity enhances the
generations of new ideas.
Motivation
In regard to motivation the study sought to investigate, the rewarding of employees
who were involved in generating new ideas, participation in outdoor activities,
recognition of one‘s performance and rewarding of employees for general
performance. Majority of the respondents, (38%) were of the view that the firms
often participated in outdoor activities, 30% rarely, 17% not at all, and 15% very
often. Opinion on whether the firm rewarded employees who generate new product
ideas, 35% responded rarely 30% often, 31% not at all and 3% very often. Regarding
recognition of one‘s performance, 34% responded rarely, 29% often, 23% not at all
and 14% very often. As to rewarding of employees for general performance, 33%
rarely agreed, 32% were for often, 19% very often and 17% not at all. This was
illustrated in Table 4.12.
The results collaborate the findings by Hong et al (2013) that motivation enhances the
morale of employees in an organization. The results also concur with the findings by
Amabile (2012) who assert that intrinsic motivation arises from the individual‘s
positive reaction to the qualities of the task itself such as interest, involvements,
curiosity and satisfaction while extrinsic motivation arises from sources outside the
task itself such as promised reward, meeting a deadline or winning a competition.
The results confirm that motivation enhances creativity. SMEs should embrace

75
creativity to empower them have the ability to develop new products, new ideas and
discover new ways of identifying new business opportunities (Hans, 2014).
Motivation can be intrinsic or extrinsic in nature. Intrinsic motivation arises from the
individual‘s positive reaction to the qualities of the task itself such as interest,
involvement curiosity and satisfaction while extrinsic motivation arises from sources
outside the task itself such as a promised reward, meeting a deadline or winning a
competition (Amabile, 2012). The social environment dynamics emphasizes creation
of teams. Teamwork is an important element in organizational settings as it facilitates
effectiveness and efficiency in an organization (Dul, Celyon & Jaspers, 2011).
Amabile (2012) in her study on ―The Impact of information Technology Resources
on SMEs innovation performance found out that creativity truly enhanced innovation
practices when senior management provided sufficient resources. Resource-
Advantage (R-A) theory of creativity views the firm as an integrator of resources that
include the firms‘ knowledge base and technological expertise that play a crucial role
in gaining competitive advantage and achieving superior levels of performance
(Hunt, 2010). The descriptive results for creativity were represented in Table 4.12.

76
Table 4.12: Creativity Indicators
Indicator Other
(1)
Not at
all (2)
rarely (3) often
(4)
Very
often (5)
Modal
Class
How often does the firm
find new application for
products
0% 32% 27% 35% 7% 4
How often if the firm
involved in product
development capability
0% 23% 28% 37% 12% 4
How often does equip
employees with skills for
their jobs
0% 21% 29% 31% 19% 4
How often does the firm
use internet in its
operations
0% 16% 38% 31% 16% 3
How often the firm is
involved in brainstorming
to stimulate new ideas
among employees
1% 28% 32% 33% 5% 4
How often is the firm
involved Developing
teams?
0% 19% 32% 36% 13% 4
How often are employees
involved if a decision is to
be made
0% 20% 35% 31% 14% 3
How often does the
manager ask opinions
from employees about
how to improve customer
service in the firm
1% 13% 27% 37% 22% 4
How often does the firm
Reward employees who
generate new product
ideas?
0% 31% 35% 30% 3% 3
How often does the firm
Participate in outdoor
activities
0% 17% 30% 38% 15% 4
Do you think the
recognition of one‘s
performance motivates
work performance of
employees
0% 23% 34% 29% 14% 3
Does the firm reward
employees for best
performance
0% 17% 33% 32% 19% 3

77
4.5.2 Organizational Structure
Centralization
The variables considered for centralization in this study were encouraging employees
to make their own decisions, employees‘ involvement in key innovation decisions,
and supervisor‘s approval on decision made by employees and whether management
get direct information from lower levels of employees. The result as shown in Table
4.13 indicated that majority (36%) were of the view that most decisions made by
employees rarely had supervisor‘s approval, 29% often, 18% very often and 16% not
at all. On the opinion whether the employees were included in key innovation
decisions, 34% responded rarely, 28% often, 23% very often and 14 % not at all.
Further on the opinion of management getting direct information from lower levels
employees, 32% responded often, 31% rarely, 25% not at all and 12% very often.
The result agree with the findings of veisi, veisi and Hasan‘s (2012) who concluded
that less centralization encourages openness and flexibility in roles which is a pre
requisite for new ideas. Shaemi et al. (2013) argue that firms with less centralized but
managerially intensive organization structures are more responsive to innovation. A
study by powley and Nissen (2012) highlighted centralization as one of the main
structural elements that may impact on innovation. The study confirms that an
organizational structure has an impact on organizational innovation specifically
centralization.
Formalization
On formalization the study sought to investigate management assignment of duties to
employees, whether written job description were formulated, whether rules and
procedures occupy a central place in the organization and the time taken for
management approval on decisions. The results are indicated in Table 4.13. Majority
of the respondent (36%) were of the view that written job descriptions were rarely
formulated at various level, 35% often 18% and 11% not at all. Regarding rules and
procedures occupying a central place in the organization 34% responded often, 32%
rarely, 18% not at all and 16% very often. Opinion on management reassigning duties

78
to employees had 33% of the view often, 32% rarely, 30% not at all, 4% very often
and 2% for other opinions.
The results are in agreement with Latiti and Shooshhtarian (2014) who discovered
that firms with organic structures that entail low formalization are more inclined to
innovate. A study by Powley and Missen (2012) reported that flexible organization
structures characterized by low levels of formalization best promote innovation
within firms. Lendel and Varmus (2012) suggest that it is necessary to employ low
formalization during innovation initiation phases because at this stage information
gathering and processing is critical for success. A study by Lewis (2011) confirms
that where the degree of formalization is low, jobs behaviours are usually not
programmed and employees have greater freedom and discretion to exercise in their
work, and new ideas are likely to be generated.
Professionalism
In relation to professionalization the study sought to investigate how often the firms
used professionals as a source of creativity and innovation, Professionals
incorporation in firm‘s activities, professional education levels and their
specialization and professionals experience in different firm activities. The results are
illustrated in Table 4.13. The results indicate that 38% of professionals are often
incorporated in firms activities, 30% rarely, 18% very often and 13% not at all.
Regarding the use of professionals as a source of creativity and innovation 34% were
of the view rarely, 28% not at all, and 5% very often. As for education levels and
specialization 33% responded often 31% rarely, 20% very often and 16% not at all.
The results concur with the findings by Meitzer and Kamprath (2013) who
acknowledge that the knowledge of the worker and their ability to create and share
new knowledge promotes products innovation in a firm. Muzio et al (2013) point out
that, the first way in which professionals restructure institutions is by opening up new
spaces for their expertise such as creation of new products. Several studies (Shaemi et
al 2013) argue that successful firms with less formalized and certified but more
professionalized and managerially intensive organization structures is therefore a
major factor of innovation practices. In their study on the effects of organizational

79
structure on organizational Trust and effectiveness Latifi and Shooshtarian (2014)
also concur that firms with organic structure that entails low formalization are more
inclined to innovate. This is also consistent with a study by Tran and Tian (2013) who
found out that flexible organizational structures characterized by low levels of
formalization and centralization best promoted innovation and better performance
within firms.
The professionals must be seen as champions of efficiency and effectiveness and
must acknowledge the challenges and their various forms, and their sources. The
requirements to educate professionals and equip them with new and higher-level
skills have consequently become urgent (Raymond, 2013). A skill is the ability either
to perform some specific behavioral task or the ability to perform some specific
cognitive process that is related to some particular task (Wanyama, 2013). However,
Obanda, (2010) report that finding, hiring and retaining dedicated, energetic, and
ethical employees with special skills is always hard. While we understand that
professionalism is a key mechanisms for, and primary targets of institutional change,
the precise role of professions and professional service firms in processes of
institutional change remain under-theorized (Lisa, 2010). Table 4.13 shows the
variables that were considered for organizational structure.

80
Table 4.13: Organizational Culture
Indicator Other
(1)
Not at
all (2)
rarely
(3)
often
(4)
Very
often
(5)
Moda
l
Class
How often does management get
direct information from lower
levels of employees
0% 25% 31% 32% 12% 4
How often are employees
included in key innovation
decisions
0% 14% 34% 28% 23% 3
Do most decisions made by
employees in the firm have to
have their supervisors‘ approval
0% 16% 36% 29% 18% 3
How often does management
reassign duties to employees
2% 30% 32% 33% 4% 4
How often are employees
expected to await for
management decision before
undertaking an operation
0% 20% 33% 32% 15% 3
How often are written job
descriptions formulated at various
levels
0% 11% 36% 35% 18% 3
How often do rules and
procedures occupy a central place
in the org
0% 18% 32% 34% 16% 4
How often does the firm use
professionals as a source of
creativity and innovation
0% 28% 33% 34% 5% 4
How often are professionals
incorporated in the firm‘s
activities
0% 13% 30% 38% 18% 4
How often do top managers and
technical stuff possess high
education levels and specialised
training
0% 16% 31% 33% 20% 4
Do top managers and technical
stuff have professional
0% 17% 30% 32% 21% 4

81
4.5.3 Research and Development
Customer participation
In relation to Customer participation the study sought to investigate customers
involvement in generating new products ideas, whether customer concern were
addressed by the firms, customers input in firms‘ decisions and modifications of
products/ services by the firms. The results were illustrated in Table 4.14. On
customer involvement in generating new product ideas 38% of respondents were of
the opinion rarely, 29% not at all, 27% often, 5% very often and 2% had other
responses. Opinion on addressing customer concerns had 35% responding often, 33%
rarely, 18% not at all and 13% very often. Regarding modification of products 35%
were of the opinion rarely, 30% not at all, 26% often and 8% very often.
The results supports the findings by Parasuraman, Hoefirinagels and Kabadayii
(2012) who concluded that customer participation in new products development can
assist Research and Development division in solving customer demands effectively.
A study by Peled and Dvir (2012) revealed that customer involvement is heavily
dependent on how involvement is managed. This study confirms that customer
participation in new product development may help create products that mirror latent
needs, decrease costs associated with new product development activities and
develop products that are less easily imitable by competitors (Ali, Jing & Ahmed,
2015).
Top Management
The top management variables sought in the study were management reward for new
products initiatives, apportion of budget for innovative programs, offering of training
programs and training of employees. The results were shown in the Table 4.14.
Majority of the respondents (36%) agreed that the management often award new
products initiatives 27% rarely, 23% not at all and 15% very often. Regarding the
apportioning budget for initiative programs, 35% were for rarely, 34% often, 19%
very often and 12% not at all. As for offering training programs to

82
employees.34%were of the opinion rarely, 27% often, 22% not at all and 16 very
often. On training employees to handle introduction of new products, 30% were for
often, another 30% rarely, 25% not at all and 16% very often
The findings were in line with a study by Evansschitzky et al (2012) who asserted
that one factor that is critical to the success of major innovation is top management.
Andreas, Marina and Klaus (2015) point out that top management involvement in
innovation practices can speed up Research and Development progress. The results of
the study concur with findings by Kleinchmidt, Schultz, Salomo and De Brentani
(2013) who concluded that top management knowledge is helpful for acquiring
resources which in turn have an impact on the accumulation of knowledge and skills
which enhance innovation practices. Top management was therefore one of the major
factors of innovation practices.
Venture capital
In relation to venture capital the study sought to examine sourcing of capital from
entrepreneurs, the use of capital sourced from entrepreneurs, financial of innovating
firms and how faster venture based firms avail products in the market. Majority of the
respondents (35%) were of the view that innovating firms are financed by venture
capitalists, 32% often, 18% not at all, 13% very often and 1% other responses. As to
whether the firms source for capital from entrepreneurs, 35% responded often, 31%
rarely, 25% not at all and 8% very often. Regarding whether capital sourced from
entrepreneurs was used to develop new products 33% were of the opinion rarely, 30%
often, 21% very often and 16% not at all. The results were summarized in Table
4.14.
The results concur with the findings by Kandel and Harry (2011) who indicated that
venture capital finance had a positive effect on innovation. Several studies (Vries,
2012; Krishnan, 2011 and Kevin et al, 2014) asserted that venture capitalists provide
not only finance but also advice to the entrepreneur on management matters such as
financing policies which help firms to adopt more professional management systems.
Venture capitalists thus enhance innovation practices through financing of various
operations within SMMEs. A study by Wadhwa, Anu and Sandip (2013) concur that

83
successful entrepreneurs should become venture capitalists in order to invest in the
next generation of entrepreneurs. The respondents‘ opinion on research and
development responses was represented in Table 4.14.
Table 4.14: Research and Development
Indicator Other
(1)
Not at
all (2)
rarely (3) often
(4)
Very often
(5)
Modal
Class
How often customers are
involved in generating new
product ideas
2% 29% 38% 27% 5% 3
Whether customers are
concerns often addressed by
the firm
0% 18% 33% 35% 13% 4
How often customers input
directly influence the firms
decision
1% 12% 33% 36% 18% 4
How often the firm modify a
product when it finds that the
customers would like the
firm to do so
0% 30% 35% 26% 8% 3
How often management
reward new product
initiatives
0% 23% 27% 36% 15% 4
Whether management
apportion part of the budget
for innovative programs
0% 12% 35% 34% 19% 3
How often management offer
training programs to prepare
employees to offer high
quality customer service
0% 22% 34% 27% 16% 3
How often employees are
trained to handle the
introduction of new products
and services
0% 25% 30% 30% 16% 3
How often the firm source
capital from entrepreneurs
0% 25% 31% 35% 8% 4
whether capital is sourced
from entrepreneurs used to
develop new products
0% 16% 33% 30% 21% 3
How often innovating firms
are likely to be financed by
venture capitalists
1% 18% 36% 32% 13% 3
How often venture based
firms are faster in bringing
their products to the market
0% 19% 30% 34% 17% 4

84
4.5.4 Commercialization
Internationalization
In relation to internalization the study sought to investigate the firms‘ involvement in
export trade, the equipping of in-house technical teams, embracing of e-commerce
and entry into new markets. Majority of respondents (37%) were of the view that the
firms rarely equipped in-house technical teams, 33% often, 26% not at all, 4% very
often and 1% other responses. Regarding embracing of e-commerce, 35% responded
rarely, 33% often, 20% not at all and 10% very often. As to whether firms were
involved in export trade, 34% were of the view not at all, 29% rarely 27% often, 6%
other responses and 3% very often. As regarding new market entry, 35% responded
rarely, 32% often, 22% not at all, and 11% very often. The results were summarized
in Table 4.15.
The results of the findings agree with a study by Chih (2011) who asserted that
internationalization helps firms to develop and acquire new resources which enhance
innovation practices. The results also concur with the findings of a study by Joung,
Jin and Woo (2015) who found that internationalization affected greatly the firm‘s
financial and innovation performance. The modal class is three indicating that most
internationalization responses were rarely. This implies that a small proportion of
SMMEs operate outside their national boundaries. The management of SMMEs
should enhance internationalization to enable them rip maximum benefits of export
trade.
Technological Exploitation
On technological exploitation the study sought to investigate acquiring of external
knowledge, utilization of new ways of marketing such as digital and social media, use
of websites to promote products and the use of electronic data interchanged based
solution. Majority of the respondents (37%) agreed that the firms often used websites
to promote their products, 33% rarely, 19% not at all and 11% very often. Regarding
utilization of new ways of marketing such as digital and social media, 35% responded

85
often, 34% rarely, 20% not at all and 10% very often. As for acquiring external
knowledge 34% were of the view often, 31% rarely, 26% not at all, 8% very often
and 1% other responses. As for using electronic data interchanged based solution,
33% were for often, another 33% rarely, 20% not at all, 12% very often and 2% other
responses.
The findings are in agreement with a study by Li, Smith, Maggitti and Katila (2013)
who asserted that technological exploitation linkages offer new products to a firm. Li
et al (2013) agreed that the skills, knowledge and experience acquired and
accumulated mainly through technological exploitation enhance innovation practices
which then influence firm performance. The study confirms that technological
exploitation activities influenced positively both innovation practices and firm
performance. This study confirmed that technological innovation activities
influenced the sales positively ultimately impacting on performance positively.
Market exploitation
Regarding market exploitation the study sought to investigate how often the firms
develop new sales and distribution channels, adoption of new ways of connecting to
customers and building of relationship, the specific product the firm markets and the
involvement of marketing personnel in customers‘ future needs. Majority of the
respondents (36%) agreed that the product the firm markets often depend on real
market needs, 32% were for rarely, 17% not at all and 15% very often. As regards the
firms adopting new ways of connecting to customers and building connections 35%
responded often, 32% rarely, 18% not at all and 14% very often. Opinions regarding
developing new sales and distribution channels had the responses, 33% often, 33%
rarely, 28% not at all and 5% very often. As to whether marketing personnel spent
time discussing customers future needs, 33% were of the view rarely, 27% often,
20% very often and another 20% not at all.
The results agreed with the findings by Jaakko (2013) who argued that market
exploitation was an important element of marketing strategy that was among the most
relevant success factors in introducing new products. Norazlina, Izaidin, Hasfarizal,
Shahrina and Lai (2013) asserted that product development and market-related

86
exploitive capabilities were viewed as the value creating mechanisms through which
entrepreneurial orientation affected performance. The findings were also in line with
Libos, Skarmeas and Lages (2013) who stated that market exploitation involved the
development of new knowledge about the firm‘s existing markets, products and
abilities based on intensive search and experimentation along an existing knowledge
dimension. This study confirmed that market exploitation may help a firm create a
competitive edge through improved performance.
Market exploitation was an important element of marketing strategy that was
arguably among the most relevant success factors in introducing new products
(Jaakko, 2013). A study by Lisboa, Skarmeas and Lages (2013) stated that market
exploitation involved the development of new knowledge about the firm‘s existing
markets, products and abilities based on intensive search and experimentation along
an existing knowledge dimension. Simultaneous investments in the exploitation of
existing innovation practices capabilities of new products may help create a
competitive edge. Chih (2011) suggested that market exploitation has two district
phases: use and development of things that are already known. He defined
development as the expansion of the firm‘s current stock of knowledge while the
term use as the appropriation of economic returns of the current stock of knowledge.
Product development and market-related exploitative capabilities were viewed as the
value creating mechanisms through which entrepreneurial orientation affected
performance (Norazlina, Izaidin, Hasfarizal, Shahrina & Lai, 2013). The results were
shown in table 4.15.

87
Table 4.15: Commercialization
Indicator Other
(1)
Not at
all (2) rarely (3)
often
(4)
Very often
(5)
Modal
Class
How often the firm is
involved in export trade? 6% 34% 29% 27% 3% 2
How often the firm equips
In-house technical teams? 1% 26% 37% 33% 4% 3
How often the firm embraces
e-commerce? 0% 20% 35% 33% 10% 3
How often the firm enters
new markets or increase
current market shares? 0% 22% 35% 32% 11% 3
How often the firm acquires
external knowledge? 1% 26% 31% 34% 8% 4
How often the firm utilizes
new ways of marketing like
digital and social media? 0% 20% 34% 35% 10% 4
How often the firm uses a
website to promote its
product 0% 19% 33% 37% 11% 4
Whether the firm use
electronic data interchanged
based solution 2% 20% 33% 33% 12% 3
How often the firm Develops
new sales and distribution
channels? 0% 28% 33% 33% 5% 3
How often the firm adopts
new ways of connecting to
customers and building
relationships?
0% 18% 32% 35% 14% 4
The product the firm markets
depend on real market needs 0% 17% 32% 36% 15% 4
The marketing personnel in
the firm spend time
discussing customers future
needs with other functional
department
0% 20% 33% 27% 20% 3

88
4.5.5 Entrepreneurial orientation
Innovativeness
Under innovativeness the study sought to investigate, the introduction of new product
lines, production of new products designed to provide value to new and existing
customers and business processes in the past five years. The results are in Table 4.16.
Majority (36%) agreed that the firms had often introduced new product lines since
their inception, 31% were of the view rarely, 28% very often and 5% not at all.
Regarding evolution of business processes in the past five years, 35% responded
often, 31% rarely, 21% very often and 13% not all. As for production of new
products designed to provide value to new and existing customers 33% responded
rarely, 30% often, 27% very often and 9% not at all.
The results supported the findings by Weibo, Weiwei, Bo and Check-Tech (2015)
who concluded that innovativeness has the ability to support creativity, new ideas and
experimentation which may result in new products/services. This study therefore
confirmed that innovativeness can enhance performance of small and medium
manufacturing enterprises in Kenya. Entrepreneurial orientation is a precursor of
innovation practices and thus management of firms should be encouraged to adopt
entrepreneurial orientation in order to develop innovative capabilities (Rosli, 2015).
Pro-activeness
As for pro-activeness the study sought to investigate ability to identify new
opportunities, introduction of new products before competitors, ability to beat
competitors to enter new markets and improvement of the equality or the number of
features of a product/service before competitors. Majority of the respondents (42%)
agreed that the firms rarely introduced new products before competitors, 29% were of
the view often, 17% not at all and 12% very often. On the opinion whether the firms
improve the quality or the number of features of its products/services before its
competitors 39% were for rarely, 31% often, 15% very often and 15% not at all. As
regards the ability to identify new opportunities, 36% responded often, 32% rarely,

89
26% not at all and 7% very often. Further opinion on the ability of the firm to beat
competitors to enter new markets had 34% often, 30% rarely, 20% not at all and 15%
very often. The results supported the findings by Eggers, Krans, Hughes, Susan and
Sean (2013) who argued that pro-activeness is the pursuit of opportunities and
competitive rivalry in anticipation of future demand to create change and shape the
business environment. This study therefore confirmed that pro-activeness is an
important dimension that should be pursued by any enterprise aspiring to improve its
performance.
Risk Management
The risk variables sought in this study were whether mistakes were treated as a
normal part of trying something new, how often the firms take informed risks,
whether risk was encouraged in the firms and whether the firms took the risk of
missing an opportunity with the same weight as that of risk failure. Majority of
respondents (38%) agreed that firms often take informed risks, 33% responded rarely,
18% very often and 11% not at all. As to whether mistakes are treated as a normal
part of trying something new, 36% responded rarely, 33% often, 20% not at all and
12% very often. Regarding how often risk taking was encouraged in the firm, 33% of
the respondents were of the view often, 31% rarely, 20% very often, 15% not at all
and 1% other responses. As to whether the firm take the risk of missing an
opportunity with the same weight as that of risk failure 33% were of the view rarely,
30% often, 20% not at all and 16% very often. The results collaborate with the
findings by Simiyu (2013) who argued that risk taking is the firm knowingly devote
resources to projects with a chance of high returns but may also entail a possibility of
high failure. This study confirmed that risk taking, innovativeness and pro-activeness
were essential elements of entrepreneurial orientation for firms aspiring to grow and
improve on their performance as shown in Table 4.16 below.

90
Table 4.16: Entrepreneurial orientation
Indicator Other
(1)
Not at
all (2)
rarely (3) often
(4)
Very
often (5)
Modal
Class
How often has your firm
introduced new product
lines since its inception?
0% 5% 31% 36% 28% 4
Does the firm produce new
products that are designed
to provide value to new
and existing customers?
0% 9% 33% 30% 27% 3
How often has your
business processes gone
through changes in the last
5 years
0% 13% 31% 35% 21% 4
How often is your firm
able to identify new
opportunities?
0% 26% 32% 36% 7% 4
Is your firm able to
introduce new products
before competitors?
0% 17% 42% 29% 12% 3
Does your firm beat
competitors to enter new
markets
0% 20% 30% 34% 15% 4
Does your firm improve
the quality or the number
of features of its products
or services before its
competitors
0% 15% 39% 31% 15% 3
Are mistakes treated as a
normal part of trying
something new?
0% 20% 36% 33% 12% 3
How often does your firm
take informed risks?
0% 11% 33% 38% 18% 4
How often is risk taking
encouraged in the firm
1% 15% 31% 33% 20% 4
Does your firm take the
risk of missing an
opportunity with the same
weight as the risk of
failure
0% 20% 33% 30% 16% 3

91
4.5.6 SMMEs Performance
Respondents‘ opinion on sales turnover had the following results, 60% were of the
view that the firms rarely had a trend of increasing sales from the previous years,
39% were of the view often and 1% not at all. Regarding selling products online,
59% responded rarely and 41% often. As for the profitability of the firms, 59% of the
respondents agreed that the firms rarely meet their projections, 39% were of the view
often and 2% not at all. As to whether the price per unit has been increasing for the
past five years, 57% were of the opinion, rarely, 42% often and 1% not at all. For
responses relating to return on investments, 60% were of the view that the firms
rarely use ROI as a measure of firms performance, 40% were of the view often and
1% not at all. As to whether ROI contributes to firm performance for the past five
years 58% responded rarely, 41% often and 1% not at all. You and Liu (2010) concur
that to capture different aspects of firm performance, multiple measures, that is,
financial and non-financial should be employed. The results were summarized in
Table 4.17.
Table 4.17: Performance of SMMEs
Indicator Other
(1)
Not at
all (2)
rarely
(3)
often
(4)
Very
often
(5)
Modal
Class
Does your firm have a trend of
increasing sales from the previous
years
0% 1% 60% 39% 0% 3
Does your firm sell its products
online
0% 0% 59% 41% 0% 3
How often does your firm meet its
profits projections
0% 2% 59% 39% 0% 3
Has the price per unit been
increasing in the last five years
0% 1% 57% 42% 0% 3
How often does the firm use ROI
as a measure of the firms
performance
0% 1% 60% 40% 0% 3
Do you regard ROI as a high
contributor to your forms
performance in the last five years
0% 1% 58% 41% 0% 3

92
The other indicators used to measure performance which were on a continuous scale
were net profits, net assets, return on investments and sales turnover. Due to their
measures, they were analysed with the mean as their measures of central tendency
and the standard deviation as a measure of dispersion. The mean net profit, net assets,
return on investment (ROI) and sales turnover were found to be 31.26, 29.9, 70.6 and
1256.6 million respectively with standard deviations 14.6, 5.5, 7.5 and 30.5 across the
5 years. The standard deviation measures the deviation from the mean that shows the
variability of the measure. A high standard deviation implies a high risk of a firm
having a measure different from the mean. This implied that there was a declining
performance of SSMEs for the last five years in terms of net profits, net assets, return
on investments and sales turnover.
The study findings were in tandem with a study by Tarus and Ng‘ang‘a (2013) who
revealed that small and medium manufacturing enterprises in Kenya have been facing
critical challenges of low performance, declining trend in innovative activities and a
high level of attrition. This is despite the fact that they are an important factor in the
attainment of the Kenya vision 2030, which stipulates that the manufacturing sector
should account for 20% of the GDP (RoK, 2007). Although Small and Medium
Manufacturing Enterprises (SMMEs) accounted for 70% of Kenya‘s manufacturing
sector (KIPPRA, 2014), their performance dropped from 5.6% in 2013 to 3.4% in
2014 (RoK, 2015). This infers that performance of SMMEs was on the decline trend
thus they need to adopt innovation practices to boost their performance as shown in
Table 4.18.

93
Table 4.18: Financial Performance of SMMEs
2011 2012 2013 2014 2015 Mean Std. Min. Max.
N ‗000,000 000,
000‘
‗000,000 000
,000‘
‗000,
000
‗000,
000
000,
000
‗000,
000
‗000,
000
Net Profit 215 40.3 35.2 30.4 27.3 23.1 31.26 14.6 23.1 40.3
Net Assets 215 20.7 34.5 24.8 16.5 16.8 29.9 5.5 16.5 34.5
Return on
Investment
(ROI)
215 122.2 80.4 65.6 55.4 29.8 70.6 7.5 29.8 122.2
Sales
Turnover
215 1120 1520 1308 1234 1101 1256.6 30.5 1101 1520.
4.6 Statistical Modelling
At the inferential stage of analysis, the researcher sought to explore the nature of
relationship between innovation practices and the performance of Small and Medium
Manufacturing Enterprises in Kenya. Statistical techniques were adopted to determine
the relationship between the independent variables and the dependent variable and
further determined the levels of influence that creativity, organizational structure,
research and development and commercialization had on the performance of Small
and Medium Manufacturing Enterprises in Kenya. The analysis adopted for
inferential analysis involved parametric estimations that required the variables used to
be measured on a continuous scale. The indicators were measured on an ordinal
categorical scale and the descriptive analysis used non-parametric techniques to
measure central tendency. The latent variables which were for the study variable that
resulted from the computation of total scores from factor analysis were resulting
continuous measures of the constructs and therefore were used for parametric
estimation.
4.6.1 Linear regression for Creativity and performance of SMMEs
The study assessed the influence of creativity on performance of Small and medium
manufacturing enterprises in Kenya as stated in the first objective. Figure 4.1 shows
the scatter plot of creativity and performance. The figure presented that all the plots

94
appeared in the first quadrate and the line of best of fit indicated an estimate line that
was increasingly positively upwards. This implied that there was a positive linear
relationship between creativity and performance of SMMEs. The study findings
conformed by Asieh (2015) who investigated the relationship between creativity and
job innovation in employees of an industrial company. The purpose of the study was
to investigate the relationship between dimensions of creativity with performance.
Figure 4.1: Scatter plot for Creativity and Performance
From the study results in Table 4.19 the researcher presented the results of the
relationship and explanatory power of the regression model for the influence of
creativity on performance of SMMEs. The R value of 0.267 showed a positive linear
relationship between creativity and performance. The R2 is the coefficient of
determination which indicates that explanatory power of the independent variables
was 0.071. This meant that 7.1% of the variation in performance was explained by
the variation of creativity in the model. The remaining 92.9% of the variation in the

95
dependent variable was unexplained by this one predictor model but by other factors
not included in the model
The ANOVA results showed that the influence of creativity on performance of
SMMEs in Kenya was significant. The p-value of the F-statistic as shown in the
ANOVA results was 0.000 which was less than 0.05 implying general significance of
the one parameter model thus implying that creativity significantly influenced
performance of SMMEs in Kenya. This is in line with the componential theory of
creativity that is grounded in a definition of creativity as the production of new ideas
or outcomes that are both novel and appropriate to some goal such as improving the
overall performance of a firm (Amabile, 2012).
The study results revealed a statistically significant positive linear relationship
between creativity and performance of SMMEs (β = 0.267, t = 4.037 and p-value =
0.000). The relationship was statistically significant because the p-value was less than
0.05. The model showed that every unit increase in the levels of Creativity lead to a
0.267 increase in performance of SMMEs in Kenya. This implied that organisations
that promote elements of creativity such as technological expertise, teamwork and
motivation tend to realise better performance. The resulting regression model that
predicted the level of performance of SMMEs for a given level of Creativity was
given by the equation below:
Y = 0.000 + 0.267X
Where
X is the independent variable, creativity
Y is the dependent variable, Performance of SMMEs
Several other studies also confirmed these results. (Lowely, 2011; Rick et al 2015,
Hong et al, 2013) also agreed that creativity ascertain SMEs of their survival and
improved performance. This is in line with a study by Celynon and Jasper (2011)
who indicated that creativity facilitated effectiveness and efficiency in an

96
organization which enhanced better performance. In their study on Does creativity
really lead to innovation? Ozge and Mette (2011) also identified creativity as one of
the most important influential factors of innovation practices ultimately leading to
firm performance. Their findings showed a positive relationship between creativity
and firm performance.
Table 4.19: Regression results for creativity
4.6.2 Linear regression for Organizational Structure and Performance of
SMMEs
The second objective required the researcher to determine the effect of an
organizational structure on performance of SMMEs in Kenya. Figure 4.2 presented
that all the plots were in the first quadrate and the line of best of fit indicated an
estimate line that was increasingly positively upwards. This implied that there was a
positive linear relationship between organizational structure and performance of
Model summary
Change statistics
Model
R R Square Adjusted R
Square
Std. Error of the
Estimate
R square
change df1 df2
sig. F.
chang
e
1 0.267a 0.071 0.067 0.966 0.071 1 213 0.000
a. Predictors: (constant), creativity
ANOVAa
Model
sum of squares df Mean square F sig. F. change
Regression
15.211 1 15.211 16.299 0.000b
Residual
198.789 213 0.933 0.000
Total
214.000 214.000
a. Dependent variable: Performance
b. Predictors: (constant), creativity
Coefficients
Model
Unstandardized coefficients
Standardized
coefficients t sig. F. change
B Std. Error Beta
(Constant)
0.228 0.066
0
Creativity
0.51 0.066 0.267 4.037 0.000a
a. Dependent variable: Performance

97
SMMEs, since the relationship was a possible linear with a positive slope. The study
findings were in agreement with the findings by Asieh (2015) who investigated the
relationship between an organizational structure and performance of SMEs and
established that there was a positive correlation between organizational structure and
performance of SMEs.
Figure 4.2: Scatter Plot for Organizational Structure and Performance
Table 4.20 shows that there was a positive linear relationship between organizational
structure and performance. The R value of 0.280 showed the positive linear
relationship between Organizational structure and performance. The R2 was the
coefficient of determination which indicated that the explanatory power of the
independent variables was 0.079. This meant that 7.9% of the variation in
performance was explained by the variation of organizational structure in the model.
The remaining 92.1% of the variation in the dependent variable was unexplained by
this one predictor model but by other factors not included in the model. This is in line
with a study by Tran and Tian (2013) who found out that flexible organizational
structure characterized by low levels of formalization and centralization best
promoted innovation and improved performance of firms.
The ANOVA results showed that the influence of organizational structure on
performance of SMMEs in Kenya was significant. The p-value of the F-statistic as
shown in the ANOVA results was 0.000 which was less the 0.05 implying general

98
significance of the one parameter model thus implying that an organizational
structure significantly influences performance of SMMEs. This is in consistent with a
study by Tran and Tian (2013) who found out that a flexible organizational structure
characterized by low levels of formalization and centralization best promoted
innovation and better performance of firms.
The regression results showed that organizational structure had a significant positive
influence on the performance of SMMEs in Kenya (β = 0.28, t = 4.262 and p-value =
0). From the regression results, the p-value< 0.05 implied significance of the
coefficient of organizational structure in the model. The model showed that with
every unit increase in the levels of organizational structure there was a 0.28 increase
in the levels of performance of SMMEs in Kenya. A further implication is that a firm
with low levels of organisation structures, a firm that focuses on centralisation and
formalisation rather than professionalism would possibly experience low
performance. The equation below shows the resulting regression model that predicts
the level of performance of SMMEs for a given level of Organizational structure:
Y = 0.000 + 0.280X2Where; X is the independent variable, Organizational structure,
Y is the dependent variable, Performance of SMMEs
The teleological change theory proposes that changes in organizational structure and
the overall flexibility of the firm is one of the most vital factors in a firm‘s
development and success. The contingency theory of organizational structure
articulates that an organization in fit enjoys higher performance as a result of
generating surplus resources which lead to growth in innovation, sales and size
(Hamilton & Shergill, 2010). A study by Palmer and Wright (2010) on innovation
practices in small firms also found out that an organization structure was a significant
predictor of innovation with less centralized and less formalized firms innovating
with somewhat greater frequency than firms with more rigid structures. Flexible
organizational structures facilitates effectiveness of firms through emphasizing,
absorbing professionals with skills that allow the employees to better serve the
company by solving problems and interacting with customers and workers as
indicated by Latif (2014).

99
Table 4.20: Regression results for organizational structure
Model summary
Change statistics
model
R R
Square
Adjusted
R
Square
Std. Error
of the
Estimate
R square
change df1 df2
sig. F.
change
1 0.28a 0.079 0.074 0.962 0.079 1 213 0.000
a. Predictors: (constant), organizational structure
ANOVAa
model
sum of
squares df Mean square F sig. F. change
Regression
16.816 1 16.816 18.165 .000b
Residual
197.184 213 0.926 0.000
Total
214 214
a. Dependent variable: Performance
b. Predictors: (constant), organizational structure
Coefficients
model
Unstandardized
coefficients
Standardized
coefficients t sig. F. change
B Std. Error Beta
(Constant)
2.246 0.066
0
Creativity
0.498 0.066 0.28 4.262 0.000a
a. Dependent variable: Performance
4.6.3 Linear regression for Research and Development and Performance of
SMMEs
The study also fitted a regression model to determine the significance of the influence
of Research and Development on performance of SMMEs in Kenya. Figure 4.3
shows the scatter plot of Research and Development and performance. The study
findings showed that all the plots are in the first quadrate and the line of best of fit
indicated an estimate line that was increasingly positively upwards. This implies that
there was a positive linear relationship between research and development and
performance of SMMEs since the relationship was a possible linear with a positive
slope. Pang and Chich (2012) studied R & D management on new product
development performance in Taiwan‘s Hi-Tech industries and found out that R & D
management ability had significant influences on new product development
performance.

100
Figure 4.3: Scatter plot for Research and Development and performance
In Table 4.21 the researcher presents the results of the relationship and explanatory
power of the regression model for the influence of Research and Development and
performance. The R value of 0.384 showed a positive linear relationship between
Research and Development and performance. The R2 is the coefficient of
determination which indicates that explanatory power of the independent variable
was 0.147. This means that 14.7% of the variation in performance was explained by
the variation of research and development in the model. The remaining 85.3% of the
variation in the dependent variable was unexplained by this one predictor model but
by other factors not included in the model. The study findings were in agreement with
findings by Pang and Chich (2012) results on R & D management on new product
development performance who established that R &D management influenced new
product development and firm performance.

101
The ANOVA results showed that the influence of Research and Development on
performance of SMMEs in Kenya was significant. The p-value of the F-statistic as
shown by ANOVA results was 0.000 which was less than 0.05 implying general
significance of the one parameter model thus implying that Research and
Development significantly influenced performance of SMMEs. Organizational
learning theory explains the skill sharing motives on Research and Development in
SMEs. The theory proposes that the ability of firms to acquire knowledge and transfer
it into a competitive weapon has long been part of the research agenda for SMEs
improved performance (Hamel, 2011)
The regression results in Table 4.21 revealed that research and development had a
significant positive influence on performance of SMMEs in Kenya (β = 0.385, t =
6.052 and p-value = 0) the p-value of the coefficient for research and development
was less than 0.05. The model showed that every unit increase in the levels of
Research and development lead to a 0.385 increase in performance of SMMEs in
Kenya. This was an implication that a firm that improves on research and
development by engaging its customers and involves top management and one that
tend to source for venture capital had higher possibility of realising better
performance. The resulting regression model that predicted the level of performance
of SMMEs for a given level of Research and Development was given by the
equation: Y = 0.000 + 0.385X3
Where; X is the independent variable, research and development, Y is the dependent
variable, Performance of SMMEs
The resource based view theory suggests that a firm that invests in valuable resources
like Research and Development and capabilities which are not possible to imitate
have an added advantage over other firms in terms of improved performance (Chao-
Hung, 2011). Vries (2012) agree that venture capital had a positive relationship with
innovation and improved performance of a firm. A study by Wang et al (2013)
ascertained that enterprise‘s top managers are capable of improving performance by
customer involvement in innovation practices. Andrea and Marco (2012) study on
succeeding in innovation, key insights on the role of Research and Development and

102
Technological acquisition drawn from company data found out that Research and
Development significantly increased overall company innovation performance from
sales generated from innovative products. A study by Andreas et al (2015) concur
that highly educated and more experienced owners or managers were more successful
in opportunity recognition, thereby directly controlling ideas and insights to the
firm‘s innovative performance.
Table 4.21: Regression results for research and development
Model Summary
Change statistics
Model
R R
Square
Adjusted
R Square
Std.
Error of
the
Estimate
R square
change df1 df2
sig. F.
change
1 0.384a 0.147 0.143 0.928 0.147 1 213 0.000
a. Predictors: (constant), research and development
ANOVAa
Model
sum of
squares df Mean square F sig. F. change
Regression
31.523 1 31.523 36.624 .000b
Residual
182.473 213 0.861
Total
214 214
a. Dependent variable: Performance
b. Predictors: (constant), research and development
Coefficients
Model
Unstandardized
coefficients
Standardized
coefficients t sig. F. change
B
Std.
Error Beta
(Constant)
3.763 0.063
0.004 0.996
Creativity
0.563 0.064 0.385 6.052 0.000a
a. Dependent variable: research and development
4.6.4. Linear regression for Commercialization and Performance of SMMEs
In order to be able to assess the influence that commercialization had on performance
of SMMEs in Kenya, the study fitted a regression model to determine the significance
of the influence. The scatter plot on Figure 4.4 shows the relationship between

103
commercialization and performance. The line of best fit of the plot showed that the
relationship was a possible linear with a positive slope. The study findings showed
that all the plots were in the first quadrate and the line of best of fit indicated an
estimate line that was increasingly positively upwards. This implied that there was a
positive linear relationship between research and development and performance of
SMMEs since the relationship was a possible linear with a positive slope.
The study findings corroborate with findings by Joung, Jin and Woo (2015) who
studied the effects of commercialization capability in small and medium sized
businesses performance. The research established a positive relationship between
factors in the process of commercializing and a firm‘s financial and innovation
performances. The small and medium-sized firms seek to overcome the drawbacks
coming from geographic and proximity by means of open innovation during the
process of commercializing the goods with their transferred techniques to increase
their performance.
Figure 4.4: Scatter plot for commercialization and performance
Table 4.22 shows a summary of regression model fitness. On the table, the study
shows the relationship and explanatory power of the regression model for the

104
influence of commercialization and performance. The R value of 0.428 showed a
positive linear relationship between commercialization and performance. The R2 is
the coefficient of determination which indicated that explanatory power of the
independent variable was 0.183. This means that 18.3% of the variation in
performance was explained by the variation of commercialization in the model. The
remaining 81.7% of the variation in the dependent variable was unexplained by this
one predictor model but by other factors not included in the model. The results are in
agreement with the study findings by Madsen and Smith (2011) who found out that
commercialization was essential for the overall performance of firms.
The ANOVA results showed that the influence of commercialization on performance
of SMMEs in Kenya was significant. The p-value of the F-statistic as shown in the
ANOVA table was 0.000 which was less than 0.05 implying general significance of
the one parameter model thus implying that commercialization significantly
influenced performance of SMMEs. The results are in line with a study by Madsen
and Smith (2011) who found out that commercialization was essential for the overall
performance of firms. The rival theory sought to identify why some organizations
were better than others in bringing new innovations to the market that further
influence their performance (Datta, 2011)
The regression results revealed that commercialization had a significant positive
influence on performance of SMMEs in Kenya (β= 0.428, t = 6.904 and p-value = 0)
the p-value of the coefficient of commercialization was less than 0.05. The estimated
model showed that with every unit increase in the levels of Commercialization there
was a 0.428 increase in performance of SMMEs in Kenya. This shows that improving
levels of commercialisation by engaging in foreign trade and exploitation of modern
technology and new markets lead to a firm‘s improved performance. To predict the
level of performance of SMMEs for a given level of Commercialization, the equation
below was generated from the model results.
Y = 0.000 + 0.428X4; Where; X is the independent variable, commercialization, Y is
the dependent variable, Performance of SMMEs. The Real Options Theory provides
that commercialization of innovation earns a return on the investment in innovation

105
which contributes to overall firm performance (Hamel, 2011). Joung, Jin and Woo
(2015) study on ―The effects of commercialization capability in SMEs business on
business performance‖ found out that internationalization affected greatly the firm‘s
financial performance and innovation performance.
Table 4. 22: Regression results for commercialization
Model summary
Change statistics
R R
Square
Adjusted
R
Square
Std. Error
of the
Estimate
R square
change df1 df2
sig. F.
change
1 0.428a 0.183 0.179 0.906 0.183 1 213 0.000
a. Predictors: (constant), commercialization
ANOVAa
Model
sum of
squares df Mean square F sig. F. change
Regression
39.133 1 39.133 47.667 .000b
Residual
174.867 213 0.821
Total
214 214
a. Dependent variable: Performance
b. Predictors: (constant),
commercialization
Coefficients
Model
Unstandardized
coefficients
Standardized
coefficients t sig. F. change
B Std. Error Beta
(Constant)
4.150 0.062
0 1
Creativity
0.553 0.062 0.428 6.904 0.000a
a. Dependent variable: commercialization
4.6.5 Entrepreneurial Orientation (Moderation Effect Test)
The study sought to investigate the moderating effect of Entrepreneurial orientation
on the relationship between innovation practices and performance of SMMEs. To
draw conclusions on the objective regarding the moderating effect of Entrepreneurial
orientation on the relationship between innovation practices and performance of
Small and Medium Manufacturing Enterprises in Kenya, the Moderated Multiple
Regression (MMR) model was adopted. This model involved generating a

106
transformation variable as an interaction variable between Entrepreneurial orientation
and the innovation practices. The effect of a moderating variable was characterized
statistically as an interaction that affects the direction and/or strength of the
relationship between dependent and independent variables (Fakhrul & Selvamalar,
2011). The interaction variables were generated as intersections between the
independent variables and entrepreneurial orientation. The interaction variables were
then used in the hierarchical moderated multiple regressions.
Table 4.23 presents the analysis of the moderating effects from the moderated
multiple regression analysis of innovation practices and performance of SMMEs.
Hierarchical regression was used as a stepwise regression analysis that produced and
tested three models. Model one only constituted innovation practices without
considering the moderating variable. Model two was fitted including the moderating
variable Entrepreneurial orientation and model 3 included the interaction variables
between the innovation practices and the moderator Entrepreneurial orientation. The
fitness of all the three models were tested using, R2 and ANOVA (F) and the
coefficients of the models tested using T-statistics. Model 1 results produced an R-
square of 0.563 implying that the variation in the independent variable in the model
explained 56.3% of the variation in performance of SMMEs in Kenya.
The second model was found to have an R-square of 0.565. This shows that the
variance of performance explained in the 2nd model was 56.5%, with an R-square
change of 0.002. The R-square change in the second step was however insignificant
as shown by the change in F that had a p-value of 0.298 which is greater than 0.05.
the P-value of the change in F being greater than 0.05 implied that the direct inclusion
of the moderating variable Entrepreneurial orientation had no significant change in
the R-square and no significant improvement on the model from model one to model
2.
The third model was fitted adding the interaction variables of the moderator and other
independent variables. The third step of the MMR modelling had an R-square of
0.588 implying that the variation in performance explained in the 3rd model was
58.8%. Model three was an improvement of the first two models with a significant

107
positive change in the R-square. The change in R-square for model three was 0.023
which was significant as shown by the P-value of the F-change which was found to
be less than 0.05. The p-value of the F-change was 0.001. This implies that inclusion
of the interaction variables significantly improved the model. This further implies that
the moderating variable entrepreneurial orientation had a moderating influence on the
relationship between innovation practices and performance of SMMEs.
The study by Arshad, Rasli, Afiza and Zain (2013) on the impact of entrepreneurial
orientation on business performance: A study of technology based SMEs in Malaysia
was represented by five dimensions of entrepreneurial orientation; innovativeness,
pro-activeness, risk taking, competitive aggressiveness and autonomy. The findings
revealed that only four dimensions of entrepreneurial orientation had influence
towards business performance; Innovativeness, pro-activeness, risk taking and
competitive aggressiveness. While no correlation were found on autonomy in the
context technological based SMEs in Malaysia.
Model 1 results showed that all the innovation practices had a significant influence on
performance of SMMEs. The coefficients also showed a positive relationship
between all the variables and performance of SMMEs. This is according to the
significance values and the coefficients obtained against each variable. The result of
the model generated an equation given as:
Model 2 results showed that addition of the moderating variable to the initial model
did not improve the model. It however found that in the joint model with the
innovation practices, the moderating variable Entrepreneurial orientation also had
insignificant direct influence on performance of SMMEs. The p-value of the t-
statistic for the variable Entrepreneurial orientation was found to be 0.298 which was
greater than 0.05. The result of the 2nd
model generated an equation given as:

108
The results for model 3 showed that addition of the interaction variables significantly
improved the model on the influence of the determinants on performance of SMMEs.
The change statistics showed a p-value of 0.000 which was less than 0.05 which
implied an improvement on the explanatory power by the moderating effect. The
individual interaction variables were also found to all have significant influence on
performance. The interaction variables between creativity and organisation structure
and Entrepreneurial orientation were found to have p-values of 0.007 and 0.031
which were both less than 0.05 implying significance at 0.05 level of significance.
The final model generated an equation given by;
Avlonitis and Salavou (2011) in their research study found out that firms labelled as
active entrepreneurs were more active in innovation practices introduction and more
efficient in asset exploration. Pro-active and risk-seeking orientation of active
entrepreneurs was demonstrated by innovation practices featuring more unique
characteristics of the market leading to higher performance. These findings concur
with Boso and Cadogan (2012) who posited that the impact of innovation practices
on performance depends on firm‘s entrepreneurial orientation. They further stated
that entrepreneurial orientation when used as a moderator strengthens the relationship
between innovation practices and firm performance. The findings are also in line with
the existing evidence that delivering a differentiated product with unique customer
benefits and superior value for the user is one of the most critical success factors.
Alegre and Chiva (2014) in their study on entrepreneurial orientation, innovation and
firm performance found out that entrepreneurial orientation with risk taking, pro-
activeness and innovation leads to higher performance.
These findings were in agreement with the contentions by Boso and Cadogan (2012)
that the impact of innovation practices on performance depends on firm‘s
entrepreneurial orientation. They established that entrepreneurial orientation and
market orientation are drivers of innovation practices and that entrepreneurial

109
orientation with risk taking and innovativeness enhances firm growth but autonomy
does not. Abebe (2014) in his study on electronic commerce adoption, entrepreneurial
orientation and small medium-sized enterprise (SME) performance found out that
entrepreneurial orientation with risk taking, innovation and proactiveness promotes
firm growth. In this study entrepreneurial orientation with risk taking, pro-activeness
and innovativeness were the key dimensions which moderated the relationship
between innovation practices and SMMEs performance.

110
Table 4.23: Moderating Effect Model Estimation
Model 1 Model 2 Model 3
Beta T
P-
value Beta T
P-
value Beta T P-value
Independent variable
(Constant) -0.002 -
0.048
0.962 -0.002 -
0.047
0.963 -0.069 -1.426 0.156
Creativity 0.300 5.931 0.000 0.286 5.484 0.000 0.280 5.522 0.000
Organizational
structure
0.367 7.582 0.000 0.359 7.336 0.000 0.340 7.093 0.000
Research and
development
0.335 7.102 0.000 0.329 6.915 0.000 0.317 6.640 0.000
Commercialization 0.589 12.02
5
0.000 0.596 12.05
0
0.000 0.565 11.231 0.000
Entrepreneurial orientation 0.053 1.043 0.298 0.054 1.108 0.029
Interaction Effect
Creativity intersection Entrepreneurial
orientation
0.142 2.745 0.007
Organizational structure intersection
Entrepreneurial orientation
0.108 2.175 0.031
Research and development intersection
Entrepreneurial orientation
0.034 0.707 0.480
Commercialization intersection Entrepreneurial
orientation
0.058 1.156 0.249
Model fitness
R 0.750 0.752 0.767
R Square 0.563 0.565 0.588
Adjusted R Square 0.554 0.555 0.576
ANOVA F 67.242 0.000 54.033 0.000 49.261 0.000
R Square Change 0.563 0.002 0.023
Change in F 67.242 0.000 1.087 0.298 11.613 0.001

111
4.7. Hypotheses Testing
The study hypotheses were tested based on the results from the regression results
between the independent variables and dependent variable. The rejection criteria for
insignificant variables were to reject a null hypothesis if the p-value of the t-statistic
of the independent variable was less than 0.05 level of significance.
H01: Commercialization does not influence the performance of SMMEs
From the study results in Table 4.22, the p-value of the t-statistic for this independent
variable was found to be 0.000. Since the p-value 0.000 was less than 0.05, the null
hypothesis was rejected and the alternative hypothesis was taken to conclude that
commercialization significantly influenced the performance of SMMEs.
H02: An organizational structure does not influence the performance of SMMEs
According to the study results in Table 4.20, the p-value of the t-statistic for this
independent variable was found to be 0.000. Since the p-value 0.000 was below 0.05,
the null hypothesis was rejected and the alternative hypothesis was taken to conclude
that organizational structure significantly influenced the performance of SMMEs.
H03: Research and Development does not influence the performance of SMMEs
From the study results in Table 4.21, the p-value of the t-statistic for this independent
variable was found to be 0.000. Since the p-value 0.000 was below 0.05, the null
hypothesis was rejected and the alternative hypothesis was taken to conclude that
research and development significantly influenced the performance of SMMEs.
H04: Creativity does not influence the performance of SMMEs
Table 4.19 shows that the p-value of the t-statistic for this variable was found to be
0.000. Since the p-value 0.000 was below 0.05, the null hypothesis was rejected and
the alternative hypothesis was taken to conclude that creativity significantly
influenced the performance of SMMEs.

112
H05: Entrepreneurial orientation does not moderate the relationship between
innovation practices and performance of SMMEs.
Table 4.23 shows that the P-value of the change in R2 for model 3 was less than 0.05,
and therefore the null hypothesis was rejected and the conclusion was that
Entrepreneurial orientation moderated the relationship between innovation practices
and performance of SMMEs. Addition of the moderating effects of entrepreneurial
orientation to the model improved the explanatory power. This conclusion concurs
with Boso and Cadogan (2012) who studied entrepreneurial orientation and
organizational structure as drivers of innovation practices success and found out that
entrepreneurial orientation with risk taking and innovativeness enhances firm growth
but autonomy does not. The conclusion from the fitted model showed that the
moderating variable entrepreneurial orientation had a positive moderating effect on
the relationship between creativity and performance. Increasing the levels of
entrepreneurial orientation would increase the rate of influence that creativity had on
performance. A graphical presentation from the model is shown in Figure 4.5. It
shows that with high entrepreneurial orientation, increases in creativity resulted into
higher and faster influence on performance than in cases of low entrepreneurial
orientation.
Figure 4.5: Moderating effect of EO on the Relationship between Creativity and
Performance.

113
In their study Parkman, Holloway and Sebastiao (2012) on Creative industries:
Aligning entrepreneurial orientation and innovation capacity, they concluded that
firms in the creative industries must align their entrepreneurial management and
creative capabilities to successfully recognise and exploit market place opportunities.
Im and Workman (2011) in their study on creativity and new product performance in
high-technology firms found out that creativity was a necessary determinant of
innovation and that it influenced performance of high technology firms to a great
extent.
The conclusion also showed that the moderating variable entrepreneurial orientation
had a positive moderating effect on the relationship between organisational structure
and performance. Increasing the levels of entrepreneurial orientation would also
increase the rate of influence that organisational structure had on performance. A
graphical presentation from the model is shown in Figure 4.6 which shows that with
high entrepreneurial orientation, increases in organisational structure resulted into
higher and faster influence on performance than in cases of low entrepreneurial
orientation.
Figure 4.6: Moderating Effect of EO on the relationship between Organisational
Structure and Performance.

114
In the province of Udine, Mason, Floreani, Miani, Beltrame and Cappellte (2015) in
their research study concluded that there was a positive and significant impact of
innovativeness, risk and aggressiveness in explaining performance. The study
provided an insight that entrepreneurial orientation dimensions played a significant
role in driving performance. The study embraces the suggestion of some authors
(Koe, 2013; Fatoki, 2012) to consider the moderating role of different variables on
the entrepreneurial orientation-performance link in a multi-dimensional
conceptualisation of entrepreneurial orientation. The organisational structure is one of
the factors that play a decisive role in the organizational entrepreneurship
performance. Lack of complexity of the organisational structure and the consistency
of the structure with the organisational criteria will lead to the improvement of
organisational entrepreneurship (Shoghi, 2013).
Lumpkin et al. (2010) stated that autonomy had a direct relationship with
centralisation and was the most effective dimension of the entrepreneurial orientation
that lead to the improvement of organisational performance. The managers of metal
industries should reduce the scale of formalisation and complexity of the
organisational structure on one hand and make the employees participate in the
decision of the organisation on the other hand to make them ready to nurture their
entrepreneurial orientation and improve their performance. Given the retention of all
the variables in the initial model, the optimal model included all the variables studied
in the model. Firm performance was influenced by all the studied innovation
practices factors (commercialization, organizational structure, Research and
Development and creativity). Entrepreneurial orientation also had a moderating effect
on the relationship between the innovation practices and performance of Small and
Medium Manufacturing Enterprises in Kenya.
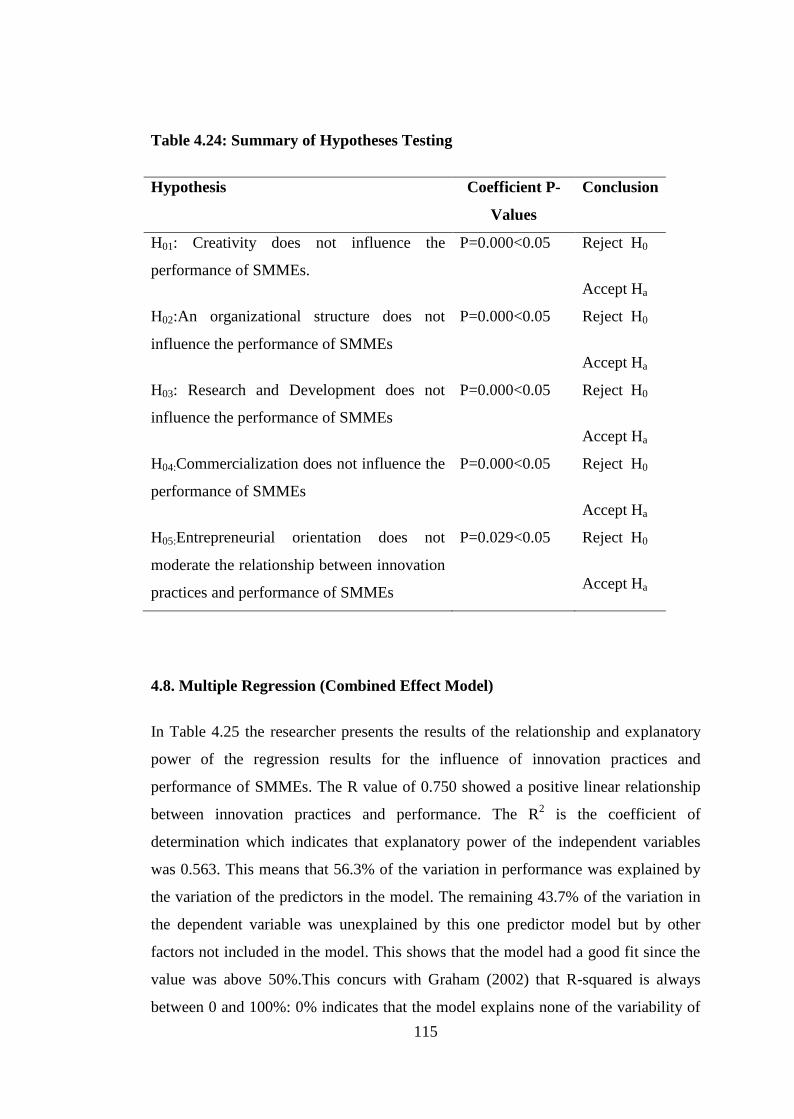
115
Table 4.24: Summary of Hypotheses Testing
Hypothesis Coefficient P-
Values
Conclusion
H01: Creativity does not influence the
performance of SMMEs.
P=0.000<0.05 Reject H0
Accept Ha
H02:An organizational structure does not
influence the performance of SMMEs
P=0.000<0.05 Reject H0
Accept Ha
H03: Research and Development does not
influence the performance of SMMEs
P=0.000<0.05 Reject H0
Accept Ha
H04:Commercialization does not influence the
performance of SMMEs
P=0.000<0.05 Reject H0
Accept Ha
H05:Entrepreneurial orientation does not
moderate the relationship between innovation
practices and performance of SMMEs
P=0.029<0.05 Reject H0
Accept Ha
4.8. Multiple Regression (Combined Effect Model)
In Table 4.25 the researcher presents the results of the relationship and explanatory
power of the regression results for the influence of innovation practices and
performance of SMMEs. The R value of 0.750 showed a positive linear relationship
between innovation practices and performance. The R2 is the coefficient of
determination which indicates that explanatory power of the independent variables
was 0.563. This means that 56.3% of the variation in performance was explained by
the variation of the predictors in the model. The remaining 43.7% of the variation in
the dependent variable was unexplained by this one predictor model but by other
factors not included in the model. This shows that the model had a good fit since the
value was above 50%.This concurs with Graham (2002) that R-squared is always
between 0 and 100%: 0% indicates that the model explains none of the variability of

116
the response data around its mean and 100% indicates that the model explains the
variability of the response data around its mean. In general, the higher the R-squared,
the better the model fits the data. The adjusted R square was slightly lower than the
R square which implied that the regression model may be over fitted by including too
many independent variables. Dropping one independent variable will reduce the R
square to the value of the adjusted R square.
The study further used Analysis of Variance (ANOVA) in order to test the
significance of the overall regression model. Green and Salkind (2003) posited that
Analysis of Variance helps in determining the significance of relationship between
the research variables. The results of Analysis of Variance (ANOVA) for regression
coefficients in Table 4.25 revealed that the significance of the F statistics was 0.000
which was less than 0.05 and the value of F (67.578) being significant at 0.000
confidence level. The value of F was large enough to conclude that the set
coefficients of the independent variables were not jointly equal to zero. This implies
that at least one of the independent variables had an effect on the dependent variable.
Table 4.25 presents the beta coefficients of all independent variables versus
performance of SMMEs. As can be observed from Table 4.25, commercialization
(X1) had a coefficient of 0.589 which was greater than zero. The t-statistic was
12.025 which had a p-value of 0.000 which was less than 0.05 implying that the
coefficient of X1 was significant at 0.05. This shows that commercialization had a
significant positive influence on performance of SMMEs.
The coefficient of organizational structure (X2) was 0.367 which was greater than
zero. The t-statistic of this coefficient was 7.582 with a p value of 0.000 which was
less than 0.05. This implied that the coefficient 0.367 was significant. Since the
coefficient of X2 was significant, it shows that organizational structure had a
significant effect on performance of SMMEs
Table 4.25 also shows that research and development (X3) had a coefficient of 0.335
which was greater than zero. The t-statistic was 7.102 which had a p-value of 0.000
which was less than 0.05 implying that the coefficient of X3 was significant at 0.05.

117
This shows that research and development had a significant positive influence on
performance of SMMEs.
Table 4.25 further shows that creativity (X4) had a coefficient of 0.300 with a t-
statistic of 5.931 which had a p-value of 0.000 which was less than 0.05. This implies
that the coefficient of X4 was significant at 0.05. This shows that creativity had a
significant positive influence on performance of SMMEs.
Finally, the constant term was -0.002. The constant term is the value of the dependent
variable when all the independent variables are equal to zero. The constant term had a
p- value of 0.120 which was greater than 0.05. This implies that the constant term
was insignificant. The multiple regression for performance of SMMEs was therefore
an equation through the origin. If all the independent variables take on the values of
zero, there would be zero performance of SMMEs.
The results of this study were consistent with the findings from other studies that
have emphasized the significant role of creativity and organizational structure on
performance of SMEs. The conclusion was similar with the studies of Noruzy,
Dalfard, Azhdari, Nazai and Rezazadeh (2013); Samad (2012); Koech and
Namusonge (2012). However, the conclusions showed partial similarities with the
studies of Obiwiere (2011); Ojokuku, Odetayo and Sajuyigbe (2012).
Table 4.25 presents the coefficients of the model. The regression results revealed that
innovation practices had significant positive influence on performance of SMMEs in
Kenya. All the four factors of innovation practices had estimated coefficients that had
positive influence. The estimated coefficients of creativity, organizational structure,
research and development and commercialization were found to be 0.300, 0.367,
0.335 and 0.589 respectively with p-values all equal to 0.000. Since the p-values were
less than 0.05, it implies that all the variables had significant joint influence on
performance of SMMEs in Kenya. The equation formed from the estimated model
was given by:

118
A study by Sumo (2010) on corporate Entrepreneurship: An organizational structure
elements, found out that not all dimensions of organizational structure influence
entrepreneurial orientation of an established organization. The organizational
structure elements that have a high impact on entrepreneurship within an established
organisation are formalization, span of control and centralisation. Organisations
pursuing innovation should ascertain that they have low to moderate levels of
centralisation, a moderate level of formalisation and the span of control should vary
both moderate wide to a wide span of control. Shoghi and Safuepoor (2015) in their
research study on the effects of organizational structure on entrepreneurial orientation
of the employees showed that organic structures of the organisations lead to the
increase of creative activities of the employees considerably. The findings are
consistent with Palmer (2010) in his study on Innovation practices in small firms: An
empirical study, who also found out that managers of SMEs should reduce the scale
of the formalisation and complexity of the organisational structure on one hand, and
make the employees participate in the decisions of the organisation on the other hand
to make them ready to nurture their creativity.

119
Table 4.25: Multiple Regression
Model Summary, Multiple Regression
R R Square Adjusted R Square Std. Error of the Estimate
0.750 0.563 0.554 0.669
ANOVA, Multiple Regression
Sum of Squares Df Mean Square F Sig.
Regression 120.422 4 30.106 67.578 0.000
Residual 93.574 210 0.4455
Total 213.996 214
Coefficients, Multiple Regression
Variable β coefficient Std. Error T P-value.
(Constant) -0.002 0.046 -0.048 0.120
Commercialization 0.589 0.049 12.025 0.000
Organizational structure 0.367 0.048 7.582 0.000
Research and development 0.335 0.047 7.102 0.000
Creativity 0.300 0.051 5.931 0.000
4.9 Diagnostic Tests of Variables
To assess the effect of innovation practices on Performance of SMMEs in Kenya, the
study used a statistical model that was based on Ordinary Least Squares regression
(OLS). OLS model fittings were based on assumptions of normality of the residuals,
non-autocorrelation of the residuals, homoscedasticity of the residuals and non-
multicollinearity of the predictors. The fitted model was therefore tested to ensure it
met the assumptions of OLS estimation.

120
4.9.1 Normality
The model fitted assumed that the residuals follow a normal distribution. The study
thus had to confirm that the assumption applied for the data collected. A classical
assumption when fitting a maximum likelihood estimate model is that the residuals
are normally distributed and the residuals are likely to be normally distributed if the
dependent variable itself also follows a normal distribution (Shenoy & Madan 1994).
A histogram of the residuals was plotted as shown in Figure 4.7. The histogram
showed a virtual indication of a normal distribution curve which was not skewed and
had a mean of 0.000 and a standard deviation of 0.991
Figure 4.7: Histogram
For confirmation of normality of the residuals, a statistical test for normality was
conducted by the researcher as shown in Table 4.34. The Shapiro-Wilk test was thus
carried out which tested the null hypothesis that the data is not normally distributed as
follows;
H0: The data is not normally distributed
Ha: The data is normally distributed

121
The criterion was to reject the null hypothesis if the p-value of the Shapiro-Wilk
statistic was greater than 0.05. From the Shapiro-Wilk test for normality, the p-value
of the Shapiro-Wilk statistics was found to be 0.107 which was greater than 0.05
confirming that the residuals for the fitted multiple regression model were normally
distributed.
Table 4.26: Normality Test
Shapiro-Wilk Statistic Df Sig.
Standardized Residual 0.972 215 0.107
4.9.2 Autocorrelation
The fitted OLS multiple regression model also assumes that the residuals are not
auto-correlated. A violation of the assumption of non-autocorrelation would imply
that even though the predictors may be significant there was an under estimation of
the standard errors of the predictors. Montgomery, Peck and Vining (2015), stated
that the hypothesis and rejection criteria for testing serial correlation using Durbin
Watson statistic was as follows; H0: ρ=0, The data does not exhibit autocorrelation;
Ha: ρ=0, The data exhibit autocorrelation. Reject H0 if the computed D-W statistic is
less than the lower limit of the tabulated D-W. The computed Durbin Watson value
from the model fitted was 1.908, while the upper limit for the five predictors
including the constant was 1.81628 and the lower limit was 1.74229. Since the
computed value was greater than the upper limit, we conclude that the residuals were
not auto-correlated.
Table 4.27: Autocorrelation
Durbin-Watson statistic Tabulated lower limit Tabulated Upper limit
1.908 1.74229 1.81628

122
4.9.3 Homoscedasticity
A variable with a non-constant variance is termed heteroscedastic. Fitting an OLS
model also assumes that the residual terms have a constant variance and are therefore
referred to as homoscedastic (Razitis & Kalantzi, 2012). Adoption of the OLS model
requires the residual terms not to be heteroscedastic but be homoscedastic. A virtual
indication of the distribution of the residuals was shown in the scatter plott of the
residuals against the predicted values in Figure 4.8. The indication on the scatter plot
did not show a pattern of an increasing or decreasing function. This was a virtual
implication that the residuals were homoscedastic.
Figure 4.8: Scatter plot of Residual Term
Heteroscedasticity in a study usually occurs when the variance of the errors varies
across observation (Long & Ervin, 2008). Breusch-Pagan and Koenker was used to
test the null hypothesis that the error variances were all equal versus the alternative
that the error variances were a multiplicative function of one or more variables.
Rotich, Wanjau and Namusonge (2015) used the Breusch-Pagan statistic to test for
homoscedasticity in their study. Breusch-Pagan and Koenker tested the null

123
hypothesis that heteroscedasticity was not present (homoscedasticity) if the
significant-value was less than 0.05, reject the null hypothesis. A large chi-square
value that was greater than 9.22 would indicate the presence of heteroscedasticity
(Sazali, Hashida, Jegak & Raduan, 2009; Wanjau & Mwangi, 2014). In this study, the
chi-square value was 8.325 indicating that heteroscedasticity was not a concern as
shown in Table 4.36
Ho: Constant variance
Variables: Creativity (C), Organizational Structure (OS), Research and Development
(R&D) and Commercialization (Comm.)
Table 4.28: H0: The Residuals Exhibit Homoscedasticity
Ho Variables Chi2(1) Prob>Chi
2
Constant Variance C,OS, R & D, Comm. 8.325 0.110
4.9.4 Mulitcollinearity
Multicollinearity is exhibited if one or more independent variables can be expressed
in terms of the other independent variables. That would imply that the predictors are
not truly independent of each other as assumed by fitting the OLS model. The fitted
OLS model assumed that the independent variables did not exhibit multicollinearity.
Mugenda and Mugenda (2012), posit that multicollinearity can occur in multiple
regression models in which some of the independent variables are significantly
correlated among themselves. Multicollinearity is a situation that occurs when the
independent variables are highly correlated (Martz, 2013). In their study, Mutunga,
Minja and Gachanja (2014) tested for multicollinearity using the Variance Inflation
Factors (VIFs) and tolerance. The fitted model was tested for multicollinearity as
shown in Table 4.29. If a predictor has a tolerance of less than 0.2, it implies that the
predictor shares more than 80% of its variance with another predictor in the model.

124
To confirm that there was non-multicollinearity in the model, all the independent
variables were shown to have tolerances of values above 0.2 and VIFs of below 5.0.
Table 4.29: Multicollinearity
Tolerance VIF
Creativity 0.826 1.211
Organizational structure 0.898 1.113
Research and development 0.944 1.059
Commercialization 0.873 1.145
4.10 Optimal Model
A model optimization was conducted based on the results in table 4.23. The model
optimization guided the derivation of the revised conceptual framework. The results
were arrived at after running a multiple regression analysis. All the variables were
retained as all the variables were found to be significant. The variables were arranged
in order of their significance with commercialization (0.589), organizational structure
(0.367), Research and Development (0.335) and creativity (0.300). The derived
equation was;
Y = β0 + β1 X1 + β2 X2 +β3 X3 + β4 X4 + ε
Y = - 0.002 + 0.589X1 + 0.367X2 +0.335X3 + 0.300X4 + ε
Where
Y= Firm Performance
B0 = Constant
X1 = Commercialization
X2 = Organizational Structure

125
X3 = Research and Development
X4 = Creativity
ε = error term
Model 2 shows the beta coefficients after moderation with slopes of
Commercialization (0.596), Organizational Structure (0.359), Research and
Development (0.329), Creativity (0.286) and the moderator Entrepreneurial
Orientation (0.053). The overall moderated regression equation for the effect was as
follows:
Y = β0 + β1X1 + β2X2 + β3X3 + β4X4 + β5Z+ ε
Y = - 0.002 + 0.596X1 + 0.359X2 + 0.329X3 + 0.286X4 + 0.053Z + ε
Where;
Y= Firm performance
β0 = Constant
X1 = Commercialization
X2 = Organizational Structure
X3 = Research and Development
X4 = Creativity
Z = Moderator Entrepreneurial Orientation
ε = error term
Thus the Study optimal model (Revised Conceptual Framework) was given by figure
4.9

126
Figure 4.9: Revised conceptual framework
Dependent
Variable
Entrepreneurial
Orientation
Pro-activeness
Risk taking
Innovation
Commercialization
Internationalization
Technological
exploitation
Market exploitation
Organizational
Structure
Centralization
Formalization
Professionalization
Research &
Development
Customer
participation
Top management
involvement
Venture capital
Creativity
Technological
expertise
Team work
Motivation
SMMEs
Performance
Sales turnover
Profitability
Return on
Investment
Moderating
Variable Independent
variables
Independent variables Moderating variable Dependent variable

127
CHAPTER FIVE
SUMMARY, CONCLUSION AND RECOMMENDATIONS
5.1 Introduction
This chapter presented the summary of major findings of the study, relevant
discussions, conclusion and the necessary recommendations. The chapter also sets out
the relevant conclusion and made recommendations and suggestions for further
research based on the findings of the study. The conclusion of the study related to the
specific objectives and recommendations on the conclusion of each specific
objective. The study established the influence of innovation practices (creativity,
organizational structure, Research and Development, and commercialization) on
performance of small and medium manufacturing enterprises in Kenya.
5.2 Summary of the Study Findings
Quantitative data from factor analysis were used for statistical modelling to test the
influence of innovation practices (creativity, organizational structure, Research and
Development and commercialization) on SMMES performance. The data was also
used to test the moderating effect of entrepreneurial orientation on the relationship
between innovation practices and SMMEs performance. Correlation analysis between
innovation practices and SMMEs performance showed that there was positive
relationship between innovation practices and SMMEs performance. The correlation
coefficients were found to be all positive for commercialization, Research and
Development, organizational structure and creativity respectively. A multiple
regression was carried out to determine the joint influence of innovation practices and
SMMEs performance. The multiple regression results had a positive coefficient of
determination implying that innovation practices explained the variation in SMMEs
performance in the model. The coefficients of the multiple regression results were
also found to be positive for commercialization, organizational structure, Research
and Development and creativity respectively.

128
5.2.1 The influence of commercialization on performance of SMMEs in Kenya
The most influential innovation practices variable according to the findings was
commercialization. In the study commercialization was measured considering fifteen
indicators. At the pilot stage, factor analysis was used to determine validity of the
measurements where six items were dropped retaining nine. The nine retained
indicators were found to be reliable measures of commercialization with a
Cronbach‘s alpha coefficient within the accepted limits. The correlation analysis
between commercialization and performance was found to be significant. The
coefficient showed a strong positive relationship between commercialization and
SMMEs performance. The regression analysis with commercialization as the
predictor produced the best results among the four variables in the study. From the
multiple regression results for determining the joint influence of innovation practices
and SMMEs performance, the coefficient of commercialization was found to be the
highest of all the predictors.
5.2.2 The effect of an organizational structure on performance of SMMEs in
Kenya
Another objective of the study was to determine the influence of organisational
structure on SMMEs performance. Organisational structure was measured using
fifteen quantitative indicators after which factor analysis at the pilot stage expunged
six items retaining nine. The remaining nine indicators were found to be reliable to
measure Organisational structure as confirmed by the Cronbach alpha reliability
coefficient. Correlation analysis and regression analysis between organisation
structures were carried out to explore the relationship between the two. The
correlation coefficient showed a weak but significant positive relationship. The
regression model with organizational structure as the predictor was estimated with a
coefficient implying positive influence on SMMEs performance. On the multiple
regression for the joint influence of innovation practices on SMMEs performance, an
organisation structure had a significant positive influence.

129
5.2.3 The influence of Research and Development on performance of SMMEs
From the findings, research and development was the third most influential
innovative practice on performance. This independent variable was measured
considering fifteen quantitative indicators. After factor analysis, seven items were
expunged retaining eight. The remaining eight indicators were found to be reliable to
measure performance as confirmed by the Cronbach alpha reliability coefficient. The
correlation coefficient results for determining the relationship between research and
development and SMMEs performance also showed a moderate positive relationship.
The regression model with research and development as the predictor yielded results
which showed a positive significance on the influence of research and development
on the SMMEs performance. The combined effect model that was carried out from
the multiple regression to determine the joint influence showed that research and
development had a positive linear influence on SMMEs performance.
5.2.4 The influence of creativity on performance of SMMEs in Kenya
The first objective was to establish the influence of creativity on performance of
SMMEs in Kenya. The independent variable creativity was measured using sixteen
quantitative indicators after which factor analysis at the pilot stage expunged four
items retaining twelve. The remaining twelve indicators were found to be reliable to
measure creativity as confirmed by the Cronbach alpha reliability coefficient. The
correlation and regression analyses showed a positive linear relationship between
creativity and SMMEs performance. The relationship was found to be weak but
significant. The regression model yielded an R-square that implied that the model
explained the variation in SMMEs performance. The model was however found to be
significant from the ANOVA results that yielded an F-statistic value implying
significance. The joint multiple regression results of innovation practices factors also
found creativity as a significant predictor of SMMEs performance. The regression
coefficient found creativity to be the least influential factor of the significant
predictors included in the study. The coefficient of creativity in the model was found
to be positive implying that creativity had a positive influence on SMMEs
performance.

130
5.2.5 Moderating effect of entrepreneurial orientation on the relationship
between innovation practices and performance of SMMEs in Kenya.
The last objective of the study was to determine how entrepreneurial orientation
moderated the relationship between innovation practices and performance of SMMEs
in Kenya. For this objective the study performed a stepwise model with the final step
having the inclusion of the interaction variables between the moderating variable EO
and other independent variables. In the first step, the study fitted a multivariate model
that considered the combined effect of all the independent variables of innovation
practices. This measured and tested if there was a joint influence of the independent
variables on the performance of SMMEs in Kenya. The estimation of the multiple
regression model yielded results with the estimated coefficients of commercialization,
organizational structure, research and development and creativity all found to be
positive.
The second and third steps involved the introduction of the moderating variable and
the interaction variables between the moderator and the independent variables. The
model with the interaction variables showed a significant improvement on the
explanatory power with a positive change in coefficient of determination that was
significant. The coefficients of the interaction variable between creativity and
entrepreneurial orientation and organisation structure and entrepreneurial orientation
were found to be significant with a positive coefficient that was found to be
significant.
5.3 Conclusion
The study found out that commercialization had the greatest influence on the
performance of SMMEs in Kenya. The value of the multiple regression analysis
results as produced by SPSS was 0.589 before moderation. This was the highest
among the variables under study. The SPSS multiple regression analysis result after
moderation was 0.596. The results before and after moderation showed that
commercialization influenced the performance of SMMEs positively. The SMEs in
the manufacturing sector should therefore embrace commercialization tips such as
technological exploitation, market exploitation and internationalization as they offer

131
new products, develop new knowledge about firm‘s existing markets and assist firms
to enter the export market.
The multiple regression analysis results for Organizational Structure before
moderation was 0.367 and 0.359 after moderation. This implied that organizational
structure had positive influence on SMMEs performance. The management of
SMMEs should therefore embrace flexible structures with low centralization and low
formalization in order to realize better performance. They should also empower their
professionals to enable them increase the budget for innovative activities. Innovation
concepts should be included in the vision and mission statements of SMMEs in
Kenya.
Research and Development had multiple regression analysis results of 0.335 before
moderation and 0.329 after moderation. This implied that Research and Development
influenced the performance of SMMEs positively. This confirmed that firms that
engage their customers in creating products that mirror latent needs, involve top
management in acquiring resources for innovation activities and consider venture
capital as a form of equity financing to boost their sales and profits promptly. The
multiple regression analysis results for creativity before and after moderation were
0.300 and 0.286 respectively. Creativity had a positive influence on the performance
of SMMEs in Kenya. This implied that organizations that promote elements of
creativity such as technological expertise, teamwork and motivation tend to realise
better performance in terms of sales turnover, return on investment and profitability.
The study found out that all the four independent variables commercialization,
organizational structure, research and development and creativity influenced SMMES
performance positively. The moderator entrepreneurial orientation moderated the
relationship between innovation practices and SMMEs performance. The findings of
this study suggested that innovation practices were most significant factors for
SMMEs in Kenya, if they have to achieve superior performance. The findings of this
research supported the findings of previous researchers. It can be concluded that
effective innovation practices must put more emphasis on commercialization,
organizational structure, research and development and creativity if SMMEs have to

132
improve performance. The model used in this study can be embraced by the
management of various enterprises to improve their performance.
5.4 Recommendations
The study derived various recommendations from the results, findings and
conclusion. Internationalization will enable SMMEs to enter the export market
through introducing novel and significantly improved products in the international
market, thus increasing their sales and the overall profitability. The findings will
equip managers with modern technology methods such as e-commerce, digital and
social media which will boost the sales turnover and the profitability of the firms thus
enhancing the SMMEs performance. The management will also use the results to
develop new sales and distribution channels and this will enhance their connection to
new and already established customers. The management should embrace
commercialization, as without prior commercialization preparation during the
innovation process, new products or services may fail.
The study findings will be used by the management of SMMEs in Kenya to adopt
flexible Organizational structures with less centralized and less formalized structures.
The structures will enable them to innovate with somewhat greater frequency than
firms with rigid structures thus promoting better performance. Low formalization
encourages openness and flexibility in roles which is a prerequisite for new ideas.
Low centralization will promote innovation within SMMEs. The professionals who
are the engine of innovation will be empowered as innovation originates in the
creativity and innovation capability of its professionals. The management should also
emphasize innovation concepts such as skills, teams and motivation through
incorporating them in their vision and mission statements.
Research and development will increase the stock of knowledge within SMMEs
which will be used to devise new applications such as new and significantly
improved products. The information obtained from customers will assist in solving
customer demands thus boosting the firms‘ sales turnover and profitability. The top
management will use the findings to adjust positively the budget for innovative
programs. Venture capital will be incorporated as one of the major sources of finance

133
for SMMEs, as it not only provides finance but also advice to the management of
SMEs on matters pertaining to strategies. SMMEs managers should emphasize on
research and development as it improves the overall performance from sales
generated from innovative products.
The results will facilitate the development of new ideas, new products and discover
new ways of looking at problems and opportunities. Employees will be equipped with
skills that are relevant for their job description in the firms. The management will use
the findings to constitute effective work groups (teams) that will reflect on diversity
of skills and be able to challenge each other‘s ideas in constructive ways in order to
facilitate the performance of SMMEs. Intrinsic and extrinsic motivation should be
incorporated in the firms to enable employees to fully dedicate themselves to the
operations of the firms. The management of SMEs in the manufacturing sector should
promote elements of creativity such as technological expertise, teamwork and
motivation in order to realize better performance.
5.5 Contribution of the study to the Body of Knowledge Theory and Practice
The study contributed to the body of knowledge by establishing that performance of
SMMEs in Kenya can be realized if SMMEs adopt innovation practices. Researchers
/scholars can therefore be able to understand the relationship between innovation
practices and SMMEs performance. Lack of innovation practices leads to poor
performance among SMMEs. This study is therefore of scholarly importance as it has
introduced other factors that influence innovation practices. However recent studies
have not investigated the influence of entrepreneurial orientation-innovation practices
and SMMEs performance relationship model. This study identified
commercialization, organizational structure, Research and Development and
creativity as the main drivers of SMMEs performance in Kenya. The study also
established that performance of SMMEs is affected by entrepreneurial orientation.

134
5.5.1 Implication of the study to practice
The findings and the results of this study suggested that the management of SMMEs
in Kenya needs to enhance commercialization, organizational structure, Research and
development and creativity in order to facilitate the realization of SMMEs objectives
through better performance. However commercialization had the greatest influence
on the performance of SMMEs. The findings showed that entrepreneurial orientation
moderated the relationship between innovation practices and SMMEs performance
and therefore ways to inspire entrepreneurial orientation behaviours and support of
such behaviours needed to be formulated. It is only when SMMEs managers are able
and willing to be innovative, take proactive actions and assume risks will the SMMEs
be able to realize superior performance and sustainable competitive advantage.
Factors associated with innovation practices therefore need to be enhanced by
including them in the mission and vision statements of SMMEs and also making
them to be part of their code of conduct. In addition SMMEs should also embrace
entrepreneurial orientation concept.
5.5.2 Theoretical implications of the study to the body of knowledge
This study made key important contributions to innovation practices and SMMEs
performance. The study confirmed the existing literature in terms of positive
influence of innovation practices on SMMEs performance. Scholarly research
examined the link between innovation practices and firm performance such as a study
by Atalay (2013) on the relationship between innovation and firm performance in
Turkey. Although the findings revealed a positive relationship between innovation
and firm performance, his findings did not specify the size of the firms under study
and therefore the results could not be generalized. In addition Atlay did not use a
moderator in his research.
Ndalira (2013) did a study on the effects of the types of innovation on the growth of
SMEs in Kenya. The study failed to specifically focus on the influence of innovation
practices on SMEs performance. This study showed the influence of innovation
practices on SMMEs performance and further showed the moderating effect of
entrepreneurial orientation on innovation practices and SMMEs performance. This

135
research helped to gain insights into the predictors of innovation practices. The
finding confirmed all the predictors of current model of innovation practices in a
firm.
5.6 Areas for Further Research
Despite the contributions made by this study it only focused on SMEs in the
manufacturing sector. A large sample size for both SMEs and large enterprises in the
manufacturing sector could be used to validate these results as it may provide more
information about innovation practices. The study focused on four factors of
innovation practices which included commercialization, organizational structure,
research and development and creativity. There is need to establish other factors of
innovation practices which influence SMMEs performance. A study can also be done
on the influence of market innovation, process innovation and technological
innovation on SMMEs performance. The moderating variable on the other hand
incorporated only three dimensions of entrepreneurial orientation. A comprehensive
research can be conducted incorporating all the five dimensions of entrepreneurial
orientation. A study can also be done on the moderating effect of entrepreneurial
orientation on research and development and commercialization on SMMEs
performance. This study relied on cross-sectional data survey where respondents
were asked to assess viewpoints on each item in the instrument. However some
superior performance factors of innovation practices are known to be strategic and
dynamic in nature. Therefore a longitudinal study would be more preferable as it
could provide better perspective to the effect of innovation practices on SMMEs
performance in Kenya. The sample study also confined itself to the SMEs in the
manufacturing sector. Future studies could consider industries beyond the
manufacturing sector. The study was only limited to the Kenyan context and hence
similar studies could be conducted in other developing countries as well.

136
REFERENCES
Abbott, M. L. & McKinney, J. (2013). Understanding and applying research design.
Somerset, NJ: John Wiley & Sons.
Abdulrhman, A. (2012). The impact of Information Technology resources on SMEs
innovation performance. London: Brunel University.
Abebe, M. (2014). Electronic Commerce adoption, Entrepreneurial Orientation and
Small and Medium - Sized Enterprise (SME) Performance. Journal of
Small Business & Enterprise Development, 21(1), 100-116.
Adams, M. (2007). Information incentives and bargaining in the Japanese economy,
Cambridge: Cambridge University press.
Ahmad, M.S. (2012). Impact of organizational culture on performance management
practices in pakistan. Business Intelligence Journal, 5(1).
Ahu, T. (2015). Effects of Innovation Strategy on Firm Performance: A Study
Conducted on Manufacturing Firms in Turkey. Procedia-Social and
Behavioral Sciences, 195, 1338-1347.
Aizzat, M. N., Muhammad, J. & Nur, F. A. F. (2012). Country of origin effect on
organizational innovation in Malaysia: the mediating role of structure.
Asian Academy of Management Journal, 9(2), 63-85.
Albino, V., Ardito, L., Dangelico, R. M., & Petruzzelli, A. M. (2013). Understanding
Eco-Innovation Evolution: A Patent Analysis in the Energy Field. In 35th
DRUID Celebration Conference. Barcelona.
Alegre, J. & Chiva, R. (2014). Entrepreneurial Orientation, Innovation and Firm
Performance: The Importance of Organizational Learning Capability.
European Journal of Innovation Management, 10.

137
Alex, B. (2014). Innovating University-Based Entrepreneurship in Order to Inform
Innovation for the 21st Century, in Sherry Hoskinson , Donald F.
Kuratko. Innovative Pathways for University Entrepreneurship in the 21st
Century: Advances in the Study of Entrepreneurship, Innovation &
Economic Growth, 24, 145 - 170.
Ali, A. Y. S., & Ali, A. H. (2014). Entrepreneurial orientation and performance of
Women owned and managed micro and small enterprises in Somalia.
ZENITH International Journal of Multidisciplinary Research, 4(1), 23-
33.
Ali, K. M., Jing, Z. & Ahmed, G. Z. (2015). Customer - Supplier Interactions in
Crowdsourcing Practices: Customer Participation on Creating and
Sharing of new Product Value. International Journal of Management
Sciences and Businesss Research, 4(3), 1-13.
Alvarez, S. A. & Buzenitz, L. W. ( 2001). The Entrepreneurship of Resource-based
Theory. Journal of Management, 27, 755-775.
Alvaro, G.V.,& Calvo, J. L. (2011). A Study on the Factors that Influence Innovation
Activities of Spanish Big Firms. Technovation and Investment, 2, 8-19.
Amabile, T. M. (2012). Componential Theory of Creativity. Boulder: Westview
Press.
Amabile, T. M. & Mueller, J. S. (2008). Studying Creativity, its processes, and its
antecedents: An exploration of the Componential Theory of Creativity.
Journal of Organizational Creativity, 33-64.
Andrea, C. & Macro, V. (2013). Succeeding in Innovation: Key Insights on the Role
of R & D and Technological Acquisition Drawn from Company Data.
Andreas, L., Marina, Z. & Klaus, M. (2015). Senior Management's Influence on New
Product Development Projects and Firm Performance in Small and

138
Medium - sized Food Companies. International Food and Agribusiness
Management Review, 18(4), 1-14.
Andrews, D. C. (2012). Is there an Organizational Structure for our Reengineering
Business Operation ?" New York: Enterprise Re-engineering .
Ardito, L. (2014). Linking inventions and new products: The influence of technology
characteristics and the moderating role of firm capabilities and external
environment. 5 - 17.
Aronoff, C. & Ward, J. (2011). Family business governance. New York: Palgrave
Macmillan.
Arshad, A. S., Rasli, A., Afiza, A. A. & Zain, Z. M. (2013). The Impact of
Entrepreneurial Orientation on Business Performance: A Study of
Technology-based SMEs in Malaysia. Journal of Behaviour and Social
Sciences, 130(2), 46-53.
Asieh, F. (2015). Examining the impact of competitive strategies on corporate
innovation: an empirical study in automobile industry. international
Journal of Asian social science, 6(2), 135-145.
Atalay, M. A. (2013). The relationship between innovation and firm performance: An
empirical evidence from Turkish automotive supplier industry.
Proceedings- social and behavorial sciences, 75, 226-235.
Authority and Managing Innovation: A Typology of Product Development Teams
and Communities. (2012). Creativity and Innovation Management, 376 -
387.
Avlonitis, G. J. & Salavou, H. (2011). Entrepreneurial Orientation of SMEs, Product
Innovativeness, and Performance. Journal of Business Research, 75, 226-
235.

139
Avolio, B. J., Yammarino, F. J. & Bass, B. M. (2009). Identifying common method
variance with data collected from a single source: an unresolved sticky
issue. Journal of Management, 17(3), 571-87.
Babatunde, D. A., & Selamat, M. H. (2012). Investigating Information Security
Management and Its Influencing Factors in the Nigerian Banking
Industry: A Conceptual Model. International Journal on Social Science
& Art, 2(2), 55-59.
Barney, J. B. & Clark, D. N. (2007). Resource- Based Theory: Origins and
implications. Oxford: Blackwell.
Baron, S., & Warnaby, G. (2011). Individual customer use and intergration of
resources: Empirical findings and organizational implications in the
context of value co- creation. Journal of Industrial Marketing
Management, 211 - 218.
Bengtsson, O. (2011). Covenants in Venture Capital Contracts. Management Science,
57(11), 1926 - 1943.
Bing, L. I. U., & Zhengping, F. U. (2011). Relationship between strategic orientation
and organizational performance in born global: A critical review.
International Journal of Business and Management, 6(3), 109.
Bloch, C., Mortesen, P. S., Foyn, F. & Salte, O. V. (2007). Development and analysis
of innovation indicators in the Nordic countries based on CIS surveys,
NIND project report.
Bollen, K. A. (2012). Structural Equations with Latent Variables. Somerset: NJ: John
& Wiley & Sons.
Bolton, R. N., Parasuraman, A., Migchels, N., Kabadayi, S. & Gruber, T. (2013).
Understanding generation Y and their use of social media: A review and
research agenda. Journal of Service Management, 24(3), 245-267.

140
Boso, N., & Cadogan, J. W. (2012). Entrepreneurial orientation and market
orientation as drivers of product innovation sucess: A study of exporters
from a developing economy. International Small Business Journal, 31(1),
57-81.
Braun, A. & Bockelmann, L . (2013). An individual perspective on open innovation -
inbound and outbound opennessess of haute cuisine chefs. International
Journal of Innovation Management, 20(01), 1650002.
Bruton, A. (2014). Innovating University - Based Entrepreneurship in order to inform
innovation for the 21st century in Sherry Hoskinson, Donald F. Kuratko
(ed). innovative pathways for University Entrepreneurship in the 21st
century,advance in the study of Entrepreneurship, innovation & amp;
Economic Growth, 24, 145-170.
Bryman, A. & Bell, E. (2011). Business research methods, Oxford, NY, Oxford
university press.
Business Daily (BD). (2012, Oct 28). SMEs play a crucial role in Kenyan Economy.
Retrieved from: http://www.businessdailyafrica.com.
Cacciolatti, L., Fearne, A., & McNeil, D. (2011). Empirical evidence for a
relationship between business growth and the use of structured marketing
information amongst food and drink SMEs. Academy of Marketing
Conference (5-7 July 2011). University of Kent, United Kingdom.
Cakar, N. D. & Ertuk, A. (2010). comparing innovation capabilty of Small and
Medium Sized Enterprises:Examining the effects of organizational
culture and empowerment. Journal of Small Business management, 48(3),
325-359.
Callaghan, C. & Venter, R. (2011). An investigation of the entrepreneurial
orientation, context and entrepreneurial performance of inner-city

141
Johannesburg street traders. Southern African Business Review, 15(1), 1-
13.
Carter, J. & Schwab, A. (2008). Turnaround Strategies in established small family
firms. Family Business Review, 21(1), 31-50.
Castillo, F. J. M., Jimenez, D. & Aleman, J. L. M. (2010). Product competence
exploitation and exploration strategies: The impact on new product
performance through quality and innovativeness. Industrial marketing
management, 40, 1172 - 1182.
CCK. (2012, April 17). Communications Commission of Kenya. Nairobi: CCK
Chen, C. J., Chang, C. C. & Hung, S. W. (2011). Influences of technological
Attributes and Environmental Factors on Technology Commercialization.
Journal of Business Ethics, 104, 525 - 535.
Chen, G. L., Yang, S. C., & Tang, S. M. (2013). Sense of virtual community and
knowledge contribution in a P3 virtual community: Motivation and
experience. Internet Research, 23(1), 4-26.
Chen, J. S., Tsou, H. T. & Huang, A. Y. H. (2009). Service delivery innovation:
antecedents and impact on firm performance. Journal of Service
Research, 12(1), 36-55.
Cheng, Y. L. & Lin, Y. H. (2012). Performance evaluation of technological
innovation capabilities in uncertainty. Procedia- Social and Behavioral
Sciences, 40, 287 - 314.
Chen-Yu, L. (2015). Conceptualizing and measuring consumer perceptions of retailer
innovativeness in Taiwan. Journal of Retailing and Consumer Services,
24, 33-41.

142
Cheung, M. F. & To, W. (2011). Customer involvement and perceptions: The
moderating role of customer co- production. Journal of Retailing and
Consumer Services, 18(4), 271-277.
Chiara, C., Daniela, C., & Annalisa, T. (2015). "Editorial - innovations networks: the
key role of actors". Journal of Business & Industrial Marketing., 30 (3/4).
Chih, W. W. (2011). Global marketing strategy modelling of high tech products.
Journal of Business Research, 64, 1229 - 1233.
Christian, H., & Alexander, B. (2013). "Strategic directions on innovation
management – a conceptual framework". Management Research Review,
36(10), 939 - 954.
CIS. (2012). The Community Innovation Survey. Innovation Statistics. Nairobi: CIS.
Clausen, H., Korneliussen, T., & Madsen, E. (2013). Modes of innovation, resources
and their influence on product innovation: Empirical evidence from R&D
active firms in Norway. Technovation, 33(6), 225-233.
Coakes, S. J., Steed, L. & Ong, C. (2010). SPSS Version 17.0 for windows: analysis
without Anguish. Australia: Milton, John Wiley & Sons Australia, Ltd.
Cohen, W. M. & Levinthal, D. (2011). ―Absorptive capacity: a new perspective on
learning and innovation. 35(1), 128-152.
Cooper, D. & Schindler, P. S. (2003). Business Research Methods. (8th
ed.) Boston:
McGraw-Hill Publishing Company.
Cooper, D. & Schindler, P. S. (2011). Business research methods . (11th
ed). New
York: McGraw-Hill Publishing Company.
Cooper, R.G. (2011). Winning at new products: Creating value through innovation.
London: Basic books.

143
Cooper, R.G., & Kleinschmidt, E. J. (2011). Succes Factors for New-Product
Development. Wiley International Encyclopedia of Marketing.
Creswell, J. W. & Clark V. L. P. (2011). Designing and conducting mixed method
research, Los Angeles: Sage.
Cronbach, L. J. (2004). My Current Thoughts on Coefficient Alpha and Successor
Procedures. Educational and Psychological Measurement, 64, 391-418.
Darian, U. (2011). "Modern innovation management theory and the evolving US
lighting industry". Journal of Management History, 17(1), 9 - 26.
Datta, A. (2011). An integrative model to explain the ability to commercialize
innovations: Linking networks, absorptive capacity, ambidexterity and
environmental factors. Journal of Management and Strategy, 2(2), 44-49.
Datta, A., Mukherjee, D., & Jessup, L. (2015). Understanding commercialization of
technological innovation: Taking stock and moving forward. R&D
Management Journal, 45(3), 215-249.
Datta, A., Reed, R. & Jessup, L. (2013). Commercialization of Innovations: An
Overarching Framework and Research Agenda. American Journal of
Business, 28(2), 147 - 191.
Denison, D. R. (2000). Organizational culture: Can it be a key lever for driving
organizational change? Journal of organizational culture, 45(3), 215-249.
D‘Ippolito, B., Miozzo, M., & Consoli, D. (2014). Knowledge systematisation,
reconfiguration and the organisation of firms and industry: the case of
design. Research Policy, 43(8), 1334-1352.
Djelassi, S. & Decoopman, I. (2013). Customer's participation in product
development through crowdsourcing: Issues and implications. Industrial
Marketing Management, 42, 683 - 692.

144
Dobni, C. B., Mark, K. & Nelson, W. T. (2015). "Innovation strategy in the US: top
executives offer their views". Journal of Business Strategy, 36(1), 3 - 13.
Dul, J., Ceylon, C., & Jaspers, F. (2011). Knowledge worker's creativity and the role
of physical work environment. Human Resource management, 50(6),
715-734.
EAC. (2010). East African Community Retrieved from: http://www.eac.int/may
14,2013.
Edvardsson, B., Kristensson, P., Magnusson, P. & Sundstrom, E. (2012). Customer
integration within service development - A review of methods and an
analysis of insitu and exsitu contributions. Technovation, 32(7-8), 419 -
429.
Eggers,F.,Kraus, S.,Hughes, M., Susan, S. & Sean, L. (2013). Implications of
Customer and Entrepreneurial orientation for SME growth. Management
Decision, 524-546.
Eijkman. (2013). Innovative Forum: Deepening Financial inclusion Through Agent
Banking.
Equity Bank. (2014). Financial results half year 2014. Retrieved from: http://
equitybankgroup com/index.php/investor-relations/financial-results
Evanschitzky, H., Eisen, M., Calantone, R. J. & Jiang, Y. (2012). Sucess Factors of
Product Innovation: An Updated Meta - Analysis. Journal of Product
Innovation Management, 21-37.
Fakhar, S., Rana, A. L., Ayesha, R.K. & Lalarukh, S. (2012). Impact of
Organizational Culture on Organizational Performance: An overview.
Interdisciplinary journal of contemporary research in business, 3(9),
975-985.

145
Fakhrul, A. Z.,& Selvamalar, A. (2011). EO and Firm performance: The role of
Personality Traits in Maly Family Firms in Malaysia.
Fang, Niu, Yuli, Zhang & Hongzhi. (2010). ―Acquisition of resources. Formal
Organization and entrepreneurial orientation of new ventures‖. Journal of
Chinese Entrepreneurship, 1(1), 40-52.
Farndale, E., Hope-Hailey, V. & Kelliher, C. (2010). High Committment
Performance Management: The role of Justice and Trust. Organizational
Trust, 336.
Feng, T. & Wang, D. (2013). Supply chain involvement for better product
development performance. Industrial Management & Data Systems,
113(1-2), 190 - 206.
Ferrary, M. (2010). Syndication of Venture Capital Investment: The Art of Resource
Pooling. Entrepreneurship: Theory & Practice, 34(5), 885 - 907.
Flick, U. (2006). An introduction to qualitative research. Thousand Oaks, CA: Sage
Publications.
Frattini, F., De Massis, A., Chiesa, V., Cassia, L., & Campopiano, G. (2012).
Bringing to market technological innovation: What distinguishes success
from failure. International Journal of Engineering Business Management,
4(15), 1-11.
Freel, M. S. & Robson, P. J. A. (2011). Small Firms Innovation Growth and
Performance: Evidence from Scotland and Northen England".
International Small Business Journal, 22(6), 561-575.
Fuchs, C., & Schreier, M. (2011). Customer empowerment in new product
development. Journal of Product Innovation Management, 28(1), 17-32.

146
Funda, O. & Cihan, T. (2014). Effect of Strategic Leadership Styles on Firm
Performance: A study in a Turkish SME. Procedia-Social and Behavioral
Sciences, 150, 778-784.
Gakure, R. W., Were, M. S., Ngugi, P.K., Kibiru C. R., & Ngugi, J.K. (2013). The
Influence of Intellectual Capital on the Growth of Small and Medium
Enterprises in Kenya. Journal of Business Management and Corporate
Affairs, 1(1), 11-19.
Gathungu, J.M., Aiko., D.M., & Machuki, V.N. (2014). Entrepreneurial orientation,
networking, external environment, and firm performance. A Critical
Literature Review, 10(7).
Gault, F. (2010). Innovation Strategies for a Global Economy. Development,
Implementation, Measurement and Management. UK: IDRC
Gehlhar, M. J., Regmi, A., Stefanou, S. E. & Zoumas, B. L. (2009). Brand leadership
and product innovation as firm strategies in global food markets. Journal
of Product & Brand Managemet, 115-126.
Geyzen, A., Scholliers, P. & Leroy, F. (2012). Innovative traditions in swifty
transforming foodscapes: An exploratory essay. Trends in Food Science
and Technology, 25, 47-52.
Gichana, J. K. (2013). Relationship between innovations and enterprise growth
among SMEs in Kenya. Unpublished PhD thesis, Juja: JKUAT.
Gunday, G., Ulusoy, G., Kilic, K., & Alpkan, L. (2011). Effects of innovation types
on firm performance. International Journal of production economics,
133(2), 662-676.
Gupta, S. K. (2012). The relevance of confidence interval and P-value in inferential
statistics. Indian Journal of Pharmacology, 44(1), 143–144.

147
Hakanen, J. J., Schaufeli, W. B., & Ahola, K. (2008). The Job Demands-Resources
model: A three-year cross-lagged study of burnout, depression,
commitment, and work engagement. Work & Stress, 22(3), 224-241.
Hambrick, D. & Mason, P. (1984). Upper echelons: the organisation as a reflection of
its top managers. Academy of Management Review, 9, 193–206.
Hamel, G. (2011). ―Competition for competence and inter-partner learning within
international strategic alliances‖. Strategic Management Journal, 12, 83-
103.
Hanadi, M. A., Ali, H. M. & Busler, M. (2015). Measuring innovation, The use of
indications in Developed countries. World Journal of Entrepreneurship,
management and sustainable development, 11(3), 150-157.
Hans, B., Mariann, J., Isabelle, R. & Rutger, S. (2012). Product innovation processes
in small firms: Combining entrepreneurial effectuation and managerial
causation. Journal of Product Innovation Management, 31(3), 616-635.
Hans, L. (2014). Product innovation process and the trade -off between product
innovation performance and business performance. European Journal of
Innovation Management, 17(1), 61-84.
Hargadon, A. B., Martin, G. (2012). Misguided Policy? Following Venture Capital
into Clean Technology. California Management Review, 54(2), 118 - 139.
Henseler, J., Ringle, C. M. & Sarstedt, M. (2015). A new criterion for assessing
discriminant validity - based structural equation modelling. Journal of the
Acedemy of Marketing Science, 43(1), 115 - 35.
Hernandez, M. A. & Torero, M. (2011). Fertilizer market situation: Market situation,
consumption and trade patterns and pricing behavior. International Food
Policy Research Institute, 5(2), 118 - 139.

148
Hernard, D. & Dacin, A. (2010). Reputation for innovation: Its impact on Consumers.
Journal of Product Innovation Management, 27(3), 321-335.
Hertenstein, J. H., Plattt, M. B. & Veryzer, R.W. (2013). What is good design? An
investigation of the complexity and structure of design. Design
Management Journal, 8, 8-21.
Hill, D. (2012). Introducing Qualitative Research Methods: Evidence Based Practice
for social Work.
Hollander, V. J. (2010). A Study of Organizational Trust and Related Variables
Among Faculty Members at HBCUs. Iowa : Iowa University.
Hong, J. T., Yang, X. Y. & Chen, J. F. (2013). An empirical research on the
relationship among knowledge management, knowledge competence and
core competence. Journal of Shanghai Jiaotong University, 47(3), 444 -
449.
Hongyong, Z. (2014). Agglomeration and product innovation in China. China
Economic Review. 4(2), 128 - 139.
Hope, R. A., Foster, T., Krolikowski, A. & Cohen, I. (2011). Mobile water payment
innovations in urban Africa. December 2011, school of Geography and
the Environment and skoll Centre for Social Entrepreneurship at Said
business school.
Hotho, S. & Champion, K. (2011). Small businesses in the new creative industries:
innovation as a people management challenge. Management Decision, 49,
29 - 54.
Hurmerinta-Peltomaki, L. & Nummela, N. (2004). First the sugar, then the eggs...or
the other way round? (r., Ed.) Handbook of qualitative research methods
for international business, R. Marschan-Piekkari and C. Welch.
Cheltenham: Edward Elgar.

149
ICU. (2011). The Rise and Fall of Industrial and Commercial Union. ICU, 1(1), 223-
235.
Im, S & Workman, J.P. (2011). Market Orientation, Creativity, and new product
performance in technology firms. Journal of Marketing, 114-132.
Inkpen, A. C. (2012). ―Learning, knowledge acquisition, and strategic alliances‖.
European Management Journal, 16(2), 223-229.
Isogawa, D., Nishikawa, K., & Ohashi, H. (2012). New-to-Market Product
Innovation and Firm Performance: Evidence from a firm-level innovation
survey in Japan (No. 12-E, p. 077). RIETI Discussion Paper Series.
Ivanka, V., Bart, V. L. & Andy, N. (2014). Steering manufacturing firms towards
service business model innovation. California Management Review,
56(1), 100-123.
Iyer, K. (2012). Learning in strategic alliances: an evolutionary perspective. Academy
of Marketing Science Review. 5(2), 118 - 139.
Jaakko, A. (2013). Creating novel consumer value vs. capturing value: Strategic
emphases and financial performance implications. Journal of Business
Research. 4(2), 18 - 39.
Jang, S. & Chung, J. (2015). How do interaction activities among customers and
between customers and firms influence market performance and
continuous product innovation? An empirical investigation of the mobile
application market. Journal of Product Innovation Management, 32, 183-
191.
Janine, S., J. & Linderman, K. (2013). Process management, Innovation and
efficiency performance. The moderating effect evidence from transition
economies, 5(2), 218 - 239.

150
Jochen, S. (2014). Leadership and innovation capability development in strategic
alliances. Leadership & Organization Development Journal, 35(5), 442-
469.
Johnson, R. B. & Onegbuzie, A. J. (2004). Mixed method research: a research
pardigm whose time has come. Educational researcher, 33(7), 14-26.
Johnson, R. B., Onwuegbuzie, A. J. & Turner, L. A. (2007). Toward a definition of
mixed method research. Journal of mixed method research, 1(2), 112-
133.
Joppe, M. (2010). The Research Process. The Quantitative Report Journal, 597-607.
Joung, H. S., Jin, O. K. & Woo, S. C. (2015). The Effects of Commercialization
Capability in Small and Medium- sized Busienss on Business
Performances: Focused on Moderating Effects of Open Innovation.
Journal of Management and Strategy, 6(2).
Justin, A., Anthony L., & Max, C. (2005). The Impact of Entrepreneurial Orientation
on the Australian Automotice Components Industry. Australian: Monash
University.
Kalay, F. & Lynn, G. S. (2015). The Impact of Strategic Innovation Managent
Practices on Firm Innovation Performance. Research Journal of Business
and Management, 2(3), 412-429.
KAM. (2015). The Kenya Association of Manufacturers Industrial Business Agenda :
Proposal for the Incoming Government. Retrieved from
http://www.kam.co.ke
Kandel, E., Leshchinskii, Dima, & Harry. (2011). VC Funds: Aging Brings Myopia.
Journals of Financial & Quantitative Analysis, 46(2), 431 - 457.
Kane, M. T. (2013). Validating the Interpretations and Uses of Test Scores. Journal
of Educational Measurements, 4(2), 118 - 139.

151
Karanja, J. K. (2013). The influence of innovativeness on the growth of SMEs in
Kenya. International Journal of Business and Social Research 3(1), 25-
31.
Kariuki, J. (2015). Survey: M-Pesa pushing card operators out of business: Sunday
Nation. Retrieved from http:www.nationmedia.com
Kaya, H., & Ağca, V. (2009). Entrepreneurial orientation and performance of Turkish
manufacturing FDI firms: An empirical study. Iktisat Isletme ve Finans,
24(275), 115-133.
Kevin, L., Blanche, S. & Armand, H. (2014). Can venture capital foster innovation?
A study of the coupling between innovation and finance. International
Product Development Management Conference.
Khadije, J., Babak, J., & Mehrdad, G. (2013). The Impact of EO and Market
Orientation on the performance of Industrial Firms listed in Teheran
Stock Exchange (food,chemical, pharmaceutical & automobile). World
Journal of Entrepreneurship, Management and Sustainable Development,
10(1), 48-68.
KIPPRA. (2013). Kenya Institute for Public Policy and Research and Analysis,
Kenya Economic Report 2013: Creating an Enabling Environment for
Stimulating Investment for Competitive and Sustainable Counties.
Nairobi: KIPPRA.
Kiragu, D. N., Wanjau, K. L., Gekara, M. & Kanali, C. (2013). Effects of bank
growth on occupational fraud risks in commercial banks in Kenya.
International Journal of Social Science and Entrepreneurship, 1(3), 469-
480.
Kleinschmidt, E. J., Schultz, C., Salomo, S. & Brentani, U. (2013). How formal
control influences decision-making clarity and innovation performance.
Journal of Product Innovation Management, 30(3), 430 - 447.

152
Kogut, B. (2011). ―Joint venture: theoretical and empirical perspectives‖. Strategic
Management Journal, 9(4), 319-32.
Kombo, A. (2011). An evaluation of the Impact of Risk Management Strategies on
Micro-Finance Institutions' Financial Sustainability: A case study of
selected Micro- Finance institutions in Kisii Municipality, Kenya.
Educational Research, 2(5), 1149-1153.
Kothari, C. R. (2004). Research Methodology: Methods and Techniques. (2nd
revised
ed.). New Delhi, India: New Age International (P) Ltd.
Kothari, C. R. (2010). Research Methodology: Methods and Techniques. ( 5th ed.).
New Delhi, India: New Age International (P) Ltd.
Koufteros, X. (2015). Special issue on literature reviews in supply chain management
and logistics. International Journal of Physical Distribution & Logistics
Management, 3(5), 427-434.
Kraus, S. (2012). The role of entrepreneurial orientation in service firms: empirical
evidence from Austria. Service Industries Journal . The Service Industries
Journal, 33(5), 427-444.
Krishnan, C. N.V. (2011). Venture Capital Reputation, Post - IPO Performance and
Corporate Governance. Journal of Financial and Quantative Analysis,
46(5), 1295 - 1333.
Kroon, B., Voorde, K., & Timmers, J. (2013). High performance work practices in
small firms: a resource-poverty and strategic decision-making
perspective. Small Business Economics, 41(1), 71-91.
Kuratko, D. F., Ireland, R. D., Covin, J. G., & Hornsby, J. S. (2005). A Model of
middle-level Managers' entrepreneurial behaviour. Entrepreneurship
Theory and Practice, 29(6), 699-716.

153
Kuratko, D. F., Morris, M. H., & Covin J. G. (2011). Corporate Entrepreneurship and
innovation Manson OH:. South - Western Cengage learning.
Kusumawardhani, A. (2013). The role of Entrepreneurial Orientation in firm
performance. A study of Indonesian SMEs in the Furniture industry in
Central Java. Wollongong: University of Wollongong.
Lacity, M., & Leslie, W. (2014). "Business process outsourcing and dynamic
innovation". Strategic Outsourcing, An International Journal, 7(1), 66 -
92.
Lagat, C., Chepkwony, J. & Kotut, C. S. (2012). Market Orientation and Firm
Performance in the Manufacturing Sector in Kenya. European Journal of
Business and Management, 4(10).
Lagat, C., Franwick, G. & Sulol, T. (2015). Effect of market positioning on Market
Orientation Innovation types and firm performance linkage.
Latifi, M., & Shooshtarian, Z. (2014). The effects of Organizational Structure on
Organizational Trust and Effectiveness. Journal of Management Studies,
10(2), 73-84.
Leal-Filho, W. (2015). "Social Innovation and the Sustainable Development".
International journal of Sustainability in Higher Education., 16(4).
Lefsrud, L. & Suddaby, R. (2012). After the gold rush: the role of professionals in the
emergence and configuration of organizational fields. The Handbook of
Entrepreneurship in Professional Services, 18(2), 172-194.
Leitner, K. H. (2014). Strategy formation in the innovation and market domain:
emergent or deliberate? Journal of Strategy and Management, 7(4), 354-
375.

154
Leitner, K.H. (2014). Pathways for the co-evolution of new product development and
strategy formation processes. European Journal of Innovation, 18(2),
172-194.
Lendel, V. & Varmus, M. (2011). Creation and implementation of the innovation
strategy in the enterprise. Economics and Management, 16, 819 - 826.
Lerner, J. (2011). Private Equity and Long - run Investments: The case of Innovation.
Journal of Finance, 445 - 477.
Lettice, F., Tschida, M. & Forstenlechner, I. (2014). managing in an economic crisis:
the role of market orientation in an international law firm. Journal of
Business Research, 67(1), 2693-2700.
Lewis, T. M. (2011). Organizational structure effect on communication efficiency for
management information system supported organizations: A Delphi Study,
Unpublished PhD dissertation, Phoenix: University of Phoenix.
Li, Q., Smith, K., Maggitti, P., Tesluk, P. & Katila, R. (2013). Top Management
attention to Innovation: The Role of Search Selection and Intensity in
New Product Introductions. Academy of Management Journal, 56, 893 -
916.
Liang, T., You, J., & Liu, C. (2010). A resource-based perspective on information
technology and firm performance: a meta-analysis. Industrial
Management & Data Systems, 110(8), 1138-1158.
Lin, Y. H., Peng, C. H. & Tkao, D. (2008). The innovativeness effect of market
orientation and learning orientation on business performance.
International Journal of Manpower, 29(8), 752-772.
Lisboa, A., Skarmeas, D. & Lages, C. (2011). Entrepreneurial orientation,
exploitative capabilities and performance outcomes in exports markets: A
resource-based approach. Industrial Marketing Management, 40, 1274 -
1284.

155
Liu, B., & Fu, Z. (2011). Relationship between Strategic Orientation and
Organizational performance in Birn Global: A Critical Review, 3(5), 27-
44..
Liu, L. & Jiang, Z. (2016). Influence of technological innovation capabilities on
product competitiveness. Industrial Management & Data Systems,
116(5), 883 - 902.
Ljiljana ,B. & Durdana, O. (2015). Enabling Innovation and Creativity in Market -
oriented firms. Baltic Journal of management, 10(2), 144-165.
Lorraine, W. L. (2012). The relationship between strategic leadership and strategic
alignment in high-performing companies in South Africa. Unpublished
PhD thesis, South Africa: University of South Africa
Lu, W., Anita, M. M., Liu, & Wang, H. (2013). Procurement innovation for public
construction projects: A study of agent-construction system and public-
private partnership in China. Engineering, Construction and Architectural
Management, 20(6), 543-562.
Lumpkin, G. T. & Dess, G.G. (2010). Linking two dimensions of entrepreneurial
orientation to firm performance: The moderating role of environment and
industry life cycle. Journal of Business Ventures, 16(3), 429-451.
Luo, X., Li, H., Zhang, J. & Shim, J. P. (2010). Examining Multi- Dimensional Trust
and Multi - Faceted Risk in Initial Acceptance of Emerging Technologies.
Decision support systems, 49(2), 222-234.
Madsen, E. & Smith, V. (2011). Commercialization of Innovations and Firm
Performance.(No.8 - 26).
Madsen, E. L. (2007). The significance of sustained entrepreneurial orientation on
performance of firms - a longitudinal analysis. Entrepreneurship and
regional Development, 19(6), 185-204.

156
Maina, K., Butoyi, S., & Michira, N. (2010). SME Solutions Center—Kenya:
Developing Alternative Financing Solutions for Small and Medium
Enterprises., Washington, DC.: World Bank Retrieved from
https://openknowledge.
Majchrzak, A., More, P. H. & Faraj, S. (2012). Transcending knowledge differences
in cross- functional teams. Organization Science, 23(4), 951 - 970.
Maleya , M. M. & Muturi, W. (2013). Factors affecting the financial performance of
listed companies at the Nairobi Securities Exchange in kenya. Reseach
Journal of finance and accounting, 4(15), 99-104.
Malhotra, N. J., Hall, M. & Shaw, A. (2006). Market research: an applied
orientation, Frenchs:Pearson Prentice Hall.
Marc, Z. (2012). The effect of sourcing balance on innovation performance and
strategic flexibility. Unpublished Master's thesis, Twente: University of
Twente.
Marco, G., Michele G. & Livio, C. (2013). Open innovation actions and innovation
performance. Innovation, Europe, Literature review, Open innovation,
Innovation performance. European Journal of Innovation Management
18, (2)150-171.
Maria, G. R., Mario J. D. & Fatima, G. M. (2014). Technological posture and
corporate social responsibility; Effects on Innovation performance,
13(10).
Marie, A. & Alan, H. (2014). Scoping the market oriention literature from 2009 to
2013: a review of the concept and the discussions found across a range of
academic disciplines. Journal of Strategic Marketing, 23(4), 353-363.

157
Marras, F., Aguglia, L., Doria, P., Giordani, R., Giuca, S., Sardone, R. & Vigano, L.
(2012). Italian agriculture in figures 2012. Pubblicazioni Congiunturali e
Ricerche Macroeconomiche.
Masood, U. H., Sadia, S., Muhammad, S. N. & Saman, N. (2013). Effects of
Innovation types on Firm Performance; An empirical study on Pakistan's
Manufacturing Sector. Pakistan Journal of Commerce and Social
Sciences, 7(2), 243-262.
Matanda, M. (2011). Entrepreneurial Small-Scale Earthenware Manufacturers in
Kenya: Barriers to their Access to New Markets. Conference Theme: The
Business of Social and Environmental innovation.
Matanda, M. (2013). The role of human capital and entrepreneurial orientation on
radical product innovations in Small scale carpentry workshops in
Nairobi. Working Paper
Mbithi, B., Muturi, W., & Rambo, C. (2015). Effects of product development strategy
on performance in sugar industry in Kenya. International Journal of
Academic Research in Businesss and Social Sciences, 5(12).
Mbogo, M., & Ashika, C. (2011). Factors Influencing Product Innovation in Micro
Finance Institutions in Kenya: A Case Study of MFIs Registered With the
Association of Microfinance Institutions. In ICSB World Conference
Proceedings (p. 1). International Council for Small Business (ICSB).
Menguc, B. & Auh, S. (2010). Development and return on execution of product
innovation capabilities: The role of organizational structure. Industrial
Marketing Management, 39, 820 - 831.
Metin, R., Ozden, A. & Betul, O. A. (2013). Does the link between marketing
orientation and innovation lead to success? A survey based on SEM in
Turkey. Dumlupinar University Journal of Social Science/Dumlupinar
Üniversitesi Soysyal Bilimler Dergisi.

158
Mietzner, D. & Kamprathi, M. (2013). A competence portfolio for professionals in
the creative industries . Creativity and Innovation Management, 17(4),
378-389.
Miguel, H. E. & Elena, D.B. (2009). Product innovation in small manufacturers,
market orientation and the industry's five competitive forces. European
Journal of Innovation Management, 12(4), 470-491.
Mihaicz, D. (2012). The importance of organizational effectiveness . Retrieved from
http://www. Effective managers. Com/dwight-mihalicz/the-importance-of-
organizational-effectiveness.
Mikel, L. (2014). Guest editorial on research and innovation strategies for smart
specialisation in Europe. European Journal of Innovation Management,
17(4), 378-389.
Miller, D. (2011). A reflection of Entrepreneurship Orientation research and some
suggestions for the future. Entrepreneurship Theory and practice, 35(5),
873-894.
Miller, D. & Friesen, P.H. (1983). Strategy- making and environment: The third link.
Strategic Management Journal, 4(3), 221-235.
Mohd, R. & Syam, S. S. (2013). Innovation and firm performance; Evidence from
Malaysian SMEs. Journal of marketing, 73(5), 90-102.
Mohd, R. M., Zuhriah, E. & Norsiah, H. (2014). The influence of innovation
performance towards manufacturing sustainability performance. In the
proceeding of 2014 International Conference on Industrial Engineering
and Operations Management.
Moriss, M. H., Kuratko, D. F., & Covin, J. G. (2013). Corporate entrepreneurship
and innovation. Cincinnati, OH: Thomson/South Western Publishers.

159
Moses, C., Sithole, M. M., Labadarios, D., Blankley, W. & Nkobole, N. (2012). The
State of Innovation in South Africa. findings from the South African N.
Mugambi, A. L. & Wanjau, K. L. (2016). Factors affecting the performance of faith
based small and Medium enterprises in Kenya. A survey of Meru County.
The International Journal of Business & Management, 4(2), 311
Mugenda, A. (2008). Social Science Research: Conception, Methodology and
Analysis. Nairobi: Kenya Applied Research and Training Services.
Mugenda, O. M. & Mugenda, A. G. (2003). Research Methods: Quantitative &
Qualitive Approaches. Nairobi: Acts Press.
Mugo, J. (2014, May 20). Business Daily. Retrieved from
http://www.nationmedia.com
Mutema, J. K, & Muturi, W. (2013). Factors influencing risk management in
construction projects in the petroleum industry in Kenya. International
Journal of Arts and Entrepreneurship, 1(5). 668-678
Mutiga, M. (2014). Kenya's Banking Revolution Lights a Fire. New York: The New
York Times.
Muzio, D., Brock, D. M. & Suddaby, R. (2013). Professions and institutional change:
towards an institutionalist sociology of the professions. Journal of
Management Studies, 50, 699 - 721.
Mwangi, S. M. & Namusonge, M. J. (2014). Influence of inoovation of small and
medium enterprises (SME) grwoth: A case study of Garment
Manufacturing Industries in Nakuru County. European Journal of
Business Management, 5(7).
Navarro-Garcia, A., Arenas-Gaitan, J. & Rondan-Cataluna, F. J. (2014). External
environment and the moderatingrole of export market orientation,.
Journal of Business Research, 67(5), 740-745.

160
Ndalira, D. W., John, K. N. & Bella, C. (2013). Effects of the type of innovation on
the growth of Small and Medium Enterprises in Kenya:. A case of
Garment Enterprises in Jericho Nairobi. European Journal of
Management Sciences and Economics, 1(2).
Ndung'u, S. I & Njeru, A. (2014). Assessment of factors influencing Adoption of
Agency Banking in kenya. A case of Kajiado North Sub County.
European Journal of Management Sciences and Economics, 1(2).
Ndung'u, S. I. (2014). Moderating role of entrepreneurial orientation on the
relationship between information security management and firm
performance in Kenya. Unpublished PHD Thesis, Nairobi, University of
Nairobi.
Ng'ang'a, S. I. & Mwachofi, M. M. (2013). Technological Adoption and Banking
Agency in Rural Kenya:. Journal of Sociological Research. 11(2).
Retrieved from http://www.macrothink.org/journal/index.php/jsr/2993
Ngugi, P. K. (2012). Challenges Hindering Sustainability of Small and Medium
Family Enterprise After the Exit of the Founders in Kenya. Unpublished
PhD Thesis. Juja: Jomo Kenyatta University of Agriculture and
Technology.
Nielsen, B. B. & Gudergan, S. (2011). Exploration and exploitation fit and
performance in international strtegic alliances . International Business
Review. , 17(4), 378-389.
Norazlina, A. A., Izaidin, A. M., Hasfarizal, K. M., Shahrina, M. N. & Lai, F. W.
(2013). Analyzing Market Exploitation and Market Exploration Dyad for
Marketing Strategy Implementation Effectiveness in Malaysian Fertilizer
Industry: A Conceptual Paper. American Journal of Economics, 3(2), 119
- 126.

161
NSF/NCSES. (2011). National Science Foundation/National Center for Science and
Engineering Statistics and U.S. Census Bureau, Business R&D and
Innovation Survey Aggregate Estimates.UK: NSF/NCSES
Ongwae, J. G., Elegwa, M. & Odhiambo, R. (2013). Innovation activity and Firm
growth across key sectors of the Kenyan Economy. Jomo Kenyatta
University of Agriculture and Technology, 426
Orodho, A. J. (2008). Essentials of Educational and Social Science Research
Methods. Nairobi: Masola Publishers.
Oslo Manual, (2005). Proposed Guidelines for Collecting and Interpreting
Technological innovation Data. Paris: Oslo Manual.
Otieno, M. M., Muiru, J. M. & Ngugi, J. K. (2013). The Influence of Innovativeness
on the Growth of SMEs in Kenya. International Journal of Business and
Social Research, 3(1), 25-31.
Otieno, S., Bwisa, H. M.,& Kihoro J. M. (2012). Influence of Entrepreneurial
Orientation on Kenya's Manufacturing Firms Operating under East
African Regional Integration. International Journal of Learning &
Development, , 3(1), 25-31.
Ottenbacher, M. C., & Harrington, R. J. (2009). The product innovation process of
quick -service restaurant chains. International Journal of Contemporary
Hospitality Management, 21(5), 523-541.
Ozge, C. & Mette, P. K. (2011). Does organizing creativity really lead to innovation?
Pallant, J. (2010). SPSS Survival Manual: A step by step guide to data analysis using
the SPSS program. MA: Allen & Unwin Pty.
Palmer, J. C. & Wright, R. E. (2010). Product Innovation. Journal of Applied
Business and Economics, 11(3), 33-38.

162
Pang, L. L. & Chih, H. T. (2012). The study of R & D Management on New Product
Development Performance in Taiwan's Hi-Tech Industries. Journal of
Business and Public Affairs, 1(1), 45-56.
Parkman, I. D., Holloway, S. S. & Sebastiao, H. (2012). Creative industries: aligning
entrepreneurial orientation and innovation capacity. Journal of Research
in Marketing and Entrepreneurship, 14(1), 95-114.
Peacock, W. (2004). Understanding Small Business Practice, Theory and Research.
Peled, M. & Dvir, D. (2012). Towards a contingent approach of customer
involvement in defence projects: An exploratory study. International
Journal of Project Management, 30(3), 317 - 328.
Pitta, D.A. (2008). Product innovation and management in a small enterprise. Journal
of Product & Brand Management, 416-419.
Raju, P. S. Lonial, S. C. & Crum, M. D. (2011). Market orientation in the context of
SMEs: A conceptual framework. Journal of Business Research, 64(12),
pp. 1320-1326.
Rajul, G., Joshi , John, C. & Veera, R. (2015). Exploring Powley, E. H. & Nissen ,
M. E. (2012). If you can't trust, stick to hierachy: structure and trust as
contigency factors in threat assesment contexts. Journal of Homeland
Security and Emergency Management, 9(1), 83-90.
grassroots innovation phenomenon through the lived experience of an Indian
grassroots innovator. South Asian Journal of Global Business Research,
4(1), 27 - 44.
Rauch, A., Wiklund, J., Lumpkin, G. T. & Frese, M. (2009). Entrepreneurial
orientation and business performance: An assessment of past research and
suggestions for the future. Entrepreneurship Theory Practice, 33(9), 761-
787.

163
Razak, A. M. N. (2012). Key note address by the Honorary Prime Minister at Invest
Malaysia Kuala Lumpur. Kuala Lumpur: University of Malaya.
Republic of Kenya. (2005). Economic Survery 2005. Kenya National Bureau of
Statistics, Nairobi: KNBS.
Republic of Kenya. (2007). Economic Survery 2007. Kenya National Bureau of
Statistics, Nairobi: KNBS.
Republic of Kenya. (2008). Economic Survey 2008. Kenya National Bureau of
Statistics, Nairobi: KNBS.
Republic of Kenya. (2009). Economic Survey 2009. Kenya National Bureau of
Statistics, Nairobi: KNBS.
Republic of Kenya. (2013). Economic Survey 2013. Kenya National Bureau of
Statistics, Nairobi: KNBS.
Republic of Kenya. (2014). Economic Survey 2014. Kenya National Bureau of
Statistics, Nairobi: KNBS.
Republic of Kenya. (2015). Economic Survey 2015. Kenya National Bureau of
Statistics, Nairobi: KNBS.
Research Advisors. (2006). Sample Size Table. Retrieved from http://www.research-
advisors.com/tools/SampleSize.htm
Rick, E., Andy, N. & Eskildsen, J. (2015). Continously relevant and responsible
Organisation Via Creativity, Innovation and Sustainability. International
Journal of Productivity and performance Management, 64(3), 64-76.
Robin, V. H. & Lars., B. (2015). The impact of global purchasing and supplies
integration on product innovation. International Journal of Operations &
Production Management, 35(9), 1295-1311.

164
Rosenbusch, N., Brinckmann, J., & Bausch, A. (2011). "Is innovation always
beneficial? A meta- analysis of the relationship between innovation and
performance in SMEs. Journal of Business Venturing, 26(4), 441-457.
Rosli, M. (2015). Entrepreneurial Orientation and performance of Nigerian Banks.
The mediating effect of Teamwork. Journal of Operations & Production
Management, 35(9), 1295-1311.
Rowe, G. & Nejad, M. H. (2009). Strategic leadership: short-term stability and long-
term viability. Ivey Business Journal, 73(5), 6–11.
Rowley, J. (2011). Innovation for Survival: From Cooperation to Collaboration, in
Anne Woodsworth (ed.). Librarianship in Times of Crisis, 34, 207 - 224.
Sandip, J., Modha, K.& Modha, S . (2013). Automatic Sentiments Analysis for
Unstructured Data. International Journal of Advanced Research in
Computer Science and Software Engineering. 41(4), 553-583
Sandra, S. (2011). Entrepreneurial Orientation - What is it and How can it be useful
for Policy and Program Development ? 1(5-6).
Sarminah, S. (2012). The Influence of Innovation and Transformational Leadership
on Organizational performance. 57, 486-493.
Saylor, M. (2012). The Mobile Wave: How Mobile Intelligence Will Change
Everything , 3(1), 25-31..
Schein, E. H. (1996). Organisational culture, Campus Verlag, Frankfurt/ New York.
Schein, E.H. (2011). Leadership and organizational Culture. New York.NY: Wiley.
Schroll, A & Mild, A. (2011). Open innovation modes and the role of internal R&D.
European Journal of Innovation Management, 14(4), 475 - 495.
Schultz, C., Salomo, S., Brentani, U. & Kleinschmidt, E. J. (2013). How Formal
Control Influences Decision - Making Clarity and Innovation

165
Performance. Journal of Product Innovation Management, 30(3), 430 -
447.
Sekaran, U. (2003). Research Methods for Business: A Skill Building Approach. (4th
ed). New York: John Wiley & Sons.
Shaemi, B.A., Abzari, M., Mazraeh, S. & Maleki, S. (2013). Determining the effect
of organization's structure dimensions on organizational trust in Esfahan's
Mobarakeh Stell company. Journal of Basic and Apllied Scientific
Research, 3(3), 84-90.
Shoghi, B., Aghajani, H. T., Shafizadeh, R. & Eisapour, H. (2013). The Relationship
Between Organizational Structure and Employee Creativity. Australian
Journal of Basic and Applied Science, 7(2).
Shufang, H. (2012). How can innovation create the future in a catching-up economy?
Journal of Knowledge-based Innovation in China, 4(2), 118-131.
Sigala, M. (2012). Social networks and customer involvement in new service
development. International Journal of Contemporary Hospitality
Management, 24(7), 966 - 990.
Simiyu, F. B. (2013). Effects of innovations strategies on performance of commercial
banks in Kenya. International Journal of Social Sciences and
Entrepreneurship, 1(3), 198-207.
Smith. (2007). Culturing Development: Bananas, Petri Dishes and "mad Science".
Journal of Eastern Africa Studies, 1(2), 212-233.
Sorensen, J. B. (2009). The strength of corporate culture and the reliability of firm
performance. Administrative Science Quarterly, 47, 70-91.
Stanko, M. A., Molina - Castillo, F. & Munuera - Aleman, J. L. (2012). Speed to
Market for Innovative Products: Blessing or Curse? Journal of Product
Innovation Management, 29(5), 751 - 765.

166
Stata, R. (1989). ―Organizational learning: the key to management innovation‖. Sloan
Management Review, 30(3), 63-74.
Stewart, D. (2010). Growing the Corporate Culture. Retrieved from
http://www.wachovia.com/foundation/v/index.jsp?vgnetoid=ab411f07760
aa110VgnVCM1000004b0d1872RCRD&vgnextfmt=default
Story, V., O'malley, L. & Hart, S. (2011). Roles, role performance and radical
innovation competences. Industrial Marketing Management, 40, 952 -
966.
Suddaby, R. & Viale, T. (2011). Professional and field-level change: institutional
work and the proffesional project. Current Sociology, 59, 423 - 442.
Sumo, R. (2010). Corporate Entrepreneurship and Organizational Structure
Elements. New York: John Wiley & Sons
Sung, S., Kim, C. & Choi, I. (2015). A study on the relationship between innovation
types and firms performance using structural equation modelling; Korean
manufacturing firms. 15(2-4), 129-152.
Suwastika, N., Anand, C. & Southgate, P. (2014). "Determinants of innovation in the
handicraft industry of Fiji and Tonga: an empirical analysis from a
tourism perspective. Journal of Enterprising Communities: People and
Places in the Global Economy, 8(4), 318 - 330.
Svendsen, M. F., Haugland, S. A., Gronhaug, K., & Hammervoll, T. (2011).
Marketing strategy and customer involvement in product development.
European Journal of Marketing, 45(4), 190-206.
Tabachnick, B.G & Fidell, L. S. (2013). Using multivariate statistics (wyd.6). New
York: John Wiley & Sons

167
Tajeddini, K. (2010). Effect of customer orientation and entrepreneurial orientation
on innovativeness: evidence from the hotel industry in Switzerland.
Journal of Tourism Management, 31, 221–231.
Tang, J., Tang, Z., Marino, L. D., Zhang, Y. & Li, Q. (2008). Exploring an inverted
U-Shape relationship between entrepreneurial orientation and
performance in Chinese ventures. Entrpepreneurship Theory & Practice,
34(1), 219-239.
Tarus, D. K., & Nganga, S. I. (2013). Small and Medium Size Manufacturing
Enterprises Growth and Work Ethics in Kenya. Developing Country
Studies, 3(2).
Teddlie, C. & Tashakori, A. (2009). Foundations of mixed method Research:
intergrating quantitative and qualitative approaches in the social science.
New York: John Wiley & Sons
Teece, D. J. & Pisano, G. (2012). ―Dynamic capabilities and strategic management‖.
Strategic Management Journal, 18(7), 509-33.
Teixeria, R., Koufteros, X. & Peng, X. D. (2012). Organizational Structure,
Integration and Manufacturing Performance: A Conceptual Model and
Propositions. Journal of Operation and Supply Chain Management, 5(1),
70-81.
Teixeria, R., Koufters, X.A. & Peng, X. D. (2012). Organizational Structure,
Intergration and Manufacturing Performance: A Conceptual Model an
Propositions. Journal of Operations and Supply Chain Management, 5(1),
69-81.
Tran, Q. & Tian, Y. (2013). Organizational Structure: Influencing Factors and Impact
on Firm. American Journal of Industrial and Business Management, 3,
229 - 236.

168
Trochim, W.M.K . (2006). Positivism & Post- Positivism. Research Methods
Knowledge Base. New York: John Wiley & Sons
Trott, P. (2010). Innovation Management and New Product Development. Harlow:
Prentice Hall.
Tseng, M. L., Lin, Y. H., Lim, M. K. & Teehankee, B. L. (2015). Using a hybrid
method to evaluate service innovation in the hotel industry. Applied Soft
Computing, 28(3), 411 - 421.
Turner, A.G. (2003). Sampling Strategies. United Nations Secretariat, Statistics
Division. Designing of Household Sample Survey. UNS, 13(4), 466-480.
Valencia, J. C., Vallle, R. S. & Jimenez, D. J. (2010). Organizational Culture as a
determinant of product innovation. European Journal of Innovation
Management, 13(4), 466-480.
Van de Ven, A. & Poole, M. (1995). Explaining development and change in
organizations. Academy of Management Review, 510-540.
Vittoria, G. S., Debmalya, M., Alessandra, P. & Mudambi, R. (2014). "A longitudinal
study of MNE innovation: the case of Goodyear". Multinational Business
Review, 22(3), 270 - 293.
Vries, J. T. (2012). The role of Venture Capital Reputation in the Innovative
Performance of an Enterprise. Journal of Venture Capital and innovation.
29(4), 525-542.
Wadhwa, Anu, B. & Sandip. (2013). Exploration and Resource Commitments in
Unequal Partnerships: An Examination of Corporate Venture Capital
Investments. Journal of Product Innovation Management, 30(5), 916 -
936.

169
Walsh, P. R. (2012). Innovation Nirvana of Innovation Wasteland? Identifying
commercialization strategies for small and medium renewable energy
enterprises. Technovation, 32, 32 - 42.
Walter, L. (2015). Social innovation and the sustainable development. International
Journal of Sustainability in Higher Education, 16(4), 437-440.
Wang, C. L. & Chung, H. F. L. (2013). The moderating role of managerial skills in
market orientation and innovation: An Asian perspective. Journal of
Business Research, 66(12), 2431-2437.
Wang, J.H., Chang, Y. C. & Chiu, W. H. (2013). Customer Involvelment in the
process innovation: Antecedents, mediation and performance. In 35th
DRUID Celebration Conference, Barcelona, Spain
Wanjau, K. L. (2010). The role of quality adoption in growth and Management of
Small and Medium Enterprises in Kenya. Unpublished PhD dissertation,
Nairobi: University of Nairobi.
Wanjau, K. L., Gakure, R. W. & Kahiri. (2012). The Role of Quality in Growth of
Small and Medium Enterprises and Economic Development in Kenya. In
Scientific Conference Proceedings.
Wanjiku, C. G. (2011). Industrial Innovation in the face of stiff competition from
Chinese, imports; A study of small and medium scale garment firms in
Nairobi. Unpublished PhD dissertation, Nairobi: University of Nairobi.
Weibao, L., Weiwei, W. , Bo Yu , & Check-Teck, F. (2015). "Is China transmuting to
fast overtake the USA in innovation?: R&D case-studies in advanced
technology manufacturing". Chinese Management Studies, 9(1), 8 - 26.
Wijetunge, W. A. & Pushpakumari, M. D. (2015). Entrepreneurial Orientation and
business performance of SMEs of Western province of Sri lanka. Journal
for International Business and Entrepreneurship Development, 11(2),
163-186.

170
Wiklund, J. & Shepherd, D. A. (2011). Where to from where? Eo as Experimentation,
Failure and Distribution of Outcomes. Entrepreneurship Theory and
Practice, 35(5), 925-946.
Wouter, M. V. B., Matthyssens, P. & Koen, V. (2015). "Drivers of Industrial
innovation in networks; unleasing the innovation potential of
domesticated market". Journal of business and industrial marketing,
30(3/4), 144-435.
Wu, L. Y. (2012). Entrepreneurial resources dynamic capabilities and start-up
performance of Taiwan‘s high-tech firms. Journal of Business Research,
60, 549-555.
Xiuli, W. & Juan, Z. (2011). The Organizational Structure Optimization Study of
SME in Start-up Stage. School of Economics and Management, North
China University of Technology , 821-825.
Xu, Y., Albert, C. L., & Gonzalez, J. (2014). An application of structural equation
modelling for continuous improvement. International journal for
numerical methods in engineering, 24(2), 337-357.
Yan, X. & Chun, Y. C. (2013). "Strengths and weaknesses of Hong Kong's
technology and innovation industry with reference to the extended open
innovation model". Journal of Science and Technology Policy in China,
4(3), 180 - 194.
Yejing, W., Deming, Z., Anthony, B. & Michael, S. (2013). Environmental
determinants of responsive and proactive market orientaions. Journal of
Business & Industrial Marketing, 28(7), 565-576.
Yilmaz, C. & Ergun, E. (2008). Organizational culture and firm effectiveness: An
examination of relative effects of culture traits and the balanced culture
hypothesis in an emerging economy. Journal of World Business, 43, 290–
306.

171
Yip, G. & McKern, B. (2014). "Innovation in emerging markets – the case of China".
International Journal of Emerging Markets, 9(1), 2 - 10.
Zachary, B., & Awino. (2013). Strategic Planning and Competitive Advantage of ICT
Small and Medium Enterprises in Kenya,. Business and Management
Horizons, 1(1), 191-195.
Zahra, S.A. & Sidhartha, R. D. (1993). Innovation strategy and financial performance
in manufacturing companies. An empirical analysis. Product and
Operations Management, 2(1), 15-37.
Zheng, W., Yang, B. & Mclean, G. N. (2010). Linking Organizational Culture,
Strategy and Organizational Effectiveness; Mediating Role of Knowledge
Management. Journal of Business research, 63(7), 763 - 771.
Zhou, K. Z., Yim, C. K. & Tse, D.K. (2005). The effects of strategic orientations on
technology and market based breakthrough innovations. Journal of
Marketing, 69(2), 42-60.
Zikmund, W. G., Babin, B. J., Carr, J. C., & Griffin, M. (2012). Business Research
Methods (9th ed.). New York: The Free Press.

172
APPENDICES
Appendix I: Questionnaire
Please fill in as honestly as possible. All information was treated with utmost
confidentially. There is no right or wrong answer that the researcher is looking for.
SECTION A: Personal information
1. Gender Male [ ] Female [ ]
2. Age 20 years & Below [ ] 21-30 [ ] 31-40 [ ]
41-50 [ ]51-60 [ ] 60 & above [ ]
3. Length of continuous service in the firm:
Less than 2 years [ ] 2-4 years [ ]
5-7 years [ ] over 7 years [ ]
4. Level of education:
Diploma [ ] undergraduate [ ]
Postgraduate [ ] others
specify…………………..
5. Type of manufacturing
business…………………………………………………….
6. Relationship with the enterprise
Owner manager [ ]
Employee manager [ ]
7. Number of years the enterprise has been in
existence………………………………..

173
SECTION B: Study Questions
Please tick (√) where appropriate
8. Creativity
(a) How many new products has your firm introduced in the last five years?
None [ ] 1 [ ] 2 [ ] 3 [ ] 4 and above [ ]
If none, please explain………………………………………………..
(b) In your opinion what percentage would you assign the level of creativity
in promoting performance of your firm?
1-25% [ ] 26-50% [ ] 51-75% [..] 76-100% [ ]
(c) What percentage of your budget is earmarked for creativity?
None [ ] 1-10% [ ] 11-20% [ ] 21-30% [ ]31% and above [ ]
If none please explain…………………………………………………

174
Please tick (√) where appropriate
9. How often does the firm
find new application for
products
Not at
all
rarely often Very
often
Others
specify
10. How often if the firm
involved in product
development capability
Not at
all
rarely often Very
often
Others
specify
11. How often does equip
employees with skills for
their jobs
Not at
all
rarely often Very
often
Others
specify
12. How often is the firm
involved in brainstorming
to stimulate new ideas
among employees?
Not at
all
rarely often Very
often
Others
specify
13. How often is the firm
involved Developing
teams?
Not at
all
rarely often Very
often
Others
specify
14. How often does the firm
Reward employees who
generate new product ideas?
Not at
all
rarely often Very
often
Others
specify
15. How often does the firm
Participate in outdoor
activities
Not at
all
rarely often Very
often
Others
specify
16. Organizational Structure
a) How can you characterize your organizational structure?
Functional [ ] Matrix [ ] Divisional [ ] any other
[ ]

175
b) How does decision making within unit/ department take place?
Centralized [ ] Empowerment [ ]
Please tick (√) where appropriate
17. Please specify the levels of
structures that the firm has
1 2 3 4 Others
Specify
18. How often does management
get direct information from
lower levels of employees
Not at
all
rarely often Very
often
Others
specify
19. How often are employees
included in key production
decisions
Not at
all
rarely often Very
often
Others
specify
20. How often does management
reassign duties to employees
Not at
all
rarely often Very
often
Others
specify
21. How often are employees
expected to await for
management decision before
undertaking an operation.
Not at
all
rarely often Very
often
Others
specify
22. How often does the firm use
professionals as a source of
creativity and innovation
Not at
all
rarely often Very
often
Others
specify
23. How often are professionals
incorporated in the firm‘s
activities
Not at
all
rarely often Very
often
Others
specify

176
24. Research and development
a) New opportunities in the firm are as a result of
i) Research [ ]
ii) Copying the competitor [ ]
b) What percentage (%) of your budget is assigned to R& D
1-10% [ ] 11-20% [ ] 21-30% [ ] Above 30% [ ]
Please tick (√) where appropriate
25. How often are customers
involved in generating new
product ideas?
Not at
all
Rarely often Very
often
Others
specify
26. Are customers concerns
often addressed by the firm?
Not at
all
Rarely often Very
often
Others
specify
27. How often does
management reward new
product initiatives?
Not at
all
Rarely often Very
often
Others
specify
28. Does management apportion
part of the budget for
innovative programs?
Not at
all
Rarely often Very
often
Others
specify
29. How often does the firm
source capital from
entrepreneurs?
Not at
all
Rarely often Very
often
Others
specify
30. Is capital sourced from
entrepreneurs used to
develop new products?
Not at
all
Rarely often Very
often
Others
specify

177
31. Commercialization
a) What percentage (%) of your firm‘s annual revenue is earmarked for
innovation?
Zero [ ] 2-10% [ ] 11-20% [ ] 21-30% [ ] above 30% [ ]
b) In which geographical markets did your enterprise sell products during the
last five years (2011 – 2015)?
Local [ ] National [ ] other countries [ ]
Please tick (√) where appropriate
Statement Not at
all
Rarely Often Very
often
Others
specify
32. How often is your Involved in
export trade?
33. How often does your firm
equip in-house technical
teams?
34. How often does your firm
embrace e-commerce?
35. How often does your firm
acquire external knowledge?
36. How often does your firm
utilize new ways of marketing
like digital and social media?
37. How often does your firm
Develop new sales and
distribution channels?
38. How often does your firm
adopt new ways of connecting
to customers and building
relationships

178
39. Entrepreneurial Orientation
a) As a manager please indicate the level of your risk taking
i) Calculated risk [ ]
ii) Moderate risk [ ]
iii) High risk [ ]
iv) Risk averse [ ]
Please tick (√) where appropriate
40. How many products has the
firm produced that are;
i) Not produced by other
firms
ii) Closely related to those of
other firms
0 1 2 3 4 and
above
41. How often has your firm
introduced new product lines
since its inception?
Not at
all
rarely often Very
often
Others
specify
42. Does the firm produce new
products that are designed to
provide value to new and
existing customers?
Not at
all
rarely often Very
often
Others
specify
43. How often is your firm able
to identify new
opportunities?
Not at
all
rarely often Very
often
Others
specify
44. Is your firm able to introduce
new products before
competitors?
Not at
all
rarely often Very
often
Others
specify
45. Are mistakes treated as a
normal part of trying
something new?
Not at
all
rarely often Very
often
Others
specify
46. How often does your firm
take informed risks?
Not at
all
rarely often Very
often
Others
specify

179
47. SMMEs Performance
This section has questions regarding the performance of your firm. Please respond as
appropriate.
Indicator Not at
all (2)
rarely
(3)
often
(4)
Very often (5)
Does your firm have a trend of
increasing sales from the
previous years
Does your firm sell its products
online
How often does your firm meet
its profits projections
Has the price per unit been
increasing in the last five years
How often does the firm use ROI
as a measure of the firms
performance
Do you regard ROI as a high
contributor to your forms
performance in the last five years
Kindly indicate the value of the following indicators of the firm, from 2011 to 2015
in Kes. ‗000,000‘.
Indicators 2011 2012 2013 2014 2015
Net Profit
Net Assets
Return on Investment (ROI)
Sales Turnover

180
Appendix II: Interview Schedule
Instructions
The information required herein will be treated with confidentiality and will only be
used for the purpose of this study only. You are therefore, requested to respond to the
questions more honestly and without any fear or favour.
Section I: General Information
1. Tell me more about yourself in regards to the position you hold in the firm (
let the interviewee explain him/herself on firm responsibilities)
Section II: Creativity
2. Are there creativity requirements by the employees that you feel have
implications on SMMEs performance in terms of their technological
expertise, team work and motivation requirements? If yes please identify
these requirements and their implications on SMMEs performance? ( let the
interviewee give you creativity challenges)
3. What is the manger/owner doing to address these challenges and ensure an all
creativity inclusions exercise( let the interviewee give you ongoing creativity
measures)
Section II: Organizational Structure
4. Do you think that the firm management has put in place organization structure
measures that have bad implications to SMMEs performance? If yes which
are they? (probe so that the interviewee can give more of these organizational
structure issues and the challenges they have posed to the SMMEs
performance; some of these include centralization, formalization,
professionalization)
5. What are the measures which have been put in place by the management to
address the organizational structure challenges witnessed?

181
Section III: Research & Development
6. Do you think that the firm management has put in place research and
development measures that have bad implications to SMMEs performance? If
yes which are they? ( probe so that the interviewee can give more of these
research and development issues and the challenges they have posed to the
SMMEs performance; some of these include customer participation, top
management involvement and venture capital)
7. What are the measures which have been put in place by the firm management
to address the R & D challenges identified?( are there ongoing measures
redress of the challenge)
Section IV: Commercialization
8. From previous experiences have you heard other firms complain on lack of
commercialization as a cause of the poor SMMEs performance? ( let the
interviewee cite a story on an incident that happened)
9. Are there measures which have been put in place by these firms to address the
challenges witnessed? If yes to what extent have the measures increased
uptake of available commercialization opportunities by the firms?
Section V: Entrepreneurial Orientation
1. Are there challenges encountered by your firm in terms of lack of pro-
activeness, risk-taking and innovation that affect the SMMEs performance?
2. Do you think the management is doing enough to support firms to give them
advantage edge in performance? If yes which are the ongoing policies to
address these challenges?
Thank you for your time and Cooperation

182
Appendix III Sample Size Calculation Table

183
Appendix IV: Factor loadings matrix
Indicator Components Status
1 2 3 4 5 6
How many new
products has your firm
introduced in the last five
years? 0.306
Expunged
The firm has a recent
new product idea in
which it is working on 0.097
Expunged
In your opinion what
percentage would you
assign the level of
creativity in promoting
performance of your
firm? 8.925
Retained
What percentage of
your budget is earmarked
for creativity? 7.676
Retained
How often does the
firm find new application
for products 0.214
Expunged
How often if the firm
involved in product
development capability 8.724
Retained
How often does equip
employees with skills for
their jobs 8.367
Retained
How often does the
firm use internet in its
operations 8.985
Retained
How often is the firm
involved in 7.883
Retained

184
brainstorming to
stimulate new ideas
among employees?
How often is the firm
involved Developing
teams? 8.178
Retained
How often are
employees involved if a
decision is to be made 7.320
Retained
How often does the
manager ask opinions
from employees about
how to improve customer
service in the firm 7.744
Retained
How often does the
firm Reward employees
who generate new
product ideas? 0.298
Expunged
How often does the
firm Participate in
outdoor activities 7.564
Retained
Do you think the
recognition of one‘s
performance motivates
work performance of
employees 8.123
Retained
Does the firm reward
employees for best
performance 8.704
Retained
How can you
characterize your
organizational structure? 7.012
Retained
How does decision
making within unit/
department take place? 7.218
Retained

185
Employees are always
expected to abide by laid
down procedures 0.053
Expunged
Do you encourage an
employee who wants to
make his/her own
decisions in the firm 0.185
Expunged
How often does
management get direct
information from lower
levels of employees 8.995
Retained
How often are
employees included in
key innovation decisions 8.522
Retained
Do most decisions
made by employees in
the firm have to have
their supervisors‘
approval 7.700
Retained
How often does
management reassign
duties to employees 0.236
Expunged
How often are
employees expected to
await for management
decision before
undertaking an operation 8.099
Retained
How often are written
job descriptions
formulated at various
levels 8.598
Retained
How often do rules and
procedures occupy a
central place in the
organization 8.934
Retained

186
How often does the
firm use professionals as
a source of creativity and
innovation 7.109
Retained
How often are
professionals
incorporated in the firm‘s
activities 7.099
Retained
How often do top
managers and technical
staff possess high
education levels and
specialised training 7.982
Retained
Do top managers and
technical staff have
professional skills 8.950
Retained
New opportunities in
the firm are as a result of
0.034
Expunged
The firm has a
department or a special
unit for R&D
0.056
Expunged
What percentage (%) of
your budget is assigned
to R& D
8.260
Retained
How often are
customers involved in
generating new product
ideas?
0.374
Expunged
Are customers
concerns often addressed
by the firm?
7.515
Retained
How often are
customers input directly
influence the firms‘
decision?
7.219
Retained

187
How often does the
firm modify a product
when it finds that the
customers would like the
firm to do so?
8.204
Retained
How often does
management reward new
product initiatives?
7.476
Retained
Does management
apportion part of the
budget for innovative
programs?
7.024
Retained
How often does
management offer
training programs to
prepare employees to
offer high quality
customer service
7.610
Retained
How often are
employees trained to
handle the introduction
of new products and
services
8.600
Retained
How often does the
firm source capital from
entrepreneurs?
0.343
Expunged
Is capital sourced from
entrepreneurs used to
develop new products?
8.587
Retained
How often are
innovating firms likely to
be financed by venture
capitalists
7.869
Retained
How often are venture
based firms faster in
7.294
Retained

188
bringing their products to
the market
What percentage(%) of
your firm‘s annual
revenue is earmarked for
innovation?
8.861
Retained
In which geographical
markets did your
enterprise sell products
during the last five years
(2011 – 2015)?
7.278
Retained
Which form of
innovation has your firm
done in the past 5 years
8.580
Retained
How often is your firm
involved in export trade?
8.736
Retained
How often does your
firm equip in-house
technical teams?
0.238
Expunged
How often does your
firm embrace e-
commerce?
7.496
Retained
How often does your
firm enter new markets
or increase current
market share?
8.626
Retained
How often does your
firm acquire external
knowledge?
8.157
Retained
How often does your
firm utilize new ways of
marketing like digital
and social media?
7.816
Retained
How often does your
firm use a website to
8.335
Retained

189
promote its product
Does the firm use
electronic data
interchanged based
solution
8.693
Retained
How often does your
firm Develop new sales
and distribution
channels?
0.250
Expunged
How often does your
firm adopt new ways of
connecting to customers
and building
relationships?
8.314
Retained
The product the firm
markets depend on real
market needs
7.854
Retained
The marketing
personnel in the firm
spend time discussing
customers future needs
with other functional
department
8.170
Retained
Does your firm
benchmark with others in
the same industry?
-0.014
Expunged
If you take a risk and
fail are you punished by
the organization?
-0.293
Retained
Does your organization
create partnerships with
the best partners in the
industry before
competitors enlist them?
7.341
Retained
As a manager please
8.276
Retained

190
indicate the level of your
risk taking
How many products
has the firm produced
that are; Not produced by
other firms
8.650
Retained
How many products
has the firm produced
that are; closely related
to those from other firms
8.008
Retained
How often has your
firm introduced new
product lines since its
inception?
0.204
Expunged
Does the firm produce
new products that are
designed to provide
value to new and existing
customers?
0.397
Expunged
How often has your
business processes gone
through changes in the
last 5 years
8.365
Retained
How often is your firm
able to identify new
opportunities?
7.533
Retained
Is your firm able to
introduce new products
before competitors?
7.889
Retained
Does your firm beat
competitors to enter new
markets
8.171
Retained
Does your firm
improve the quality or
the number of features of
7.291
Retained

191
its products or services
before its competitors
Are mistakes treated as
a normal part of trying
something new?
8.736
Retained
How often does your
firm take informed risks?
8.167
Retained
How often is risk
taking encouraged in the
firm
7.183
Retained
Does your firm take the
risk of missing an
opportunity with the
same weight as the risk
of failure
7.133
Retained
How many people are
employed in your
organization?
8.082 Retained
What is your average
turnover in KES
‗000,000?
7.877 Retained
Net Profit
0.886 Retained
Net Assets
0.717 Retained
Return on Investment
(ROI)
0.748 Retained
Sales Turnover
0.904 Retained
Does your firm have a
trend of increasing sales
from the previous years
-0.525 Retained
Does your firm sell its
products online
0.039 Expunged
How often does your
firm meet its profits
projections
-0.678 Retained
Has the price per unit
0.755 Retained

192
been increasing in the
last five years
How often does the
firm use ROI as a
measure of the firms
performance
-0.554 Retained
Do you regard ROI as a
high contributor to your
forms performance in the
last five years
-0.485 Retained

193
Appendix V: Durbin Watson Tables
Critical Values for the Durbin-Watson Test: 5% Significance Level
T=200,210,220,...,500, K=2 to 21
K includes intercept
T K dL dU T K dL dU T K dL dU
200 2 1.75844 1.77852 210 10 1.6855 1.86394 220 18 1.61562 1.9471
200 3 1.74833 1.78871 210 11 1.67532 1.87445 220 19 1.60547 1.95776
200 4 1.73815 1.79901 210 12 1.66508 1.88505 220 20 1.59527 1.96852
200 5 1.72789 1.80942 210 13 1.65478 1.89574 220 21 1.58503 1.97935
200 6 1.71755 1.81994 210 14 1.64441 1.90653 230 2 1.77525 1.7927
200 7 1.70713 1.83057 210 15 1.63398 1.91742 230 3 1.76647 1.80154
200 8 1.69663 1.84133 210 16 1.62348 1.92839 230 4 1.75763 1.81045
200 9 1.68607 1.85219 210 17 1.61293 1.93947 230 5 1.74873 1.81945
200 10 1.67543 1.86316 210 18 1.60232 1.95063 230 6 1.73977 1.82854
200 11 1.66471 1.87423 210 19 1.59165 1.96188 230 7 1.73075 1.83771
200 12 1.65394 1.88541 210 20 1.58094 1.97323 230 8 1.72168 1.84697
200 13 1.64308 1.89671 210 21 1.57015 1.98467 230 9 1.71254 1.85632
200 14 1.63216 1.9081 220 2 1.77003 1.78829 230 10 1.70335 1.86574
200 15 1.62117 1.91961 220 3 1.76086 1.79753 230 11 1.6941 1.87524
200 16 1.61011 1.93122 220 4 1.75161 1.80686 230 12 1.68479 1.88483
200 17 1.599 1.94292 220 5 1.74229 1.81628 230 13 1.67544 1.8945
200 18 1.58781 1.95473 220 6 1.73292 1.82581 230 14 1.66602 1.90424
200 19 1.57657 1.96665 220 7 1.72348 1.83543 230 15 1.65655 1.91407
200 20 1.56527 1.97865 220 8 1.71398 1.84513 230 16 1.64703 1.92398
200 21 1.5539 1.99075 220 9 1.70441 1.85492 230 17 1.63746 1.93397
210 2 1.76445 1.78358 220 10 1.69477 1.86482 230 18 1.62784 1.94403
210 3 1.75483 1.79326 220 11 1.68509 1.87479 230 19 1.61816 1.95417
210 4 1.74513 1.80305 220 12 1.67533 1.88486 230 20 1.60844 1.96439
210 5 1.73537 1.81295 220 13 1.66552 1.89502 230 21 1.59868 1.97467
210 6 1.72554 1.82294 220 14 1.65566 1.90526 240 2 1.78012 1.79685
210 7 1.71563 1.83305 220 15 1.64573 1.91559 240 3 1.77171 1.8053
210 8 1.70566 1.84325 220 16 1.63575 1.92601 240 4 1.76325 1.81384
210 9 1.69561 1.85355 220 17 1.62571 1.93651 240 5 1.75473 1.82246

194
Appendix VI: Small and Medium Manufacturing Firms (List of 2017)Building,
Mining and Construction Industry
ARM Cement Ltd
Bamburi Cement Ltd
Buyuna Building Materials
Central glass industries
East Africa Portland cement
Flamingo tiles (Kenya ltd)
Glewn investment ltd
International energy Techn Ltd
Kenbro industries Ltd
Kenya Builders and Concrete
ltd
Manson hart Kenya ltd
Orbit enterprises ltd
Reliable concrete works ltd
Sat ceramic ltd
Savanna cement ltd
Space and style ltd
Tile and carpet centre
Virji vishram patel and sons
Valrem construction
CHEMICAL AND ALLIED
SECTOR
Anfi Kenya Ltd
Basco products (k) Ltd
Bayer east Africa Ltd
Betersdorf East Afriaca Ltd
Blue Ring Products Ltd
Boc Kenya Ltd
Buyline Industries Ltd
Canon Chemicals Ltd
Carbacid (K) Ltd
Chemicals and Solvent
Chrysal Africa Ltd
Continental products
Cooper K-brands Ltd
Crown gases Ltd
Crown paints (kenya) Ltd
Danfords industries Ltd
Decase chemicals industries ltd
Deluxe inks ltd
Desbro Kenya ltd
Doric industries
Elex products ltd
Galaxy paints and coating ltd
Grand paints ltd
Haco tiger brand (EA) ltd
Henkel Kenya ltd
Henlez polymer
Hi- tech ink and coating ltd
Inter consumer products
Johnson diversey east Africa
ltd
Kamili Packers ltd
Kel chemicals ltd
Kenya nat Ink & chemicals ltd
Kip melamine co. ltd
Kridha ltd
Leatherlife (EPZ) ltd
Oreal east Africa ltd
Maroo polymers ltd
Match masters ltd
Mea ltd
Metoxide Africa ltd
Murphy chemicals ltd
Odex chemicals ltd
Orbit chemicals ltd
Osho Chemicals ltd
Rolychem east Africa
Procter and gamble
PZ cussons EA ltd
Reckitt benckiser (EA) ltd
Rock industries ltd

195
Rutuba bio agri & organic
fertilizers Co. ltd
Sadolin paints (EA) ltd
Saweco paints ltd
Soilex prosolve ltd
Strategic industries ltd
Super brite ltd
Superform ltd
Syngenta east Africa ltd
Synresins ltd
Tri- clover industries ltd
Tropical Brand (Africa)ltd
Twiga chemicals industries ltd
Unilever east Africa ltd
Vitafoam products ltd
Waridi creations ltd
West minister paints and resins
ltd
ENERGY, ELECTRICALS
AND ELECTRONICS SECTOR
Amedo centre Kenya ltd
Asano international ltd
Assa abloy east Africa ltd
Aucma digital technology
Avery east Africa ltd
Bauman engineering ltd
Centurion systems ltd
Digitech east Africa ltd
East african cables ltd
Farm refrigeration and
electrical systems ltd
Holman brothers (E.A)ltd
Ibera Africa power (E.A) ltd
International energy technik td
Kenwest cables ltd
Libya oil Kenya ltd
Manufacturers and supplies (k)
ltd
Metlex international ltd
Marshall Fowler engineers ltd
Nationalwide chemicals
industries ltd
Optimum lubricants ltd
Ouru power ltd
Power technics ltd
Powered lubricants
Roka industries
Scales and software (k) ltd
Socabelec (E.A) ltd
Sollatek electronics (k) ltd
Solmpex africa ltd
Synergy lubricants solutions
Ubbink east Africa
Vivo energy Kenya ltd
FRESH PRODUCE
Acqiza development co ltd
Avoken ltd
From eden
Kankam Exporters ltd
Mahee flowers
Maridadi flowers
Rainforest farmland Kenya ltd
Sunland Roses ltd
FOOD AND BEVERAGES
Africa Spirits ltd
Agriner agricultural
development
Agripro –pak ltd
Al mahra industries
Al phine foods ltd
Alpine coolers ltd
Aquamist ltd
Bakers corner ltd
Belat enterprises
Belfast Millers ltd
Beverage services Kenya ltd
Bidco Africa ltd
Bio food products ltd
Buwty ltd
The breakfast cereal co ltd
British American tobacco
Kenya ltd
Broadway bakery ltd
Brookside dairy ltd

196
C. Dormans ltd
C. Czarnikow sugar east Africa
ltd
Cadbury Kenya ltd
Candy Kenya ltd
Capwell industries ltd
Cewtrofood industries ltd
Chrag Kenya ltd
Cocacola East and central
Africa ltd
Coffe agriworks ltd
Deeper industries
Europack industries ltd
Excel Chemicals ltd
Farmers‘ choice ltd
Glaciersproducts
Global fresh ltd
Gonas best ltd
Green forest food td
Heritage foods Kenya ltd
Highland canners ltd
Insta products (ep z) ltd
Jambo biscuits (k) ltd
Jetlak Foods ltd
Kamili Packers ltd
Ka oil refineries
Kenafric bakery
Kanafric industries ltd
Kewblest ltd
Kenchic ltd
Kaetaste products
Kenya breweries ltd
Kenya sweet ltd
Kenya wine agencies
Kesian Kenya ltd
Koba waters ltd
Kuguru food complex
Kwality candles and sweets
London distillers (k) ltd
Manji food industries
Mastermind tobacco (k) ltd
Mayfeeds kenyaltd
Melvinmash intrnational
Minibakeries Nairobi
Maritini Kenya ltd
Njengo ltd
Nairobi Bottlers ltd
New Kenya co-operative
creameries ltd
Nestle food Kenya ltd
Norda industries ltd
Nutro manufacturers EPZ ltd
Palmhouse Diaries LTD
Patco industries ltd
Pernod Richard Kenya ltd
Pearl industries ltd
Pembe flour mills ltd
Premier flour mills ltd &
premier food ltd
Pristine international ltd
Proctor & Allan (E.A) ltd
Prom Asidor kennya ltd
Rafiki Millers ltd
Razco ltd
Re-sun spices ltd
Salim wazarani Kenya ltd
Sameer agriculture and
livestock Kenya ltd
SBC Kenya ltd
Sigma supplies ltd
Spice world ltd
Sunny processors
Tru foods ltd
Trust feeds ltd
Trust flavor millsltd
Umoja flour mills
Unga group ltd
United distillers and vintners
Value pak foods
Vinepak foods
Wanji food industries
Wrigley Company (E.A) LTD
LEATHEER AND FOOTWEAR
Alpharama Ltd

197
Arthi River Ltd
Bata Shoe Company
(Kenya)Ltd
Budget Shoes Ltd
C & P shoe industries
Leather industries Kenya ltd
Sandstorm Africa ltd
Zingo investment
METAL AND ALLIED SECTOR
Agro Irrigation and pump
Allied east Africa ltd
Alloy steel casting ltd
Apex steel ltd
Arvind engineering
Asl ltd stee division
Asp company ltd
Ashut engineers ltd
Arthi river steel plant ltd
Blue nile wires ltd
Boothi extractions ltd
City ingineering works ltd
Crystal industries ltd
Davis &shirtliff ltd
Devki stee mills
Dushi enterprises
East Africa Spectre ltd
East Africa foundry works
East Africa Glass Wear Mart
ltd
Easy Coach East Africa Ltd
Elite tolls ltd
Fine Engineerring
Friendship container
manufacturing ltd
General aluminum fabricators
ltd
Harveer bas body Builders ltd
Hobra manufacturing ltd
Insteel ltd
Iron art ltd
Kaluworks ltd
Ken metal industries
Mabati rolling mills
Load trailers
Kenya coach industries
Kenya grange vehicle
industries ltd
King bird (k) ltd
King finn kenya
Mann manufacturing co. ltd
Master fabricaters ltd
Megh cushion industries ltd
Motorbike Africa ltd
Mutsimoto company ltd
Pipe Manufacturers ltd
R.T (east africa) ltd
Scania east Africa ltd
Sohansons ltd
Songyi motorcycles
international ltd
Soroya motor spares
Theevan Enterprises ltd
Toyota Kenya ltd
Toyota tshusho east Africa ltd
PAPER AND BOARD
Associated paper and stationery
ltd
Autolihyoltd
Bag and envelop converters
Bag and envelop manufacturers
(k) ltd
Belsize industries ltd
Brand printers ltd
Carton Manufacturers ltd
Cempack solutions ltd
Chandaria industries ltd
Colour labels ltd
Colour packaging ltd
Adpak international ltd
Allpack industries ltd
P.L Patel press Kenya
Dodhia packaging ltd
Dune packaging ltd

198
East africa Packaging
Industries
Economic Industries ltd
Elite offset ltd
Ellams products
English press ltd
Essential Manufacturing
Euro packaging ltd
Flora Printers ltd
Fortune printers and
stationeries ltd
Fransiscan Kolbe press
General Printers ltd
Graphics and allied ltd
IconPprinters ltd
International papers & and
board suppliers ltd
Juja pulp and paper ltd
Kartasi industries
Kenafric diaries Manufacturers
ltd
Kenya litho ltd
Kenya paper mill
Kenya stationery ltd
Kim – fay east africa
Kql graphics ltd
L.a.b international Kenya ltd
Label converters ltd
Manipal international printing
press ltd
Mfi Ultra print ltd
Modern lithographic (k) ltd
Mufundi paper ltd
Palmy enterprises
Paper House of Kenya ltd
Paperbags ltd
Pressmaster ltd
Printpak multipackaging
Printwell industries
Punchline ltd
Rayco printing works
Regal press Kenya
Sintel security print solutions
Stallion stationery
Manufacturers ltd
Startpack industries ltd
Tetra pak ltd
The rodwell press ltd
Twiga stationery and printers
ltd
United Bags Manufacturers ltd
Vakharia international
papermills ltd
PHARMACEUTICAL AND
MEDICAL EQUIPMENT
SECTOR
African cotton industries
Alfa medical Manufacturers ltd
Autosterile ltd
Benmed pharmaceuticals ltd
Beta health care international
ltd
Biodeal laboratories ltd
Biopharma ltd
Cosmos ltd
Dawa ltd
Elys chemicall industries ltd
Glaxo smithkline kenya ltd
Global Merchants ltd
Labaratory and allied ltd
Manhar Brothers (k)ltd
Medivet products ltd
Novelty manufactures ltd
Osschemie (k)ltd
Pharmaccess africa ltd
Pharmaceutical manufacturing
co(k)ltd
Questa care ltd
Regal pharmaceuticals ltd
Scales and soft ware‘s (k)ltd
Skylight chemicals ltd
Lain pharmaceutical ltd
PLASTICS & RUBBER
SECTOR

199
Acme containers ltd
Afro plastics (k) ltd
Bluesky industries ltd
Betetrad (k) ltd
Bobmil industries ltd
Brush manufactures ltd
Cables and plastics ltd
Canaaneast company ltd
Complast industries ltd
Coniny indutries ltd
Cocorico investment ltd
Darshan plastics ltd
Dynaplas ltd
Elgiread (kenya) ltd
Elgon kenya ltd
Eslon platic of kenya ltd
Five styar industries ltd
Flar kenya ltd
Foam mattress
General platics ltd
Hi.plast ltd
Jamlam indusrtries ltd
Jumbo chem
Kenpoly manufactures ltd
Kentainers ltd
Kinpash enterprices ltd
27 .l.g harris &co ltd
Lakhir plastics ltd
Laneeb platic industries ltd
Malplat industries
Metroplat indutries ltd
Nairobi plastic ltd
Ombi rubber roller ltd
Platics electricons
Plastic and rubber industries ltd
Polyflex industry ltd
Polythene indutries ltd
Princeware africa (k)ltd
Prosel ltd
Rubber product ltd
Safepak ltd
Sanpak africa ltd
Signode Packaging systems ltd
Singh retread ltd
Pringbox kenya ltd
Super manufactures ltd
Tech pak industries ltd
Thermopak ltd
Top pak ltd
Treadsetters types ltd
Uniplastics ltd
Vectus kenya ltd
Wonderpac indutries ltd
TEXTILE & APPARELLS
All Tex Epz Ltd
Alph Knits Ltd
Force Equipment Ltd
Global Apparels Kenya Ltd
Kema (EA) Ltd
Kenwear Garments
Manufacturers
Kenya Tents Ltd
Kenya Trading (EPZ) Ltd
Kikoy Co Ltd
Nidco Textiles
Newwide Garment (K) Ltd
Royal Garment Indutriies Ltd
Spin Knit Ltd
Spinners & Spinners Ltd
Sunflag Textiles And Knitwear
Miles Ltd
Tarpo Industries Ltd
Thika Cloth Mills Ltd
Ts Spinning And Weaving Ltd
Vatas Manufacturers Ltd
Future Garment (Epz) Ltd
TIMBER, WOOD &
FURNITURE
Fine Wood Works Ltd
Furniture Internation Ltd
Kenya Wood Ltd
Newline Ltd
Ned Inerior Dewrators Ltd
Panesar‘s Kenya Ltd

200
PG Bison (K) Ltd
Rosewood Funiture
Manufacturers Ltd
Shah Timber Mart Ltd
Shamco Industries Ltd
Tim Sales Ltd
Woodmakers Ltd
Wood Tex Kenya
Copyright © 2022 FDOKUMEN