Linking energy efficiency and innovation practices - IRIS ...
17
Linking energy efficiency and innovation practices: Empirical evidence from the foundry sector Enrico Cagno a,n , Andres Ramirez-Portilla a,b , Andrea Trianni a a Politecnico di Milano, Department of Management, Economics and Industrial Engineering, Piazza Leonardo da Vinci 32, 20133 Milan, Italy b KTH Royal Institute of Technology, Department of Industrial Economics and Management, Lindstedsvägen 30, 10044 Stockholm, Sweden Received 29 June 2014 Received in revised form 4 February 2015 Accepted 24 February 2015 Available online 5 March 2015 1. Introduction According to the European Council for an Energy Efficient Economy, since the 1970s, energy efficiency has contributed more to European economic prosperity than any other single source of energy supply (ECEEE, 2014). This fact indicates that proper po- licies focusing on energy sustainability and energy efficiency tar- gets are of vital importance for society, governments, and industry. Conversely, industry involvement is a keystone to achieving these targets because it is responsible for a considerable share of the final energy consumption in society. For instance, in the EU alone, industry accounts for 26% of the final energy consumption (Eur- opean Commission, 2013a). Nevertheless, industry involvement is often inhibited by the existence of market failures and barriers Abbreviations: AE, association expert; BEE, barrier to energy efficiency; BEE-H, high level of barriers to energy efficiency; BEE-L, low level of barriers to energy efficiency; BAT, best available technology; BAT-H, high level of adoption of best available technologies; BAT-L, low level of adoption of best available technologies; EEI, energy efficiency indicator; EM, energy manager; INB, inbound Open Innova- tion; IP, intellectual property; IRD, internal R&D; OI, Open Innovation; OUT, out- bound Open Innovation; SEC, specific energy consumption; SEC-H, high level of performance in specific energy consumption i.e. more energy efficient; SEC-L, low level of performance in specific energy consumption i.e. less energy efficient; SME, small- and medium-sized enterprise n Corresponding author. E-mail addresses: [email protected] (E. Cagno), [email protected] (A. Ramirez-Portilla), [email protected] (A. Trianni).
-
Upload
khangminh22 -
Category
Documents
-
view
3 -
download
0
Transcript of Linking energy efficiency and innovation practices - IRIS ...

Abbrehigh levefficiencavailablEEI, enetion; IPbound Operformlevel ofsmall- a
n CorrE-m
andres.randrea.
Linking energy efficiency and innovation practices: Empirical evidencefrom the foundry sector
Enrico Cagno a,n, Andres Ramirez-Portilla a,b, Andrea Trianni a
a Politecnico di Milano, Department of Management, Economics and Industrial Engineering, Piazza Leonardo da Vinci 32, 20133 Milan, Italyb KTH Royal Institute of Technology, Department of Industrial Economics and Management, Lindstedsvägen 30, 10044 Stockholm, Sweden
Received 29 June 2014 Received in revised form4 February 2015Accepted 24 February 2015 Available online 5 March 2015
viations: AE, association expert; BEE, barrierel of barriers to energy efficiency; BEE-L, lowy; BAT, best available technology; BAT-H, hige technologies; BAT-L, low level of adoption orgy efficiency indicator; EM, energy manager, intellectual property; IRD, internal R&D; OI,pen Innovation; SEC, specific energy consumance in specific energy consumption i.e. morperformance in specific energy consumptionnd medium-sized enterpriseesponding author.ail addresses: [email protected] (E. [email protected] (A. [email protected] (A. Trianni).
to energy efficiency; BEE-H,level of barriers to energyh level of adoption of bestf best available technologies;; INB, inbound Open Innova-Open Innovation; OUT, out-ption; SEC-H, high level ofe energy efficient; SEC-L, lowi.e. less energy efficient; SME,
),tilla),
1. Introduction
According to the European Council for an Energy Efficient Economy, since the 1970s, energy efficiency has contributed more to European economic prosperity than any other single source of energy supply (ECEEE, 2014). This fact indicates that proper po-licies focusing on energy sustainability and energy efficiency tar-gets are of vital importance for society, governments, and industry. Conversely, industry involvement is a keystone to achieving these targets because it is responsible for a considerable share of the final energy consumption in society. For instance, in the EU alone, industry accounts for 26% of the final energy consumption (Eur-opean Commission, 2013a). Nevertheless, industry involvement is often inhibited by the existence of market failures and barriers
that drive the intervention of public policies and initiatives (Brown, 2001). Therefore, it seems that to encourage better en-gagement of the industrial sector towards achieving higher energy efficiency, it is necessary to promote additional initiatives that help decrease these barriers but, at the same time, drive compe-titiveness and growth in firms. One possible option could be fo-cusing on innovation, first, because promoting innovation and R&D rather than energy efficiency per se is likely to be an especially effective way of improving efficiency (Reddy, 1991), and second, because innovation is an initiative that, together with energy-re-lated efforts, has been notably included in the agendas of firms and governments in the last decade.
A clear example is the Europe 2020 strategy (European Com-mission, 2010), a central guideline for European Union growth in which two of the key targets translate into flagship initiatives such as promoting R&D and energy efficiency (European Commission, 2013b). Despite this type of policy helping firms to realise the need for both, driving profitable growth through innovation and being environmentally sustainable (Smith et al., 2010), there has been little discussion about understanding the impact of innovation practices on energy efficiency. Addressing this gap is of paramount importance because traditional literature has overlooked the op-portunity to use interdisciplinary approaches to propose how to foster more innovative and energy-efficient firms. Even more, this is particularly relevant for firms operating in energy-intensive sectors with moderate level of innovation, such as foundries, where energy efficiency is strictly related to industrial and com-pany performance.
Thus, to empirically explore the link between innovation practices and energy efficiency, we borrow the idea of Open In-novation (Chesbrough, 2003) to measure the innovativeness of a firm in terms of its innovation practices, rather than focusing on product, process, or service innovation. Open Innovation (OI) is a model for managing innovation based on leveraging the firm's R&D through the purposive inflows and outflows of knowledge to accelerate internal innovation (the inbound process) and to ex-pand the markets for external use of innovation (the outbound process) (Chesbrough et al., 2006). One advantage of this model is encompassing, connecting and integrating of internal R&D with other existing innovation activities and previous innovation the-ories (Huizingh, 2011). In addition, evidence shows that OI can help organisations, including small- and medium-sized en-terprises (SMEs), innovate, even with limited resources and mar-ket reach (Brunswicker and Ehrenmann, 2013; Van de Vrande et al., 2009; Xiaobao et al., 2013). We then explore a possible link between innovation practices and energy efficiency under the premise that because OI can support the introduction of new technologies to a firm (West and Bogers, 2013), it could also support the addition of the best energy-efficient technologies. Consequently, this paper explores whether the combination of internal R&D with Open Innovation practices is beneficial to firms in terms of energy efficiency, measured by three different indicators.
To accomplish this task, being this a first and exploratory at-tempt, a multiple case study was conducted with 30 foundries located in Northern Italy producing four different types of alloys: aluminium, steel, grey cast iron and ductile cast iron. Through a self-reported questionnaire, we estimated six main indicators. On one side, we evaluated the firms' innovation level through the adoption of practices related to internal R&D (IRD), inbound Open Innovation (INB), and outbound Open Innovation (OUT). On the other side, we measured three different but related energy effi-ciency indicators (EEIs), namely the firms' specific energy con-sumption (SEC), the adoption of energy-efficient best available technologies (BATs), and the perception of barriers to energy ef-ficiency (BEEs). Based on these variables, we analysed the impact
of combining different innovation practices on foundries' effi-ciency levels as measured by the three EEIs. In particular, each indicator allowed us to examine the effect between different levels of adoption of innovation activities and (i) a common and objec-tive measure of energy efficiency, i.e., SEC; (ii) the viewpoint of technology adoption as a direct enabler of energy efficiency, i.e., BATs; and (iii) considering perceived obstacles on the decision-making process acting on energy efficiency, i.e., BEEs. Moreover, we examined the relationship between the three EEIs to provide further evidence of innovation practices as an enabler of energy efficiency.
The rest of the paper is organised as follows. Section 2 reviews major literature on the concepts and measurement of Open In-novation and industrial energy efficiency, together with a sug-gestion of their link and the study framework. Section 3 explains the research method. Section 4 shows and discusses the main results of our analysis. Section 5 provides conclusions of this study with potential policy implications, limitations, and opportunities for future research.
2. Combining innovation and energy efficiency
Historically, people have used innovation as a way to increase efficiency in energy-related applications, with several well-known examples in the industrial sector (see, e.g., Geels, 2002). These events indicate that continuous innovation, R&D, the development of new technologies, and other types of innovation practices could have a direct effect on energy efficiency and industrial perfor-mance. Although literature combining innovation practices and energy efficiency is scarce, a few previous studies have provided some initial indications for understanding the relationship be-tween these two concepts.
One of these first studies was from Lutzenhiser (1994), who investigated industrial energy efficiency with a model derived from social sciences literature on technology and organisational change. This model proposed the role of organisational networks in shaping and constraining innovation, and the topic was studied using data on barriers to energy efficiency in the US industry. Another interesting study revealing energy efficiency as an out-come of using a different innovation perspective was conducted by Christensen et al. (2005). Although the main purpose of their study was investigating the industrial dynamics of OI, their ana-lysis provided some hints about the connection between industrial innovation and energy efficiency. More specifically, his in-depth case study revealed that in the consumer electronics innovation system, open and collaborative innovation was needed to achieve better energy efficiency performance in audio amplifiers, which later created a new technological regime.
Following the Open Innovation research trend observed in the last decade, Hakkim and Heidrick (2008) used the OI model to explore the energy sector in Canada. Although this study was useful for advancing the role of OI in the energy sector, it did not provide insights about the relationship between innovation prac-tices and energy efficiency performance. To the best of our knowledge, the only recent study that has proposed to understand the role of innovation in energy efficiency was done by Trianni et al. (2013b). This study examined how some innovation factors may affect the adoption of energy-efficient technologies in energy-intensive industries based on the barriers affecting the adoption of such technologies. This study provided valuable evidence on the role of market, product, and process innovativeness in the adop-tion of energy-efficient technologies; however, the study did not focus on the different types of collaborative innovation practices used currently by many firms. Thus, a different perspective for evaluating the role of present innovation practices and processes
within firms could provide complementary results.Indeed, there is a vast range of perspectives and models that
have been proposed to describe the way in which firms innovate. However, choosing one of these models does not necessarily mean that it is better than the others, only that it could be more con-venient for firms' current practices. Seeing that current stronger global competition has created greater knowledge sharing and collaboration in the innovation processes in firms (Gassmann, 2006), using the OI model could be an appropriate option to manage innovation. The main idea of the OI model (Chesbrough, 2003) is that the innovation processes of a firm need to be opened outside its boundaries to enable innovation to move more easily between the external environment and the internal R&D pro-cesses. Likewise, the model assumes that not all knowledge and ideas will come from inside the firm and not all ideas will be successfully marketed internally (Chesbrough and Crowther, 2006).
Although previous innovation models have proposed similar ideas on the use of external knowledge by firms, the OI model has some notable differences. An interesting example is Kline and Rosenberg's (1986) ‘chain-linked model’, which depicts the in-novation process inside a firm where the innovator occasionally takes ideas from a common pool of knowledge to try to solve an internal design problem. However, in OI, the knowledge can come from different actors who can help the firm not only explore new knowledge but also exploit it. This exploitation usually takes the form of the commercialisation of an unused innovation to expand the market or create new ones (Chesbrough et al., 2006). This highlights the difference that in the chain-linked model, as in other models, innovation materialises only if a market already exists for it, whereas in OI, a market-push strategy is not needed to profit from innovations. In addition, the use of external actors for innovation could also resemble models, such as collaborative R&D networks where universities, large companies, and government labs build links to create and enforce intellectual property (IP) rights (Wen and Kobayashi, 2001). However, the use of several actors in the OI model has wider applicability because it is also useful for small firms, where formal protection methods to capture value, e.g., IP rights such as patents, are less feasible (De Backer and Cervantes, 2008; Huizingh, 2011).
Other comparisons could be possible, but the main idea here is that the essence of OI, and thus one key difference with other innovation models, is that it connects the processes of acquiring external knowledge and exploiting internal knowledge externally. Although OI novelty has been questioned for being conceived using previous theories, the reality is that currently, in terms of innovation management, it is considered ‘the umbrella that en-compasses, connects, and integrates a range of already existing activities’ (Huizingh, 2011; p. 3). Researchers of OI have acknowl-edged that this concept uses traditional management ideas such as absorptive capacity (Cohen and Levinthal, 1990), exploration ver-sus exploitation (March, 1991), and complementary assets (Teece, 1986) but also that OI represents modern innovation practices by firms (Van der Meer, 2007). Hence, a common way to oper-ationalise OI is through different types of activities, mainly
Innovation practices
Internal R&D
Open Innovation
InboundOutbound
Fig. 1. The conceptu
grouped as Inbound and Outbound (Gassmann and Enkel, 2004).The adoption of these practices does not imply that a firm
should stop its established internal innovation process (Huizingh, 2011); instead, OI suggests that internal R&D should be com-plemented and leveraged with other sources of technology and knowledge (Schroll and Mild, 2012). However, before a firm can look for innovative solutions and technologies outside its organi-sational boundaries, it must have a strong R&D capacity (Veu-gelers, 1997; Xiaobao et al., 2013). Weak internal R&D (IRD) would be an obstacle for a firm towards being innovative even with the support of external sources of knowledge (Negassi, 2004); there-fore, IRD is a key element in Open Innovation (Xiaobao et al., 2013). Moreover, many recent studies have shown that OI as-sumptions are also valid for contexts such as medium-tech man-ufacturing SMEs in mature industries, including the automotive industry (see, e.g., Brunswicker and Ehrenmann, 2013; Chiaroni et al., 2010; De Massis et al., 2012; Ili et al., 2010; Lazzarotti et al., 2010, 2011; Van de Vrande et al., 2009; Xiaobao et al., 2013). Certainly, some challenges exist when adopting OI, such as ob-jectively measuring its impact on firms due to the lack of a widely accepted indicator to proxy OI (De Backer and Cervantes, 2008). However, researchers seem to agree that OI can be evaluated through scales for each OI practice (Cheng and Huizingh, 2014), by the type and number of activities and collaborations (Laursen and Salter, 2006) or with a mix of them to understand the level of openness in a firm (Dahlander and Gann, 2010).
Regarding the level of energy efficiency in a firm, a similar approach can be used because energy efficiency implies several different indicators (Patterson, 1996). One of these indicators could be the assessment of energy efficiency measures (Fleiter et al., 2012a), such as the most efficient technology or new process-specific technologies in a firm (Trianni et al., 2013a). The practice of comparing and adopting these innovations and technologies, including the BATs in an industry, can improve the firm's overall energy efficiency performance (Norup and Taylor, 2005; The In-stitute for Industrial Productivity, 2013a). Similarly, the im-plementation of BATs by a firm relates directly to the existing barriers that may inhibit investments in these energy-efficient technologies and consequently limit industrial energy efficiency (Sorrell et al., 2000; Trianni et al., 2013c). Thus, the perception of the barriers that a firm could have can also be used as a com-plementary indicator of its level of energy efficiency (Cagno et al., 2013). This idea has been recently studied with large firms in the foundry sector (Trianni et al., 2013a) but also with SMEs (Cagno and Trianni, 2012; Trianni and Cagno, 2012).
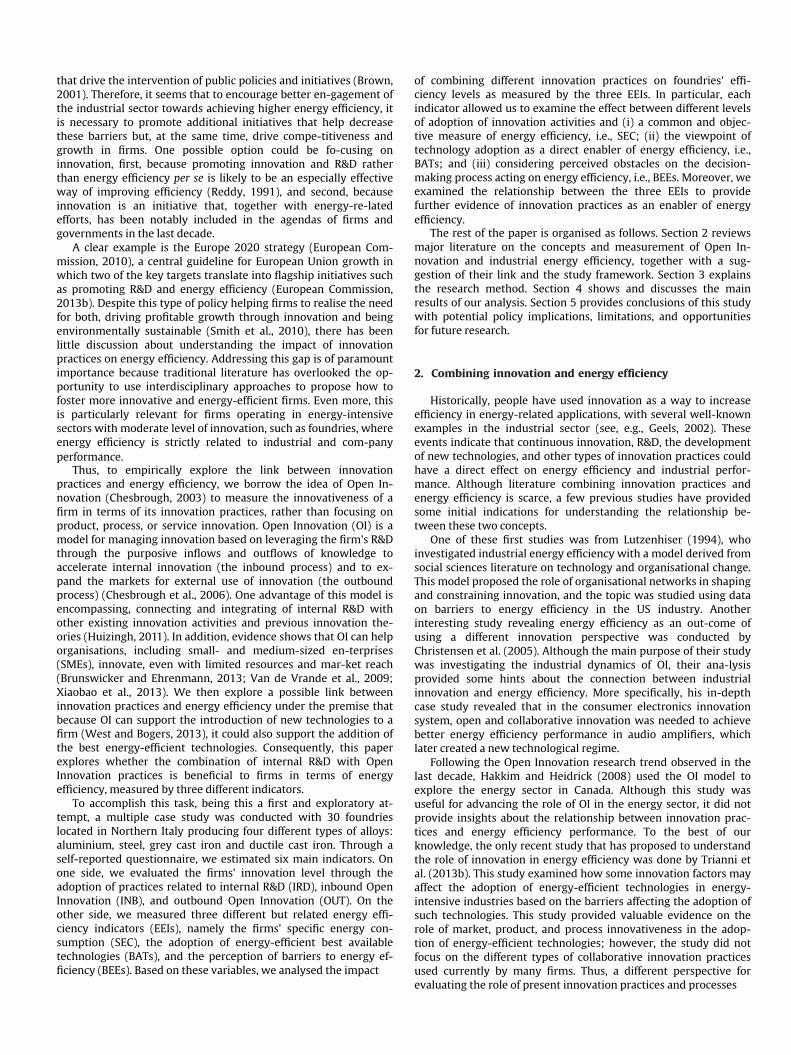
Considering the aforementioned ideas, Fig. 1 depicts how they all relate in our study. In this framework, linking innovation practices with energy efficiency is done under the assumption that because OI can support the introduction of new technologies to a firm (West and Bogers, 2013), it could also support the addition of energy-efficient BATs. More specifically, there are three clearly differentiated types of innovation practices (IRD, INB and OUT) that a firm uses to benefit from external knowledge and technol-ogy as aligned to the central idea of the OI ‘funnel’ (Chesbrough, 2006). Interaction between these innovation practices
Energy Efficiency
Specific energy consumption (SEC)
Best available technologies (BATs)
Barriers to energy efficiency (BEEs)
al framework.
e t s ,
e e g
-f --s --e , , -s f r l
demonstrates the precondition of internal R&D being essential in thfirm (Xiaobao et al., 2013) together with a different concurreninfluence of INB and OUT practices (Mazzola et al., 2012) toachieve higher levels of energy efficiency. In particular, we see thifirst with SEC, which is an actual and objective measure of howenergy efficient the main production process of a foundry is; secondwith the rate of adoption of the BATs in each foundry sector, whichare deemed as direct enablers of energy efficiency and thereforprobably having an effect on SEC; and third, with a measure of thperceived barriers, i.e., BEEs, which can affect the decision-makinprocess of adopting energy-efficient BATs and consequently alsohave an impact on the level of SEC.
Moreover, analysing the link between the three energy efficiency indicators could be helpful for understanding the result oadopting more or less innovation practices on better energy efficiency performance. Finally, it should be noticed from the framework that the scope of our study is to explore these relationshipfirst at the firm level, which means that external drivers of innovation in energy efficiency, such as economic, social and, institutional regulations, are not currently included. Nevertheless, wacknowledge that regulations have a major impact on in-novatione.g., the creation of innovation-based alliances (Firth and Mellor1999), and also on energy efficiency, e.g., the relocation of energyintensive firms (Martin et al., 2014). Regrettably, because in thistudy it was not possible to collect data to measure the effect opolicies and regulations, we limit our discussion to linking oufindings with suggestions and implications for policy in a generasense.
---, l, s - -
-e
t
g e s ; l g
; e
3. Methodological approach
3.1. Measured indicators
To explore the relationship between firms' levels of innovativeness and energy efficiency, we focused on measuring six indicators, which are described next. In regards to a firm's innovativeness, the measurement is not straightforward. For instancedespite the process of harmonisation based on the Oslo Manuageneral innovation indicators still have significant difference(OECD, 2013a). A similar challenge exists with OI measures, whichare subjective and only marginally comparable (Cheng and Huizingh, 2014; Schroll and Mild, 2012). Nevertheless, a widespreadapproach to measure the level of innovativeness of a firm is focusing on the perceived ability to innovate through innovationpractices (OECD, 2005). As justified before, in this study we chose tomeasure innovation practices related to internal R&D (IRD), inboundOI (INB), and outbound OI (OUT).
To provide objectivity to our study, we adapted the items used tomeasure IRD and OI practices, either from innovation questionnaires or from the innovation management literature. From thfirst group of sources, we took items directly associated with IRDactivities mainly from the latest public Community InnovationSurvey (Eurostat, 2013). We then added more focused questions onopen and collaborative innovation from the IMP3rove assess-men(Brunswicker and Vanhaverbeke, 2011) and the Open2-In-nova8ionTool (Caird et al., 2013). Later, we reinforced these questions usinconcepts overlapping in the literature relevant to the context of thstudied firms, i.e., manufacturing firms in ma-ture industrie(Chiaroni et al., 2010; Ili et al., 2010; Laursen and Salter, 2006Lazzarotti et al., 2010). Finally, we conducted an ad-ditionaconfirmation of the questions related to IRD and OI by matchinthem with empirical measures obtained from recent studies andreports (Cheng and Huizingh, 2014; European Com-mission, 2013cOECD, 2008). We included all these steps to guarantee that thquestionnaire contained well-known items
used to measure a firm's level of innovativeness (Table 1).All the innovation practices were evaluated through multiple
direct questions using a 1–4 Likert scale (1 – not adopted to 4 –extensively adopted) for the level of adoption within the firm. In addition, to show the results in a clear-cut way, we considered useful defining a practice as having a low adoption level if it was rated with a value of 1 or 2 and having a high adoption level if it was rated with a value of 3 or 4. Using the same logic, we defined a foundry having low or high adoption levels for each group of in-novation practices (i.e., IRD, INB, and OUT) by calculating an average of all the scores in each group. It should be clarified that using an average was the best option to show the results in an aggregated way because performing a factor analysis was not possible due to the low values of the Kaiser–Meyer–Olkin mea-sure, mainly caused by the limited size of our sample.
On the other side, to measure the energy efficiency perfor-mance of a firm, we used an interdisciplinary approach (Thol-lander and Palm, 2013) consisting of three different EEIs. First, from the different measures for energy efficiency performance stressed by the International Energy Agency (Tanaka, 2008), we chose the energy consumption index, i.e., the total amount of energy required to produce a tonne of a certain material measured in kilowatt-hours per tonne. In our study, we labelled this in-dicator as Specific Energy Consumption (SEC) to align with the term used in industrial energy efficiency benchmarks (UNIDO, 2010). Additional advantages of choosing this physical-thermo-dynamic indicator include its objective measurement, reflecting what it is required in terms of the end user unit (Patterson, 1996), avoiding market value fluctuations, and its relation to process operations and technology choices (IEA, 2013). It is important to clarify that in this study, we focus on measuring the SEC value of the melting process in the foundries because it can account for up to 84% of the total final energy use (UNIDO, 2010).
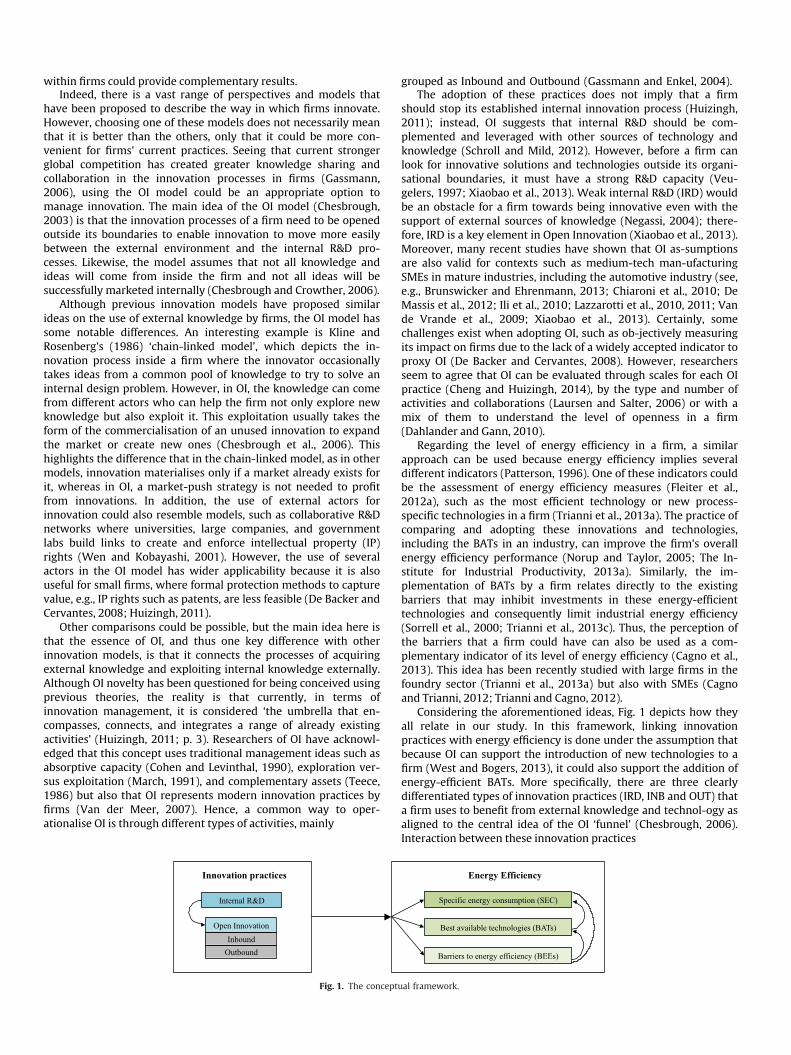
Because each sector has different industry standards for energy efficiency (Patterson, 1996), each alloy foundry has its own benchmark SEC values for considering a process energy efficient. Therefore, we coded the SEC value on a scale from 1 (poor) through 4 (excellent) using different thresholds for each alloy (Table 2). Such thresholds were derived based on theoretical, practical minimum, and benchmark values taken from the litera-ture, primarily from industry reports (Backlund et al., 2011; Choate and Green, 2003; EPA, 2012, 2008; European Commission, 2012, 2005; Helber and Steinhäuser, 2011; Remus et al., 2013; The In-stitute for Industrial Productivity, 2013a; U.S. Department of En-ergy, 2005; UNIDO, 2010). The foundry associations and their ex-perts, with whom we collaborated on this project, helped us to confirm these thresholds while we prepared the questionnaire. Later, based on the built scales and the experts' estimation, we decided to have clear-cut criteria for presenting results related to SEC as well. Accordingly, we categorised foundries as having poor (1) and good (2) levels as being less efficient and thus having a low performance level of SEC (SEC-L). In contrast, foundries with very good (3) and excellent (4) levels were considered to be more energy efficient and thus have a high performance level of SEC (SEC-H).
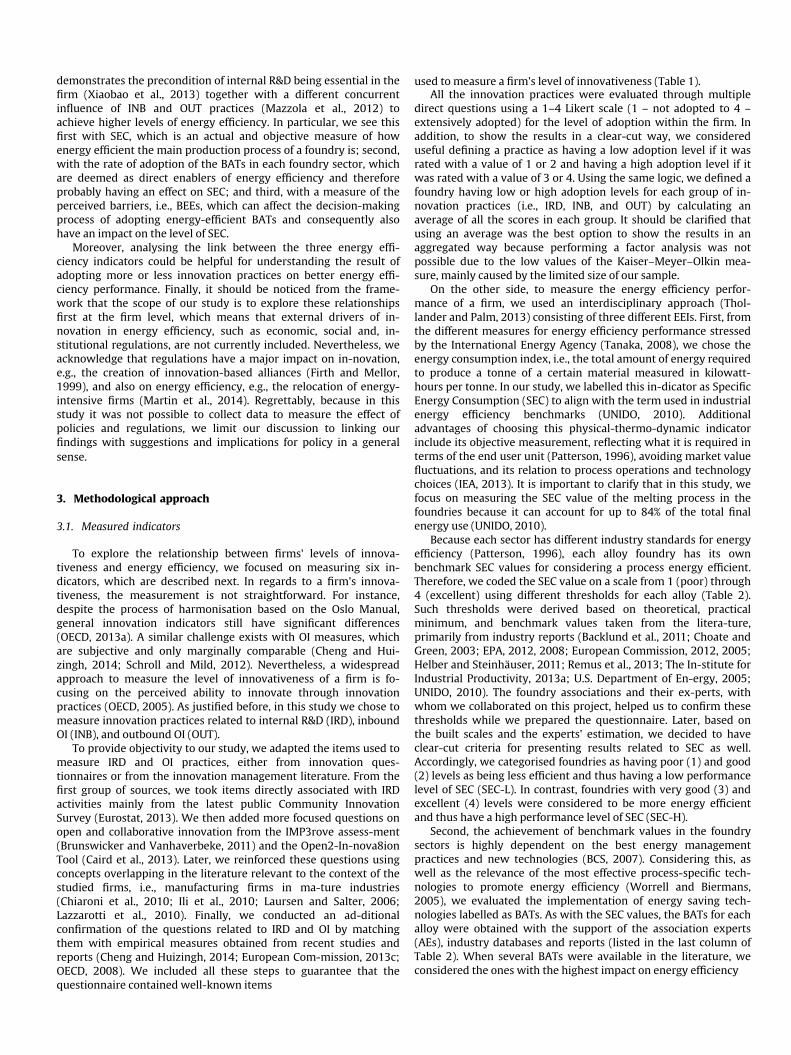
Second, the achievement of benchmark values in the foundry sectors is highly dependent on the best energy management practices and new technologies (BCS, 2007). Considering this, as well as the relevance of the most effective process-specific tech-nologies to promote energy efficiency (Worrell and Biermans, 2005), we evaluated the implementation of energy saving tech-nologies labelled as BATs. As with the SEC values, the BATs for each alloy were obtained with the support of the association experts (AEs), industry databases and reports (listed in the last column of Table 2). When several BATs were available in the literature, we considered the ones with the highest impact on energy efficiency

Table 1Items used to measure internal R&D and Open Innovation practices.
Construct Concept Code Practices and activities Sources
Perceived innovationcapacity
Internal innovation(R&D)
In1 Introducing innovative products related with the firm'score business
Community Innovation Survey Questionnaire (Eurostat, 2013), IMP3rove assessment (Brunswicker and Vanhaverbeke, 2011)
In2 Introducing innovative processes related with thefirm's core business
In3 Investing of resources in internal R&DIn4 Operating at the forefront of developing new
technologiesIn5 Producing intellectual property inside the firmIn6 Engaging in org. innovation to improve operations
and efficienciesInbound OpenInnovation
Ib1 Accessing to external funding to develop innovativeideas
Open2-Innova8ion Tool (Caird et al., 2013), Empirical measures of Open Innovation (OECD, 2008), Open Innovation 2.0 Yearbook (European Commission, 2013c), Laursen and Salter (2006), Lazzarotti et al. (2010)Ib2 Using new methods of organising relations with other
organisationsIb3 Conducting trend and technology scoutingIb4 Consuming external R&D to increase knowledge and
expertise stockIb5 Innovating through reverse engineeringIb6 Purchasing technical or scientific servicesIb7 Acquiring advanced machinery, equipment or soft-
ware to innovateIb8 Licensing-in patents or purchasing external IP
knowledgeIb9 Adapting information on customer requirements into
valuable IPIb10 External training of personnel to improve the in-
novation processIb11 Engaging in activities to get innovative ideas from
atypical sourcesIb12 Using different entities as collaboration partners to
innovateOutbound OpenInnovation
Ob1 Selling innovation projects developed inside the firm Chiaroni et al. (2010), Ili et al. (2010), Cheng and Huizingh (2014)Ob2 Supporting the formation of spin-off companiesOb3 Using licensing-out schemes (technology, patents, and
trademarks)Ob4 Selling technical or scientific services to other
organisationsOb5 Creating valuable intellectual property to sell it to
other organisationsOb6 Commercialising technology developed or improved
inside the firm
. ,
,
Table 2Ranges of specific energy consumption (SEC) for different alloys.
Alloy SEC [kWh/ton] Sources of information
Poor (1) Good (2) Very good (3) Excellent (4)
Steel Higher than 2530 2530–2205 2205–1075 1075–730 BAT Reference Document for Iron and Steel ProductionBAT Conclusions for Iron and Steel Production
Aluminium Higher than 830 830–705 705–490 490–390 Industrial Efficiency Technology Database: Iron and SteelBAT Guidance Note for the Non-Ferrous MetalsUS Aluminum Production Energy Requirements
Ductile cast iron Higher than 1200 1200–1000 1000–800 800–750 BAT Guidance Note for Ferrous Metals FoundriesEnergy Saving Opportunities for the Metal Casting IndustryGlobal Industrial Energy Efficiency Benchmarking
Grey cast iron Higher than 1100 1100–900 900–700 700–650 Foundrybench D19 and D16The Smitheries and Foundries BREF
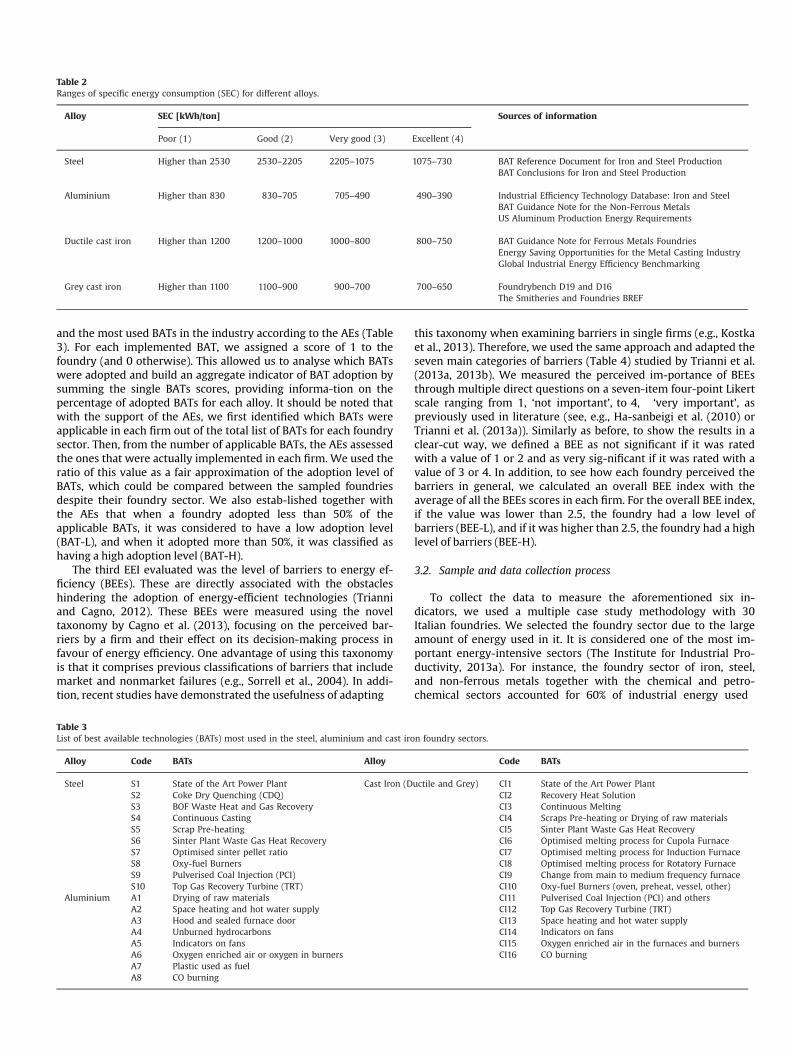
and the most used BATs in the industry according to the AEs (Table 3). For each implemented BAT, we assigned a score of 1 to the foundry (and 0 otherwise). This allowed us to analyse which BATs were adopted and build an aggregate indicator of BAT adoption by summing the single BATs scores, providing informa-tion on the percentage of adopted BATs for each alloy. It should be noted that with the support of the AEs, we first identified which BATs were applicable in each firm out of the total list of BATs for each foundry sector. Then, from the number of applicable BATs, the AEs assessed the ones that were actually implemented in each firm. We used the ratio of this value as a fair approximation of the adoption level of BATs, which could be compared between the sampled foundries despite their foundry sector. We also estab-lished together with the AEs that when a foundry adopted less than 50% of the applicable BATs, it was considered to have a low adoption level (BAT-L), and when it adopted more than 50%, it was classified as having a high adoption level (BAT-H).
The third EEI evaluated was the level of barriers to energy ef-ficiency (BEEs). These are directly associated with the obstacles hindering the adoption of energy-efficient technologies (Trianni and Cagno, 2012). These BEEs were measured using the novel taxonomy by Cagno et al. (2013), focusing on the perceived bar-riers by a firm and their effect on its decision-making process in favour of energy efficiency. One advantage of using this taxonomy is that it comprises previous classifications of barriers that include market and nonmarket failures (e.g., Sorrell et al., 2004). In addi-tion, recent studies have demonstrated the usefulness of adapting
Table 3List of best available technologies (BATs) most used in the steel, aluminium and cast iro
Alloy Code BATs Alloy
Steel S1 State of the Art Power Plant Cast Iron (DS2 Coke Dry Quenching (CDQ)S3 BOF Waste Heat and Gas RecoveryS4 Continuous CastingS5 Scrap Pre-heatingS6 Sinter Plant Waste Gas Heat RecoveryS7 Optimised sinter pellet ratioS8 Oxy-fuel BurnersS9 Pulverised Coal Injection (PCI)S10 Top Gas Recovery Turbine (TRT)
Aluminium A1 Drying of raw materialsA2 Space heating and hot water supplyA3 Hood and sealed furnace doorA4 Unburned hydrocarbonsA5 Indicators on fansA6 Oxygen enriched air or oxygen in burnersA7 Plastic used as fuelA8 CO burning
this taxonomy when examining barriers in single firms (e.g., Kostkaet al., 2013). Therefore, we used the same approach and adapted theseven main categories of barriers (Table 4) studied by Trianni et al(2013a, 2013b). We measured the perceived im-portance of BEEsthrough multiple direct questions on a seven-item four-point Likertscale ranging from 1, ‘not important’, to 4, ‘very important’, aspreviously used in literature (see, e.g., Ha-sanbeigi et al. (2010) orTrianni et al. (2013a)). Similarly as before, to show the results in aclear-cut way, we defined a BEE as not significant if it was ratedwith a value of 1 or 2 and as very sig-nificant if it was rated with avalue of 3 or 4. In addition, to see how each foundry perceived thebarriers in general, we calculated an overall BEE index with theaverage of all the BEEs scores in each firm. For the overall BEE indexif the value was lower than 2.5, the foundry had a low level ofbarriers (BEE-L), and if it was higher than 2.5, the foundry had a highlevel of barriers (BEE-H).
3.2. Sample and data collection process
To collect the data to measure the aforementioned six in-dicators, we used a multiple case study methodology with 30Italian foundries. We selected the foundry sector due to the largeamount of energy used in it. It is considered one of the most im-portant energy-intensive sectors (The Institute for Industrial Pro-ductivity, 2013a). For instance, the foundry sector of iron, steeland non-ferrous metals together with the chemical and petro-chemical sectors accounted for 60% of industrial energy used
n foundry sectors.
Code BATs
uctile and Grey) CI1 State of the Art Power PlantCI2 Recovery Heat SolutionCI3 Continuous MeltingCI4 Scraps Pre-heating or Drying of raw materialsCI5 Sinter Plant Waste Gas Heat RecoveryCI6 Optimised melting process for Cupola FurnaceCI7 Optimised melting process for Induction FurnaceCI8 Optimised melting process for Rotatory FurnaceCI9 Change from main to medium frequency furnaceCI10 Oxy-fuel Burners (oven, preheat, vessel, other)CI11 Pulverised Coal Injection (PCI) and othersCI12 Top Gas Recovery Turbine (TRT)CI13 Space heating and hot water supplyCI14 Indicators on fansCI15 Oxygen enriched air in the furnaces and burnersCI16 CO burning

Table 4Taxonomy of barriers to energy efficiency. Adapted from Cagno et al. (2013).
Category Description of the associated barriers
Economic barriers Low capital availability, investment costs, hidden costs, intervention-related risks, external risks, intervention not sufficientlyprofitable.
Organisational barriers Complex decision chain, lack of time and other priorities of top management, issues on energy contracts, lack of internal control,divergent interests
Information barriers Issues on energy contracts, lack of information on benefits, trustworthiness of the information source, unclear information by tech-nology suppliers
Behavioural barriers Inertia, lack of sharing the objectives and interest in energy efficiency topic, imperfect evaluation criteria other priorities.Barriers related to competences Difficulties in gathering external skills to identify inefficiencies and opportunities in order to implement interventions.Barriers related to awareness Lack of personal environmental/energy concern, ignorance about energy efficiency topicTechnology-related barriers Technology not adequate or compatible, and technology not available.
worldwide in 2010 (UNIDO, 2010). In the European Union, these industrial sectors accounted for almost 16% of its total final energy consumption in 2011. Moreover, our studied context is relevant because in 2011, Italy had the second highest consumption of final energy in these sectors in the EU, only trailing Germany (European Commission, 2013a).
Because foundries are energy-intensive firms, it is reasonable to assume that energy efficiency has a strong and direct influence on industrial and company performance, making this research con-text relevant for the purpose of this study. It is worth mentioning that we noticed some common characteristics for the chosen firms, which we are not highlighting in this study but could be important to mention. First, according to the EU definition, most foundries in Italy are SMEs (Trianni et al., 2013a). Second, the se-lected foundries are often tier-2 suppliers1 to the automotive in-dustry, which allowed the firms to be stable given the pressures of a major supplied manufacturing industry in terms of cost opti-misation, R&D efficiency, and competition (Wyman, 2007). Moreover, the main markets served by foundries in Europe are the automotive (50%), general engineering (30%) and construction (10%) sectors, which could also be sources of innovation from an OI perspective. Third, all firms are equally influenced by the same European regulations for the foundry sectors, thus making it dif-ficult to consider these regulations as relevant differentiators. For instance, all the sampled foundries should follow the European emissions trading scheme (EU ETS) regardless of which foundry sector they belong to. Fourth, as we previously mentioned, the foundries produce four different types of alloys: steel, aluminium, grey cast iron, and ductile cast iron. This distinction is important because it relates directly to the benchmark values of SEC and the specific BATs for each alloy and process. Nevertheless, the focus of this study is not on the alloy process itself but on the relationship between the level of adoption of certain BATs and the perceived BEEs, among others.
For this study, we chose 30 firms with the support of different Italian foundries' associations. These associations provide foun-dries with continuous assistance related to technical, regulatory and environmental information; therefore, having their support was vital to collecting and confirming data. All of the studied foundries are located in Northern Italy, which provided con-sistency to the firms analysed in our study because this region is marked by a particular diffusion of innovative activities among firms (Conte, 2002; Lazzarotti et al., 2011). It should be noted that from more than 40 foundries contacted randomly, very few chose to participate. Therefore, we requested the foundry associations provide the names of firms known for being more cooperative and proactive. This strategy helped us obtain information for more
1 A tier-2 or second-tier supplier is a company that supplies materials or parts toanother company, which then supplies them to a manufacturer.
firms; however, a side effect was that the foundries suggested by the associations were also known for being relatively innovative. Therefore, it can be said that the firm selection process was par-tially influenced by the associations' participation; however, their participation helped us reach our goal of studying firms with certain levels of R&D and innovation intensity. We acknowledge that our sample is not representative of all foundries in the region, including the least innovative foundries. However, the case study approach is judged on its theoretical generalisability rather than its statistical generalisability (Eisenhardt and Graebner, 2007). Therefore, the sample of 30 firms, including foundries deemed as relatively innovative, was judged to be appropriate.
We collected and analysed the data with a multiple case study methodology (see Yin (2013)), used in similar studies focusing on energy management (Thollander and Ottosson, 2010), industrial energy efficiency (Thollander et al., 2007), barriers to energy ef-ficiency (Trianni et al., 2013b), and innovation management (Laz-zarotti and Manzini, 2009). The multiple case study approach in-cluded a visit to each foundry to apply semi-structured interviews and a self-reported questionnaire that was designed according to literature suggestions (Bryman and Bell, 2007; Fink, 2003). This questionnaire was the result of refining a larger set of items through a pilot study (Ramirez-Portilla et al., 2014), yielding 65 relevant questions for this study. Testing the preliminary mea-surement instrument in the aforesaid study helped in providing consistency (firms answering in the same way to the same ques-tion) and validity (items correctly measuring the investigated in-dicators) to this larger study. Likewise, to increase the reliability of our study, we followed a rigorous case study protocol as well as a structured database created for the analysis of the empirical evi-dence from the cases.
It should be acknowledged that a self-reporting method for collecting data, such as our questionnaire, could have some dis-advantages in terms of validity and respondent bias. We tried to offset these drawbacks by teaming up with the foundry associa-tions and their experts before and during the visits to the firms. For instance, the AEs reviewed preliminary versions of the ques-tionnaire with a special emphasis on verifying items related to the benchmark levels of energy consumption per alloy sector and the lists of the state-of-the-art energy-efficient technologies for each alloy. Similarly, the team of AEs also supported us during the data collection process. Together with the AEs, we spent around half a day per case, four to six hours in each firm, evaluating the different indicators by each party. This means that on the one side was that the AEs led the objective assessment of the technologies applied in each firm and measuring the energy efficiency of the main foundry process. In contrast, we led the evaluation of the perceived BEEs and the innovation practices adopted by firms through interviews with managers.
To ensure respondents in the Italian foundries fully understood the constructs and indicators originally formulated in English, we

used a double back translation procedure (see, e.g., Cheng and Huizingh, 2014). We conducted the semi-structured interviews and the questionnaire with top management selected as key re-spondents due to their direct role in the strategy and operations of the firms, e.g., the general director, the operations director, the plant manager and other specialised managers if available. This approach was appropriate because it is common in Italian SMEs that these types of key employees are deeply involved with stra-tegic firm decisions, such as innovation, technology and efficiency topics (Lazzarotti et al., 2010).
e e
e t r e e e , s
e f s - t s t s , ,
e , r e
.
4. Results and discussion
The results of this study are discussed in different ways. First, wdescribe some general aspects from the sample such as its mix, thexistence of specialised managers and the types of collabora-tionpartners used for innovation projects (Section 4.1). Later we analysthe innovation indicators and groups of firms with dif-ferenadoption levels of innovation practices (Section 4.2) to betteunderstand their influence on foundries' SEC (Section 4.3), thadoption rate of energy-efficient BATs (Section 4.4), and thperceived BEEs (Section 4.5). In all sections, a discussion of threlationships between the different innovation levels is includedand, when appropriate, the relationship between the three EEIs idiscussed.
4.1. General analysis of the sample
When examining the general characteristics of the sample, wcan see a similar mix of SMEs in terms of annual turnover andnumber of employees (Table 5). This mix is similar to the size ofirms in the European foundry industry, in which 80% of firmemploy less than 250 people (European Commission, 2005). Regarding the proportion of foundries, even though we wanted tostudy an equal number of SMEs per each foundry sector, the amounof firms in the studied region varied greatly between them. It irecognised that the size of the sample for each type of alloy is noequal and statistically representative in all cases; nevertheless, thistudy covered a fair proportion of the foundries in the region, with20%, 80% and 32% for steel, aluminium and cast iron foundriesrespectively (ASSOFOND, 2013; ASSOMET, 2014; FEDERACCIAI2014). Therefore, this sample is relevant for the purpose of exploringthe link between innovation practices and energy efficiency.
An interesting observation is that only two firms in the samplhave an innovation manager, in comparison to the existence of 12energy managers (EM). This difference suggests that althoughmanagers in these foundries coordinate some innovation activ-itiesthey are not focused on innovation alone; they support otheactivities and areas inside the foundries. It is also clear that thnumber of EMs, 12, is similar to the 11 firms conducting energyaudits in the last three years, suggesting an analogous relationbetween energy-focused staff and energy-focused activitiesNevertheless, after a closer evaluation, we observed that the
Table 5General characteristics of the studied firms.
Type of alloy Annual turnover [€M] No. of employees No
Min Max Min Max
Steel – 235 – 205 1Alum. 11 100 50 240 4Cast iron 5 60.5 23 220 25TOTAL 30
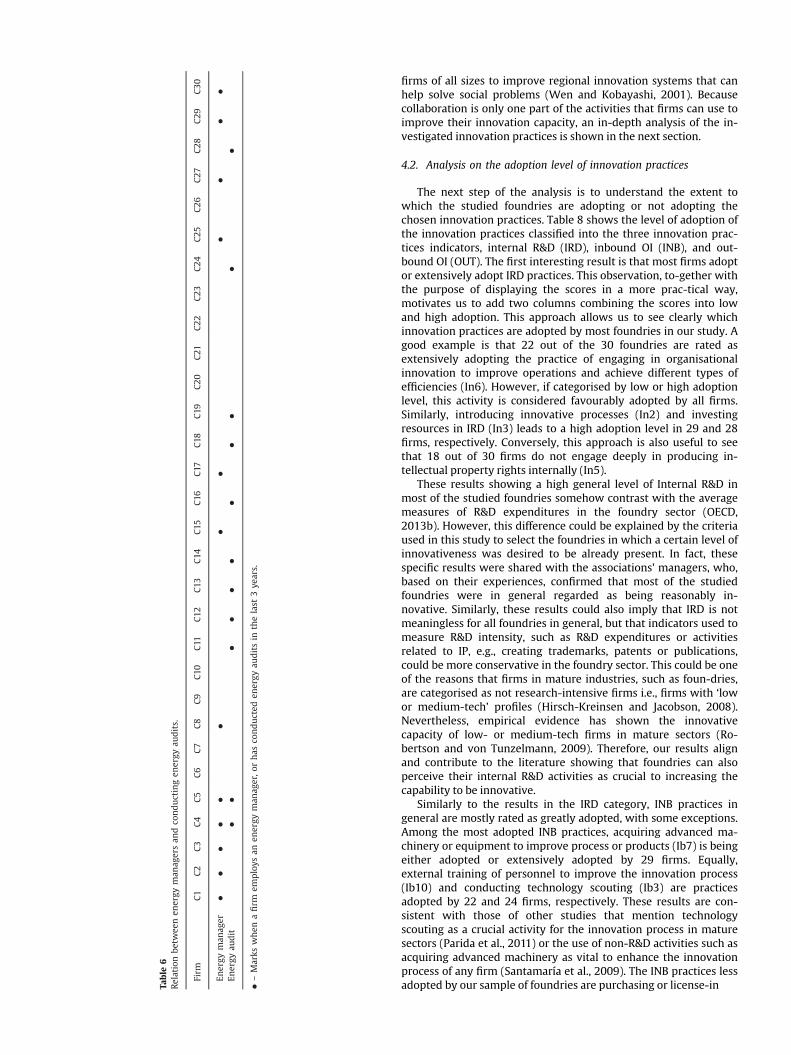
relationship between having an EM and conducting energy audits is not correspondent in our sample (Table 6). For instance, only 2 foundries (C4 and C5) employ EMs and at the same time conduct energy audits. However, the other 19 foundries also marked with a dot in the table do not show simultaneous employment of an EM and conducting of energy audits. We believe this unexpected trend could be explained by two different strategies that some top managers expressed during the visits and interviews. The first is when a firm chooses an approach focused on managing energy issues, it clearly identifies in an EM an opportunity to improve the firm's energy performance, control internal energy indicators and thus decrease external audits. The second is a more conservative approach in which firms do not hire a full-time EM but delegate part of this role to other employees to execute energy-related activities periodically, such as energy audits. This result is inter-esting because the studied foundries do not need to appoint a certified energy manager according to Italian national laws, de-rived from the Act of the Rational Use of Energy since their energy consumption is lower than 10,000 toe/year (The Institute for In-dustrial Productivity, 2013b). This finding suggests, as expressed by some top managers, that most foundries in our sample are al-ready aware of energy management practices and the importance of energy efficiency actions due to the role of industrial associa-tions in communicating local and regional policies. Similarly, it suggests that some of these foundries pursue different strategies to be energy efficient even though they are all guided by the same regulations such as the EU ETS or not requiring a certified energy manager.
On the innovation side, an additional and preliminary analysis of the information sources and collaboration partners that the sampled foundries use to innovate is reported in Table 7. From this table, we can see that for the 30 foundries, all of them indicated that they collaborate or obtain information useful for innovation from suppliers, and 27 firms did so from clients. Two other sources of information or forms of collaboration highly mentioned were industry associations, mentioned by 26 firms, and technical or scientific publications, mentioned by 25 firms. In contrast, the less mentioned sources of knowledge or collaboration for innovation used by foundries are start-up firms, public research institutes, and other industries. These results are aligned with previous stu-dies on the impact of different types of innovation collaborations and innovation sources, which found that horizontal collabora-tions (e.g., with competitors) and science-based collaborations (e.g., with government research institutions) are not adopted by many firms in the manufacturing sector. Instead, it is more usual that vertical collaboration (e.g., with suppliers and clients) can positively influence innovation capacity and performance in this type of firms (Ebersberger et al., 2012). For instance, one of the owners stated that it was common to periodically invite suppliers and clients to the foundry premises to talk about possible joint projects. Conversely, he said that they would probably never invite a competitor or a start-up because they were not sure which types of collaborations could be done with them. All these findings suggest that regional policies could be better framed to promote collaboration networks between universities, government and
. of firms Innovation managers Energy managers Energy audits
0 1 11 4 11 9 92 14 11
Table
6Re
lation
betw
eenen
ergy
man
agersan
dco
nductingen
ergy
audits.
Firm
C1
C2
C3
C4
C5
C6
C7
C8
C9
C10
C11
C12
C13
C14
C15
C16
C17
C18
C19
C20
C21
C22
C23
C24
C25
C26
C27
C28
C29
C30
Energy
man
ager
��
��
��
��
��
��
Energy
audit
��
��
��
��
��
�
� –Marks
when
afirm
employs
anen
ergy
man
ager,o
rhas
conducted
energy
auditsin
thelast
3ye
ars.
firms of all sizes to improve regional innovation systems that can help solve social problems (Wen and Kobayashi, 2001). Because collaboration is only one part of the activities that firms can use to improve their innovation capacity, an in-depth analysis of the in-vestigated innovation practices is shown in the next section.
4.2. Analysis on the adoption level of innovation practices
The next step of the analysis is to understand the extent to which the studied foundries are adopting or not adopting the chosen innovation practices. Table 8 shows the level of adoption of the innovation practices classified into the three innovation prac-tices indicators, internal R&D (IRD), inbound OI (INB), and out-bound OI (OUT). The first interesting result is that most firms adopt or extensively adopt IRD practices. This observation, to-gether with the purpose of displaying the scores in a more prac-tical way, motivates us to add two columns combining the scores into low and high adoption. This approach allows us to see clearly which innovation practices are adopted by most foundries in our study. A good example is that 22 out of the 30 foundries are rated as extensively adopting the practice of engaging in organisational innovation to improve operations and achieve different types of efficiencies (In6). However, if categorised by low or high adoption level, this activity is considered favourably adopted by all firms. Similarly, introducing innovative processes (In2) and investing resources in IRD (In3) leads to a high adoption level in 29 and 28 firms, respectively. Conversely, this approach is also useful to see that 18 out of 30 firms do not engage deeply in producing in-tellectual property rights internally (In5).
These results showing a high general level of Internal R&D in most of the studied foundries somehow contrast with the average measures of R&D expenditures in the foundry sector (OECD, 2013b). However, this difference could be explained by the criteria used in this study to select the foundries in which a certain level of innovativeness was desired to be already present. In fact, these specific results were shared with the associations' managers, who, based on their experiences, confirmed that most of the studied foundries were in general regarded as being reasonably in-novative. Similarly, these results could also imply that IRD is not meaningless for all foundries in general, but that indicators used to measure R&D intensity, such as R&D expenditures or activities related to IP, e.g., creating trademarks, patents or publications, could be more conservative in the foundry sector. This could be one of the reasons that firms in mature industries, such as foun-dries, are categorised as not research-intensive firms i.e., firms with ‘low or medium-tech’ profiles (Hirsch-Kreinsen and Jacobson, 2008). Nevertheless, empirical evidence has shown the innovative capacity of low- or medium-tech firms in mature sectors (Ro-bertson and von Tunzelmann, 2009). Therefore, our results align and contribute to the literature showing that foundries can also perceive their internal R&D activities as crucial to increasing the capability to be innovative.
Similarly to the results in the IRD category, INB practices in general are mostly rated as greatly adopted, with some exceptions. Among the most adopted INB practices, acquiring advanced ma-chinery or equipment to improve process or products (Ib7) is being either adopted or extensively adopted by 29 firms. Equally, external training of personnel to improve the innovation process (Ib10) and conducting technology scouting (Ib3) are practices adopted by 22 and 24 firms, respectively. These results are con-sistent with those of other studies that mention technology scouting as a crucial activity for the innovation process in mature sectors (Parida et al., 2011) or the use of non-R&D activities such as acquiring advanced machinery as vital to enhance the innovation process of any firm (Santamaría et al., 2009). The INB practices less adopted by our sample of foundries are purchasing or license-in
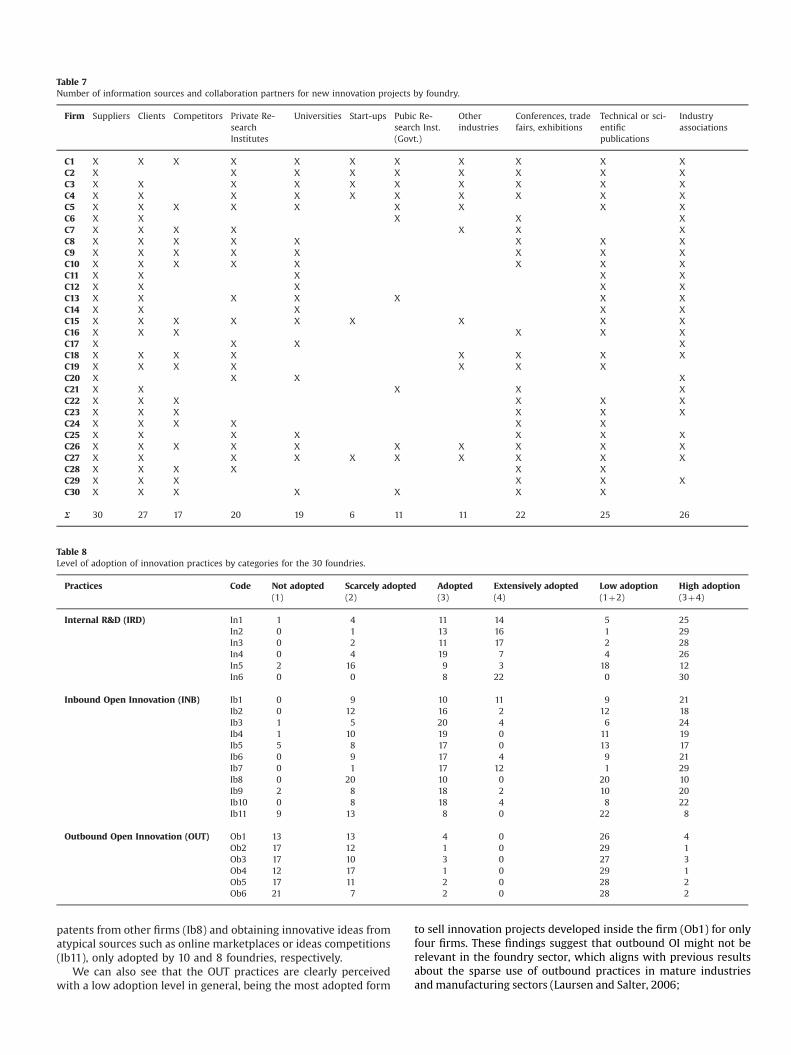
Table 7Number of information sources and collaboration partners for new innovation projects by foundry.
Firm Suppliers Clients Competitors Private Re-searchInstitutes
Universities Start-ups Pubic Re-search Inst.(Govt.)
Otherindustries
Conferences, tradefairs, exhibitions
Technical or sci-entificpublications
Industryassociations
C1 X X X X X X X X X X XC2 X X X X X X X X XC3 X X X X X X X X X XC4 X X X X X X X X X XC5 X X X X X X X X XC6 X X X X XC7 X X X X X X XC8 X X X X X X X XC9 X X X X X X X XC10 X X X X X X X XC11 X X X X XC12 X X X X XC13 X X X X X X XC14 X X X X XC15 X X X X X X X X XC16 X X X X X XC17 X X X XC18 X X X X X X X XC19 X X X X X X XC20 X X X XC21 X X X X XC22 X X X X X XC23 X X X X X XC24 X X X X X XC25 X X X X X X XC26 X X X X X X X X X XC27 X X X X X X X X X XC28 X X X X X XC29 X X X X X XC30 X X X X X X X
Σ 30 27 17 20 19 6 11 11 22 25 26
Table 8Level of adoption of innovation practices by categories for the 30 foundries.
Practices Code Not adopted Scarcely adopted Adopted Extensively adopted Low adoption High adoption(1) (2) (3) (4) (1þ2) (3þ4)
Internal R&D (IRD) In1 1 4 11 14 5 25In2 0 1 13 16 1 29In3 0 2 11 17 2 28In4 0 4 19 7 4 26In5 2 16 9 3 18 12In6 0 0 8 22 0 30
Inbound Open Innovation (INB) Ib1 0 9 10 11 9 21Ib2 0 12 16 2 12 18Ib3 1 5 20 4 6 24Ib4 1 10 19 0 11 19Ib5 5 8 17 0 13 17Ib6 0 9 17 4 9 21Ib7 0 1 17 12 1 29Ib8 0 20 10 0 20 10Ib9 2 8 18 2 10 20Ib10 0 8 18 4 8 22Ib11 9 13 8 0 22 8
Outbound Open Innovation (OUT) Ob1 13 13 4 0 26 4Ob2 17 12 1 0 29 1Ob3 17 10 3 0 27 3Ob4 12 17 1 0 29 1Ob5 17 11 2 0 28 2Ob6 21 7 2 0 28 2
patents from other firms (Ib8) and obtaining innovative ideas fromatypical sources such as online marketplaces or ideas competitions(Ib11), only adopted by 10 and 8 foundries, respectively.
We can also see that the OUT practices are clearly perceivedwith a low adoption level in general, being the most adopted form
to sell innovation projects developed inside the firm (Ob1) for only four firms. These findings suggest that outbound OI might not be relevant in the foundry sector, which aligns with previous results about the sparse use of outbound practices in mature industries and manufacturing sectors (Laursen and Salter, 2006;

Table 9Average values of the innovation practices adopted in every firm shown by theinnovation sub-categories proposed for the analysis.
Firm ALL TIRD TIRDþTINB TIRDþTINBþTOUT
IRD INB OUT
C1 2.33 1.91 1.00 – – –
C2 2.83 2.55 2.00 – – –
C3 3.50 3.00 3 3.50 3.25 3.17C4 3.33 2.45 2.17 3.33 – –
C5 3.33 2.45 2.17 3.33 – –
C6 3.67 3.00 2.00 3.67 3.33 –
C7 3.67 3.00 2.00 3.67 3.33 –
C8 3.50 3.27 2.00 3.50 3.39 –
C9 3.67 3.00 2.00 3.67 3.33 –
C10 3.50 2.64 1.00 3.50 – –
C11 2.33 2.27 2.00 – – –
C12 2.83 2.18 2.00 – – –
C13 3.33 2.91 1.00 3.33 – –
C14 3.17 2.82 1.17 3.17 – –
C15 3.00 2.64 1.33 3.00 – –
C16 3.17 2.18 1.00 3.17 – –
C17 3.17 2.09 1.00 3.17 – –
C18 3.17 2.09 1.20 3.17 – –
C19 3.00 2.45 2.17 3.00 – –
C20 4.00 2.82 1.00 4.00 – –
C21 2.67 2.91 1.17 – – –
C22 3.17 2.45 1.33 3.17 – –
C23 3.33 2.73 1.17 3.33 – –
C24 3.00 2.27 1.67 3.00 – –
C25 3.50 3.09 1.83 3.50 3.30 –
C26 3.83 3.18 1.00 3.83 3.51 –
C27 3.67 3.09 1.17 3.67 3.38 –
C28 3.33 3.27 1.17 3.33 3.30 –
C29 3.83 3.27 1.17 3.83 3.55 –
C30 2.83 2.73 1.17 – – –
Total firms 30 24 10 1
Lichtenthaler, 2009).The results on the low level of adoption of OUT practices lead us
to use a different approach to continue further analyses. Therefore, to better understand the differences between firms that adopted more or less certain innovation practices, we defined three new categories of firms based on the aggregated level of innovation practices for each firm. To do this, we considered the average value for each group of innovation practices (IRD, INB and OUT). Based on the difference between the top performers and the rest of the firms, we categorise the firms in three groups (Table 9):
–
All foundries in the sample (labelled as ALL). This sub-categoryis used as a baseline and thus includes the 30 firms regardlessof their levels for each innovation practice.–
Top performers in internal R&D practices (labelled as TIRD).This sub-category covers only firms that show a mean value ofIRD practices higher than 3. We calculated this value as anaverage of the adoption levels for the six IRD practices.–
Top performers in internal R&D and in inbound OI practices(labelled as TIRDþTINB). This sub-category covers only firmsthat show a mean value higher than 3 on IRD and on INBpractices. Similarly as before, we calculated these values withthe average of the adoption levels separately for the six IRDpractices and for the 11 practices classified as INB.It should be noted that in the resulting sub-categories of firms,only one firm fell under a fourth classification of adding up theOUT practices; thus, this sub-category was not considered as re-levant. We then compared the overall average of innovation levelsbetween the sub-categories proposed as a further step to confirmrelevant differences between the groups. By doing this we
observed a difference in the average of 22.9% between the groups ALL and TIRD. Similarly, we saw a difference of 21.8% between the groups ALL and TIRDþTINB. These moderate differences indicated to us that other relevant differences could arise when comparing the groups with the three EEIs.
When analysing in detail which innovation practices have a higher weight in the proposed innovation sub-categories, we no-tice some similarities and differences with the first analysis of the whole sample. These findings highlighting some of the most adopted innovation practices suggest that the disparity between the innovativeness levels of the sampled foundries could be im-proved by promoting some specific activities as best practices by the foundry associations. For instance, adopting or developing new technologies (In4) was the only practice showing a higher adop-tion rate in the TIRD group in comparison to the foundries grouped in ALL. If the comparison is made with the TIRDþTINB group, we see similar adoption rates in this group, with the exception of two additional practices considered both as extensively adopted: in-troducing innovative products (In1) and accessing to external funding to develop innovative ideas (Ib1). Thus, the adoption of certain innovation practices is crucial for being regarded as highly innovative among the studied foundries, and these practices could be established as a benchmark for the foundry sector.
4.3. Analysis of the level of specific energy consumption (SEC)
In relation to the first EEI, a comparison of the SEC level for the 30 firms showed a fair distribution of this indicator level in our sample. This was concluded because 10 foundries have a poor le-vel, 9 foundries have a good level, and 11 foundries have a very good SEC level. It is worth noting that only the first three levels were obtained from the sampled foundries, and none of them were evaluated with a level of excellent SEC, which could be ex-plained since this level is close to the theoretical value. Although the main purpose of this study is not to provide precise results for each foundry sector, evaluation of the SEC level was possible by type of alloy. Considering that 15 out of the 26 cast iron foundries produce both types of cast iron because their primary process is very similar, together with the association experts, we assessed the SEC values for 45 production processes. Based on this eva-luation, 14 processes were rated as having a poor SEC level, 14 were acceptable, and 17 were energy efficient, which shows a si-milar fair distribution of the SEC levels throughout the studied foundries if analysed by alloy. Moreover, if we consider the SEC levels in the foundry sector (UNIDO, 2010), we can see in our sample that the steel foundry has a slightly less energy-efficient process in comparison to the European benchmark. On the con-trary, the four aluminium foundries can be observed as having energy-efficient production compared with the European and in-ternational benchmark. The rest of the 40 production processes for cast iron foundries are divided between poor, good and very good levels; however, based on the European and international foundry benchmarks, we determined that only 15 of these processes were really energy efficient.
With these views of the SEC levels among the processes of all sampled foundries, it is then also interesting to evaluate the SEC level in the innovation sub-categories previously created. Al-though the difference of the average SEC level is not very high between the three groups, the relative difference between ALL and TIRD with respect to the TIRDþTINB sub-category looks interest-ing (Graph A in Fig. 2). More precisely, in this graph, we can see that ALL and TIRD practically have the same SEC mean value – 2.03 and 2.04, respectively – i.e., a good level. Interestingly, however, firms included in the TIRDþTINB group present a higher average SEC value equal to 2.20. This finding provides partial support for the conceptual premise that a higher level of innovativeness based

Fig. 2. (A) Average levels of specific energy consumption for the three innovation sub-categories based on different levels of adoption of innovation practices and(B) adoption rate of best available technologies for the same three innovation sub-categories.
on the aggregated innovation practices used by a firm provides slightly better results in terms of the SEC level.
4.4. Analysis of the adoption level of best available technologies(BATs)
For the BATs evaluated in the whole sample, the level of adoption exhibits an average of 34% with a standard deviation of 0.13, demonstrating that this is an average that properly describes the adoption level of the studied foundries. This number contrasts with the 60% adoption level expressed by one of the foundry as-sociations as the desired minimum level in the affiliated foundries. Nevertheless, in general, the level of adoption of BATs is fairly optimistic for the studied firms considering the variety of available technologies in the different foundry sectors (Fig. 3). An important reminder when looking at this graph is that each alloy has dif-ferent numbers of BATs. Thus, as previously explained in Section 3.1, to compare the levels of adoption between all foundries, we focused on assessing the applicable BATs in each firm and not on the list of all possible BATs for each sector. This approach helps display the general level of BAT adoption in the whole sample on a similar basis.
The difference in the number of BATs used for each alloy pro-duction and the number of cases of each alloy makes it difficult to provide a detailed analysis of BATs in an aggregated way. Thus, we
0%
10%
20%
30%
40%
50%
60%
C1
C2
C3
C4
C5
C6
C7
C8
C9
C10
C11
C12
C13
% o
f ado
pted
BAT
s
Fig. 3. Adoption rate of best available technol
centred our further analysis on the BATs specifically on cast iron foundries, which is the largest cluster of our sample. When ana-lysing cast iron foundries, we found that among the most used BATs by the 25 firms, having a state-of-the-art power plant (CI1) was mentioned 13 times. Furthermore, considering that cast iron can be produced with three types of furnaces (cupola, induction and rotary), it is interesting to see that all 12 foundries using in-duction furnaces implement an optimising melting process (CI7). Similarly, 5 out 6 firms using cupola (CI6), and 6 out of 7 using rotary (CI8) apply this technology. These results seem to show that processes can be equally enhanced in the three types of furnaces, even though in the foundry sector, the induction furnace is pre-ferred as the best option to achieve energy efficiency. Other BATs commonly implemented within the 25 cast iron foundries include using oxy-fuel burners (CI10), operating space heating and hot water supply (CI13), and having indicators on fans (CI14), im-plemented by 12, 11 and 10 firms, respectively. In contrast, the BATs less employed in this sector include only two firms using recovery heat solutions (CI2) and none of the firms implementing Pulverised Coal Injection – PCI (CI11) or Scraps Pre-heating-SPh (CI4). This preference could be explained by the fact that applying PCI can be costly, especially if a complex layout for the plant in-creases the installation costs, and operating the SPh process can be inconvenient due to its complex ratio of time spent and energy savings obtained if staff is not trained properly (The Institute for
C14
C15
C16
C17
C18
C19
C20
C21
C22
C23
C24
C25
C26
C27
C28
C29
C30
Firmsogies for the whole sample of foundries.
Industrial Productivity, 2013a).Similarly as before, we analysed the evaluation of the adoption
rate of BATs by each of the innovation sub-categories. By doing this breakdown, it is possible to see that the 10 foundries grouped in TIRDþTINB had slightly higher adoption rates of BATs of 4% and 5% with respect to the ALL and TIRD categories (Graph B in Fig. 2). This result seems to suggest that combining inbound OI practices with internal R&D practices could lead to a greater adoption level of energy efficiency BATs than focusing only on internal innovation practices. It was also noticed that, when looking at the details of the most and less used BATs, we did not find a major difference between the ALL, TIRD or TIRDþTINB sub-categories. This could be explained by the fact that the mix of alloy foundries comprising the ALL group remains alike for the TIRD group (20 cast iron and 4 aluminium) and different but still comparable for TIRDþTINB (6 cast iron and 4 aluminium). Although these different mixes could imply that aluminium foundries are more likely to combine dif-ferent innovation practices, due to our limited number of cases for this alloy, it is difficult to provide such a conclusion. In contrast, the detailed analysis on BATs adopted by the sampled cast iron foundries can provide more precise insights. For instance, it seems that these foundries, independently of their innovation levels, can implement some energy-efficient technologies, such as CI1, CI10, CI13 and CI14. In fact, we shared this suggestion with the man-agers of the foundry association, who concurred that these BATs should be adopted as the minimum level in the cast iron foundry sector in Italy and in Europe.
To explore the influence of different adoption levels of BATs on other EEI, we further assessed the effect of adopting more or fewer BATs on the foundry's level of SEC. Based on this idea, we analysed 23 foundries considered BAT-L and 7 as BAT-H because the dif-ference of 0.33 in their mean SEC values was considered relevant (BAT-L¼1.96 and BAT-H¼2.29). This result shows that having a higher adoption level of BATs also seems to have a slight but re-latively significant influence on the level of energy efficiency in terms of the SEC value. This finding, while preliminary, seems to suggest that the studied foundries having better technology and innovation management techniques and tools (e.g., see Hidalgo and Albors (2008)) benefit not only in terms of the quality of the technologies being used but also in terms of the efforts towards being energy efficient.
The most adopted BATs by foundries grouped as BAT-H include using a state-of-the-art power plant (CI1), oxy fuel burners in ovens and vessels (CI10), space heating and having a hot water supply (CI13), and indicators on fans (CI14). These BATs affect the 34% adoption level of BATs for all foundries assessed on site by the authors and association experts, in comparison to the average 32%adoption rate of new energy-efficient technologies self-reported by top management during the interviews. This minimal differ-ence suggests a high awareness by the studied foundries on the technologies and energy saving opportunities for reducing energy consumption (Cagno and Trianni, 2012), which, if addressed by local authorities through proper policies, could further diffuse the
Table 10Frequencies of barriers to energy efficiency by categories ad by perceived importance fo
Categories Not important Scarcely important Import(1) (2) (3)
Economic 0 5 15Organisational 5 19 4Information 5 13 12Behavioural 8 18 4Competences 3 20 7Awareness 3 26 1Technology 0 11 13
adoption of specific energy-efficient BATs, as previously mentioned.
4.5. Analysis of the level of perceived barriers (BEEs)
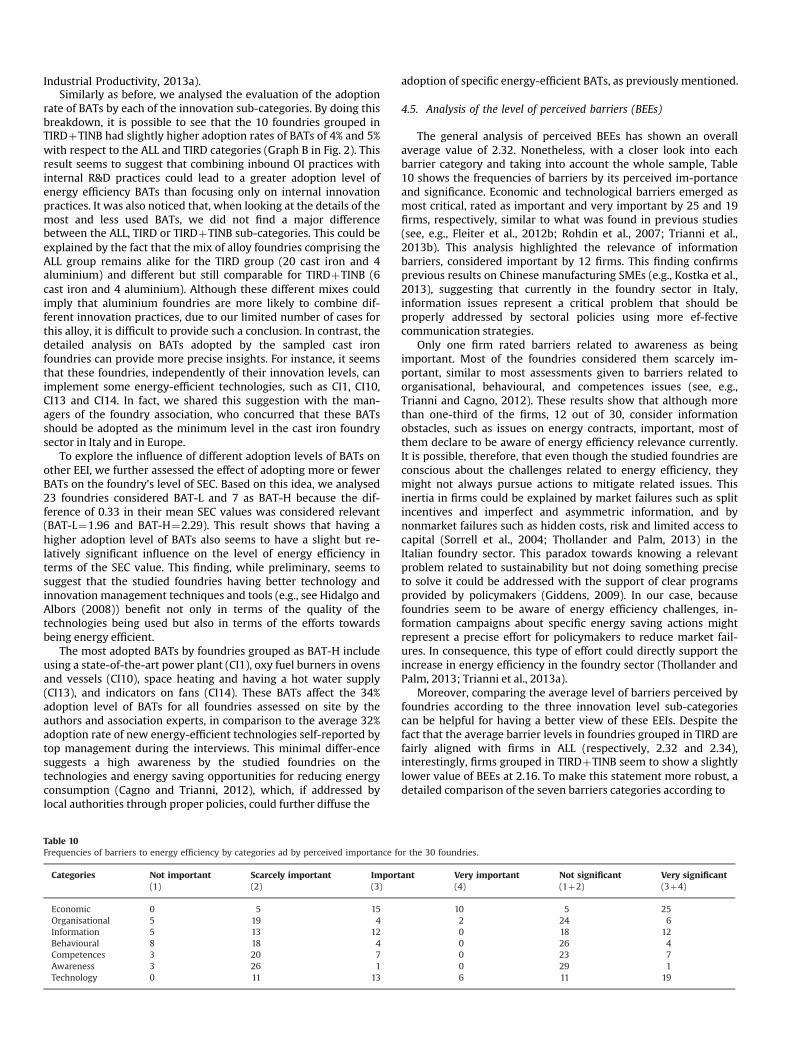
The general analysis of perceived BEEs has shown an overall average value of 2.32. Nonetheless, with a closer look into each barrier category and taking into account the whole sample, Table 10 shows the frequencies of barriers by its perceived im-portance and significance. Economic and technological barriers emerged as most critical, rated as important and very important by 25 and 19 firms, respectively, similar to what was found in previous studies (see, e.g., Fleiter et al., 2012b; Rohdin et al., 2007; Trianni et al., 2013b). This analysis highlighted the relevance of information barriers, considered important by 12 firms. This finding confirms previous results on Chinese manufacturing SMEs (e.g., Kostka et al., 2013), suggesting that currently in the foundry sector in Italy, information issues represent a critical problem that should be properly addressed by sectoral policies using more ef-fective communication strategies.
Only one firm rated barriers related to awareness as being important. Most of the foundries considered them scarcely im-portant, similar to most assessments given to barriers related to organisational, behavioural, and competences issues (see, e.g., Trianni and Cagno, 2012). These results show that although more than one-third of the firms, 12 out of 30, consider information obstacles, such as issues on energy contracts, important, most of them declare to be aware of energy efficiency relevance currently. It is possible, therefore, that even though the studied foundries are conscious about the challenges related to energy efficiency, they might not always pursue actions to mitigate related issues. This inertia in firms could be explained by market failures such as split incentives and imperfect and asymmetric information, and by nonmarket failures such as hidden costs, risk and limited access to capital (Sorrell et al., 2004; Thollander and Palm, 2013) in the Italian foundry sector. This paradox towards knowing a relevant problem related to sustainability but not doing something precise to solve it could be addressed with the support of clear programs provided by policymakers (Giddens, 2009). In our case, because foundries seem to be aware of energy efficiency challenges, in-formation campaigns about specific energy saving actions might represent a precise effort for policymakers to reduce market fail-ures. In consequence, this type of effort could directly support the increase in energy efficiency in the foundry sector (Thollander and Palm, 2013; Trianni et al., 2013a).
Moreover, comparing the average level of barriers perceived by foundries according to the three innovation level sub-categories can be helpful for having a better view of these EEIs. Despite the fact that the average barrier levels in foundries grouped in TIRD are fairly aligned with firms in ALL (respectively, 2.32 and 2.34), interestingly, firms grouped in TIRDþTINB seem to show a slightly lower value of BEEs at 2.16. To make this statement more robust, a detailed comparison of the seven barriers categories according to
r the 30 foundries.
ant Very important Not significant Very significant(4) (1þ2) (3þ4)
10 5 252 24 60 18 120 26 40 23 70 29 16 11 19

3.17 3.21 3.10
2.83 2.83
2.60
2.23 2.21
1.70
2.13 2.17
2.00 2.10
2.17
2.00 1.93 1.96
2.10
1.87 1.83
1.60 1.50 1.70 1.90 2.10 2.30 2.50 2.70 2.90 3.10 3.30
ALL TIRD TIRD + TINB
Lev
el o
f per
ceiv
ed b
arri
ers
Economic Technology Information CompetenceOrganizational Awareness Behavioural
Fig. 4. Level of perceived barriers to energy efficiency for the three innovation sub-categories.
the three innovation sub-groups is shown in Fig. 4. When com-paring the average barrier levels in the TIRDþTINB group, it is possible to notice some differences, e.g., information barriers showing similar scores between firms in the ALL and TIRD groups. In particular, all barriers seem to have a decreasing slope from the two groups ALL and TIRD to the TIRDþTINB group. The only ex-ception is barriers related to awareness, which increases its value in the group of more innovative firms. This finding could be jus-tified because using more inbound OI activities would inherently expose foundries to more external knowledge, making it possible for them to be exposed to technologies and practices of which they were not aware before. However, it is probable that foundries, as found by literature for other traditional industries, might need assistance in building absorptive capacity to use this external knowledge in the best possible way (Spithoven et al., 2010), and using collective research centres supported by local authorities could be an option.
Among other interesting differences, we can see that the levels of information and behavioural barriers seem to drop when the studied foundries adopt more INB practices, which can be ex-plained by the fact that one of the basic notions of the Open In-novation model is the inflow and outflow of information and knowledge, which in turn could influence the behaviour of the whole organisation (Chesbrough, 2003). Less profoundly but still interestingly, organisational and competences barriers seem to decrease for foundries adopting INB practices in addition to IRD
Fig. 5. (A) Adoption rate of best available technologies according to foundries with higsumption according to foundries with high and low levels of barriers to energy efficiencyto 2.5. BEE-L: Firms that have an average level of perceived barriers lower than 2.5.
practices i.e., firms in the TIRDþTINB group. In fact, according to our previous results, certain INB practices with high adoption le-vels in our sample of foundries, such as external training of per-sonnel to improve the innovation process (Ib10) and conducting technology scouting (Ib3), could support the gathering of external skills to identify opportunities for energy savings.
In addition, we have assessed the relationship of barriers with the level of adoption of BATs. Thus, to be consistent with previous criteria, we considered relevant making a comparison between the 22 BEE-L foundries and the 8 BEE-H foundries because the dif-ference of 12% between their BAT adoption rates, i.e., 37% and 25%, respectively, is substantial. This preliminary result shows that foundries that perceive lower BEEs adopt more BATs. Conversely, the more barriers perceived by a firm, the lower its BAT adoption level is. To reinforce this finding and provide additional evidence, we added an analysis of the BAT adoption level among foundries with high (BEE-H) and low (BEE-L) average levels of barriers (Graph A in Fig. 5).
Differences between foundries having low and high levels of BEE are visible, but the most notable ones mainly pertain to two barriers. First, the BAT adoption rate increases by 9% when foun-dries perceive lower information-related barriers. This trend could be explained, as noticed during the visits to the foundries, by the fact that managers perceiving lower obstacles to obtaining in-formation from different sources often increase their interest in energy efficiency, benefit from discovering new technologies, and
h and low levels of barriers to energy efficiency. (B) Level of specific energy con-. BEE-H: Firms that have an average level of perceived barriers higher than or equal
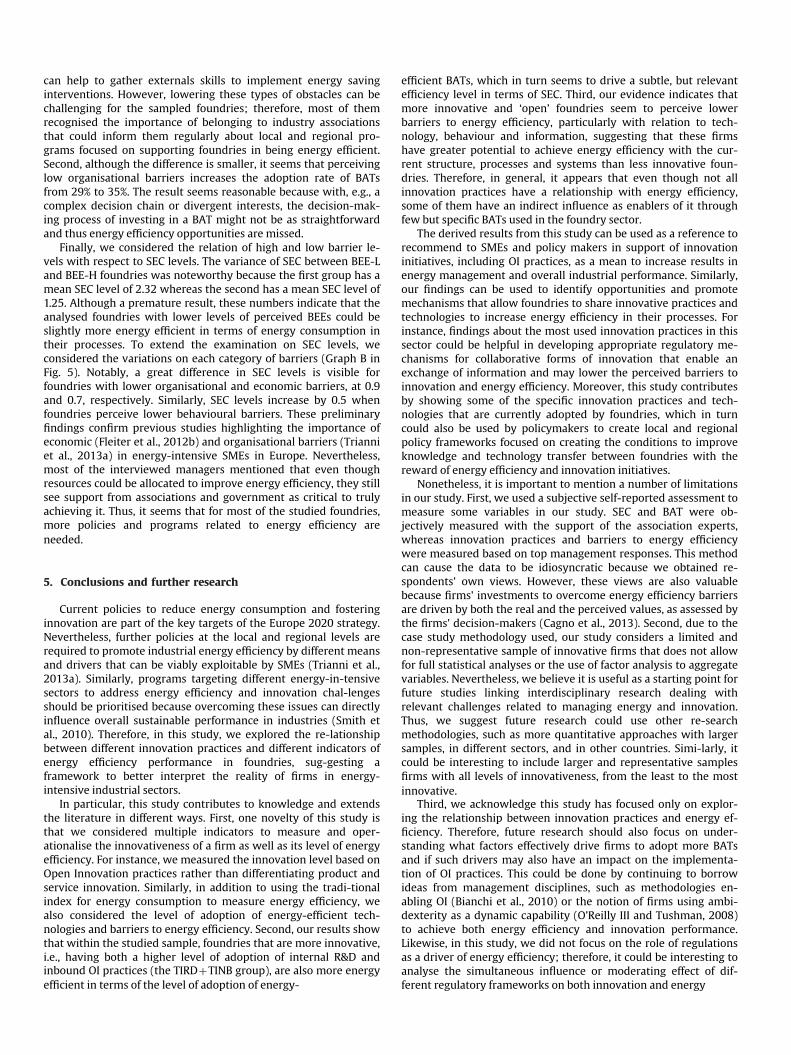
can help to gather externals skills to implement energy saving interventions. However, lowering these types of obstacles can be challenging for the sampled foundries; therefore, most of them recognised the importance of belonging to industry associations that could inform them regularly about local and regional pro-grams focused on supporting foundries in being energy efficient. Second, although the difference is smaller, it seems that perceiving low organisational barriers increases the adoption rate of BATs from 29% to 35%. The result seems reasonable because with, e.g., a complex decision chain or divergent interests, the decision-mak-ing process of investing in a BAT might not be as straightforward and thus energy efficiency opportunities are missed.
Finally, we considered the relation of high and low barrier le-vels with respect to SEC levels. The variance of SEC between BEE-L and BEE-H foundries was noteworthy because the first group has a mean SEC level of 2.32 whereas the second has a mean SEC level of 1.25. Although a premature result, these numbers indicate that the analysed foundries with lower levels of perceived BEEs could be slightly more energy efficient in terms of energy consumption in their processes. To extend the examination on SEC levels, we considered the variations on each category of barriers (Graph B in Fig. 5). Notably, a great difference in SEC levels is visible for foundries with lower organisational and economic barriers, at 0.9 and 0.7, respectively. Similarly, SEC levels increase by 0.5 when foundries perceive lower behavioural barriers. These preliminary findings confirm previous studies highlighting the importance of economic (Fleiter et al., 2012b) and organisational barriers (Trianni et al., 2013a) in energy-intensive SMEs in Europe. Nevertheless, most of the interviewed managers mentioned that even though resources could be allocated to improve energy efficiency, they still see support from associations and government as critical to truly achieving it. Thus, it seems that for most of the studied foundries, more policies and programs related to energy efficiency are needed.
5. Conclusions and further research
Current policies to reduce energy consumption and fostering innovation are part of the key targets of the Europe 2020 strategy. Nevertheless, further policies at the local and regional levels are required to promote industrial energy efficiency by different means and drivers that can be viably exploitable by SMEs (Trianni et al., 2013a). Similarly, programs targeting different energy-in-tensive sectors to address energy efficiency and innovation chal-lenges should be prioritised because overcoming these issues can directly influence overall sustainable performance in industries (Smith et al., 2010). Therefore, in this study, we explored the re-lationship between different innovation practices and different indicators of energy efficiency performance in foundries, sug-gesting a framework to better interpret the reality of firms in energy-intensive industrial sectors.
In particular, this study contributes to knowledge and extends the literature in different ways. First, one novelty of this study is that we considered multiple indicators to measure and oper-ationalise the innovativeness of a firm as well as its level of energy efficiency. For instance, we measured the innovation level based on Open Innovation practices rather than differentiating product and service innovation. Similarly, in addition to using the tradi-tional index for energy consumption to measure energy efficiency, we also considered the level of adoption of energy-efficient tech-nologies and barriers to energy efficiency. Second, our results show that within the studied sample, foundries that are more innovative, i.e., having both a higher level of adoption of internal R&D and inbound OI practices (the TIRDþTINB group), are also more energy efficient in terms of the level of adoption of energy-
efficient BATs, which in turn seems to drive a subtle, but relevant efficiency level in terms of SEC. Third, our evidence indicates that more innovative and ‘open’ foundries seem to perceive lower barriers to energy efficiency, particularly with relation to tech-nology, behaviour and information, suggesting that these firms have greater potential to achieve energy efficiency with the cur-rent structure, processes and systems than less innovative foun-dries. Therefore, in general, it appears that even though not all innovation practices have a relationship with energy efficiency, some of them have an indirect influence as enablers of it through few but specific BATs used in the foundry sector.
The derived results from this study can be used as a reference to recommend to SMEs and policy makers in support of innovation initiatives, including OI practices, as a mean to increase results in energy management and overall industrial performance. Similarly, our findings can be used to identify opportunities and promote mechanisms that allow foundries to share innovative practices and technologies to increase energy efficiency in their processes. For instance, findings about the most used innovation practices in this sector could be helpful in developing appropriate regulatory me-chanisms for collaborative forms of innovation that enable an exchange of information and may lower the perceived barriers to innovation and energy efficiency. Moreover, this study contributes by showing some of the specific innovation practices and tech-nologies that are currently adopted by foundries, which in turn could also be used by policymakers to create local and regional policy frameworks focused on creating the conditions to improve knowledge and technology transfer between foundries with the reward of energy efficiency and innovation initiatives.
Nonetheless, it is important to mention a number of limitations in our study. First, we used a subjective self-reported assessment to measure some variables in our study. SEC and BAT were ob-jectively measured with the support of the association experts, whereas innovation practices and barriers to energy efficiency were measured based on top management responses. This method can cause the data to be idiosyncratic because we obtained re-spondents' own views. However, these views are also valuable because firms' investments to overcome energy efficiency barriers are driven by both the real and the perceived values, as assessed by the firms' decision-makers (Cagno et al., 2013). Second, due to the case study methodology used, our study considers a limited and non-representative sample of innovative firms that does not allow for full statistical analyses or the use of factor analysis to aggregate variables. Nevertheless, we believe it is useful as a starting point for future studies linking interdisciplinary research dealing with relevant challenges related to managing energy and innovation. Thus, we suggest future research could use other re-search methodologies, such as more quantitative approaches with larger samples, in different sectors, and in other countries. Simi-larly, it could be interesting to include larger and representative samples firms with all levels of innovativeness, from the least to the most innovative.
Third, we acknowledge this study has focused only on explor-ing the relationship between innovation practices and energy ef-ficiency. Therefore, future research should also focus on under-standing what factors effectively drive firms to adopt more BATs and if such drivers may also have an impact on the implementa-tion of OI practices. This could be done by continuing to borrow ideas from management disciplines, such as methodologies en-abling OI (Bianchi et al., 2010) or the notion of firms using ambi-dexterity as a dynamic capability (O’Reilly III and Tushman, 2008) to achieve both energy efficiency and innovation performance. Likewise, in this study, we did not focus on the role of regulations as a driver of energy efficiency; therefore, it could be interesting to analyse the simultaneous influence or moderating effect of dif-ferent regulatory frameworks on both innovation and energy
efficiency efforts. In this sense, investigating the influence of or-ganisational structure in energy-intensive SMEs, e.g., the presenceor absence of energy managers due to regulations, could providean interesting vein of further research.
Finally, we also noted that most of the examined foundries donot measure their energy consumption levels and targets in tonnesof oil equivalent [toe] but rather in kilowatt-hours, in contrast toguidelines suggested in the Energy Efficiency Directive approvedin 2012. This situation, together with our main findings, suggeststhe need for local and regional policy makers to support andmonitor larger policies, programs and frameworks to enhancepositive expectations towards energy efficiency and increase in-novation (Foxon et al., 2005). We have taken a small but steadystep towards understanding the link between innovation practicesand energy efficiency, but more research is still needed. Likewise,policies and regulatory frameworks that separately stimulate en-ergy efficiency and R&D are currently in place, but more can bedone. Therefore, we encourage further involvement from re-searchers and policymakers to find the right coactive strategiesthat can support the achievement of the challenging targets set on
innovation and energy efficiency that are still ahead of us.Acknowledgements
The authors would like to warmly thank Andrea Consonni aswell as managers and experts from ASSOFOND, ASSOMET andFEDERACCIAI for their support in contacting the firms and col-lecting data. Likewise, they kindly thank the relevant input pro-vided during seminars at KTH Royal Institute of Technology(Sweden) and EIB Symposium at Barcelona University (Spain). Lastbut not least, we want to thank the two anonymous reviewers fortheir valuable suggestions and comments, which helped us im-prove our work. This paper is produced as part of the EMJD Pro-gramme European Doctorate in Industrial Management (EDIM)
funded by the European Commission, Erasmus Mundus Action 1.d
References
ASSOFOND, 2013. La fonderia nel 2012 (in Italian) [WWW Document]. Ital. Foun-dries' Assoc. URL: ⟨http://www.assofond.it⟩.
ASSOMET, 2014. Membership list [WWW Document]. Natl. Assoc. Non-Ferrous Met.
Foundries. URL: ⟨http://www.assomet.it⟩.Backlund, S., Thollander, P., Giudici, L., 2011. Foundry Bench: A Study of Barriers to
and Drivers for Energy Efficiency in the Foundry Industry in Finland, France, Germany, Italy, Poland, Spain and Sweden. Linköping, Sweden.BCS, 2007. U.S. Energy Requirements for Aluminum Production: Historial Per-
spective, Theoretical Limits and Current Practices. Laurel, Maryland.Bianchi, M., Campodall’Orto, S., Frattini, F., Vercesi, P., 2010. Enabling open in-novation in small- and medium-sized enterprises: how to find alternative ap-
plications for your technologies. R&D Manag. 40, 414–431.Brown, M.A., 2001. Market failures and barriers as a basis for clean energy policies.
Energy Policy 29, 1197–1207.Brunswicker, S., Ehrenmann, F., 2013. Managing open innovation in SMEs: a good
practice example of a German software firm. Int. J. Ind. Eng. Manag. 4, 33–41. Brunswicker, S., Vanhaverbeke, W., 2011. Beyond Open Innovation in Large En-terprises: HOW do Small and Medium-sized Enterprises (SMEs) Open up to
External Innovation Sources? Available at SSRN 1925185.Bryman, A., Bell, E., 2007. Business Research Methods, 2nd ed. Oxford University
Press, Oxford.Cagno, E., Trianni, A., 2012. Analysis of the most effective energy efficiency op-
portunities in manufacturing primary metals, plastics, and textiles small- and medium-sized enterprises. J. Energy Resour. Technol. 134, 1–9.Cagno, E., Worrell, E., Trianni, A., Pugliese, G., 2013. A novel approach for barriers to
industrial energy efficiency. Renew. Sustain. Energy Rev. 19, 290–308.Caird, S., Hallett, S., Potter, S., 2013. The Open2-Innova8ion Tool – a software tool
forrating organisational innovation performance. Technovation 33, 381–385. Cheng,
C.C.J., Huizingh, E.K.R.E., 2014. When is open innovation beneficial? The roleof strategic orientation. J. Prod. Innov. Manag. 31, 1235–1253.
Chesbrough, H., 2003. Open Innovation: The New Imperative for Creating andProfiting from Technology. Harvard Business Press, Boston.
Chesbrough, H., 2006. Open innovation: a new paradigm for understanding
industrial innovation In: Chesbrough, H., W.Vanhaverbeke, W., West, J. (Eds.), Open Innovation: Researching a New Paradigm. Oxford University Press, Ox-ford, pp. 1–12.
Chesbrough, H., Crowther, A., 2006. Beyond high tech: early adopters of open in-novation in other industries. R&D Manag. 36, 229–236.
Chesbrough, H., Vanhaverbeke, W., West, J., 2006. Open Innovation: Researching a New Paradigm. Oxford University Press, Oxford.Chiaroni, D., Chiesa, V., Frattini, F., 2010. Unravelling the process from closed toopen innovation: evidence from mature, asset-intensive industries. R&D
Manag. 40, 222–245.Choate, W.T., Green, J.A.S., 2003. US aluminum production energy requirements:
historical perspective, theoretical limits, and new opportunities. In: 2003ACEEE Summer Study on Energy Efficiency in Industry. Washington, pp. 1–13.
Christensen, J.F., Olesen, M.H., Kjær, J.S., 2005. The industrial dynamics of openinnovation – evidence from the transformation of consumer electronics. Res.
Policy 34, 1533–1549.Cohen, W.M., Levinthal, D.A., 1990. Absorptive capacity: a new perspective on
learning and innovation. Adm. Sci. Q. 35, 128–152.Conte, A., 2002. Innovation in Italian Industry: A Firm-level Analysis. University of
Turin Research Paper.Dahlander, L., Gann, D.M., 2010. How open is innovation? Res. Policy 39, 699–709. De Backer, K., Cervantes, M., van de Velde, E., 2008. Open Innovation in Global
Networks. OECD Publishing, Paris.De Massis, A., Lazzarotti, V., Pizzurno, E., Salzillo, E., 2012. Open Innovation in the
automotive industry: a multiple case-study In: Sun, H. (Ed.), Management of Technological Innovation in Developing and Developed Countries. InTech, Ri-jeka, Crovatia, pp. 217–235.
Ebersberger, B., Bloch, C., Herstad, S.J., van de Velde, E., 2012. Open innovationpractices and their effect on innovation. Int. J. Innov. Technol. Manag. 9, 1–22.
Eisenhardt, K.M., Graebner, M.E., 2007. Theory building from cases: opportunitiesand challenges. Acad. Manag. Rev. 50, 25–32.
EPA, 2008. BAT Guidance Note on Best Available Techniques for the Non-FerrousMetals and Galvanising. Wexford, Ireland.
EPA, 2012. BAT Guidance Note on Best Available Techniques for Ferrous MetalsFoundries. Wexford, Ireland.
European Commission, 2005. Reference Document on Best Available Techniques inthe Smitheries and Foundries Industry.
European Commission, 2010. Europe 2020: A Strategy for Smart, Sustainable andInclusive Growth: Communication from the Commission. Brussels.
European Commission, 2012. BAT conclusions for iron and steel production. Off. J.Eur. Union 55, 63–98.
European Commission, 2013a. EU Energy in Figures: Statistical Pocketbook 2013.Luxemburg.
European Commission, 2013b. Digital Agenda for Europe: A Europe 2020 Initiative[WWW Document]. Eur. Comm. Dir. Gen. Commun. Networks, Content Technol.
URL: ⟨http://ec.europa.eu/digital-agenda/en⟩.European Commission, 2013c. Open Innovation 2.0 Yearbook 2013. Luxemburg. European Council for an Energy Efficient Economy, 2014. We're All About Energy
Efficiency and Energy Savings [WWW Document]. About ECEEE. URL: ⟨http://eceee.org/about-eceee⟩.
Eurostat, 2013. Community Innovation Survey (CIS) [WWW Document]. Commu-nity Innov. Surv.-Descr. dataset. URL: ⟨http://epp.eurostat.ec.europa.eu/portal/page/portal/microdata/cis⟩.
FEDERACCIAI, 2014. Steel Industry in Italy [WWW Document]. Fed. Ital. Steel Co.URL: ⟨www.federacciai.it⟩.
Fink, A., 2003. The Survey Handbook. Sage Publications Ltd., London.Firth, L., Mellor, D., 1999. The impact of regulation on innovation. Eur. J. Law Econ. 8, 199–205.Fleiter, T., Hirzel, S., Worrell, E., 2012a. The characteristics of energy-efficiency
measures – a neglected dimension. Energy Policy 51, 502–513.Fleiter, T., Schleich, J., Ravivanpong, P., 2012b. Adoption of energy-efficiency mea-
sures in SMEs – an empirical analysis based on energy audit data from Ger-many. Energy Policy 51, 863–875.Foxon, T., Gross, R., Chase, A., Howes, J., Arnall, A., Anderson, D., 2005. UK innova-tion systems for new and renewable energy technologies: drivers, barriers an
systems failures. Energy Policy 33, 2123–2137.Gassmann, O., 2006. Opening up the innovation process: towards an agenda. R&D
Manag. 36, 223–228.Gassmann, O., Enkel, E., 2004. Towards a theory of open innovation: three core
process archetypes. In: Proceedings of the R&D Management Conference(RADMA). Lisbon, Portugal, pp. 1–18.
Geels, F.W., 2002. Technological transitions as evolutionary reconfiguration pro-cesses: a multi-level perspective and a case-study. Res. Policy 31, 1257–1274.
Giddens, A., 2009. The Politics of Climate Change, 1st ed. Polity Press, Cambridge. Hakkim, R.P., Heidrick, T.R., 2008. Open innovation in the energy sector. In: Pro-ceedings of the PICMET 2008. Cape Town, South Africa, pp. 565–571. Hasanbeigi, A.,
Menke, C., du Pont, P., 2010. Barriers to energy efficiency improve-ment and decision-making behavior in Thai industry. Energy Effic. 3, 33–52. Helber,
J., Steinhäuser, M., 2011. Foundrybench D19 Good Practice Guide on EnergySaving Potentials and Opportunities for Foundries. Düsseldorf.
Hidalgo, A., Albors, J., 2008. Innovation management techniques and tools: a reviewfrom theory and practice. R&D Manag. 38, 113–127.
Hirsch-Kreinsen, H., Jacobson, D., 2008. Innovation in Low-tech Firms and In-dustries. Edward Elgar Publishing, Cheltenham, UK.
Huizingh, E., 2011. Open innovation: state of the art and future perspectives.Technovation 31, 2–9.
IEA, 2013. Energy Balances of Non-OECD Countries. Paris. http://dx.doi.org/10.1787/energy_bal_non-oecd-2013-en.
Ili, S., Albers, A., Miller, S., 2010. Open innovation in the automotive industry. R&DManag 40, 246–255.
Kline, S.J., Rosenberg, N., 1986. An Overview of Innovation. In: Landau, R., Rosen-berg, N. (Eds.), The Positive Sum Strategy: Harnessing Technology for Economic
Growth. National Academies Press, Washington, D.C., pp. 275–305.Kostka, G., Moslener, U., Andreas, J., 2013. Barriers to increasing energy efficiency: evi-
dence from small-and medium-sized enterprises in China. J. Clean. Prod. 57, 59–68. Laursen, K., Salter, A., 2006. Open for innovation: the role of openness in explaining
innovation performance among U.K. manufacturing firms. Strateg. Manag. J. 27, 131–150.Lazzarotti, V., Manzini, R., 2009. Different modes of open innovation: a theoretical
framework and an empirical study. Int. J. Innov. Manag. 13, 615–636.Lazzarotti, V., Manzini, R., Pellegrini, L., 2010. Open innovation models adopted in
practice: an extensive study in Italy. Meas. Bus. Excell. 14, 11–23.Lazzarotti, V., Manzini, R., Pellegrini, L., 2011. Firm-specific factors and the opennessdegree: a survey of Italian firms. Eur. J. Innov. Manag. 14, 412–434. Lichtenthaler, U., 2009. Outbound open innovation and its effect on firm perfor-mance: examining environmental influences. R&D Manag. 39, 317–330. Lutzenhiser,
L., 1994. Innovation and organizational networks: barriers to energyefficiency in the US housing industry. Energy Policy 22, 867–876.
March, J., 1991. Exploration and exploitation in organizational learning. Organ. Sci.2, 71–87.
Martin, R., Muûls, M., de Preux, L.B., Wagner, U.J., 2014. Industry compensationunder relocation risk: a firm-level analysis of the EU emissions trading scheme.
Am. Econ. Rev. 104, 2482–2508.Mazzola, E., Bruccoleri, M., Perrone, G., 2012. The effect of inbound, outbound and
coupled innovation on performance. Int. J. Innov. Manag. 16, 27.Negassi, S., 2004. R&D co-operation and innovation a microeconometric study on
French firms. Res. Policy 33, 365–384.Norup, J., Taylor, G., 2005. Best practice benchmarking in energy efficiency: Cana-
dian Automotive Parts Industry. In: Summer Study on Energy Efficiency in In-dustry. Niagara Falls, NY, pp. 96–106.O’Reilly III, C.A., Tushman, M.L., 2008. Ambidexterity as a dynamic capability: re-
solving the innovator's dilemma. Res. Organ. Behav. 28, 185–206.OECD, 2005. Oslo Manual: Guidelines for Collecting and Interpreting Innovation
Data, 3rd ed. OECD Publishing, Paris.OECD, 2008. Empirical measures of open innovation. In: De Backer, K., Cervantes, M.,van de Velde, E. (Eds.), Open Innovation in Global Networks. OECD Publishing, Paris, pp. 49-75.OECD, 2013a. OECD Science, Technology and Industry Scoreboard 2013: Innovation
for Growth. OECD Publishing, Paris.OECD, 2013b. STAN Industry Rev. 4 [WWW Document]. STAN OECD Struct. Anal.
Stat. (database).Parida, V., Larsson, T., Isaksson, 0., Oghazi, P., 2011. Towards open innovation
practices in aerospace industry: challenges and opportunities. In: Proceedingsof the 3rd International Conference on Research into Design, ICoRD’11. Ban-galore, India.
Patterson, M.G., 1996. What is energy efficiency? Concepts, indicators and meth-odological issues. Energy Policy 24, 377–390.
Ramirez-Portilla, A., Cagno, E., Trianni, A., 2014. Is innovation an enabler of energyefficiency? An exploratory study of the foundry sector. Energy Procedia 61,1191–1195.
Reddy, A.K.N., 1991. Barriers to improvements in energy efficiency. Energy Policy19, 953–961.
Remus, R., Aguado Monsonet, M.A., Roudier, S., Delgado Sancho, L., 2013. BestAvailable Techniques (BAT) Reference Document for Iron and Steel Production.
Seville, Spain.Robertson, P., von Tunzelmann, N., 2009. Innovation in low- and medium-tech-
nology industries. Res. Policy 38, 441–446.Rohdin, P., Thollander, P., Solding, P., 2007. Barriers to and drivers for energy effi-
ciency in the Swedish foundry industry. Energy Policy 35, 672–677.Santamaría, L., Nieto, M.J., Barge-Gil, A., 2009. Beyond formal R&D: taking ad-vantage of other sources of innovation in low- and medium-technology
industries. Res. Policy 38, 507–517.Schroll, A., Mild, A., 2012. A critical review of empirical research on open innovation adoption. J. Betriebswirtschaft 62, 85–118.Smith, A., Voß, J.-P., Grin, J., 2010. Innovation studies and sustainability transitions: the allure of the multi-level perspective and its challenges. Res. Policy 39, 435–448.Sorrell, S., O’Malley, E., Schleich, J., Scott, S., 2004. The Economics of Energy Effi-
ciency: Barriers to Cost-effective Investment. Edward Elgar Publishing, Chel-tenham, UK.
Sorrell, S., Schleich, J., Scott, S., O’Malley, E., Trace, F., Boede, U., 2000. ReducingBarriers to Energy Efficiency in Public and Private Organizations. SPRU, Final
Report.Spithoven, A., Clarysse, B., Knockaert, M., 2010. Building absorptive capacity to
organize inbound open innovation in traditional industries. Technovation 30, 130–141.
Tanaka, K., 2008. Assessing Measures of Energy Efficiency Performance and TheirApplication in Industry. Paris.
Teece, D.J., 1986. Profiting from technological innovation: implications for in-tegration collaboration, licensing and public policy. Res. Policy 15, 285–305. The Institute for Industrial Productivity, 2013a. Industrial Efficiency TechnologyDatabase (IETD) [WWW Document]. Ind. Effic. Technol. Database Iron Steel.
URL: ⟨http://ietd.iipnetwork.org⟩.The Institute for Industrial Productivity, 2013b. Industrial Efficiency Policy Database
[WWW Document]. Mandat. Energy Manag. URL: ⟨http://ietd.iipnetwork.org⟩. Thollander, P., Danestig, M., Rohdin, P., 2007. Energy policies for increased in-dustrial energy efficiency: evaluation of a local energy programme for manu-
facturing SMEs. Energy Policy 35, 5774–5883.Thollander, P., Ottosson, M., 2010. Energy management practices in Swedish en-
ergy-intensive industries. J. Clean. Prod. 18, 1125–1133.Thollander, P., Palm, J., 2013. Improving Energy Efficiency in Industrial Energy
Systems. Springer, London.Trianni, A., Cagno, E., 2012. Dealing with barriers to energy efficiency and SMEs:
some empirical evidences. Energy 37, 494–504.Trianni, A., Cagno, E., Thollander, P., Backlund, S., 2013a. Barriers to industrial en-
ergy efficiency in foundries: a European comparison. J. Clean. Prod. 40, 161–176. Trianni, A., Cagno, E., Worrell, E., 2013b. Innovation and adoption of energy efficient
technologies: an exploratory analysis of Italian primary metal manufacturing SMEs. Energy Policy 61, 430–440.Trianni, A., Cagno, E., Worrell, E., Pugliese, G., 2013c. Empirical investigation of
energy efficiency barriers in Italian manufacturing SMEs. Energy 49, 444–458. U.S. Department of Energy, 2005. Advanced Melting Technologies: Energy Saving
Concepts and Opportunities for the Metal Casting Industry.UNIDO, 2010. Global Industrial Energy Efficiency Benchmarking: An Energy Policy
Tool. Vienna.Van de Vrande, V., de Jong, J.P.J., Vanhaverbeke, W., de Rochemont, M., 2009. Open
innovation in SMEs: trends, motives and management challenges. Technova-tion 29, 423–437.Van der Meer, H., 2007. Open innovation; the Dutch treat: challenges in thinking in
business models. Creat. Innov. Manag. 16, 192–202.Veugelers, R., 1997. Internal R&D expenditures and external technology sourcing.
Res. Policy 26, 303–315.Wen, J., Kobayashi, S., 2001. Exploring collaborative R&D network: some new evi-
dence in Japan. Res. Policy 30, 1309–1319.West, J., Bogers, M., 2013. Leveraging external sources of innovation: a review of
research on open innovation. J. Prod. Innov. Manag. 31, 1–18.Worrell, E., Biermans, G., 2005. Move over! Stock turnover, retrofit and industrial
energy. Energy Policy 33, 949–962.Wyman, O., 2007. 2015 Car Innovation.Xiaobao, P., Wei, S., Yuzhen, D., 2013. Framework of open innovation in SMEs in an emerging economy: firm characteristics, network openness, and network in-formation. Int. J. Technol. Manag. 62, 223–250.Yin, R.K., 2013. Case Study Research: Design and Methods, 5th ed. Sage Publications,
Inc., Thousand Oaks, CA.