effect of internal factors on financial - JKUAT Repository Home
212
EFFECT OF INTERNAL FACTORS ON FINANCIAL PERFORMANCE OF DEPOSIT TAKING SAVINGS AND CREDIT SOCIETIES IN KENYA JANE JEPKORIR BARUS DOCTOR OF PHILOSOPHY (Business Administration- Finance) JOMO KENYATTA UNIVERSITY OF AGRICULTURE AND TECHNOLOGY 2018
-
Upload
khangminh22 -
Category
Documents
-
view
0 -
download
0
Transcript of effect of internal factors on financial - JKUAT Repository Home
EFFECT OF INTERNAL FACTORS ON FINANCIAL
PERFORMANCE OF DEPOSIT TAKING SAVINGS AND
CREDIT SOCIETIES IN KENYA
JANE JEPKORIR BARUS
DOCTOR OF PHILOSOPHY
(Business Administration- Finance)
JOMO KENYATTA UNIVERSITY OF
AGRICULTURE AND TECHNOLOGY
2018
Effect of Internal Factors on Financial Performance of Deposit
Taking Savings and Credit Societies in Kenya
Jane Jepkorir Barus
A thesis submitted in partial fulfillment for the degree of Doctor of
Philosophy in Business Administration (Finance) in the
Jomo Kenyatta University of Agriculture and Technology
2018

ii
DECLARATION
This thesis is my original work and has not been presented for a degree in any other
university
Signature…………………………………… Date……………………………
Jane Jepkorir Barus
This thesis has been submitted for examination with our approval as supervisors
Signature…………………………. Date…………………………….
Prof. Willy Muturi
JKUAT, Kenya
Signature…………………………… Date……………………………...
Dr. Patrick Kibati
Kabarak University, Kenya

iii
DEDICATION
I dedicate this thesis to God the almighty for being the light of my life, to my late father
Jeremiah C. Barus who never lived long enough to see the academic achievements of
his children, my lovely mum Rael Barus, my wonderful family my husband Nixon
Kibiwott, my lovely children Faith Jerop, Mercy Jemeli, Joyline Jebet and Patience
Jeptum, for their great sacrifice, encouragement, support and prayers they made
especially during the process of my studies at Jomo Kenyatta University of Agriculture
and Technology. Thank you very much for always being there for me.

iv
ACKOWLEDGEMENT
To God the most merciful be glory and honor for His support throughout the entire
study and my life wholly. This work has been a result of the collective efforts of many
stakeholders ranging from institutions to individuals. I may not mention all of them,
but through this sentence I wish to appreciate their support without apportioning the
level of appreciation. My heartfelt gratitude’s goes to my supervisors Prof. Willy
Muturi and Dr. Patrick Kibati who cannot go without my special acknowledgement for
their relentless support, guidance and their constant support in writing this thesis, I
thank them sincerely for their patience and availability, my lecturers who imparted
cutting edge knowledge and skills during the course also deserve a special mention on
this page. I would also wish to acknowledge the contribution, immense support and
encouragement I received from my classmates Doctor of Philosophy in Business
Administration January, 2014 class. Special thanks to my fellow scholars who have
been a source of encouragement on my academic journey. May the almighty God bless
them all.
v
TABLE OF CONTENTS
DECLARATION ........................................................................................................ ii
DEDICATION ........................................................................................................... iii
ACKOWLEDGEMENT ........................................................................................... iv
LIST OF TABLES ................................................................................................... xii
LIST OF FIGURES ................................................................................................. xv
LIST OF APPENDICES ......................................................................................... xvi
ACRONYMS AND ABBREVIATIONS .............................................................. xvii
OPERATIONAL DEFINITION OF TERMS ...................................................... xix
ABSTRACT ........................................................................................................... xxiii
CHAPTER ONE ......................................................................................................... 1
INTRODUCTION ...................................................................................................... 1
1.1 Background of the Study ..................................................................................... 1
1.1.1 Deposit Taking SACCOs in Kenya ............................................................. 5
1.1.2. SACCO Regulatory Framework in Kenya ................................................. 8
1.1.3. SACCO Financial Performance ................................................................. 9
1.2 Statement of the Problem ................................................................................. 12
1.3 Research Objectives ......................................................................................... 14
1.3.1 General Objective ...................................................................................... 14
1.4 Research Hypotheses ....................................................................................... 15
1.5 Significance of the Study ................................................................................. 15
1.6 Scope of the Study ........................................................................................... 16
1.7 Limitations of the Study ................................................................................... 16
vi
CHAPTER TWO...................................................................................................... 18
LITERATURE REVIEW ........................................................................................ 18
2.1 Introduction ...................................................................................................... 18
2.2 Theoretical Framework .................................................................................... 18
2.2.1 Market Power Theory ................................................................................ 19
2.2.2 Monetarist Theory ..................................................................................... 21
2.2.3 Efficient Structure Theory ......................................................................... 22
2.2.4 Liquidity Theory ....................................................................................... 23
2.2.5 Portfolio Selection Theory ........................................................................ 26
2.2.6 Expense-Preference Behavior Theory ....................................................... 27
2.3 Conceptual Framework .................................................................................... 28
2.3.1 Capital adequacy ....................................................................................... 30
2.3.3 Management efficiency ............................................................................. 32
2.3.4 Earning ability ........................................................................................... 32
2.3.5 Liquidity .................................................................................................... 33
2.3.6 Sensitivity to Market Risk ......................................................................... 34
2.4 Empirical Literature Review ............................................................................ 35
2.4.1 Capital Adequacy and Financial Performance of Savings and Credit
Societies in Kenya .............................................................................................. 35
2.4.2 Asset Quality and Financial Performance of Savings and Credit Societies
in Kenya ............................................................................................................. 38
2.4.3 Management Efficiency and Financial Performance of Savings and Credit
Societies in Kenya .............................................................................................. 40
2.4.4 Earnings Ability and Financial Performance of Savings and Credit
Societies in Kenya .............................................................................................. 42
vii
2.4.5 Liquidity and Financial Performance of Savings and Credit Societies in
Kenya ................................................................................................................. 43
2.4.7 Sensitivity to Market Risk on Internal Factors of Financial Performance of
Savings and Credit Societies in Kenya .............................................................. 47
2.5 Critique of Reviewed Literature ....................................................................... 49
2.6 Research Gaps .................................................................................................. 50
2.7 Summary .......................................................................................................... 51
CHAPTER THREE ................................................................................................. 52
RESEARCH METHODOLOGY ........................................................................... 52
3.1 Introduction ...................................................................................................... 52
3.2 Research Philosophy ........................................................................................ 52
3.3 Research Design ............................................................................................... 53
3.4 Target Population ............................................................................................. 53
3.5 Sampling Frame ............................................................................................... 54
3.6 Sample Size and Sampling Technique ............................................................. 54
3.7 Data Collection Instruments ............................................................................. 55
3.8 Data Collection Procedure ............................................................................... 55
3.9 Pilot Testing ..................................................................................................... 56
3.9.1 Validity of the Research Instruments ........................................................ 56
3.9.2 Reliability of the Research Instruments .................................................... 57
3.10 Data Analysis and Presentation ...................................................................... 57
3.10.1 Diagnostic Tests ...................................................................................... 59
3.11 Operationalization of Variables ..................................................................... 60
CHAPTER FOUR .................................................................................................... 62
RESEARCH FINDINGS AND DISCUSSIONS .................................................... 62
viii
4.1 Introduction ...................................................................................................... 62
4.2 Response Rate .................................................................................................. 62
4.3 Demographic Characteristics ........................................................................... 63
4.3.1 Type of Membership ................................................................................. 63
4.3.2 Period of Existence .................................................................................... 64
4.4 Diagnostic Tests ............................................................................................... 64
4.4.1 Reliability Analysis ................................................................................... 64
4.4.2 Test for Normality of Residuals ................................................................ 66
4.4.3 Multicollinearity Test ................................................................................ 66
4.4.4 Heteroscedasticity Test ............................................................................. 68
4.5 Trend Analysis ................................................................................................. 68
4.5.1 Capital Adequacy ...................................................................................... 68
4.5.2 Asset Quality ............................................................................................. 69
4.5.3 Management Efficiency ............................................................................ 70
4.5.4 Earnings Ability ........................................................................................ 70
4.5.5 Liquidity .................................................................................................... 71
4.5.6 Sensitivity to Market Risks ....................................................................... 71
4.5.7 Financial Performance Trend .................................................................... 72
4.6 Effect of Capital Adequacy on Financial Performance of SACCOs ............... 72
4.6.1 Descriptive Statistics ................................................................................. 73
4.6.2 Cross Tabulation between Capital Adequacy and Financial Performance 75
4.6.3 Joint Capital Adequacy Elements and Financial Performance ................. 78
4.6.4 Capital Adequacy Elements and Financial Performance....................... 79
4.6.5 Hypothesis Testing .................................................................................... 80
ix
4.7 Effect of Asset Quality and Financial Performance of SACCOs .................... 80
4.7.1 Descriptive Statistics ................................................................................. 81
4.7.2 Cross Tabulation between Asset Quality and Financial Performance ...... 83
4.7.3 Joint Asset Quality Elements and Financial Performance ..................... 85
4.7.4 Asset Quality Elements and Financial Performance ............................. 86
4.7.5 Hypothesis Testing .................................................................................... 87
4.8 Effect of Management Efficiency and Financial Performance of SACCOs .... 88
4.8.1 Descriptive Statistics ................................................................................. 88
4.8.2 Cross Tabulation of Management Efficiency Elements ............................ 90
4.8.3 Joint management Efficiency Elements and Financial Performance ........ 93
4.8.4 Management Efficiency Elements and Financial Performance ................ 94
4.8.5 Hypothesis Testing .................................................................................... 94
4.9 Effects of Earnings Ability and Financial Performance of SACCOs .............. 95
4.9.1 Descriptive Statistics ................................................................................. 95
4.9.2 Cross Tabulation between Earnings Ability Elements and Financial
Performance ....................................................................................................... 98
4.9.3 Join Earnings Ability Elements and Financial Performance ................... 100
4.9.4 Earnings Ability Elements and Financial Performance ....................... 101
4.9.5 Hypothesis Testing .................................................................................. 102
4.10 Effect of Liquidity and Financial Performance of SACCOs ....................... 102
4.10.1 Descriptive Statistics ............................................................................. 103
4.10.2 Cross Tabulation between Liquidity Elements ..................................... 106
4.10.3 Joint Liquidity Elements and Financial Performance ........................... 108
4.10.5 Liquidity Elements and Financial Performance .................................... 109
4.10.5 Hypothesis Testing ................................................................................ 110
x
4.11 Sensitivity to Market Risks and Financial Performance .............................. 111
4.11.1 Descriptive Statistics ............................................................................. 111
4.11.2 Sensitivity to Market Risks and Financial Performance ....................... 113
4.12 Test for Moderating Effect of Sensitivity to Market Risk ........................... 114
4.12.1 Capital Adequacy and Sensitivity to Market Risk ................................ 114
4.12.2 Asset Quality and Sensitivity to Market Risk ....................................... 115
4.12.3 Management Efficiency and Sensitivity to Market Risk ...................... 116
4.12.4 Earnings Ability and Sensitivity to Market Risk................................... 116
4.12.5 Liquidity and Sensitivity to Market Risk .............................................. 117
4.13 Financial Performance of Savings and Credit Societies .............................. 117
4.13.1 Descriptive Statistics ................................................................................. 118
4.14 Correlation Analysis..................................................................................... 120
4.15 Multivariate Regression model before Moderation ..................................... 122
4.16 Multivariate Regression Model after Moderation ........................................ 124
4.17 Hypothesis Testing and Discussion ............................................................. 125
CHAPTER FIVE .................................................................................................... 129
SUMMARY, CONCLUSIONS AND RECOMMENDATIONS ........................ 129
5.1 Introduction .................................................................................................... 129
5.2 Summary of Findings ..................................................................................... 129
5.2.1 Capital Adequacy and Financial Performance ........................................ 129
5.2.2 Asset Quality and Financial Performance ............................................... 130
5.2.3 Management Efficiency and Financial Performance .............................. 131
5.2.4 Earnings Ability and Financial Performance .......................................... 131
5.2.5 Liquidity and Financial Performance ...................................................... 132
xi
5.2.6 Sensitivity to Market Risk ....................................................................... 132
5.3 Conclusions .................................................................................................... 133
5.3.1 Capital Adequacy and Financial Performance ........................................ 133
5.3.2 Asset Quality and Financial Performance ............................................... 134
5.3.3 Management Efficiency and Financial Performance .............................. 134
5.3.4 Earnings Ability and Financial Performance .......................................... 134
5.3.5 Liquidity and Financial Performance ...................................................... 134
5.3.6 Sensitivity to Market Risk ....................................................................... 135
5.4 Recommendations .......................................................................................... 135
5.4.1 Capital Adequacy and Financial Performance ........................................ 135
5.4.2 Asset Quality and Financial Performance ............................................... 135
5.4.3 Management Efficiency and Financial Performance .............................. 136
5.4.4 Earnings Ability and Financial Performance .......................................... 136
5.4.5 Liquidity and Financial Performance ...................................................... 136
5.5 Suggested areas for Further Study ................................................................. 136
REFERENCES ....................................................................................................... 138
APPENDICES ........................................................................................................ 157
xii
LIST OF TABLES
Table 3.1: Operationalization of Variables ............................................................... 61
Table 4.1: Response Rate .......................................................................................... 62
Table 4.2: Type of Membership ................................................................................ 63
Table 4.3: Period of Existence .................................................................................. 64
Table 4.4: Reliability Coefficient .............................................................................. 65
Table 4.5: Multicollinearity Test using Variance Inflation Factor ............................ 67
Table 4.6: Test for Heteroskedasticity ...................................................................... 68
Table 4.7: Capital Adequacy Descriptive Statistics .................................................. 73
Table 4.8: Cross Tabulation of Core Capital to Total Asset ..................................... 75
Table 4.9: Cross Tabulation of Institutional Capital to Total Asset .......................... 76
Table 4.10: Cross Tabulation of Core Capital of Kshs. 10 million ........................... 76
Table 4.11: Cross Tabulation of Core Capital to Total Deposits .............................. 77
Table 4.12: Regression model ................................................................................... 78
Table 4.13: Regression model ................................................................................... 79
Table 4.14: Asset Quality Descriptive Statistics ....................................................... 81
Table 4.15: Cross Tabulation of Credit Policy and Financial Performance ............. 83
Table 4.16: Cross Tabulation of State of the Economy ............................................ 83
Table 4.17: Cross Tabulation of Trend of Creditors ................................................. 84
Table 4.18: Cross Tabulation of Loan Portfolio Policy ............................................ 85
Table 4.19: Regression Model of Asset Quality and Financial Performance ........... 85
Table 4.20: Regression Model of Asset Quality and Financial Performance ........... 86
Table 4.21: Management Efficiency Descriptive Statistics ...................................... 88
Table 4.22: Cross Tabulation of Observing Management Efficiency ....................... 90
xiii
Table 4.23: Cross Tabulation of Improved Business Plan ........................................ 90
Table 4.24: Cross Tabulation of Internal and External Audit implementation ......... 91
Table 4.25: Cross Tabulation of Capability of Board of Directors and Senior
Management .......................................................................................... 92
Table 4.26: Cross Tabulation of Fit and Proper Test ................................................ 93
Table 4.27: Regression Model for Management Efficiency Elements ..................... 93
Table 4.28: Regression Model for Management Efficiency Elements ..................... 94
Table 4.29: Earnings Ability Descriptive Statistics .................................................. 95
Table 4.30: Earnings Ability Rating and Financial Performance ............................. 96
Table 4.31: Earnings Ability influence and Financial Performance ......................... 97
Table 4.32: Cross Tabulation of Earning Ability and Financial Performance ....... 98
Table 4.33: Cross Tabulation of Earning Ability Guards of Sacco........................... 99
Table 4.34: Cross Tabulation of Earning Ability and Financial Performance ....... 99
Table 4.35: Regression Model of Joint Earnings Ability Elements ........................ 100
Table 4.36: Regression Model of Earnings Ability Elements ................................. 101
Table 4.37: Descriptive Statistics of Liquidity ........................................................ 103
Table 4.38: Liquidity Response Rate ...................................................................... 105
Table 4.39: Influence of Liquidity on Financial Performance ................................ 105
Table 4.40: Cross Tabulation between Liquidity Elements .................................... 106
Table 4.41: Cross Tabulation of minimum statutory ratio ...................................... 107
Table 4.42: Cross Tabulation of Liquidity scale ..................................................... 107
Table 4.43: Cross Tabulation of Liquidity Status .................................................. 108
Table 4.44: Regression Model of Joint Liquidity Elements .................................... 108
Table 4.45: Regression model of Joint Liquidity Elements .................................... 109
Table 4.46: Sensitivity to Market Risks Descriptive Statistics ............................... 111
xiv
Table 4.47: Interest Rate Risk ................................................................................. 112
Table 4.48: Inflation Risks ...................................................................................... 113
Table 4.49: Regression Model................................................................................. 113
Table 4.50: Moderating Effect of Sensitivity to Market Risk ................................. 114
Table 4.51: Moderating Effect of Sensitivity to Market Risk ................................. 115
Table 4.52: Moderating Effect of Sensitivity to Market Risk of Management
efficiency and Financial Performance .................................................. 116
Table 4.53: Moderating Effect of Sensitivity to Market Risk ................................. 116
Table 4.54: Moderating Effect of Sensitivity to Market Risk ................................. 117
Table 4.55: Profit Making ....................................................................................... 118
Table 4.56: Financial Performance Descriptive Statistics....................................... 119
Table 4.57: Overall Correlation Matrix ................................................................... 121
Table 4.58: Regression Results before Moderation ................................................ 122
Table 4.59: Regression Results after Moderation ................................................... 124
Table 4.60: Hypothesis Testing and Discussion ..................................................... 125
xv
LIST OF FIGURES
Figure 2.1: Conceptual framework ........................................................................... 30
Figure 4.1: Graphical representation Normality of Residuals .................................. 66
Figure 4.2: Capital Adequacy Trend ......................................................................... 69
Figure 4.3: Asset Quality Trend ................................................................................ 69
Figure 4.4: Management Efficiency Trend ............................................................... 70
Figure 4.5: Earnings Ability Trend ........................................................................... 71
Figure 4.6: Liquidity Trend ....................................................................................... 71
Figure 4.7: Sensitivity to Market Risks Trend .......................................................... 72
Figure 4.8: Financial Performance Trend ................................................................. 72

xvi
LIST OF APPENDICES
Appendix I: Questionnaire ...................................................................................... 157
Appendix II: List of SACCOS ................................................................................ 164
Appendix III: Raw Data ......................................................................................... 168
xvii
ACRONYMS AND ABBREVIATIONS
ACCOSCA Africa in Confederation of Cooperative Savings and Credit
Association
ATM Automated Teller Machines
CAMEL Capital adequacy, Asset quality, Management efficiency, Earnings
ability and Liquidity
CAMELS
Capital adequacy, Asset quality, Management efficiency Earnings
ability, Liquidity and Sensitivity to market risk
CCD Commission of Cooperative Development
CRAR Capital-to-Risk Weighted Assets Ratio
DTS’s Deposit Taking SACCOs
EAC East Africa Community
EALA East Africa Legislative Assembly
EPS Earnings Per Share
FDIC Federal Deposit Insurance Corporation
FSD Financial Service Deepening
GDP Gross Domestic Product
GFSR Global Financial Stability Report
GIS Generalized least Squares
KNL Kenya National Legislation
NPA Non-Performing Assets
xviii
PEARLS Protection, Effective financial structure, Asset quality, Rates of return
and costs, and Liquidity and Signs of growth.
ROA Return on Asset
SACCOs Savings and Credit Co-operative Societies
SAP’s Structural Adjusted Programs
SASRA
SCP
Sacco Society Regulatory Authority
Structure-Conduct-Performance
UFIRS Uniform Financial Institution Rating System
US$ US Dollar
VIF Variance Inflation Factor
WOCCU World Council of Credit Union
xix
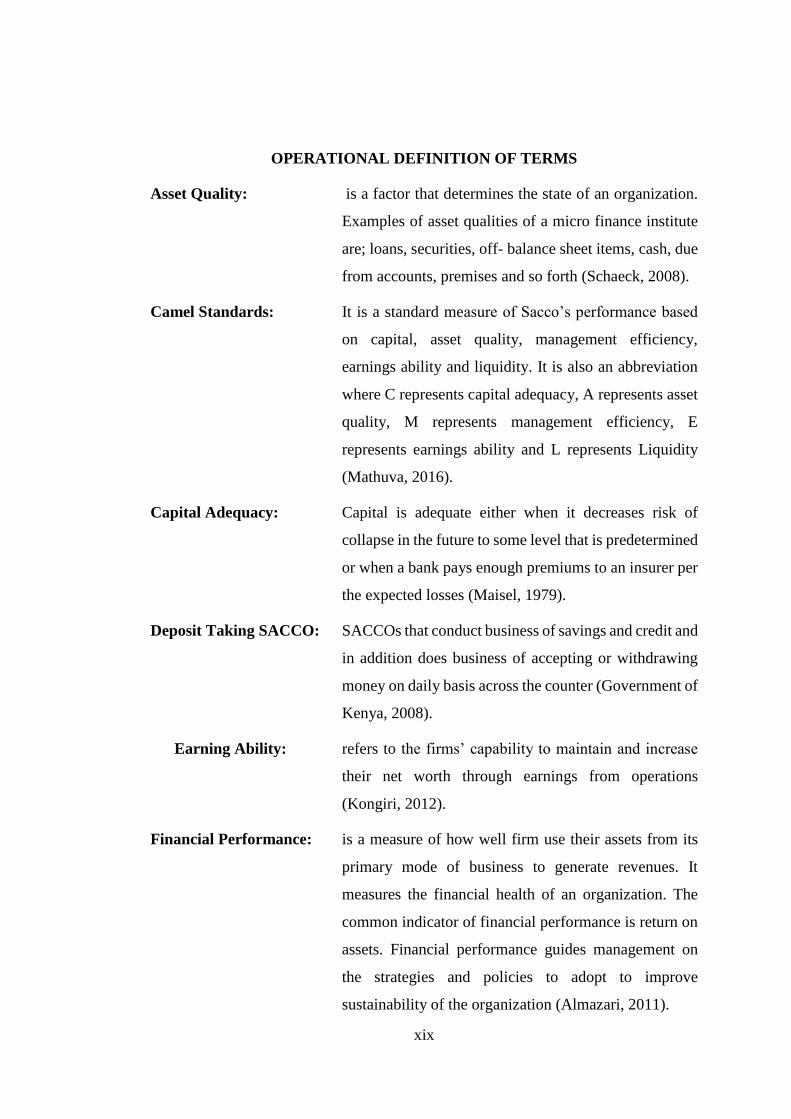
OPERATIONAL DEFINITION OF TERMS
Asset Quality: is a factor that determines the state of an organization.
Examples of asset qualities of a micro finance institute
are; loans, securities, off- balance sheet items, cash, due
from accounts, premises and so forth (Schaeck, 2008).
Camel Standards: It is a standard measure of Sacco’s performance based
on capital, asset quality, management efficiency,
earnings ability and liquidity. It is also an abbreviation
where C represents capital adequacy, A represents asset
quality, M represents management efficiency, E
represents earnings ability and L represents Liquidity
(Mathuva, 2016).
Capital Adequacy: Capital is adequate either when it decreases risk of
collapse in the future to some level that is predetermined
or when a bank pays enough premiums to an insurer per
the expected losses (Maisel, 1979).
Deposit Taking SACCO: SACCOs that conduct business of savings and credit and
in addition does business of accepting or withdrawing
money on daily basis across the counter (Government of
Kenya, 2008).
Earning Ability: refers to the firms’ capability to maintain and increase
their net worth through earnings from operations
(Kongiri, 2012).
Financial Performance: is a measure of how well firm use their assets from its
primary mode of business to generate revenues. It
measures the financial health of an organization. The
common indicator of financial performance is return on
assets. Financial performance guides management on
the strategies and policies to adopt to improve
sustainability of the organization (Almazari, 2011).
xx
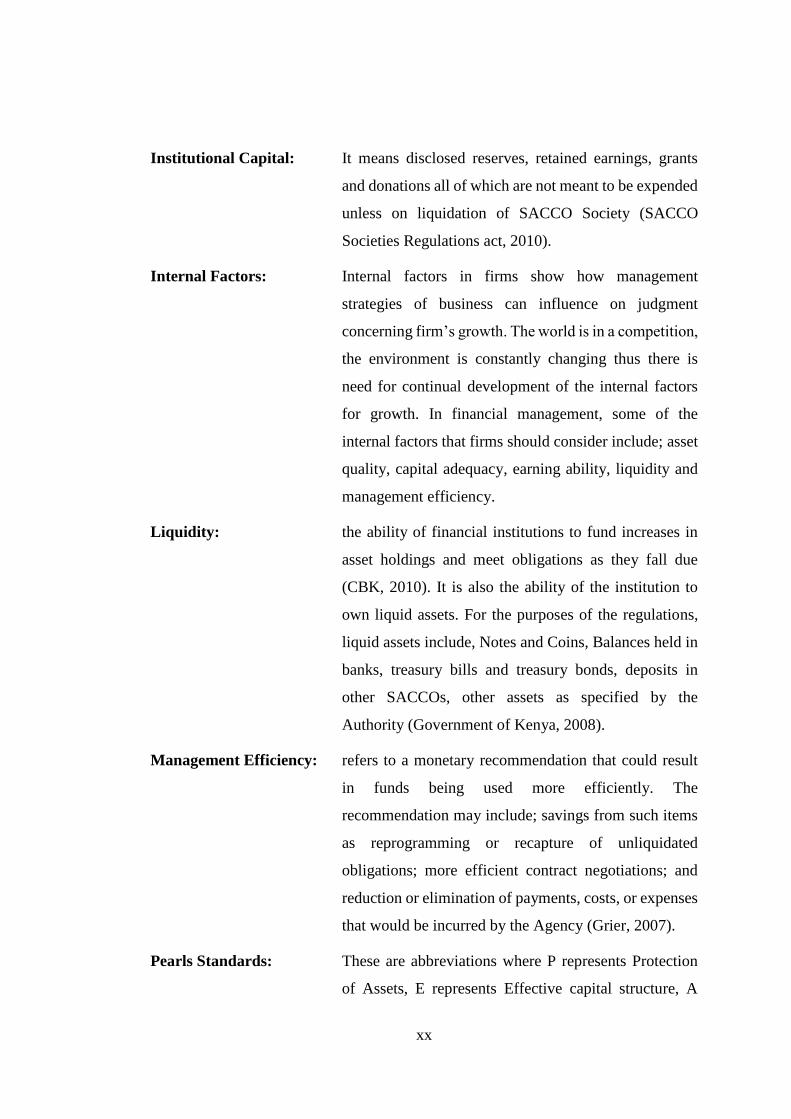
Institutional Capital: It means disclosed reserves, retained earnings, grants
and donations all of which are not meant to be expended
unless on liquidation of SACCO Society (SACCO
Societies Regulations act, 2010).
Internal Factors: Internal factors in firms show how management
strategies of business can influence on judgment
concerning firm’s growth. The world is in a competition,
the environment is constantly changing thus there is
need for continual development of the internal factors
for growth. In financial management, some of the
internal factors that firms should consider include; asset
quality, capital adequacy, earning ability, liquidity and
management efficiency.
Liquidity: the ability of financial institutions to fund increases in
asset holdings and meet obligations as they fall due
(CBK, 2010). It is also the ability of the institution to
own liquid assets. For the purposes of the regulations,
liquid assets include, Notes and Coins, Balances held in
banks, treasury bills and treasury bonds, deposits in
other SACCOs, other assets as specified by the
Authority (Government of Kenya, 2008).
Management Efficiency: refers to a monetary recommendation that could result
in funds being used more efficiently. The
recommendation may include; savings from such items
as reprogramming or recapture of unliquidated
obligations; more efficient contract negotiations; and
reduction or elimination of payments, costs, or expenses
that would be incurred by the Agency (Grier, 2007).
Pearls Standards: These are abbreviations where P represents Protection
of Assets, E represents Effective capital structure, A
xxi
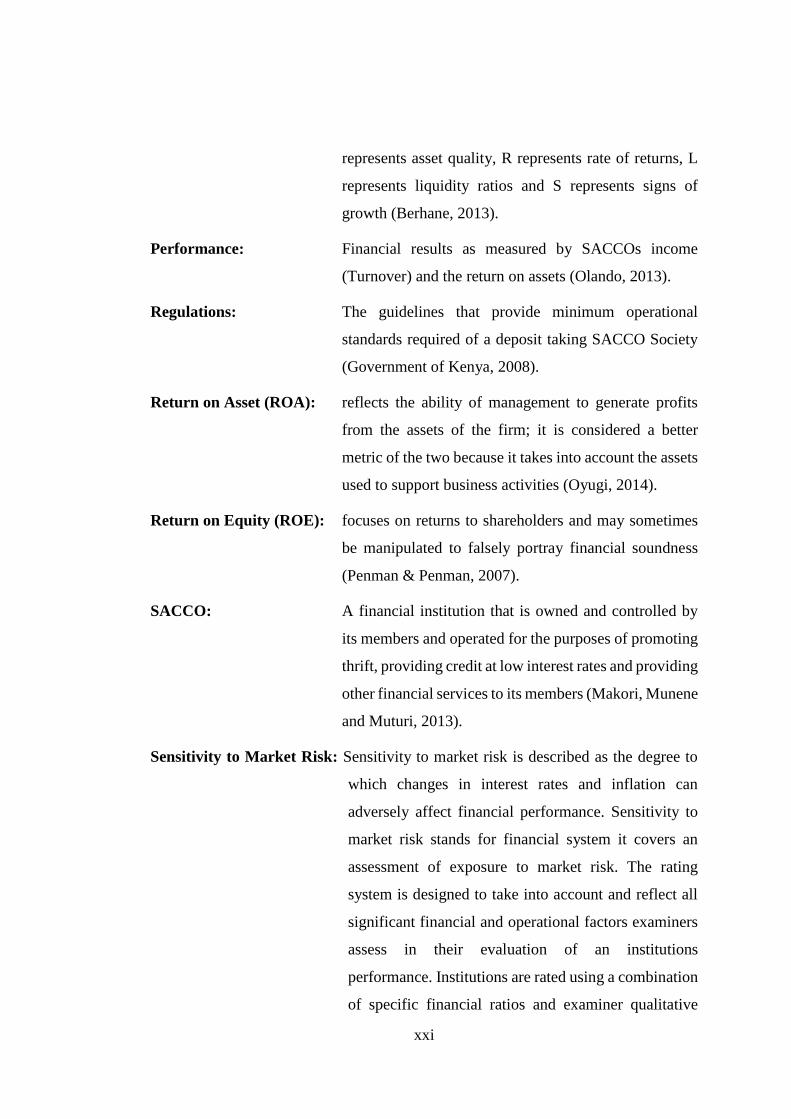
represents asset quality, R represents rate of returns, L
represents liquidity ratios and S represents signs of
growth (Berhane, 2013).
Performance: Financial results as measured by SACCOs income
(Turnover) and the return on assets (Olando, 2013).
Regulations: The guidelines that provide minimum operational
standards required of a deposit taking SACCO Society
(Government of Kenya, 2008).
Return on Asset (ROA): reflects the ability of management to generate profits
from the assets of the firm; it is considered a better
metric of the two because it takes into account the assets
used to support business activities (Oyugi, 2014).
Return on Equity (ROE): focuses on returns to shareholders and may sometimes
be manipulated to falsely portray financial soundness
(Penman & Penman, 2007).
SACCO: A financial institution that is owned and controlled by
its members and operated for the purposes of promoting
thrift, providing credit at low interest rates and providing
other financial services to its members (Makori, Munene
and Muturi, 2013).
Sensitivity to Market Risk: Sensitivity to market risk is described as the degree to
which changes in interest rates and inflation can
adversely affect financial performance. Sensitivity to
market risk stands for financial system it covers an
assessment of exposure to market risk. The rating
system is designed to take into account and reflect all
significant financial and operational factors examiners
assess in their evaluation of an institutions
performance. Institutions are rated using a combination
of specific financial ratios and examiner qualitative

xxii
judgments the possibility of an investor to experience
losses due to factors that affect the overall financial
market (Brockett, Cooper, Golden, Rousseau & Wang,
1997).
xxiii
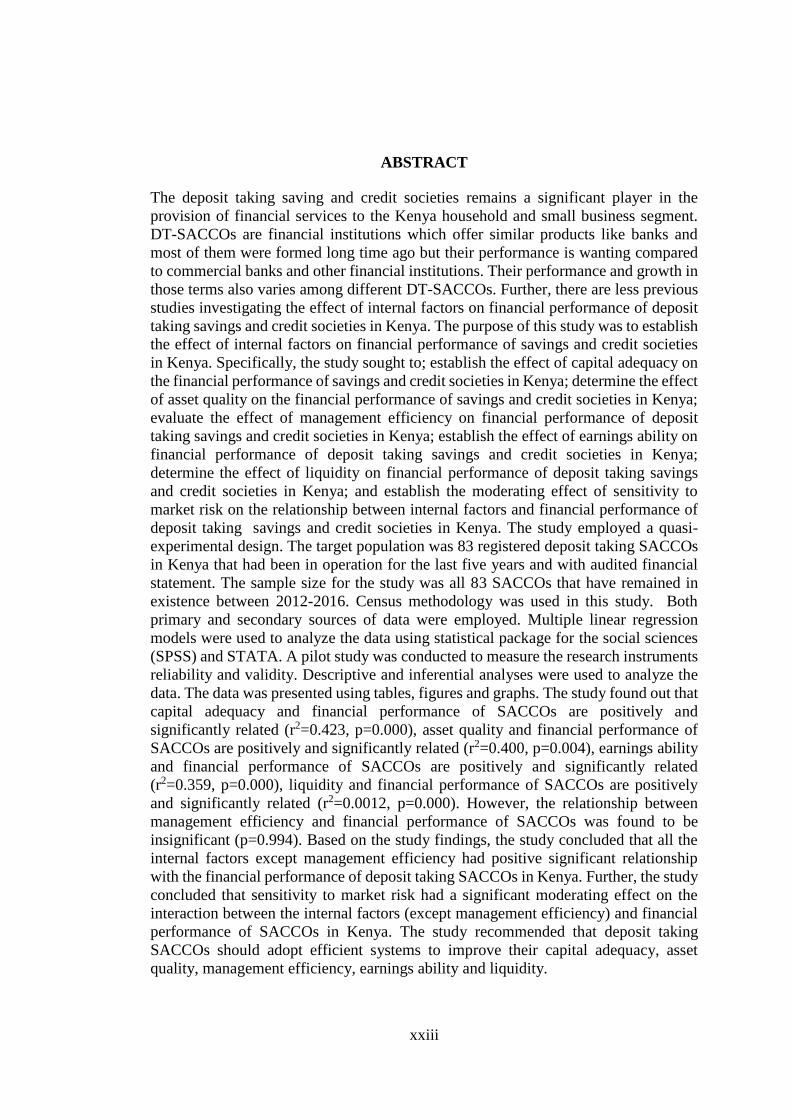
ABSTRACT
The deposit taking saving and credit societies remains a significant player in the
provision of financial services to the Kenya household and small business segment.
DT-SACCOs are financial institutions which offer similar products like banks and
most of them were formed long time ago but their performance is wanting compared
to commercial banks and other financial institutions. Their performance and growth in
those terms also varies among different DT-SACCOs. Further, there are less previous
studies investigating the effect of internal factors on financial performance of deposit
taking savings and credit societies in Kenya. The purpose of this study was to establish
the effect of internal factors on financial performance of savings and credit societies
in Kenya. Specifically, the study sought to; establish the effect of capital adequacy on
the financial performance of savings and credit societies in Kenya; determine the effect
of asset quality on the financial performance of savings and credit societies in Kenya;
evaluate the effect of management efficiency on financial performance of deposit
taking savings and credit societies in Kenya; establish the effect of earnings ability on
financial performance of deposit taking savings and credit societies in Kenya;
determine the effect of liquidity on financial performance of deposit taking savings
and credit societies in Kenya; and establish the moderating effect of sensitivity to
market risk on the relationship between internal factors and financial performance of
deposit taking savings and credit societies in Kenya. The study employed a quasi-
experimental design. The target population was 83 registered deposit taking SACCOs
in Kenya that had been in operation for the last five years and with audited financial
statement. The sample size for the study was all 83 SACCOs that have remained in
existence between 2012-2016. Census methodology was used in this study. Both
primary and secondary sources of data were employed. Multiple linear regression
models were used to analyze the data using statistical package for the social sciences
(SPSS) and STATA. A pilot study was conducted to measure the research instruments
reliability and validity. Descriptive and inferential analyses were used to analyze the
data. The data was presented using tables, figures and graphs. The study found out that
capital adequacy and financial performance of SACCOs are positively and
significantly related (r2=0.423, p=0.000), asset quality and financial performance of
SACCOs are positively and significantly related (r2=0.400, p=0.004), earnings ability
and financial performance of SACCOs are positively and significantly related
(r2=0.359, p=0.000), liquidity and financial performance of SACCOs are positively
and significantly related (r2=0.0012, p=0.000). However, the relationship between
management efficiency and financial performance of SACCOs was found to be
insignificant (p=0.994). Based on the study findings, the study concluded that all the
internal factors except management efficiency had positive significant relationship
with the financial performance of deposit taking SACCOs in Kenya. Further, the study
concluded that sensitivity to market risk had a significant moderating effect on the
interaction between the internal factors (except management efficiency) and financial
performance of SACCOs in Kenya. The study recommended that deposit taking
SACCOs should adopt efficient systems to improve their capital adequacy, asset
quality, management efficiency, earnings ability and liquidity.
1
CHAPTER ONE
INTRODUCTION
1.1 Background of the Study
In the world co-operative movement was initiated in the year 1844 in Rochdale village,
Manchester in England, since then it has spread globally as a socioeconomic
movement with its unique identity, history and objective (Tache, 2006). In 1864 the
first credit union was established by Raiffeisen in German to facilitate the needs of the
rural people which were deemed nonbankable owing to very few, fluctuating cash and
shortages of human capital (WOCCU, 2008). Since that period there has been a rapid
growth in the cooperative movement worldwide. Tache (2006), reveals that the
cooperative movement spread all over Europe, Northern America, Latin America and
Asia from 1900 to 1930 and thereafter to Africa through Ghana by a catholic Bishop.
Savings and credit cooperative societies are autonomous association of persons united
voluntarily to meet their common economic and social needs through jointly owned
and democratically controlled enterprises, which operate under the principles of
cooperative movement (ICA, 2009). They are guided by the values of self-help,
honesty, openness, self-responsibility, social-responsibility, democracy, quality,
equity, solidarity, mutual caring, efficiency, transparency and accountability (ICA,
2009). The financial health of the financial system has important role in the country
economy its failure can disrupt economic development of the country (Das & Ghosh,
2007).
Globally the cooperative origin is dated back to 1852 when Herman Frank consolidated
two pilot projects in Germany into credit unions. In 1864, Raiffeisen founded the first
rural credit union in rural Germany to cater for the needs of the rural poor. The rural
communities were considered to be very small, with seasonal flows of cash and limited
human resources hence not bankable (WOCCU, 2008). Since then, there has been a
rapid growth in the cooperative movement worldwide based on the organizational
methods of Raiffeisen.
Savings and credit cooperative in developed countries tends to access supply of
funding that is more stable and less responsive to monetary policy and market risk,
2
they also tends to offer comparatively lower fees than other types of commercial banks,
which not only helps to increase access of credit to the poor, but reduces the cost of
remittance transfers (Schenk, 2007, WOCCU, 2009).
The first ever SACCO was established in 1844 by Robert Owen (John, 2002).
SACCOs belong to a group of cooperatives that are commonly called Raiffeisen
cooperatives due to the German originator of this movement in the 1800’s (Tache,
2006). SACCOs are guided by seven principles as stipulated by the International
Cooperative Alliance (ICA). This includes; Open and voluntary membership, member
economic participation, independence and autonomy, democratic member control,
education, training and information, Concern for Community and Cooperation among
Cooperatives.
IMF indicates that savings and credit co-operative movement in developed countries
tend to be more stable than commercial banks, mainly during financial crisis, as their
investment patterns tend to be less speculative and returns are therefore less volatile
(Hesse & Cihak, 2007). During economic crisis, research indicate that cooperative
finance fare better than investor-owned savings and loans institutions, as they pursue
more conservative investment policies (Chaddad & Cook, 2004).
SACCOs are expected to give better and cheaper services to its members as compared
to the main stream banks because SACCOs understands the needs of the members
given that they are the owners (Wanyama, Develtere & Pollet, 2008). Services offered
by SACCOs include normal loans, emergency loans, school fees loans and front office
services for example; payment of salaries, salary advances, bank cheques, safe
keeping of documents, and ATMs (Ngaira, 2011).
According to ICA (2009), Rochdale pioneers were the founder of the contemporary
co-operative movement in Lancashire England, to deliver cheap alternative to poor-
quality and adulterated and provisions of food by use of surplus so as to benefit the
community. Subsequently, the co-operative movement has succeeded spreading
throughout the world and incorporating all parts of the economy. The principles that
supported cooperatives ways of doing trade is still recognized today as the basis upon

3
which all co-operatives operate, however, the principles has been looked over and
updated.
In the United States, Benjamin Franklin started the first cooperative business, a mutual
insurance company, in 1752. Agricultural cooperatives played an important role in the
development of cooperatives in the U.S. with the first cooperative beginning
operations in 1810 in dairy and cheese making. From 1810 until 1887, cooperatives
were founded in many sectors of agriculture, including marketing, irrigation, fruit
marketing, and cotton ginning, among others. The Grange, one of the first farm
organizations in the U.S., organized cooperative development efforts while other farm
groups like the American Farm Bureau and National Farmers Union were also
instrumental to developing agricultural cooperatives. In fact, Farm Bureau helped to
establish Growmark and Nationwide Insurance while National Farmers Union helped
to establish the largest agricultural cooperative in the U.S. (ICA, 2009),
Globally, the sector has 1 billion membership, it is estimated that co-operatives has
employed 250 million people all over the world, with 2.2 trillion US Dollars profits,
while providing infrastructure and services that the society needs to flourish. 2015
Global statistical report recorded a total of 57,000 savings and credit unions
(SACCOs), spread across 105 countries and 6 continents. The world savings and credit
union system combine savings of 1.5 trillion US$, asset base of 1.8 trillion US$ out of
which 1.2 trillion US$ constitutes the loan portfolio. The average worldwide
penetration rate of the Credit Union system stood at 8.2 percent (World Co-operative
Monitor, 2014).
Globally, efficiency of community banks were analyzed in the United States (US)
using data from year-end 2006-2008, multivariate discriminant model was used based
on the CAMEL(S) model to differentiate between low and high efficiency community
banks by using the efficiency ratio as the independent variable. The results on the
significance of the individual CAMEL components provided mixed results for
different periods apart from the sensitivity to market risk which was found to be
statistically insignificant (Hays, Stephen & Arthur, 2009).
4
In India, performance of Indian Banking sector through its effect on the asset value
was analyzed. The study recognized the key factors such as the risk management, Non-
Performing Assets (NPA) levels, effective cost management and financial inclusion.
Moreover, Indian performance of different private and public sectors banks over the
period 2000-2011 were analyzed using the CAMEL approach and it was established
that the private sector banks were at the top with their performance being the best in
terms of soundness (Chaudhry & Singh, 2012).
In Africa research indicates that approximately seven per cent of the Africa population
is affiliated to cooperatives sector also specific social protection mechanisms
associated with cooperatives in Africa are very limited (Pollet, 2009). Growth of
SACCOs was experienced to the extent that in 1965, Africa Federation of Cooperative
Societies Savings and Credit Association (ACCOSSCA) was formed with the principle
objective of offering SACCO insurance, education to members and promoting SACCO
principles (Ng’ombe & Mikwamba, 2004). There are 28 countries in the continent of
Africa with established SACCOs with membership of 16 million which is 8% of the
whole world membership, with savings of 62% and loans of 65% being 3rd after Asia
and North America which has 36 million and 102 million respectively. Africa
mobilized 0.4% of the worldwide savings of US$ 1.1 trillion and 0.4% of international
loans given to members standing at US$ 912 billion (WOCCU, 2009).
In Malaysia, cooperatives movement operate under democratic system, flexible and
have participatory management system which contribute to economic development of
a country. They enhance community participation and identity and also social
organization as well as alleviating poverty, creating employment, improving country
economic growth and development. However, cooperatives in Malaysia are facing
more challenges including lack of capital, poor cooperative governance, wanting
financial performance, inefficient management and non-compliance with cooperative
societies Act of 1993 and its related legislations (Tehrani et al 2014).
In Africa, performance of the South African banking sector was analyzed from 1994
and it was found that all bank specific variables were statistically significant at
conventional level for both Return on Assets (ROA) and Return on Equity (ROE)
5
equations. Study shows that asset quality, management efficiency, and liquidity had
positive relationship with both measures of bank performance, which is significant
with priori theoretical expectations.
However, the leverage ratio, as measure of capital adequacy, shows a surprising
insignificant relationship with ROA, whereas its relationship with ROE is positively
significant as expected (Ifeacho & Ngalawa, 2014). In Ghana CAMEL rating system
was used to test the performance of local and foreign banks results of the study
indicated that not all the CAMEL variables affect banks financial performance in
Ghana in terms of ROA and ROE (Ansah, 2015).
In East Africa, the East African Legislative Assembly (EALA) passed the East African
Community Cooperative Societies bill, 2014 to provide a legal framework for
cooperatives societies in the community and to provide for other related matters
encompassing rights and duties of members’ organs of cooperative society’s assets and
funds of societies, audits and inspections and miscellaneous provisions (EACCS Act,
2014). In Ethiopia Zerfeshewa (2010), investigated the determinants of SACCO
performance the study established that the educational level of members and officials
as well as the regulations posed the greatest impediment to the performance of
SACCOs.
The Kenyan National Legislations (KNL) on cooperatives requires alignment with
EACCS bill, 2014. The bill is based on the understanding that each state shall
undertake to encourage the efficient use of resources and to promote the development
of private sector organizations which are engaged in all types of economic activities,
such as the national chambers of commerce and industry, confederations and
associations of industry, agriculture among others economic activities. It also
recognizes the responsibility of state parties to enact national legislations to govern the
operations of co-operative societies within the party states.
1.1.1 Deposit Taking SACCOs in Kenya
In Kenya, the first SACCO (Lumbwa, SACCO) was established by white settlers in
1908, with its main aim of enhancing agricultural activities in order to take advantage
of economies of scale (KUSCCO, 2006). The SACCO was formed to enable the

6
members bargain for better fertilizer and seeds prizes (Chebor, 2008). At the beginning
of 2011 there were 83 deposits taking SACCOs that had complied and registered with
SASRA, by 2016 there were a total of 245 SACCOs out of which a total of 164 DTSS
were licensed for deposit-taking business, the remaining 81 DTSS were required by
the law to have achieved the minimum licensing threshold and 83 SACCOs had
audited published accounts from 2011 to 2015.
The strict adherence to the compliance standards revealed the inability of some of the
SACCOs to maintain the minimum licensing requirements, five SACCOs which were
found to be noncompliant had their licenses revoked during year 2015, and they ceased
to take deposits from the public, three SACCOs had their licenses revoked in 2014. In
addition, five other SACCOs were allowed to continue operating on conditionally
restricted licenses during the year 2015 in an effort by the authority to tune them to
compliance status. The nature of SACCOs has made it an area of keen interest in
developing countries more than in developed countries (SASRA, 2015).
SACCO activities contribute 43% of the Gross Domestic Product (GDP). The total
assets, total deposits and gross loans of the deposit taking SACCO societies grew by
13.7%, 15.3% and 13.0% to reach Kshs 342.8 billion, Kshs 258.1 billion and Kshs
237.4 billion respectively, hence underscoring the continued role of SACCOs in the
mobilization of savings and the provision of credit to Kenyans (SASRA, 2015).
However, net loans at the end of 2015 amounted to Kshs 251 billion and constituted
73.2% of the total asset base of savings and credit societies. SACCOs traditionally rely
on their ability to mobilize savings from its members (SASRA, 2015).
In Kenya co-operative movement was firmly under the reigns of the government as a
motivation, it was given donor support for capitalization and personnel development.
Private traders were not allowed to compete with co-operatives, this era come to an
end as more countries adopted reform under the Structural Adjusted Programs (SAP’s)
aimed at enhancing growth through free market economic model. Under session paper
No. 6 of 1997 there were development of commercially autonomous member based
cooperative organization which were democratically and professionally managed, self-
controlled and self-reliant businesses, 50% of the population derive their livelihood
7
from cooperative that was approximately 250,000 Kenyans are employed or gain most
of the income from cooperative (ILO, 2009).
In Kenya, SACCOs were formerly controlled by the government through the co-
operative ordinance act passed in 1945. In 1997, the act was amended to Co-operative
Societies Act (CSA) withdrawing much of state control over the co-operative
movement and empowered co-operatives to become autonomous, self-reliant, self-
controlled and commercially viable institutions. The government took up the role of
facilitating autonomy and general regulation, further amendments were effected in
2004 through the co-operative society’s amendment Act of 2004 to re-enforce state
regulation of the co-operative movement through the office of the Commissioner for
Co-operatives Development (CCD). Further, the Act 2004 was amended to SACCO
Societies Regulatory Authority SASRA (2008), which was inaugurated in 2009
charged with the prime responsibility to license and supervise deposit taking SACCOs
which defined a paradigm shift moment to the SACCO industry in Kenya.
The Act required that SACCOs maintain Kshs. 10 million capital at all times, return
on capital adequacy is to be filed with SASRA every month before the 15th day of the
following month. SASRA also requires liquidity ratio of not less than 15% be
maintained by all licensed SACCOs (Manyuanda, 2014). According to SASRA
(2008), the core capital of SACCOs consists of fully paid up members shares, retained
earnings, disclosed reserves, grants and donations all of which are not meant to be
expended unless on liquidation of the SACCO society.
Capital adequacy indicates whether SACCOs maintain enough capital to absorb
unexpected losses, asset quality determines the healthiness of financial institutions
against loss of value in the assets as asset impairment risks the solvency of the financial
institutions, management efficiency assesses the efficiency of management in
generating business and in maximizing financial performance, earnings ability focuses
on how financial institutions make profit, sustainability and growth of those earnings
in the future, liquidity measures determines the ability of the business to meet its
financial obligations as and when they fall due without disrupting any of its activities
(Reddy, 2012). Sensitivity to market risk determines the degree to which changes in
8
interest rate, inflation, commodity pricing adversely affect SACCOs performance and
it places on quantity of risk and risk management with respect to SACCOs activities.
Mvula (2013) enumerates inadequate capital, poor asset quality, poor governance, poor
profitability, poor liquidity and noncompliance as the main bottlenecks to deposit
taking savings and credit societies performance which target low income earners and
puts them at a greater risk compared to mainstream commercial banks. Kenya is
regarded as the leading country in Africa in co-operative movement and account for a
significant portion of the financial sector (ACCOSCA, 2013). SACCOs have ventured
into agriculture, banking, credit, agro-processing and storage sectors marketing, dairy,
fishing and housing sectors (Okundi, 2011).
Olweny and Shipo (2011) studied and adopted the CAMEL model, analyzed the
determinants of bank failures in Kenya, they found out that asset quality and liquidity
are positive determinants of bank failures. Ongore and Kusa (2013) concluded that the
financial performance of commercial banks in Kenya is driven mainly by board and
management decisions, while macroeconomic factors have insignificant effect.
1.1.2. SACCO Regulatory Framework in Kenya
According to cooperative society act, (1966) state was empowered to get involved in
day to day management of cooperative, people wishing to join cooperative were guided
by their social economic problems, registration, constitution, regulation and other
matters incidental to the operations of cooperative societies. The act was revised in
1997 with the view of ushering in the spirit of liberalization. In 1st June 1998, the
cooperative society Act, 1966 presumed that cooperative had matured to a state where
they could regulate themselves democratically and professionally management, thus
making them autonomous, self-reliant and viable, controlled by members and ensuring
that it operates within the international cooperative principle.
The sacco society regulatory authority provides an enabling legal and regulatory
framework to the all sacco societies to enable them remain competitive in the financial
market and build confidence in their members by offering them efficient and effective
services (Ademba, 2011). Further the objective of this regulation is to protect the
9
interests of sacco members and promise public confidence thus ensuring sustainability
of the Sacco sector as a key player in the country economy.
Kilonzi (2012) carried out a study to establish the impact of SASRA regulations on the
financial performance of SACCOs in Kenya. Sample size was 30 SACCOs for the
period between 2008 to 2011.Financial performance was measured between ROA and
ROE. Factors used for regression against ROA and ROE were capital to total assets,
liquidity and management efficiency (Earning Assets/ Total Assets). Regressions were
run for 2008 to 2009, 2010 to 2011and coefficients compared for differences which
may have been caused by the regulations being applicable from 2010. The findings
were that ROE, capital ratio, liquidity and management efficiency improved in the
second period in comparison to the first. The sample size was biased as it included
SACCOs in one region.
According to cooperative society Act, (2004), introduction of reforms in cooperative
sector to refine the legal framework governing the constitution, registration and
regulation was done in order to enhance their operations and ensure effective
management. The need to regulate SACCOs emerged when there were urgent needs
to draft the bill. The SACCO sub sector comprises of both deposit taking and non-
deposit taking SACCOs, deposit taking SACCOs are licensed and regulated by
SASRA while non-deposit taking SACCOs are supervised by the Commissioner for
co-operatives. SASRA issue license to SACCOs that have been duly registered under
the Cooperative Societies Act CAP 490 (SASRA, 2012). The SACCO society Act
2008, was enacted later to provide licensing, regulation, promotion of saving and credit
societies and supervision, this act lead to establishment of SASRA whose functions
entail licensing, regulating and supervision of SACCOs (Wanyama, 2009).
1.1.3. SACCO Financial Performance
Financial performance is the ultimate goal of financial institution. All the strategies
designed and activities performed thereof are meant to realize this grand objective.
However, this does not mean that financial institutions like saccos have no other goals.
Deposit taking savings and credit societies could also have additional social and
economic goals. To measure the profitability of deposit taking saccos there are variety
10
of financial ratios used of which Return on Asset, Return on Equity and Net Interest
Margin are the major (Murthy and Sree, 2003; Alexandru et al., 2008).
The financial performances of deposit taking savings and credit societies can be
classified in to internal and external factors (Al-Tamimi, 2010; Aburime, 2005). These
are stochastic variables that affect the financial performance. Internal factors are
individual Sacco characteristics which affect the financial performance. These
financial factors are affected by internal decisions of board of directors. Financial
performance is a technique where long and short-term financial decisions which have
the same objective of enabling an institution growth by ensuring that return on capital
exceeds cost of capital, without making high financial risks (Pandey, 2010). The
external factors are variables which are beyond the control of the institution and affect
the financial performance of saccos.
performance of savings and credit societies affect economic growth of a country.
prudence financial performance of saccos rewards its members for their investment.
This, in turn, encourages more and more investment that contribute to economic
growth of a country. However, poor banking performance by financial institution can
lead to failure and insolvency of financial institution which have negative
repercussions on country economic growth. Financial and operating ratios analysis has
long been used as a tool for determining the condition and the financial performance
of an institution (Ogilo, 2012). Performance is an outcome arising from the activities
carried out by an organization (Habbershon, Williams and MacMillan, 2003). The
financial performance of a SACCO is measured by its ability to meet the financial
demands of its members taking into consideration the economic status of the members.
SACCO is said to be doing well financially if it is able to finance its member’s loans
on timely and at appropriate rates. The CAMEL approach employed financial ratios to
assess the various elements within the CAMEL framework and based on pre-
determined industry benchmarks to determine the financial soundness of financial
institutions like SACCOs (Dang, 2011).
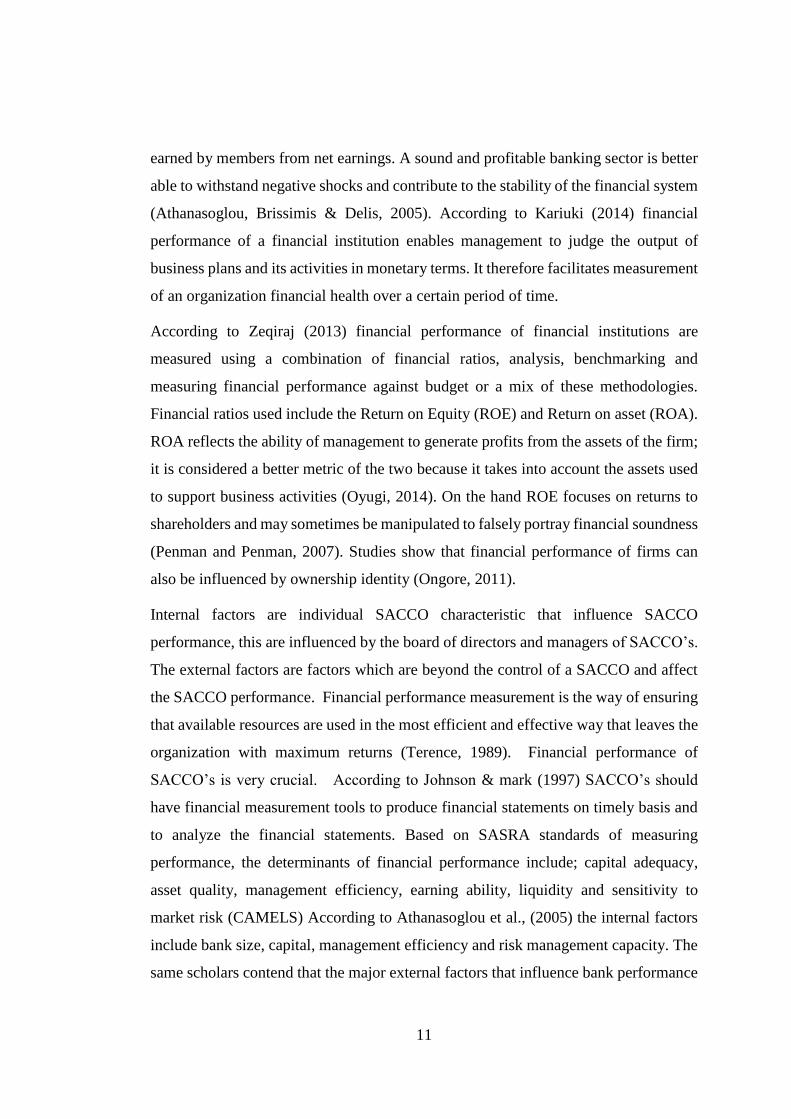
According to Fried, Lovell and Schmidt (2008), it is appropriate to apply the profit
maximization approach in modeling financial performance of SACCOs since it does
not negate the principle of maximizing the benefit to members where dividends are
11
earned by members from net earnings. A sound and profitable banking sector is better
able to withstand negative shocks and contribute to the stability of the financial system
(Athanasoglou, Brissimis & Delis, 2005). According to Kariuki (2014) financial
performance of a financial institution enables management to judge the output of
business plans and its activities in monetary terms. It therefore facilitates measurement
of an organization financial health over a certain period of time.
According to Zeqiraj (2013) financial performance of financial institutions are
measured using a combination of financial ratios, analysis, benchmarking and
measuring financial performance against budget or a mix of these methodologies.
Financial ratios used include the Return on Equity (ROE) and Return on asset (ROA).
ROA reflects the ability of management to generate profits from the assets of the firm;
it is considered a better metric of the two because it takes into account the assets used
to support business activities (Oyugi, 2014). On the hand ROE focuses on returns to
shareholders and may sometimes be manipulated to falsely portray financial soundness
(Penman and Penman, 2007). Studies show that financial performance of firms can
also be influenced by ownership identity (Ongore, 2011).
Internal factors are individual SACCO characteristic that influence SACCO
performance, this are influenced by the board of directors and managers of SACCO’s.
The external factors are factors which are beyond the control of a SACCO and affect
the SACCO performance. Financial performance measurement is the way of ensuring
that available resources are used in the most efficient and effective way that leaves the
organization with maximum returns (Terence, 1989). Financial performance of
SACCO’s is very crucial. According to Johnson & mark (1997) SACCO’s should
have financial measurement tools to produce financial statements on timely basis and
to analyze the financial statements. Based on SASRA standards of measuring
performance, the determinants of financial performance include; capital adequacy,
asset quality, management efficiency, earning ability, liquidity and sensitivity to
market risk (CAMELS) According to Athanasoglou et al., (2005) the internal factors
include bank size, capital, management efficiency and risk management capacity. The
same scholars contend that the major external factors that influence bank performance
12
are macroeconomic variables such as interest rate, inflation, economic growth and
other factors like ownership.
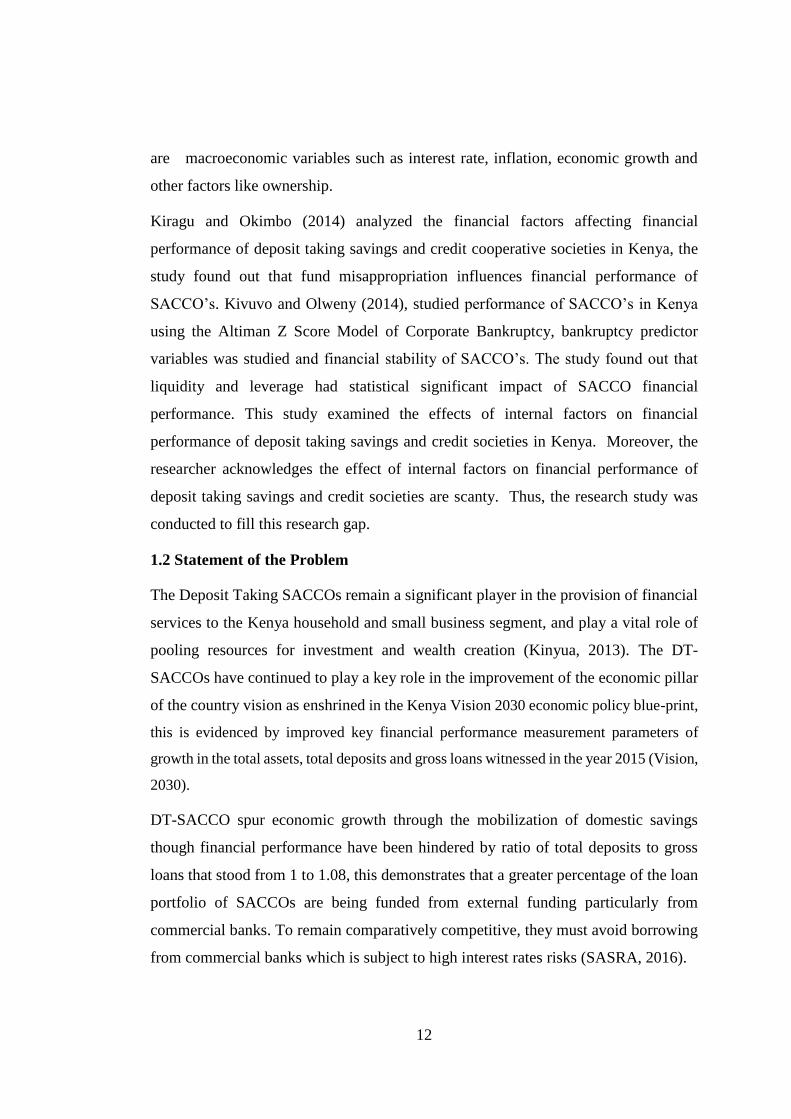
Kiragu and Okimbo (2014) analyzed the financial factors affecting financial
performance of deposit taking savings and credit cooperative societies in Kenya, the
study found out that fund misappropriation influences financial performance of
SACCO’s. Kivuvo and Olweny (2014), studied performance of SACCO’s in Kenya
using the Altiman Z Score Model of Corporate Bankruptcy, bankruptcy predictor
variables was studied and financial stability of SACCO’s. The study found out that
liquidity and leverage had statistical significant impact of SACCO financial
performance. This study examined the effects of internal factors on financial
performance of deposit taking savings and credit societies in Kenya. Moreover, the
researcher acknowledges the effect of internal factors on financial performance of
deposit taking savings and credit societies are scanty. Thus, the research study was
conducted to fill this research gap.
1.2 Statement of the Problem
The Deposit Taking SACCOs remain a significant player in the provision of financial
services to the Kenya household and small business segment, and play a vital role of
pooling resources for investment and wealth creation (Kinyua, 2013). The DT-
SACCOs have continued to play a key role in the improvement of the economic pillar
of the country vision as enshrined in the Kenya Vision 2030 economic policy blue-print,
this is evidenced by improved key financial performance measurement parameters of
growth in the total assets, total deposits and gross loans witnessed in the year 2015 (Vision,
2030).
DT-SACCO spur economic growth through the mobilization of domestic savings
though financial performance have been hindered by ratio of total deposits to gross
loans that stood from 1 to 1.08, this demonstrates that a greater percentage of the loan
portfolio of SACCOs are being funded from external funding particularly from
commercial banks. To remain comparatively competitive, they must avoid borrowing
from commercial banks which is subject to high interest rates risks (SASRA, 2016).
13
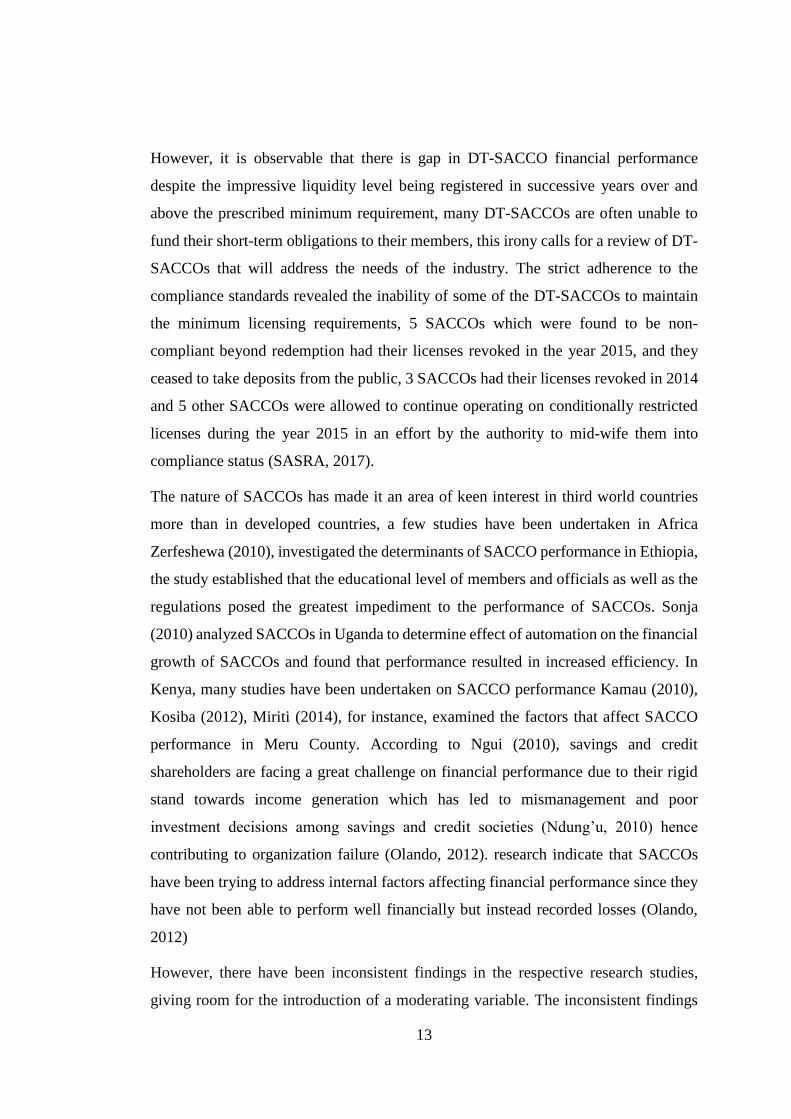
However, it is observable that there is gap in DT-SACCO financial performance
despite the impressive liquidity level being registered in successive years over and
above the prescribed minimum requirement, many DT-SACCOs are often unable to
fund their short-term obligations to their members, this irony calls for a review of DT-
SACCOs that will address the needs of the industry. The strict adherence to the
compliance standards revealed the inability of some of the DT-SACCOs to maintain
the minimum licensing requirements, 5 SACCOs which were found to be non-
compliant beyond redemption had their licenses revoked in the year 2015, and they
ceased to take deposits from the public, 3 SACCOs had their licenses revoked in 2014
and 5 other SACCOs were allowed to continue operating on conditionally restricted
licenses during the year 2015 in an effort by the authority to mid-wife them into
compliance status (SASRA, 2017).
The nature of SACCOs has made it an area of keen interest in third world countries
more than in developed countries, a few studies have been undertaken in Africa
Zerfeshewa (2010), investigated the determinants of SACCO performance in Ethiopia,
the study established that the educational level of members and officials as well as the
regulations posed the greatest impediment to the performance of SACCOs. Sonja
(2010) analyzed SACCOs in Uganda to determine effect of automation on the financial
growth of SACCOs and found that performance resulted in increased efficiency. In
Kenya, many studies have been undertaken on SACCO performance Kamau (2010),
Kosiba (2012), Miriti (2014), for instance, examined the factors that affect SACCO
performance in Meru County. According to Ngui (2010), savings and credit
shareholders are facing a great challenge on financial performance due to their rigid
stand towards income generation which has led to mismanagement and poor
investment decisions among savings and credit societies (Ndung’u, 2010) hence
contributing to organization failure (Olando, 2012). research indicate that SACCOs
have been trying to address internal factors affecting financial performance since they
have not been able to perform well financially but instead recorded losses (Olando,
2012)
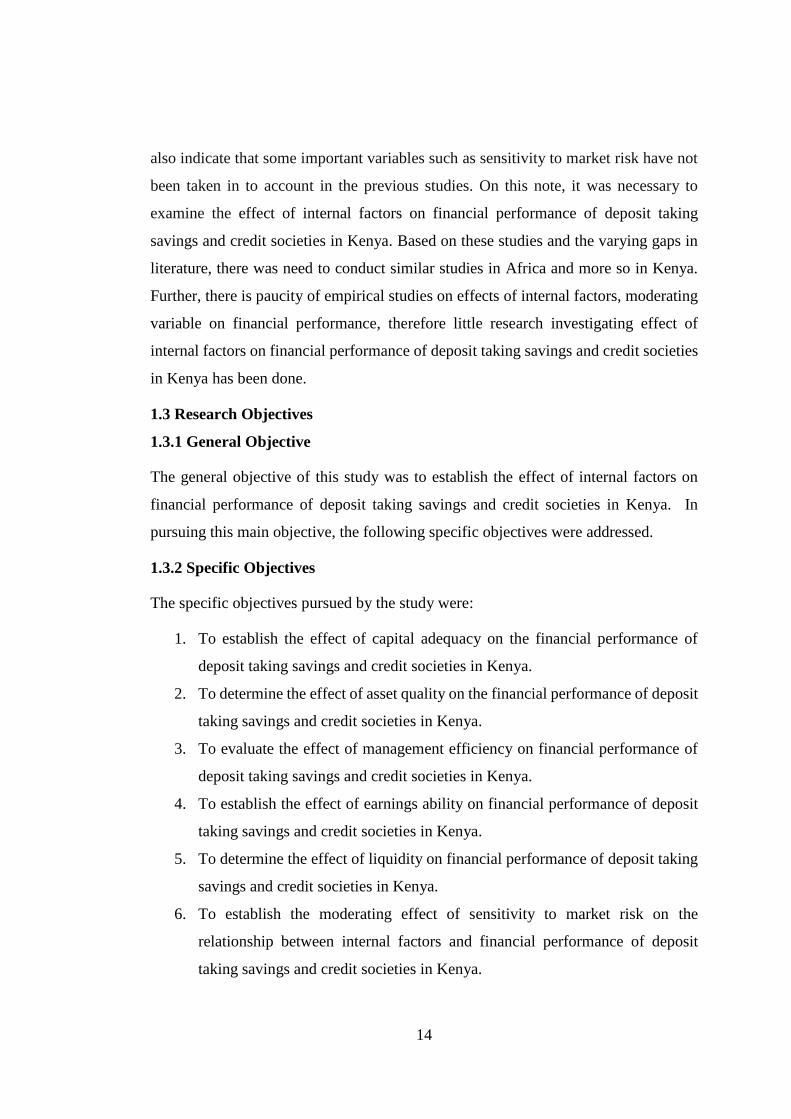
However, there have been inconsistent findings in the respective research studies,
giving room for the introduction of a moderating variable. The inconsistent findings
14
also indicate that some important variables such as sensitivity to market risk have not
been taken in to account in the previous studies. On this note, it was necessary to
examine the effect of internal factors on financial performance of deposit taking
savings and credit societies in Kenya. Based on these studies and the varying gaps in
literature, there was need to conduct similar studies in Africa and more so in Kenya.
Further, there is paucity of empirical studies on effects of internal factors, moderating
variable on financial performance, therefore little research investigating effect of
internal factors on financial performance of deposit taking savings and credit societies
in Kenya has been done.
1.3 Research Objectives
1.3.1 General Objective
The general objective of this study was to establish the effect of internal factors on
financial performance of deposit taking savings and credit societies in Kenya. In
pursuing this main objective, the following specific objectives were addressed.
1.3.2 Specific Objectives
The specific objectives pursued by the study were:
1. To establish the effect of capital adequacy on the financial performance of
deposit taking savings and credit societies in Kenya.
2. To determine the effect of asset quality on the financial performance of deposit
taking savings and credit societies in Kenya.
3. To evaluate the effect of management efficiency on financial performance of
deposit taking savings and credit societies in Kenya.
4. To establish the effect of earnings ability on financial performance of deposit
taking savings and credit societies in Kenya.
5. To determine the effect of liquidity on financial performance of deposit taking
savings and credit societies in Kenya.
6. To establish the moderating effect of sensitivity to market risk on the
relationship between internal factors and financial performance of deposit
taking savings and credit societies in Kenya.
15
1.4 Research Hypotheses
The study hypotheses were;
Ho1: Capital adequacy has no statistical significant effect on financial performance of
deposit taking savings and credit societies in Kenya.
Ho2: Asset quality has no statistical significant effect on financial performance of
deposit taking savings and credit societies in Kenya.
Ho3: Management efficiency has no statistical significant effect on financial
performance of deposit taking savings and credit societies in Kenya.
Ho4: Earnings ability has no statistical significant effect on financial performance of
deposit taking savings and credit societies in Kenya.
Ho5: Liquidity has no statistical significant effect on financial performance of deposit
taking savings and credit societies in Kenya.
Ho6: Sensitivity to market risk has no statistical significant moderating effect on the
relationship between internal factors and financial performance of deposit
taking savings and credit societies in Kenya.
1.5 Significance of the Study
The study provides invaluable insights to financial management leaders and policy
makers in properly targeting the pillars of effective SACCO stewardship owing to their
significant contributions to the sector. SACCO Sector in general and practitioners in
particular would likely be activated by the findings to invest their utmost creative
abilities in developing internal factors to manage and improve SACCOs’ performance
in Kenya. The research also brings together information about the financial
performance of the SACCO sector and how management can implement, monitor and
evaluate efforts and contribution of their internal factors.
The study is beneficial to researchers and academicians by creating a platform for
further research study on related topics; it will also act as a resourceful tool for other
academicians who intend to study the same topic in their area of specialization.
16
This research study will also help to highlight other important variables that require
further research study; this may be focusing on other variables that affect SACCO
performance. Finally, the study will help SASRA in policy formulation aimed at
controlling and regulating SACCOs in Kenya. SASRA will be better placed in policy
formulation and the regulation of SACCOs as a whole which has the ripple effect on
job creation, curbing of inflation and the general growth of the economy.
1.6 Scope of the Study
The study sought to establish effect of internal factors on financial performance of
deposit taking savings and credit societies in Kenya. The co-operatives studied were
savings and credit cooperative societies within the banking sector. This study did not
cover other forms of co-operatives. The study population was all deposit taking
SACCOs in Kenya that had audited financial statements for 5 consecutive years.
The study therefore focused on these 83 SACCOs that were in existence from January
2012 to December 2016 and had audited accounts. This research was conducted from
August 2016 to September 2017. The SACCOs that were studied were deposit taking
savings and credit cooperative societies. The scope was also limited to the stated
objectives of the study which spells out the variables to be studied. The study was
conducted in August, 2016 and data was gathered during this period.
1.7 Limitations of the Study
The study findings were limited to SACCOs that had audited financial statements for
5 (five) consecutive years. Further, the study was restricted in terms of content since it
only considered five variables as the internal factors of the financial performance of
SACCOs whereas there could be other factors. However, the exclusion of other
internal factors creates an opportunity for other studies to extend a similar study, but
focusing on other internal factors.
The study also considered only the financial performance of SACCOs whereas there
could be non-financial indicators of performance. It is expected that other studies will
extend a similar study, but focus on non-financial indicators.
17
The SACCO confidentiality policy restricted most of the respondents from answering
some questions in the questionnaire. This would have been considered to be against
the confidentiality policy to expose the organization’s confidential matters. The
researcher mitigated this limitation by presenting an introduction letter obtained from
the university to the respective SACCO management to avoid suspicion and enable the
management to disclose much of the information that was sought by the study on the
effect of internal factors on financial performance of savings and credit societies in
Kenya
18
CHAPTER TWO
LITERATURE REVIEW
2.1 Introduction
This chapter was organized according to specific objectives in order to bring out the
relevance of the research gap. The literature surrounding the study of SACCO
performance was conducted in the context of different existing theories. This chapter
specifically reviews the literature and discuss around the theories that were used to
study SACCO performance. Literature on; capital adequacy, asset quality,
management efficiency, earnings ability, liquidity and sensitivity to market risk were
discussed. Lastly some empirical works on internal factors of financial performance
was reviewed and the research gap.
2.2 Theoretical Framework
The theoretical framework is the structure that can support a theory of research study.
A theory is a group of statements which explain phenomena or are supported by
evidence meant to explain some phenomena. Theories provide a generalized
explanation to an occurrence of phenomena. Torraco (1997) explain that theories are
formulated to explain, predict, and understand phenomena and in many cases,
problems and extend existing knowledge, within the limits of the critical bounding
assumptions. The theoretical framework should demonstrate an understanding of
relevant theories and concepts to the topic of the research study and that will relate to
the broader area of knowledge in the area of study. According to Kennedy, (2007)
theory selection should highly depend on its appropriateness, its ease of application,
and its explanatory power. The theoretical framework connects the researcher to
existing knowledge.
Researcher was conversant with those theories applicable to this area of research study
(Kombo and Tromp, 2009, Smyth, 2004). According to Aguilar (2009), a theoretical
framework conceptualize research in determining what variables to measure, and what
statistical relationships to look for in context of the gap under study, thus, theoretical
literature helped the researcher to clearly see the independent, dependent and
19
moderating variables under study, provides a general framework for data analysis and
helps in the selection of applicable research design.
The theories reviewed were market power theory, liquidity theory, efficient structure
theory, monetarist theory, portfolio selection theory, economic efficient theory and
expense preference theory. These theories reviewed the source of the variables of the
study, their prepositions and the interactions between the dependent and independent
variables. Theoretical review was undertaken to eliminate duplication of what has been
done by other researchers and to provide clear understanding of existing knowledge
based on the theories.
2.2.1 Market Power Theory
Modigliani and Miller (1950) approach to capital theory advocates capital structure
irrelevancy theory, he further states that the market value of a firm is affected by its
future growth prospect apart from the risk involved in the investment. Its prepositions
were: financial leverage is in direct proportion to the cost of equity and no taxes based
on the following assumptions: there is no taxes, transaction cost for buying and selling
securities as well as bankruptcy cost is nil, there is symmetry of information, the cost
of borrowing is the same for investors as well as companies and debt financing does
not affect companies EBIT.
The market power theory states that increased external market forces results into
financial performance in terms of profits. Moreover, the hypothesis suggests that only
firms with large market share and well differentiated portfolio can outstand their
competitors and enjoy monopolistic profit. Market power theories entail traditional
structure conduct performance and the relative-market power hypotheses. The
Structure-Conduct-Performance (SCP) can be defined as the relationship between
market structure, firm conduct and firm performance (Berger, 1995). The market
power theory postulates that the existence of entry barriers is the major determinant of
firm profits. According to this theory, high costs of entry makes it easier for existing
firms to maintain monopoly profits, entry barriers can be in the form of strict
regulations provided by the regulator (SASRA).
20
Smirlok (1985) subscribing to the efficiency hypothesis, considers market share as a
proxy for efficiency. The efficiency hypothesis prevails when a significant positive
correlation between market share and profitability is signaled. This method implicitly
assumes that a higher market concentration is the main source of market power.
Shepherd (1986) criticizes this method by considering that the direct source of market
power is the domination of participants over the individual market, independently of
the ultimate sources of such a domination, hence the emergence of the Relative Market
power (RMP) hypothesis. It is uniquely the banks with a large market share and
diversified products that might exert their market power to determine prices and make
profits. Consequently, under the RMP hypothesis, individual market shares accurately
determine market power and market imperfections
In Kenya the SACCO industry is portrayed by capital adequacy requirements that
prevent easy entry into the industry, new entrants will diminish the level of those
profits and capital requirements often lock out new entrants resulting in monopoly
tendencies. The rate of entry is relatively low in the SACCO industry in Kenya.
However, this is not to say that capital requirements are main barriers of entry to the
SACCO industry.
Empirical works by scholars on the effect of market structure on the performance of
the banking industry has focused on the standard analysis of the relationship between
profitability and concentration measures and they found a positive relationship
between market structure and bank performance for instance, Kaufman, 1966 and
Rhoades, 1985. Other empirical works had varied results, for instance Smirlock
(1985), found an insignificant relationship between the measures of market structure
and of bank performance.
Entry barriers can also be designed to increase efficiency and such barriers are referred
to as structural barriers (OECD, 2007). They reflect the basic industry conditions. With
regard to capital adequacy requirement, SASRA seeks to protect investors and
member’s interests. The market power theory is relevant to this study since the SACCO
with a strong position in the market (market power share) is likely to achieve higher
financial performance.
21
2.2.2 Monetarist Theory
Milton Friedman was the Founding Father of Monetarism theory in 1987. Monetarism
is a theoretical challenge to Keynesian economics that increased in importance and
popularity in the late 1960’s and 1970’s Monetarists argue that since money is a direct
substitute for all other assets, an increase in the supply of money, given a fairly stable
velocity of circulation, there will be direct effect on the demand for other assets since
there will be more money to spend on those assets. If the total output of the economy
is fixed, then an increase in the money supply will lead directly to high prices
(Friedman, 1987). All increases in the money supply will be reflected in higher prices
unless when there is a long-term growth in the economy.
Kiyotaki and Wright (1989) illustrate that a model that can now be described more
easily than when it was first developed, due to advances in technique. The goal is to
derive equilibrium trading patterns endogenously, to see if they resemble arrangements
observed in actual economies, in a stylized sense, and especially to see if there emerge
institutions like the use of some commodities as medium of exchange or some agents
as intermediaries. Adding other assets allows researchers to more easily illustrate
additional financial performance. These include: assets can facilitate intertemporal
exchange; this may be true for fiat currency, an asset with a zero return, or even assets
with negative returns; for money to be essential, necessary conditions include limited
commitment and imperfect information; the value of fiat money is both tenuous and
robust; and whether assets circulate as media of exchange may not be pinned down by
primitives (Kiyotaki and Wright 1991,1993).
Monetarist school contended that money supply is a key determinant of the level of
production in the short run and the rate of inflation in the long run. In order to minimize
uncertainty monetarist advocated for the maintenance of a constant rate of growth of
money supply (Friedman, 1987). The monetarist school holds to three major
propositions: that growth of the money supply is the major systematic determinant of
nominal GDP growth; prices and wages are relatively flexible and that private
economy is stable, these propositions suggest that macroeconomic fluctuations arise
primarily from erratic money-supply growth.
22
The monetarist theory is relevant to this study as it guides the SACCO on asset quality,
given the risks and uncertainty of the future. Additionally, inflationary expectation is
affected by previous period thus affecting economic growth through asset quality of
SACCO that contributes to the economy of the country.
2.2.3 Efficient Structure Theory
This theory was formulated by Modigliani and millers (1950), through capital theory
approach advocating capital structure irrelevancy theory; they further states that the
market value of a firm is affected by its future growth prospect apart from the risk
involved in the investment, efficient structure theory prepositions were; no transaction
cost and individual and corporate borrow at the same rate. Efficient structure theory
enhanced managerial and scale efficiency leads to higher concentration and then
leading to higher profitability within the financial institution.
According to Nzongang and Atemnkeng in Olweny and Shipho (2011) balanced
portfolio theory also added additional dimension into the study of bank financial
performance. It states that the portfolio composition of the financial institution like
saccos, its profit and the return to the members is the result of the decisions made by
the management and the overall policy decisions. From the above theories, it is
possible to conclude that saccos financial performance is influenced by both internal
and external factors.
Demsetz (1973) formulated an alternative explanation on market structure
performance relationship and proposes the Efficiency Hypothesis. Applied to financial
institution like sacco sector, this hypothesis stipulates that a sacco which operates more
efficiently than its competitors gain higher profits resulting from low operational costs.
The same bank holds an important share of the market. Consequently, differences at
the level of efficiency create an unequal distribution of positions within the market and
an intense concentration. Since efficiency determines market structure and
performance, the positive relationship between these two seems superficial.
According to Thoraneenitiyan (2010), bank efficiency studies can be separated into
those that examine scale and scope efficiency and those that examine X-efficiency
(frontier efficiency). The X-efficiency hypothesis argues that banks with better
23
management and practices raise profits and control costs, moving the bank closer to
the best-practice. The scale-efficiency hypothesis argues that some banks achieve
better scale of operation and, thus, lower costs. Lower costs lead to growth and higher
profits.
Berger (1995) divides the efficiency hypothesis into x-efficiency (XE) and scale
efficiency (SE) hypotheses. According to the x-efficiency hypothesis, the costs
incurred by financial institution with efficient management and technologies are lower
resulting in higher profitability. The better banks x-efficiency is, the larger are market
shares and the higher is concentration. Under the efficiency hypothesis, the difference
in performance between two firms is not due to differences in management efficiency,
but to differences at the level of scale efficiency. Banks costs lower than their
competitors result in higher profitability. These banks may acquire extended market
shares which increases market concentration. Previous research on market-power
theories test produce suspect findings, and do not support the efficient-structure
theories and findings support for only two of the four hypotheses, the relative market
power and the X-efficiency hypotheses using simultaneous test of all four competing
hypotheses two market-power and two efficient structure by adding measures of X-
efficiency and scale efficiency to the standard tests (Berger, 1995).
Empirically tested this hypothesis (Efficient-Structure theory) using data set over 2700
banks, found that no relationship between market concentration and bank performance,
while statistical significant positive correlation between bank profitability and market
share was present (Smirlock, 1985). The efficiency structure theory is relevant to this
study as it guides the SACCO in management efficiency.
2.2.4 Liquidity Theory
Keynes (1936) developed the liquidity preference theory in his famous book, the
general theory of employment, interest, and money was developed due to the great
depression with persistent unemployment for which the quantity theory of money had
no answer to economic problems in the society. His theory was based on the
preposition that money is financial asset in portfolio that consists of ether money or
bond; he further researched on both transaction and asset theories of money demand.
24
Keynes distinguished three motives of holding money as; transaction motive,
precautionary motive and speculative motive.
Baumol and Tobin (1958) refined the liquidity preference theory and their propositions
which were based on Keynesian model economy that emphasized on investing in risky
assets, instead of transaction balances. Baumol (1958) considered transaction balances
to meet the working capital needs of the investors while Tobin (1958), emphasized on
investment balances that premised on liquidity preference theory that seeks to explain
the level of interest rate with regards to the interaction of money supply and desire of
investors to hold their savings in cash or near cash.
Calomiris, Heider and Hoerova (2014) further argued that banks should hold cash to
guard against liquidity risk and as a prudential regulatory measure. Borrowing from
the Black-Scholes model, the theory argues that cash as opposed to capital is riskless,
observable and verifiable. By holding cash, financial institutions mitigate against two
risks simultaneously; default risk and liquidity risk. There are several liquidity
theories; the liquid asset theory focuses on the asset side of the financial position and
argues that financial institutions must hold large amount of liquid assets against
possible demand or payment cushion of readily marketable short-term liquid assets
against unforeseen circumstances. This approach is very expensive in a current world
of dynamic money market (Ngwu, 2006).
The shift ability theory holds that bank liquidity is maintained as long as assets that
could be shifted or sold to other lenders or investors for cash. The theory includes
marketable securities as part of liquidity. Anticipated income theory argues that Sacco
liquidity can be estimated and influenced by the maturity pattern of the loans and
investment portfolios, short-term business and customer installment loans which
would have more liquidity than those secured by real estate (Taye, 2014). The
commercial loan theory on the other hand argues that SACCO liquidity would be
assured if assets were held in short term, loan that would be liquidated in the normal
course of business and by extending working capital loans, liquidity is assured as such
inventory would eventually be sold for cash.
25
Saunders and Cornett (2011) advocate for the prudential planning of cash flows by
matching assets against maturities of liabilities. For an organization to operate in a
positive cash flow the maturity of asset must be earlier than the maturity of liabilities.
Government of Kenya (2008), SACCO Societies Act advocates for 15% Liquidity ratio
is computed as total cash and cash equivalent divided by the summation of short-term
deposits and short term liabilities. The ratio encourages SACCOs to be liquid always
to enable them meet daily cash requirements for the members and a similar view was
shared by Ruth (2001).
Allen and Gale (2004) advocate that, in the absence of financial shocks and
incompleteness of the markets for aggregate risk, there is no regulation that can
improve upon the market equilibrium. In contrast to the literature Farhi et al, (2009),
proposed that bringing in a liquidity requirement on the minimal or the maximal
amount of liquidity holdings of the short asset for an intermediary. They identify a
reason for the market failure and externality in which intermediaries do not internalize
how liquidity they provide aspects other intermediaries via the possibility of trades on
private markets. Importantly, this externality exists even when there are no aggregate
shocks. This contrasts with the conclusions of Holmstrom and Tirole (1998) and Allen
and Gale (2004) that the government has an important role in regulating liquidity only
if there are aggregate shocks.
Saunders and Cornett (2011) recommended prudential planning of cash flows by
matching maturities of assets and liabilities. Organization should operate in a positive
cash flow and the maturity of asset must be earlier than the maturity of liabilities in
order to cushion against risk. SASRA act advocates for 15% Liquidity ratio which is
computed as total cash and cash equivalent divided by the summation of short-term
deposits and short-term liabilities. The ratio encourages SACCOs to be liquid always
to enable them meet their obligation for the members (Government of Kenya, 2008).
In this study this theory is relevant as it guides SACCOs by highlighting how much
they get indebted, whether the debt burden is heavy or light and finally whether their
financial situation is improving or not.
26
2.2.5 Portfolio Selection Theory
Markowitz (1952) developed this theory through his paper, portfolio selection,
formalized intuition by proposing that investors focuses on selecting portfolios based
on portfolios overall risk return characteristic instead of compiling portfolios from
securities that each individually have attractive risk return characteristic. He argued
that only systematic risk can be diversified while unsystematic risk cannot be
diversified but can be hedged and transferred only. Tobin (1958) expanded on
Markowitz’s theory by adding a risk-free asset to the analysis which made it possible
to leverage portfolio on the efficient frontier.
The main prepositions of this theory were: that future return of the invested stocks is
uncertain and therefore to calculate it with absolute certainty is not possible, different
investors have different preferences of the risk associated with uncertainty thus
investors choose the stocks with their desired level of risk preferences and the future
return of the invested stocks are correlated to each other. Hence, while creating
portfolio, independence is considered between the return values of the stocks and the
risk. In this study market risk is an inherent part of a higher return thus risk averse
SACCO management (investors) can construct portfolio based on a given level of
sensitivity to market risk.
Utility and risk are two often competing measurements on the investment performance
and indicate that efficient trade-off between these two measurements for investment
portfolios happens, in general, on a convex curve in the two-dimensional space of
utility and risk. This is a rather general pattern. The modern portfolio theory of
Markowitz (1959) studied Portfolio Selection, and its natural generalization, the capital
market pricing model, Sharpe, (1966) analyzed mutual fund performance, which are
special cases of our general framework when the risk measure is taken to be the
standard deviation and the utility function is the identity mapping. Using our general
framework, we also get the results in (Rockafellar, Uryasev and Zabarankin, (2006)
who analysed master funds in portfolio analysis with general deviation measures that
extends the capital market pricing model to allow for the use of more general deviation
measures. This generalized capital asset pricing model also applies to approximation
of the maximum drawdown is considered as a risk measure. Furthermore, the
27
consideration of a general utility function allows to go beyond the additive
performance measure to a multiplicative one of cumulative returns by using the log
utility. As a result, the growth optimal portfolio theory. Lintner (1965) studied the
valuation of risk assets and the selection of risky investments in stock portfolios and
capital budgets, and the leverage space portfolio theory. Vince (2009) also did the
Leverage space trading model which can also be understood under our general
framework. Thus, this general framework allows a unification of several important
existing portfolio theories and goes much beyond. Nzongang and Atemnkeng (2006)
added to balanced portfolio theory a different dimension into the study of bank
financial performance. The theory suggests that the portfolio composition of a
commercial bank, its performance and the return to shareholders is the solution of the
decisions made by the management and the overall bank policy decisions.
According to Omisore, Munirat & Nwufo (2012), asset diversification to hedge against
market risk as well as risk that is unique to a specific organization uses this theory.
Portfolio theory is quantification of the relationship between risk and return tradeoff
and the assumption that investors must be compensated for assuming risk. The
portfolio selection theory is relevant to this study as it guides SACCOs and saving
investors on how to construct their investment portfolios and how to mitigate against
risk through portfolio diversification and hence increase return to SACCO members
through dividends.
2.2.6 Expense-Preference Behavior Theory
This theory was developed by Williamson (1963), and later refined by Rees (1974),
this theory posits individual preferences of managers of a firm as utility maximizing,
as opposed to profit maximizing. This theory predicts that under certain circumstances
such as the separation of ownership and control, costly monitoring of managerial
behavior, lack of effective competition in input and output markets, or effective
regulation in those same markets, managers spend more on other prerequisites than is
consistent with profit maximization behavior, (Gropper and Oswald, 1996).
Edwards (1977) did the first empirical work for the expense preference theoretical
framework on financial institutions using data of 44 banks in 1962, 1964, 1986 and
28
total wages and salaries; total employees as the dependent variables, he found out that
coefficient of the three bank concentration ratios to be positive and significantly
correlated with both the bank's total labour force and the bank's total wage bill thus,
concluded that expense preference behavior is a significant force that detracts from
profit maximization in many banks. Other works consistent with this view include the
empirical works of Arnould (1985), who found evidence of the expense preference
theory in the banking firms. The theory is relevant to this study as it guides on how
the profitability of the SACCO is taken in measuring performance.
2.2.7 Economic Efficiency Theory
Economic efficiency theory states that companies should achieve their output at the
lowest possible cost per unit produced. According to this theory, economies of scale
should be exploited to achieve optimal production. The theory focuses on two kinds of
efficiency; allocative and productive efficiency, allocative efficiency is achieved by
ensuring that all firms in the industry charge optimal prices. In the banking sector, this
will result in a reduction of lending rates.
The economic efficiency theory is relevant to this study as it guides in savings
mobilization, which will enable SACCOs to create credit out of excess deposits (credit
creation) hence SACCO will earn interest. Allocative efficiency in the determination
of lending rates among SACCOs will ensure unhealthy competition does not ensue
between them. High competition in banking is associated with instability (De Nicoló,
Jalal and Boyd, 2006). Productive efficiency is achieved when SACCOs employ all
their resources efficiently, producing the most output from the least input (Said, 2011).
This theory is relevant to this study as Productive efficiency guides both the lending
and investment decisions of SACCO hence improving financial performance and guide
in investing in low risk assets such as government bonds.
2.3 Conceptual Framework
A conceptual framework is principles taken from relevant fields of enquiry and used
to structure a subsequent presentation (Kombo and Tromp, 2009). A conceptual
framework is a research tool intended to assist a researcher to understand the situation
under scrutiny and to communicate it.
29
According to Mugenda (2008), a conceptual framework is a hypothesized model
portraying the relationship between dependent and independent variables graphically
or diagrammatically. Conceptual framework helps in quickly conceptualizing the
proposed relationship and is put to test in order to establish the significance of the
proposed relationship. The conceptual framework illustrates the dependent and
independent variables.
The CAMEL is a Uniform Financial Institutions Rating System (UFIRS) that was
adopted by the Federal Financial Institution Examination Council (FFIEC) to evaluate
the soundness of financial firms (Dang, 2011). The system became internationally
known with the abbreviation CAMEL, reflecting five assessment areas; capital
adequacy, asset quality, management efficiency, earnings ability and liquidity. The
CAMELS approach system focuses on the financial statement, funding sources,
macroeconomic data, budget and cash flow thus observing the institution's dynamic
aspect (Deyoung et al., 2001). A similar approach was applied by Gupta (2014), in
analyzing the performance of public banks in India. A conceptual framework in this
study shows the effect of internal factors on financial performance of SACCOs in
Kenya and has been depicted in Figure 2.1.
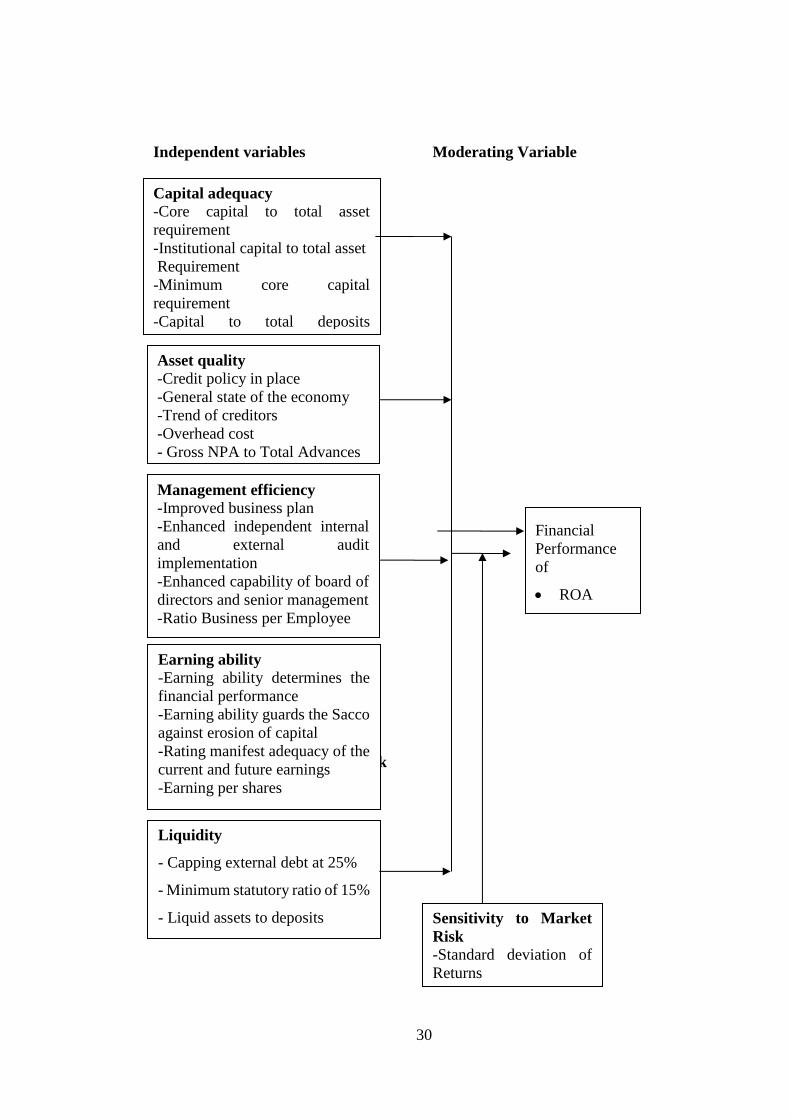
30
Figure 2.1: Conceptual framework
2.3.1 Capital adequacy
Asset quality
-Credit policy in place
-General state of the economy
-Trend of creditors
-Overhead cost
- Gross NPA to Total Advances
Financial
Performance
of
ROA
Management efficiency
-Improved business plan
-Enhanced independent internal
and external audit
implementation
-Enhanced capability of board of
directors and senior management
-Ratio Business per Employee
Earning ability
-Earning ability determines the
financial performance
-Earning ability guards the Sacco
against erosion of capital
-Rating manifest adequacy of the
current and future earnings
-Earning per shares
Capital adequacy
-Core capital to total asset
requirement
-Institutional capital to total asset
Requirement
-Minimum core capital
requirement
-Capital to total deposits
requirement
Sensitivity to Market
Risk
-Standard deviation of
Returns
Liquidity
- Capping external debt at 25%
- Minimum statutory ratio of 15%
- Liquid assets to deposits
Independent variables Moderating Variable
Dependent variable
31
Capital is the money already invested in business or investable (Geoffrey, 2014).
Capital is adequate either when it decreases risk of collapse in the future to some level
that is predetermined or when a bank pays enough premiums to an insurer per the
expected losses (Maisel, 1979). Moulton (1918) in his theory of shiftability reveals
that firms should have assets that can easily be shifted to other firms. This helps to
counter the problem of capital adequacy. In this study, capital adequacy was measured
using core capital to total asset requirement, institutional capital to total asset
requirement and minimum core capital requirement. The dimension of capital
adequacy is an important factor to help the bank in understanding the shock attractive
capability during risk. In this study, capital adequacy is measured by using the equity
to total assets ratio (Vong & Chan, 2009). That means, capital adequacy enables a bank
to meet any financial unexpected condition due to Financial risk, credit risk, market
risk, interest rate risk. Capital adequacy protects the interest of members of a sacco.
Odhiambo (2011) researched on relationship between working capital management
and financial performance by deposit taking SACCOs licensed in Nairobi County.
Findings of the study indicated that efficient working capital management leads to
better financial performance of a SACCO hence positive relationship existed between
efficient working capital management and financial performance.
2.3.2 Asset Quality
Asset quality is a factor that determines the state of an organization. Examples of asset
qualities of a micro finance institute are; loans, securities, off balance sheet items, cash,
due from accounts, premises and so forth (Schaeck, 2008). Asset quality is evaluated
through rating, what is known as asset quality rating. This rating reflects on the existing
and possible credit risk associated with the asset qualities. In this study, asset quality
was measured using credit policy in place, general state of the economy and trend of
creditors. The dimension of asset quality is an important factor that help the financial
institution in conceptualizing the risk on the exposure of the organization debtors.
According to merchant (2012), this variable is measured by the provision for loan loss
reserve to total asset ratio. This ratio assures to cover the bad and doubtful loans of the
32
Sacco. This variable will benefit the Sacco in getting right the amount of funds that
have been reserved by the Sacco in the event of bad investments.
2.3.3 Management efficiency
Management efficiency is an internal factor that refers to how best the management is
able to allocate and use resource to increase performance. Management efficiency can
be computed by different ratios such as total asset growth, earning growth rate and
loan growth rate (Kusa & Ongore, 2013). The study also noted that ratio of operating
profit to income is also a good measure of management efficiency. Management
efficiency refers to a monetary recommendation that could result in funds being used
more efficiently. The recommendation may include; savings from such items as
reprogramming or recapture of unliquidated obligations; more efficient contract
negotiations; and reduction or elimination of payments, costs, or expenses that would
be incurred by the Agency (Grier, 2007).
Management efficiency evaluate Governance of SACCOs, how prudent the SACCOs
board of directors operate, including the board diversity of technical expertise of an
organization, independence of management and its ability to make decisions
effectively, it also evaluates whether human resources provides clear guidance and
support to operations staff, Processes, controls and audit (SASRA, 2013). In this study,
management efficiency was measured using improved strategic plan, improved
business plan, enhanced independent internal and external audit implementation and
enhanced capability of board of directors and senior management. Management
efficiency reflects the management soundness of a financial institution. The
management acts as a safeguard to operate the sacco in a smooth and prudent manner
and is called excellence management or skillful management, whenever it controls its
cost and increases performance, ultimately achieving higher profits.
2.3.4 Earning ability
Earnings ability refers to the firm capability to maintain and increase its net worth
through earnings from operations (Kongiri, 2012). In this study, earnings ability was
measured using earning ability determines the financial performance, earning ability
guards the Sacco against erosion of capital and rating manifest adequacy of the current
33
and future earnings. Earning ability is an important parameter to measure the financial
performance of an organization like savings and credit societies. Earning ability
measures the profitability and productivity of a financial institution, explains the
financial growth and sustainability of future earnings capacity of an organization. In
the same way, saccos depends on its earning ability to perform the routine activities
like funding dividends, maintaining adequate capital levels, providing for
opportunities for investment for saccos to grow financially, strategies for engaging in
new emerging activities and maintaining the competitive outlook in the market.
2.3.5 Liquidity
Liquidity is the availability of money that can be used to finance a project or
institution’s ability to finance an increase in assets and to repay liabilities in time
(Adrian and Shin, 2010). It is also the ability to settle obligations within the stipulated
time. It can be measured using the following concepts; money overhang, the price gap,
nominal money gap and the real money gap (Polleit and Gerdesmeier, 2005).
According to Uzhegova (2010) banks with high liquidity ratio have low profits and
high risk. In this case the bank management is always in a cross road regarding
performance and liquidity hence the management should be very keen in decision
making. In this study, liquidity was measured using capping external debt at 25%,
minimum statutory ratio of 15%, liquid assets to deposits and short-term liabilities.
Liquidity ratio, in a measure the ability to meet its current obligations as they come
(Hazzi and Kilani, 2013). To have a sound financial institution operation there is needs
to comply or meet the liquidity solvency ratio threshold as required by sasra. If any
Sacco faces liquidity crisis, Sacco it cannot meet up its short-term obligations as
required. Liquidity crisis seems to be a curse to the image of financial institution like
saccos thus is a prime concern to saccos. Loans, Cash and investments are the most
liquid assets of a Sacco. An adequate liquidity position means a situation, where
institution can obtain sufficient funds, either by rising liabilities or by converting its
assets quickly at a reasonable cost. Here liquidity performance is measured by net
investment to total asset ratio. This ratio can be defined as the amounts of assets been
engaged in investment.
34
2.3.6 Sensitivity to Market Risk
Sensitivity to market risk is described as the degree to which changes in interest rates
and inflation can adversely affect financial performance. Sensitivity to market risk
stands for financial system it covers an assessment of exposure to market risk. The
rating system is designed to take into account and reflect all significant financial and
operational factors examiners assess in their evaluation of an institutions performance.
Institutions are rated using a combination of specific financial ratios and examiner
qualitative judgments the possibility of an investor to experience losses due to factors
that affect the overall financial market (Brockett, Cooper, Golden, Rousseau & Wang,
1997).
Sensitivity to Market risk is mainly associated with the interest rate risks, exchange
rate risks, and commodity as well as equity price risks. Deposit savings and credit
associations are also exposed to these risks. The sensitivity to market risk is assessed
by the percentage to which changes in market prices, interest rates, exchange rates,
commodity prices, and equity prices adversely affect a bank earnings and capital. The
sensitivity of the financial institution earnings or the economic value of its capital base
or net equity value due to adverse effect in the interest rates of the market. The amount
of market risk arising from trading and foreign operations. As regards the sensitivity
to market risk, Basel Committee on Banking Supervision highlights the aspects like;
sensitivity of the financial institution’s net earnings or the economic value of its capital
to changes in interest rates under various scenarios and stress environments, volume
composition and volatility of any foreign exchange or other trading positions taken by
the financial institution, actual or potential volatility of earnings or capital because of
any changes in market valuation of trading portfolios or financial instruments, ability
of management to identify, measure, monitor and control interest rate risk as well as
price and foreign exchange risk where applicable and material to an institution
(Sahajwala and Bergh, 2000).
35
2.4 Empirical Literature Review
This section reviews studies previously done on effects of internal factors on financial
performance. Empirical literature review is a directed search of published work which
includes books and periodicals. It is a comprehensive survey of previous inquiries
related to the research questions (Zikmund et al, 2010). Miller and Yang (2008) found
out that through the use of a systematic approach to previous scholarly work, literature
review allows researchers to place the research work into an intellectual property and
enables researcher declare why research matters.
2.4.1 Capital Adequacy and Financial Performance of Savings and Credit
Societies in Kenya
Naceur and Kandil (2006) examined the effect of capital requirement on the
profitability of commercial banks in Egypt, the study focused on capital requirement
regulations set by the central bank of Egypt and the Basle committee. The study found
that high capital requirement increased the cost of intermediation. On the other hand,
the capital requirements increased the banks’ size leading to increased bank activity
and therefore improved financial performance; the study concluded that capital
requirement regulation improved financial performance.
Onaolapo and Olufemi (2012) examined the effect of capital adequacy on the
profitability of the Nigerian banking sector for 10 years period, 1999-2008, using
Augmented Dickey Fuller (ADF) to test for stationary of the data. The study further
conducted a pair wise grange r causality test to determine the co-integration between
the study variables. Findings reveal that the bank performance variables tested, Return
on Capital Employed (ROCE), Return on Assets (ROA), Efficiency Ratio (ER) does
not have significant effect on capital adequacy of the banking sector. They recommend
pragmatic governance and stable economic and financial environment for better
financial performance of commercial banks in Nigeria.
Saona (2010) investigated the relationship between the capital structure of commercial
banks in the United States and performance; the study revealed that a negative
relationship existed between the capital ratio and the profitability for the banking
industry. Another study by Berger and Bowman (2012), indicated that capital helps
36
small banks to increase their probability of survival and market share at all times. They
study further argued that capital enhances the performance of medium and large banks
primarily during banking crises
Odunga, Nyangweso, Carter, and Mwarumba, (2013) studied the effect of credit risk
and capital adequacy on the performance of commercial banks in Kenya. The study
was guided by the operational efficiency theory; they found that credit risk ratios had
a significant impact on operating efficiency of the banks. In an interesting twist, the
study found that capital adequacy had no statistical significant impact on bank
performance. The study recommended that banks shifted their concentration from
increasing capital levels to credit risk management.
Goddard et al. (2004) investigated performance of European banks using cross
sectional data during the year 1990s. The findings indicated that the relationship
between the capital to asset ratio and profitability was statistical significant. Athanas
oglou et al. (2013) studied the effect of bank specific, industry specific and
macroeconomic determinants of bank profitability in Greece and found out that
coefficient of capital variable was significant and highly significant reflecting the
sound financial condition of Greek banks. Kosmidou et al. (2005) researched on the
impact of banks characteristics, macroeconomic conditions and financial market
structure on banks net interest margin and return on average assets (ROAA) in the UK
commercial banking industry over the period 1995 to 2002. The findings indicated that
capital strength is one of the main determinants of UK banks financial performance
hence capitalized banks face lower cost of going bankrupt, which reduces their cost of
funding or lowers the needs for external funding which results in higher profitability.
Ngo (2006) researched on the relationship between capital adequacy and profitability
and his findings indicated no statistical significant relationship existed between capital
and profitability. Olalekan and Adeyinka (2013) studied the effect of capital adequacy
and profitability of deposit taking banks in Nigeria using primary data collected
through questionnaires distributed to banking employee, involving a sample of 518
respondents with a response rate of 76% and also the use of secondary data form
published financial statements of banks for the period 2006 to 2010. The findings from
37
this research for the primary data analysis revealed statistical insignificant relationship
but the secondary data analysis showed a positive and statistical significant
relationship between capital adequacy and bank profitability. This implies that for
deposit taking financial institutions, capital adequacy plays a key role in the
determination of bank profitability.
Kivuvo and Olweny (2014) studied the financial performance of SACCOs in Kenya
using the Altiman Z score model of corporate bankruptcy, the research study focused
on predictor variables of bankruptcy and the financial stability of SACCOs. The study
found out that liquidity and leverage was significant to SACCO financial performance.
According to the study, financial stability is also significant to economic performance.
The study concluded that SASRA should advocate for additional capital base for
SACCOs. They recommended that SACCOs should improve their liquidity,
profitability, operating efficiency and total assets turnover if they must remain in
business and meet the capitalization threshold.
Kahuthu (2016) studied the impact of prudential regulation on financial performance
of deposit taking savings and credit co-operative Societies in Kenya and revealed that
core capital positively influenced the financial performance of deposit taking SACCOs
in Kenya. Results of the inferential statistics such as ANOVA showed that core capital
has a major positive significance relationship on the SACCOs financial performance.
Barus, Muturi, Kibati, and Koima (2017) concluded that capital adequacy influenced
the financial performance of savings and credit societies in Kenya. Their findings were
explained by the regression results that showed the influence was positive and also
showed the magnitude by which capital adequacy influenced the financial performance
of savings and credit societies.
Odhiambo (2011) did a study on relationship between working capital management
and financial performance by deposit taking Saccos in Nairobi County and found out
that efficient working capital management leads to better financial performance of a
SACCO hence positive relationship existed between efficient working capital
management and financial performance. Olando (2013) study looked at the assessment
of financial practices as a determinant of growth of Sacco’s wealth in Kenya, a case
study of Meru County. This study used a comparative design in soliciting information
38
among forty four SACCOs. The study found out that SACCOs which inadequately
complied with their by-laws and did not have incomes from their investments were
unable to adequately cover their costs. The study recommended that the government
should review legal framework to ensure that institutional capital was used to grow
Sacco’s wealth. Ademba (2012) reported on cash management and stated that cash
management was the most important item in the operations of a SACCO. He asserted
that financial institutions should manage cash adequately to avoid panic withdrawals
by depositors.
According to Beckmann (2007), high capital ratio lead to low profits since banks with
a high capital ratio are risk averse, they ignore risky investment opportunities and as a
result, investors demand a lower return on their capital in exchange for lower risk. The
regulation that exists in most countries is capital requirement. Capital adequacy
requirements can take a variety of forms. Most countries know their minimum
threshold level of capital required. Therefore, many countries require the maintenance
of some capital adequacy solvency ratio; that is a minimum ratio between capital and
an overall balance sheet magnitude, such as total assets or liability, or some weighted
measure of risk assets. The Basel Accord was modified in 2004 introducing more
sophisticated ways of computing capital requirements and increasing the focus on risk-
management policies and systems in banks. In particular the new regulation, which
will start to be implementation from the end of 2006, encourages banks to develop,
with supervisory oversight, their own systems to compute minimum capital
requirements (Biggar and Heimler, 2005).
2.4.2 Asset Quality and Financial Performance of Savings and Credit Societies in
Kenya
Luqman (2014) undertook a study on the effect of credit risk on performance of banks
in Nigeria; the study found that there is a significant relationship between bank
financial performance (in terms of profitability) and credit risk management (in terms
of loan performance). The study mentioned that loans and advances and
nonperforming loans are major variables in determining asset quality of a bank.
Findings indicated that improper credit risk management reduces bank profitability,
affects the quality of its assets and increases loan losses and non-performing loan
39
which may eventually lead to financial distress. The study recommended that
management need to be cautious in setting up a credit policy that will not negatively
affects profitability and also, they need to know how credit policy affects the operation
of their banks to ensure judicious utilization of deposits and maximization of profit.
Non-Performing Assets (NPAs) has increasingly been gaining interest in recent past
years. Banks performance is significant to raising NPAs in the entire banking system.
Some studies found out that insolvency of financial institution can be predicted by
asset quality which is said to be one of the causes of failure of many financial
institutions since most of the banking institutions which have failed were linked to
increase in the level of their non-performing loans (NPLs) (Swamy, 2013). Failure of
many financial institutions in a country is associated with poor loan quality and bad
debts leading to receivership of some banks in the recent past. According to Waweru
and Kalani (2009) NPLs greatly contributed to the failure of some of the financial
institutions in 1986. The study also concluded that many commercial banks results to
failure due to the extensive insider lending. Hence asset quality is very vital in
understanding the performance of financial institution in the banking industry. Non-
performing loans lead to wastage of resources and result to indirect cost to the bank
caused by low asset quality, leading to low interests earned on loans and in long run it
negatively affects the performance of the bank (Cheruiyot, 2016).
Kinyua (2013) investigated the relationship between the SACCO size and financial
performance in Kenya, the study used total assets deposits and turnover as proxies for
SACCO size. The study found that SACCO size significantly influence performance.
Kioko (2014) investigated the influence of credit information sharing on SACCO
performance. The study established that credit information sharing plays a significant
role in determining performance of deposit taking SACCOs. Christopoulos et al.
(2011) found out that asset quality ratio tended to increase over the years. It implies a
low ability to detect, measure, monitor and regulate credit risks of an institution, while
at the same time considering its bad and doubtful debt for the Lehman Brothers. The
policy adopted in issuing loans was proven to be the worst policy by issuing loans to
insolvent, high-risk customers, which led to increase in its non-performing loans each
year.
40
Manyuanda (2013) examined the effect of nonperforming loans on the performance of
SACCOs in Nairobi, Kenya. The study concluded that a significant negative
relationship existed between non-performing loans and performance of SACCOs. The
study recommended that SACCOs opt for equity financing instead of debt financing
to improve on its leverage. SACCOs should also avoid excessive lending, maintain
high credit standards and limit lending to un-hedged borrowers.
Gitonga (2014) studied the effect of loan provision on the profitability of SACCOs in
Nairobi County. The study gathered information on loan provision from the year 2010
to 2013. The study revealed that a negative relationship existed between loan loss
provision and profitability of deposit taking SACCOs. A positive relationship was also
found between the size of the SACCO and performance. The study also mentioned that
management quality positively impacted on performance. They study also looked at
the role of loan intensity in SACCO performance. Findings indicated that a unit
increase in loan intensity led to a unit increase in profit of deposit taking SACCOs.
2.4.3 Management Efficiency and Financial Performance of Savings and Credit
Societies in Kenya
Bataineh (2014) examined the impact of employee training on the performance of
commercial banks in Jordan. The study found that training employees increased their
productivity. Increased knowledge and skills lead to efficiency. According to the study,
training also increases motivation levels among employees. Productivity of employees
is directly tied to performance of banks. A similar study by Tahir and Sajjad (2013),
on commercial banks in Lahore indicated that training significantly influenced bank
performance.
Okwee (2011) carried out research on corporate governance and financial performance
of SACCOs in lango sub region of Northern Uganda. The research sought to establish
the level of compliance with corporate governance guidelines, determine the
relationship between corporate governance and risks, to examined the relationships
between corporate governance and financial performance. A sample of 63 SACCOs
were drawn from a population of 75 SACCOs and a questionnaire distributed to each
of the SACCOs. The questionnaires were then collected, vetted and analyzed. The
41
findings revealed that majority of SACCOs were found to comply less with corporate
governance guidelines, risk was found to be weakly and negatively correlated with
corporate governance and financial performance.
Grier (2007) suggests that management is considered to be the single most important
element because it plays a substantial role in a bank’s success; however, it is subject
to measure as the asset quality examination. The management has clear strategies and
goals in directing the bank’s domestic and international business, and monitors the
collection of financial ratios consistent with management strategies. The top
management with good quality and experience has preferably excellent reputation in
the local communication.
Management relates to the competency of the bank’s managers, using their expertise’s
to make subjective judgments, create a strategic vision, and other relevant qualities.
Management is the key variable which determines a banks’ success. The evaluation of
the management is the hardest one to be measured and it is the most unpredictable
(Golin, 2001). Research indicate highest rating in the management quality displays a
strong performance of financial institutions as well as high competency of its human
capital, which would help the bank grow in the future (Majithiya & Pattani, 2010). On
the contrary, Christopoulos et al. (2011) show a continuous decreasing trend in the
management ratio over the years. It infers that many of the loans were bad, approved
as a result of the poor borrower analysis, a task that falls within the responsibilities of
the management of the institution
Olweny (2011) adopted the ratio of operating costs to net operating income to compute
the operating efficiency for the commercial banks in Kenya, and findings indicate that
operational costs inefficiency leads to poor profitability. The operating expenses to
assets ratio indicate expenses in relation to the size of a bank. It was similar with cost
to income ratio but it was not affected by the changes in interest. Atikogullari (2009)
observed the management quality situation of the Northern Cyprus banking sector for
the period of 2001 to 2007 by using operating expenses to assets ratio.
Maseki (2012) studied the impact of knowledge management on performance of
commercial banks in Kenya. The study found that knowledge management greatly
42
affected performance of the commercial banks. According to the study knowledge
management enhances product and service quality; increases productivity and
innovative ability. The study mentioned that knowledge management improves
performance of employees in their duties in the bank and enhances employee
competence. Knowledge management enhances the ability of the bank to develop new
innovative financial products for its customers, turnaround time of employees,
communication process in the bank and profitability of the bank.
Kimari (2013) undertook a study on the credit risk management and SACCO financial
performance in Kenya. The study used capital adequacy, asset quality, management
efficiency, earnings and liquidity as the independent variables and ROE as the
dependent variable. The study found that the model significantly explained SACCO
financial performance. A positive relationship was found to exist between all the
CAMEL components and financial performance. The study recommended that with
regard credit risk management, the management should undertake measures to
improve Capital adequacy, Asset quality, Management efficiency, Earnings ability and
Liquidity.
2.4.4 Earnings Ability and Financial Performance of Savings and Credit Societies
in Kenya
Ausina-Tortosa (2012) examined earnings quality and bank performance in Spain. The
study found that contrary to expectations, earnings management did not significantly
influence profitability. Kongiri (2012) investigated the effect CAMEL variables on the
efficiency of commercial banks. The study found that capital adequacy, earnings and
liquidity ratio have a negative relationship to efficiency ratio while Management
quality and asset quality have a positive relationship. The study mentioned that the
earnings ability reflects the bank's ability to absorb losses, expand its financing, as well
as, its ability to pay dividends to its shareholders, and helps develop an adequate
amount of own capital (Kongiri, 2012).
Olando, Mbewa and Jagongo (2012) studied financial practice as determinant of
growth in SACCOs in Kenya. The study found that growth of SACCOs wealth
depended on financial stewardship, capital structure and funds allocation strategy.
43
According to the study, most SACCOs inadequately complied with their by-laws.
Their incomes from investments did not adequately cover their costs.
The study recommended a continuous review of credit policies, establishment of
irrecoverable loan provision policies, development of sound staff recruitment policies
and the use of appropriate financing mix. Further, he recommended that the
Government should review legal framework to ensure that institutional capital is used
to grow SACCOs’ wealth.
2.4.5 Liquidity and Financial Performance of Savings and Credit Societies in
Kenya
Marozva (2015) examined the relationship between liquidity and performance of
commercial banks. The study used net interest margin as the proxy for performance.
The study found a negative significant deterministic relationship between net interest
margin and funding liquidity risk. However, an insignificant co-integrating
relationship was found between net interest margin and measures of liquidity.
Abang-anoh (2012) undertook a study on the effect of liquidity on performance of
commercial banks. The study found a positive relationship between liquidity and the
existence of any banks. According to the study adequate liquidity enable banks to
mandate it risk and thereby helping to sustain public confidence in the operation of the
banking institution which in turn leads to more patronage and consequently more
profit.
Halling and Hayden (2006) found out that a bank should define and identify the
liquidity risk to which it is exposed for all legal entities, branches and subsidiaries in
the jurisdictions in which it is active. A bank liquidity needs and the sources of liquidity
available to meet those needs depend significantly on the bank business and product
mix, balance sheet structure and cash flow profiles of its on and off-balance sheet
obligations. As a result, a bank should analyze on and off-balance sheet position,
including the effect of embedded options and other contingent exposures that may
affect the bank sources and uses of funds, and determine how it can affect liquidity
risk. A bank should consider the interactions between exposures to funding liquidity
risk and market liquidity risk (Jeanne and Svensson, 2007). Elsiefy (2013) justify that
44
banks with sufficient investment in liquid assets have the ability to withstand liquidity
crisis. The challenge is to identify the optimum amount of liquidity given by the risk
return tradeoff. The researcher further argued that higher liquidity in an institution
compared to the average for the sector also reflect inefficiency of the banking
institution. The higher the liquidity the lower the profitability, this imply that there is
a negative relationship between profitability and liquidity.
Konadu (2009) studied factors determining the liquidity trends of selected banks so as
to ascertain the profitability trend of the selected banks with the aim of analyzing and
establishing the relationship between bank liquidity and performance levels in Ghana.
Data was collected between 2006 and 2009 from commercial banks listed at the
Ghanaian Stock Exchange which included Standard Charted Bank Ghana Ltd, SG-
SSB Ltd and Cal Bank Ltd. The liquidity ratios used for the study were cash ratio,
current ratio, quick ratio and net operating cash flow ratio whereas the profitability
ratios consisted of net profit margin, return on assets, return on equity and net asset
turnover. Trend analysis was adopted so as to achieve the set objective. The research
findings established that there was no positive relationship between liquidity trend and
profitability whereas a negative relationship existed between liquidity and bank profit
in Ghana.
Omino (2014) analyzed the liquidity mitigation measures and performance of
SACCOs in Kisumu County. The study found that liquidity risk mitigation approaches
adopted by different SACCOs had a significant effect on their financial performances.
The study revealed that SACCOs adopted a more cautious position in their current
liabilities to ensure that operating cash flows were sufficient to cover the short terms
obligations entered by the firms. Further, the study revealed that debtor collection
periods were longer to encourage voluntary membership and consequently the
SACCOs were either unjustifiably constraining their creditor payment periods or were
conditioned to do so. The study recommended the deployment of efficient systems to
strengthen liquidity risk control fundamentals. SACCOs should also consider seeking
professional guidance towards adopting policies on asset and liability management.
Kabamba (2012) analyzed liquidity management and growth of microfinance
institutions in Uganda a case study of Kibuku, the study revealed that if liquidity is
45
well managed, the costs associated with it such as loss of public confidence, high
administrative costs and close of business was dealt with. The need for sound liquidity
management strategies is particularly critical since measures should be properly
implemented. Conclusions drawn from the study showed that there was a positive
relationship between liquidity and growth of the institution. If liquidity is properly
managed, the costs associated with it will be minimized and this will drastically
increase the growth of the micro finance institutions.
2.4.6 Internal factors of Financial Performance on Financial Performance of
Savings and Credit Societies in Kenya
Internal factors of financial performance are critical to all the shareholders. The value
of shareholders is dependent on several factors including: the current profitability of
the company, its risks, and its economic growth essential for future company earnings.
All of these are major factors influencing the market value of a company (Chijoriga,
2007). Tomuleasa (2014) studied the determinants of European bank performance. The
study focused on bank specific factors and macroeconomic variables. The study
mentioned that inflation effect on profitability is tethered to the capacity of bank’s
management to forecast inflation. The study established mixed findings; banks were
able to correctly anticipate inflation had the opportunity to adjust their interest rates
accordingly and consequently to earned higher profits. The performance of those that
could not predict inflation was adversely affected.
Menicucci and Paolucci (2016) analysed bank specific factors and profitability in
European banking sector in order to determine the impact of internal factors on
achieving high profitability employing regression analysis done on unbalanced panel
dataset related to 28 European banks over the period 2006 to 2015. The largest bank
of any single country of the European Union was selected and regression results
indicated that capital adequacy ratio and bank size have positive and significant impact
on bank performance in Europe, while higher asset quality results in lower profitability
levels. Findings also suggest that banks with higher deposit ratio tend to be more
profitable. The findings also provided interesting insights into the characteristics and
practices of profitable banks in Europe. First, the results offer new comprehensive
insights into the factors determining the profitability of commercial banks in Europe.
46
Single bank’s characteristics explain a portion of within country variation in European
bank profitability, suggesting that much more attention should be dedicated on bank
specific factors in order to increase the profitability. next, the study could be a support
for investors in their decision-making process and particularly could be useful for the
global institutional investors looking for profitable investment opportunities in
European banking institutions.
Sufian and Chong (2008) studied the determinants of financial performance under
profitability during the period 1990 to 2005 in Philippines banks. Results of the study
indicate a direct relationship between financial performance and bank specific factors.
Similarly, the empirical results suggested that the bank specific factors such as capital
adequacy, asset quality and management efficiency affect profitability and by
extension the financial performance of the banks. According to Sufian and Chong
(2008) poor expenses management is a main contributor to poor performance.
Operational expense efficiency is one way of assessing managerial efficiency in banks.
strategies are likely to be more profitable. The specific items highlighted in the study
are an expression of efficiency in management.
Njoroge (2008) assessed the relationship between financial performance and selected
determinants for SACCOs in Nairobi, Kenya using sample size considered comprised
of 30 SACCOs for the period between 2002 to 2007. Financial performance was
measured using return on assets (ROA) and return on Equity (ROE). Factors used for
regression against ROA were size of the SACCO, loans to total Assets, liquidity to
total loans, operating expenses to total assets and growth rate of loans. Asset Size,
loans to total assets, liquidity to total assets and growth rate of loans were positively
correlated to financial performance. Operating expense ratio was negatively related to
performance. Capital ratio was also positively correlated to ROA
Ozgur and Gorus (2016) analysed the impact of bank specific and macroeconomic
factors on deposit bank profitability in Turkey using OLS methodology to construct
multiple regression analysis. The study employed the monthly data for the period over
2006:1 to 2016:2. Empirical results indicated that equity over total assets, non-
performing loans to total cash loans, net interest revenues to average total assets, and
central bank policy interest rate have a positive and significant impact over return on
47
assets (ROA) while noninterest income over total assets, market share of deposit banks
in banking sector, operational expenses to average total assets, and exchange rate are
statistically insignificant. This indicated that recent global financial crisis on bank
performance is significantly negative. Indeed, result of this study provide supportive
evidence that financial crisis adversely affected banking industry performance in
Turkey.
2.4.7 Sensitivity to Market Risk on Internal Factors of Financial Performance of
Savings and Credit Societies in Kenya
The inclusion of moderating variable in this study may potentially increase the
predictive validity of the model under investigation and explain the inconsistent
findings in various disciplines (judge et al, 2001). In research moderating variable
have enjoyed popularity in literature in recent years of which scholars have appreciated
its importance in predicting sensitivity to market risk for instance (Kenny, 1986 and
Sharma et al, 1981).
Sensitivity to market risk is the degree to which changes in interest rates, foreign
exchange rates, commodity prices, or equity prices can adversely affect capital. Boyd
and Smith (2000) conducted a study on the effect of inflation on the performance of
commercial banks. The study found that significant negative relationship existed
between inflation and the performance of the banking sector. According to the study,
a rise in inflation reduces lending activities and equity development. This is because
an increase in inflation diminishes the real return on and According to Jorian, (1997),
extreme value theory (EVT) is used as a typical implement along with financial
institution to describe the risk of a market portfolio. It will measure the utmost loss of
the portfolio worth that will take place over a given time at some explicit confidence
level due to uncertain market factors.
Milanova (2010) examined sensitivity to market risk management in banks. The study
focused on interest rate risk management using the Value at Risk (VAR) model. The
study found that market interest rates, currency exchange rates, prices of shares and
exchange tradable commodities have an adverse impact on bank incomes and capital
48
position. The study recommended rigorous risk management to mitigate against the
risk.
Determinants of European bank performance was studied and it focused on bank
specific factors and macroeconomic variables. The study mentioned that inflation
affect profitability and is tethered to the capacity of bank’s management to forecast
inflation. The study established mixed findings that banks were able to correctly
anticipate inflation and had the opportunity to adjust their interest rates accordingly
and consequently to earned higher profits. The performance of those that could not
predict inflation was adversely affected (Tomuleasa, 2014).
In this study sensitivity to market risk is expected to moderate internal factors on
financial performance of Savings and Credit Societies in Kenya. Sensitivity to market
risk stands for financial system; it covers an assessment of exposure to market risk.
The rating system is designed to take into account and reflect all significant financial
and operational factors assessed in their evaluation of an institutions performance.
Institutions are rated using a combination of specific financial ratios and examiner
qualitative judgments and the possibility of an investor to experience losses due to
factors that affect the overall financial market (Brockett, Cooper, Golden, Rousseau &
Wang, 1997).
Ngalawa and Ngare (2013) showed that bank’s exposure to interest rate risk or income
gap determines the structure of the financial position. They analyzed interest rate
sensitivity gaps obtained from financial accounting reports for 10 commercial banks
listed in the Nairobi securities exchange for the period 2008 to 2012. Findings indicate
that there is large exposure to interest rates that can be predicted through the income
gap and also sensitivity of income gaps to market interest rates as determined by the
CBK through treasury instruments. Recommendation indicate that research on wider
sample of banks over a longer time series period be established on comprehensive
effect of interest
Gachua (2011) studied on the effect of foreign exchange exposure on a firm’s financial
performance of a case of 32 selected listed companies in the Kenya Nairobi Stock
Exchange. The data analysed was for the period covering years 2001 to 2010. Results
49
indicated that listed firms use the income statement and the owners’ equity account to
record foreign exchange differences. The research concluded that unrealized foreign
exchange gains or losses had an effect on the Net Income of listed companies as it was
posted to either income statement or owners’ equity. The market risks rising rate of
environment exposure posed by increases in interest rates and inflation rate to
unprepared financial institutions like SACCOs are very vast. A rising rate of market
risk exposes institutions like SACCOs with liability-sensitive positions to declines in
net interest income. Effect of sensitivity to market risk on internal factors of
performance was tested following adopted model is similar to that used by many of the
studies done in the area of moderating effect Muiruri, Memba and Njeru (2015) and
Ongore and Kusa (2013).
2.5 Critique of Reviewed Literature
More research on has been done in the banking sector and very few on SACCOs.
Naceur and Kandil (2006) examined the impact of capital requirement on the
profitability of commercial banks in Egypt. The study differs in scope from the current
study as it was not carried out in Kenya and focused on commercial banks and not on
SACCOs. (Saona, 2010) investigated the relationship between the capital structure of
commercial banks in the United States and performance. This study differs from the
current study as it was carried out in USA and its scope was limited to commercial
banks also moderating effect was not studied. Banks and SACCOs are unique in terms
of operations and therefore findings may not be generally generalizable.
Luqman (2014) undertook a study on the effect of credit risk on performance of banks
in Nigeria. This study differs from the current one as it only focused on credit risk as
a determinant of performance but did not address the other determinants identified in
this study. Kinyua (2013) investigated the relationship between the SACCO size and
financial performance in Kenya. Manyuanda (2013) examined the effect of
nonperforming loans on the performance of SACCOs in Nairobi, Kenya. The study’s
objective differs from the current one.
Olando (2013) carried a study on the assessment of financial practice as a determinant
of growth for SACCOs wealth in Meru county, Kenya. The Study was a case study for
50
SACCOs in Meru county and hence bias of results applicable in only one county.
Moreover, the study obtained information from 44 SACCOs and did not distinguish
which were deposit taking SACCOs and which ones applied to non-deposit taking
SACCOs.
Reviewed literature has looked at determinants on performance without considering
the moderating effect of sensitivity to market risk on the effect of internal factors on
financial performance of savings and credit societies in Kenya. The current study aims
to fill this gap. Reviewed studies done in Kenya tend to confine themselves to specific
counties, further these studies fail to employ the moderating variable of sensitivity to
market approach in examining SACCO performance.
2.6 Research Gaps
The literature review reveals the existence of many knowledge gaps with respect of
effect of internal factors on financial performance of deposit taking saccos especially
in the context of Kenya. This is because most of the reviewed literature are empirical
researches done on determinants of profitability and financial performance of on
African and specifically non-Kenyan banks. In addition, the literature review shows
the existence of non-conclusive studies with varying results.
A review of literature available was mostly focused on developed and developing
countries on effects of internal factors on financial performance of banks and very few
on SACCOs and hence limited knowledge. This study appreciates the role played by
the important corporative sector which contributes 31% of national savings and the
greater contribution it can achieve if financial performance is improved in the sector.
For instance, Naceur and Kandil (2006), examined the impact of capital requirement
on the profitability of commercial banks in Egypt, the study was also confined to
Egypt.
Studies in Kenya also focused on performance of commercial banks, for instance
Odunga et al, (2013), who studied the effect of credit risk and capital adequacy on the
performance of commercial banks in Kenya. Those that concentrated on SACCOs did
not measure the moderating effect of sensitivity of market risk on internal factors of
savings and credit association. Kongiri (2012) used CAMEL variables to investigate
51
the efficiency of commercial banks in Kenya. Nyambere (2013) undertook a similar
study but focused on the role credit risk management on performance of SACCOs.
Hence, the studies failed to identify the moderating variable.
Thus, the study contributes to the existing knowledge by offering solution to the
performance of savings and credit societies whose going concerns are threatened on
daily basis, the SACCOs financial performance continuously weakens. The study also
offers special insight on importance of capital adequacy, asset quality, management
efficiency and liquidity on financial performance and its moderating effect of
sensitivity to market risk. This research therefore will add to the existing body of
knowledge on effect of internal factors on financial performance of savings and credit
societies in Kenya also will add value to existing literature and can be used as a guide
to SACCO policy development for the general good of the country economy and
members.
2.7 Summary
The chapter reviewed several theories including market power theory, liquidity theory,
efficient structure theory, monetarist theory, portfolio selection theory, economic
efficient theory and expense preference theory. These theories were found applicable
to the research as they provided a background on the variables supporting financial
performance in deposit taking SACCOs. In addition, these theories supported the
conceptual framework which is the core basis and fundamental base for this research.
Thus, the study contributed to the theories of finance on the importance of the
hypothesis postulated and tested on capital adequacy, asset quality, management
efficiency liquidity and sensitivity to market risk, on financial performance.
Empirical review also was conducted where past studies both global and local were
reviewed in line with the following criteria, title, scope, methodology resulting into a
critique; it is from these critiques that the research gap was identified. The chapter also
outlined the conceptual framework of the study, which reflected the various variables
under study
52
CHAPTER THREE
RESEARCH METHODOLOGY
3.1 Introduction
This chapter discusses the methodology, which was used in the research. It outlines
the research philosophy, research design, study population, sampling frame, sample
size determination and sampling technique, data collection instruments, data collection
procedure and pilot testing. The section also describes the data analysis and
presentation methods. The statistical measurement model used in the analysis and tests
for hypotheses are also captured in this chapter.
3.2 Research Philosophy
Research philosophy relates to the development of knowledge and the nature of that
knowledge (Saunders, Lewis & Thornhill, 2009). The question of what is, or should
be regarded as acceptable knowledge in a discipline was the main focus of
epistemology, or the study of how knowledge develops. Epistemology is categorized
as descriptive where one can describe the philosophical position than can be discerned
in research. According to Goldkuhl (2012), there are three epistemological positions
including realism, interpretivism and positivism.
This study adopted a positivist research paradigm which is an epistemological position.
Positivism is sometimes referred to as 'scientific method' or 'science research', and is
based on the rationalistic, empiricist philosophy that originated with Aristotle, Francis
Bacon, John Locke, August Comte, and Emmanuel Kant (Denzin & Giardina, 2016).
Positivism is an epistemology that advocates for the application of methods of natural
sciences to the study of social reality and beyond. It is characterized by a belief in
theory before research and statistical justification of conclusions from empirically
testable hypothesis, the core of tenets of social science (Denzin & Giardina, 2016). The
current study is founded on several theories and testable hypotheses and hence
positivist philosophy was appropriate.
53
3.3 Research Design
A research design is a general plan or strategy for conducting a research study to
examine specific testable research questions of interest (Lavrakas, 2008). According
to Chandran (2004), a research design outlines what techniques was used to gather
data, what kind of sampling strategies and tools was used and how was time and cost
constraints be dealt with. The study employed a Quasi-Experimental Design. The
design is suitable for those studies that seek to establish a cause and effect relationship
between two or more variables.
The quasi-experimental design was most appropriate design for this study since it
helped in understanding the cause and effect relationship between internal factors and
financial performance of deposit Savings and Credit Societies in Kenya. Through the
design, the researcher was able to establish the cause and effect relationship between
internal factors (capital adequacy, asset quality, management efficiency, earnings
ability and liquidity) and financial performance of Savings and Credit Societies in
Kenya.
3.4 Target Population
A population is a well-defined set of people, services, elements and events, group of
things or household that are being investigated (Ngechu, 2004). Hyndman (2008)
describes a population as the entire collection of things in which we are interested.
Polit and Beck (2003) define population as the aggregate or totality of those
conforming to a set of specifications. By population the researcher means the complete
census of the sampling frame.
The target population refers to the entire set of units for which the survey data was
used to make inferences. The target population of this study was 83 DT-SACCOs in
Kenya (see appendix II). The accessible population was all the 83 registered deposits
taking SACCOs licensed by SASRA as at 1st January 2012 to December 2016, with
audited accounts and have been in operation for the last five years.
Therefore, the study used the inclusion criteria to select a total of 83 SACCOs
registered by SASRA as at 1st January 2012. The choice of the SACCOs licensed as at
1st January 2012 to December 2016 was justified since they had audited financial
54
statements and, therefore, secondary data collected from these financial accounts was
credible and generally acceptable.
3.5 Sampling Frame
Mugenda and Mugenda (2003) and Kothari (2004) define the term sampling frame as
a list that contains the names of all the elements in a universe. Polit and Beck (2003)
define sampling frame as the technical name for the list of the elements from which
the sample is selected from. The sampling frame describes the list of all population
unit from which the sample will be selected, (coopers & Schindler, 2003). The
sampling frame for the study consisted of all 83 licensed DT-SACCOs in Kenya, which
were in operation as at 1st January, 2012 and still in operation as at 31st December 2016
and with audited accounts as they appear in the SASRA database (SASRA, 2016).
3.6 Sample Size and Sampling Technique
A sample is a way of selecting a portion of the population which adequately represents
the entire population (Chandran, 2004). Gerstman (2003) mentioned that a sample is
needed because a study that is insufficiently precise lacks the power to reject a false
null hypothesis and is a waste of time and money. Therefore, the researcher determined
the sample size requirements of a study before collecting data. Census methodology
was used in the study since the population was small.
The number of respondents was 83 finance managers, one from each of the SACCOS.
The choice of the finance managers as the unit of observation was justified since they
have adequate information regarding internal factors that affect financial performance
of their organizations.
This study used purposive sampling procedure to identify the sample units. Purposive
sampling involves deliberate selection of particular units of the universe for
constituting a sample which represents the universe (Miller & Yang 2008; Kothari
2004). Burns and Grove (2003) emphasized that purposive sampling enables the
researcher to select specific subjects that provide the most extensive information about
the problem being studied. Secondary data and primary data were used. The study
covered a period of 5 years (2012-2016) and the data were obtained from the audited
financial statements of selected savings and credit societies in Kenya.
55
The sample was selected on the basis of the availability of audited accounts of SACCO
for a continuous period of 5 years from 2012 to 2016 and the financial statements
obtained from SASRA for SACCOs operating and with audited accounts in Kenya.
Only 83 SACCOs had audited financial statements for 5 consecutive years. The study
therefore focused on these 83 societies with audited financial statements. A census of
all the 83 SACCOs that had audited accounts and remained in existence since 2012-
2016 was done.
3.7 Data Collection Instruments
A questionnaire is a data collection tool that is used to record the data and it contains
a list of questions directed to particular respondents and a definite purpose which is to
meet a set objective as per the study or research. The questionnaire in this study was
divided into three parts. The first part asked questions in regard to the demographic
structure of the SACCO (there name of the SACCO, ownership category and duration
of operations). The second part focused on the independent variables and the third part
focused on dependent variable (See appendix I). The choice of questionnaires in the
collection of primary data was justified since they give respondents freedom to express
their views or opinions more objectively.
3.8 Data Collection Procedure
Kothari (2004) describe primary data as that which is raw and is collected for the first
time, and thus happen to be original. Louis, Lawrence and Morrison (2007) describes
primary data as those items that are original to the problem under study while Ember
and Ember (2009), describe primary data as data collected by the investigator in
various field sites explicitly for a comparative study.
The researcher received introductory letter from the University to facilitate the study.
The entry point to the SACCOs was through the finance departments. The
questionnaires were administered through drop and pick method to all Finance
Managers of deposit taking SACCOs. The researcher used research assistant to
distribute the questionnaires which were completed by the respondent. Before
commencing data collection, the research assistant was adequately trained to
understand the questionnaires in order to effectively collect data, thereafter the
56
researcher first booked appointment with all Financial Managers (respondents). Upon
completion, the questionnaires were collected by research assistant to ensure high
completion rate and return of the questionnaires.
A secondary data template was used to collect secondary data from published audited
accounts of the firms. Secondary data on capital adequacy, asset quality, management
efficiency, earnings ability and liquidity management and financial performance of
SACCOs was gathered (See appendix III). Coopers and Schindler (2008) postulates
that secondary data is a useful quantitative technique for evaluating historical or
contemporary, confidential or public records, reports, government documents and
opinions.
3.9 Pilot Testing
The study carried out a pilot test to test the validity and reliability of the questionnaires
in gathering the data required for the purposes of this research study. According to
Nieswiadomy (2008), approximately 10% of the population is recommended for pilot
study. The rule of the thumb suggests that 5 % to 10 % of the target sample should
constitute the pilot test (Cooper & Schindler, 2011; Creswell, 2003; Gall & Borg,
2007).
Therefore, the researcher used 10% of total population which was 8 deposits taking
SACCOs for the purpose of carrying out a pilot study. The pilot study was carried out
in 8 deposit taking SACCOs in Nakuru County before actual research so as to get an
indication of the expected responses with a view of identifying ambiguous and unclear
questions as well as detect possible weaknesses in the design and instrumentation as
suggested by Coopers and Schindler (2008).
According to Mugenda (2003), research instruments need to be valid and reliable in
order to produce useful results. The 8 SACCOs selected for pilot study were excluded
from the main study so as to avoid biasness.
3.9.1 Validity of the Research Instruments
Validity was accessed using content validity. Content validity was achieved through
piloting the questionnaires among 8 selected SACCOs as to establish the relevant and
57
representativeness of questionnaires as noted by (Eby, 1993). Reliability was tested
using the 8 questionnaires which were piloted and not included in the final study
sample. This avoided response bias in case they filled the same questionnaire twice.
Eight questionnaires were coded and input into Statistical Package for Social Sciences
[SPSS] for running the Cronbach reliability test.
3.9.2 Reliability of the Research Instruments
The reliability of the questionnaire was tested using the Cronbach’s alpha correlation
coefficient with the aid of Statistical Package for Social Sciences (SPSS) software. The
researcher employed Cronbach’s alpha coefficient statistical procedure to assess
reliability of measures as recommended by (Mugenda & Mugenda, 2003). As a rule of
thumb, reliability of 0.7 and above is recommended for research purposes to denote
research and instrument as reliable, (Robert et al., 2006). Cronbach’s alpha coefficient
is one of the most commonly used indicators of internal consistency.
3.10 Data Analysis and Presentation
Data Analysis is the processing of data to make meaningful information (Saunders,
Lewis & Thornbill, 2009). According to Zikmund et al (2010), data analysis is the
application of way of thinking to understand the raw data collected with the aim of
determining patterns and summarizing the relevant details revealed in the research
study. Data analysis is a process of inspecting, cleaning, transforming and modeling
data with the goal of discovering useful information, suggesting conclusions and
supporting decision making. According to Shamoo and Resnik, (2003), various
analytic procedures provided ways of drawing inductive inferences from data and
distinguishing the signal from the statistical fluctuations present in the data. To
determine the patterns revealed in the data collected in selected variables, data analysis
was guided by the objectives of the research study.
According to Hyndman (2008), data processing involves translating the answers on a
questionnaire into a form that can be manipulated to produce statistics. Data processing
involves data entry, coding, editing, and monitoring the whole data processing
procedure. The data collected was processed using Statistical Package for Social

58
Sciences (SPSS) and STATA software. The software was used to produce frequencies,
descriptive and inferential statistics which were used to derive generalizations and
conclusions regarding the population. The descriptive statistics used included
percentages, means and standard deviations while the inferential statistics included
Pearson correlation coefficient and regressions analysis. The data collected from
primary and secondary sources were used by the researcher to analyze effect of internal
factors on financial performance of savings and credit societies in Kenya. The findings
were presented using Tables and Figures.
Multiple linear regression models were used to measure the relationship between the
independent variables and the dependent variable which is explained in the model
below. The adopted model is similar to that used by many of the studies done in the
area of internal factors affecting financial performance, Kamau (2010); Kosiba (2012)
and Miriti (2014). In this research the following regression equation model was used
to test the statistical significance of the study hypotheses:
Y= βo + β1X1+ β2X2+ β3X3+ β4X4+ β5X5 +
Where:
Y= Financial performance
X1 = Capital adequacy
X2 = Asset quality
X3 = Management efficiency
X4= Earnings ability
X5= Liquidity
β0, β1, β2, β3, β4, β5 = Regression coefficients of changes included in Y by each X value
= Error term which is normally distributed with a mean and variance of zero.
The moderating variable in this research study was sensitivity to market risk. The
moderating effect of sensitivity to market risk was measured using standard deviation
of variance, testing for moderating was done following adopted model similar to that
used by Ongore and Kisa, 2013.
59
Y = βo + β1X1.M + β2X2.M + β3X3.M+ β4X4.M+ β5X5.M+ є
Where:
M = Moderator (Sensitivity to Market Risk)
X1.M = Capital adequacy * Sensitivity to Market Risk
X2.M = Asset quality * Sensitivity to Market Risk
X3.M = Management efficiency * Sensitivity to Market Risk
X4.M = Earnings ability * Sensitivity to Market Risk
X5.M = Liquidity * Sensitivity to Market Risk
= Error term which is normally distributed with a mean and variance of zero.
The equation above shows the moderating effect of sensitivity to market risk on the
internal factors on financial performance of SACCOs.
3.10.1 Diagnostic Tests
According to International Business Machines (IBM) (2010), the assumptions of linear
regression must be met by the data to be analyzed by the researcher. These assumptions
states that the coefficients must be linear in nature, the response errors should follow
a normal distribution and the errors should have a common distribution. Normality,
multicollinearity and heteroscedasticity diagnostic tests were carried out to ensure that
data suits the basic assumptions of classical linear regression model.
To test normality graphical representation of residues was used. The purpose of
normality test was to assess whether the sample was obtained from a normally
distributed population. Condition for normality is required for one to fit a linear
regression model and data that is not normally distributed consequently does not
qualify for linear regression analysis (Sekaran, 2003).
For multicollinearity test, Variance Inflation Factor (VIF) was used. The rule of thumb
is that a VIF for all the independent variables is less than 10 (VIF ≤ 10) indicate no
Multicollinearity. On the other hand, a VIF of more than 10 (VIF ≥ 10) indicates a
problem of Multicollinearity.
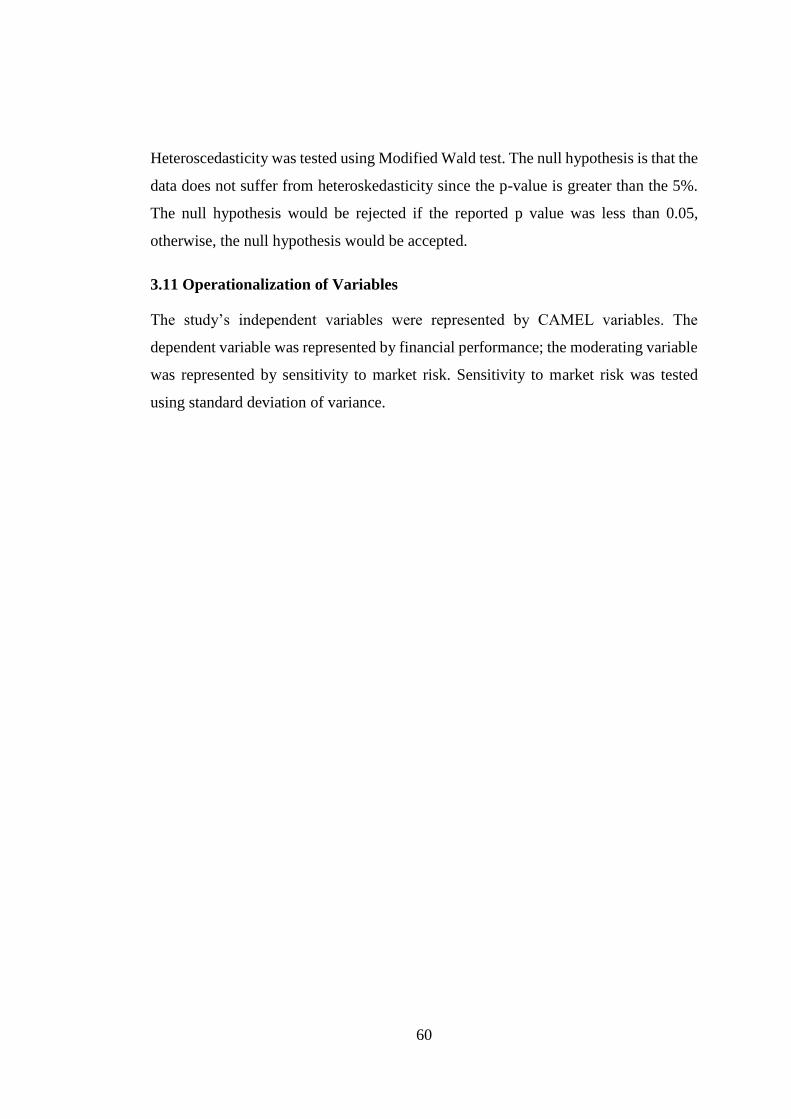
60
Heteroscedasticity was tested using Modified Wald test. The null hypothesis is that the
data does not suffer from heteroskedasticity since the p-value is greater than the 5%.
The null hypothesis would be rejected if the reported p value was less than 0.05,
otherwise, the null hypothesis would be accepted.
3.11 Operationalization of Variables
The study’s independent variables were represented by CAMEL variables. The
dependent variable was represented by financial performance; the moderating variable
was represented by sensitivity to market risk. Sensitivity to market risk was tested
using standard deviation of variance.
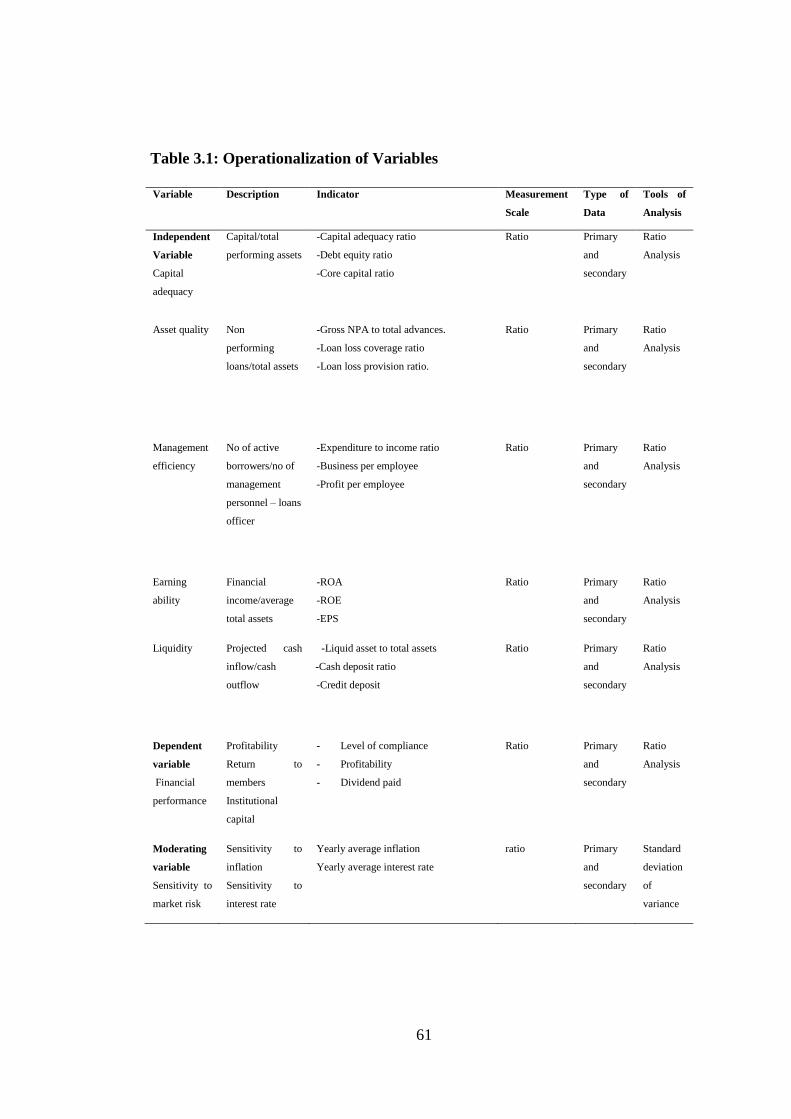
61
Table 3.1: Operationalization of Variables
Variable Description Indicator Measurement
Scale
Type of
Data
Tools of
Analysis
Independent
Variable
Capital
adequacy
Capital/total
performing assets
-Capital adequacy ratio
-Debt equity ratio
-Core capital ratio
Ratio Primary
and
secondary
Ratio
Analysis
Asset quality Non
performing
loans/total assets
-Gross NPA to total advances.
-Loan loss coverage ratio
-Loan loss provision ratio.
Ratio Primary
and
secondary
Ratio
Analysis
Management
efficiency
No of active
borrowers/no of
management
personnel – loans
officer
-Expenditure to income ratio
-Business per employee
-Profit per employee
Ratio Primary
and
secondary
Ratio
Analysis
Earning
ability
Financial
income/average
total assets
-ROA
-ROE
-EPS
Ratio Primary
and
secondary
Ratio
Analysis
Liquidity Projected cash
inflow/cash
outflow
-Liquid asset to total assets
-Cash deposit ratio
-Credit deposit
Ratio Primary
and
secondary
Ratio
Analysis
Dependent
variable
Financial
performance
Profitability
Return to
members
Institutional
capital
- Level of compliance
- Profitability
- Dividend paid
Ratio Primary
and
secondary
Ratio
Analysis
Moderating
variable
Sensitivity to
market risk
Sensitivity to
inflation
Sensitivity to
interest rate
Yearly average inflation
Yearly average interest rate
ratio Primary
and
secondary
Standard
deviation
of
variance
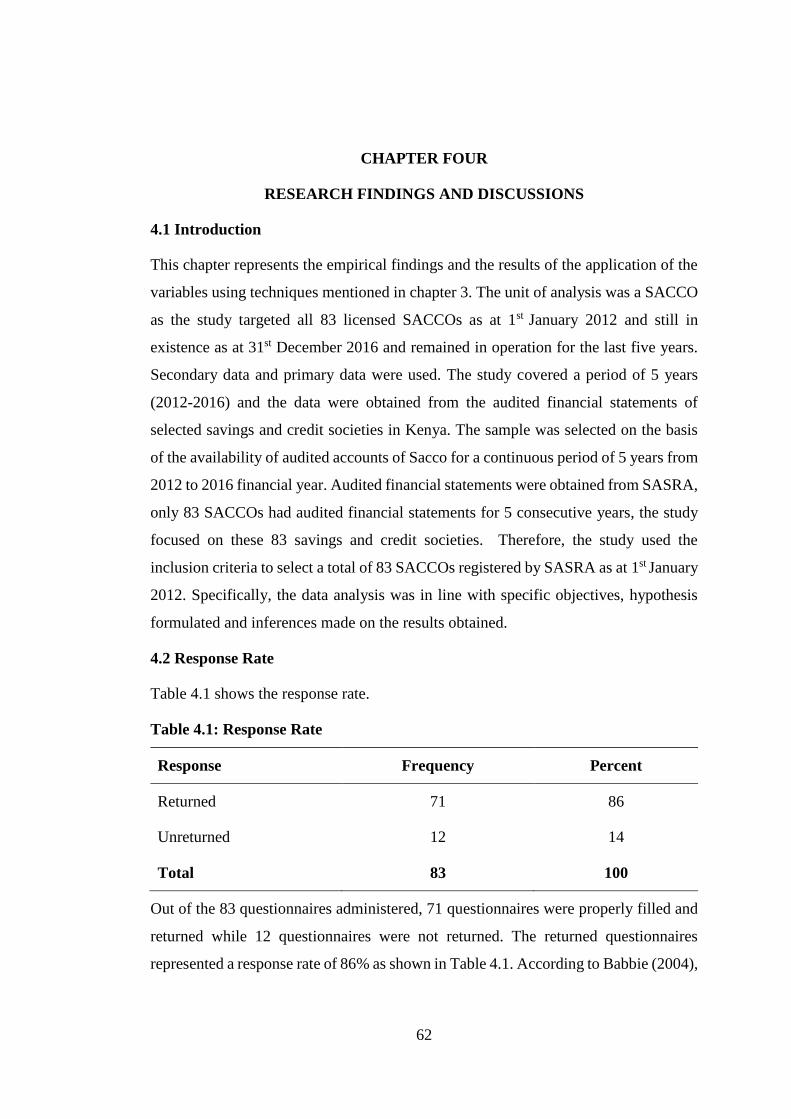
62
CHAPTER FOUR
RESEARCH FINDINGS AND DISCUSSIONS
4.1 Introduction
This chapter represents the empirical findings and the results of the application of the
variables using techniques mentioned in chapter 3. The unit of analysis was a SACCO
as the study targeted all 83 licensed SACCOs as at 1st January 2012 and still in
existence as at 31st December 2016 and remained in operation for the last five years.
Secondary data and primary data were used. The study covered a period of 5 years
(2012-2016) and the data were obtained from the audited financial statements of
selected savings and credit societies in Kenya. The sample was selected on the basis
of the availability of audited accounts of Sacco for a continuous period of 5 years from
2012 to 2016 financial year. Audited financial statements were obtained from SASRA,
only 83 SACCOs had audited financial statements for 5 consecutive years, the study
focused on these 83 savings and credit societies. Therefore, the study used the
inclusion criteria to select a total of 83 SACCOs registered by SASRA as at 1st January
2012. Specifically, the data analysis was in line with specific objectives, hypothesis
formulated and inferences made on the results obtained.
4.2 Response Rate
Table 4.1 shows the response rate.
Table 4.1: Response Rate
Response Frequency Percent
Returned 71 86
Unreturned 12 14
Total 83 100
Out of the 83 questionnaires administered, 71 questionnaires were properly filled and
returned while 12 questionnaires were not returned. The returned questionnaires
represented a response rate of 86% as shown in Table 4.1. According to Babbie (2004),
63
return rates of 50% are acceptable to analyze and publish, 60% is good and 70% is
very good. Based on Babbie’s assertion, 86% response rate was adequate for the study.
A similar argument is also supported by Hardigan, Popovici and Carvajal (2016). The
high response rate was as a result of the researcher contacting the respondents through
email and telephone calls before the exercise of data collection and requesting them to
complete the questionnaires.
4.3 Demographic Characteristics
This section analyzes the demographic characteristics of the respondents and presents
the descriptions of the respondents in terms of type of membership and period of
existence.
4.3.1 Type of Membership
Table 4.2 shows the respondents type of membership.
Table 4.2: Type of Membership
Response Frequency Percent
Government employees 8 11.3
General public 30 42.3
Business Men and Women 33 46.5
Total 71 100
The study sought to find out the membership of the respondents. Results presented in
Table 4.2 indicate that 47 % of the respondents were business men and women, 42 %
of the respondents were the general public while 11% of the respondents were
government employees. This implies that majority of the SACCOs members and
customers were business people and the general public and that most business people
relied on SACCOs for finances. This is likely to have a positive influence on SACCOs
financial performance.
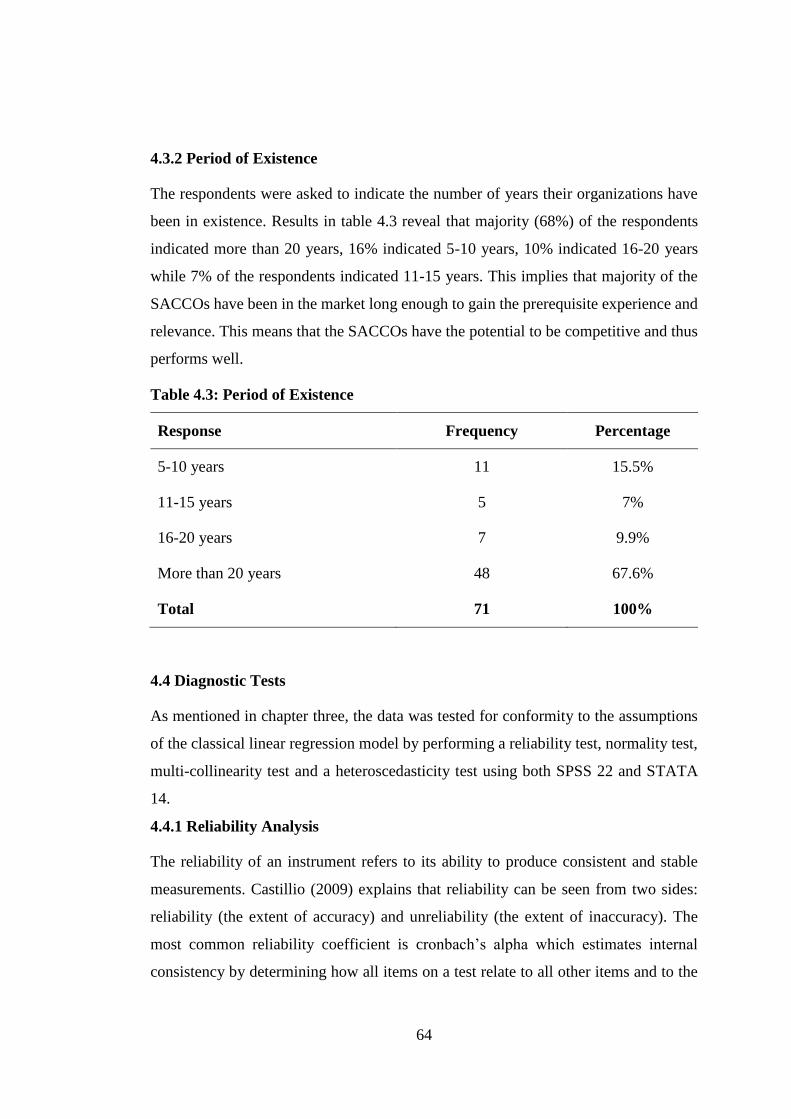
64
4.3.2 Period of Existence
The respondents were asked to indicate the number of years their organizations have
been in existence. Results in table 4.3 reveal that majority (68%) of the respondents
indicated more than 20 years, 16% indicated 5-10 years, 10% indicated 16-20 years
while 7% of the respondents indicated 11-15 years. This implies that majority of the
SACCOs have been in the market long enough to gain the prerequisite experience and
relevance. This means that the SACCOs have the potential to be competitive and thus
performs well.
Table 4.3: Period of Existence
Response Frequency Percentage
5-10 years 11 15.5%
11-15 years 5 7%
16-20 years 7 9.9%
More than 20 years 48 67.6%
Total 71 100%
4.4 Diagnostic Tests
As mentioned in chapter three, the data was tested for conformity to the assumptions
of the classical linear regression model by performing a reliability test, normality test,
multi-collinearity test and a heteroscedasticity test using both SPSS 22 and STATA
14.
4.4.1 Reliability Analysis
The reliability of an instrument refers to its ability to produce consistent and stable
measurements. Castillio (2009) explains that reliability can be seen from two sides:
reliability (the extent of accuracy) and unreliability (the extent of inaccuracy). The
most common reliability coefficient is cronbach’s alpha which estimates internal
consistency by determining how all items on a test relate to all other items and to the
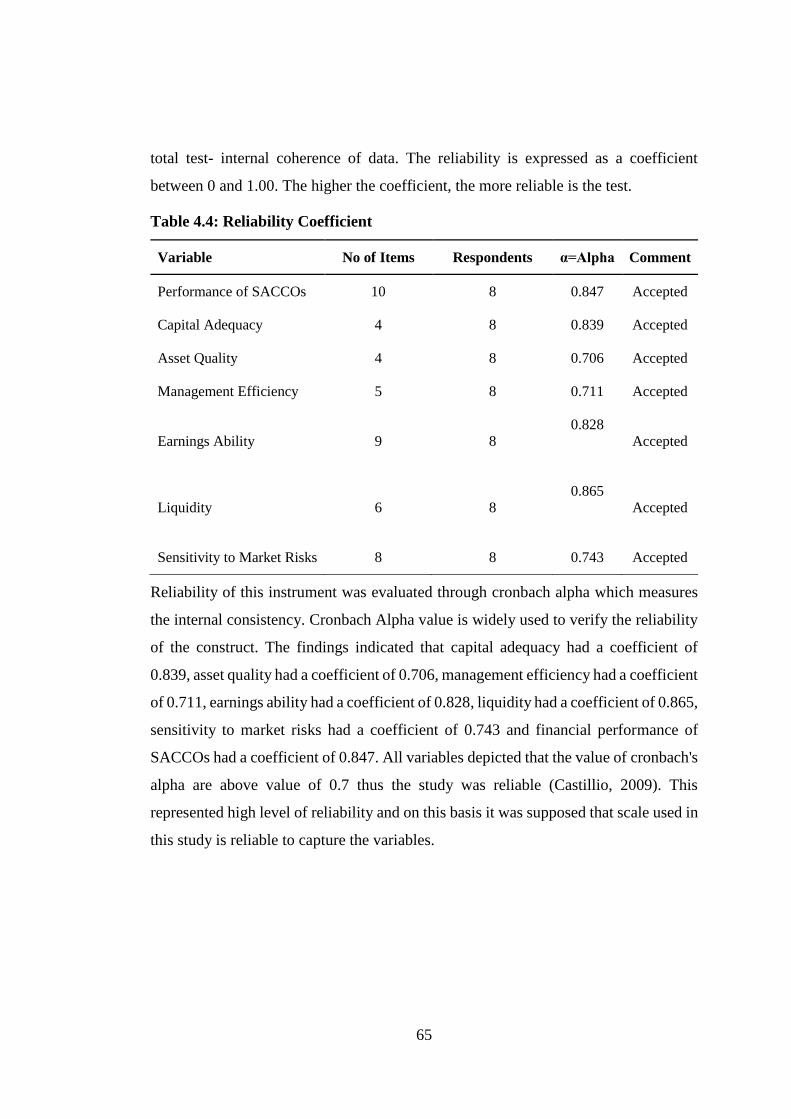
65
total test- internal coherence of data. The reliability is expressed as a coefficient
between 0 and 1.00. The higher the coefficient, the more reliable is the test.
Table 4.4: Reliability Coefficient
Variable No of Items Respondents α=Alpha Comment
Performance of SACCOs 10 8 0.847 Accepted
Capital Adequacy 4 8 0.839 Accepted
Asset Quality 4 8 0.706 Accepted
Management Efficiency 5 8 0.711 Accepted
Earnings Ability 9 8 0.828
Accepted
Liquidity 6 8 0.865
Accepted
Sensitivity to Market Risks 8 8 0.743 Accepted
Reliability of this instrument was evaluated through cronbach alpha which measures
the internal consistency. Cronbach Alpha value is widely used to verify the reliability
of the construct. The findings indicated that capital adequacy had a coefficient of
0.839, asset quality had a coefficient of 0.706, management efficiency had a coefficient
of 0.711, earnings ability had a coefficient of 0.828, liquidity had a coefficient of 0.865,
sensitivity to market risks had a coefficient of 0.743 and financial performance of
SACCOs had a coefficient of 0.847. All variables depicted that the value of cronbach's
alpha are above value of 0.7 thus the study was reliable (Castillio, 2009). This
represented high level of reliability and on this basis it was supposed that scale used in
this study is reliable to capture the variables.
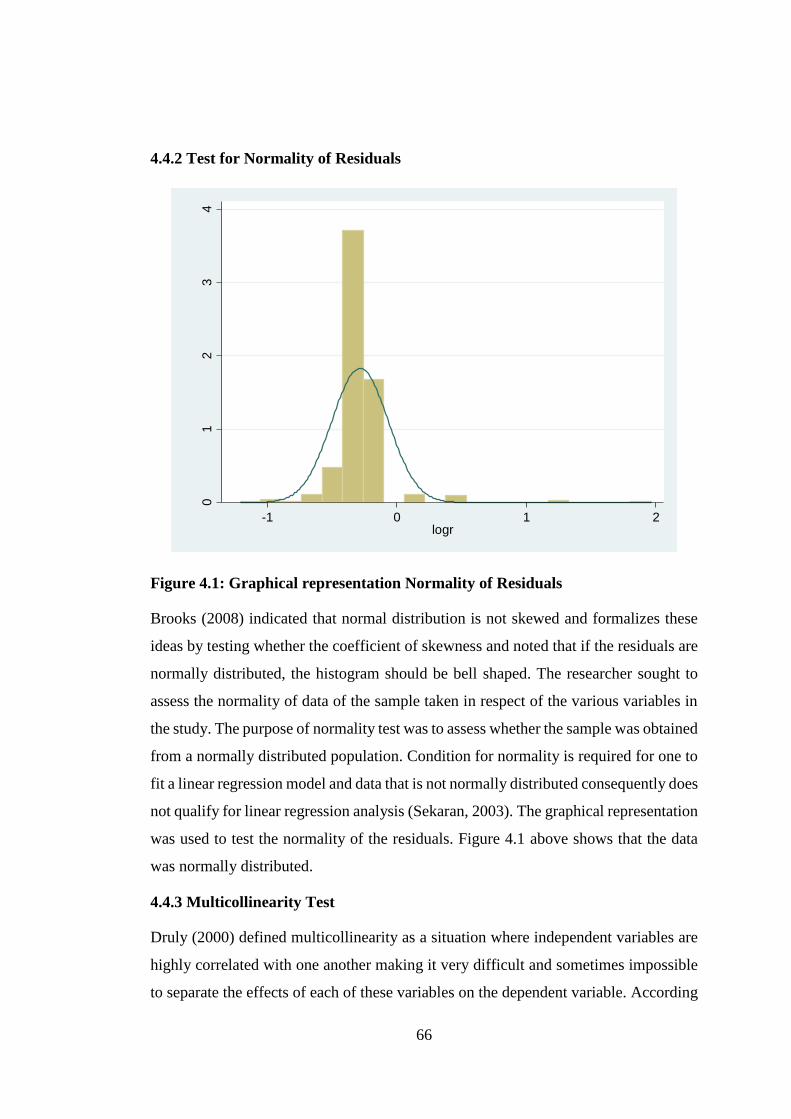
66
4.4.2 Test for Normality of Residuals
Figure 4.1: Graphical representation Normality of Residuals
Brooks (2008) indicated that normal distribution is not skewed and formalizes these
ideas by testing whether the coefficient of skewness and noted that if the residuals are
normally distributed, the histogram should be bell shaped. The researcher sought to
assess the normality of data of the sample taken in respect of the various variables in
the study. The purpose of normality test was to assess whether the sample was obtained
from a normally distributed population. Condition for normality is required for one to
fit a linear regression model and data that is not normally distributed consequently does
not qualify for linear regression analysis (Sekaran, 2003). The graphical representation
was used to test the normality of the residuals. Figure 4.1 above shows that the data
was normally distributed.
4.4.3 Multicollinearity Test
Druly (2000) defined multicollinearity as a situation where independent variables are
highly correlated with one another making it very difficult and sometimes impossible
to separate the effects of each of these variables on the dependent variable. According
01
23
4
Den
sity
-1 0 1 2logr
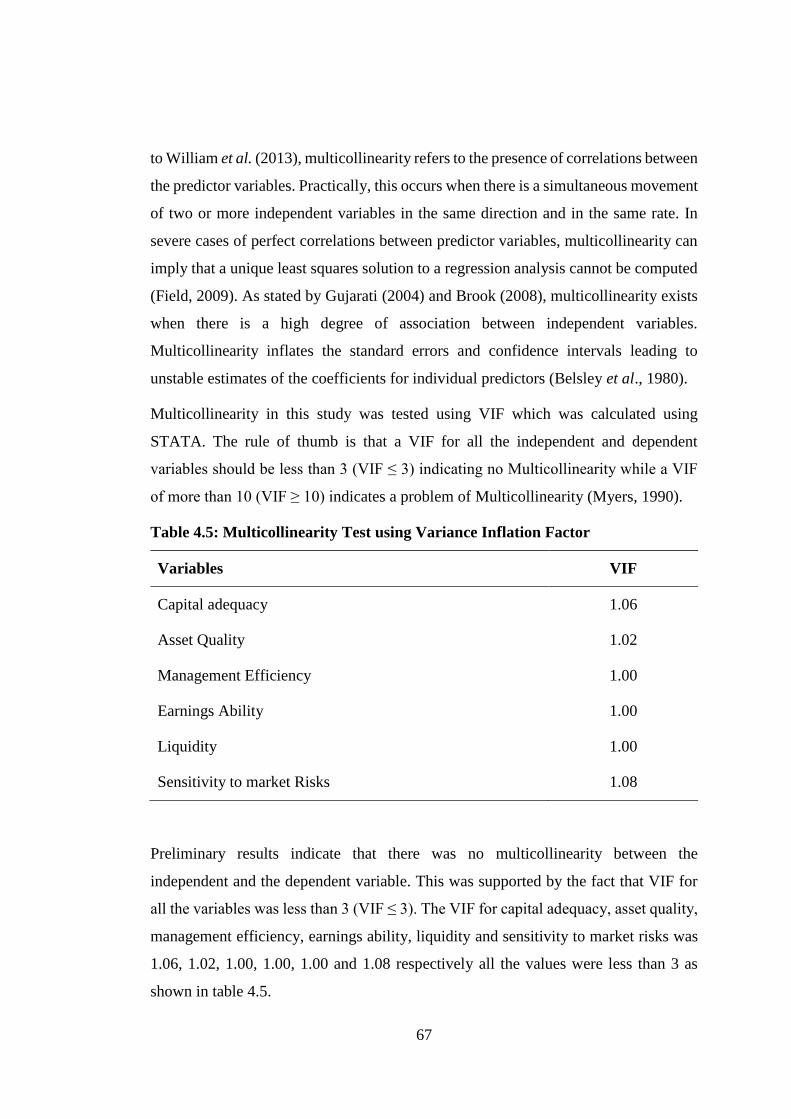
67
to William et al. (2013), multicollinearity refers to the presence of correlations between
the predictor variables. Practically, this occurs when there is a simultaneous movement
of two or more independent variables in the same direction and in the same rate. In
severe cases of perfect correlations between predictor variables, multicollinearity can
imply that a unique least squares solution to a regression analysis cannot be computed
(Field, 2009). As stated by Gujarati (2004) and Brook (2008), multicollinearity exists
when there is a high degree of association between independent variables.
Multicollinearity inflates the standard errors and confidence intervals leading to
unstable estimates of the coefficients for individual predictors (Belsley et al., 1980).
Multicollinearity in this study was tested using VIF which was calculated using
STATA. The rule of thumb is that a VIF for all the independent and dependent
variables should be less than 3 (VIF ≤ 3) indicating no Multicollinearity while a VIF
of more than 10 (VIF ≥ 10) indicates a problem of Multicollinearity (Myers, 1990).
Table 4.5: Multicollinearity Test using Variance Inflation Factor
Variables VIF
Capital adequacy 1.06
Asset Quality 1.02
Management Efficiency 1.00
Earnings Ability 1.00
Liquidity 1.00
Sensitivity to market Risks 1.08
Preliminary results indicate that there was no multicollinearity between the
independent and the dependent variable. This was supported by the fact that VIF for
all the variables was less than 3 (VIF ≤ 3). The VIF for capital adequacy, asset quality,
management efficiency, earnings ability, liquidity and sensitivity to market risks was
1.06, 1.02, 1.00, 1.00, 1.00 and 1.08 respectively all the values were less than 3 as
shown in table 4.5.
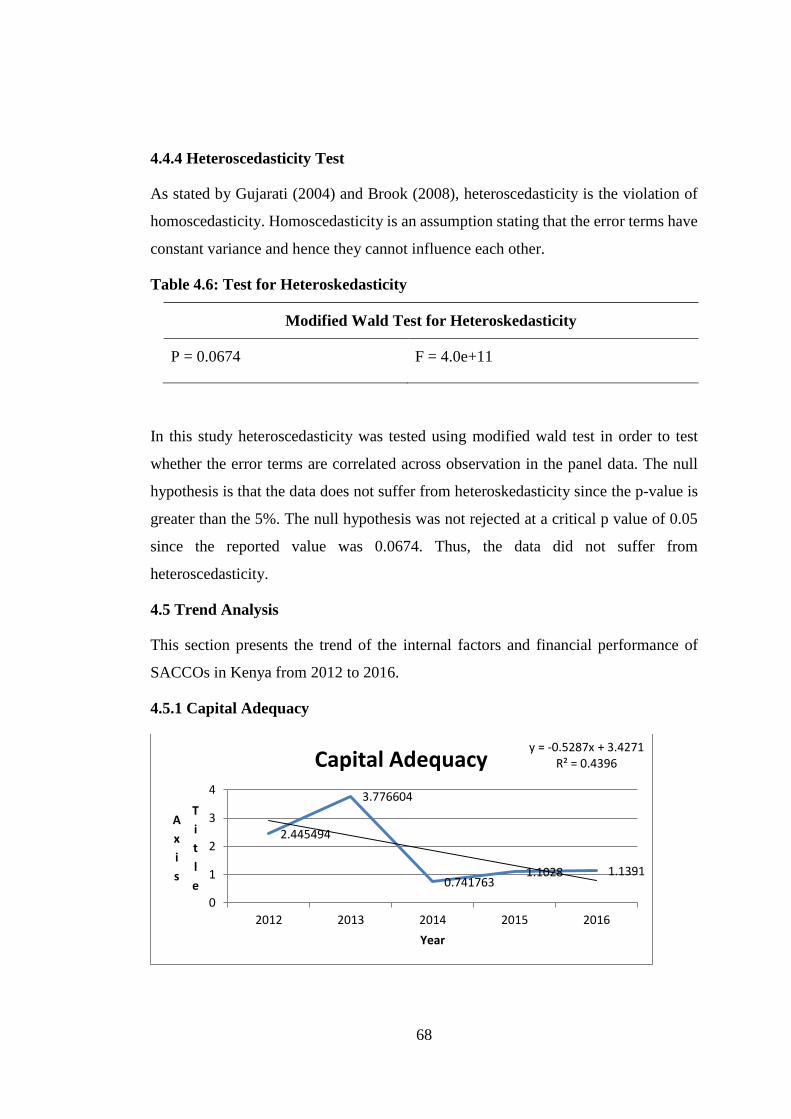
68
4.4.4 Heteroscedasticity Test
As stated by Gujarati (2004) and Brook (2008), heteroscedasticity is the violation of
homoscedasticity. Homoscedasticity is an assumption stating that the error terms have
constant variance and hence they cannot influence each other.
Table 4.6: Test for Heteroskedasticity
Modified Wald Test for Heteroskedasticity
P = 0.0674 F = 4.0e+11
In this study heteroscedasticity was tested using modified wald test in order to test
whether the error terms are correlated across observation in the panel data. The null
hypothesis is that the data does not suffer from heteroskedasticity since the p-value is
greater than the 5%. The null hypothesis was not rejected at a critical p value of 0.05
since the reported value was 0.0674. Thus, the data did not suffer from
heteroscedasticity.
4.5 Trend Analysis
This section presents the trend of the internal factors and financial performance of
SACCOs in Kenya from 2012 to 2016.
4.5.1 Capital Adequacy
2.445494
3.776604
0.7417631.1028 1.1391
y = -0.5287x + 3.4271R² = 0.4396
0
1
2
3
4
2012 2013 2014 2015 2016
A
x
i
s
T
i
t
l
e
Year
Capital Adequacy
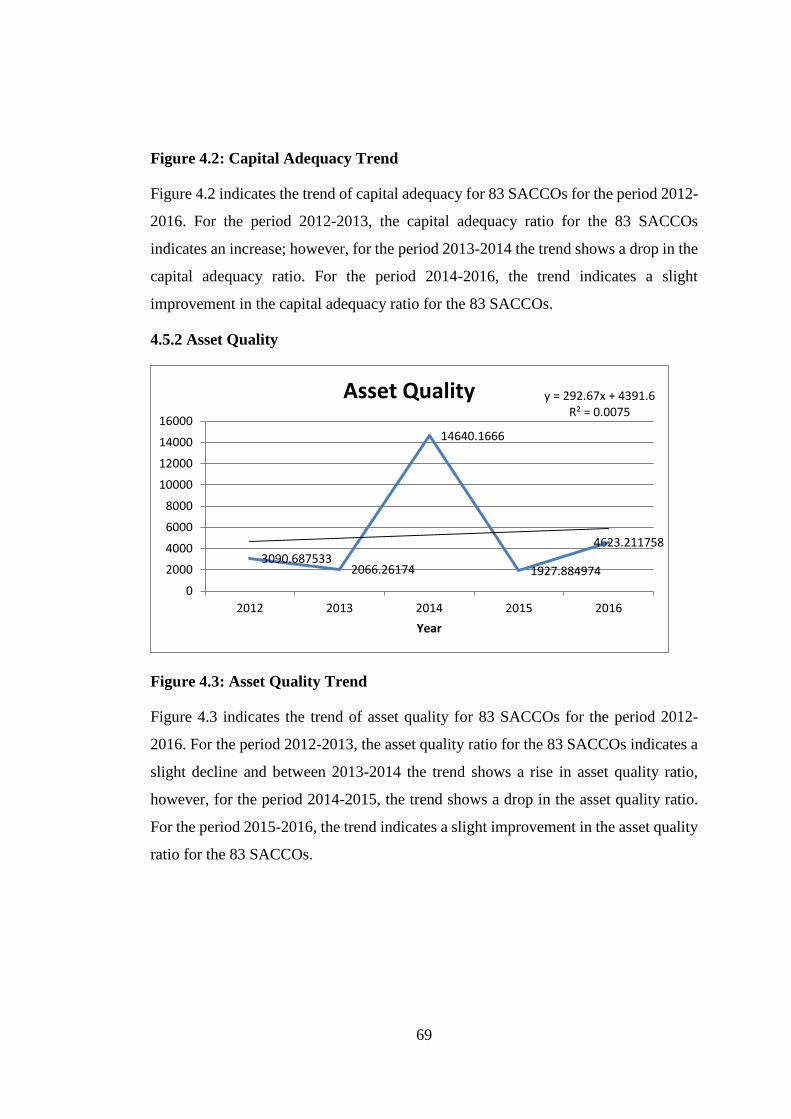
69
Figure 4.2: Capital Adequacy Trend
Figure 4.2 indicates the trend of capital adequacy for 83 SACCOs for the period 2012-
2016. For the period 2012-2013, the capital adequacy ratio for the 83 SACCOs
indicates an increase; however, for the period 2013-2014 the trend shows a drop in the
capital adequacy ratio. For the period 2014-2016, the trend indicates a slight
improvement in the capital adequacy ratio for the 83 SACCOs.
4.5.2 Asset Quality
Figure 4.3: Asset Quality Trend
Figure 4.3 indicates the trend of asset quality for 83 SACCOs for the period 2012-
2016. For the period 2012-2013, the asset quality ratio for the 83 SACCOs indicates a
slight decline and between 2013-2014 the trend shows a rise in asset quality ratio,
however, for the period 2014-2015, the trend shows a drop in the asset quality ratio.
For the period 2015-2016, the trend indicates a slight improvement in the asset quality
ratio for the 83 SACCOs.
3090.6875332066.26174
14640.1666
1927.884974
4623.211758
y = 292.67x + 4391.6R² = 0.0075
0
2000
4000
6000
8000
10000
12000
14000
16000
2012 2013 2014 2015 2016
Year
Asset Quality
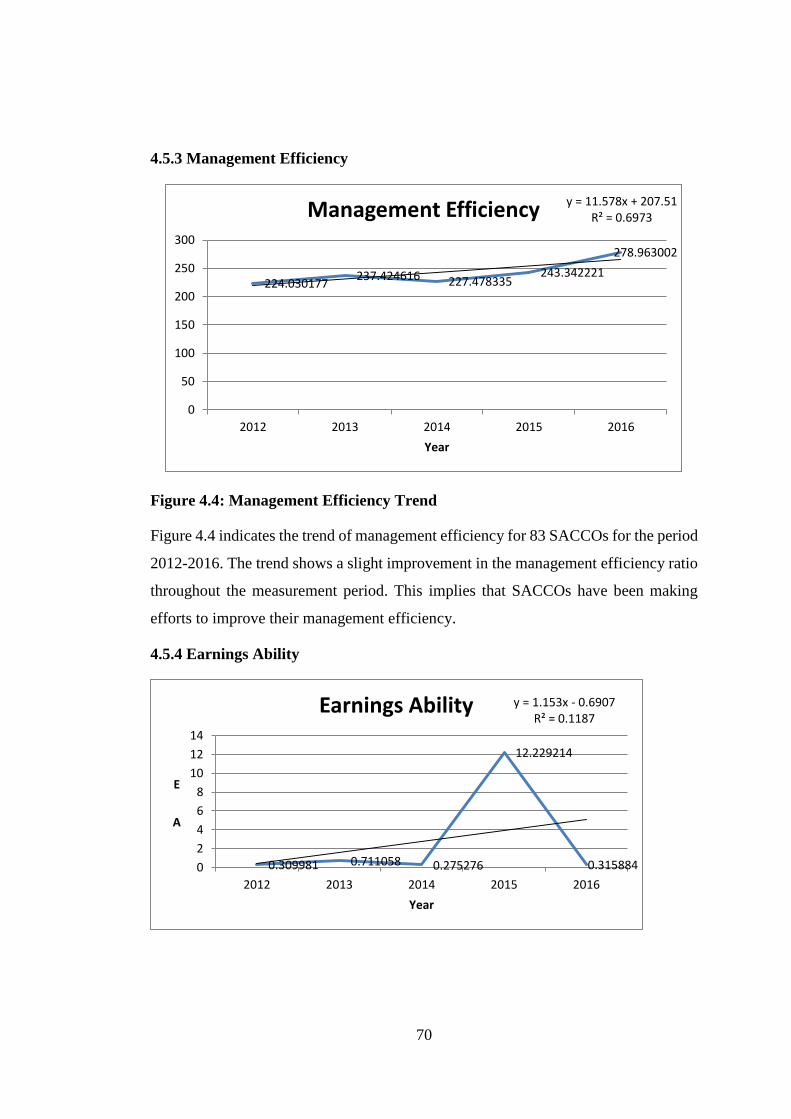
70
4.5.3 Management Efficiency
Figure 4.4: Management Efficiency Trend
Figure 4.4 indicates the trend of management efficiency for 83 SACCOs for the period
2012-2016. The trend shows a slight improvement in the management efficiency ratio
throughout the measurement period. This implies that SACCOs have been making
efforts to improve their management efficiency.
4.5.4 Earnings Ability
224.030177237.424616 227.478335
243.342221
278.963002
y = 11.578x + 207.51R² = 0.6973
0
50
100
150
200
250
300
2012 2013 2014 2015 2016
Year
Management Efficiency
0.309981 0.711058 0.275276
12.229214
0.315884
y = 1.153x - 0.6907R² = 0.1187
0
2
4
6
8
10
12
14
2012 2013 2014 2015 2016
E
A
Year
Earnings Ability
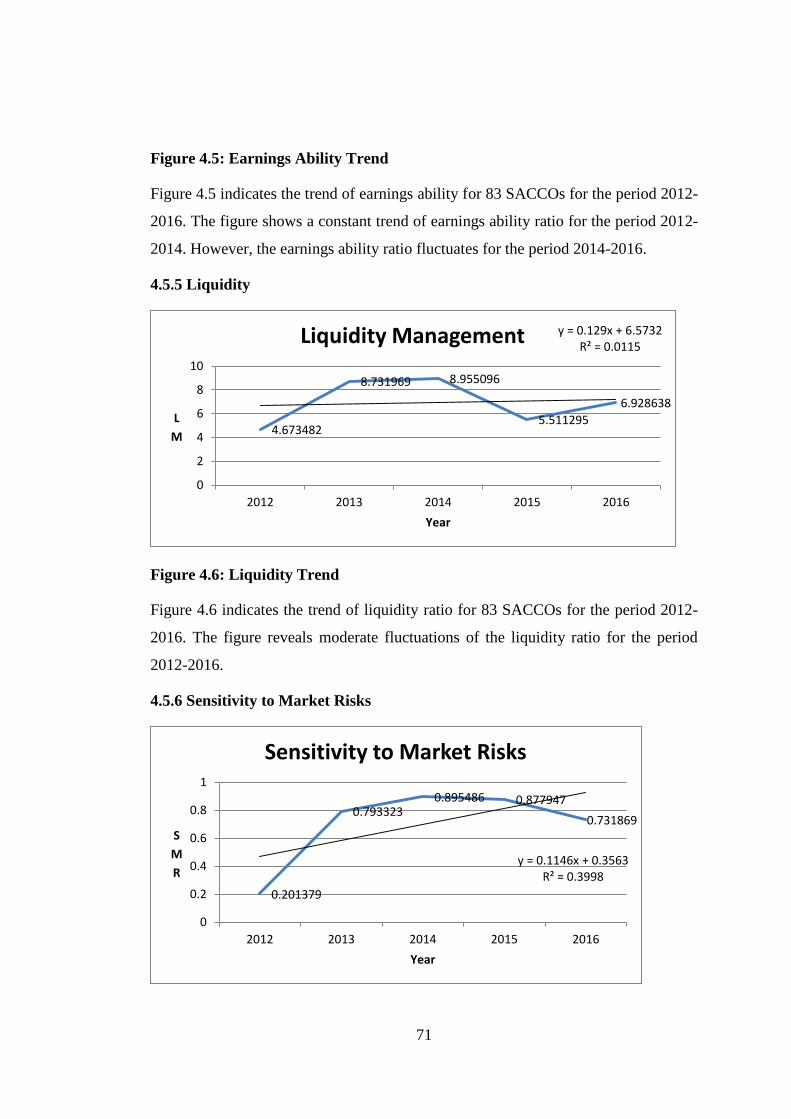
71
Figure 4.5: Earnings Ability Trend
Figure 4.5 indicates the trend of earnings ability for 83 SACCOs for the period 2012-
2016. The figure shows a constant trend of earnings ability ratio for the period 2012-
2014. However, the earnings ability ratio fluctuates for the period 2014-2016.
4.5.5 Liquidity
Figure 4.6: Liquidity Trend
Figure 4.6 indicates the trend of liquidity ratio for 83 SACCOs for the period 2012-
2016. The figure reveals moderate fluctuations of the liquidity ratio for the period
2012-2016.
4.5.6 Sensitivity to Market Risks
4.673482
8.731969 8.955096
5.511295
6.928638
y = 0.129x + 6.5732R² = 0.0115
0
2
4
6
8
10
2012 2013 2014 2015 2016
L
M
Year
Liquidity Management
0.201379
0.7933230.895486 0.877947
0.731869
y = 0.1146x + 0.3563R² = 0.3998
0
0.2
0.4
0.6
0.8
1
2012 2013 2014 2015 2016
S
M
R
Year
Sensitivity to Market Risks
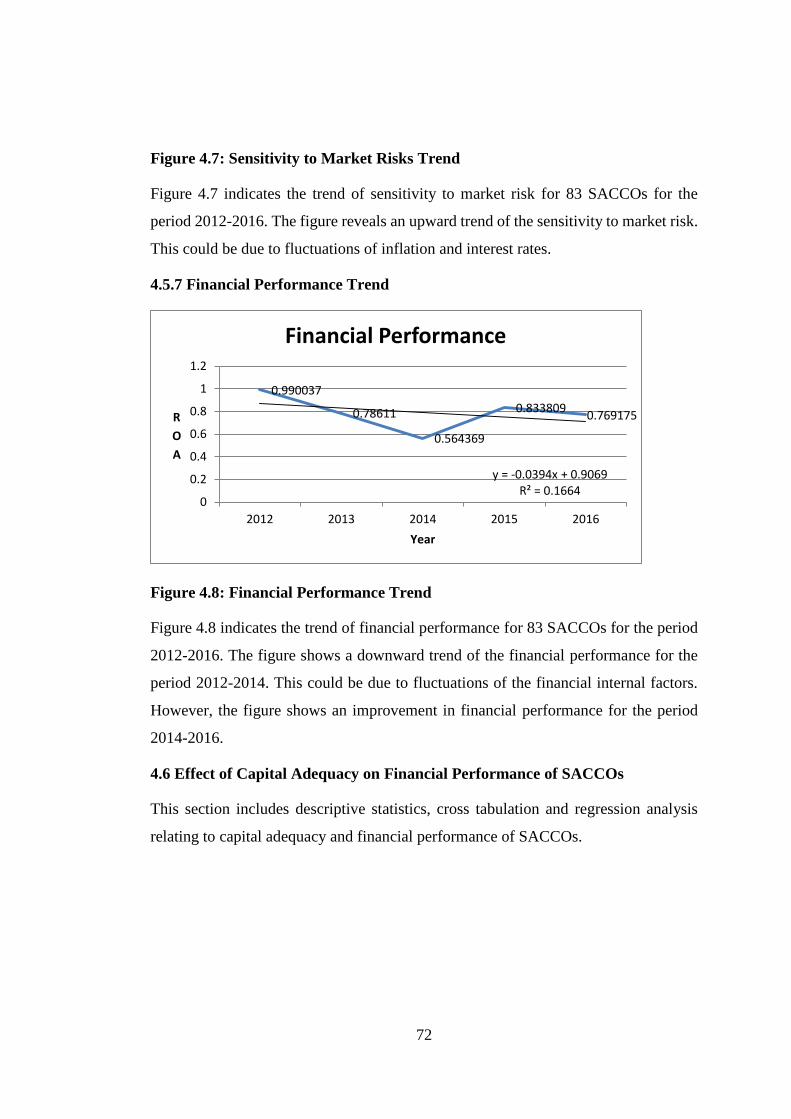
72
Figure 4.7: Sensitivity to Market Risks Trend
Figure 4.7 indicates the trend of sensitivity to market risk for 83 SACCOs for the
period 2012-2016. The figure reveals an upward trend of the sensitivity to market risk.
This could be due to fluctuations of inflation and interest rates.
4.5.7 Financial Performance Trend
Figure 4.8: Financial Performance Trend
Figure 4.8 indicates the trend of financial performance for 83 SACCOs for the period
2012-2016. The figure shows a downward trend of the financial performance for the
period 2012-2014. This could be due to fluctuations of the financial internal factors.
However, the figure shows an improvement in financial performance for the period
2014-2016.
4.6 Effect of Capital Adequacy on Financial Performance of SACCOs
This section includes descriptive statistics, cross tabulation and regression analysis
relating to capital adequacy and financial performance of SACCOs.
0.990037
0.78611
0.564369
0.8338090.769175
y = -0.0394x + 0.9069R² = 0.1664
0
0.2
0.4
0.6
0.8
1
1.2
2012 2013 2014 2015 2016
R
O
A
Year
Financial Performance
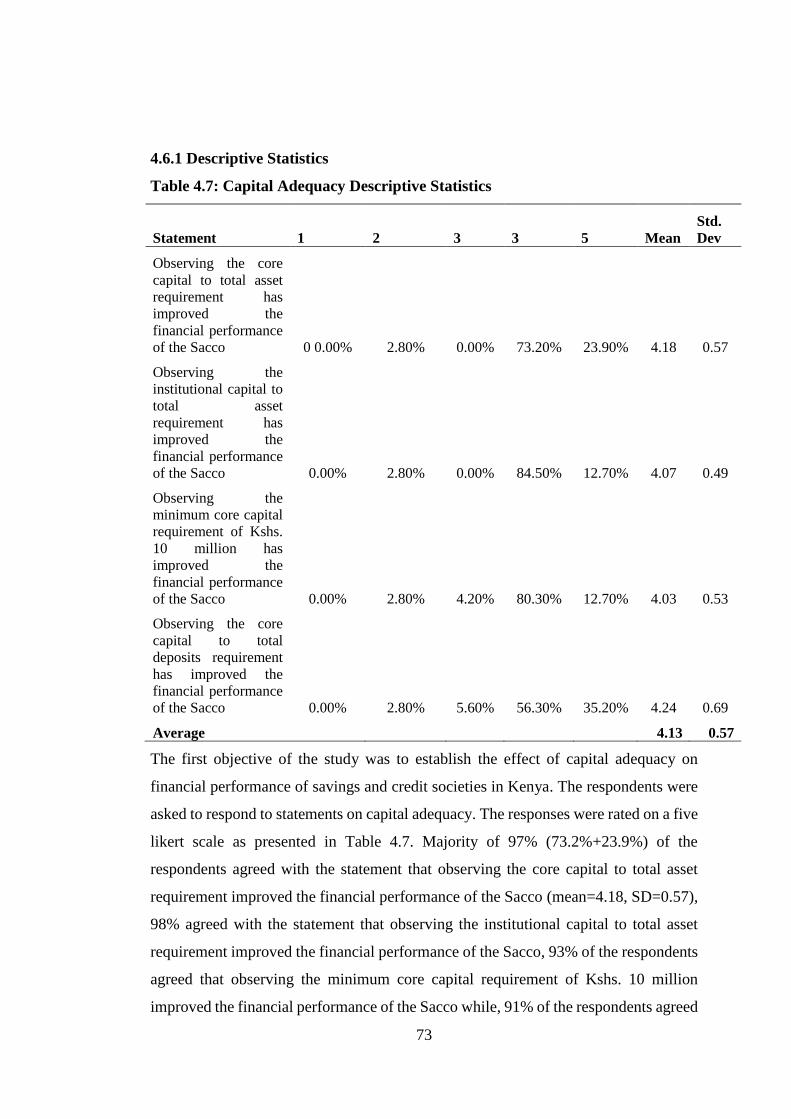
73
4.6.1 Descriptive Statistics
Table 4.7: Capital Adequacy Descriptive Statistics
Statement 1 2 3 3 5 Mean
Std.
Dev
Observing the core
capital to total asset
requirement has
improved the
financial performance
of the Sacco 0 0.00%
2.80%
0.00%
73.20% 23.90% 4.18 0.57
Observing the
institutional capital to
total asset
requirement has
improved the
financial performance
of the Sacco 0.00% 2.80% 0.00% 84.50% 12.70% 4.07 0.49
Observing the
minimum core capital
requirement of Kshs.
10 million has
improved the
financial performance
of the Sacco 0.00% 2.80% 4.20% 80.30% 12.70% 4.03 0.53
Observing the core
capital to total
deposits requirement
has improved the
financial performance
of the Sacco 0.00% 2.80% 5.60% 56.30% 35.20% 4.24 0.69
Average 4.13 0.57
The first objective of the study was to establish the effect of capital adequacy on
financial performance of savings and credit societies in Kenya. The respondents were
asked to respond to statements on capital adequacy. The responses were rated on a five
likert scale as presented in Table 4.7. Majority of 97% (73.2%+23.9%) of the
respondents agreed with the statement that observing the core capital to total asset
requirement improved the financial performance of the Sacco (mean=4.18, SD=0.57),
98% agreed with the statement that observing the institutional capital to total asset
requirement improved the financial performance of the Sacco, 93% of the respondents
agreed that observing the minimum core capital requirement of Kshs. 10 million
improved the financial performance of the Sacco while, 91% of the respondents agreed
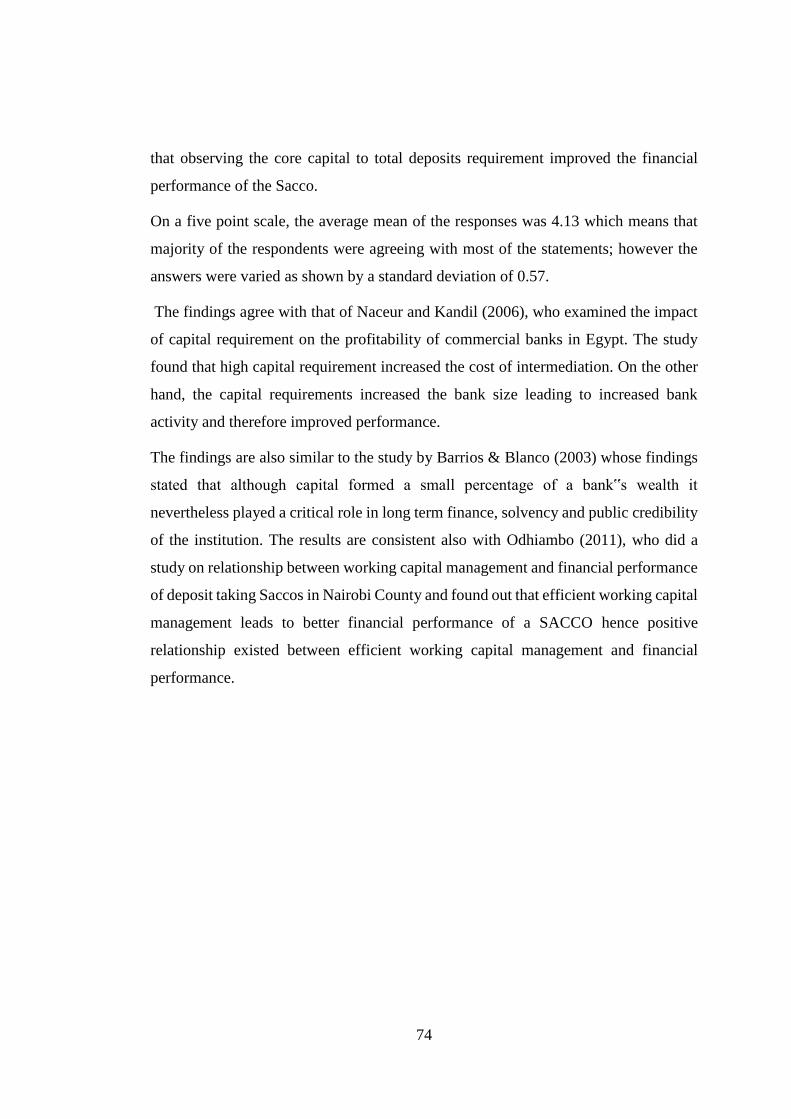
74
that observing the core capital to total deposits requirement improved the financial
performance of the Sacco.
On a five point scale, the average mean of the responses was 4.13 which means that
majority of the respondents were agreeing with most of the statements; however the
answers were varied as shown by a standard deviation of 0.57.
The findings agree with that of Naceur and Kandil (2006), who examined the impact
of capital requirement on the profitability of commercial banks in Egypt. The study
found that high capital requirement increased the cost of intermediation. On the other
hand, the capital requirements increased the bank size leading to increased bank
activity and therefore improved performance.
The findings are also similar to the study by Barrios & Blanco (2003) whose findings
stated that although capital formed a small percentage of a bank‟s wealth it
nevertheless played a critical role in long term finance, solvency and public credibility
of the institution. The results are consistent also with Odhiambo (2011), who did a
study on relationship between working capital management and financial performance
of deposit taking Saccos in Nairobi County and found out that efficient working capital
management leads to better financial performance of a SACCO hence positive
relationship existed between efficient working capital management and financial
performance.
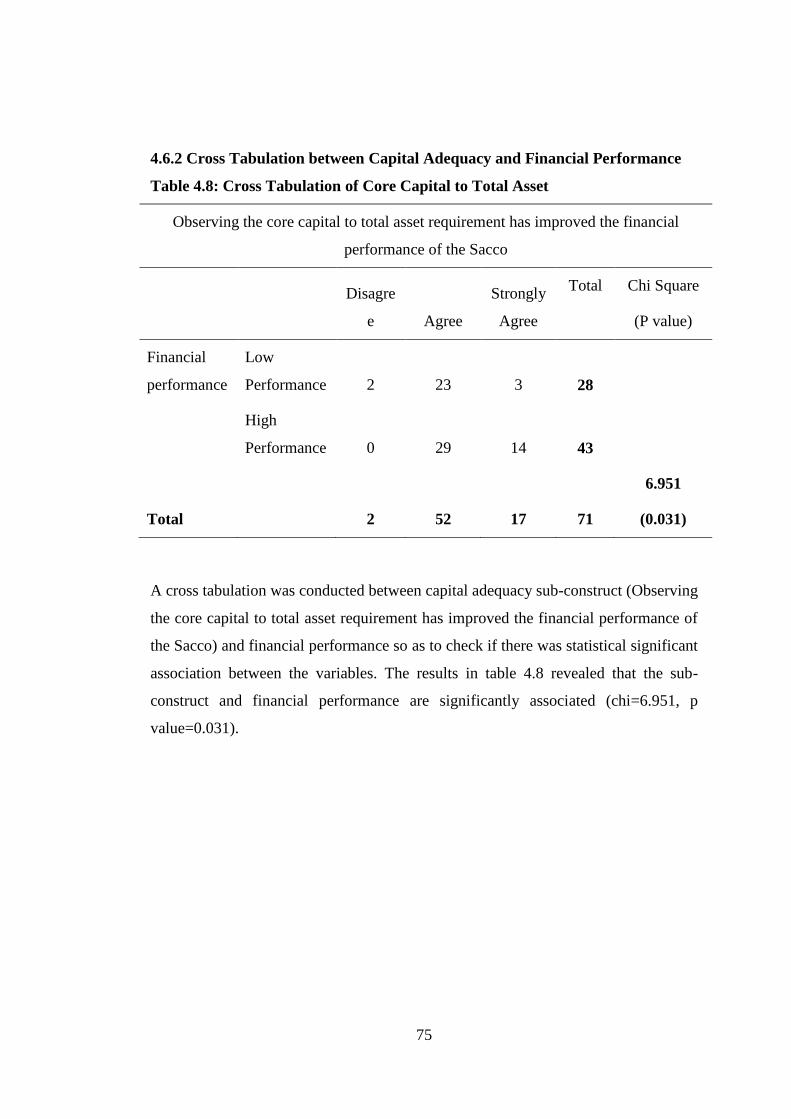
75
4.6.2 Cross Tabulation between Capital Adequacy and Financial Performance
Table 4.8: Cross Tabulation of Core Capital to Total Asset
Observing the core capital to total asset requirement has improved the financial
performance of the Sacco
Disagre
e Agree
Strongly
Agree
Total Chi Square
(P value)
Financial
performance
Low
Performance 2 23 3 28
High
Performance 0 29 14 43
Total 2 52 17 71
6.951
(0.031)
A cross tabulation was conducted between capital adequacy sub-construct (Observing
the core capital to total asset requirement has improved the financial performance of
the Sacco) and financial performance so as to check if there was statistical significant
association between the variables. The results in table 4.8 revealed that the sub-
construct and financial performance are significantly associated (chi=6.951, p
value=0.031).
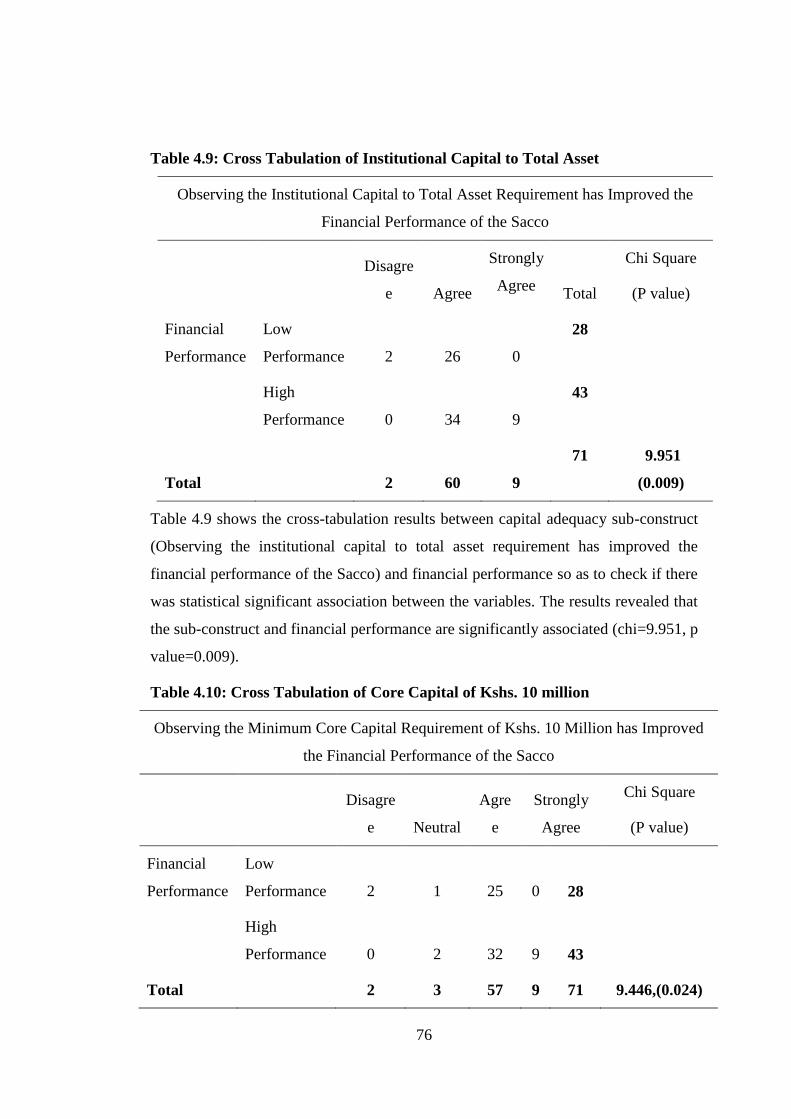
76
Table 4.9: Cross Tabulation of Institutional Capital to Total Asset
Observing the Institutional Capital to Total Asset Requirement has Improved the
Financial Performance of the Sacco
Disagre
e Agree
Strongly
Agree Total
Chi Square
(P value)
Financial
Performance
Low
Performance 2 26 0
28
High
Performance 0 34 9
43
Total 2 60 9
71 9.951
(0.009)
Table 4.9 shows the cross-tabulation results between capital adequacy sub-construct
(Observing the institutional capital to total asset requirement has improved the
financial performance of the Sacco) and financial performance so as to check if there
was statistical significant association between the variables. The results revealed that
the sub-construct and financial performance are significantly associated (chi=9.951, p
value=0.009).
Table 4.10: Cross Tabulation of Core Capital of Kshs. 10 million
Observing the Minimum Core Capital Requirement of Kshs. 10 Million has Improved
the Financial Performance of the Sacco
Disagre
e Neutral
Agre
e
Strongly
Agree
Chi Square
(P value)
Financial
Performance
Low
Performance 2 1 25 0 28
High
Performance 0 2 32 9 43
Total 2 3 57 9 71 9.446,(0.024)
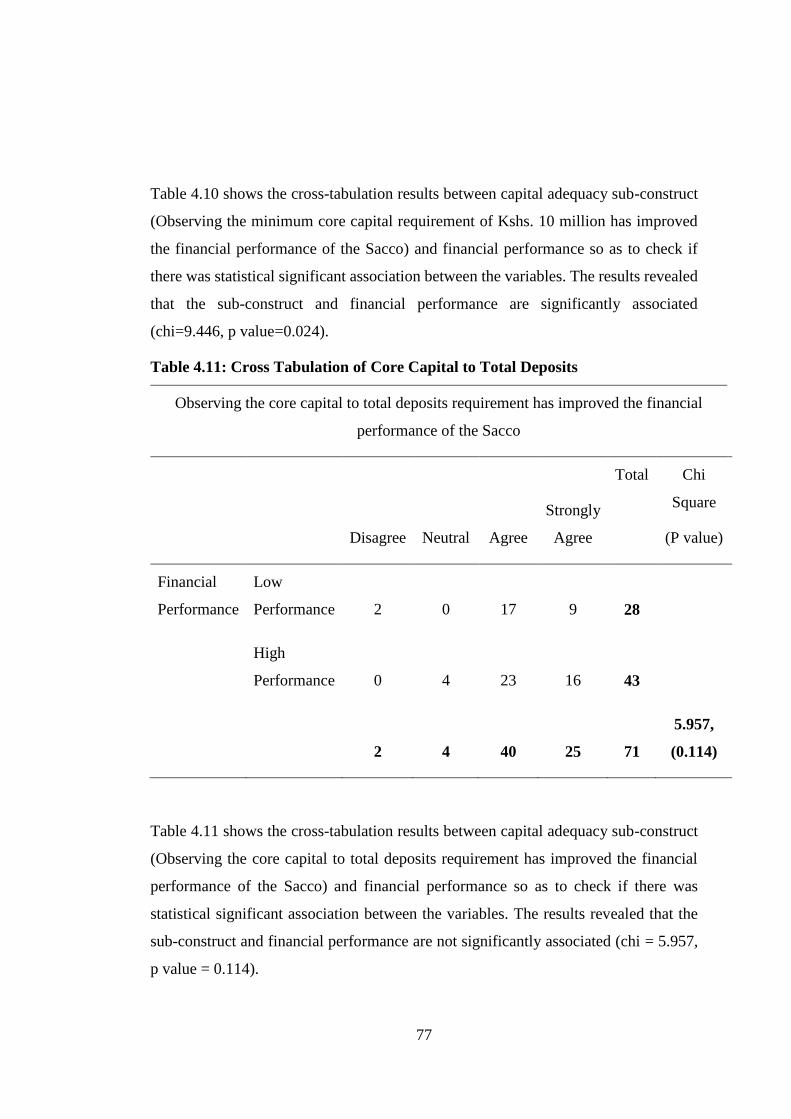
77
Table 4.10 shows the cross-tabulation results between capital adequacy sub-construct
(Observing the minimum core capital requirement of Kshs. 10 million has improved
the financial performance of the Sacco) and financial performance so as to check if
there was statistical significant association between the variables. The results revealed
that the sub-construct and financial performance are significantly associated
(chi=9.446, p value=0.024).
Table 4.11: Cross Tabulation of Core Capital to Total Deposits
Observing the core capital to total deposits requirement has improved the financial
performance of the Sacco
Disagree Neutral Agree
Strongly
Agree
Total Chi
Square
(P value)
Financial
Performance
Low
Performance 2 0 17 9 28
High
Performance 0 4 23 16 43
2 4 40 25 71
5.957,
(0.114)
Table 4.11 shows the cross-tabulation results between capital adequacy sub-construct
(Observing the core capital to total deposits requirement has improved the financial
performance of the Sacco) and financial performance so as to check if there was
statistical significant association between the variables. The results revealed that the
sub-construct and financial performance are not significantly associated (chi = 5.957,
p value = 0.114).
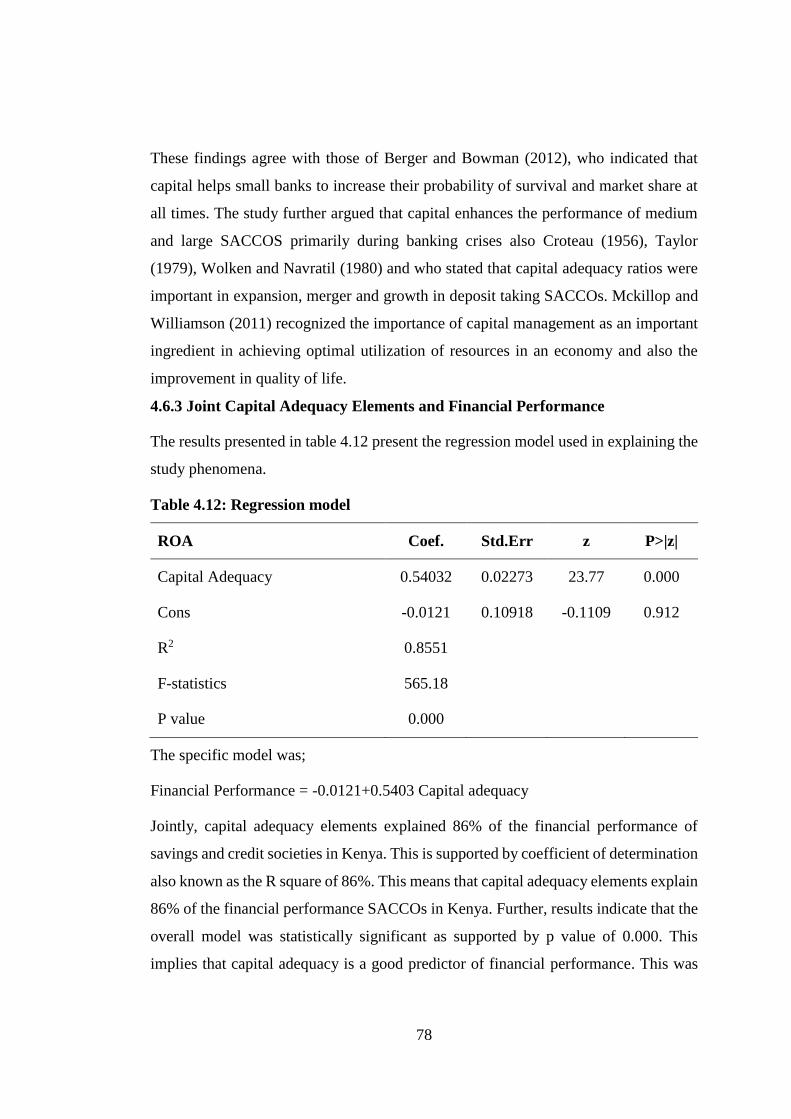
78
These findings agree with those of Berger and Bowman (2012), who indicated that
capital helps small banks to increase their probability of survival and market share at
all times. The study further argued that capital enhances the performance of medium
and large SACCOS primarily during banking crises also Croteau (1956), Taylor
(1979), Wolken and Navratil (1980) and who stated that capital adequacy ratios were
important in expansion, merger and growth in deposit taking SACCOs. Mckillop and
Williamson (2011) recognized the importance of capital management as an important
ingredient in achieving optimal utilization of resources in an economy and also the
improvement in quality of life.
4.6.3 Joint Capital Adequacy Elements and Financial Performance
The results presented in table 4.12 present the regression model used in explaining the
study phenomena.
Table 4.12: Regression model
ROA Coef. Std.Err z P>|z|
Capital Adequacy 0.54032 0.02273 23.77 0.000
Cons -0.0121 0.10918 -0.1109 0.912
R2 0.8551
F-statistics 565.18
P value 0.000
The specific model was;
Financial Performance = -0.0121+0.5403 Capital adequacy
Jointly, capital adequacy elements explained 86% of the financial performance of
savings and credit societies in Kenya. This is supported by coefficient of determination
also known as the R square of 86%. This means that capital adequacy elements explain
86% of the financial performance SACCOs in Kenya. Further, results indicate that the
overall model was statistically significant as supported by p value of 0.000. This
implies that capital adequacy is a good predictor of financial performance. This was
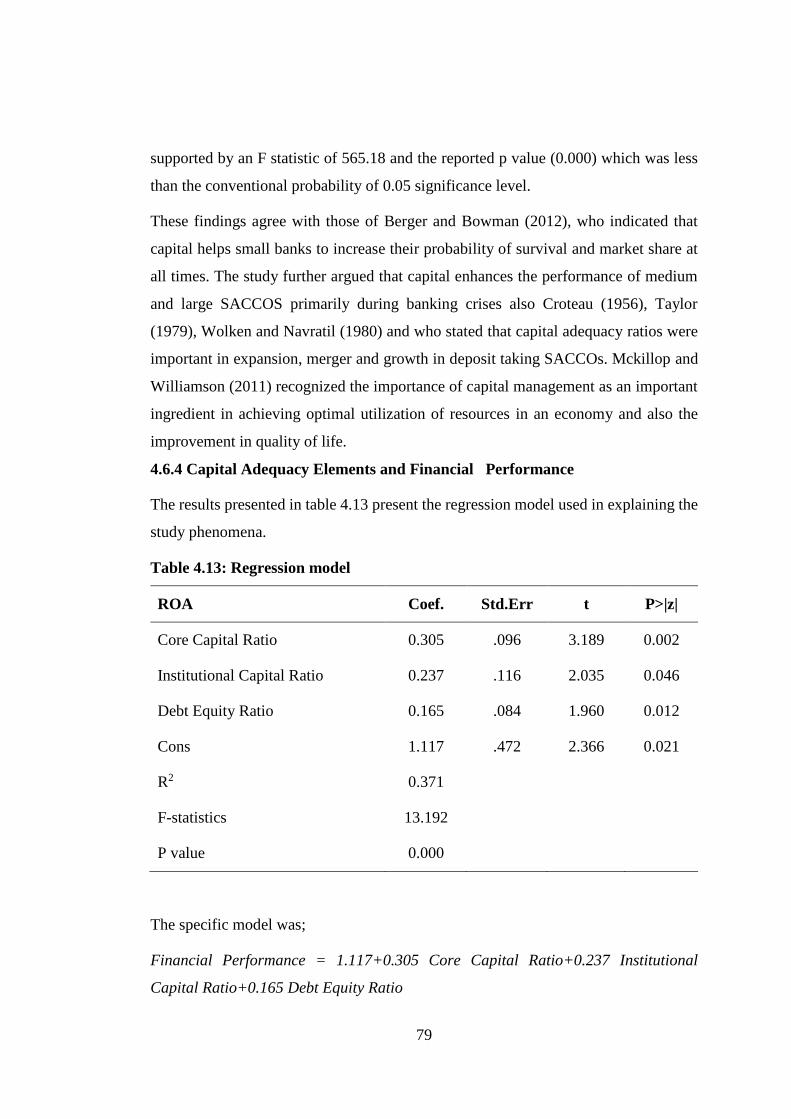
79
supported by an F statistic of 565.18 and the reported p value (0.000) which was less
than the conventional probability of 0.05 significance level.
These findings agree with those of Berger and Bowman (2012), who indicated that
capital helps small banks to increase their probability of survival and market share at
all times. The study further argued that capital enhances the performance of medium
and large SACCOS primarily during banking crises also Croteau (1956), Taylor
(1979), Wolken and Navratil (1980) and who stated that capital adequacy ratios were
important in expansion, merger and growth in deposit taking SACCOs. Mckillop and
Williamson (2011) recognized the importance of capital management as an important
ingredient in achieving optimal utilization of resources in an economy and also the
improvement in quality of life.
4.6.4 Capital Adequacy Elements and Financial Performance
The results presented in table 4.13 present the regression model used in explaining the
study phenomena.
Table 4.13: Regression model
ROA Coef. Std.Err t P>|z|
Core Capital Ratio 0.305 .096 3.189 0.002
Institutional Capital Ratio 0.237 .116 2.035 0.046
Debt Equity Ratio 0.165 .084 1.960 0.012
Cons 1.117 .472 2.366 0.021
R2 0.371
F-statistics 13.192
P value 0.000
The specific model was;
Financial Performance = 1.117+0.305 Core Capital Ratio+0.237 Institutional
Capital Ratio+0.165 Debt Equity Ratio
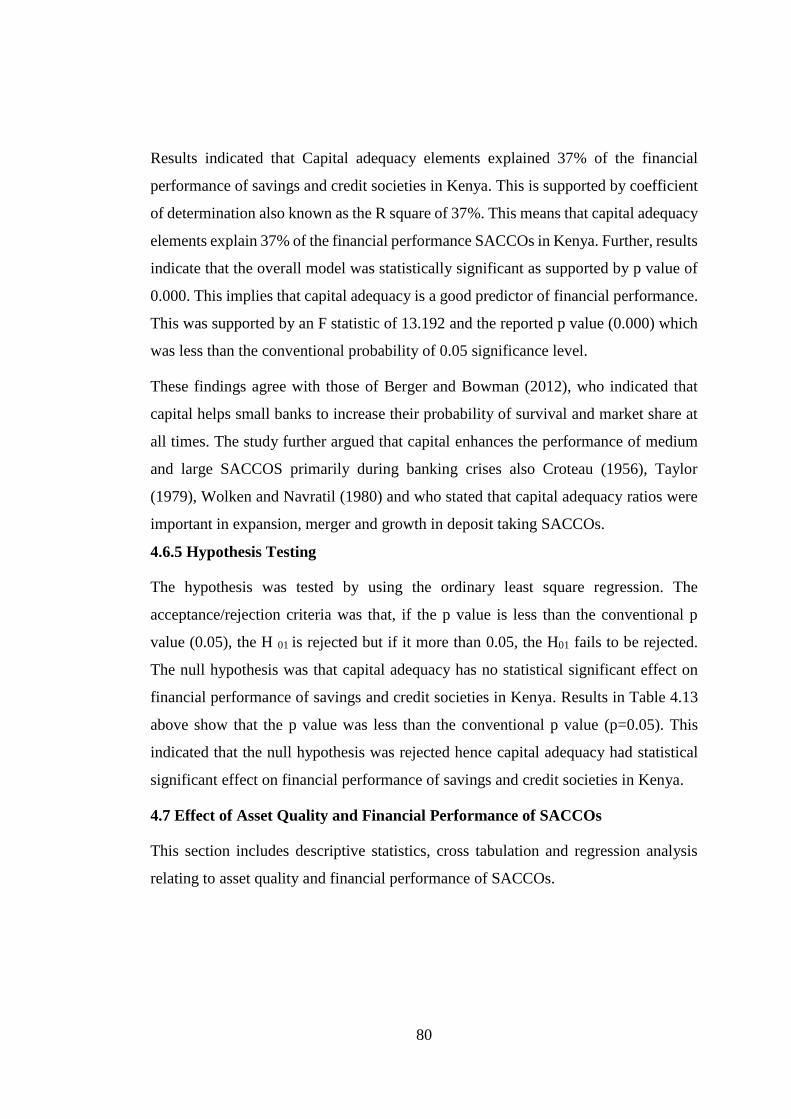
80
Results indicated that Capital adequacy elements explained 37% of the financial
performance of savings and credit societies in Kenya. This is supported by coefficient
of determination also known as the R square of 37%. This means that capital adequacy
elements explain 37% of the financial performance SACCOs in Kenya. Further, results
indicate that the overall model was statistically significant as supported by p value of
0.000. This implies that capital adequacy is a good predictor of financial performance.
This was supported by an F statistic of 13.192 and the reported p value (0.000) which
was less than the conventional probability of 0.05 significance level.
These findings agree with those of Berger and Bowman (2012), who indicated that
capital helps small banks to increase their probability of survival and market share at
all times. The study further argued that capital enhances the performance of medium
and large SACCOS primarily during banking crises also Croteau (1956), Taylor
(1979), Wolken and Navratil (1980) and who stated that capital adequacy ratios were
important in expansion, merger and growth in deposit taking SACCOs.
4.6.5 Hypothesis Testing
The hypothesis was tested by using the ordinary least square regression. The
acceptance/rejection criteria was that, if the p value is less than the conventional p
value (0.05), the H 01 is rejected but if it more than 0.05, the H01 fails to be rejected.
The null hypothesis was that capital adequacy has no statistical significant effect on
financial performance of savings and credit societies in Kenya. Results in Table 4.13
above show that the p value was less than the conventional p value (p=0.05). This
indicated that the null hypothesis was rejected hence capital adequacy had statistical
significant effect on financial performance of savings and credit societies in Kenya.
4.7 Effect of Asset Quality and Financial Performance of SACCOs
This section includes descriptive statistics, cross tabulation and regression analysis
relating to asset quality and financial performance of SACCOs.
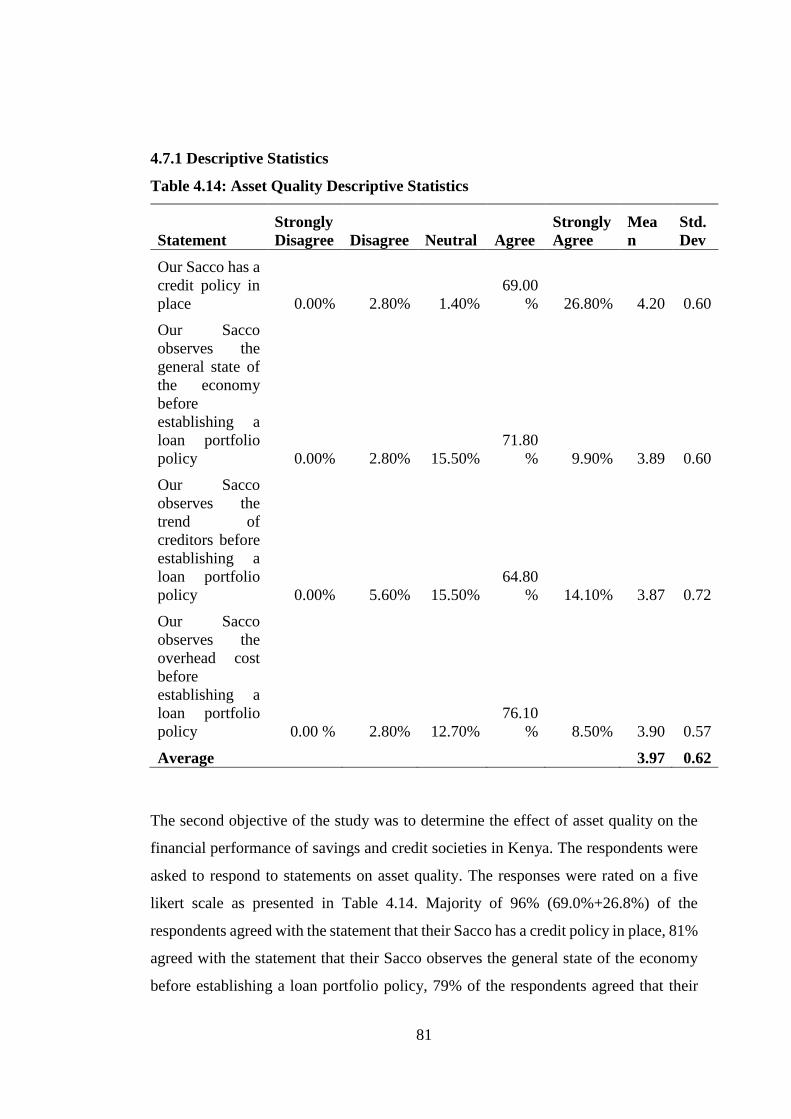
81
4.7.1 Descriptive Statistics
Table 4.14: Asset Quality Descriptive Statistics
Statement
Strongly
Disagree Disagree Neutral Agree
Strongly
Agree
Mea
n
Std.
Dev
Our Sacco has a
credit policy in
place 0.00% 2.80% 1.40%
69.00
% 26.80% 4.20 0.60
Our Sacco
observes the
general state of
the economy
before
establishing a
loan portfolio
policy 0.00% 2.80% 15.50%
71.80
% 9.90% 3.89 0.60
Our Sacco
observes the
trend of
creditors before
establishing a
loan portfolio
policy 0.00% 5.60% 15.50%
64.80
% 14.10% 3.87 0.72
Our Sacco
observes the
overhead cost
before
establishing a
loan portfolio
policy 0.00 % 2.80% 12.70%
76.10
% 8.50% 3.90 0.57
Average 3.97 0.62
The second objective of the study was to determine the effect of asset quality on the
financial performance of savings and credit societies in Kenya. The respondents were
asked to respond to statements on asset quality. The responses were rated on a five
likert scale as presented in Table 4.14. Majority of 96% (69.0%+26.8%) of the
respondents agreed with the statement that their Sacco has a credit policy in place, 81%
agreed with the statement that their Sacco observes the general state of the economy
before establishing a loan portfolio policy, 79% of the respondents agreed that their
82
Sacco observes the trend of creditors before establishing a loan portfolio policy while
85% of the respondents agreed that their Sacco observes the overhead cost before
establishing a loan portfolio policy. On a five-point scale, the average mean of the
responses was 3.97 which means that majority of the respondents were agreeing with
most of the statements; however, the answers were varied as shown by a standard
deviation of 0.62.
These findings agree with those of Luqman (2014), who undertook a study on the effect
of credit risk on performance of banks in Nigeria. The study found that there is a
significant relationship between bank performance (in terms of profitability) and credit
risk management (in terms of loan performance). The study mentioned that Loans and
advances and non-performing loans are major variables in determining asset quality of
a SACCO. Findings indicated that improper credit risk management reduces bank
profitability, affects the quality of its assets and increases loan losses and non-
performing loan which may eventually lead to financial distress.
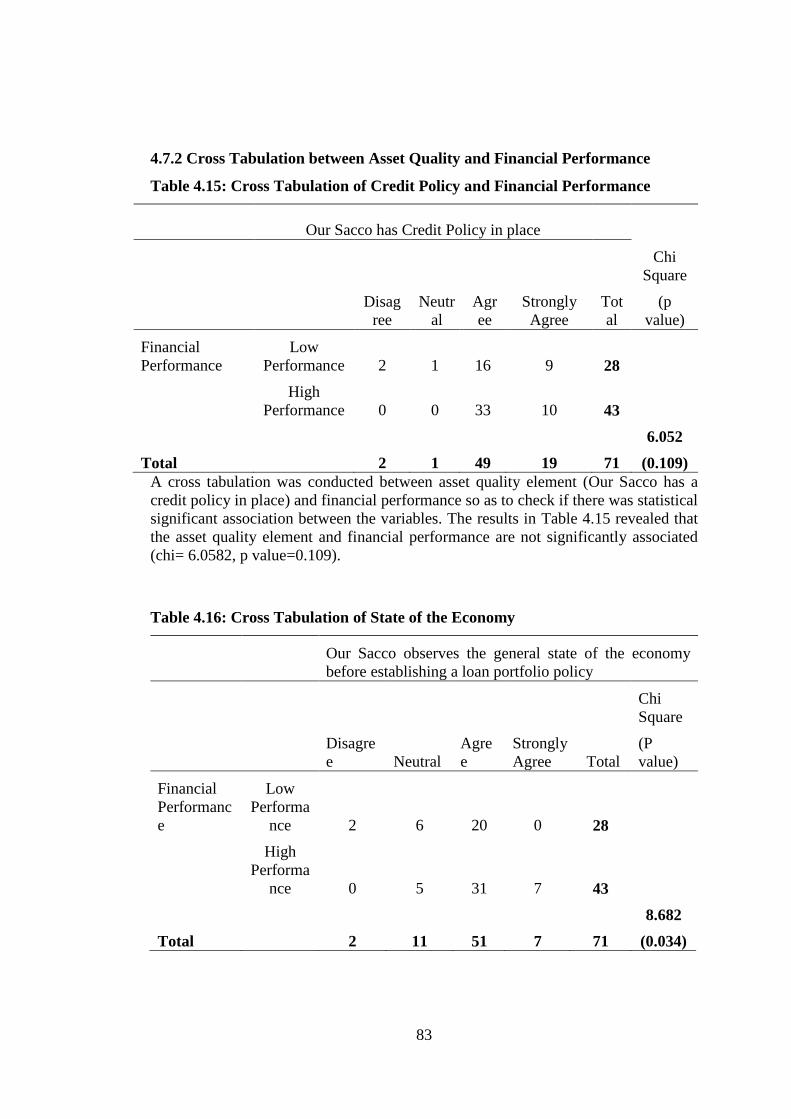
83
4.7.2 Cross Tabulation between Asset Quality and Financial Performance
Table 4.15: Cross Tabulation of Credit Policy and Financial Performance
Our Sacco has Credit Policy in place
Disag
ree
Neutr
al
Agr
ee
Strongly
Agree
Tot
al
Chi
Square
(p
value)
Financial
Performance
Low
Performance 2 1 16 9 28
High
Performance 0 0 33 10 43
Total 2 1 49 19 71
6.052
(0.109)
A cross tabulation was conducted between asset quality element (Our Sacco has a
credit policy in place) and financial performance so as to check if there was statistical
significant association between the variables. The results in Table 4.15 revealed that
the asset quality element and financial performance are not significantly associated
(chi= 6.0582, p value=0.109).
Table 4.16: Cross Tabulation of State of the Economy
Our Sacco observes the general state of the economy
before establishing a loan portfolio policy
Disagre
e Neutral
Agre
e
Strongly
Agree Total
Chi
Square
(P
value)
Financial
Performanc
e
Low
Performa
nce 2 6 20 0 28
High
Performa
nce 0 5 31 7 43
Total 2 11 51 7 71
8.682
(0.034)
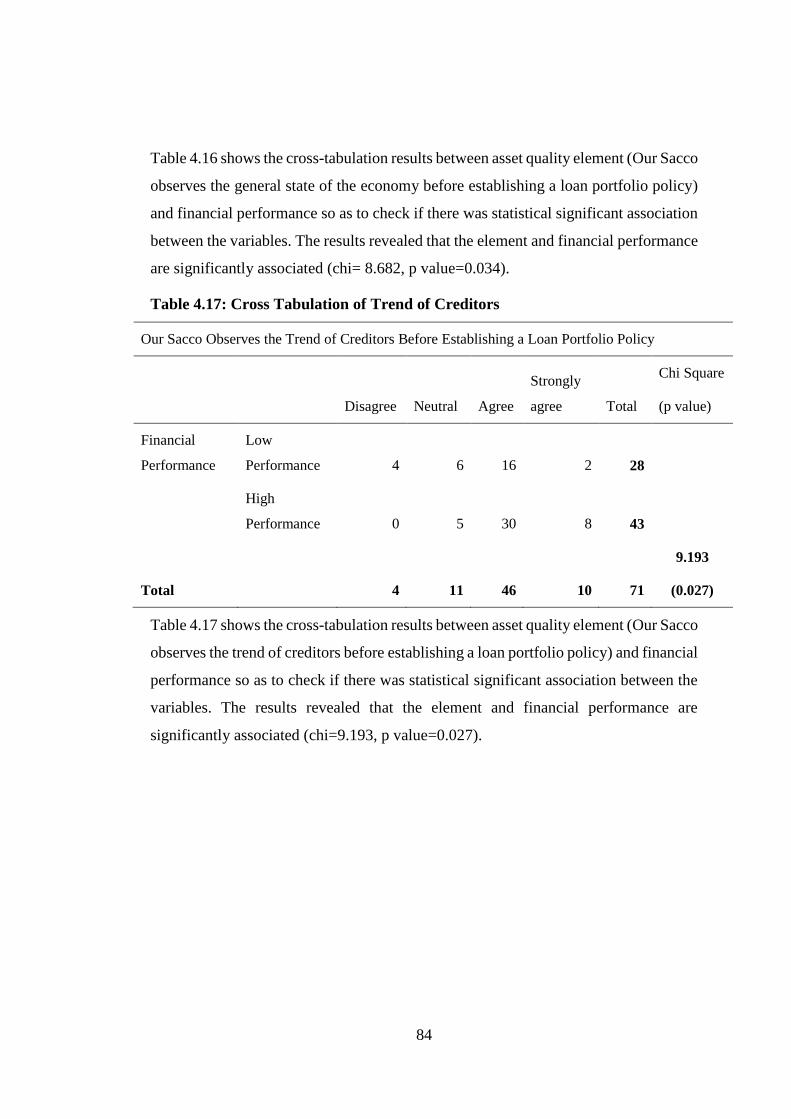
84
Table 4.16 shows the cross-tabulation results between asset quality element (Our Sacco
observes the general state of the economy before establishing a loan portfolio policy)
and financial performance so as to check if there was statistical significant association
between the variables. The results revealed that the element and financial performance
are significantly associated (chi= 8.682, p value=0.034).
Table 4.17: Cross Tabulation of Trend of Creditors
Our Sacco Observes the Trend of Creditors Before Establishing a Loan Portfolio Policy
Disagree Neutral Agree
Strongly
agree Total
Chi Square
(p value)
Financial
Performance
Low
Performance 4 6 16 2 28
High
Performance 0 5 30 8 43
Total 4 11 46 10 71
9.193
(0.027)
Table 4.17 shows the cross-tabulation results between asset quality element (Our Sacco
observes the trend of creditors before establishing a loan portfolio policy) and financial
performance so as to check if there was statistical significant association between the
variables. The results revealed that the element and financial performance are
significantly associated (chi=9.193, p value=0.027).

85
Table 4.18: Cross Tabulation of Loan Portfolio Policy
Our Sacco Observes the Overhead Cost Before Establishing a Loan Portfolio Policy
Disagre
e Neutral Agree
Strongl
y Agree
Tota
l
Chi Square
(P value)
Financial
Performance
Low
Performance 2 5 19 2 28
High
Performance 0 4 35 4 43
Total 2 9 54 6 71
4.553
(0.020)
Table 4.18 shows the cross-tabulation results between asset quality element (Our Sacco
observes the overhead cost before establishing a loan portfolio policy) and financial
performance so as to check if there was statistical significant association between the
variables. The results revealed that the element and financial performance are
significantly associated (chi=4.553, p value=0.020).
4.7.3 Joint Asset Quality Elements and Financial Performance
Table 4.19: Regression Model of Asset Quality and Financial Performance
ROA Coef. Std.Err z P>|z| [95% Conf.Interval
Asset quality 5.8269 0.43337 13.44 0.000 4.9769 6.6757
Cons -1.0608 0.23176 -4.58 0.000 -1.5150 -0.6066
R2 0.4986
F-statistics 180.74
P value 0.000
The specific model was;
SACCO financial performance = -1.0608+5.8269 asset quality
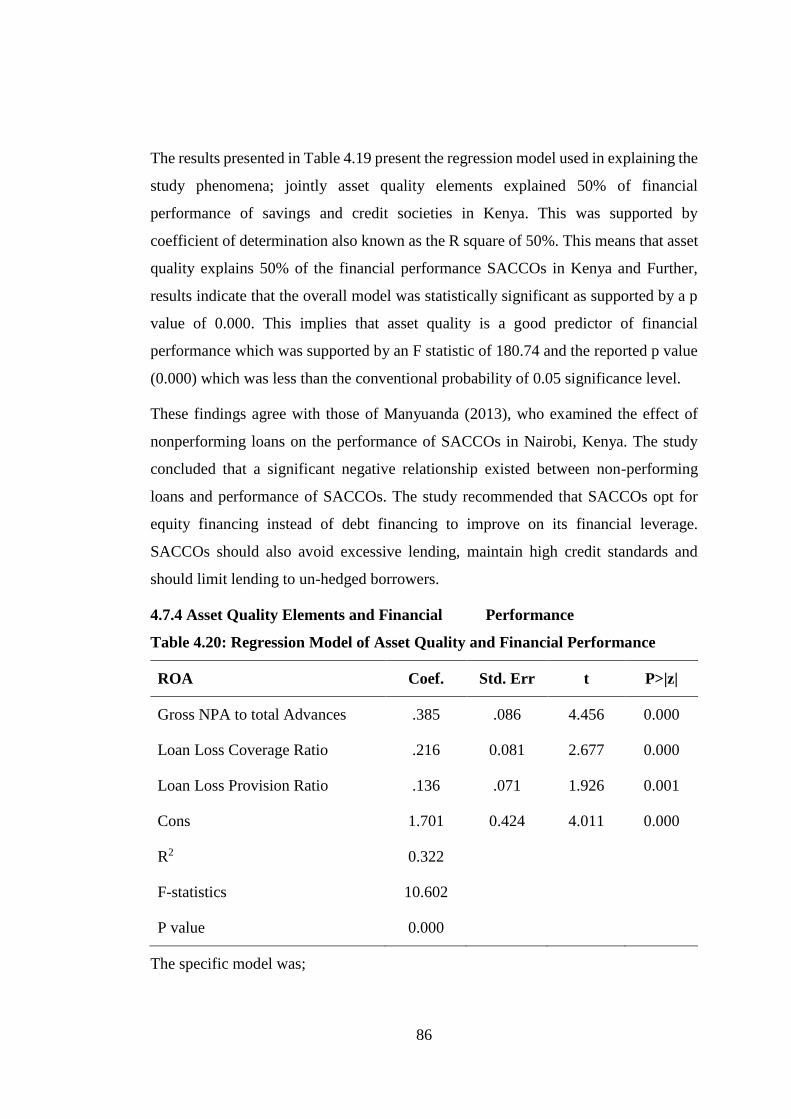
86
The results presented in Table 4.19 present the regression model used in explaining the
study phenomena; jointly asset quality elements explained 50% of financial
performance of savings and credit societies in Kenya. This was supported by
coefficient of determination also known as the R square of 50%. This means that asset
quality explains 50% of the financial performance SACCOs in Kenya and Further,
results indicate that the overall model was statistically significant as supported by a p
value of 0.000. This implies that asset quality is a good predictor of financial
performance which was supported by an F statistic of 180.74 and the reported p value
(0.000) which was less than the conventional probability of 0.05 significance level.
These findings agree with those of Manyuanda (2013), who examined the effect of
nonperforming loans on the performance of SACCOs in Nairobi, Kenya. The study
concluded that a significant negative relationship existed between non-performing
loans and performance of SACCOs. The study recommended that SACCOs opt for
equity financing instead of debt financing to improve on its financial leverage.
SACCOs should also avoid excessive lending, maintain high credit standards and
should limit lending to un-hedged borrowers.
4.7.4 Asset Quality Elements and Financial Performance
Table 4.20: Regression Model of Asset Quality and Financial Performance
ROA Coef. Std. Err t P>|z|
Gross NPA to total Advances .385 .086 4.456 0.000
Loan Loss Coverage Ratio .216 0.081 2.677 0.000
Loan Loss Provision Ratio .136 .071 1.926 0.001
Cons 1.701 0.424 4.011 0.000
R2 0.322
F-statistics 10.602
P value 0.000
The specific model was;
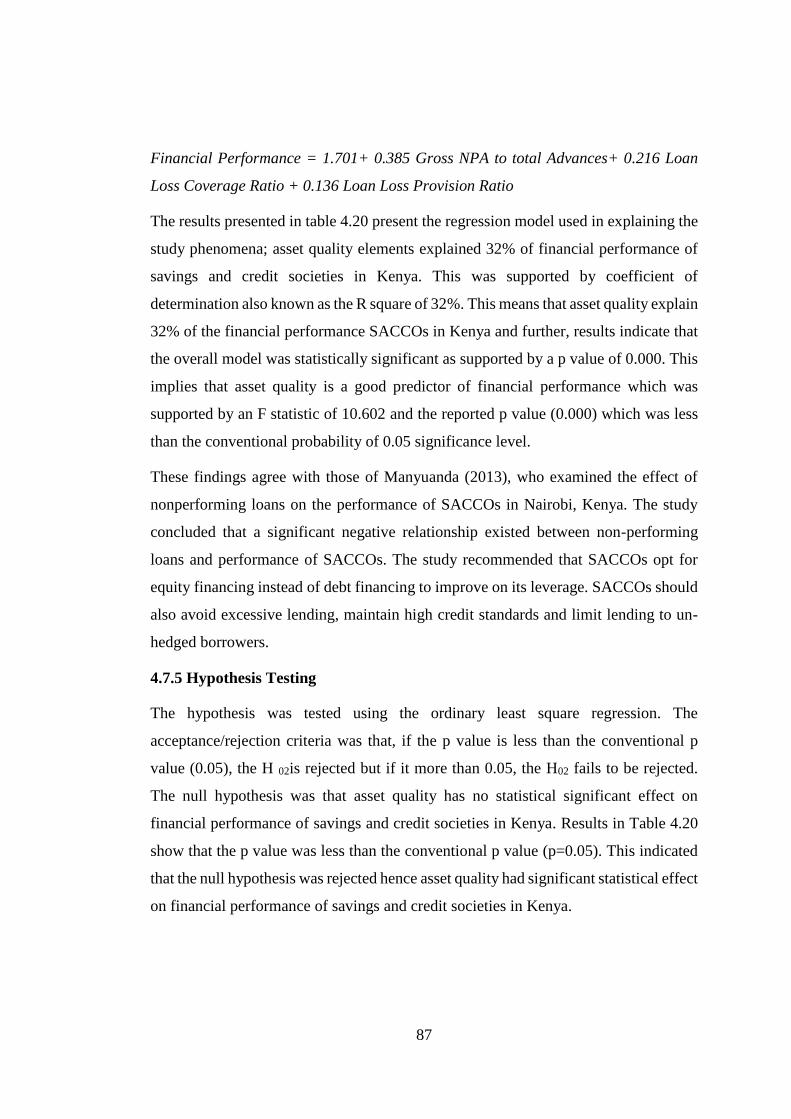
87
Financial Performance = 1.701+ 0.385 Gross NPA to total Advances+ 0.216 Loan
Loss Coverage Ratio + 0.136 Loan Loss Provision Ratio
The results presented in table 4.20 present the regression model used in explaining the
study phenomena; asset quality elements explained 32% of financial performance of
savings and credit societies in Kenya. This was supported by coefficient of
determination also known as the R square of 32%. This means that asset quality explain
32% of the financial performance SACCOs in Kenya and further, results indicate that
the overall model was statistically significant as supported by a p value of 0.000. This
implies that asset quality is a good predictor of financial performance which was
supported by an F statistic of 10.602 and the reported p value (0.000) which was less
than the conventional probability of 0.05 significance level.
These findings agree with those of Manyuanda (2013), who examined the effect of
nonperforming loans on the performance of SACCOs in Nairobi, Kenya. The study
concluded that a significant negative relationship existed between non-performing
loans and performance of SACCOs. The study recommended that SACCOs opt for
equity financing instead of debt financing to improve on its leverage. SACCOs should
also avoid excessive lending, maintain high credit standards and limit lending to un-
hedged borrowers.
4.7.5 Hypothesis Testing
The hypothesis was tested using the ordinary least square regression. The
acceptance/rejection criteria was that, if the p value is less than the conventional p
value (0.05), the H 02is rejected but if it more than 0.05, the H02 fails to be rejected.
The null hypothesis was that asset quality has no statistical significant effect on
financial performance of savings and credit societies in Kenya. Results in Table 4.20
show that the p value was less than the conventional p value (p=0.05). This indicated
that the null hypothesis was rejected hence asset quality had significant statistical effect
on financial performance of savings and credit societies in Kenya.
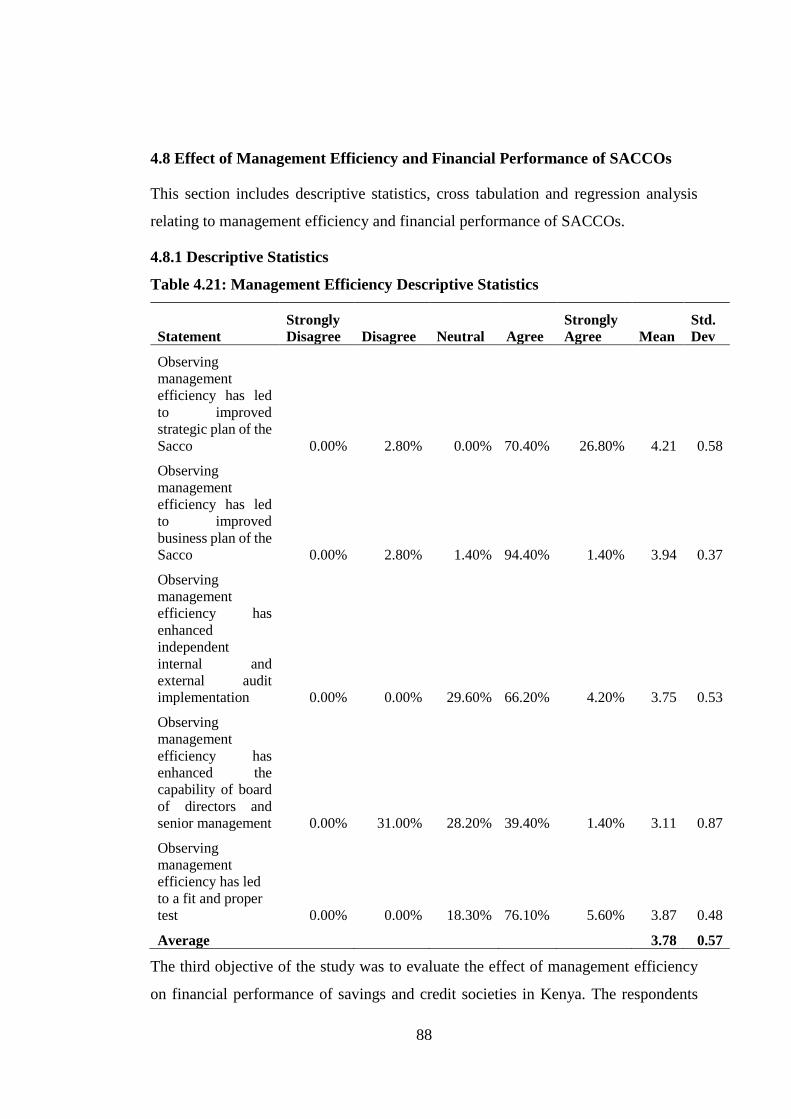
88
4.8 Effect of Management Efficiency and Financial Performance of SACCOs
This section includes descriptive statistics, cross tabulation and regression analysis
relating to management efficiency and financial performance of SACCOs.
4.8.1 Descriptive Statistics
Table 4.21: Management Efficiency Descriptive Statistics
Statement
Strongly
Disagree Disagree Neutral Agree
Strongly
Agree Mean
Std.
Dev
Observing
management
efficiency has led
to improved
strategic plan of the
Sacco 0.00% 2.80% 0.00% 70.40% 26.80% 4.21 0.58
Observing
management
efficiency has led
to improved
business plan of the
Sacco 0.00% 2.80% 1.40% 94.40% 1.40% 3.94 0.37
Observing
management
efficiency has
enhanced
independent
internal and
external audit
implementation 0.00% 0.00% 29.60% 66.20% 4.20% 3.75 0.53
Observing
management
efficiency has
enhanced the
capability of board
of directors and
senior management 0.00% 31.00% 28.20% 39.40% 1.40% 3.11 0.87
Observing
management
efficiency has led
to a fit and proper
test 0.00% 0.00% 18.30% 76.10% 5.60% 3.87 0.48
Average 3.78 0.57
The third objective of the study was to evaluate the effect of management efficiency
on financial performance of savings and credit societies in Kenya. The respondents
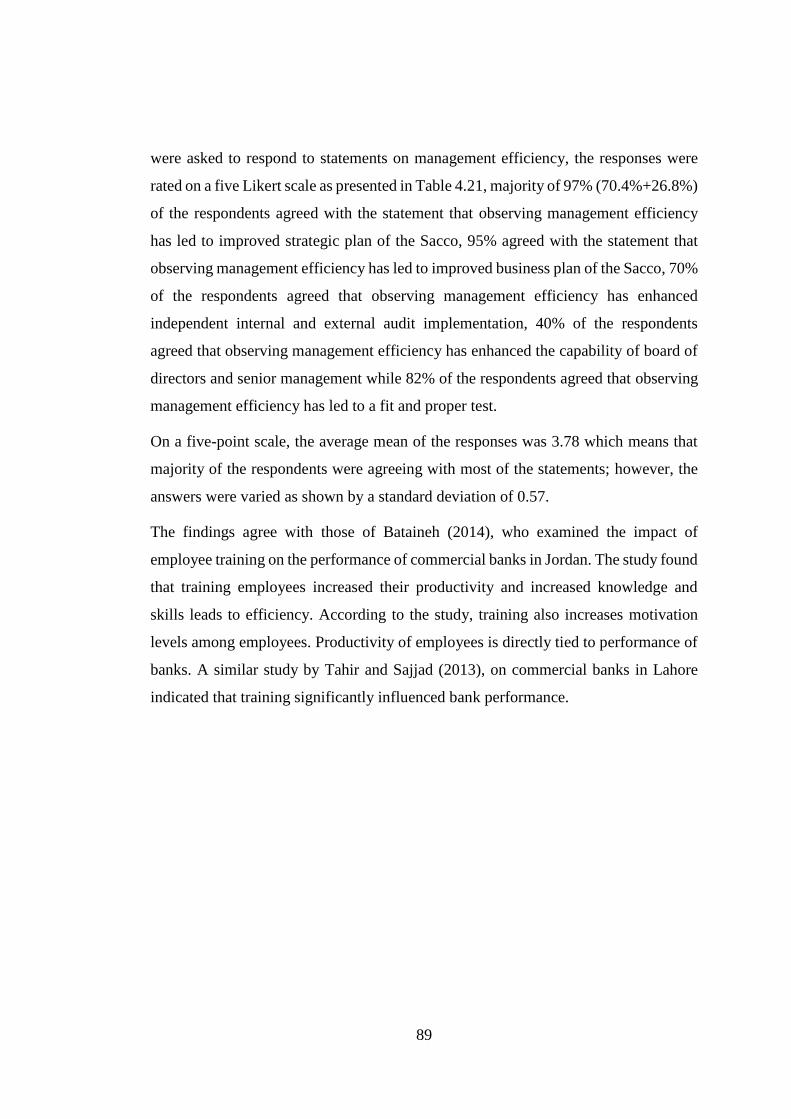
89
were asked to respond to statements on management efficiency, the responses were
rated on a five Likert scale as presented in Table 4.21, majority of 97% (70.4%+26.8%)
of the respondents agreed with the statement that observing management efficiency
has led to improved strategic plan of the Sacco, 95% agreed with the statement that
observing management efficiency has led to improved business plan of the Sacco, 70%
of the respondents agreed that observing management efficiency has enhanced
independent internal and external audit implementation, 40% of the respondents
agreed that observing management efficiency has enhanced the capability of board of
directors and senior management while 82% of the respondents agreed that observing
management efficiency has led to a fit and proper test.
On a five-point scale, the average mean of the responses was 3.78 which means that
majority of the respondents were agreeing with most of the statements; however, the
answers were varied as shown by a standard deviation of 0.57.
The findings agree with those of Bataineh (2014), who examined the impact of
employee training on the performance of commercial banks in Jordan. The study found
that training employees increased their productivity and increased knowledge and
skills leads to efficiency. According to the study, training also increases motivation
levels among employees. Productivity of employees is directly tied to performance of
banks. A similar study by Tahir and Sajjad (2013), on commercial banks in Lahore
indicated that training significantly influenced bank performance.
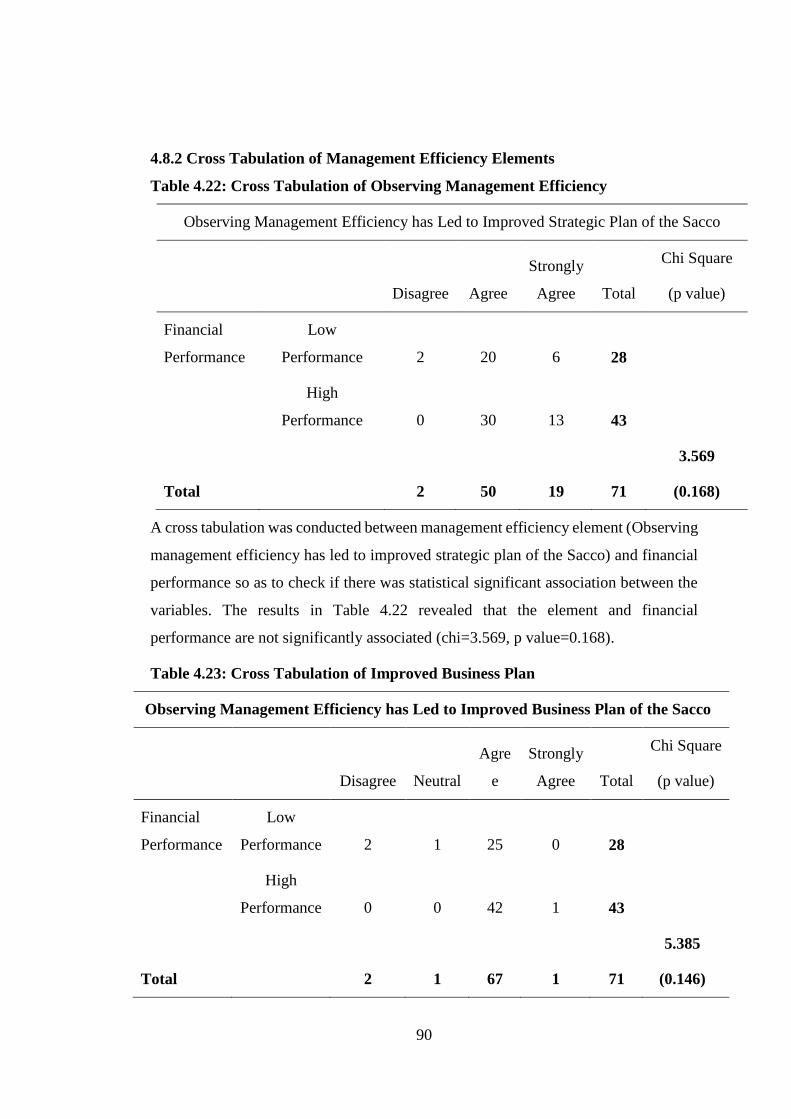
90
4.8.2 Cross Tabulation of Management Efficiency Elements
Table 4.22: Cross Tabulation of Observing Management Efficiency
Observing Management Efficiency has Led to Improved Strategic Plan of the Sacco
Disagree Agree
Strongly
Agree Total
Chi Square
(p value)
Financial
Performance
Low
Performance 2 20 6 28
High
Performance 0 30 13 43
Total
2 50 19 71
3.569
(0.168)
A cross tabulation was conducted between management efficiency element (Observing
management efficiency has led to improved strategic plan of the Sacco) and financial
performance so as to check if there was statistical significant association between the
variables. The results in Table 4.22 revealed that the element and financial
performance are not significantly associated (chi=3.569, p value=0.168).
Table 4.23: Cross Tabulation of Improved Business Plan
Observing Management Efficiency has Led to Improved Business Plan of the Sacco
Disagree Neutral
Agre
e
Strongly
Agree Total
Chi Square
(p value)
Financial
Performance
Low
Performance 2 1 25 0 28
High
Performance 0 0 42 1 43
Total
2 1 67 1 71
5.385
(0.146)

91
Table 4.23 shows the cross-tabulation results between management efficiency element
(Observing management efficiency has led to improved business plan of the Sacco)
and financial performance so as to check if there was statistical significant association
between the variables. The results revealed that the element and financial performance
are not significantly associated (chi=5.385, p value=0.146).
Table 4.24: Cross Tabulation of Internal and External Audit implementation
Observing Management Efficiency has Enhanced Independent Internal and
External Audit Implementation
Neutral
Agre
e
Strongly
Agree Total
Chi Square
(p value)
Financial
Performanc
e
Low
Performance 7 21 0 28
High
Performance 14 26 3 43
Total
21 47 3 71
2.822
(0.244)
Table 4.24 shows the cross tabulation results between management efficiency element
(Observing management efficiency has enhanced independent internal and external
audit implementation) and financial performance so as to check if there was statistical
significant association between the variables. The results revealed that the element and
financial performance are not significantly associated (chi=2.822, p value=0.244).
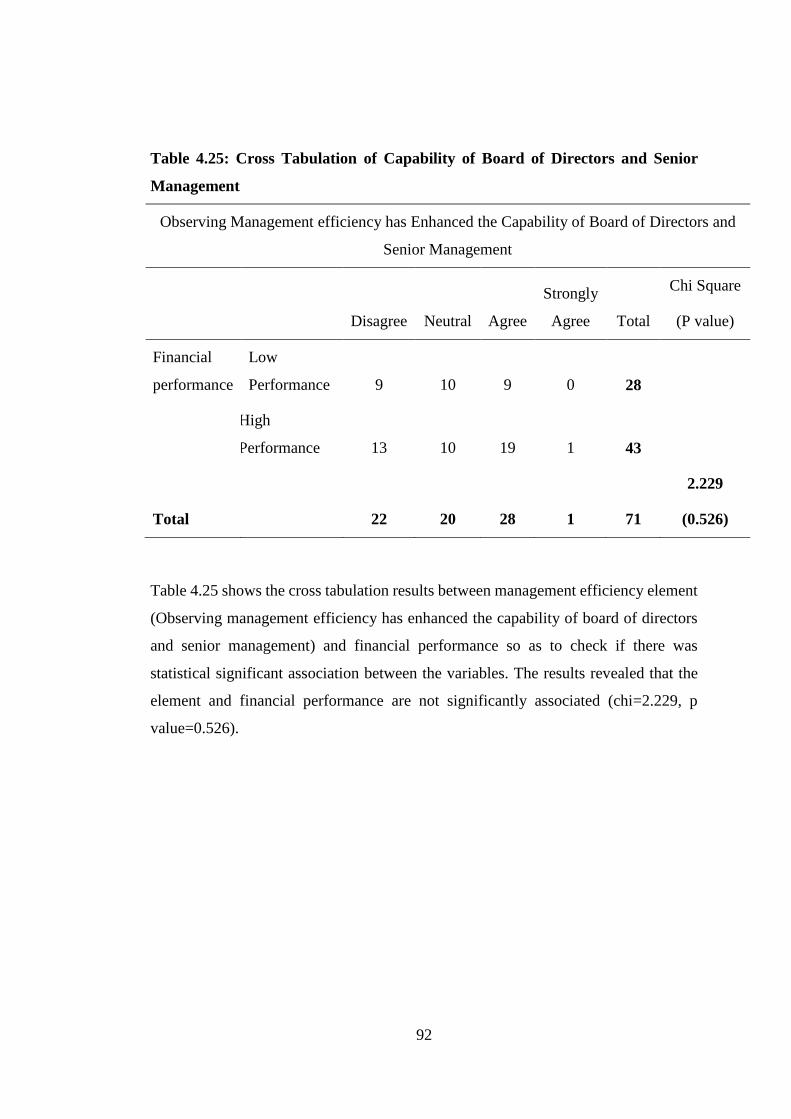
92
Table 4.25: Cross Tabulation of Capability of Board of Directors and Senior
Management
Observing Management efficiency has Enhanced the Capability of Board of Directors and
Senior Management
Disagree Neutral Agree
Strongly
Agree Total
Chi Square
(P value)
Financial
performance
Low
Performance 9 10 9 0 28
High
Performance 13 10 19 1 43
Total 22 20 28 1 71
2.229
(0.526)
Table 4.25 shows the cross tabulation results between management efficiency element
(Observing management efficiency has enhanced the capability of board of directors
and senior management) and financial performance so as to check if there was
statistical significant association between the variables. The results revealed that the
element and financial performance are not significantly associated (chi=2.229, p
value=0.526).
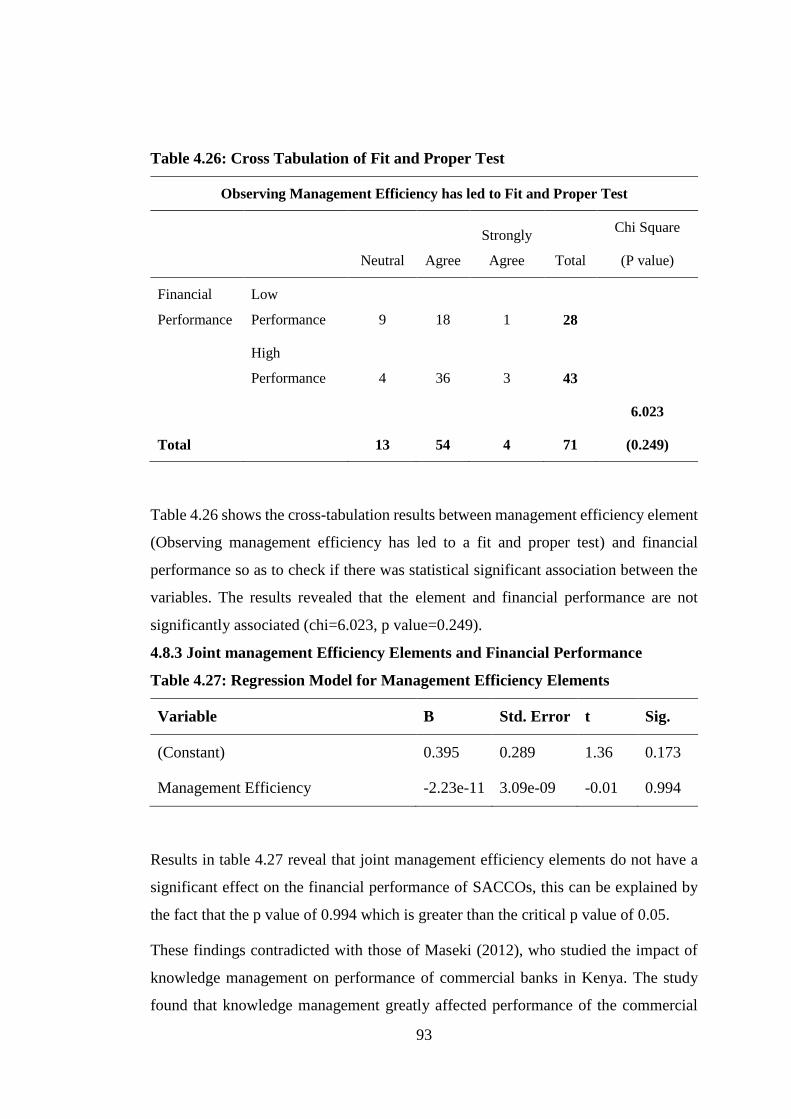
93
Table 4.26: Cross Tabulation of Fit and Proper Test
Observing Management Efficiency has led to Fit and Proper Test
Neutral Agree
Strongly
Agree Total
Chi Square
(P value)
Financial
Performance
Low
Performance 9 18 1 28
High
Performance 4 36 3 43
Total 13 54 4 71
6.023
(0.249)
Table 4.26 shows the cross-tabulation results between management efficiency element
(Observing management efficiency has led to a fit and proper test) and financial
performance so as to check if there was statistical significant association between the
variables. The results revealed that the element and financial performance are not
significantly associated (chi=6.023, p value=0.249).
4.8.3 Joint management Efficiency Elements and Financial Performance
Table 4.27: Regression Model for Management Efficiency Elements
Variable B Std. Error t Sig.
(Constant) 0.395 0.289 1.36 0.173
Management Efficiency -2.23e-11 3.09e-09 -0.01 0.994
Results in table 4.27 reveal that joint management efficiency elements do not have a
significant effect on the financial performance of SACCOs, this can be explained by
the fact that the p value of 0.994 which is greater than the critical p value of 0.05.
These findings contradicted with those of Maseki (2012), who studied the impact of
knowledge management on performance of commercial banks in Kenya. The study
found that knowledge management greatly affected performance of the commercial
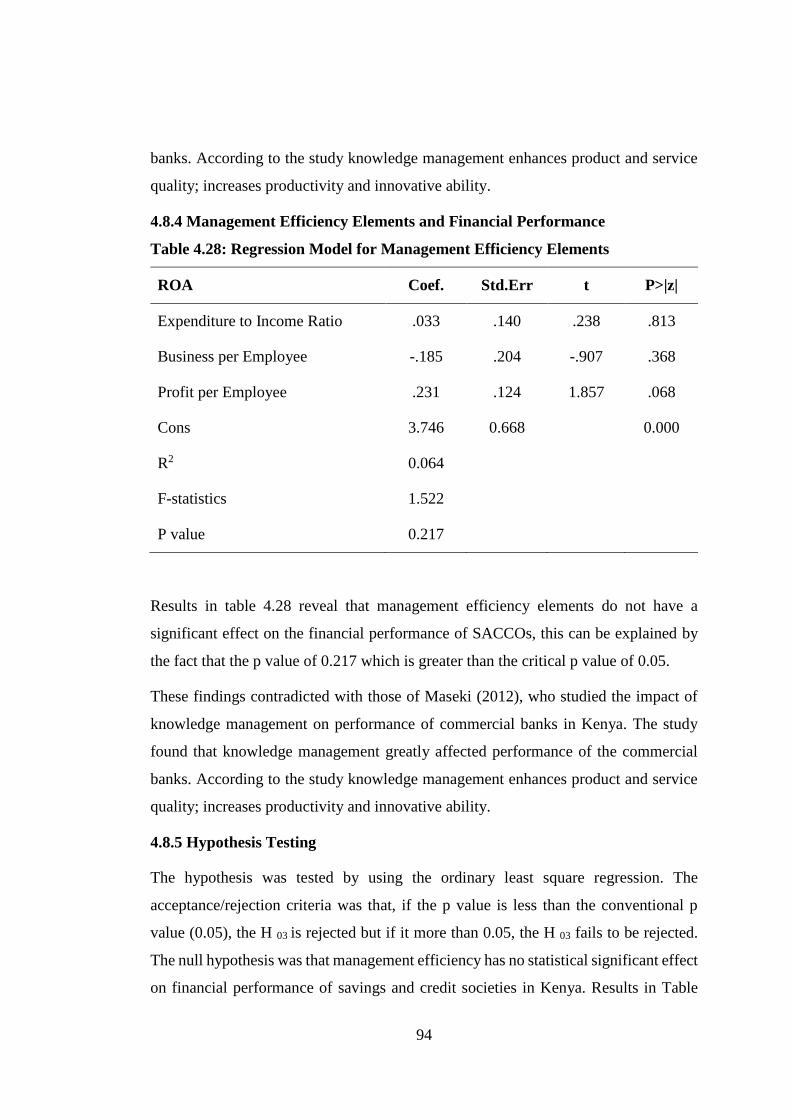
94
banks. According to the study knowledge management enhances product and service
quality; increases productivity and innovative ability.
4.8.4 Management Efficiency Elements and Financial Performance
Table 4.28: Regression Model for Management Efficiency Elements
ROA Coef. Std.Err t P>|z|
Expenditure to Income Ratio .033 .140 .238 .813
Business per Employee -.185 .204 -.907 .368
Profit per Employee .231 .124 1.857 .068
Cons 3.746 0.668
0.000
R2 0.064
F-statistics 1.522
P value 0.217
Results in table 4.28 reveal that management efficiency elements do not have a
significant effect on the financial performance of SACCOs, this can be explained by
the fact that the p value of 0.217 which is greater than the critical p value of 0.05.
These findings contradicted with those of Maseki (2012), who studied the impact of
knowledge management on performance of commercial banks in Kenya. The study
found that knowledge management greatly affected performance of the commercial
banks. According to the study knowledge management enhances product and service
quality; increases productivity and innovative ability.
4.8.5 Hypothesis Testing
The hypothesis was tested by using the ordinary least square regression. The
acceptance/rejection criteria was that, if the p value is less than the conventional p
value (0.05), the H 03 is rejected but if it more than 0.05, the H 03 fails to be rejected.
The null hypothesis was that management efficiency has no statistical significant effect
on financial performance of savings and credit societies in Kenya. Results in Table
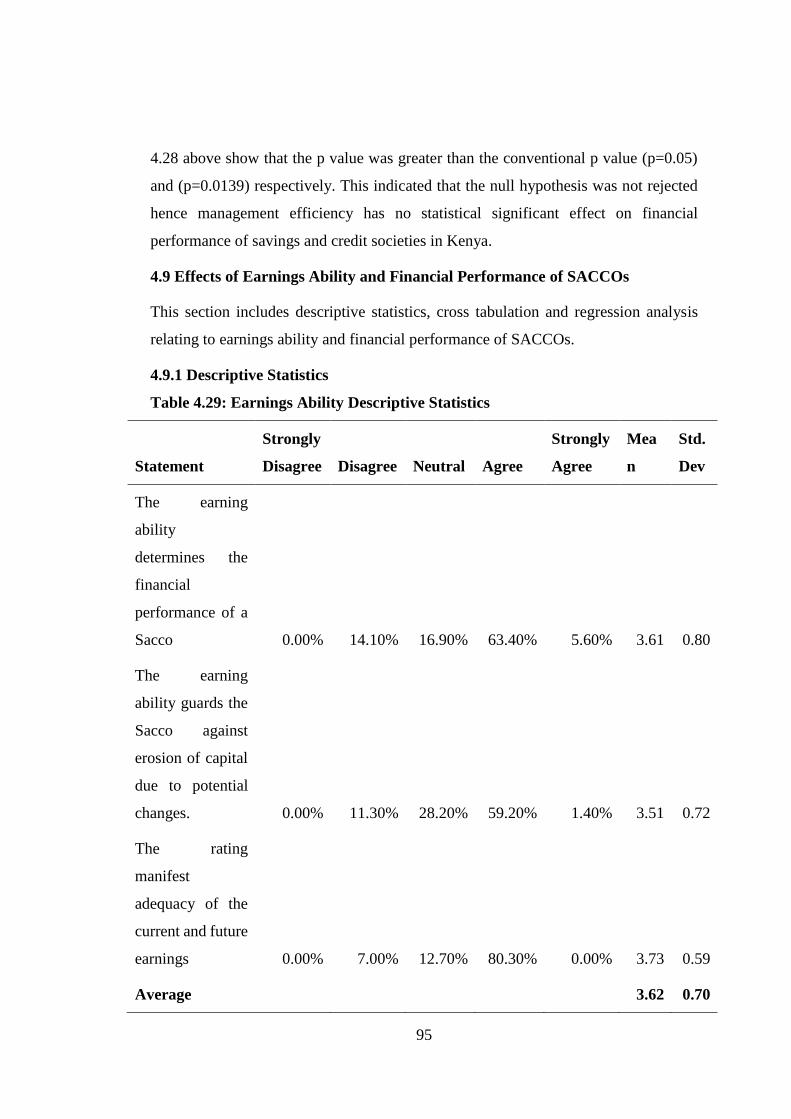
95
4.28 above show that the p value was greater than the conventional p value (p=0.05)
and (p=0.0139) respectively. This indicated that the null hypothesis was not rejected
hence management efficiency has no statistical significant effect on financial
performance of savings and credit societies in Kenya.
4.9 Effects of Earnings Ability and Financial Performance of SACCOs
This section includes descriptive statistics, cross tabulation and regression analysis
relating to earnings ability and financial performance of SACCOs.
4.9.1 Descriptive Statistics
Table 4.29: Earnings Ability Descriptive Statistics
Statement
Strongly
Disagree Disagree Neutral Agree
Strongly
Agree
Mea
n
Std.
Dev
The earning
ability
determines the
financial
performance of a
Sacco 0.00% 14.10% 16.90% 63.40% 5.60% 3.61 0.80
The earning
ability guards the
Sacco against
erosion of capital
due to potential
changes. 0.00% 11.30% 28.20% 59.20% 1.40% 3.51 0.72
The rating
manifest
adequacy of the
current and future
earnings 0.00% 7.00% 12.70% 80.30% 0.00% 3.73 0.59
Average 3.62 0.70
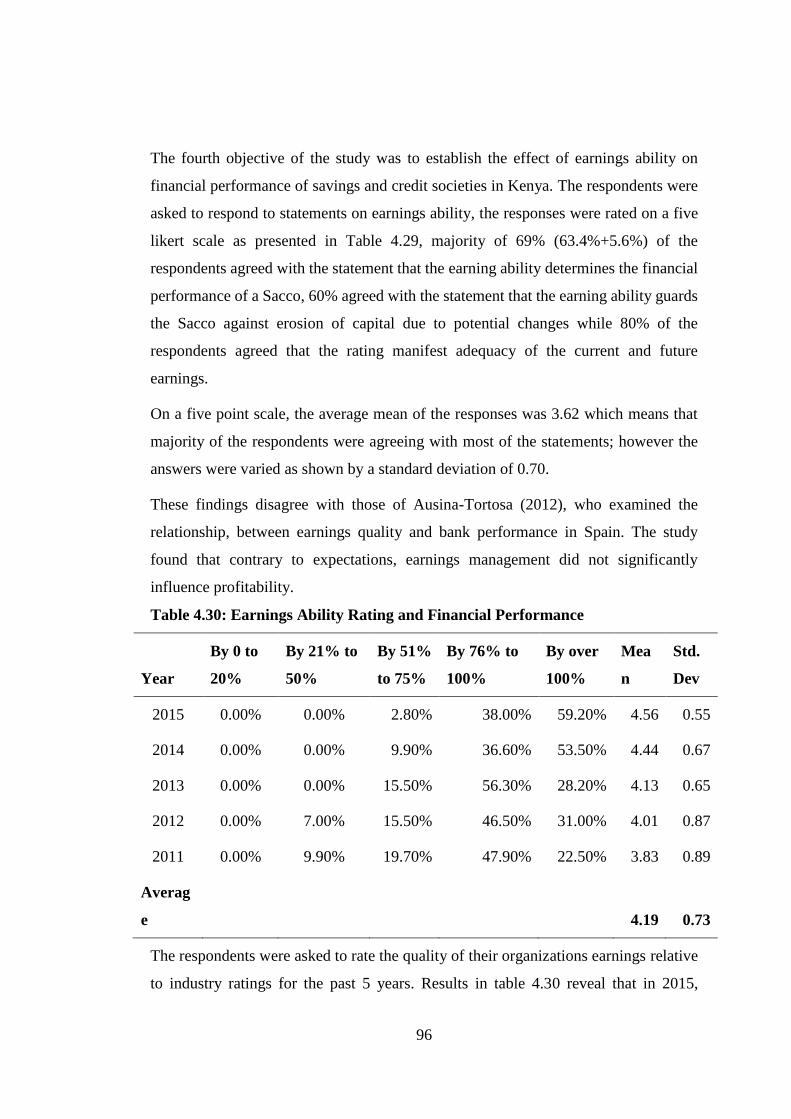
96
The fourth objective of the study was to establish the effect of earnings ability on
financial performance of savings and credit societies in Kenya. The respondents were
asked to respond to statements on earnings ability, the responses were rated on a five
likert scale as presented in Table 4.29, majority of 69% (63.4%+5.6%) of the
respondents agreed with the statement that the earning ability determines the financial
performance of a Sacco, 60% agreed with the statement that the earning ability guards
the Sacco against erosion of capital due to potential changes while 80% of the
respondents agreed that the rating manifest adequacy of the current and future
earnings.
On a five point scale, the average mean of the responses was 3.62 which means that
majority of the respondents were agreeing with most of the statements; however the
answers were varied as shown by a standard deviation of 0.70.
These findings disagree with those of Ausina-Tortosa (2012), who examined the
relationship, between earnings quality and bank performance in Spain. The study
found that contrary to expectations, earnings management did not significantly
influence profitability.
Table 4.30: Earnings Ability Rating and Financial Performance
Year
By 0 to
20%
By 21% to
50%
By 51%
to 75%
By 76% to
100%
By over
100%
Mea
n
Std.
Dev
2015 0.00% 0.00% 2.80% 38.00% 59.20% 4.56 0.55
2014 0.00% 0.00% 9.90% 36.60% 53.50% 4.44 0.67
2013 0.00% 0.00% 15.50% 56.30% 28.20% 4.13 0.65
2012 0.00% 7.00% 15.50% 46.50% 31.00% 4.01 0.87
2011 0.00% 9.90% 19.70% 47.90% 22.50% 3.83 0.89
Averag
e 4.19 0.73
The respondents were asked to rate the quality of their organizations earnings relative
to industry ratings for the past 5 years. Results in table 4.30 reveal that in 2015,
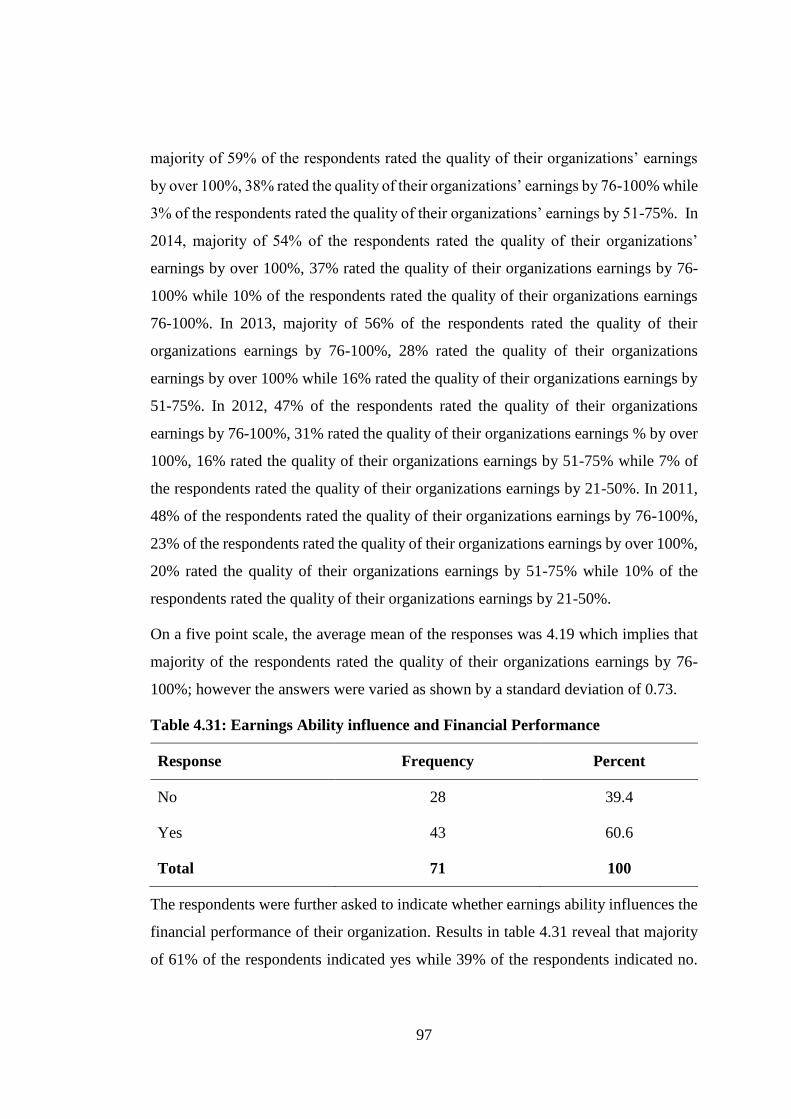
97
majority of 59% of the respondents rated the quality of their organizations’ earnings
by over 100%, 38% rated the quality of their organizations’ earnings by 76-100% while
3% of the respondents rated the quality of their organizations’ earnings by 51-75%. In
2014, majority of 54% of the respondents rated the quality of their organizations’
earnings by over 100%, 37% rated the quality of their organizations earnings by 76-
100% while 10% of the respondents rated the quality of their organizations earnings
76-100%. In 2013, majority of 56% of the respondents rated the quality of their
organizations earnings by 76-100%, 28% rated the quality of their organizations
earnings by over 100% while 16% rated the quality of their organizations earnings by
51-75%. In 2012, 47% of the respondents rated the quality of their organizations
earnings by 76-100%, 31% rated the quality of their organizations earnings % by over
100%, 16% rated the quality of their organizations earnings by 51-75% while 7% of
the respondents rated the quality of their organizations earnings by 21-50%. In 2011,
48% of the respondents rated the quality of their organizations earnings by 76-100%,
23% of the respondents rated the quality of their organizations earnings by over 100%,
20% rated the quality of their organizations earnings by 51-75% while 10% of the
respondents rated the quality of their organizations earnings by 21-50%.
On a five point scale, the average mean of the responses was 4.19 which implies that
majority of the respondents rated the quality of their organizations earnings by 76-
100%; however the answers were varied as shown by a standard deviation of 0.73.
Table 4.31: Earnings Ability influence and Financial Performance
Response Frequency Percent
No 28 39.4
Yes 43 60.6
Total 71 100
The respondents were further asked to indicate whether earnings ability influences the
financial performance of their organization. Results in table 4.31 reveal that majority
of 61% of the respondents indicated yes while 39% of the respondents indicated no.
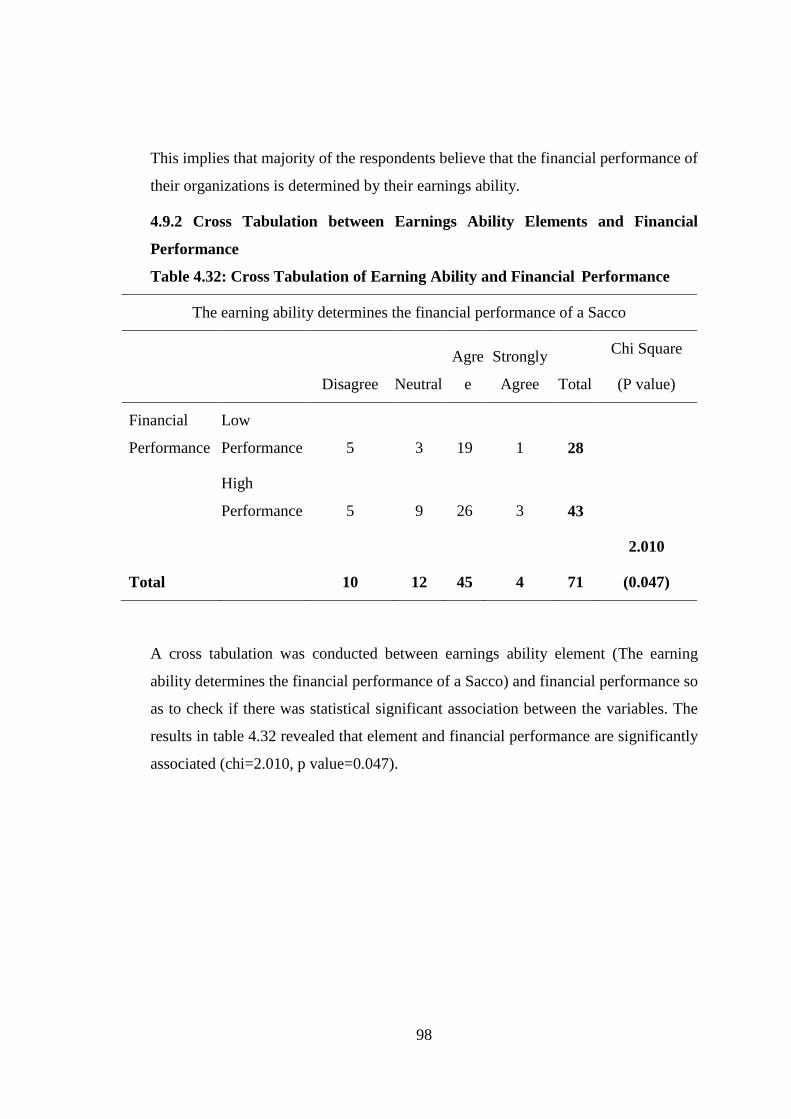
98
This implies that majority of the respondents believe that the financial performance of
their organizations is determined by their earnings ability.
4.9.2 Cross Tabulation between Earnings Ability Elements and Financial
Performance
Table 4.32: Cross Tabulation of Earning Ability and Financial Performance
The earning ability determines the financial performance of a Sacco
Disagree Neutral
Agre
e
Strongly
Agree Total
Chi Square
(P value)
Financial
Performance
Low
Performance 5 3 19 1 28
High
Performance 5 9 26 3 43
Total 10 12 45 4 71
2.010
(0.047)
A cross tabulation was conducted between earnings ability element (The earning
ability determines the financial performance of a Sacco) and financial performance so
as to check if there was statistical significant association between the variables. The
results in table 4.32 revealed that element and financial performance are significantly
associated (chi=2.010, p value=0.047).
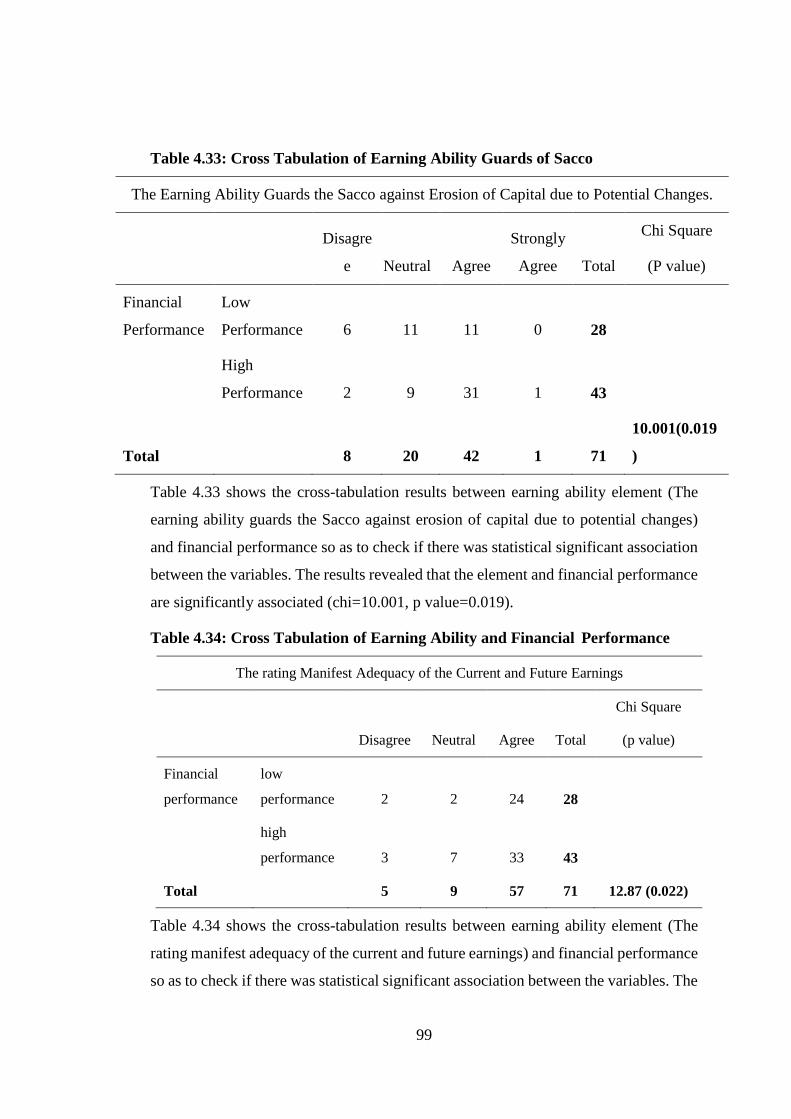
99
Table 4.33: Cross Tabulation of Earning Ability Guards of Sacco
The Earning Ability Guards the Sacco against Erosion of Capital due to Potential Changes.
Disagre
e Neutral Agree
Strongly
Agree Total
Chi Square
(P value)
Financial
Performance
Low
Performance 6 11 11 0 28
High
Performance 2 9 31 1 43
Total 8 20 42 1 71
10.001(0.019
)
Table 4.33 shows the cross-tabulation results between earning ability element (The
earning ability guards the Sacco against erosion of capital due to potential changes)
and financial performance so as to check if there was statistical significant association
between the variables. The results revealed that the element and financial performance
are significantly associated (chi=10.001, p value=0.019).
Table 4.34: Cross Tabulation of Earning Ability and Financial Performance
The rating Manifest Adequacy of the Current and Future Earnings
Disagree Neutral Agree Total
Chi Square
(p value)
Financial
performance
low
performance 2 2 24 28
high
performance 3 7 33 43
Total 5 9 57 71 12.87 (0.022)
Table 4.34 shows the cross-tabulation results between earning ability element (The
rating manifest adequacy of the current and future earnings) and financial performance
so as to check if there was statistical significant association between the variables. The

100
results revealed that the element and financial performance are significantly associated
(chi=12.87, p value=0.022).
4.9.3 Join Earnings Ability Elements and Financial Performance
Table 4.35: Regression Model of Joint Earnings Ability Elements
ROA Coef. Std.Err z P>|z| [95% Conf.Interval
Earnings Ability 6.4384 0.3271 19.68 0.000 5.7973 7.07954
cons -1.589051 0.2374 -6.69 0.000 -2.0543 -1.12384
R2 0.4631
F-statistics 387.42
P value 0.000
The specific model was;
SACCO Financial Performance = -1.5891+6.4384 earnings ability
The results presented in table 4.35 present the regression model used in explaining the
study phenomena. Jointly, earnings ability elements explained 46% of the financial
performance of SACCOs in Kenya. This is supported by coefficient of determination
also known as the R square of 46%. This means that earnings ability explain 46% of
the financial performance SACCOs in Kenya. Further, results indicate that the overall
model was statistically significant as supported by a p value of 0.000. This implies that
earnings ability is a good predictor of financial performance. This was supported by
an F statistic of 387.42 and the reported p value (0.000) which was less than the
conventional probability of 0.05 significance level.
These findings disagree with of those of Kongiri (2012), who investigated the effect
CAMEL variables on the efficiency of commercial banks. The study found that capital
adequacy, earnings and liquidity ratio have a negative relationship to efficiency ratio
while management quality and asset quality have a positive relationship. The study
mentioned that the earnings ability reflects the bank's ability to absorb losses, expand
its financing, as well as, its ability to pay dividends to its shareholders, and helps
develop an adequate amount of own capital.
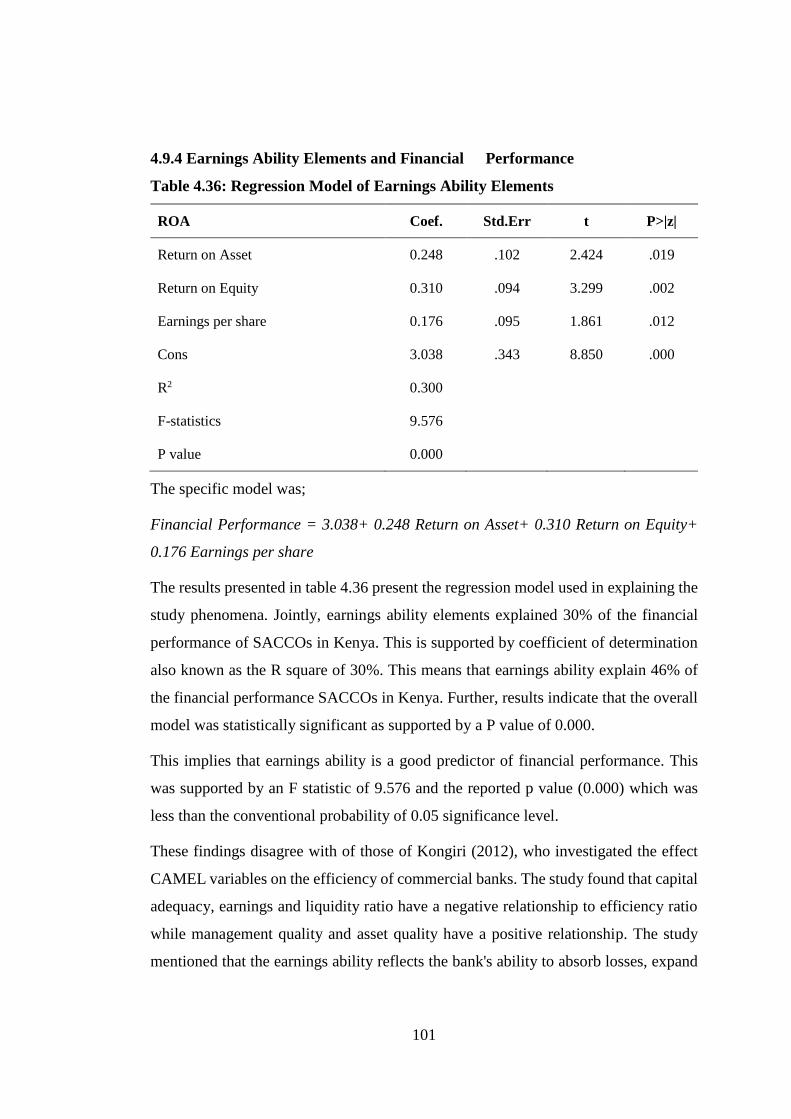
101
4.9.4 Earnings Ability Elements and Financial Performance
Table 4.36: Regression Model of Earnings Ability Elements
ROA Coef. Std.Err t P>|z|
Return on Asset 0.248 .102 2.424 .019
Return on Equity 0.310 .094 3.299 .002
Earnings per share 0.176 .095 1.861 .012
Cons 3.038 .343 8.850 .000
R2 0.300
F-statistics 9.576
P value 0.000
The specific model was;
Financial Performance = 3.038+ 0.248 Return on Asset+ 0.310 Return on Equity+
0.176 Earnings per share
The results presented in table 4.36 present the regression model used in explaining the
study phenomena. Jointly, earnings ability elements explained 30% of the financial
performance of SACCOs in Kenya. This is supported by coefficient of determination
also known as the R square of 30%. This means that earnings ability explain 46% of
the financial performance SACCOs in Kenya. Further, results indicate that the overall
model was statistically significant as supported by a P value of 0.000.
This implies that earnings ability is a good predictor of financial performance. This
was supported by an F statistic of 9.576 and the reported p value (0.000) which was
less than the conventional probability of 0.05 significance level.
These findings disagree with of those of Kongiri (2012), who investigated the effect
CAMEL variables on the efficiency of commercial banks. The study found that capital
adequacy, earnings and liquidity ratio have a negative relationship to efficiency ratio
while management quality and asset quality have a positive relationship. The study
mentioned that the earnings ability reflects the bank's ability to absorb losses, expand
102
its financing, as well as, its ability to pay dividends to its shareholders, and helps
develop an adequate amount of own capital.
4.9.5 Hypothesis Testing
The hypothesis was tested by using the ordinary least square regression. The
acceptance/rejection criteria was that, if the p value is less than the conventional p
value (0.05), the H 04 is rejected but if it more than 0.05, the H 04 fails to be rejected.
The null hypothesis was that earnings ability has no statistical significant effect on
financial performance of savings and credit societies in Kenya. Results in Table 4.36
above show that the p value was less than the conventional p value (p=0.05). This
indicated that the null hypothesis was rejected hence earnings ability had a statistical
significant effect on financial performance of savings and credit societies in Kenya.
4.10 Effect of Liquidity and Financial Performance of SACCOs
This section includes descriptive statistics, cross tabulation and regression analysis
relating to liquidity and financial performance of SACCOs.
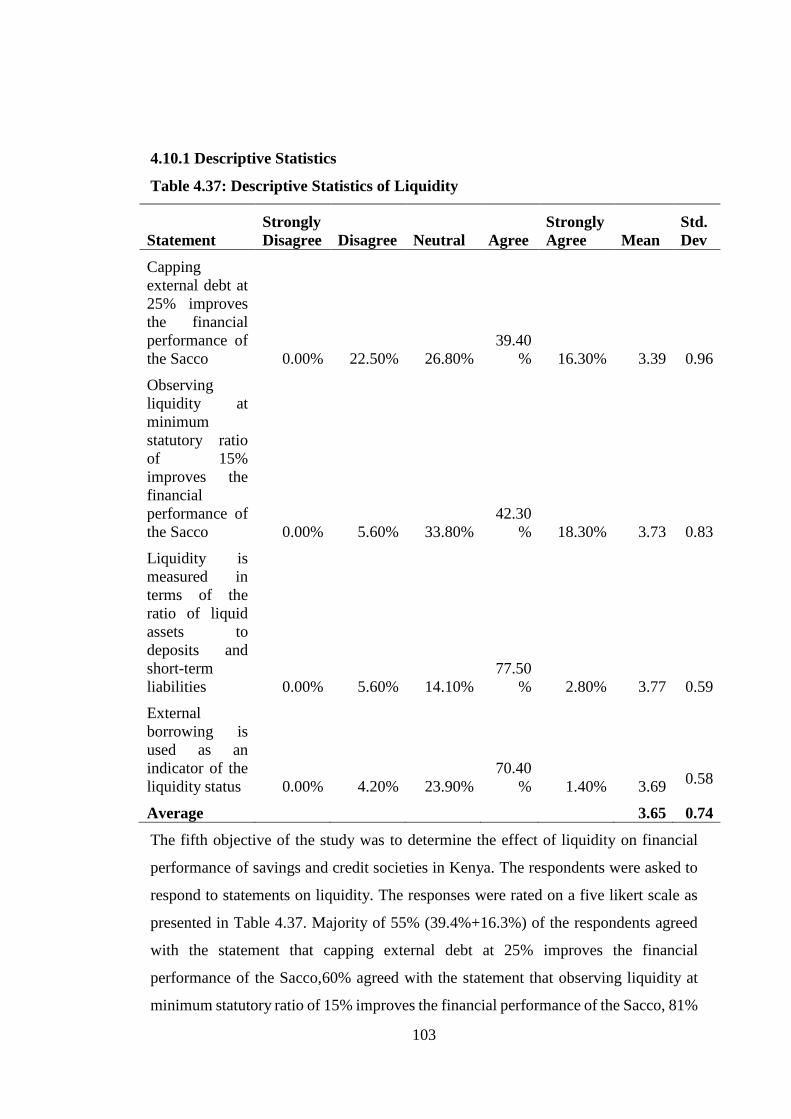
103
4.10.1 Descriptive Statistics
Table 4.37: Descriptive Statistics of Liquidity
Statement
Strongly
Disagree Disagree Neutral Agree
Strongly
Agree Mean
Std.
Dev
Capping
external debt at
25% improves
the financial
performance of
the Sacco 0.00% 22.50% 26.80%
39.40
% 16.30% 3.39 0.96
Observing
liquidity at
minimum
statutory ratio
of 15%
improves the
financial
performance of
the Sacco 0.00% 5.60% 33.80%
42.30
% 18.30% 3.73 0.83
Liquidity is
measured in
terms of the
ratio of liquid
assets to
deposits and
short-term
liabilities 0.00% 5.60% 14.10%
77.50
% 2.80% 3.77 0.59
External
borrowing is
used as an
indicator of the
liquidity status 0.00% 4.20% 23.90%
70.40
% 1.40% 3.69 0.58
Average 3.65 0.74
The fifth objective of the study was to determine the effect of liquidity on financial
performance of savings and credit societies in Kenya. The respondents were asked to
respond to statements on liquidity. The responses were rated on a five likert scale as
presented in Table 4.37. Majority of 55% (39.4%+16.3%) of the respondents agreed
with the statement that capping external debt at 25% improves the financial
performance of the Sacco,60% agreed with the statement that observing liquidity at
minimum statutory ratio of 15% improves the financial performance of the Sacco, 81%
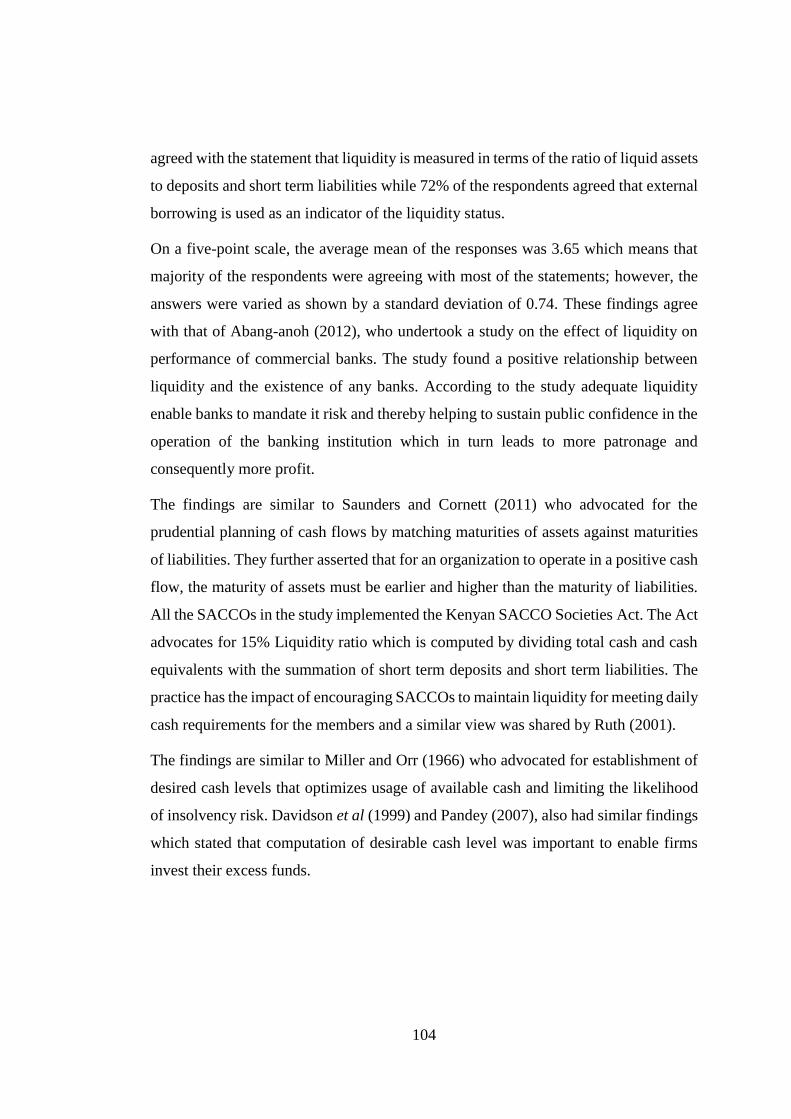
104
agreed with the statement that liquidity is measured in terms of the ratio of liquid assets
to deposits and short term liabilities while 72% of the respondents agreed that external
borrowing is used as an indicator of the liquidity status.
On a five-point scale, the average mean of the responses was 3.65 which means that
majority of the respondents were agreeing with most of the statements; however, the
answers were varied as shown by a standard deviation of 0.74. These findings agree
with that of Abang-anoh (2012), who undertook a study on the effect of liquidity on
performance of commercial banks. The study found a positive relationship between
liquidity and the existence of any banks. According to the study adequate liquidity
enable banks to mandate it risk and thereby helping to sustain public confidence in the
operation of the banking institution which in turn leads to more patronage and
consequently more profit.
The findings are similar to Saunders and Cornett (2011) who advocated for the
prudential planning of cash flows by matching maturities of assets against maturities
of liabilities. They further asserted that for an organization to operate in a positive cash
flow, the maturity of assets must be earlier and higher than the maturity of liabilities.
All the SACCOs in the study implemented the Kenyan SACCO Societies Act. The Act
advocates for 15% Liquidity ratio which is computed by dividing total cash and cash
equivalents with the summation of short term deposits and short term liabilities. The
practice has the impact of encouraging SACCOs to maintain liquidity for meeting daily
cash requirements for the members and a similar view was shared by Ruth (2001).
The findings are similar to Miller and Orr (1966) who advocated for establishment of
desired cash levels that optimizes usage of available cash and limiting the likelihood
of insolvency risk. Davidson et al (1999) and Pandey (2007), also had similar findings
which stated that computation of desirable cash level was important to enable firms
invest their excess funds.

105
Table 4.38: Liquidity Response Rate
Response Frequency Percent
No 39 54.9
Yes 32 45.1
Total 71 100
The respondents were asked to indicate whether their organizations possess adequate
liquidity to meet their obligations as and when they fall due. Results in table 4.38 reveal
that majority of 55% of the respondents indicated no while 45% of the respondents
indicated yes. This implies that majority of the SACCOs do not have adequate liquidity
to meet their financial obligations. This implies that most organizations experience
liquidity problems.
Table 4.39: Influence of Liquidity on Financial Performance
Response Frequency Percent
No 41 57.7
Yes 30 42.3
Total 71 100
The respondents were further asked to indicate whether the level of liquidity influences
their organization’s performance. Results in table 4.39 reveal that majority of 58% of
the respondents indicated no while 42% of the respondents indicated yes. This implies
that most of the respondents do not think that their level of liquidity has a significant
impact on their organizations’ performance.
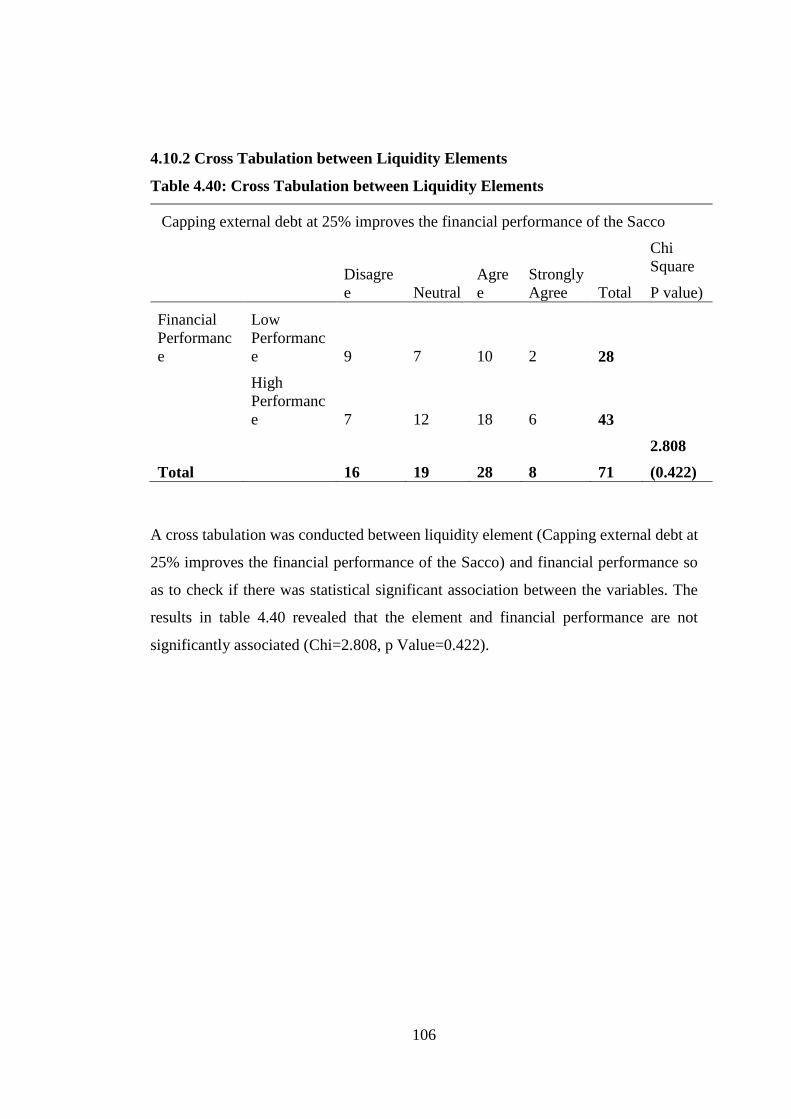
106
4.10.2 Cross Tabulation between Liquidity Elements
Table 4.40: Cross Tabulation between Liquidity Elements
Capping external debt at 25% improves the financial performance of the Sacco
Disagre
e Neutral
Agre
e
Strongly
Agree Total
Chi
Square
P value)
Financial
Performanc
e
Low
Performanc
e 9 7 10 2 28
High
Performanc
e 7 12 18 6 43
Total 16 19 28 8 71
2.808
(0.422)
A cross tabulation was conducted between liquidity element (Capping external debt at
25% improves the financial performance of the Sacco) and financial performance so
as to check if there was statistical significant association between the variables. The
results in table 4.40 revealed that the element and financial performance are not
significantly associated (Chi=2.808, p Value=0.422).
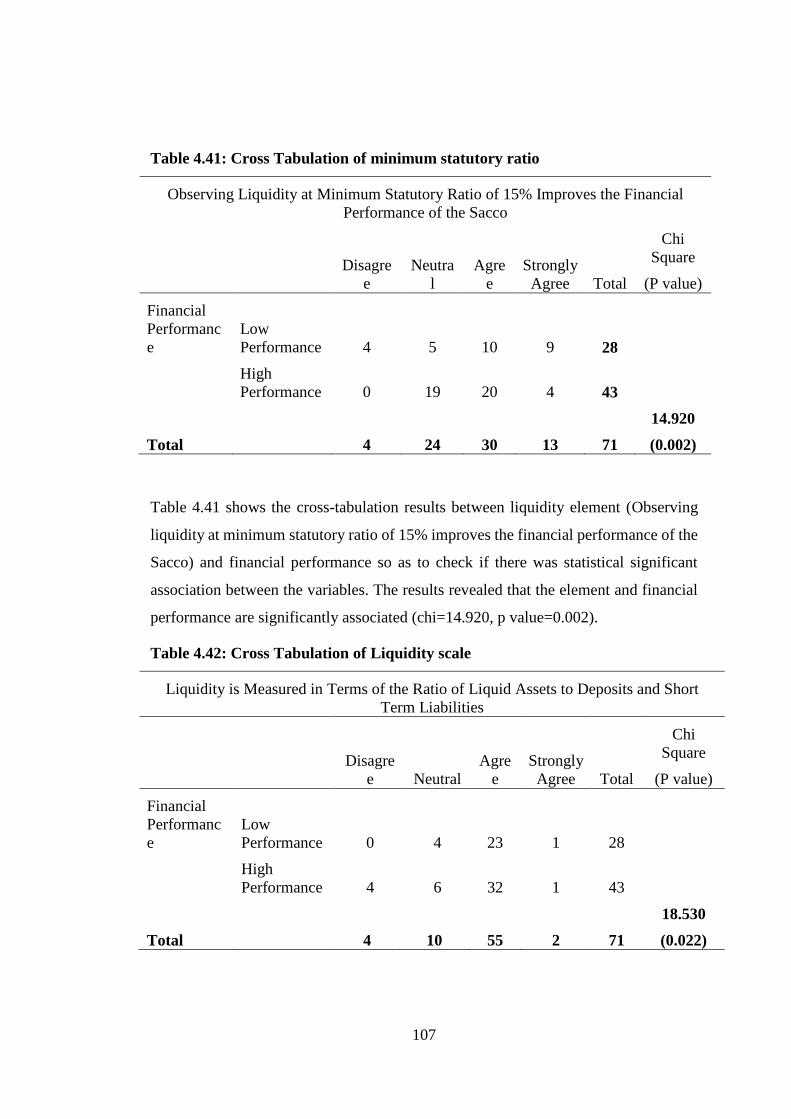
107
Table 4.41: Cross Tabulation of minimum statutory ratio
Observing Liquidity at Minimum Statutory Ratio of 15% Improves the Financial
Performance of the Sacco
Disagre
e
Neutra
l
Agre
e
Strongly
Agree Total
Chi
Square
(P value)
Financial
Performanc
e
Low
Performance 4 5 10 9 28
High
Performance 0 19 20 4 43
Total 4 24 30 13 71
14.920
(0.002)
Table 4.41 shows the cross-tabulation results between liquidity element (Observing
liquidity at minimum statutory ratio of 15% improves the financial performance of the
Sacco) and financial performance so as to check if there was statistical significant
association between the variables. The results revealed that the element and financial
performance are significantly associated (chi=14.920, p value=0.002).
Table 4.42: Cross Tabulation of Liquidity scale
Liquidity is Measured in Terms of the Ratio of Liquid Assets to Deposits and Short
Term Liabilities
Disagre
e Neutral
Agre
e
Strongly
Agree Total
Chi
Square
(P value)
Financial
Performanc
e
Low
Performance 0 4 23 1 28
High
Performance 4 6 32 1 43
Total 4 10 55 2 71
18.530
(0.022)
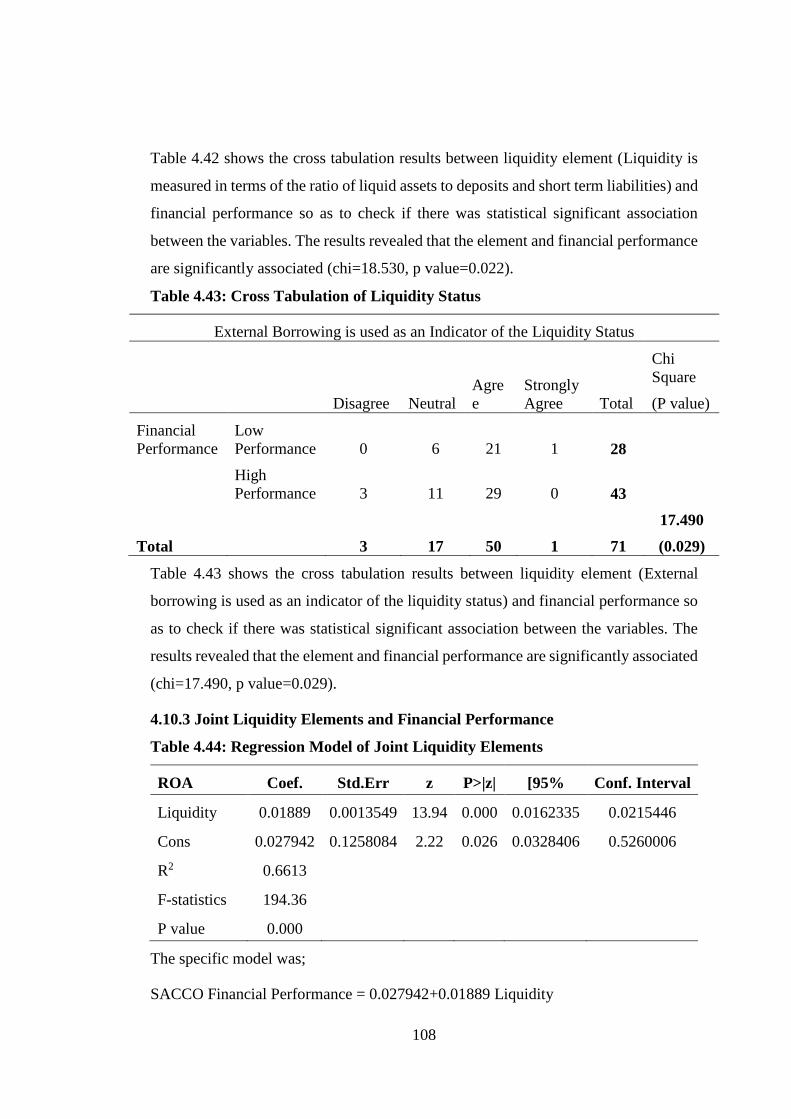
108
Table 4.42 shows the cross tabulation results between liquidity element (Liquidity is
measured in terms of the ratio of liquid assets to deposits and short term liabilities) and
financial performance so as to check if there was statistical significant association
between the variables. The results revealed that the element and financial performance
are significantly associated (chi=18.530, p value=0.022).
Table 4.43: Cross Tabulation of Liquidity Status
External Borrowing is used as an Indicator of the Liquidity Status
Disagree Neutral
Agre
e
Strongly
Agree Total
Chi
Square
(P value)
Financial
Performance
Low
Performance 0 6 21 1 28
High
Performance 3 11 29 0 43
Total 3 17 50 1 71
17.490
(0.029)
Table 4.43 shows the cross tabulation results between liquidity element (External
borrowing is used as an indicator of the liquidity status) and financial performance so
as to check if there was statistical significant association between the variables. The
results revealed that the element and financial performance are significantly associated
(chi=17.490, p value=0.029).
4.10.3 Joint Liquidity Elements and Financial Performance
Table 4.44: Regression Model of Joint Liquidity Elements
ROA Coef. Std.Err z P>|z| [95% Conf. Interval
Liquidity 0.01889 0.0013549 13.94 0.000 0.0162335 0.0215446
Cons 0.027942 0.1258084 2.22 0.026 0.0328406 0.5260006
R2 0.6613
F-statistics 194.36
P value 0.000
The specific model was;
SACCO Financial Performance = 0.027942+0.01889 Liquidity
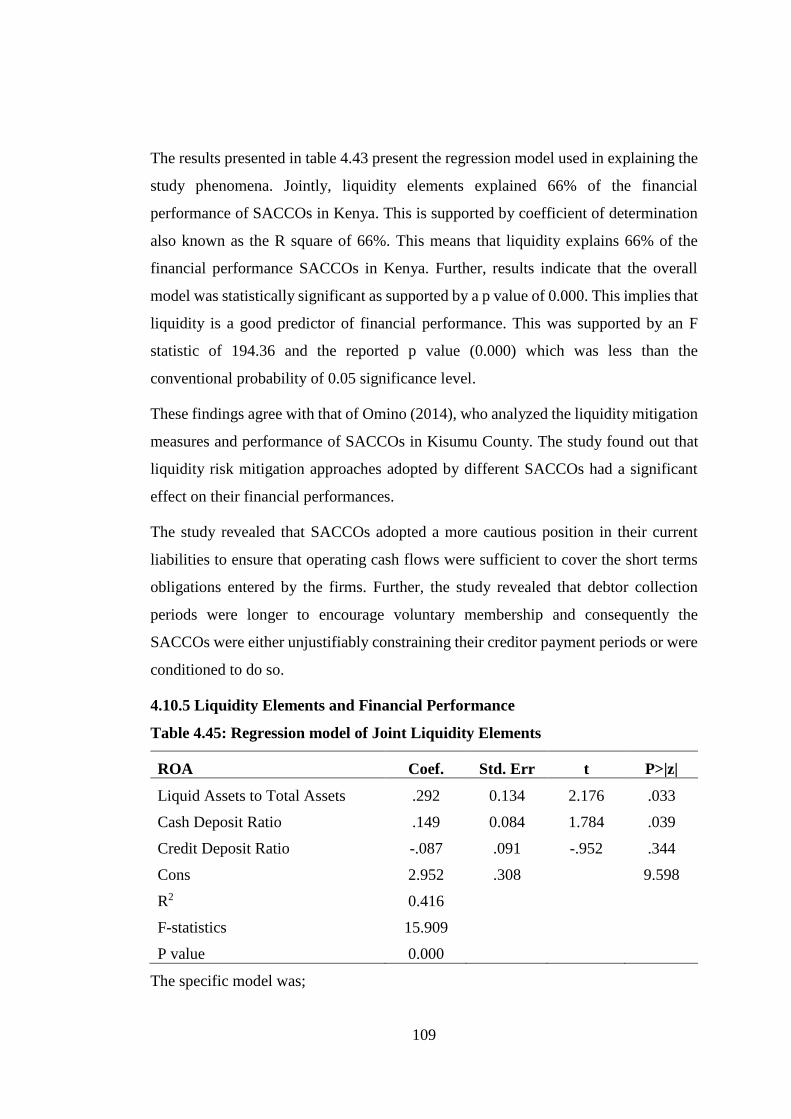
109
The results presented in table 4.43 present the regression model used in explaining the
study phenomena. Jointly, liquidity elements explained 66% of the financial
performance of SACCOs in Kenya. This is supported by coefficient of determination
also known as the R square of 66%. This means that liquidity explains 66% of the
financial performance SACCOs in Kenya. Further, results indicate that the overall
model was statistically significant as supported by a p value of 0.000. This implies that
liquidity is a good predictor of financial performance. This was supported by an F
statistic of 194.36 and the reported p value (0.000) which was less than the
conventional probability of 0.05 significance level.
These findings agree with that of Omino (2014), who analyzed the liquidity mitigation
measures and performance of SACCOs in Kisumu County. The study found out that
liquidity risk mitigation approaches adopted by different SACCOs had a significant
effect on their financial performances.
The study revealed that SACCOs adopted a more cautious position in their current
liabilities to ensure that operating cash flows were sufficient to cover the short terms
obligations entered by the firms. Further, the study revealed that debtor collection
periods were longer to encourage voluntary membership and consequently the
SACCOs were either unjustifiably constraining their creditor payment periods or were
conditioned to do so.
4.10.5 Liquidity Elements and Financial Performance
Table 4.45: Regression model of Joint Liquidity Elements
ROA Coef. Std. Err t P>|z|
Liquid Assets to Total Assets .292 0.134 2.176 .033
Cash Deposit Ratio .149 0.084 1.784 .039
Credit Deposit Ratio -.087 .091 -.952 .344
Cons 2.952 .308
9.598
R2 0.416
F-statistics 15.909
P value 0.000
The specific model was;
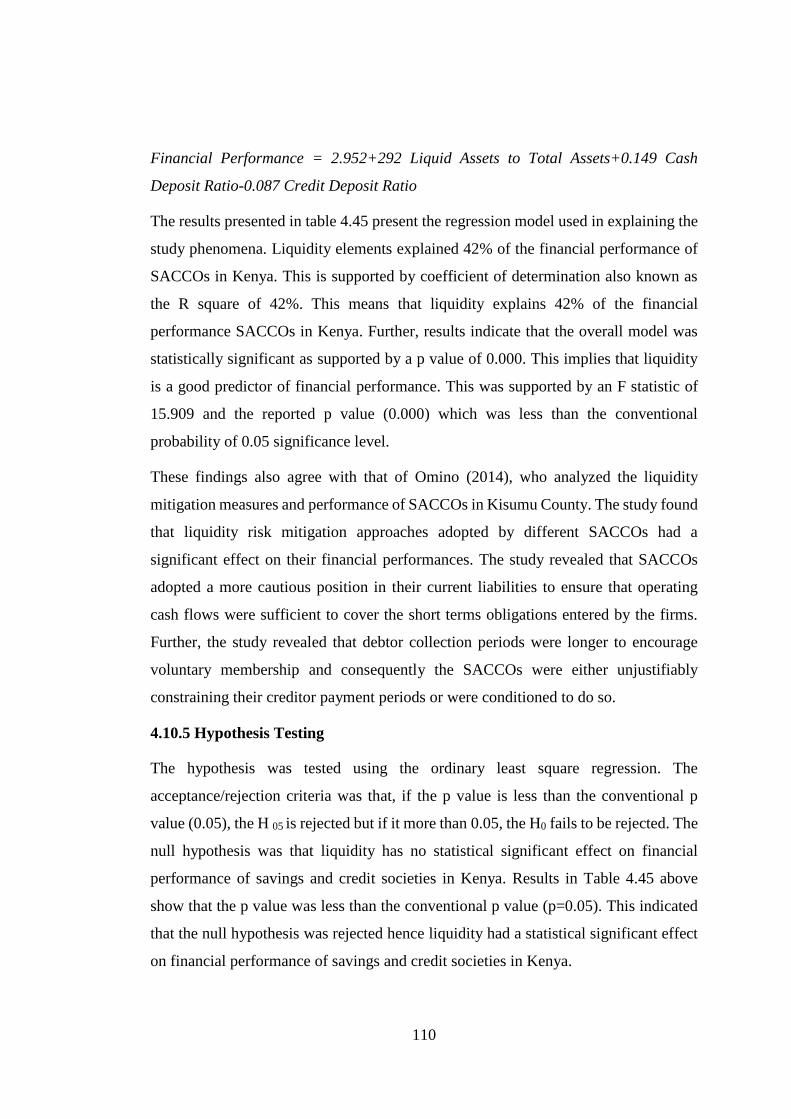
110
Financial Performance = 2.952+292 Liquid Assets to Total Assets+0.149 Cash
Deposit Ratio-0.087 Credit Deposit Ratio
The results presented in table 4.45 present the regression model used in explaining the
study phenomena. Liquidity elements explained 42% of the financial performance of
SACCOs in Kenya. This is supported by coefficient of determination also known as
the R square of 42%. This means that liquidity explains 42% of the financial
performance SACCOs in Kenya. Further, results indicate that the overall model was
statistically significant as supported by a p value of 0.000. This implies that liquidity
is a good predictor of financial performance. This was supported by an F statistic of
15.909 and the reported p value (0.000) which was less than the conventional
probability of 0.05 significance level.
These findings also agree with that of Omino (2014), who analyzed the liquidity
mitigation measures and performance of SACCOs in Kisumu County. The study found
that liquidity risk mitigation approaches adopted by different SACCOs had a
significant effect on their financial performances. The study revealed that SACCOs
adopted a more cautious position in their current liabilities to ensure that operating
cash flows were sufficient to cover the short terms obligations entered by the firms.
Further, the study revealed that debtor collection periods were longer to encourage
voluntary membership and consequently the SACCOs were either unjustifiably
constraining their creditor payment periods or were conditioned to do so.
4.10.5 Hypothesis Testing
The hypothesis was tested using the ordinary least square regression. The
acceptance/rejection criteria was that, if the p value is less than the conventional p
value (0.05), the H 05 is rejected but if it more than 0.05, the H0 fails to be rejected. The
null hypothesis was that liquidity has no statistical significant effect on financial
performance of savings and credit societies in Kenya. Results in Table 4.45 above
show that the p value was less than the conventional p value (p=0.05). This indicated
that the null hypothesis was rejected hence liquidity had a statistical significant effect
on financial performance of savings and credit societies in Kenya.
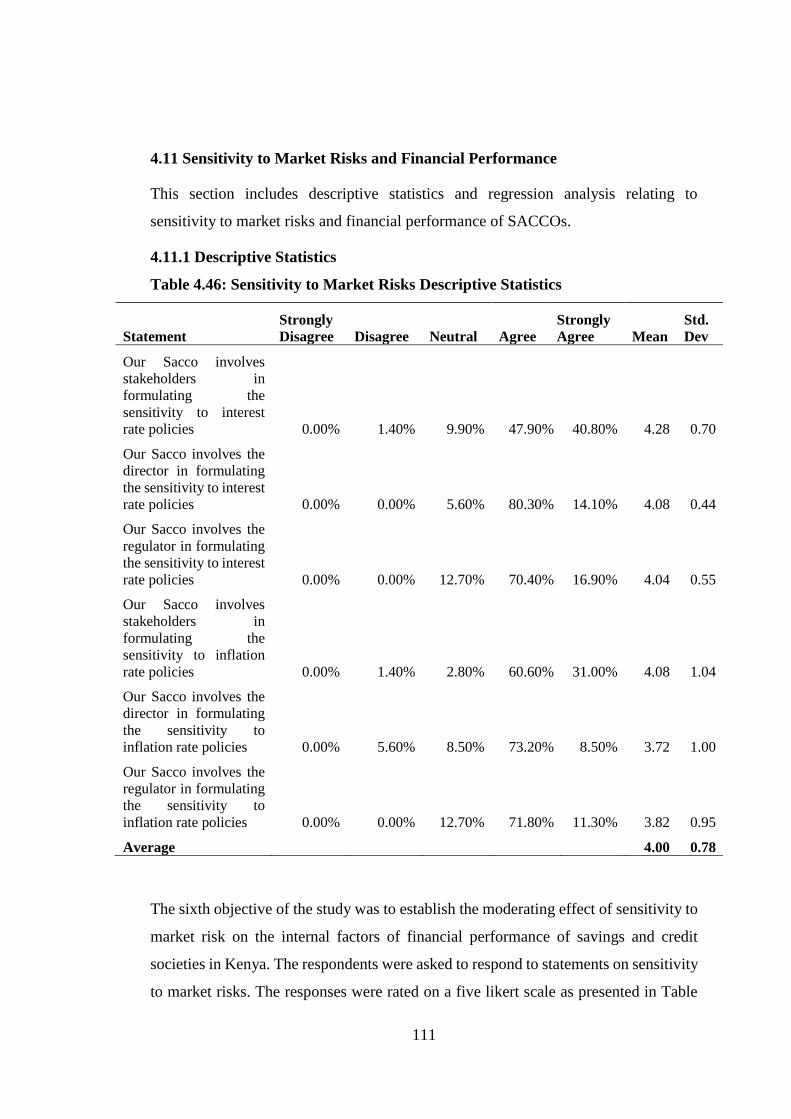
111
4.11 Sensitivity to Market Risks and Financial Performance
This section includes descriptive statistics and regression analysis relating to
sensitivity to market risks and financial performance of SACCOs.
4.11.1 Descriptive Statistics
Table 4.46: Sensitivity to Market Risks Descriptive Statistics
Statement
Strongly
Disagree Disagree Neutral Agree
Strongly
Agree Mean
Std.
Dev
Our Sacco involves
stakeholders in
formulating the
sensitivity to interest
rate policies 0.00% 1.40% 9.90% 47.90% 40.80% 4.28 0.70
Our Sacco involves the
director in formulating
the sensitivity to interest
rate policies 0.00% 0.00% 5.60% 80.30% 14.10% 4.08 0.44
Our Sacco involves the
regulator in formulating
the sensitivity to interest
rate policies 0.00% 0.00% 12.70% 70.40% 16.90% 4.04 0.55
Our Sacco involves
stakeholders in
formulating the
sensitivity to inflation
rate policies 0.00% 1.40% 2.80% 60.60% 31.00% 4.08 1.04
Our Sacco involves the
director in formulating
the sensitivity to
inflation rate policies 0.00% 5.60% 8.50% 73.20% 8.50% 3.72 1.00
Our Sacco involves the
regulator in formulating
the sensitivity to
inflation rate policies 0.00% 0.00% 12.70% 71.80% 11.30% 3.82 0.95
Average 4.00 0.78
The sixth objective of the study was to establish the moderating effect of sensitivity to
market risk on the internal factors of financial performance of savings and credit
societies in Kenya. The respondents were asked to respond to statements on sensitivity
to market risks. The responses were rated on a five likert scale as presented in Table
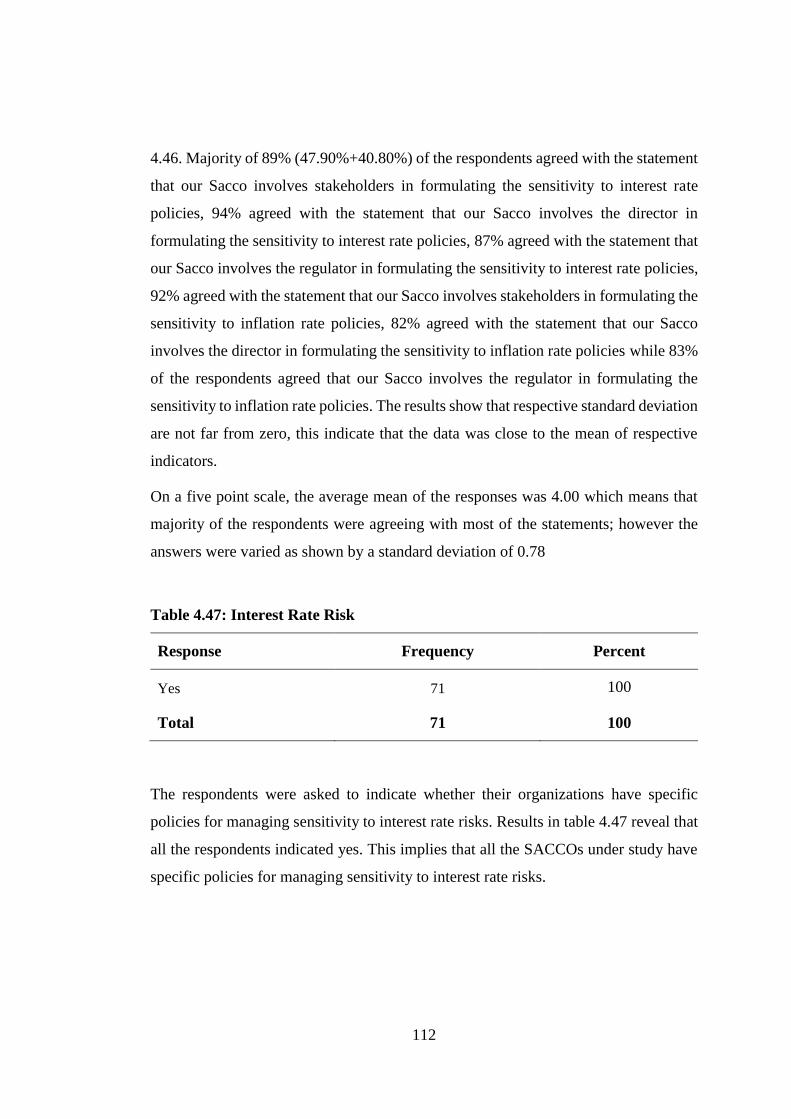
112
4.46. Majority of 89% (47.90%+40.80%) of the respondents agreed with the statement
that our Sacco involves stakeholders in formulating the sensitivity to interest rate
policies, 94% agreed with the statement that our Sacco involves the director in
formulating the sensitivity to interest rate policies, 87% agreed with the statement that
our Sacco involves the regulator in formulating the sensitivity to interest rate policies,
92% agreed with the statement that our Sacco involves stakeholders in formulating the
sensitivity to inflation rate policies, 82% agreed with the statement that our Sacco
involves the director in formulating the sensitivity to inflation rate policies while 83%
of the respondents agreed that our Sacco involves the regulator in formulating the
sensitivity to inflation rate policies. The results show that respective standard deviation
are not far from zero, this indicate that the data was close to the mean of respective
indicators.
On a five point scale, the average mean of the responses was 4.00 which means that
majority of the respondents were agreeing with most of the statements; however the
answers were varied as shown by a standard deviation of 0.78
Table 4.47: Interest Rate Risk
Response Frequency Percent
Yes 71 100
Total 71 100
The respondents were asked to indicate whether their organizations have specific
policies for managing sensitivity to interest rate risks. Results in table 4.47 reveal that
all the respondents indicated yes. This implies that all the SACCOs under study have
specific policies for managing sensitivity to interest rate risks.
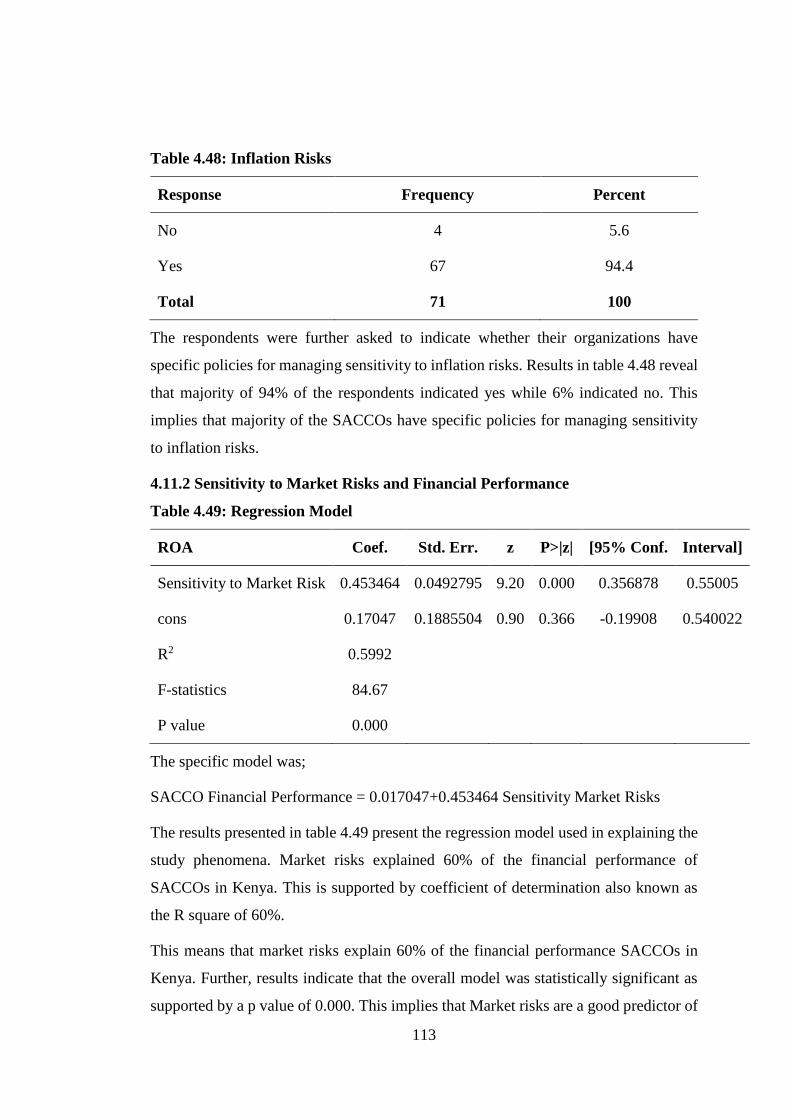
113
Table 4.48: Inflation Risks
Response Frequency Percent
No 4 5.6
Yes 67 94.4
Total 71 100
The respondents were further asked to indicate whether their organizations have
specific policies for managing sensitivity to inflation risks. Results in table 4.48 reveal
that majority of 94% of the respondents indicated yes while 6% indicated no. This
implies that majority of the SACCOs have specific policies for managing sensitivity
to inflation risks.
4.11.2 Sensitivity to Market Risks and Financial Performance
Table 4.49: Regression Model
ROA Coef. Std. Err. z P>|z| [95% Conf. Interval]
Sensitivity to Market Risk 0.453464 0.0492795 9.20 0.000 0.356878 0.55005
cons 0.17047 0.1885504 0.90 0.366 -0.19908 0.540022
R2 0.5992
F-statistics 84.67
P value 0.000
The specific model was;
SACCO Financial Performance = 0.017047+0.453464 Sensitivity Market Risks
The results presented in table 4.49 present the regression model used in explaining the
study phenomena. Market risks explained 60% of the financial performance of
SACCOs in Kenya. This is supported by coefficient of determination also known as
the R square of 60%.
This means that market risks explain 60% of the financial performance SACCOs in
Kenya. Further, results indicate that the overall model was statistically significant as
supported by a p value of 0.000. This implies that Market risks are a good predictor of
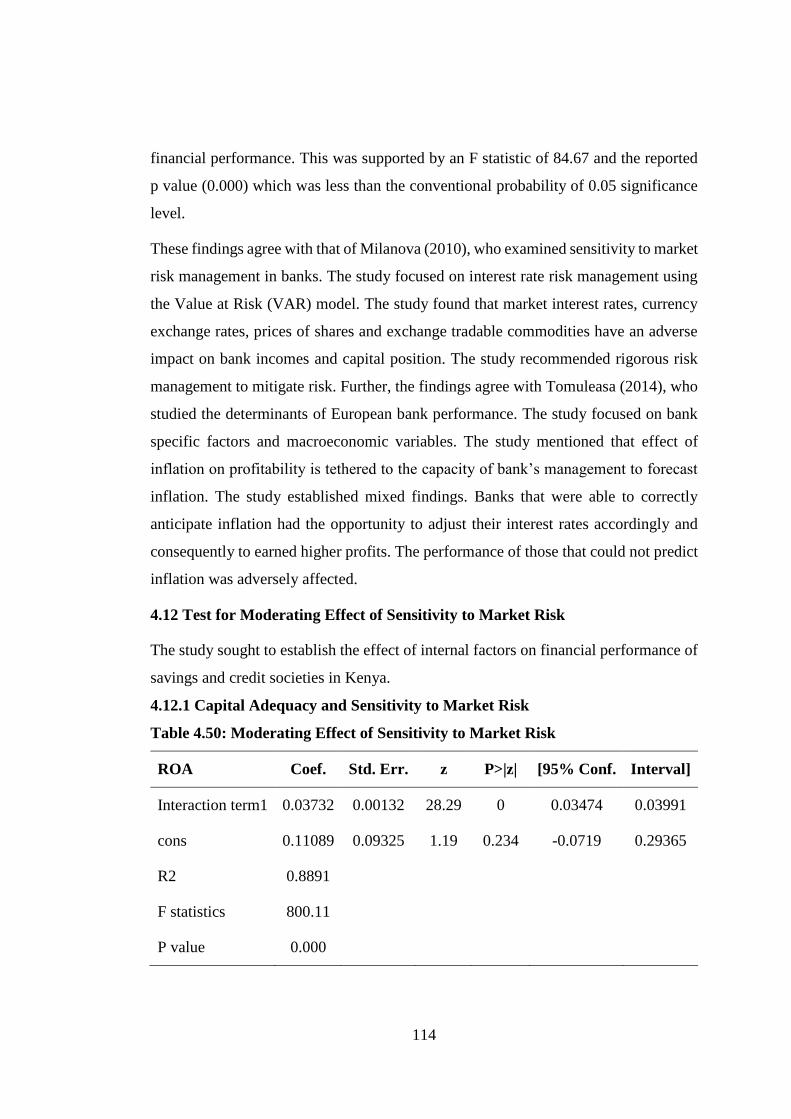
114
financial performance. This was supported by an F statistic of 84.67 and the reported
p value (0.000) which was less than the conventional probability of 0.05 significance
level.
These findings agree with that of Milanova (2010), who examined sensitivity to market
risk management in banks. The study focused on interest rate risk management using
the Value at Risk (VAR) model. The study found that market interest rates, currency
exchange rates, prices of shares and exchange tradable commodities have an adverse
impact on bank incomes and capital position. The study recommended rigorous risk
management to mitigate risk. Further, the findings agree with Tomuleasa (2014), who
studied the determinants of European bank performance. The study focused on bank
specific factors and macroeconomic variables. The study mentioned that effect of
inflation on profitability is tethered to the capacity of bank’s management to forecast
inflation. The study established mixed findings. Banks that were able to correctly
anticipate inflation had the opportunity to adjust their interest rates accordingly and
consequently to earned higher profits. The performance of those that could not predict
inflation was adversely affected.
4.12 Test for Moderating Effect of Sensitivity to Market Risk
The study sought to establish the effect of internal factors on financial performance of
savings and credit societies in Kenya.
4.12.1 Capital Adequacy and Sensitivity to Market Risk
Table 4.50: Moderating Effect of Sensitivity to Market Risk
ROA Coef. Std. Err. z P>|z| [95% Conf. Interval]
Interaction term1 0.03732 0.00132 28.29 0 0.03474 0.03991
cons 0.11089 0.09325 1.19 0.234 -0.0719 0.29365
R2 0.8891
F statistics 800.11
P value 0.000
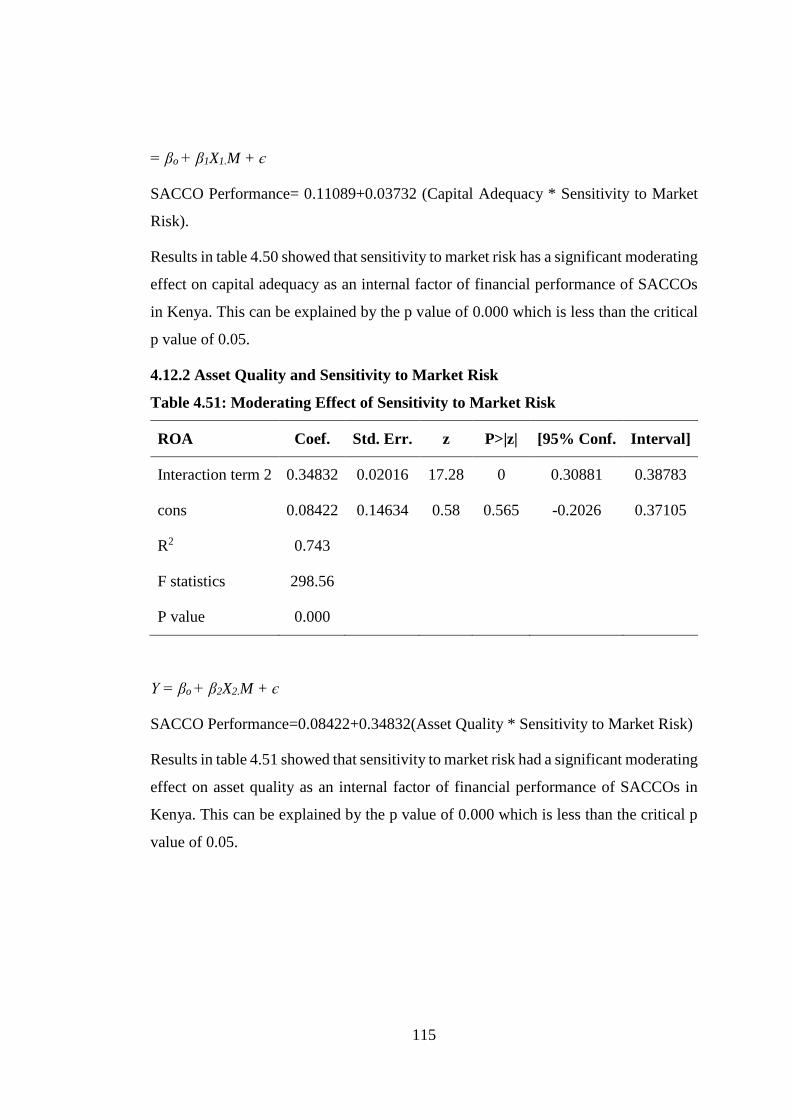
115
= βo + β1X1.M + є
SACCO Performance= 0.11089+0.03732 (Capital Adequacy * Sensitivity to Market
Risk).
Results in table 4.50 showed that sensitivity to market risk has a significant moderating
effect on capital adequacy as an internal factor of financial performance of SACCOs
in Kenya. This can be explained by the p value of 0.000 which is less than the critical
p value of 0.05.
4.12.2 Asset Quality and Sensitivity to Market Risk
Table 4.51: Moderating Effect of Sensitivity to Market Risk
ROA Coef. Std. Err. z P>|z| [95% Conf. Interval]
Interaction term 2 0.34832 0.02016 17.28 0 0.30881 0.38783
cons 0.08422 0.14634 0.58 0.565 -0.2026 0.37105
R2 0.743
F statistics 298.56
P value 0.000
Y = βo + β2X2.M + є
SACCO Performance=0.08422+0.34832(Asset Quality * Sensitivity to Market Risk)
Results in table 4.51 showed that sensitivity to market risk had a significant moderating
effect on asset quality as an internal factor of financial performance of SACCOs in
Kenya. This can be explained by the p value of 0.000 which is less than the critical p
value of 0.05.
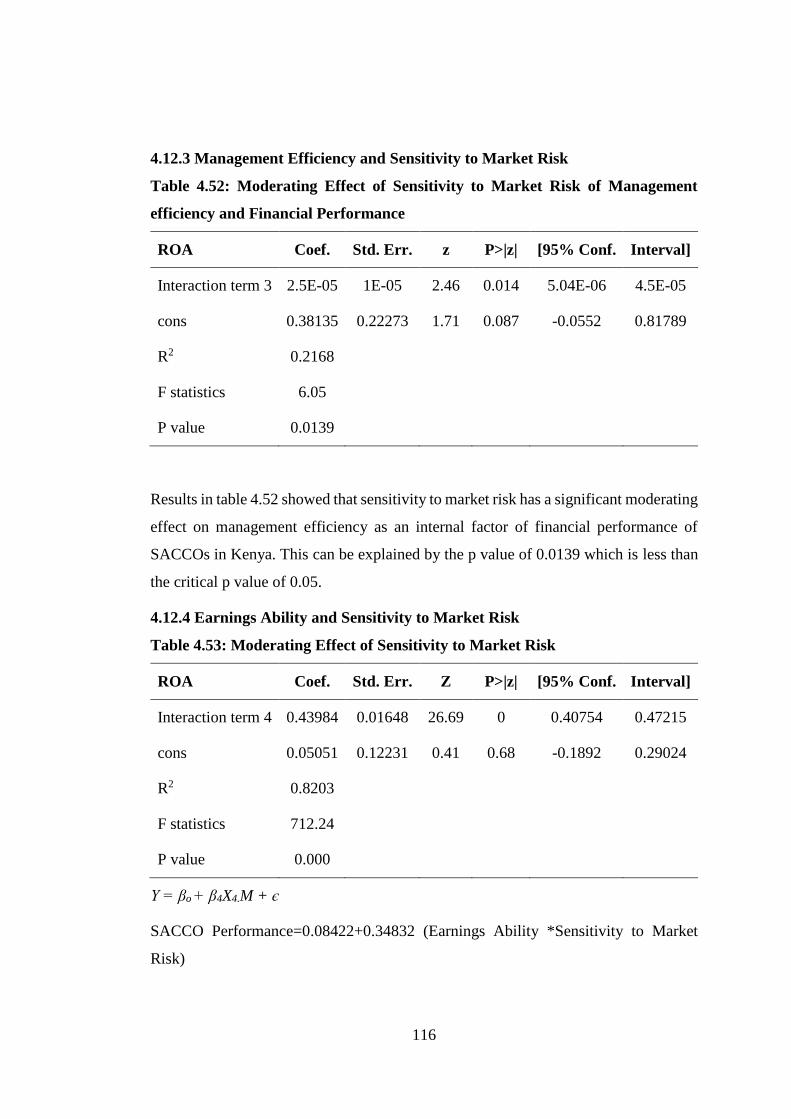
116
4.12.3 Management Efficiency and Sensitivity to Market Risk
Table 4.52: Moderating Effect of Sensitivity to Market Risk of Management
efficiency and Financial Performance
ROA Coef. Std. Err. z P>|z| [95% Conf. Interval]
Interaction term 3 2.5E-05 1E-05 2.46 0.014 5.04E-06 4.5E-05
cons 0.38135 0.22273 1.71 0.087 -0.0552 0.81789
R2 0.2168
F statistics 6.05
P value 0.0139
Results in table 4.52 showed that sensitivity to market risk has a significant moderating
effect on management efficiency as an internal factor of financial performance of
SACCOs in Kenya. This can be explained by the p value of 0.0139 which is less than
the critical p value of 0.05.
4.12.4 Earnings Ability and Sensitivity to Market Risk
Table 4.53: Moderating Effect of Sensitivity to Market Risk
ROA Coef. Std. Err. Z P>|z| [95% Conf. Interval]
Interaction term 4 0.43984 0.01648 26.69 0 0.40754 0.47215
cons 0.05051 0.12231 0.41 0.68 -0.1892 0.29024
R2 0.8203
F statistics 712.24
P value 0.000
Y = βo + β4X4.M + є
SACCO Performance=0.08422+0.34832 (Earnings Ability *Sensitivity to Market
Risk)
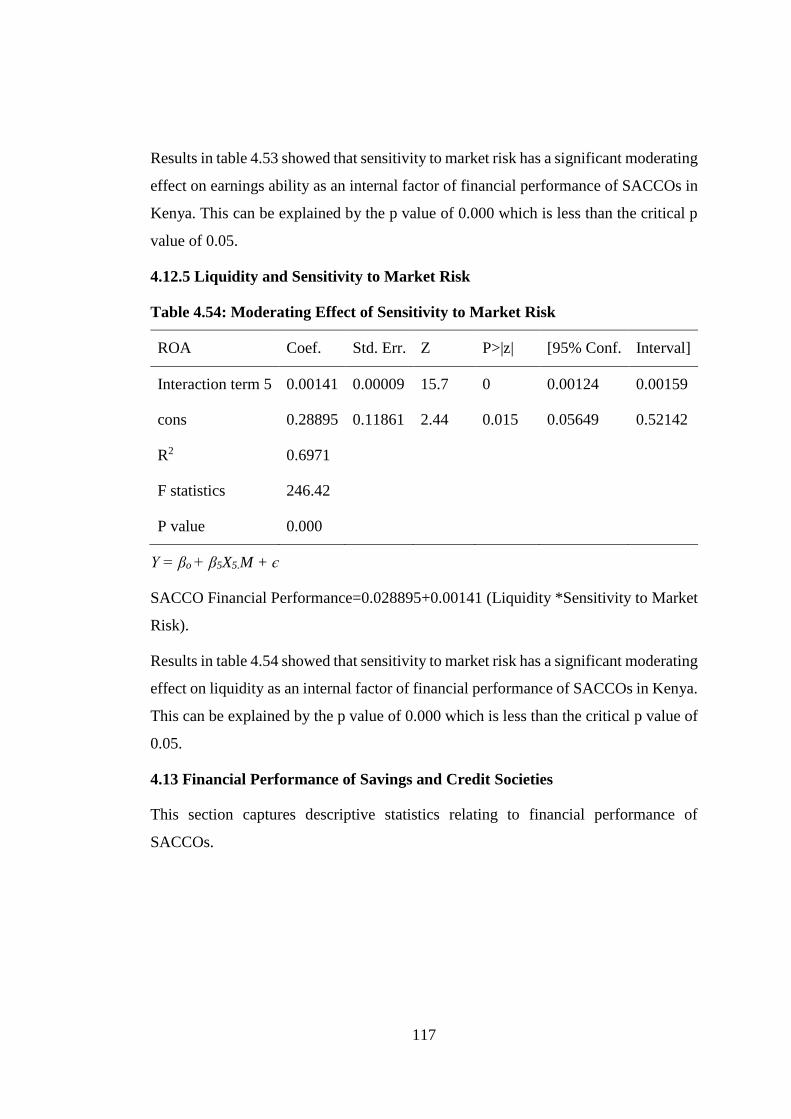
117
Results in table 4.53 showed that sensitivity to market risk has a significant moderating
effect on earnings ability as an internal factor of financial performance of SACCOs in
Kenya. This can be explained by the p value of 0.000 which is less than the critical p
value of 0.05.
4.12.5 Liquidity and Sensitivity to Market Risk
Table 4.54: Moderating Effect of Sensitivity to Market Risk
ROA Coef. Std. Err. Z P>|z| [95% Conf. Interval]
Interaction term 5 0.00141 0.00009 15.7 0 0.00124 0.00159
cons 0.28895 0.11861 2.44 0.015 0.05649 0.52142
R2 0.6971
F statistics 246.42
P value 0.000
Y = βo + β5X5.M + є
SACCO Financial Performance=0.028895+0.00141 (Liquidity *Sensitivity to Market
Risk).
Results in table 4.54 showed that sensitivity to market risk has a significant moderating
effect on liquidity as an internal factor of financial performance of SACCOs in Kenya.
This can be explained by the p value of 0.000 which is less than the critical p value of
0.05.
4.13 Financial Performance of Savings and Credit Societies
This section captures descriptive statistics relating to financial performance of
SACCOs.

118
4.13.1 Descriptive Statistics
Table 4.55: Profit Making
Response Frequency Percent
No 1 1.4
Yes 70 98.6
Total 71 100
The respondents were asked to indicate whether their organizations have been making
profits and results in table 4.55 reveal that majority of 99 % of the respondents
indicated yes while only 1% of the respondents indicated no, this implies that majority
of the SACCOs have been making profit for the period they have been in existence.
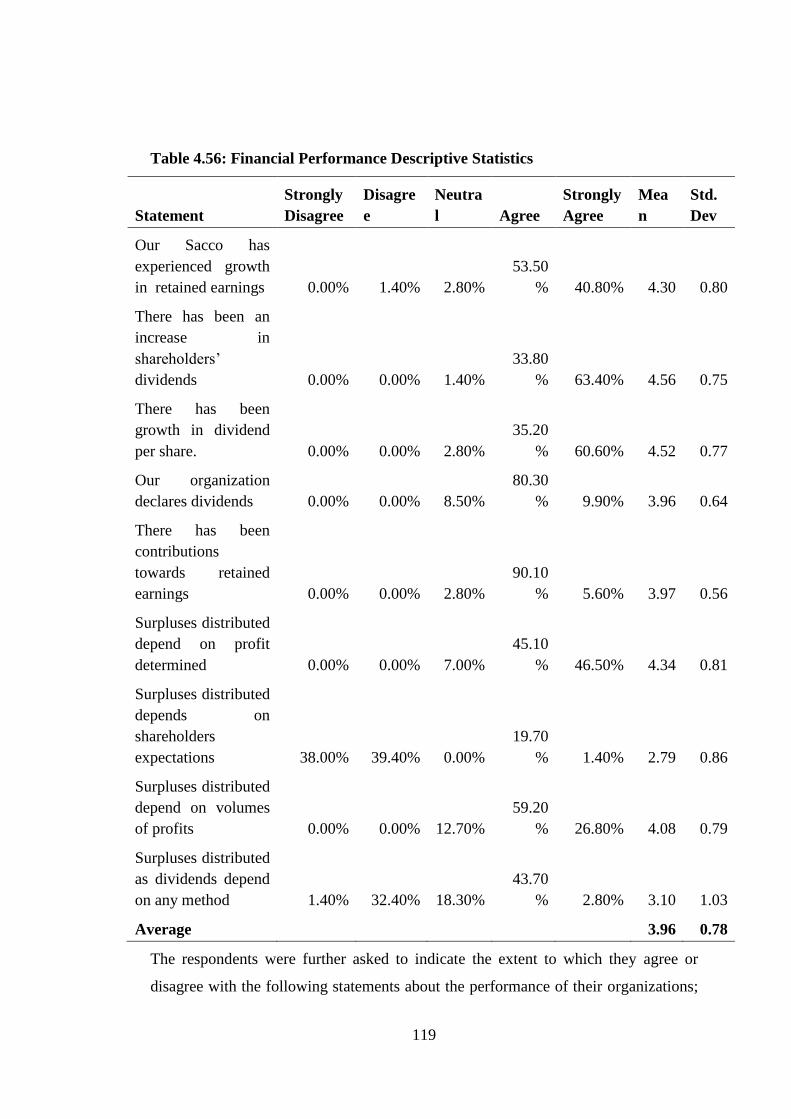
119
Table 4.56: Financial Performance Descriptive Statistics
Statement
Strongly
Disagree
Disagre
e
Neutra
l Agree
Strongly
Agree
Mea
n
Std.
Dev
Our Sacco has
experienced growth
in retained earnings 0.00% 1.40% 2.80%
53.50
% 40.80% 4.30 0.80
There has been an
increase in
shareholders’
dividends 0.00% 0.00% 1.40%
33.80
% 63.40% 4.56 0.75
There has been
growth in dividend
per share. 0.00% 0.00% 2.80%
35.20
% 60.60% 4.52 0.77
Our organization
declares dividends 0.00% 0.00% 8.50%
80.30
% 9.90% 3.96 0.64
There has been
contributions
towards retained
earnings 0.00% 0.00% 2.80%
90.10
% 5.60% 3.97 0.56
Surpluses distributed
depend on profit
determined 0.00% 0.00% 7.00%
45.10
% 46.50% 4.34 0.81
Surpluses distributed
depends on
shareholders
expectations 38.00% 39.40% 0.00%
19.70
% 1.40% 2.79 0.86
Surpluses distributed
depend on volumes
of profits 0.00% 0.00% 12.70%
59.20
% 26.80% 4.08 0.79
Surpluses distributed
as dividends depend
on any method 1.40% 32.40% 18.30%
43.70
% 2.80% 3.10 1.03
Average 3.96 0.78
The respondents were further asked to indicate the extent to which they agree or
disagree with the following statements about the performance of their organizations;
120
the responses were rated on a five likert scale as presented in Table 4.56. Majority of
95% (53.5% + 40.8%) of the respondents agreed with the statement that our Sacco has
experienced growth in retained earnings, 97% agreed with the statement that there has
been an increase in shareholders’ dividends, 96% agreed with the statement that there
has been growth in dividend per share, 90% agreed with the statement that our
organization declares dividends, 96% agreed with the statement that there has been
contributions towards retained earnings, 92% agreed with the statement that surpluses
distributed depend on profit determined, 86% agreed with the statement that surpluses
distributed depend on volumes of profits, 47% of the respondents agreed with the
statement that surpluses distributed as dividends depend on any method, However,
77% of the respondents disagreed with the statement that surpluses distributed depends
on shareholders expectations.
On a five point scale, the average mean of the responses was 3.96 which means that
majority of the respondents were agreeing with most of the statements; however the
answers were varied as shown by a standard deviation of 0.78.
4.14 Correlation Analysis
Table 4.57 shows the overall correlation analysis results for all the variables.
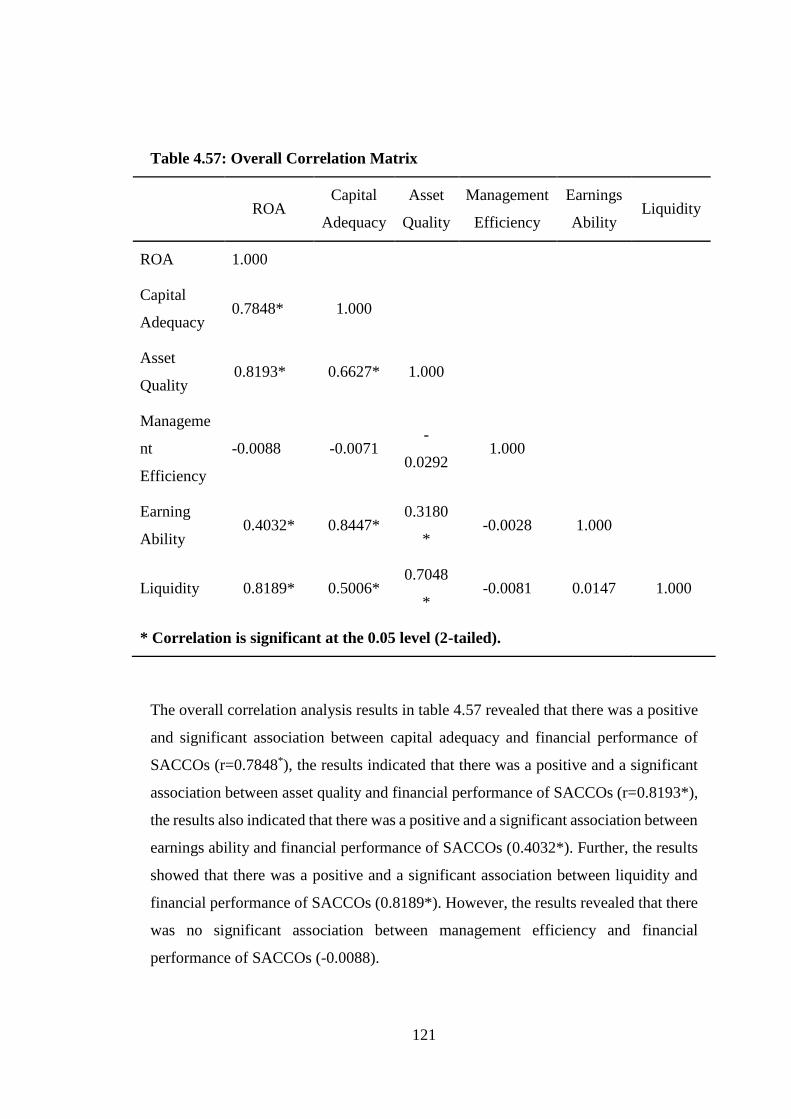
121
Table 4.57: Overall Correlation Matrix
ROA Capital
Adequacy
Asset
Quality
Management
Efficiency
Earnings
Ability Liquidity
ROA 1.000
Capital
Adequacy 0.7848* 1.000
Asset
Quality 0.8193* 0.6627* 1.000
Manageme
nt
Efficiency
-0.0088 -0.0071 -
0.0292 1.000
Earning
Ability 0.4032* 0.8447*
0.3180
* -0.0028 1.000
Liquidity 0.8189* 0.5006* 0.7048
* -0.0081 0.0147 1.000
* Correlation is significant at the 0.05 level (2-tailed).
The overall correlation analysis results in table 4.57 revealed that there was a positive
and significant association between capital adequacy and financial performance of
SACCOs (r=0.7848*), the results indicated that there was a positive and a significant
association between asset quality and financial performance of SACCOs (r=0.8193*),
the results also indicated that there was a positive and a significant association between
earnings ability and financial performance of SACCOs (0.4032*). Further, the results
showed that there was a positive and a significant association between liquidity and
financial performance of SACCOs (0.8189*). However, the results revealed that there
was no significant association between management efficiency and financial
performance of SACCOs (-0.0088).
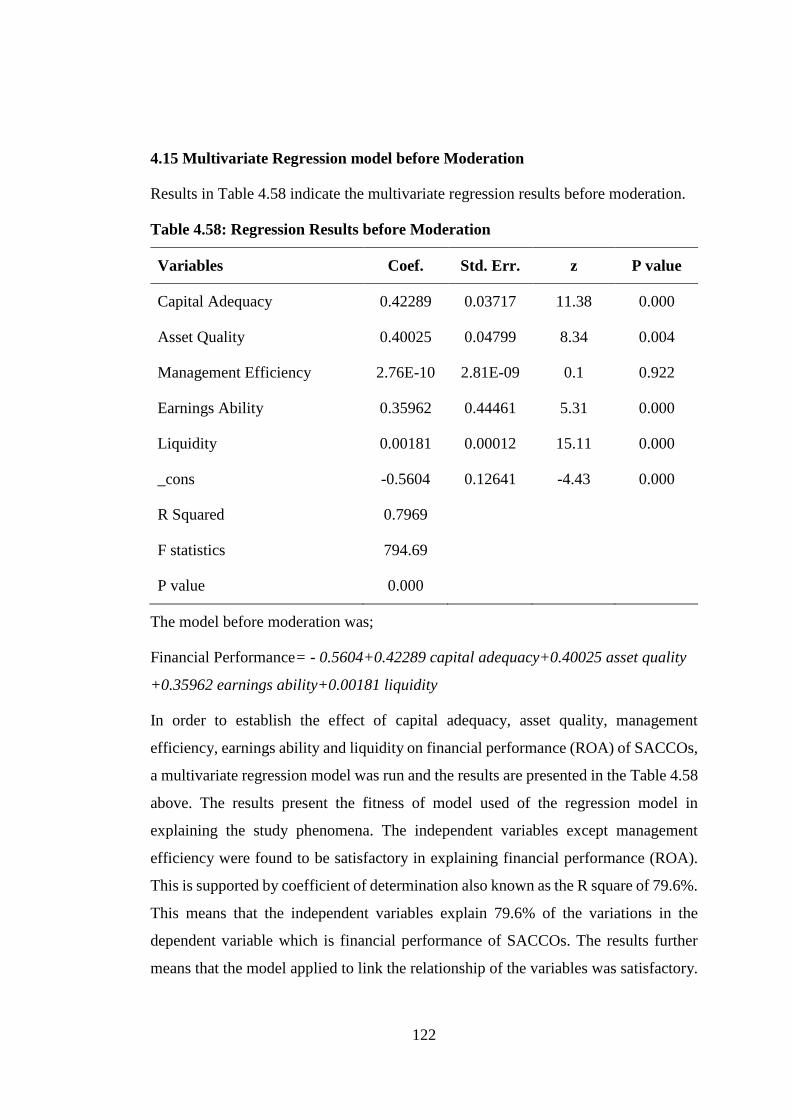
122
4.15 Multivariate Regression model before Moderation
Results in Table 4.58 indicate the multivariate regression results before moderation.
Table 4.58: Regression Results before Moderation
Variables Coef. Std. Err. z P value
Capital Adequacy 0.42289 0.03717 11.38 0.000
Asset Quality 0.40025 0.04799 8.34 0.004
Management Efficiency 2.76E-10 2.81E-09 0.1 0.922
Earnings Ability 0.35962 0.44461 5.31 0.000
Liquidity 0.00181 0.00012 15.11 0.000
_cons -0.5604 0.12641 -4.43 0.000
R Squared 0.7969
F statistics 794.69
P value 0.000
The model before moderation was;
Financial Performance= - 0.5604+0.42289 capital adequacy+0.40025 asset quality
+0.35962 earnings ability+0.00181 liquidity
In order to establish the effect of capital adequacy, asset quality, management
efficiency, earnings ability and liquidity on financial performance (ROA) of SACCOs,
a multivariate regression model was run and the results are presented in the Table 4.58
above. The results present the fitness of model used of the regression model in
explaining the study phenomena. The independent variables except management
efficiency were found to be satisfactory in explaining financial performance (ROA).
This is supported by coefficient of determination also known as the R square of 79.6%.
This means that the independent variables explain 79.6% of the variations in the
dependent variable which is financial performance of SACCOs. The results further
means that the model applied to link the relationship of the variables was satisfactory.
123
In statistics significance testing the p-value indicates the level of relation of the
independent variables to the dependent variable. If the significance number found is
less than the critical value also known as the probability value (P) which is statistically
set at 0.05, then the conclusion would be that the model is significant in explaining the
relationship; else the model would be regarded as non-significant. Table 4.58 provides
the results on the analysis of the variance (ANOVA). The results indicate that the
model was statistically significant. Further, the results imply that the independent
variables are a good predictor of performance. This was supported by an F statistics of
794.69 and a p value (0.000) which was less than the conventional probability of
0.05significance level.
Regression of coefficients results in table 4.58 shows that capital adequacy and
financial performance (ROA) are positively and significantly related (r=0.42289,
p=0.000). The table also indicates that asset quality and financial performance (ROA)
are positively and significantly related (r=0.40025, p=0.004). Further, earnings ability
and financial performance (ROA) were found to be positively and significantly related
(r=0.35962, p=0.000). It was further established that liquidity and financial
performance (ROA) are positively and significantly related (r=0.00181, p=0.000).
However, the relationship between management efficiency and financial performance
(ROA) was found to be insignificant (p=0.922).
These findings agree with that of Boyd and Smith (2000), who conducted a study on
the effect of inflation on the performance of commercial banks. The study found that
there was significant negative relationship between inflation and the performance of
the banking sector. According to the study, a rise in inflation reduces lending activities
and equity development. This is because an increase in inflation diminishes the real
return on and assets in general. In time of hyperinflation, lenders are gravely at a
disadvantage.
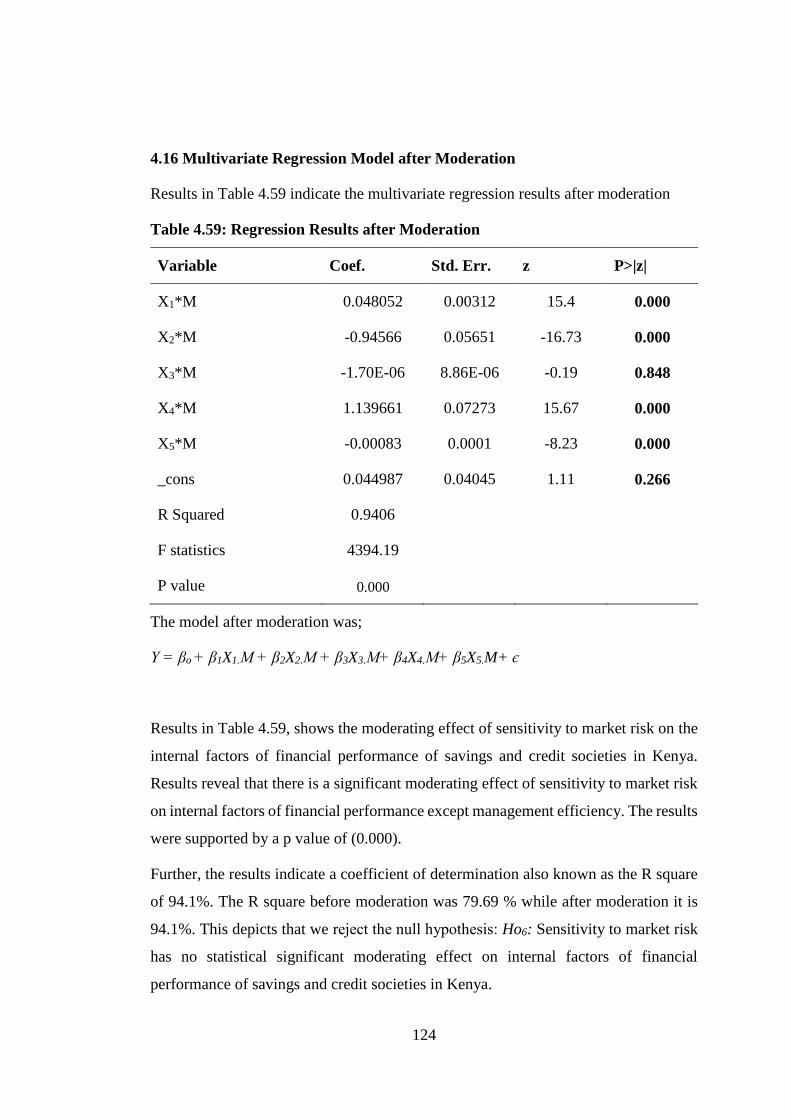
124
4.16 Multivariate Regression Model after Moderation
Results in Table 4.59 indicate the multivariate regression results after moderation
Table 4.59: Regression Results after Moderation
Variable Coef. Std. Err. z P>|z|
X1*M 0.048052 0.00312 15.4 0.000
X2*M -0.94566 0.05651 -16.73 0.000
X3*M -1.70E-06 8.86E-06 -0.19 0.848
X4*M 1.139661 0.07273 15.67 0.000
X5*M -0.00083 0.0001 -8.23 0.000
_cons 0.044987 0.04045 1.11 0.266
R Squared 0.9406
F statistics 4394.19
P value 0.000
The model after moderation was;
Y = βo + β1X1.M + β2X2.M + β3X3.M+ β4X4.M+ β5X5.M+ є
Results in Table 4.59, shows the moderating effect of sensitivity to market risk on the
internal factors of financial performance of savings and credit societies in Kenya.
Results reveal that there is a significant moderating effect of sensitivity to market risk
on internal factors of financial performance except management efficiency. The results
were supported by a p value of (0.000).
Further, the results indicate a coefficient of determination also known as the R square
of 94.1%. The R square before moderation was 79.69 % while after moderation it is
94.1%. This depicts that we reject the null hypothesis: Ho6: Sensitivity to market risk
has no statistical significant moderating effect on internal factors of financial
performance of savings and credit societies in Kenya.
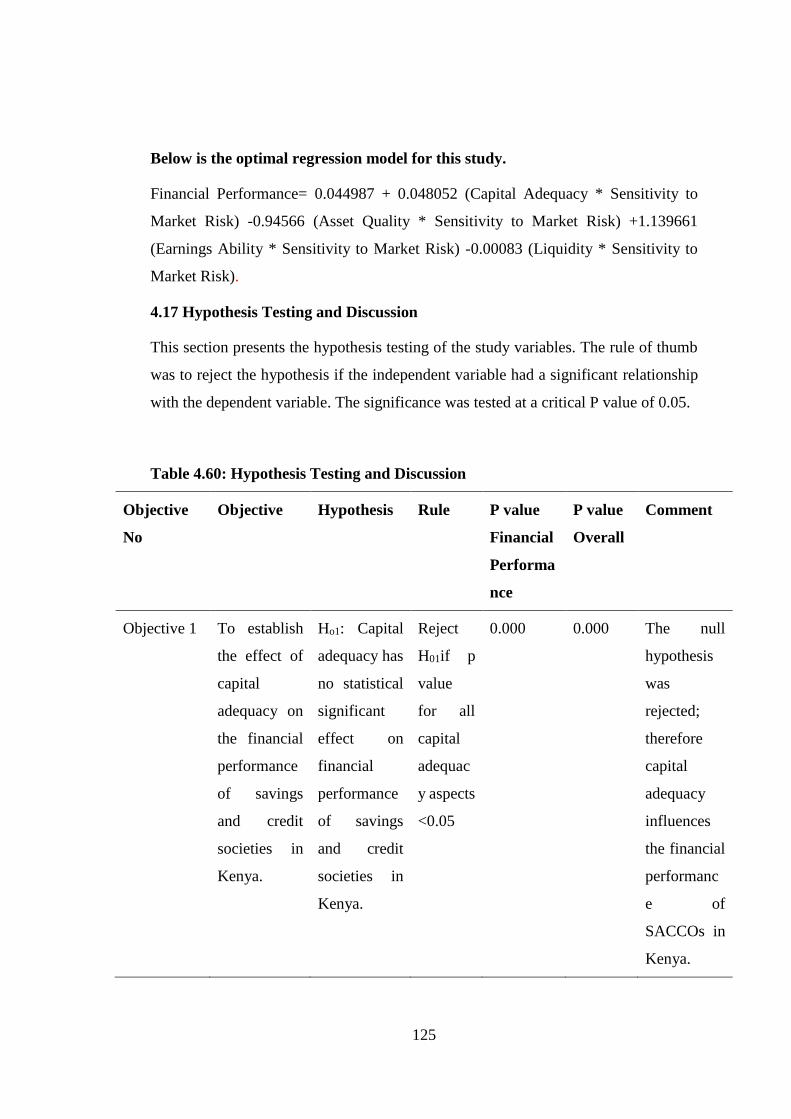
125
Below is the optimal regression model for this study.
Financial Performance= 0.044987 + 0.048052 (Capital Adequacy * Sensitivity to
Market Risk) -0.94566 (Asset Quality * Sensitivity to Market Risk) +1.139661
(Earnings Ability * Sensitivity to Market Risk) -0.00083 (Liquidity * Sensitivity to
Market Risk).
4.17 Hypothesis Testing and Discussion
This section presents the hypothesis testing of the study variables. The rule of thumb
was to reject the hypothesis if the independent variable had a significant relationship
with the dependent variable. The significance was tested at a critical P value of 0.05.
Table 4.60: Hypothesis Testing and Discussion
Objective
No
Objective Hypothesis Rule P value
Financial
Performa
nce
P value
Overall
Comment
Objective 1 To establish
the effect of
capital
adequacy on
the financial
performance
of savings
and credit
societies in
Kenya.
Ho1: Capital
adequacy has
no statistical
significant
effect on
financial
performance
of savings
and credit
societies in
Kenya.
Reject
H01if p
value
for all
capital
adequac
y aspects
<0.05
0.000 0.000 The null
hypothesis
was
rejected;
therefore
capital
adequacy
influences
the financial
performanc
e of
SACCOs in
Kenya.
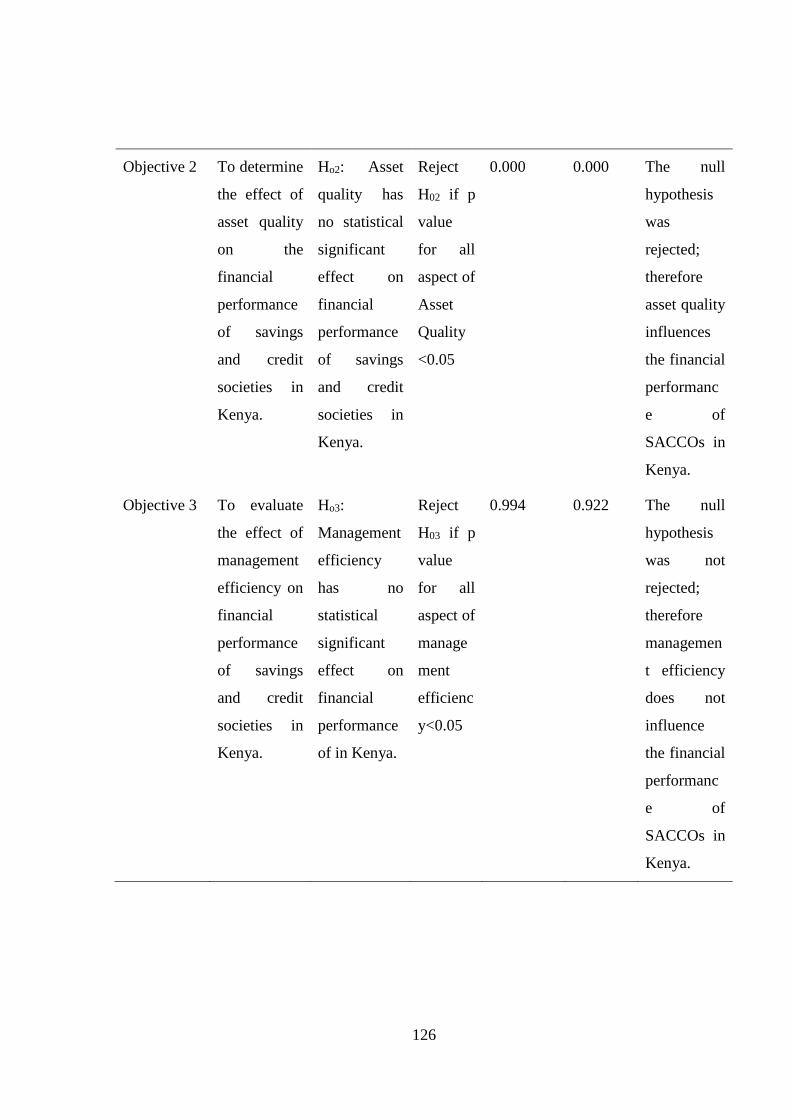
126
Objective 2 To determine
the effect of
asset quality
on the
financial
performance
of savings
and credit
societies in
Kenya.
Ho2: Asset
quality has
no statistical
significant
effect on
financial
performance
of savings
and credit
societies in
Kenya.
Reject
H02 if p
value
for all
aspect of
Asset
Quality
<0.05
0.000 0.000 The null
hypothesis
was
rejected;
therefore
asset quality
influences
the financial
performanc
e of
SACCOs in
Kenya.
Objective 3 To evaluate
the effect of
management
efficiency on
financial
performance
of savings
and credit
societies in
Kenya.
Ho3:
Management
efficiency
has no
statistical
significant
effect on
financial
performance
of in Kenya.
Reject
H03 if p
value
for all
aspect of
manage
ment
efficienc
y<0.05
0.994 0.922 The null
hypothesis
was not
rejected;
therefore
managemen
t efficiency
does not
influence
the financial
performanc
e of
SACCOs in
Kenya.
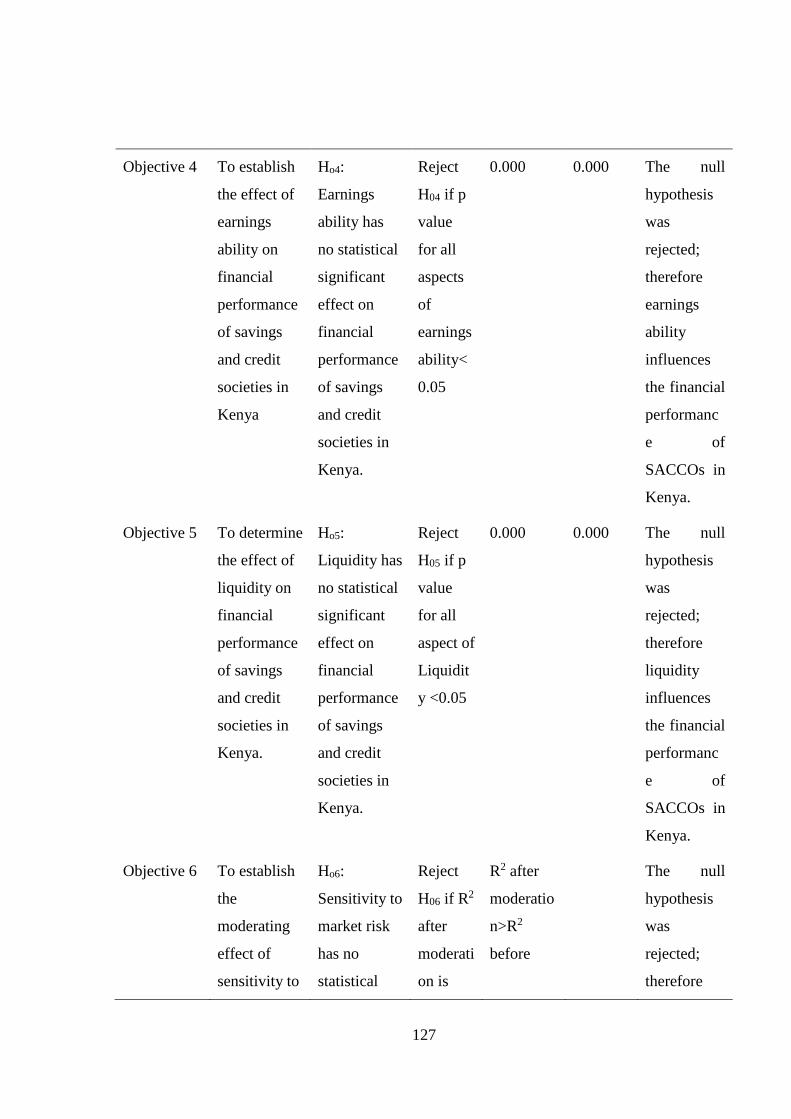
127
Objective 4 To establish
the effect of
earnings
ability on
financial
performance
of savings
and credit
societies in
Kenya
Ho4:
Earnings
ability has
no statistical
significant
effect on
financial
performance
of savings
and credit
societies in
Kenya.
Reject
H04 if p
value
for all
aspects
of
earnings
ability<
0.05
0.000 0.000 The null
hypothesis
was
rejected;
therefore
earnings
ability
influences
the financial
performanc
e of
SACCOs in
Kenya.
Objective 5 To determine
the effect of
liquidity on
financial
performance
of savings
and credit
societies in
Kenya.
Ho5:
Liquidity has
no statistical
significant
effect on
financial
performance
of savings
and credit
societies in
Kenya.
Reject
H05 if p
value
for all
aspect of
Liquidit
y <0.05
0.000 0.000 The null
hypothesis
was
rejected;
therefore
liquidity
influences
the financial
performanc
e of
SACCOs in
Kenya.
Objective 6 To establish
the
moderating
effect of
sensitivity to
Ho6:
Sensitivity to
market risk
has no
statistical
Reject
H06 if R2
after
moderati
on is
R2 after
moderatio
n>R2
before
The null
hypothesis
was
rejected;
therefore
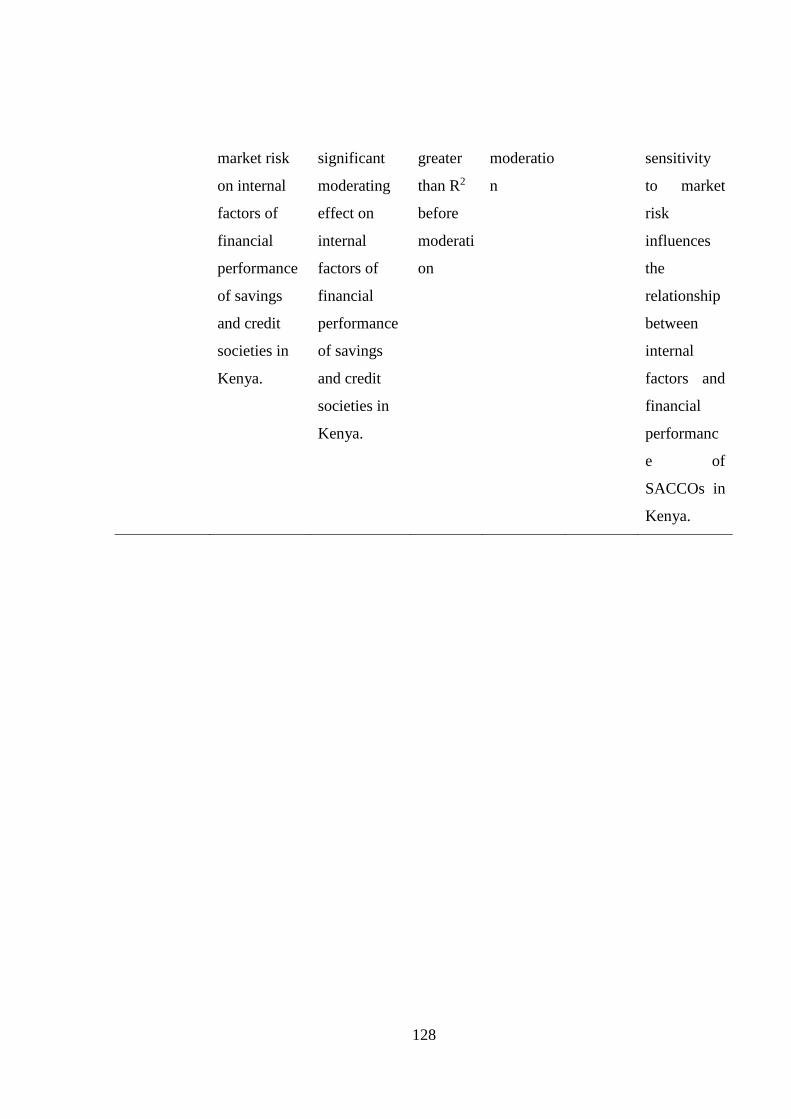
128
market risk
on internal
factors of
financial
performance
of savings
and credit
societies in
Kenya.
significant
moderating
effect on
internal
factors of
financial
performance
of savings
and credit
societies in
Kenya.
greater
than R2
before
moderati
on
moderatio
n
sensitivity
to market
risk
influences
the
relationship
between
internal
factors and
financial
performanc
e of
SACCOs in
Kenya.
129
CHAPTER FIVE
SUMMARY, CONCLUSIONS AND RECOMMENDATIONS
5.1 Introduction
This chapter presents the summary of major findings of the study, relevant discussions,
conclusions and the necessary recommendations. The study sought to establish the
effect of internal factors of savings and credit cooperative societies in Kenya, capital
adequacy, asset quality, earning ability, liquidity and management efficiency on
financial performance of savings and credit societies in Kenya. This was done in line
with the objectives of the study, areas of further research were suggested and
limitations of the study were taken into account.
5.2 Summary of Findings
The summary is done in line with the objectives of the study based on the output of the
descriptive and inferential statistical analyses guided to test the research hypothesis of
the study.
5.2.1 Capital Adequacy and Financial Performance
The first objective of the study was to establish the effect of capital adequacy on the
financial performance of savings and credit societies in Kenya. Majority of the
respondents noted that observing the core capital to total asset requirement improved
the financial performance of the Sacco also, observing the institutional capital to total
asset requirement has improved the financial performance of the Sacco. Further,
observing the minimum core capital requirement of Kshs. 10 million has improved the
financial performance of the Sacco. Finally, observing the core capital to total deposits
requirement has improved the financial performance of the Sacco.
Correlation analysis results showed that capital adequacy and financial performance
of SACCOs are positively and significantly associated. Regression analysis results
showed that there is a positive and significant statistical relationship between capital
adequacy and financial performance of savings and credit societies in Kenya. The
hypothesis results indicated that there is a statistical significant relationship between
capital adequacy and financial performance of savings and credit societies in Kenya.
130
These findings agree with those of Berger and Bowman (2012), who indicated that
capital helps small banks to increase their probability of survival and market share at
all times. The study further argued that capital enhances the performance of medium
and large SACCOS primarily during banking crises also Croteau (1956), Taylor
(1979), Wolken and Navratil (1980) and who stated that capital adequacy ratios were
important in expansion, merger and growth in deposit taking SACCOs. Mckillop and
Williamson (2011) recognized the importance of capital management as an important
ingredient in achieving optimal utilization of resources in an economy and also the
improvement in quality of life.
5.2.2 Asset Quality and Financial Performance
The second objective of the study was to determine the effect of asset quality on the
financial performance of savings and credit societies in Kenya. Majority of the
respondents noted that their originations observe the general state of the economy
before establishing a loan portfolio policy. They observe the trend of creditors before
establishing a loan portfolio policy and further, the firms observe the overhead cost
before establishing a loan portfolio policy.
Correlation analysis results showed that asset quality and financial performance of
SACCOs are positively and significantly associated. Regression analysis results
indicated that there is a positive and significant relationship between asset quality and
financial performance of savings and credit societies in Kenya. The hypothesis results
indicated that there is a statistical significant relationship between asset quality and
financial performance of savings and credit societies in Kenya.
These findings agree with those of Manyuanda (2013), who examined the effect of
nonperforming loans on the performance of SACCOs in Nairobi, Kenya. The study
concluded that a significant negative relationship existed between non-performing
loans and performance of SACCOs. The study recommended that SACCOs opt for
equity financing instead of debt financing to improve on its financial leverage.
SACCOs should also avoid excessive lending, maintain high credit standards and
should limit lending to un-hedged borrowers.
131
5.2.3 Management Efficiency and Financial Performance
The third objective of the study was to evaluate the effect of management efficiency
on financial performance of savings and credit societies in Kenya. Correlation analysis
results showed that management efficiency and financial performance of SACCOs are
not significantly associated. Regression analysis results indicated that there is no
significant relationship between management efficiency and financial performance of
savings and credit societies in Kenya. The hypothesis results indicated that there is no
statistical significant relationship between management efficiency and financial
performance of savings and credit societies in Kenya.
These findings contradicted with those of Maseki (2012), who studied the impact of
knowledge management on performance of commercial banks in Kenya. The study
found that knowledge management greatly affected performance of the commercial
banks. According to the study knowledge management enhances product and service
quality; increases productivity and innovative ability.
5.2.4 Earnings Ability and Financial Performance
The fourth objective of the study was to establish the effect of earnings ability on
financial performance of savings and credit societies in Kenya. Majority of the
respondents noted that earning ability determines the financial performance of a
SACCOs. Also, earning ability guards the Sacco against erosion of capital due to
potential changes. Further, rating manifests adequacy of the current and future
earnings.
Correlation analysis results showed that earnings ability and financial performance of
SACCOs are positively and significantly associated. Regression analysis results
indicated that there is a positive and significant relationship between earnings ability
and financial performance of savings and credit societies in Kenya. The hypothesis
results indicated that there is a statistical significant relationship between earnings
ability and financial performance of savings and credit societies in Kenya.
These findings disagree with of those of Kongiri (2012), who investigated the effect
CAMEL variables on the efficiency of commercial banks. The study found that capital
adequacy, earnings and liquidity ratio have a negative relationship to efficiency ratio
132
while management quality and asset quality have a positive relationship. The study
mentioned that the earnings ability reflects the bank's ability to absorb losses, expand
its financing, as well as, its ability to pay dividends to its shareholders, and helps
develop an adequate amount of own capital.
5.2.5 Liquidity and Financial Performance
The fifth objective of the study was to determine the effect of liquidity on financial
performance of savings and credit societies in Kenya. Majority of the respondents
noted that observing liquidity at minimum statutory ratio of 15% improves the
financial performance of the Sacco. Further, liquidity is measured in terms of the ratio
of liquid assets to deposits and short term liabilities. Finally, external borrowing is used
as an indicator of the liquidity status.
Correlation analysis results showed that liquidity and financial performance of
SACCOs are positively and significantly associated. Regression analysis results
indicated that there is a positive and significant relationship between liquidity and
financial performance of savings and credit societies in Kenya. The hypothesis results
indicated that there is a statistical significant relationship between liquidity and
financial performance of savings and credit societies in Kenya.
These findings agree with that of Omino (2014), who analyzed the liquidity mitigation
measures and performance of SACCOs in Kisumu County. The study found out that
liquidity risk mitigation approaches adopted by different SACCOs had a significant
effect on their financial performances. The study revealed that SACCOs adopted a
more cautious position in their current liabilities to ensure that operating cash flows
were sufficient to cover the short terms obligations entered by the firms. Further, the
study revealed that debtor collection periods were longer to encourage voluntary
membership and consequently the SACCOs were either unjustifiably constraining
their creditor payment periods or were conditioned to do so.
5.2.6 Sensitivity to Market Risk
The sixth objective of the study was to establish the overall moderating effect of
sensitivity to market risk on the internal factors of financial performance of savings
and credit societies in Kenya. The results indicated that the firms involve stakeholders,
133
directors and regulator in formulation of both the sensitivity to interest rate and
inflation rate policies.
The moderation results indicated that the interaction effect of sensitivity to market risk
on the relationship between the independent variables (except management efficiency)
and dependent variable was significant. Since the calculated p value of the interaction
was 0.000<0.05, the null hypothesis was rejected and thus sensitivity to market risk
has a statistical significant moderating effect on internal factors of financial
performance of savings and credit societies in Kenya.
These findings agree with that of Milanova (2010), who examined sensitivity to market
risk management in banks. The study focused on interest rate risk management using
the Value at Risk (VAR) model. The study found that market interest rates, currency
exchange rates, prices of shares and exchange tradable commodities have an adverse
impact on bank incomes and capital position. The study recommended rigorous risk
management to mitigate risk. Further, the findings agree with Tomuleasa (2014), who
studied the determinants of European bank performance. The study focused on bank
specific factors and macroeconomic variables. The study mentioned that effect of
inflation on profitability is tethered to the capacity of bank’s management to forecast
inflation. The study established mixed findings. Banks that were able to correctly
anticipate inflation had the opportunity to adjust their interest rates accordingly and
consequently to earned higher profits. The performance of those that could not predict
inflation was adversely affected.
5.3 Conclusions
5.3.1 Capital Adequacy and Financial Performance
Based on the findings the study concluded that capital adequacy influenced the
financial performance of savings and credit societies in Kenya. This can be explained
by the regression results which showed that the influence was positive and also showed
the magnitude by which capital adequacy influenced the financial performance of
savings and credit societies. Based on the findings, the study concluded that an
improvement in capital adequacy by 1 unit would lead to an improvement in financial
performance of SACCOs by 0.423 units.
134
5.3.2 Asset Quality and Financial Performance
Based on the findings the study concluded that asset quality influenced the financial
performance of savings and credit societies in Kenya. This can be explained by the
regression results which showed that the influence was positive and also showed the
magnitude by which asset quality influenced the financial performance of savings and
credit societies. Based on the findings, the study concluded that an improvement in
asset quality by 1 unit would lead to an improvement in financial performance of
SACCOs by 0.400units.
5.3.3 Management Efficiency and Financial Performance
Based on the findings the study concluded that management efficiency has no
statistical significant influence on the financial performance of savings and credit
societies in Kenya. The regression results revealed that management efficiency has no
statistical significant influence on the financial performance of savings and credit
societies (p=0.922).
5.3.4 Earnings Ability and Financial Performance
Based on the findings the study concluded that earnings ability influenced the financial
performance of savings and credit societies in Kenya. This can be explained by the
regression results which showed that the influence was positive and also showed the
magnitude by which earnings ability influenced the financial performance of savings
and credit societies. From the findings, the study concluded that an improvement in
earnings ability by 1 unit would lead to an improvement in financial performance of
SACCOs by 0.359 units.
5.3.5 Liquidity and Financial Performance
Based on the findings the study concluded that liquidity influenced the financial
performance of savings and credit societies in Kenya. This can be explained by the
regression results which showed that the influence was positive and also showed the
magnitude by which liquidity influenced the financial performance of savings and
credit societies. From the findings, the study concluded that an improvement in
liquidity by 1 unit would lead to an improvement in financial performance of SACCOs
by 0.0012 units.
135
5.3.6 Sensitivity to Market Risk
Based on the findings, the study concluded that sensitivity to market risk moderates
the interaction between capital adequacy, asset quality, earnings ability, liquidity and
financial performance of savings and credit societies in Kenya.
5.4 Recommendations
The study recommendations are in line with the objectives, findings and conclusions
of the study.
5.4.1 Capital Adequacy and Financial Performance
Based on the findings, the study recommended that Saccos need to strengthen their
capital adequacy elements. In particular, the management of the SACCOs should
ensure that they observe the core capital to total asset requirement. The firms should
also observe the institutional capital to total asset requirement. Further, the firms
should observe the minimum core capital requirement as well as the core capital to
total deposits requirement. This will lead to improvement in the financial performance
of the SACCOs as illustrated by the regressions results, which showed a positive and
significant relationship between capital adequacy elements and financial performance
of SACCOs.
5.4.2 Asset Quality and Financial Performance
The study recommends that management need to be cautious in setting up a credit
policy that will not negatively affects profitability and also they need to know how
credit policy affects the operation of their banks to ensure judicious utilization of
deposits and maximization of profit. The study also recommends credit information
sharing between SACCOs. This will play a significant role in determining performance
of deposit taking SACCOs. Further, the study recommends that SACCOs opt for equity
financing instead of debt financing to improve on its leverage. SACCOs should also
avoid excessive lending, maintain high credit standards and limit lending to un-hedged
borrowers.
136
5.4.3 Management Efficiency and Financial Performance
Based on the findings, the study recommended the need for SACCOs to strengthen
management efficiency elements. Some of these elements include; improved business
plan, enhanced independent internal and external audit implementation and enhanced
capability of board of directors and senior management.
5.4.4 Earnings Ability and Financial Performance
The study recommends for continuous review of credit policies, establishment of
irrecoverable loan provision policies, development of sound staff recruitment policies
and the use of appropriate financing mix. Further, the Government should review legal
framework to ensure that institutional capital is used to grow SACCOs’ wealth.
5.4.5 Liquidity and Financial Performance
Based on the findings, the study recommended the need for the deployment of efficient
systems to strengthen liquidity risk control fundamentals. SACCOs should also
consider seeking professional guidance towards adopting policies on asset and liability
management.
5.5 Suggested areas for Further Study
The study sought to establish the effect of internal factors on financial performance of
deposit taking savings and credit societies in Kenya. Further studies could, thus focus
on internal factors in other financial institutions such as insurance, MFIs and
commercial banks. In particular, further studies should look into the effect of capital
adequacy, asset quality, earning ability, liquidity and management efficiency on
financial performance of the insurance firms, MFIs and commercial banks. This would
facilitate comparison of the findings with those of the current study.
The findings of this study found no significant relationship between management
efficiency and financial performance of SACCOs. Further studies should explore this
kind of research so as to obtain conclusive results in regard to the effect of management
efficiency on financial performance of firms.

137
Future researchers could also consider introducing different variables other than
sensitivity to market risk in testing for moderation effect. Some of these variables could
be regulation frameworks, firms size and organization culture.
138
REFERENCES
Abang-Anoh, C. A. (2012). The Impact of Liquidity on the Performance of
Commercial Bank in Nigeria PLC. Caritas University Nigeria
Adrian, T., & Shin, H. S. (2010). Liquidity and leverage. Journal of Financial
Intermediation, 19(3), 418-437.
ACCOSCA. (2013). The Facts About Saccos in Africa. Saccos in Brief Quarterly
Publication.
ACCOSCA. (2014). History and Background. Retrieved From Http://Www. Acosca.
Org
Achou, F. T., & Tegnuh, N. C. (2008). Bank Performance and Credit Risk
Management. Master Degree Project School of Technology and Society,
University of Skovde Press.
ACHU, A. A. C. (2012). The Impact of Liquidity on the Performance of Commercial
Bank in Nigeria PLC. Enugu: Abang-Anoh Charity Achu.
Ademba, C. (2010). Challenges facing SACCO regulations in Africa. Paper presented
at 11th SACCO congress, Swaziland. Retrieved from: http://www.acosca.org
Al Daoud, Khaldoon A., Sraheen, Dea’a A. O., Alslehat, & Nimer A. A. (2015). The
Moderating Effect of An Audit Committee on the Relationship Between Non-
Audit Services and Corporate Performance. The International Institute for
Science, Technology and Education (IISTE).
Al-Tamini, H. (2002). Risk Management Practices: An Empirical Analysis of the UEA
Commercial Banks. Finance India, Vol 16 no. 3
Allen, F., & Gale, D. Competition and Financial Stability.wharton.upenn.edu
Atikogllari, M. (2009). An analysis of the Northern Cyprus Banking Sector in the post-
2001 period thorough the camels approach. International Research Journal of
Finance and Economics, (32), 212-230.
Arnould, R. J. (1985). Agency Costs In Banking Firms: An Analysis of Expense
Preference Behavior. Journal of Economics and Business, 37(2), 103-112.
139
Athanasoglou, P., Brissimism, S. & Delis, N. D. (2005). Bank-Specific, Industry
Specific and Macroeconomic Determinants of Bank Profitability (No. 25).Bank
Of Greece Working Paper.
Athanasoglou, P.P., Sophocles, N.B., & Matthaios, D.D. (2005). Bank-specific,
industry-specific and macroeconomic determinants of bank profitability.
Working paper, Bank of Greece. 1(1), 3-4.
Almazari, A. A. (2011). Financial Performance Evaluation of Some Selected
Jordanian Commercial Banks. International Research Journal of Finance and
Economics. ISSN 1450-2887 Issue 68 (2011).
Aubyn-Ansah, J. (2015). Exchange Rate Volatility and Trade Balance in Ghana:
Insight & Analysis. SaarbruCken: Lap Lambert Academic Publishing.
Ausina-Tortosa, E. (2012). Bank Branch Geographic Location Patterns in Spain:
Some Implications for Financial Exclusion. Growth and Change, 43(3), 505-
543.
Babie, E. (2004). The Practice of Social Research. Belmont C.A Wadsworth.
Behaviour, Agency Costs, and Ownership Structure, Journal of Finance.
Barnes, S. J. (2003). Enterprise Mobility: Concepts and Examples. International
Journal of Mobile Communications, 1( 4), 341-359.
Baron, R. M., & Kenny, D. A. (1986). The Moderator-Mediator Variable Distinction
in Social Psychological Research: Conceptual, Strategic, and Statistical
Consideration. Journal of Personality and Psychology, 51, 1173-1182.
Barus, J. J., Muturi, W., Kibati, P., & Koima, J. (2017). Effect of Capital Adequacy on
The Financial Performance of Savings and Credit Societies in Kenya.
American Journal of Finance. Vol.1, Issue 4 No.1, pp1-12.
Bataineh, K. (2014). Impacts of Employee Training on the Performance of
Commercial Banks in Jordan. European Journal of Business and Management,
6(27), 192-196.
140
Baumol, W. J. (1952). The transaction demand for cash: An Inventory Theoretical
Approach. Quarterly Journal of Economics.
Bennaceur, S., & Kandil, M. (2006). The Impact of Capital Requirements on Banks
Performance: The Case of Egypt. Available At SSRN 903655.
Berger, A. N. (1995). The Profit-Structure Relationship in Banking Tests of Market-
Power and Efficient-Structure Hypotheses. Journal of Money, Credit and
Banking, 27 (May 1995), 404-431.
Berger, A., Bouwman, C., Kick, T., & Schaeck, K. (2012). Bank Risk Taking and
Liquidity Creation Following Regulatory Interventions and Capital Support.
Deutsche Bundes bank Discussion Paper, Series 2, NO 05/2010.
Berger, A., & Bouwman, C. (2012). How Does Capital Affect Bank Performance
During Financial Crises. University of South Carolina.
Berger, A.N. & Hannan, T.H. (1993). Using Efficiency Measures to Distinguish
Among Alternative Explanations of the Structure-Performance Relationship in
Banking, No.93-18, Finance and Economics Discussion Series, Federal
Reserve Board.
Biggar, D., & Heimler, A. (2005). An increasing role for competition in the regulation
of banks. Antitrust Enforcement in Regulated sectors–Subgroup 1, ICN
(International Competition Network). Bonn, 586.
Boyd, J. H., & Smith, B. D. (1996). The Co-evolution of the Real and Financial Sectors
in the Growth Process, World Bank Economic Review, 10, 371-96.
Brockett, P. L., Cooper W. W., Golden, L. L., Rousseau, J. J., & Wang, Y. (1997).
evaluating solvency versus efficiency performance and different forms of
organization and marketing in U.S. Property-Liability Insurance Companies.
European Journal of Operation Research. No 154. – Pp. 492-514.
Burns, N. & Grove, S. K. (2003). The Practice of Nursing Research: Conduct, Critique
and Utilization. Toronto: WB Saunders.

141
Business Dictionary. (2011). Online Website Resource Retrieved from
Http://Www.Businessdictionary.Com Retrieved on 30th July 2016.
Calomiris, C. W., Heider, F., & Hoerova, M. (2014). A Theory of Bank Liquidity
Requirements. Columbia Business School Research paper, (14-39).
Campbell, (2007). Why Would Corporation Behave in Socially Responsible Way? An
Institutional Theory of Corporate Social Responsibility. Academy of
Management Review.
Constantino, F. (2012). Regulation of Supervision on Financial Markets. International
Journal of the Public Sector Management, 25(6/7), 437 – 443.
Central Bank of Kenya. (2010). Bank Supervision Report. Nairobi, Kenya.
Chaddad, F., & Cook, M. (2004). The Economics of Organization Structure Changes:
A US Perspective on Demutualization, Annals of Public and Co-operative
Economics, Vol: 75 Issue: 4, Pp. 575-594.
Chandran, E. (2004). Research Methods: A Quantitative Approach with Illustrations
from Christian Ministries. Nairobi: Daystar University.
Chaudhry, S., & Singh, S. (2012); Impact of Reforms on the Asset Quality in Indian
Banking. International Journal of Multidisciplinary. 5(2), 17-24.
Chebor, M. (2008). Understanding Co-operative Movement and Its Value. Greenline
Publishers. Nairobi. Kenya.
Chijoriga, M. M. (1997). Application of Credit Scoring and Financial Distress
Prediction Models to Commercial Banks Lending: The Case of Tanzania. Ph.D
Dissertation, Wirts Chaftsnnversitat Wien (WU), Vienna.
Cooper, C. R., & Schindler, P. S. (2008). Business Research Methods (10th Ed.).
Boston: Mcgraw-Hill.
Cooper, D. R., & Schindler, P. S. (2011). Business Research Methods, 11th, Edition.
Mcgraw-Hill Publishing, Co. Ltd. New Delhi-India.
Cooperative Societies Act. (2004). The Cooperative Society Act (Amended) No. 12 of
1997.
142
Creswell, J. W. (2003). Research Design: Qualitative, Quantitative and Mixed
Methods and Approaches (2nd Ed.). Thousand Oaks, CA: Sage.
Croteau, T. J. (1956). The Economics of the Credit Union. Detroit: Wayne State
University Press.
Dang, U. (2011). The CAMEL Rating System in Banking Supervision. A Case Study.
Das, A., & Ghosh, S. (2007). Determinants of credit risk in Indian state-owned banks:
An empirical investigation.
Demsetz, H. (1973). Industry Structure, Market Rivalry and Public Policy, Journal of
Law and Economics, Vol.16, N.1, pp.1-9.
De Nicolò, G., Boyd, J. H., & Jalal, A. M. (2006). Bank Risk-Taking and Competition
Revisited [Electronic Resource]: New Theory and New Evidence. International
Monetary Fund.
Denzin, N. K., & Giardina, M. D. (Eds.). (2016). Qualitative inquiry and the
conservative challenge. Routledge.
Deyoung, R. E., Hughes, J. P., & Moon, C. G. (2001). Efficient Risk-Taking and
Regulatory Covenant Enforcement in a Deregulated Banking Industry. Journal
of Economics and Business. 53(2), 255-282.
Eby, M. (1993). Validation. Choosing a Test to Fit the Design. Nurse Researcher.
Vol.1, No.2, Pp27-33.
Edwards, F. R. (1977). Managerial Objectives in Regulated Industries: Expense-
Preference Behavior In Banking. Journal of Political Economy. 85(1), 147-
161.
Elsiefy E (2013) Comparative analysis of Qatari Islamic banks performance versus
conventional banks before, during and after the financial crisis. International
Journal of Business and Commerce 3 (3): 11–41.
Ember, C., & Ember, M. (2009). Cross Cultural Research Methods, 2nd Edition.
Altamira Press, New York, United States of America.
143
Farhi, Emmanuel, Mikhail Golosov, and Aleh Tsyvinski. (2009). A theory of liquidity
and regulation of financial intermediation. Review of Economic Studies 76,
no. 3: 973-992
Federal Deposit Insurance Corporation. (2007). FDIC Quarterly. Washington, D C:
Federal Deposit Insurance Corporation.
Frazier, P. A., Tix, A. P., & Barron, K. E. (2004). Testing Moderator and Mediator
Effect in Counseling Psychology. Journal of Counseling Pysycology, 52 (2),
134.
Fried, H. O., Lovell, C. K., & Schmidt, S. S. (2008). The Measurement of Productive
Efficiency and Productivity Growth. Oxford University Press.
Friedman, B. M. (1987). Lessons from the 1979-1982 Monetary Policy Experiment
(No. W1272). National Bureau of Economic Research.
FSD. (2010). Zooming in on Governance Issues. SACCO CAP News.
Gachua, N. F. 2011. The effect of foreign exchange exposure on a Firm’s financial
performance: a case of listed companies in Kenya (Doctoral dissertation, KCA
University).
Gall, M. D., Gall, J. P., & Borg, W. R. (2007). Educational Research: An Introduction.
Boston: Pearson Education
Gale, D., & Ozgur, O. (2005). Are Bank Capital Ratiotoo High or Too Low?
Incomplete Market and Optimal Capital Structure. Journal of European
Economic Association. 3:690-700.
Gathurithu, A.W. (2011). An Investigation in to the factors affecting marketing of
SACCO Products in Thika. Kenya. A Research Project Submitted at Makerere
University, Uganda.
Gerstman, B. (2003). Determining Sample Size. Retrieved on Thursday 21st July, 2016
@ Http://Www.Sjsu.Edu/Faculty/Gerstman/Statprimer/Sampsize.
144
Gitonga, J. K. (2014). The Effect of Loan Loss Provisioning on Profitability of Deposit
Taking SACCO Societies in Nairobi County. (Doctoral Dissertation, University
of Nairobi).
Goldkuhl, G. (2012). Pragmatism vs interpretivism in qualitative information systems
research. European journal of information systems, 21(2), 135-146.
Golin, J. L. (2001). The Bank Credit Analysis hand book: A guide for analysts, bankers
and investors. Singapore: J.Wiley
Grier, W. A. (2007). Credit Analysis of Financial Institutions. 2nd ed. Euro money
Institution Investor PLC.
Gropper, D. M., & Oswald, S. L. (1996). Regulation, Deregulation and Managerial
Behaviour. Applied Financial Economics, 6(1), 1-7.
Gupta, P. K. (2014). An Analysis of Indian Public Sector Banks Using CAMEL
Approach. IOSR Journal of Business and Management, 16, 94-102.
Government of Kenya. (2008). The SACCO Societies (Deposit Taking Business)
Regulations, 2010. Nairobi: Government Printer.
Government of Kenya. (2008). Economic Survey (2008). Nairobi: Central Bureau of
Statistics.
Habbershon, T. G., Williams, M., & Macmillan, I. C. (2003). A Unified Systems
Perspective of Family Firm Performance. Journal of Business Venturing.18(4),
451-465.
Hamid, A., & Azmi, S. (2011). The Performance of Banking During 2000-2009: Bank
Islam Malaysia Berhad and Conventional Banking in Malaysia. International
Journal of Economics and Management Sciences. 1(1), 9-19.
Hannan, T. H. (1979). Expense-Preference Behavior in Banking: A re examination.
Journal of Political Economy. 87 (October), 891-895.
Halling, M. & Hayden, E. (2006). Bank failure prediction: a two‐step survival time
approach, C.R.E.D.I.T. Conference, Austrian National Bank, Vienna, 31; 101-
109.
145
Hardigan, P. C., Popovici, I., & Carvajal, M. J. (2016). Response rate, response time,
and economic costs of survey research: a randomized trial of practicing
pharmacists. Research in Social and Administrative Pharmacy, 12(1), 141-148.
Harry, M. (1952). Portfolio Selection, Efficient Diversification of Investments. The
Journal of Finance. 7, 1, 77-91.
Hazzi, O. A., & Kilani, M. I. A. (2013). The Financial Performance Analysis of Islamic
and Traditional Banks: Evidence from Malaysia. European Journal of
Economics, Finance and Administrative Sciences, Issue:57, February 2013,
ISSN: 14502275
Hesse, H. & Cihák, M. (2007). Co-operative Banks and Financial Stability. IMF
Working Paper WP/07/02/, International Monetary Fund, Washing D.C
Hays, Fred H., De Lurgio, Stephen A., Gilbert Jr., & Arthur H. (2009).Efficiency
Ratios and Community Bank Performance. Journal of Finance and
Accountancy. Vol. 1, 1-15.
Hyndman, R. (2008). Functional Time Series Forecasting. Monash University, VIC,
3800, Melbourne, Australia
Hyndman, R. (2008). Quantitative Business Research Methods. Department of
Econometrics and Business Statistics, Monash University (Clayton Campus).
IBM Statistics. (2010). Retrieved on Tuesday 12th July, 2016 @
Http://Www.Unileon.Es/Ficheros/Servicios/Informatica/Spss/English/IBM-
SPSS_Basico.Pdf, United States of America.
ICA. (2009). 59th annual Conference. Chicago, Illinoisusa Chicago Marriott
Infeacho, C., & Ngalawa, H. (2014). Performance of the South African Banking Sector
Since 1994. Journal of Applied Business Research (Jabr),30(4)1183-1196
International Labour Conference, & International Labour Organization. (2009). ILO
Summit on the Global Jobs Crisis (Geneva, 15-17 June 2009): International
Labor Conference, 98th Session, 2009. Geneva: International Labour Office.
146
Jhingan, M. L. (2004). Money Banking International Trade and Public Finance. India:
Vrinda Publications [P] Ltd.
Jeanne, O. & Svensson, L. O. (2007). Credible commitment to optimal escape from a
liquidity trap: the role of the balance sheet, The American Economic Review,
97(1):474‐490.
John, A. (2002). Rochdale Pioneer. The Oxford Companion to British History.
Kabamba, K. (2012). Liquidity Management and Growth of Microfinance Institutions
in Uganda Case Study in Kibuku. Makerere University, Uganda.
Kahuthu, D. G. (2016). Impact of Prudential Regulation on Financial Performance of
Deposit Taking Savings and Credit Co-operative Societies in Kenya,
Unpublished PhD Thesis, Nairobi: Jomo Kenyatta University of Agriculture
and Technology
Kaufman, G. (1966). Bank Market Structure and Performance: The Evidence from
Iowa. Southern Economic Journal, 32(4), 429-431.
Kamau, J. M. (2010). Determinants of Performance of Savings and Credit Co-
operatives Societies (Saccos) in Kenya (Doctoral Dissertation, University of
Nairobi, Kenya).
Kenya Vision 2030. Country Development Programme Covering the Period 2008-
2030
Keynes, J. (1936). The general Theory of Employment, Interest and Money: London
and New York.
Khaldoon, A. A., Dea’a A. O. A. & Nimer, A. A. A. (2015). The Moderating Effect
of an Audit Committee on the Relationship Between Non-Audit Services and
Corporate Performance. Research Journal of Finance and Accounting.
Kimari, F. N. (2013). Effect of Credit Risk Management on Financial Performance of
Deposit Taking Savings and Credit Cooperative Societies in Kenya (Doctoral
Dissertation, University of Nairobi).
147
Kinyua, J. W. (2013). Relationship Between Financial Performance and Size of
Deposit Taking Savings and Credit Cooperative Societies in Kenya (Doctoral
Dissertation, University of Nairobi).
Kioko, C. (2014). Credit Information Sharing Influence on Performance of Licensed
Deposit Taking SACCO Businesses in Kenya. Strategic Journal of Business &
Change Management, 1(2).
Kiragu, J. M., & Okimbo, B. (2014). Financial Factors Influencing Performance of
Savings and Credit Corporative Organization in Kenya.
Kivuvo, R. M., & Olweny, T. (2014). Financial Performance Analysis of Kenya’s
SACCO Sector Using the Altima Z Score model of corporate bankruptcy.
international journal of business and social science, 5(9).
Kiyotaki, N., & Wright, R. (1989). On Money as a Medium of Exchange, JPE 97, 927-
54.
Kiyotaki, N., & Wright, R. (1991). A contribution to the pure theory of money. JET
53, 215-35.
Kiyotaki, N., & Wright, R. (1993). A search-Theoretic approach to monetary
economics, AER 83, 63-77
Kombo, D. K., & Tromp, D. L. A. (2009). Proposal and Thesis Writing: An
Introduction. Paulines Publications Africa, Don Bosco Printing Press, Nairobi
Kenya
Kongiri, A. T. (2012). Digital Repository. Retrieved January 26, 2016, From
University Of Nairobi: Http://Erepository.Uonbi.Ac.Ke.
Kosiba, J. O. (2012). Membership and Financial Performance: A survey of selected
savings and credit cooperative Societies in Kenya (Doctoral Dissertation,
University of Nairobi, Kenya).
Kosmidou, K., Tanna, S., & Pasiouras, F. (2005, June). Determinants of profitability
of domestic UK commercial banks: panel evidence from the period 1995 -2002.
148
In Money Macro and Finance (MMF) Research Group Conference (Vol. 45,
pp. 1-27).
Kothari, C. (2004). Research Methodology: Methods & Techniques. 2nd Edition. New
Age International Publishers, New Delhi, India.
KUSCCO. (2006). The SACCO Family Union Newspaper, Nairobi, A Journal Kenya
Union of Savings Credit Co-Operate Unions (KUSCCO).
Lavrakas, P. J. (2008). Encyclopedia of Survey Research Methods. Sage Publications.
Louis, C., Lawrence, M., & Morrison, K. (2007). Research Methods in Education, 6th
Edition. Routledge, New York, United States of America.
Luqman, O. S. (2014). The Effect of Credit Risk on the Performance of Commercial
Banks in Nigeria. Journal of Social Science Research Network, 45: 4, 117-139.
Maisel, S. J. (1979). Risk and capital adequacy in banks. In Regulation of Financial
Institutions Conference Series No (Vol. 21, pp. 203-63).
Majithiya, R., & Pattani, A. (2010). Rating the performance of the bank through
CAMELS model (Post Diploma thesis), Tolani Institute of Management
Studies, India.
Makori, J., Munene, C. & Muturi, W. (2013). The challenges facing deposittaking
Savings and Credit Cooperative Societies’ regulatory compliance in Kenya. A
case of the Gusii Region, Interdisciplinary Journal of Contemporary Research
in Business, 4(12)
Manyuanda, M. O. (2014). The Effect of Nonperforming Loans on the Financial
Performance of Savings and Credit Co-Operative Societies in Nairobi County,
Kenya.
Markowitz, H. (1959). Portfolio Selection. Cowles Monograph, 16. Wiley, New York
Marozva, G. (2015). Liquidity and Bank Performance. International Business &
Economics Research Journal (IBER), 14(3), 453-562.
Merchant, I. P. (2012). Performance analysis of banks using CAMEL approach, An
Empirical study of Islamic Banks Versus Conventional Banks of GCC.
149
Menicucci E., & Paolucci, G. (2016). Factors affecting bank profitability in Europe:
an empirical investigation. African Journal of Business Management 10 (17):
410–420. https://doi.org/10.5897/ AJBM2016.8081
Maseki, C. (2012). Knowledge Management and Performance of Commercial Banks
in Kenya (Doctoral Dissertation, University of Nairobi).
Mckillop, D., & Wilson, J. (2011). Credit Unions, a Theoretical and Empirical
Overview. Periodicals, Inc. New York: University Salomon Center and Wiley.
Milanova, D. (2010). Management of Change and Change of Management. Trakia
Journal of Sciences, 8(3), 140-142.
Miller, G. J., & Yang, K. (2008). Handbook of Research Methods in Public
Administration. Auerbach Publications, Newyork.
Miriti, J. M. (2014). Factors Influencing Financial Performance of Savings and Credit
Cooperative Societies. A Case of Capital Sacco, Meru County, Kenya
(Doctoral Dissertation, University Of Nairobi).
Modigliani, F. & Miller, M. H. (1959). The Cost of Capital, Corporate Finance and
The Theory of Investment, American Economic Survey. Vol. 48
Mugenda, A. G. (2008). Social Science Research: Theory and Principles. Nairobi,
Kenya
Mugenda, O. & Mugenda, A. (2003). Research Methods Quantitative and Qualitative
Approaches. Africa Centre for Technology, Acts Press, Nairobi, Kenya.
Muiruri, P. M., Memba, F. & Njeru, A. (2015). Moderating Effect of Bank Ownership
on the Relationship between Securitization Uptake and Financial Performance
of Commercial Banks in Kenya. Academic Journal of Economic Studies. Vol.
1 No 2nd june 2015 Pp24-43.
Murthy, Y., Sree, R. (2003). A Study on Financial Ratios of major Commercial Banks.
Research Studies, College of Banking & Financial Studies, Sultanate of Oman.
Mvula, P. (2013). Factors Affecting Financial Performance of Savings and Credit
Societies. Research Publish
150
Myers, S. (1990). Corporate Financing and Investment Decisions When Firms Have
Information That Investors Do Not Have, Journal of Financial Economics
13(2), 187 – 221.
Naceur, S. B. & Kandil, M. (2006). The Impact of Capital Requirement on Bank
Performance. The Case of Egypt. Social Science Research Network
Naceur, S. (2003). The Determinants of the Tunisian Banking Industry Profitability:
Panel Evidence.
Nazir, T. (2010). Analyzing Financial Performance of Commercial Banks in India:
Application of CAMEL Model. Pakistan Journal of Commerce & Social
Sciences, 4(1).
Ngaira, L. (2011). The Impact of SACCO Regulatory Authority Guidelines on SACCO
Operations in Kenya-The Case of Nairobi Deposit Taking Saccos (Doctoral
Dissertation, School of Business, University of Nairobi).
Ngalawa, J., & Ngare, P. (2013). Interest rate risk management for commercial banks
in Kenya. Journal of Economics and Finance (IOSR-JEF) e-ISSN: 2321-5933,
Retrieved from; www.iosrjournals.org risk exposure on Kenyan financial
performance.
Ngechu, M. (2004). Understanding the Research Process and Methods, An
Introduction to Research Methods. Acts Press, Nairobi.
Ngo, P.T. (2006). Endogenous Capital and Profitability in Banking. ANUCBE school
of Economics Working Paper, 464.
Ngo’mbe, B. W., & Mikwamba, E. (2004). Know More About SACCO. A Handbook
for SACCO Study Circle Programme. Malawi Union of Savings and Credit
Cooperative, Lilongwe, Malawi.
Ngwu, T. C. (2006). Bank Management. Owerri: Bob Publishers.
Ngui, A. N. (2010). A survey of the use of financial performance indicators by
SACCOS in Kenya, An unpublished MBA Thesis, University of Nairobi
151
Nieswiadomy, R.M. (2008). Foundations of Nursing Research. 5th ed. New Jersey:
Pearson.
Njoroge, L.W.N. (2008). Determinants of financial performance in savings and credit
cooperative societies in Nairobi. Unpublished MBA project, Nairobi:
University of Nairobi.
Nyambere, (2013). Effects of Credit Risk Management on Financial Performance of
Deposit Taking Savings and Credit Co-operative Societies in Kenya.
University of Nairobi.
Nzongang, T. & Atemnkeng, J. T. (2006). Market Structure and Profitability
Performance in Banking Industry of CFA countries: the case of Commercial
Banks in Cameroon. Working. paper.
Odhiambo, J. (2011). The relationship between working capital management and
financial performance of deposit taking Savings and credit Co-operatives
societies licensed by SACCO Societies Regulatory Authority in Nairobi county.
Unpublished Phd Thesis, Nairobi: University of Nairobi.
Odunga, R. M., Nyangweso, P. M., Carter, D. A., & Mwarumba, M. (2013). Credit
Risk, Capital Adequacy and Operating Efficiency of Commercial Banks in
Kenya. International Journal of Business and Management Invention, 2(9).
Ogilo, F. (2012). The Impact of Credit Risk Management on Financial Performance
of Commercial Banks in Kenya. DBA Africa Management Review 2012, Vol
3 No 1, 22-37
Okundi, H. O. (2011). Financial Challenges Facing Savings And Credit Co-operative
Societies in Kenya: The Case of Saccos in Nairobi (Doctoral Dissertation,
University of University).
Okwee, A. (2011). Corporate governance and financial performance of SACCOS in
Lango sub region. Unpublished MSc. Thesis, Kampala: Makerere University.
Olagunju, A., David, A. O., & Samuel, O. O. (2011). Liquidity Management and
Commercial Banks' Profitability in Nigeria. Research Journal of finance and
accounting , 7-8.
152
Olando, C., Jagongo, A., & Mbewa, M. (2013). The contribution of SACCO financial
stewardship to growth of SACCOS in Kenya. International Journal of
humanities and social sciences, 3(17), 1.
Olalekan, A., Adeyinka, S. (2013). Capital adequacy and banks’ profitability: an
empirical evidence from Nigeria. American International Journal of
Contemporary Research 3 (10): 87–93.
Olando, C. O., Mbewa, M. O. & Jagongo, A. (2012). Financial practice as a
determinant of growth of savings and credit co-operative societies wealth (a
pointer to overcoming poverty challenges in Kenya), International journal of
Business and social science.
Omino, P. A. (2014). Liquidity risk mitigation measures and financial performance of
savings and credit co-operative societies (SACCOs) in Kisumu County-Kenya
(Doctoral dissertation, University of Nairobi).
Omisore, I., Munirat, Y. & Nwufo, C. (2012). The modern portfolio theory as an
investment decision tool. Journal of Accounting and Taxation Vol. 4(2), 19-28
Onaolapo and Adebayo E. O (2012) Effect of Capital Adequacy on the Profitability of
the Nigerian Banking Sector, Journal of Money, Investment and Banking, Euro
Journals
Ongore V. O. & Kisa B. G. (2003). determinants of financial performance of
commercial banks in Kenya. International journal of economics and financial
issues.Vol 3. No 2013 pp237-252.
Opiyo, I. (2014). SACCOs should analyse financial reports to understand members.
Retrieved January 26, 2016, from Business Daily:
http://www.businessdailyafrica.com
Organisation for Economic Co-operation and Development. (2007). OECD economic
surveys: Ukraine : economic assessment. Paris: OECD.
Oyugi, I. G. (2014). The effect of automated service on financial performance of
savings and credit cooperative societies licensed by SACCO society regulatory
authority in Kenya (Doctoral dissertation, University of Nairobi).
153
Ozgur, O., Gorus MS (2016) Determinants of deposit bank profitability: evidence from
Turkey. Journal of Applied Economics and Business Research 6 (3): 218–231.
Pandey, I. M. (2010). Financial Management. Vikas Publishing House (PVT) Ltd,
New Delhi
Penman, S. H., & Penman, S. H. (2007). Financial statement analysis and security
valuation (p. 476). New York: Mc Graw-Hill.
Polit, D., & Beck, C. (2003). Nursing Research: Principles & Methods, 7th Edition,
Lippincott, Williams & Wilkins, United States of America.
Polleit, T., & Gerdesmeier, D. (2005). Measures of excess liquidity (No. 65). Working
paper series//Frankfurt School of Finance & Management
Rhoades, S. A. (1985). Market Share as a Source of Market Power: Implications and
Some Evidence. Journal of Economics and Business, 37(4), 343-363.
Reddy, S. K. (2012). Relative Performance of commercial banks in India using
CAMEL approach. International Journal of Multidisciplinary Research, 2(3),
38-58.
Rees, R. (1974). A reconsideration of the expense preference theory of the Firm.
Economica, 41(2), 295-307.
Rockafellar, R. T. (1970). Convex Analysis. Vol. 28 Princeton Math. Series, Princeton
Uni-versity Press, Princeton,
SACCO Societies Act. (2008). Capital adequacy for deposit taking SACCOs. Nairobi:
government printers.
Sahajwala, R & P. V. D. Bergh (2000). Supervisory Risk Assessment and Early
Warning Systems. Basel Committee on Banking Supervision Working Papers
No. 4, Bank for International Settlements (BIS). Basel, Switzerland, December.
Sasra. (2013). Sasra 2013 Sacco Supervision Report. Nairobi.
Sasra. (2015). Sasra 2015 Sacco Supervision Report. Nairobi.
Sasra. (2010). Sasra 2010 Sacco Supervision Report. Nairobi.
154
Sasra. (2009). Sasra 2009 Sacco Supervision Report. Nairobi.
Sasra. (2008). Sasra 2008 Sacco Supervision Report. Nairobi.
Sasra. (2012). Sacco Supervision Report: Deposit Taking Saccos. In House
Publication.
Said, R. M., Mohd, H. T. (2011). Performance and Financial Ratios of Commercial
Banks in Malasia and China.
Saona, P. (2010). Capital Structure and Performance in the US Banking Industry.
Available at SSRN 1617830.
Saunders, M., Lewis, P., Thornhill, A., & Wang, C. (2009). Analyzing Qualitative
Data. Research Methods for Business Students. 5th Ed.. Harlow, Essex, UK:
Pearson Education Ltd, 480-525.
Saunders, A., & Cornett, M. M. (2011). Financial Markets and Institutions: An
Introduction to a Risk Management Approach. (3rd Ed). New Delhi: Savings
Banks.
Schaeck, K. (2008). Bank liability structure, FDIC loss, and time to failure: A quantile
regression approach. Journal of Financial Services Research, 33(3), 163-179.
Schenk, C. R. (2007). The rise of Hong Kong and Tokyo as international financial
centres after 1950.
Sekaran, U., & Bougie, R. (2011). Research Methods for Business: A Skill Building
Approach. 5th Edition. Aggarwal Printing Press, Delhi, ISBN: 978-81-265-
3131-8
Schindler, D. R., & Cooper, P. S. (2008). Business Research Methods.
Schumpeter, J. A. (1928). The Instability of Capitalism. The Economic Journal.
Schumpeter, J. A. (1939). Business Cycles. Mcgraw-Hill: New York.
Shamoo, A. E., & Resnik, B. R. (2003). Responsible Conduct of Research. New York:
Oxford University Press.
155
Sharpe, W. F. (1964). Capital asset prices: A theory of market equilibrium under
conditions of risk. Journal of Finance , 19:425{442, 1964.
Sharpe, W. F. (1966). Mutual fund performance. Journal of Business, 1:119{138,
Shepherd, W. G. (1986). Tobins’q and the Structure-Performance Relationship:
Comment, The American Economic Review, Vol.76, No.5, pp. 1205-1210.
Smirlock, M. (1985). Evidence of the Non-Relationship between Concentration and
Profitability in Banking. Journal of Money, Credit and Banking, 17(1), 69-83.
Sonja, K. (2010). Effect of Computerization on Performance of Saccos in Uganda.
Unpublished MBA Research Project Reutlingen Germany.
Sufian, F., & Chong, R. R. (2008). Determinants of Bank Profitability in a Developing
Economy: Empirical Evidence from Philippines. Asian Academy of
Management Journal of Accounting and Finance.
Swamy, V. (2013). Determinants of Bank Asset Quality and Profitability -An
Empirical Assessment. IBS –Hyderabad MPRA Paper No. 47513
Tahir, A., & Sajjad, S. (2013). Assessing the Impact of Training on Employees’
Performance in Commercial Banks in Urban Lahore.
Taye, H. (2014). Analysis on liquidity management practices of five private
commercial banks in Ethiopia (Doctoral dissertation, St. Mary's University,
Ethiopia).
Thoraneenitiyan, N. (2010). Measuring Bank Performance in the Current Evolving
Market Place. Abac Journal, 30(3), 1-14.
Tobin, J. (1958). Liquidity Preference as Behavior Towards Risk. The Review of
Economic Studies, 65-86.
Tomuleasa, L. L. (2014). Measuring the Financial Performance of the European
Systemically important Banks.Vasile COCRIS university, France.
Vision, 2030. (2008). Republic of Kenya, a Globally Competitive and Prosperous
Kenya. First medium-term plan 2008-2012, Ministry of State for Planning,
National Development and Vision 2030.
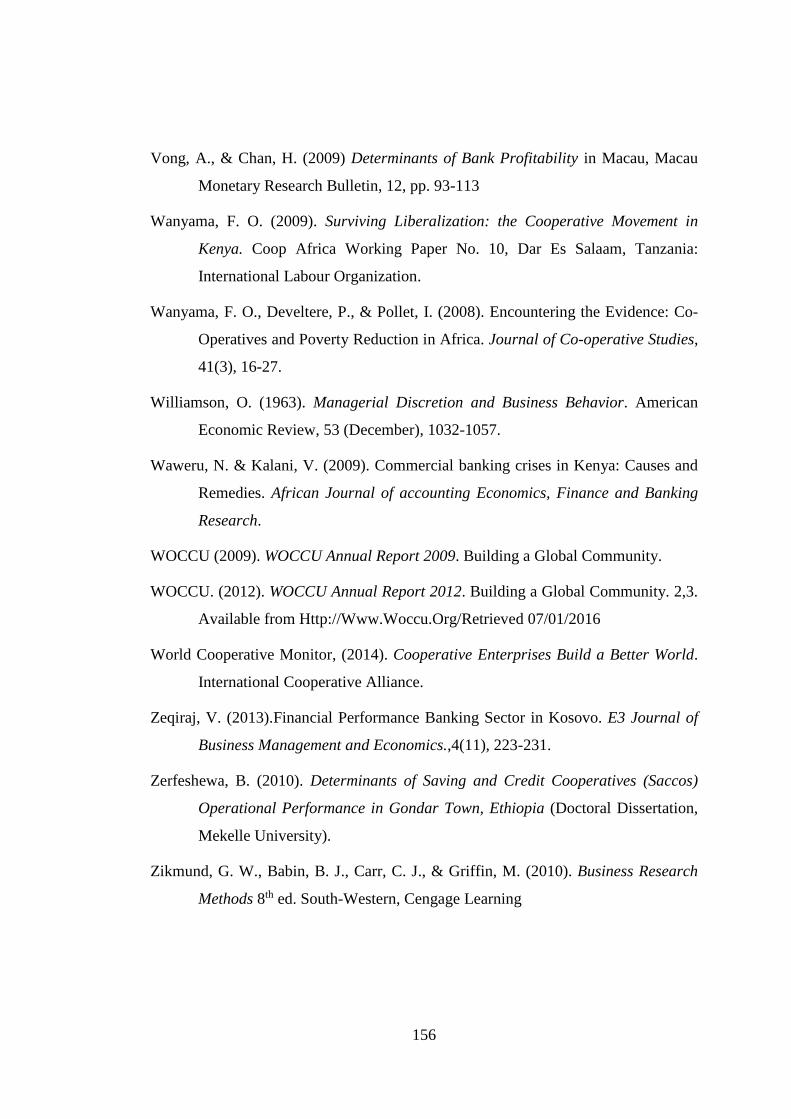
156
Vong, A., & Chan, H. (2009) Determinants of Bank Profitability in Macau, Macau
Monetary Research Bulletin, 12, pp. 93-113
Wanyama, F. O. (2009). Surviving Liberalization: the Cooperative Movement in
Kenya. Coop Africa Working Paper No. 10, Dar Es Salaam, Tanzania:
International Labour Organization.
Wanyama, F. O., Develtere, P., & Pollet, I. (2008). Encountering the Evidence: Co-
Operatives and Poverty Reduction in Africa. Journal of Co-operative Studies,
41(3), 16-27.
Williamson, O. (1963). Managerial Discretion and Business Behavior. American
Economic Review, 53 (December), 1032-1057.
Waweru, N. & Kalani, V. (2009). Commercial banking crises in Kenya: Causes and
Remedies. African Journal of accounting Economics, Finance and Banking
Research.
WOCCU (2009). WOCCU Annual Report 2009. Building a Global Community.
WOCCU. (2012). WOCCU Annual Report 2012. Building a Global Community. 2,3.
Available from Http://Www.Woccu.Org/Retrieved 07/01/2016
World Cooperative Monitor, (2014). Cooperative Enterprises Build a Better World.
International Cooperative Alliance.
Zeqiraj, V. (2013).Financial Performance Banking Sector in Kosovo. E3 Journal of
Business Management and Economics.,4(11), 223-231.
Zerfeshewa, B. (2010). Determinants of Saving and Credit Cooperatives (Saccos)
Operational Performance in Gondar Town, Ethiopia (Doctoral Dissertation,
Mekelle University).
Zikmund, G. W., Babin, B. J., Carr, C. J., & Griffin, M. (2010). Business Research
Methods 8th ed. South-Western, Cengage Learning

157
APPENDICES
Appendix I: Questionnaire
This questionnaire is divided into nine short sections that should take only a few
moments of your time to complete. Please respond by ticking the appropriate box or
filling in your answers in the blank spaces provided. This is an academic exercise and
all information collected from respondents will be treated with strict confidentiality.
Thank you very much for your cooperation
SECTION 1: GENERAL INFORMATION
1. Name of the SACCO (optional)…….………………………….
2. Who are your members? ....................................................
3. How long has the SACCO been in existence? ………………...
SECTION 2: CAPITAL ADEQUACY
To what extent do you agree or disagree with the following statements on capital
adequacy? Where; 5 strongly agree, 4 agree, 3 neutral 2 disagree, 1 strongly disagree.
Capital Adequacy Ratios 5 4 3 2 1
1 Observing the core capital to total asset
requirement has improved the financial
performance of the Sacco
2 Observing the institutional capital to
total asset requirement has improved
the financial performance of the Sacco
3 Observing the minimum core capital
requirement of Kshs. 10 million has
improved the financial performance of
the Sacco
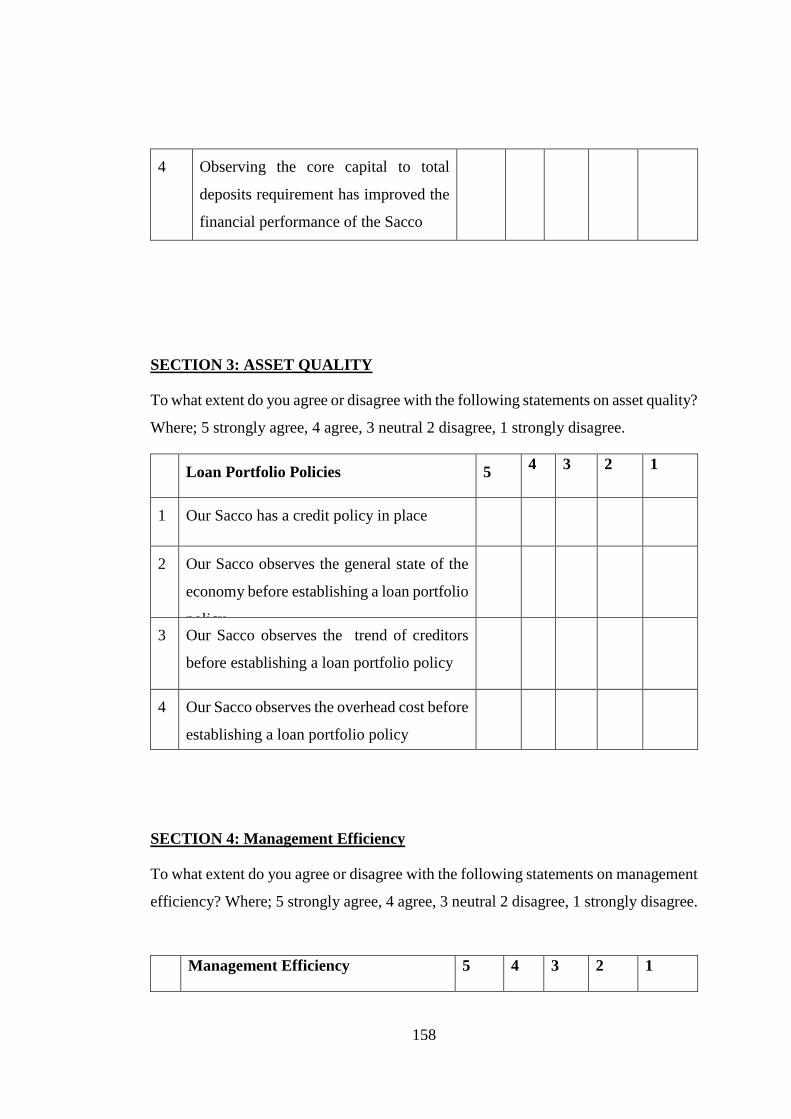
158
4 Observing the core capital to total
deposits requirement has improved the
financial performance of the Sacco
SECTION 3: ASSET QUALITY
To what extent do you agree or disagree with the following statements on asset quality?
Where; 5 strongly agree, 4 agree, 3 neutral 2 disagree, 1 strongly disagree.
Loan Portfolio Policies 5 4 3 2 1
1 Our Sacco has a credit policy in place
2 Our Sacco observes the general state of the
economy before establishing a loan portfolio
policy
3 Our Sacco observes the trend of creditors
before establishing a loan portfolio policy
4 Our Sacco observes the overhead cost before
establishing a loan portfolio policy
SECTION 4: Management Efficiency
To what extent do you agree or disagree with the following statements on management
efficiency? Where; 5 strongly agree, 4 agree, 3 neutral 2 disagree, 1 strongly disagree.
Management Efficiency 5 4 3 2 1
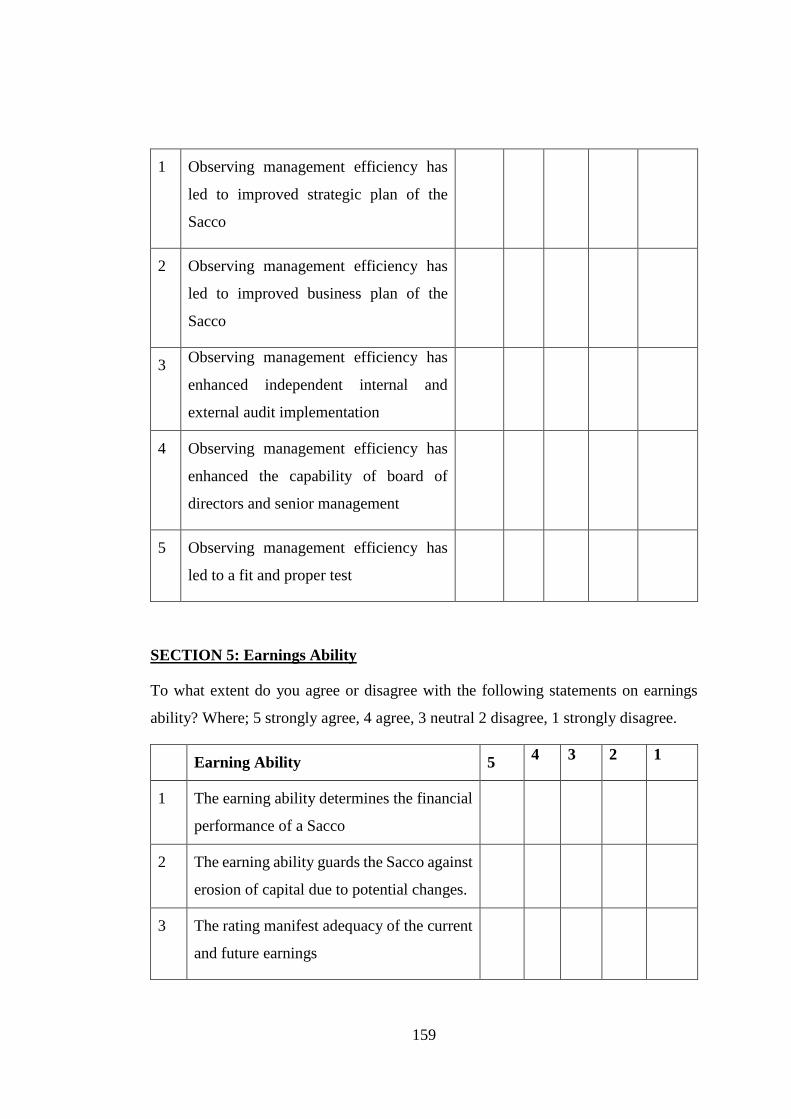
159
1 Observing management efficiency has
led to improved strategic plan of the
Sacco
2 Observing management efficiency has
led to improved business plan of the
Sacco
3 Observing management efficiency has
enhanced independent internal and
external audit implementation
4 Observing management efficiency has
enhanced the capability of board of
directors and senior management
5 Observing management efficiency has
led to a fit and proper test
SECTION 5: Earnings Ability
To what extent do you agree or disagree with the following statements on earnings
ability? Where; 5 strongly agree, 4 agree, 3 neutral 2 disagree, 1 strongly disagree.
Earning Ability 5 4 3 2 1
1 The earning ability determines the financial
performance of a Sacco
2 The earning ability guards the Sacco against
erosion of capital due to potential changes.
3 The rating manifest adequacy of the current
and future earnings
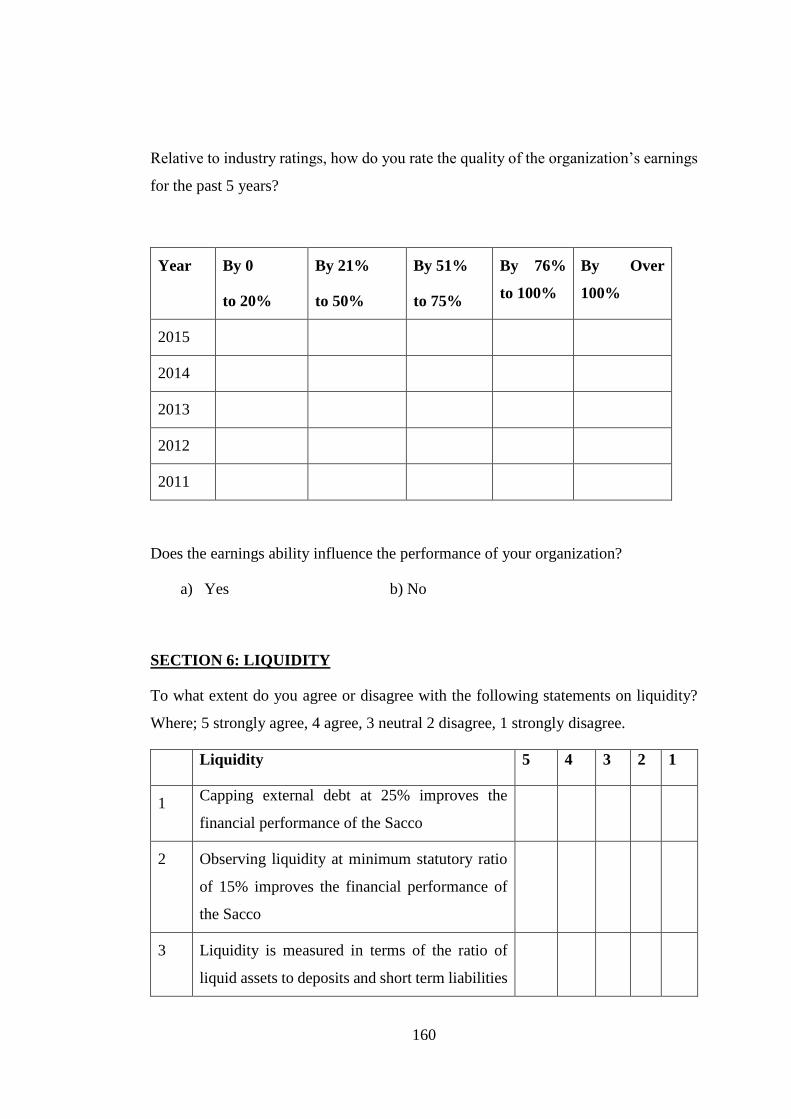
160
Relative to industry ratings, how do you rate the quality of the organization’s earnings
for the past 5 years?
Year By 0
to 20%
By 21%
to 50%
By 51%
to 75%
By 76%
to 100%
By Over
100%
2015
2014
2013
2012
2011
Does the earnings ability influence the performance of your organization?
a) Yes b) No
SECTION 6: LIQUIDITY
To what extent do you agree or disagree with the following statements on liquidity?
Where; 5 strongly agree, 4 agree, 3 neutral 2 disagree, 1 strongly disagree.
Liquidity 5 4 3 2 1
1 Capping external debt at 25% improves the
financial performance of the Sacco
2 Observing liquidity at minimum statutory ratio
of 15% improves the financial performance of
the Sacco
3 Liquidity is measured in terms of the ratio of
liquid assets to deposits and short term liabilities
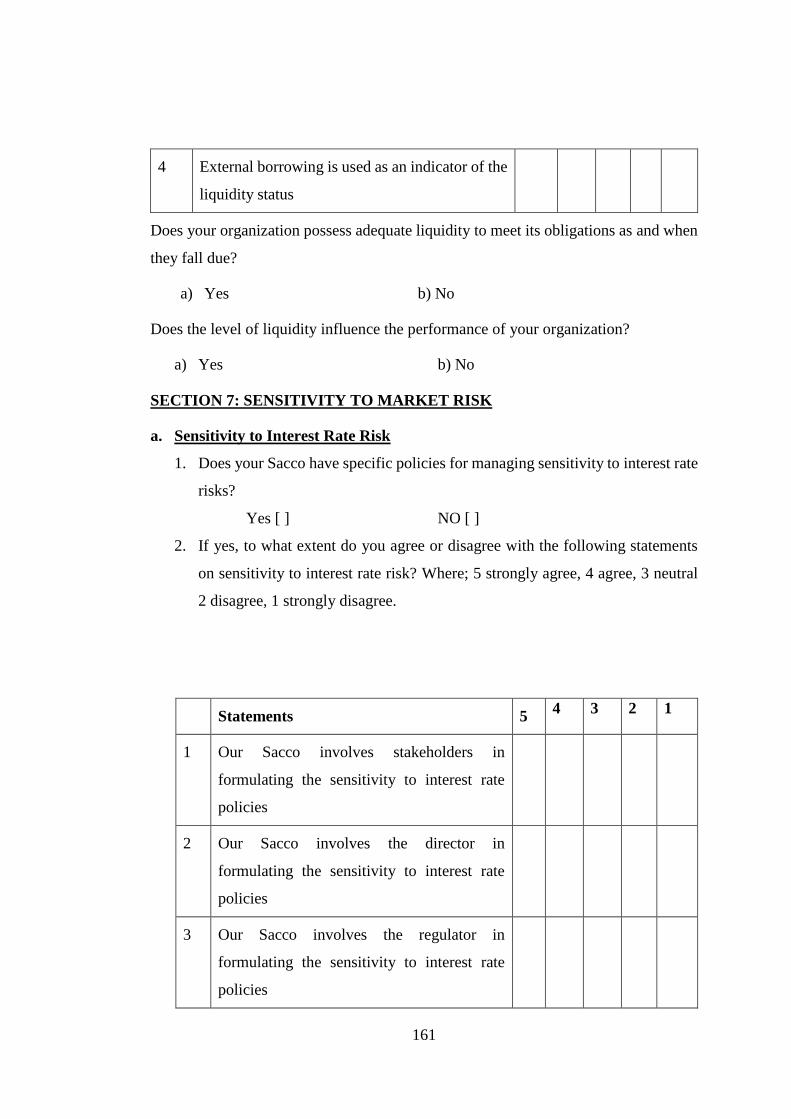
161
4 External borrowing is used as an indicator of the
liquidity status
Does your organization possess adequate liquidity to meet its obligations as and when
they fall due?
a) Yes b) No
Does the level of liquidity influence the performance of your organization?
a) Yes b) No
SECTION 7: SENSITIVITY TO MARKET RISK
a. Sensitivity to Interest Rate Risk
1. Does your Sacco have specific policies for managing sensitivity to interest rate
risks?
Yes [ ] NO [ ]
2. If yes, to what extent do you agree or disagree with the following statements
on sensitivity to interest rate risk? Where; 5 strongly agree, 4 agree, 3 neutral
2 disagree, 1 strongly disagree.
Statements 5 4 3 2 1
1 Our Sacco involves stakeholders in
formulating the sensitivity to interest rate
policies
2 Our Sacco involves the director in
formulating the sensitivity to interest rate
policies
3 Our Sacco involves the regulator in
formulating the sensitivity to interest rate
policies

162
b. Sensitivity to Inflation Risk
1. Does your Sacco have specific policies for managing sensitivity to inflation
risks?
Yes [ ] No [ ]
2. If yes, to what extent do you agree or disagree with the following statements
on sensitivity to inflation rate risk? Where; 5 strongly agree, 4 agree, 3 neutral
2 disagree, 1 strongly disagree.
Statements 5 4 3 2 1
1 Our Sacco involves stakeholders in
formulating the sensitivity to inflation rate
policies
2 Our Sacco involves the director in
formulating the sensitivity to inflation rate
policies
3 Our Sacco involves the regulator in
formulating the sensitivity to inflation rate
policies
SECTION 8: PERFORMANCE OF DEPOSIT TAKING SACCO
Has your organization been making profits?
a) Yes [ ] b) No [ ]

163
If yes, to what extent do you agree or disagree with the following statements about the
performance of your organization? Where; 5 is strongly agree and 4 is agree, 3 Neutral,
2 is disagree and 1 is strongly disagree
Performance 5 4 3 2 1
1 Our Sacco has experienced growth in retained
earnings
2 There has been an increase in shareholders’
dividends
3 There has been growth in dividend per share.
4 Our organization declares dividends
5 There has been contributions towards retained
earnings
6 Surpluses distributed depend on profit
determined
7 Surpluses distributed depends on shareholders
expectations
8 Surpluses distributed depend on volumes of
profits
9 Surpluses distributed as dividends depend on any
method

164
Appendix II: List of SACCOS
LICENSED SACCO SOCIETIES FOR PERIOD ENDING 1ST JANUARY 2012
1. AFYA SACCO SOCIETY LIMITED
2. ASILI SACCO SOCIETY LIMITED
3. BANDARI SACCO SOCIETY LIMITED
4. BARAKA SACCO SOCIETY LIMITED
5. BARINGO FARMERS SACCO SOCIETY Limited
6. BARINGO TEACHERS SACCO
7. SOCIETY LIMITED BIASHARA SACCO SOCIETY LIMITED
8. BINGWA/KIRINYAGA TEA SACCOSOCIETY LIMITED
9. BORABU FARMERS TEA SACCO SOCIETY LIMITED
10. BUNGOMA TEACHERS SACCOSOCIETY LIMITED
11. BURETI TEA SACCO SOCIETYLIMITED
12. CHAI SACCO SOCIETY LIMITED
13. CHEMELIL SACCO SOCIETY LIMITED
14. CHEPSOL TEA GROWERS SACCO SOCIETY LIMITED
15. COMOCO SACCO SOCIETY LIMITED
16. DIOCESE OF MERU SACCO SOCIETY LIMITED
17. EMBU TEACHERS SACCO SOCIETY LIMITED
18. FARIJI SACCO SOCIETY LIMITED
19. GITHUNGURI DAIRY SACCOSOCIETY LIMITED
20. GUSII MWALIMU SACCO SOCIETY LIMITED
21. HARAMBEE SACCO SOCIETY LIMITED
22. IRIANYI TEA SACCO SOCIETY LIMITED
23. JAMII SACCO SOCIETY LIMITED
24. KAKAMEGA TEACHERS SACCO SOCIETY LIMITED
165
25. KEIYO TEACHERS SACCO SOCIETY LIMITED
26. KENPIPE SACCO SOCIETY LIMITED
27. KENYA CANNERS SACCO SOCIETY LIMITED
28. KENYA POLICE SACCO SOCIETY LIMITED
29. KERICHO TEA/K.H. SACCO SOCIETY LIMITED
30. KIAMBAA DAIRY RURAL SACCO SOCIETY LIMITED
31. KIAMBU UNITY FINANCE SACCO SOCIETY LIMITED
32. KILIFI TEACHERS SACCO SOCIETY LIMITED
33. KINGDOM SACCO SOCIETY LIMITED
34. KIPSIGIS TEACHERS SACCO SOCIETY LIMITED
35 KIPSIGIS TEACHERS CO-OP
35. KITE SACCO SOCIETY LIMITED
36. KITUI TEACHERS SACCO SOCIETY LIMITED
37. KMFRI SACCO SOCIETY LIMITED
38. KONOIN TEA GROWERS SACCO SOCIETY LIMITED
39. KURIA TEACHERS SACCO SOCIETY LIMITED
40. MAGADI SACCO SOCIETY LIMITED
41. MATHIRA COFFEE FARMERS SACCO SOCIETY LIMITED
42. MAUA METHODIST SACCO SOCIETY LIMITED
43. MERU SOUTH FARMERS SACCO SOCIETY LIMITED
44. METROPOLITAN SACCO SOCIETY LIMITED
45. MOMBASA PORT SACCO SOCIETY LIMITED
46. MOMBASA TEACHERS SACCO SOCIETY LIMITED
47. MUHIGIA SACCO SOCIETY LIMITED
48. MUMIAS OUTGROWERS SACCO SOCIETY LIMITED
49. MUNGANIA TG SACCO SOCIETY LIMITED
166
50. MURAMATI SACCO SOCIETY LIMITED
51. MURANG’A TEACHERS SACCO SOCIETY LIMITED
52. MWALIMU SACCO SOCIETY LIMITED
53. MWITO SACCO SOCIETY LIMITED
54. NACICO SACCO SOCIETY LIMITED
55. NAKURU TEACHERS SACCO SOCIETY LIMITED
56. NANDI HEKIMA SACCO SOCIETY LIMITED
57. NAROK TEACHERS SACCO SOCIETY LIMITED
58. NATION STAFF SACCO SOCIETY LIMITED
59. NDEGE CHAI SACCO SOCIETY LIMITED
60. NITHI TEA GROWERS SACCO SOCIETY LIMITED
61. NYAMIRA TEA FARMERS SACCO SOCIETY LIMITED
62. NYANDARUA TEACHERS SACCO SOCIETY LIMITED
63. NYERI TEACHERS SACCO SOCIETY LIMITED
64. ORTHODOX SACCO SOCIETY LIMITED
65. SAFARICOM SACCO SOCIETY LIMITED
66. SHERIA SACCO SOCIETY LIMITED
67. SIAYA TEACHERS SACCO SOCIETY LIMITED
68. SIMBA CHAI SACCO SOCIETY LIMITED
69. SOT TEA GROWERS SACCO SOCIETY LIMITED
70. SOUTH IMENTI TG SACCO SOCIETY LIMITED
71. STIMA SACCO SOCIETY LIMITED
72. TAI/KIAMBU TG SACCO SOCIETY LIMITED
73. TAIFA SACCO SOCIETY LIMITED
74. TENHOS SACCO SOCIETY LIMITED
75. THARAKA NITHI TEACHRS SACCO SOCIETY LIMITED

167
76. TRANS-NZOIA TEACHERS SACCO SOCIETY LIMITED
77. UN SACCO SOCIETY LIMITED
78. UNIVERSAL TRADERS SACCO SOCIETY LIMITED
79. WAKENYA PAMOJA SACCO SOCIETY LIMITED
80. WAKULIMA DAIRY SACCO SOCIETY LIMITED
81. WANANCHI SACCO SOCIETY LIMITED
82. WANANDEGE SACCO SOCIETY LIMITED
83. WARENG TEACHERS SACCO SOCIETY LIMITED
Source: [email protected]
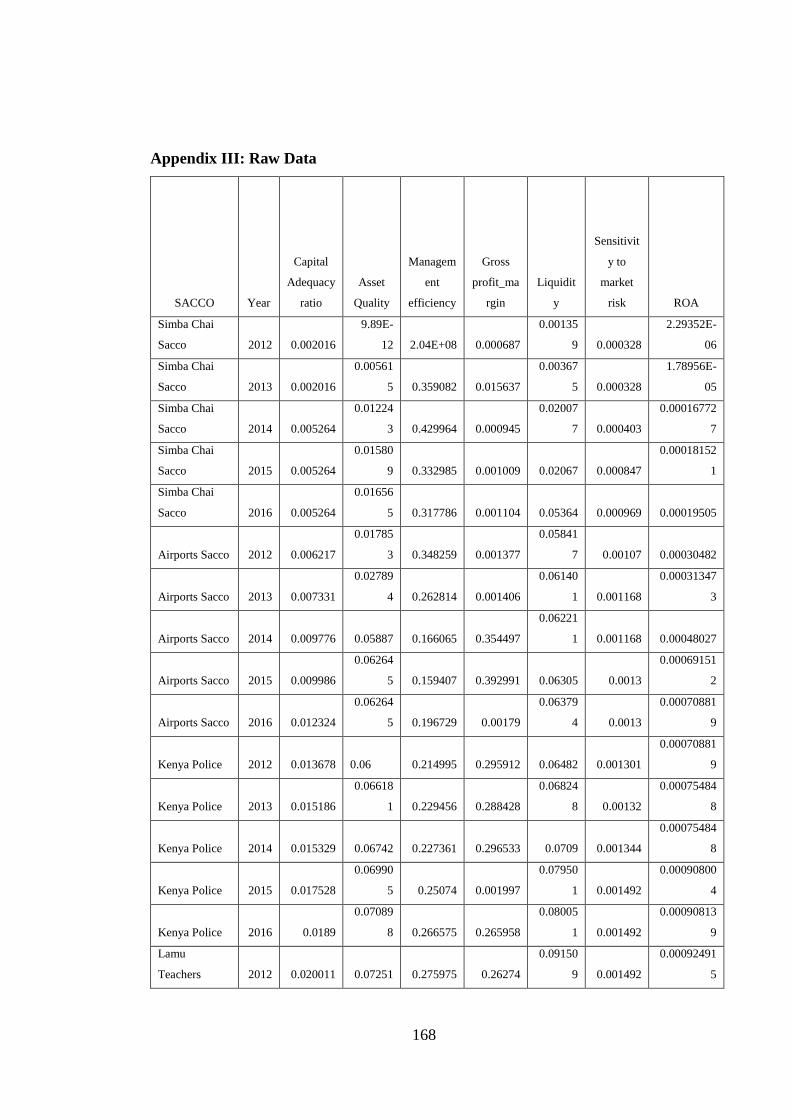
168
Appendix III: Raw Data
SACCO Year
Capital
Adequacy
ratio
Asset
Quality
Managem
ent
efficiency
Gross
profit_ma
rgin
Liquidit
y
Sensitivit
y to
market
risk ROA
Simba Chai
Sacco 2012 0.002016
9.89E-
12 2.04E+08 0.000687
0.00135
9 0.000328
2.29352E-
06
Simba Chai
Sacco 2013 0.002016
0.00561
5 0.359082 0.015637
0.00367
5 0.000328
1.78956E-
05
Simba Chai
Sacco 2014 0.005264
0.01224
3 0.429964 0.000945
0.02007
7 0.000403
0.00016772
7
Simba Chai
Sacco 2015 0.005264
0.01580
9 0.332985 0.001009 0.02067 0.000847
0.00018152
1
Simba Chai
Sacco 2016 0.005264
0.01656
5 0.317786 0.001104 0.05364 0.000969 0.00019505
Airports Sacco 2012 0.006217
0.01785
3 0.348259 0.001377
0.05841
7 0.00107 0.00030482
Airports Sacco 2013 0.007331
0.02789
4 0.262814 0.001406
0.06140
1 0.001168
0.00031347
3
Airports Sacco 2014 0.009776 0.05887 0.166065 0.354497
0.06221
1 0.001168 0.00048027
Airports Sacco 2015 0.009986
0.06264
5 0.159407 0.392991 0.06305 0.0013
0.00069151
2
Airports Sacco 2016 0.012324
0.06264
5 0.196729 0.00179
0.06379
4 0.0013
0.00070881
9
Kenya Police 2012 0.013678
0.06 0.214995 0.295912 0.06482 0.001301
0.00070881
9
Kenya Police 2013 0.015186
0.06618
1 0.229456 0.288428
0.06824
8 0.00132
0.00075484
8
Kenya Police 2014 0.015329 0.06742 0.227361 0.296533 0.0709 0.001344
0.00075484
8
Kenya Police 2015 0.017528
0.06990
5 0.25074 0.001997
0.07950
1 0.001492
0.00090800
4
Kenya Police 2016 0.0189
0.07089
8 0.266575 0.265958
0.08005
1 0.001492
0.00090813
9
Lamu
Teachers 2012 0.020011 0.07251 0.275975 0.26274
0.09150
9 0.001492
0.00092491
5
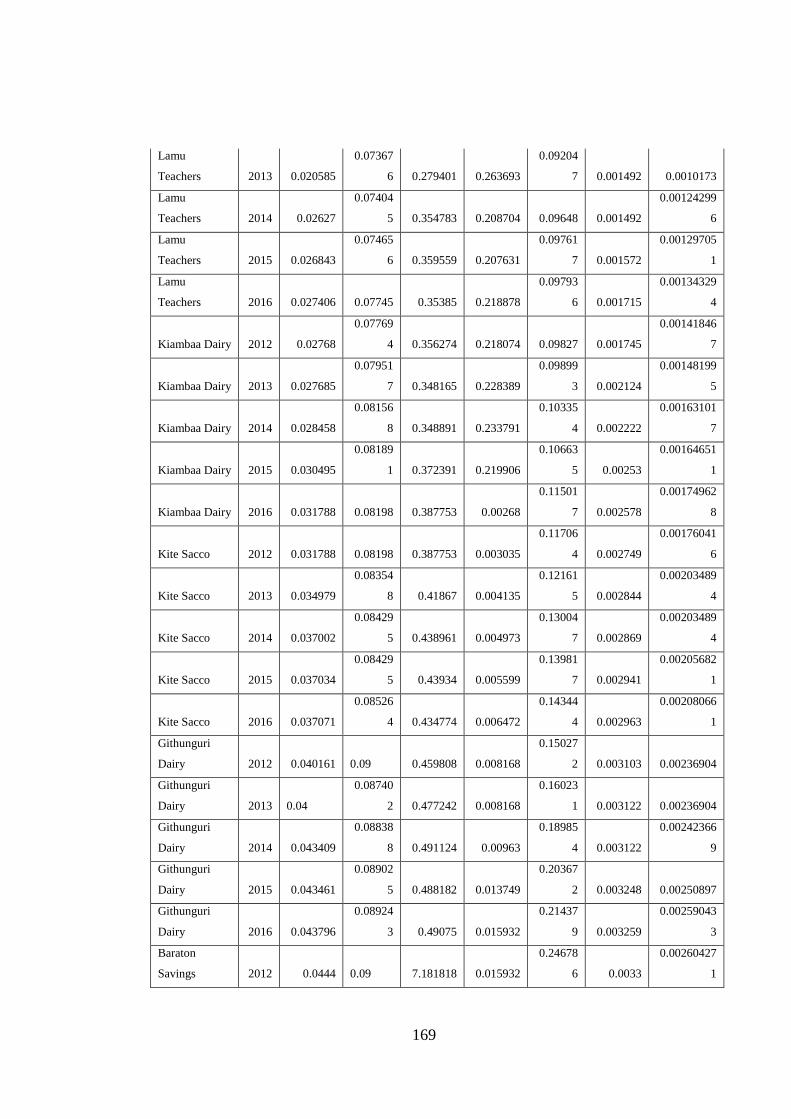
169
Lamu
Teachers 2013 0.020585
0.07367
6 0.279401 0.263693
0.09204
7 0.001492 0.0010173
Lamu
Teachers 2014 0.02627
0.07404
5 0.354783 0.208704 0.09648 0.001492
0.00124299
6
Lamu
Teachers 2015 0.026843
0.07465
6 0.359559 0.207631
0.09761
7 0.001572
0.00129705
1
Lamu
Teachers 2016 0.027406 0.07745 0.35385 0.218878
0.09793
6 0.001715
0.00134329
4
Kiambaa Dairy 2012 0.02768
0.07769
4 0.356274 0.218074 0.09827 0.001745
0.00141846
7
Kiambaa Dairy 2013 0.027685
0.07951
7 0.348165 0.228389
0.09899
3 0.002124
0.00148199
5
Kiambaa Dairy 2014 0.028458
0.08156
8 0.348891 0.233791
0.10335
4 0.002222
0.00163101
7
Kiambaa Dairy 2015 0.030495
0.08189
1 0.372391 0.219906
0.10663
5 0.00253
0.00164651
1
Kiambaa Dairy 2016 0.031788 0.08198 0.387753 0.00268
0.11501
7 0.002578
0.00174962
8
Kite Sacco 2012 0.031788 0.08198 0.387753 0.003035
0.11706
4 0.002749
0.00176041
6
Kite Sacco 2013 0.034979
0.08354
8 0.41867 0.004135
0.12161
5 0.002844
0.00203489
4
Kite Sacco 2014 0.037002
0.08429
5 0.438961 0.004973
0.13004
7 0.002869
0.00203489
4
Kite Sacco 2015 0.037034
0.08429
5 0.43934 0.005599
0.13981
7 0.002941
0.00205682
1
Kite Sacco 2016 0.037071
0.08526
4 0.434774 0.006472
0.14344
4 0.002963
0.00208066
1
Githunguri
Dairy 2012 0.040161
0.09 0.459808 0.008168
0.15027
2 0.003103 0.00236904
Githunguri
Dairy 2013
0.04
0.08740
2 0.477242 0.008168
0.16023
1 0.003122 0.00236904
Githunguri
Dairy 2014 0.043409
0.08838
8 0.491124 0.00963
0.18985
4 0.003122
0.00242366
9
Githunguri
Dairy 2015 0.043461
0.08902
5 0.488182 0.013749
0.20367
2 0.003248 0.00250897
Githunguri
Dairy 2016 0.043796
0.08924
3 0.49075 0.015932
0.21437
9 0.003259
0.00259043
3
Baraton
Savings 2012 0.0444
0.09 7.181818 0.015932
0.24678
6 0.0033
0.00260427
1
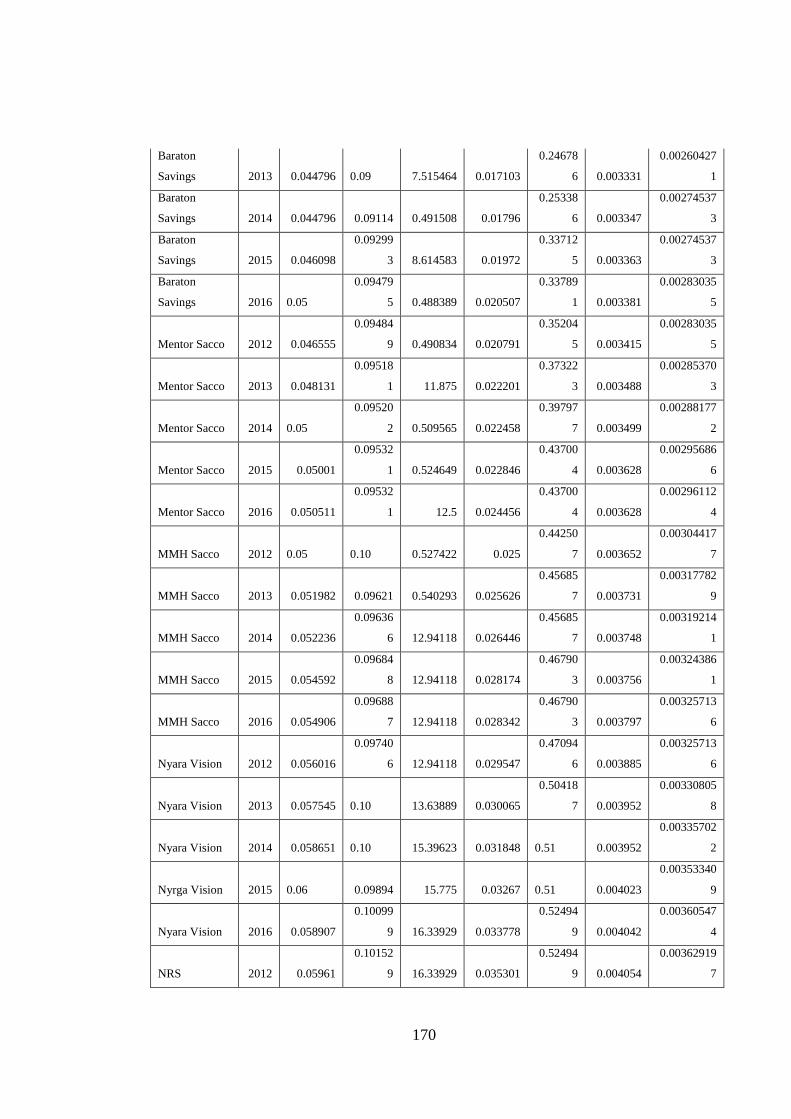
170
Baraton
Savings 2013 0.044796
0.09 7.515464 0.017103
0.24678
6 0.003331
0.00260427
1
Baraton
Savings 2014 0.044796 0.09114 0.491508 0.01796
0.25338
6 0.003347
0.00274537
3
Baraton
Savings 2015 0.046098
0.09299
3 8.614583 0.01972
0.33712
5 0.003363
0.00274537
3
Baraton
Savings 2016
0.05
0.09479
5 0.488389 0.020507
0.33789
1 0.003381
0.00283035
5
Mentor Sacco 2012 0.046555
0.09484
9 0.490834 0.020791
0.35204
5 0.003415
0.00283035
5
Mentor Sacco 2013 0.048131
0.09518
1 11.875 0.022201
0.37322
3 0.003488
0.00285370
3
Mentor Sacco 2014
0.05
0.09520
2 0.509565 0.022458
0.39797
7 0.003499
0.00288177
2
Mentor Sacco 2015 0.05001
0.09532
1 0.524649 0.022846
0.43700
4 0.003628
0.00295686
6
Mentor Sacco 2016 0.050511
0.09532
1 12.5 0.024456
0.43700
4 0.003628
0.00296112
4
MMH Sacco 2012
0.05
0.10 0.527422 0.025
0.44250
7 0.003652
0.00304417
7
MMH Sacco 2013 0.051982 0.09621 0.540293 0.025626
0.45685
7 0.003731
0.00317782
9
MMH Sacco 2014 0.052236
0.09636
6 12.94118 0.026446
0.45685
7 0.003748
0.00319214
1
MMH Sacco 2015 0.054592
0.09684
8 12.94118 0.028174
0.46790
3 0.003756
0.00324386
1
MMH Sacco 2016 0.054906
0.09688
7 12.94118 0.028342
0.46790
3 0.003797
0.00325713
6
Nyara Vision 2012 0.056016
0.09740
6 12.94118 0.029547
0.47094
6 0.003885
0.00325713
6
Nyara Vision 2013 0.057545
0.10 13.63889 0.030065
0.50418
7 0.003952
0.00330805
8
Nyara Vision 2014 0.058651
0.10 15.39623 0.031848
0.51 0.003952
0.00335702
2
Nyrga Vision 2015
0.06 0.09894 15.775 0.03267
0.51 0.004023
0.00353340
9
Nyara Vision 2016 0.058907
0.10099
9 16.33929 0.033778
0.52494
9 0.004042
0.00360547
4
NRS 2012 0.05961
0.10152
9 16.33929 0.035301
0.52494
9 0.004054
0.00362919
7
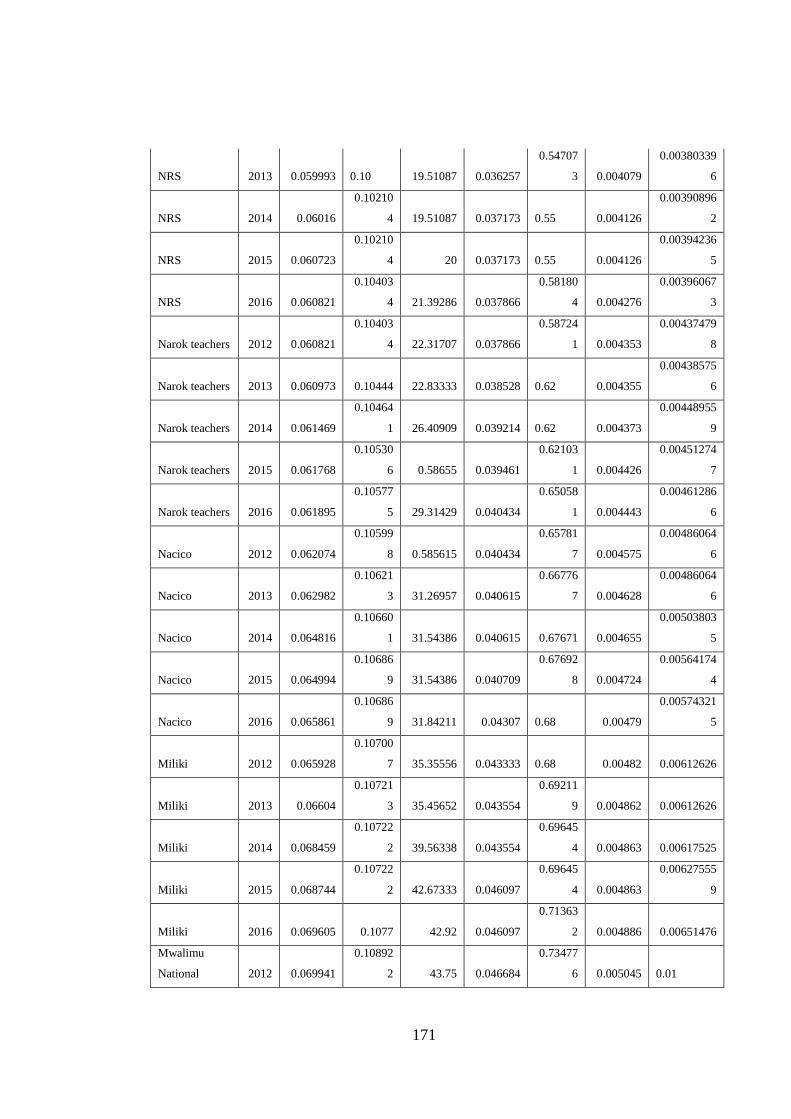
171
NRS 2013 0.059993
0.10 19.51087 0.036257
0.54707
3 0.004079
0.00380339
6
NRS 2014 0.06016
0.10210
4 19.51087 0.037173
0.55 0.004126
0.00390896
2
NRS 2015 0.060723
0.10210
4 20 0.037173
0.55 0.004126
0.00394236
5
NRS 2016 0.060821
0.10403
4 21.39286 0.037866
0.58180
4 0.004276
0.00396067
3
Narok teachers 2012 0.060821
0.10403
4 22.31707 0.037866
0.58724
1 0.004353
0.00437479
8
Narok teachers 2013 0.060973 0.10444 22.83333 0.038528
0.62 0.004355
0.00438575
6
Narok teachers 2014 0.061469
0.10464
1 26.40909 0.039214
0.62 0.004373
0.00448955
9
Narok teachers 2015 0.061768
0.10530
6 0.58655 0.039461
0.62103
1 0.004426
0.00451274
7
Narok teachers 2016 0.061895
0.10577
5 29.31429 0.040434
0.65058
1 0.004443
0.00461286
6
Nacico 2012 0.062074
0.10599
8 0.585615 0.040434
0.65781
7 0.004575
0.00486064
6
Nacico 2013 0.062982
0.10621
3 31.26957 0.040615
0.66776
7 0.004628
0.00486064
6
Nacico 2014 0.064816
0.10660
1 31.54386 0.040615 0.67671 0.004655
0.00503803
5
Nacico 2015 0.064994
0.10686
9 31.54386 0.040709
0.67692
8 0.004724
0.00564174
4
Nacico 2016 0.065861
0.10686
9 31.84211 0.04307
0.68 0.00479
0.00574321
5
Miliki 2012 0.065928
0.10700
7 35.35556 0.043333
0.68 0.00482 0.00612626
Miliki 2013 0.06604
0.10721
3 35.45652 0.043554
0.69211
9 0.004862 0.00612626
Miliki 2014 0.068459
0.10722
2 39.56338 0.043554
0.69645
4 0.004863 0.00617525
Miliki 2015 0.068744
0.10722
2 42.67333 0.046097
0.69645
4 0.004863
0.00627555
9
Miliki 2016 0.069605 0.1077 42.92 0.046097
0.71363
2 0.004886 0.00651476
Mwalimu
National 2012 0.069941
0.10892
2 43.75 0.046684
0.73477
6 0.005045
0.01

172
Mwalimu
National 2013 0.070325
0.10912
4 44.24194 0.048896
0.76447
2 0.005096
0.00664439
3
Mwalimu
National 2014 0.071009
0.10921
5 45.33333 0.049155
0.76613
2 0.005124
0.01
Mwalimu
National 2015 0.071223
0.10958
6 45.38596 0.050025
0.77334
3 0.005175 0.00690335
Mwalimu
National 2016 0.07146
0.10994
2 48.31034 0.050542
0.77437
5 0.005204
0.00701781
9
Ngarisha 2012 0.07206
0.11016
5 48.74797 0.050542
0.78364
4 0.005353
0.00703296
4
Ngarisha 2013 0.073062
0.11036
6 52.25225 0.05096
0.78364
4 0.005415
0.00719575
2
Ngarisha 2014 0.075818 26563.6 54.36111 0.05096
0.79487
7 0.005417
0.00728442
6
Ngarisha 2015 0.075818
0.11245
1 55.48148 0.052913
0.80912
1 0.005455
0.00736648
4
Ngarisha 2016 0.076637
0.11294
7 56 0.053392
0.83568
5 0.005455 0.00739546
Nassefu 2012 0.077085
0.11404
4 60.01852 0.055117
0.83568
5 0.005459
0.00748186
2
Nassefu 2013 0.078649
0.11441
9 60.25714 0.055439
0.86502
9 0.005496
0.01
Nassefu 2014 0.078815
0.11521
4 62.5 0.055759
0.86502
9 0.005521 0.00765728
Nassefu 2015 0.078815 0.11546 65.71053 0.056534
0.89098
7 0.005676
0.00784328
9
Nassefu 2016 0.078972
0.11568
7 65.71429 0.057045
0.92141
4 0.005872
0.00796426
8
Nanyuki
equator 2012 0.079235
0.12 66.25 0.057051
0.94824
3 0.005948
0.00802095
6
Nanyuki
equator 2013 0.079235
0.11619
4 0.68192 0.060782
0.98139
1 0.00607
0.00803835
5
Nanyuki
equator 2014 0.079679
0.11638
1 69.10526 0.061857
0.98174
1 0.006096
0.00825385
2
Nanyki
equator 2015 0.080385
0.11653
7 69.10526 0.061857
0.98693
4 0.006134 0.0084584
Nanyuki
equator 2016 0.080474
0.11712
8 70 0.062195
1.00 0.00621 0.0084584
Bingwa 2012 0.081632
0.11712
8 71.80279 0.063951
1.00 0.006641
0.00850595
9
173
Bingwa 2013 0.082326
0.11713
9 72.48438 0.063951 1 0.006641
0.00853255
9
Bingwa 2014 0.082326
0.11928
8 74 0.063951 1 0.006645
0.00853255
9
Bingwa 2015 0.082361
0.11935
3 80.90291 0.063951 1 0.006645
0.00873854
9
Bingwa 2016 0.082361
0.11957
2 81.76667 0.063951 1 0.006985
0.00899283
5
Magereza 2012 0.082964
0.11957
2 90.22222 0.063951 1 0.007031
0.00916716
8
Magereza 2013 0.088618
0.11972
1 92.52632 0.064331 1.00894 0.007097
0.01
Magereza 2014 0.088885
0.12037
8 93.18182 0.06436 1.00894 0.007167
0.00924686
1
Magereza 2015 0.08894
0.12 93.8 0.066342 1.00937 0.007311
0.00935720
8
Magereza 2016 0.08894 0.12051 95.25 0.066757
1.01377
7 0.007311
0.00945473
2
All churches 2012 0.089402 0.12051 98 0.067857
1.03053
4 0.007311
0.00969319
7
All churches 2013 0.090053
0.12186
4 101.0787 0.067857
1.03053
4 0.007311
0.00969319
7
All churches 2014 0.091636
0.12220
9 101.0787 0.06811
1.03624
7 0.007311
0.01
All churches 2015 0.091737
0.12234
3 101.1818 0.06823
1.03687
8 0.007363
0.00974717
7
All churches 2016 0.093052 0.12271 101.3636 0.068552
1.03763
3 0.00738
0.01
Fariji Sacco 2012 0.09314
0.12284
3 102.0847 0.068806
1.03849
8 0.007399
0.01006307
9
Fariji Sacco 2013 0.094135
0.12297
1 102.1 0.069317
1.03935
4 0.007485
0.01050941
8
Fariji Sacco 2014 0.095202 0.12298 103.8 0.069699
1.04184
2 0.007499 0.01051581
Fariji Sacco 2015 0.095202 0.12325 104.8083 0.069743
1.04646
3 0.007546
0.01088273
1
Fariji Sacco 2016 0.096026
0.12326
2 104.8083 0.071045
1.04690
6 0.007566 0.01091732
Metropolitan 2012 0.096588
0.12356
6 107.0909 0.073204
1.04690
6 0.007665
0.01092685
7
174
Metropolitan 2013 0.096605 0.12358 109.3333 0.074752 1.04866 0.007701
0.01097519
5
Metropolitan 2014 0.097828
20587.2
2 110.3864 0.075379
1.04921
6 0.007711
0.01126102
1
Metropolitan 2015 0.098034 0.12487 114.3 0.077145
1.04921
6 0.007765 0.0114485
Metropolitan 2016 0.098059
0.12488
5 115 0.077341
1.05264
3 0.007813
0.01152714
4
Cosmopolitan 2012 0.09807
0.12488
5 116.3143 0.078964
1.05328
8 0.007839
0.01158627
8
Cosmopolitan 2013 0.098314 0.12497 116.3827 0.080881
1.05375
4 0.007867
0.01166649
1
Cosmopolitan 2014 0.098673
20410.8
5 116.3827 0.081381
1.05462
4 0.007903
0.01168546
4
Cosmopolitan 2015 0.098673
20420.9
8 119.0667 0.081876
1.05623
3 0.007975
0.01172720
4
Cosmopolitan 2016 0.099544
0.12550
2 121.8182 0.08294
1.05866
7 0.007984
0.01174032
8
Lengo 2012 0.100076
0.12559
5 121.8182 0.085421
1.06175
6 0.008011
0.01190885
9
Lengo 2013 0.101356
0.12577
9 124.1163 0.086868
1.06798
7 0.008368
0.01197300
6
Lengo 2014 0.103452
0.12588
8 124.1163 0.086907 1.06919 0.008379
0.01199874
1
Lengo 2015 0.103655
19439.5
1 124.1163 0.087424 1.07071 0.008427
0.01201105
4
Lengo 2016 0.103896
0.12648
2 124.3 0.088686
1.07381
8 0.008478
0.01201894
6
Ilkisonko 2012 0.10425
19299.7
6 126.0814 0.088969
1.07520
1 0.008479
0.01210165
8
Ilkisonko 2013 0.10441 0.12741 127.9348 0.089229
1.07545
8 0.008485
0.01214052
9
Ilkisonko 2014 0.104425 0.12741 132.1566 0.091456
1.07545
8 0.008514
0.01221130
7
Ilkisonko 2015 0.104783
0.12853
4 132.1566 0.091962
1.07580
9 0.008533 0.01235794
Ilkisonko 2016 0.105154
0.12866
7 132.484 0.093762
1.07668
5 0.008654 0.01235794
Hazina 2012 0.105935
0.12866
7 132.8452 0.093986
1.07781
5 0.008662
0.01245251
7
175
Hazina 2013 0.106157
0.12964
3 132.8452 0.102876
1.08127
9 0.008691
0.01249161
8
Hazina 2014 0.106281
0.12988
3 135 0.103942
1.08477
5 0.008785
0.01258004
4
Hazina 2015 0.106281
0.13017
1 135 0.10458
1.08718
8 0.008789
0.01261834
9
Hazina 2016 0.106606 0.13021 138.2188 0.106528
1.08812
7 0.008825
0.01266589
8
Jamii savings 2012 0.108432 0.13021 138.4545 0.109222
1.08820
9 0.008896 0.01281676
Jamii savings 2013 0.109761 0.13021 138.4545 0.110094
1.08820
9 0.008896
0.01305828
7
Jamii savings 2014 0.109829
0.13037
8 140 0.112071 1.09047 0.008896
0.01352966
6
Jamii savings 2015 0.109829
0.13068
1 140.2093 0.113399
1.09047
8 0.008896
0.01354154
9
Jamii savings 2016 0.11085
0.13 140.2093 0.114866
1.09167
5 0.008896
0.01355722
1
Kenpipe sacco 2012 0.110934
0.13252
9 141.0492 0.116221
1.09167
5 0.008928
0.01360499
8
Kenpipe sacco 2013 0.110934
0.13337
9 142.8529 0.116387
1.09319
1 0.009037
0.01364944
3
Kenpipe sacco 2014 0.111138
0.13337
9 143.2 0.1164
1.09482
9 0.009126
0.01367449
2
Kenpipe sacco 2015 0.111451
0.13467
6 143.2 0.117633
1.09482
9 0.009139
0.01372522
4
Kenpipe sacco 2016 0.111741
0.13495
1 143.3333 0.117707
1.09538
9 0.009153
0.01381879
5
Fortune sacco 2012 0.112136
0.13525
2 143.5625 0.119231
1.09538
9 0.00918
0.01381879
5
Fortune sacco 2013 0.112619
0.13552
6 143.6875 0.120652
1.09723
5 0.009193
0.01391477
3
Fortune sacco 2014 0.112674
0.13599
8 144.5455 0.120652
1.09795
1 0.009563
0.01395327
1
Fortune sacco 2015 0.113299
0.13651
2 144.5455 0.122511
1.10026
5 0.009583
0.01418972
8
Fortune sacco 2016 0.113469
0.13678
4 145.0667 0.123394 1.10209 0.009789
0.01428437
4
Kenversity 2012 0.115903
0.13684
1 145.1667 0.123394
1.10270
3 0.009834 0.01444452
176
Kenversity 2013 0.117643
0.13706
7 145.6224 0.124177
1.10270
3 0.009846
0.01452813
9
Kenversity 2014 0.117743
0.13765
9 145.6224 0.124177
1.10357
5 0.009976
0.01470953
8
Kenversity 2015 0.118301
0.13777
3 145.8 0.124888
1.10521
9 0.010152
0.01479175
8
Kenversity 2016 0.119241
0.13786
1 145.8 0.124888
1.10521
9 0.010233
0.01495445
2
KMFRI 2012 0.119273
0.13800
1 145.875 0.125466
1.10717
9 0.010268
0.01509488
2
KMFRI 2013 0.120651
0.13828
8 146.8125 0.126604
1.10868
9 0.010279
0.01509488
2
KMFRI 2014 0.121236
0.13874
3 147.75 0.126609 1.10872 0.010304
0.01509621
5
KMFRI 2015 0.121881
0.13890
7 148.125 0.127318
1.10923
4 0.010427
0.01526696
8
KMFRI 2016 0.121932
0.13943
8 148.3333 0.128188
1.11035
5 0.010597
0.01526696
8
Jitegemee 2012 0.122619
0.14 149.625 0.128338
1.11075
7 0.010756
0.01530243
1
Jitegemee 2013 0.122619
0.14071
2 150.3228 0.129579
1.11079
8 0.010779
0.01542606
4
Jitegemee 2014 0.123819
0.14101
5 150.6932 0.129579 1.11539 0.010811
0.01564117
3
Jitegemee 2015 0.123819
0.14 150.9259 0.129579
1.11564
2 0.011007
0.01582832
1
Jitegemee 2016 0.125011
0.14179
5 151.7333 0.129579
1.11638
3 0.011074
0.01583808
3
Imarisha 2012 0.126088
0.14210
9 151.7857 0.129579
1.11682
4 0.011087
0.01612381
9
Imarisha 2013 0.127168
0.14230
6 153.0833 0.129579
1.11871
7 0.01117
0.01616169
9
Imarisha 2014 0.12877
0.14253
9 154.2 0.134851
1.11876
5 0.011207
0.01616169
9
Imarisha 2015 0.129464
0.14292
9 155.125 0.136815
1.11932
7 0.011265
0.01617169
1
Imarisha 2016 0.129923
0.14292
9 155.3 0.137219
1.12042
9 0.011339
0.01617169
1
Mudete tea 2012 0.130529
0.14 156.4659 0.138605
1.12266
3 0.011453
0.01630931
9
177
Mudete tea 2013 0.131112
0.14405
8 156.4659 0.139202
1.12338
3 0.011512
0.01647238
5
Mudete tea 2014 0.133259
0.14420
6 156.6765 0.139924
1.12338
3 0.011573
0.01656736
3
Mudete tea 2015 0.133763
0.14 159 0.139936
1.12432
7 0.011741
0.01656736
3
Mudete tea 2016 0.136267
0.14 159.5429 0.140553 1.12467 0.011797
0.01707751
5
Murata 2012 0.137236
0.14457
3 160.1111 0.140956
1.12579
8 0.011905
0.01707751
5
Murata 2013 0.137578
0.15 160.2667 0.140956
1.12627
1 0.01201
0.01772840
2
Murata 2014 0.137883
0.14548
4 161.3621 0.147215
1.12639
3 0.012101
0.01792835
1
Murata 2015 0.139164
0.14548
4 161.5 0.148412
1.12672
1 0.012217
0.01815585
1
Murata 2016 0.139164
0.14615
2 161.5385 0.150928
1.12698
1 0.01222
0.01817339
1
Kipsigis6Dis 2012 0.139285
0.15 161.873 0.151292
1.12740
9 0.012259
0.01819422
3
Kipsigis6Dis 2013 0.139285
0.14649
8 161.873 0.154895
1.12793
1 0.012286
0.01878636
2
Kipsigis6Dis 2014 0.139614
0.14719
9 162.4762 0.155176
1.12965
5 0.012398
0.01911633
1
Kipsigis6Dis 2015 0.139919
0.14720
2 163.75 0.155176
1.12983
4 0.012732
0.01916116
3
Kipsigis6Dis 2016 0.141155
0.14723
3 164.2927 0.155184
1.13043
3 0.012751
0.01926903
8
County coop 2012 0.141904
0.15 166.5 0.156119
1.13043
3 0.012768
0.01983271
5
County coop 2013 0.142585
0.14865
1 166.7083 0.157151 1.1314 0.012882
0.02003422
3
County coop 2014 0.14364
0.14887
4 167.5333 0.157151
1.13275
3 0.013114
0.02008972
3
County coop 2015 0.14364
0.14918
7 167.6111 0.15785
1.13285
6 0.013255 0.02033869
County coop 2016 0.145591
0.14943
6 167.9677 0.162961
1.13332
9 0.013263
0.02033954
6
Wareng
teachers 2012 0.146107
0.14978
8 168.125 0.163842
1.13949
5 0.013417
0.02074415
5
178
Wareng
teachers 2013 0.146805
0.14999
8 168.4444 0.174332
1.13970
7 0.013482
0.02102958
9
Wareng
teachers 2014 0.147295
0.15026
7 172.5 0.175937
1.14016
1 0.013484
0.02133024
4
Wareng
teachers 2015 0.147484
0.15035
9 174.4 0.176195
1.14105
9 0.013645
0.02179340
7
Wareng
teachers 2016 0.149593
0.15052
8 175.6667 0.176195
1.14287
2 0.013688
0.02186121
1
Dumisha 2012
0.15
0.15060
8 175.9444 0.177972
1.14569
6 0.013749
0.02188571
5
Dumisha 2013 0.150262
0.15098
7 175.9444 0.178924
1.14754
4 0.01375
0.02192863
5
Dumisha 2014 0.150618 0.15142 177.1304 0.181465
1.14932
3 0.013761 0.02212009
Dumisha 2015 0.150968
0.15 178.2258 0.181465
1.15089
6 0.013829
0.02219657
2
Dumisha 2016 0.151302
0.15150
4 178.2258 0.182364
1.15374
7 0.013846 0.02224765
Mwingi
mwalimu 2012 0.151388
0.15208
8 178.8 0.184965
1.15650
9 0.01387
0.02242179
3
Mwingi
mwalimu 2013 0.152501 0.15216 178.803 0.185127
1.15895
5 0.013926
0.02256000
8
Mwingi
mwalimu 2014 0.153425
0.15216
9 178.803 0.186707
1.15993
6 0.013934
0.02304795
9
Mwingi
mwalimu 2015 0.153499
0.15220
1 178.8095 0.187569
1.16163
2 0.01397
0.02308530
9
Mwingi
mwalimu 2016 0.153612
0.15220
1 180.1429 0.189022
1.16214
9 0.014089
0.02338649
1
Tembo sacco 2012 0.153612
0.15 181.4667 0.189022
1.16354
7 0.01416
0.02366204
3
Tembo sacco 2013 0.153819
0.15294
5 181.5385 0.189927
1.16483
9 0.014374
0.02375639
2
Tembo sacco 2014 0.153864
0.15312
6 181.5385 0.189927
1.16653
5 0.014439
0.02399096
8
Tembo sacco 2015 0.154662
0.15392
2 182.2135 0.190754
1.16653
5 0.014464
0.02406035
3
Tembo sacco 2016 0.155138
0.15435
9 182.2135 0.193426
1.16780
4 0.014488
0.02458435
8
Hazina 2012 0.155634
0.15436
1 183 0.194114
1.16815
6 0.014528
0.02481098
5
179
Hazina 2013 0.156156
0.15437
5 183 0.200302
1.16815
6 0.014665
0.02491175
7
Hazina 2014 0.15846
0.15445
8 184.4521 0.200439
1.17247
1 0.014676
0.02491175
7
Hazina 2015 0.159466
0.15 185.3625 0.201845
1.17273
8 0.014679
0.03
Hazina 2016 0.159466
0.15491
1 186.5652 0.201871
1.17273
8 0.014762 0.02543102
Baraka 2012 0.160958
0.15511
9 192 0.202461
1.17664
8 0.014762
0.02550895
5
Baraka 2013 0.161131
0.15519
8 193.6 0.203842
1.17767
4 0.014788 0.02581698
Baraka 2014 0.161754
0.15519
8 193.6364 0.203888
1.17827
6 0.014832
0.02604510
6
Baraka 2015 0.161788
0.16 194.1667 0.204237
1.17827
6 0.01496
0.02619918
9
Baraka 2016
0.16
0.15555
2 196 0.204481
1.17839
5 0.014986
0.02627262
9
Ardhi 2012 0.16492
0.15558
9 200.0952 0.206256
1.17911
9 0.015183
0.02631076
7
Ardhi 2013 0.165448
0.15558
9 200.0952 0.206287
1.17917
4 0.015587
0.02633960
1
Ardhi 2014 0.165533
0.16 201.1111 0.207795
1.17994
2 0.0156
0.02636322
2
Ardhi 2015 0.165533
0.15645
5 202.2727 0.207988 1.18123 0.01561
0.02640831
6
Ardhi 2016 0.165635
0.15653
4 205.8342 0.207993 1.18123 0.015788
0.02671457
4
Unaitas 2012 0.16673
0.15653
4 206.4167 0.208401
1.18219
4 0.016115
0.02682614
8
Unaitas 2013 0.166907
0.15721
4 207.1739 0.20898
1.18295
8 0.01614
0.02684175
2
Unaitas 2014 0.16711
0.15868
4 208.0353 0.20898
1.18429
1 0.016576
0.02684579
6
Unaitas 2015
0.17
0.15885
1 208.0353 0.209609 1.18432 0.016854
0.02687142
4
Unaitas 2016 0.167959
0.15905
5 208.1111 0.209609 1.18432 0.017204
0.02687142
4
Nyahururu
umoja 2012 0.168048
0.15925
3 208.4737 0.212441
1.18757
5 0.017566
0.02687632
8
180
Nyahururu
umoja 2013 0.168881
0.16 208.7619 0.215111 1.18972 0.017705
0.02693350
5
Nyahururu
umoja 2014 0.170594
0.16 208.7619 0.216515 1.18972 0.01791
0.02697889
2
Nyahururu
umoja 2015 0.171026
0.15993
9 211.5 0.218765
1.19183
6 0.01791
0.02701225
6
Nyahururu
umoja 2016
0.17
0.16 212.871 0.221235
1.19208
1 0.018086
0.02703748
2
Elimu sacco 2012 0.172753
0.16020
1 215.3194 0.223266
1.19226
6 0.018228
0.02712885
1
Elimu sacco 2013 0.173203
11622.1
9 215.3194 0.225832
1.19301
6 0.018704
0.02714098
3
Elimu sacco 2014 0.174092
0.16032
4 215.3929 0.226916
1.19366
4 0.018987
0.02733545
8
Elimu sacco 2015 0.174277
0.16038
7 215.3929 0.228702
1.19486
5 0.019058
0.02735685
8
Elimu sacco 2016 0.174559
0.16046
5 216.8947 0.231996
1.19622
3 0.019058
0.02744715
4
Boresha 2012 0.175205
11483.6
8 217.15 0.232705
1.19824
7 0.01988
0.02763921
5
Boresha 2013 0.177068
0.16082
9 218.2239 0.234683
1.19930
5 0.01988
0.02778293
4
Boresha 2014 0.177596
0.16082
9 218.2239 0.238253
1.20063
8 0.020108
0.02783089
4
Boresha 2015 0.177596
0.16099
2 219.0714 0.239778
1.20130
3 0.020415
0.02793577
9
Boresha 2016 0.180892
0.16131
4 219.6667 0.241802
1.20145
7 0.020604
0.02800703
3
Wanaanga 2012 0.182226
0.16155
5 220.3158 0.242574
1.20199
2 0.020604
0.02847056
3
Wanaanga 2013 0.182412 0.16161 220.9412 0.242736
1.20313
4 0.020604 0.02870236
Wanaanga 2014
0.18
0.16226
7 222.6316 0.243012
1.20319
8 0.020604
0.02927905
5
Wanaanga 2015 0.185033
0.16 223.2593 0.243231
1.20339
9 0.020604
0.02930024
7
Wanaanga 2016 0.185834
0.16 223.2593 0.248869
1.20657
9 0.020604
0.02967262
9
Orient 2012 0.185834
0.16302
3 223.2593 0.252215
1.20843
9 0.02091
0.03006565
6
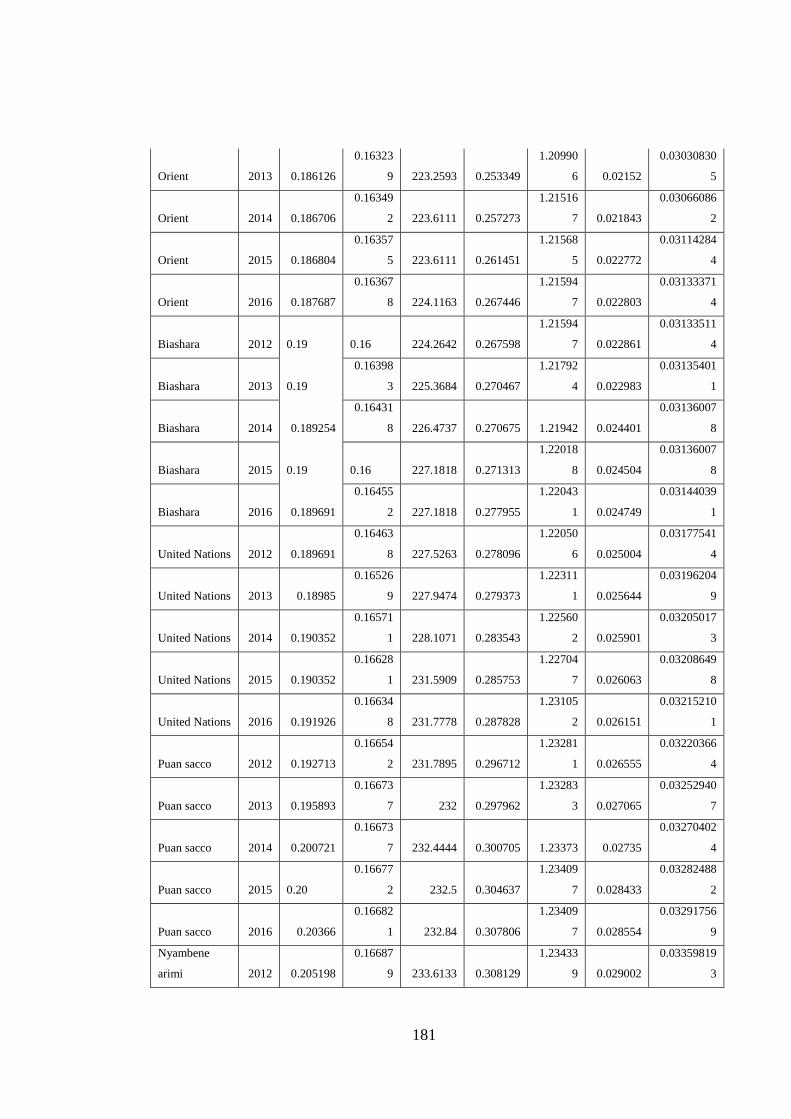
181
Orient 2013 0.186126
0.16323
9 223.2593 0.253349
1.20990
6 0.02152
0.03030830
5
Orient 2014 0.186706
0.16349
2 223.6111 0.257273
1.21516
7 0.021843
0.03066086
2
Orient 2015 0.186804
0.16357
5 223.6111 0.261451
1.21568
5 0.022772
0.03114284
4
Orient 2016 0.187687
0.16367
8 224.1163 0.267446
1.21594
7 0.022803
0.03133371
4
Biashara 2012
0.19
0.16 224.2642 0.267598
1.21594
7 0.022861
0.03133511
4
Biashara 2013
0.19
0.16398
3 225.3684 0.270467
1.21792
4 0.022983
0.03135401
1
Biashara 2014 0.189254
0.16431
8 226.4737 0.270675 1.21942 0.024401
0.03136007
8
Biashara 2015
0.19
0.16 227.1818 0.271313
1.22018
8 0.024504
0.03136007
8
Biashara 2016 0.189691
0.16455
2 227.1818 0.277955
1.22043
1 0.024749
0.03144039
1
United Nations 2012 0.189691
0.16463
8 227.5263 0.278096
1.22050
6 0.025004
0.03177541
4
United Nations 2013 0.18985
0.16526
9 227.9474 0.279373
1.22311
1 0.025644
0.03196204
9
United Nations 2014 0.190352
0.16571
1 228.1071 0.283543
1.22560
2 0.025901
0.03205017
3
United Nations 2015 0.190352
0.16628
1 231.5909 0.285753
1.22704
7 0.026063
0.03208649
8
United Nations 2016 0.191926
0.16634
8 231.7778 0.287828
1.23105
2 0.026151
0.03215210
1
Puan sacco 2012 0.192713
0.16654
2 231.7895 0.296712
1.23281
1 0.026555
0.03220366
4
Puan sacco 2013 0.195893
0.16673
7 232 0.297962
1.23283
3 0.027065
0.03252940
7
Puan sacco 2014 0.200721
0.16673
7 232.4444 0.300705 1.23373 0.02735
0.03270402
4
Puan sacco 2015
0.20
0.16677
2 232.5 0.304637
1.23409
7 0.028433
0.03282488
2
Puan sacco 2016 0.20366
0.16682
1 232.84 0.307806
1.23409
7 0.028554
0.03291756
9
Nyambene
arimi 2012 0.205198
0.16687
9 233.6133 0.308129
1.23433
9 0.029002
0.03359819
3
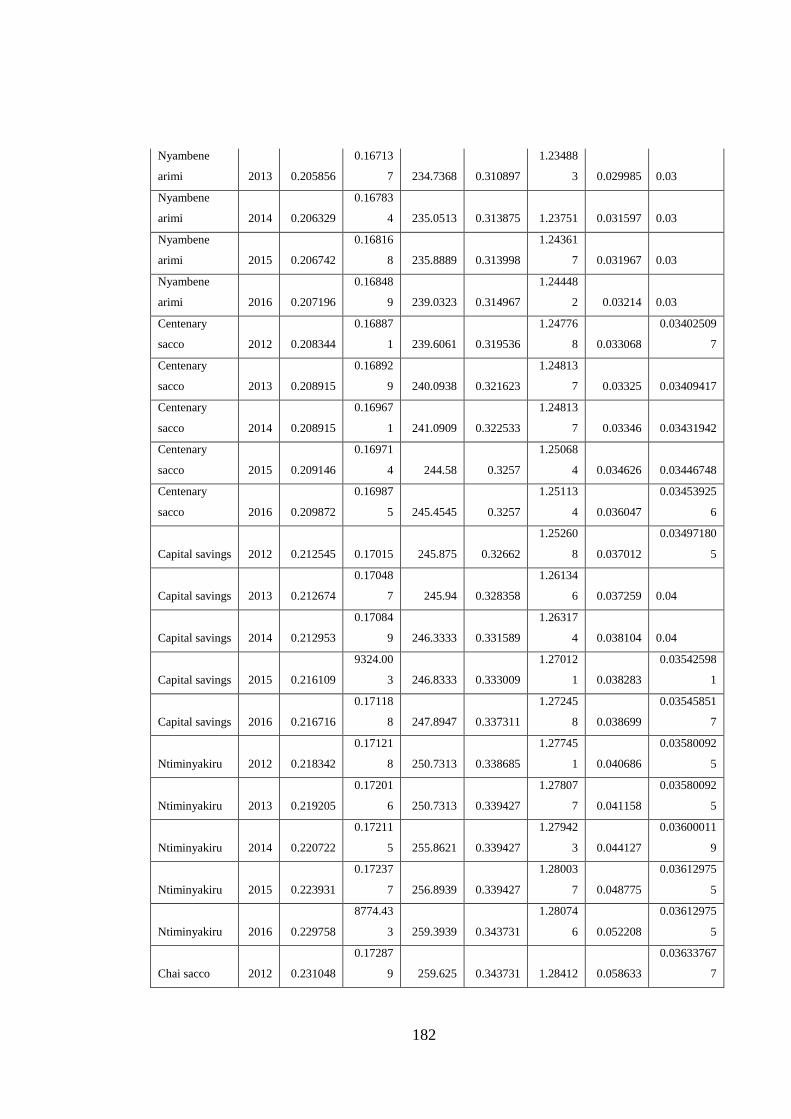
182
Nyambene
arimi 2013 0.205856
0.16713
7 234.7368 0.310897
1.23488
3 0.029985
0.03
Nyambene
arimi 2014 0.206329
0.16783
4 235.0513 0.313875 1.23751 0.031597
0.03
Nyambene
arimi 2015 0.206742
0.16816
8 235.8889 0.313998
1.24361
7 0.031967
0.03
Nyambene
arimi 2016 0.207196
0.16848
9 239.0323 0.314967
1.24448
2 0.03214
0.03
Centenary
sacco 2012 0.208344
0.16887
1 239.6061 0.319536
1.24776
8 0.033068
0.03402509
7
Centenary
sacco 2013 0.208915
0.16892
9 240.0938 0.321623
1.24813
7 0.03325 0.03409417
Centenary
sacco 2014 0.208915
0.16967
1 241.0909 0.322533
1.24813
7 0.03346 0.03431942
Centenary
sacco 2015 0.209146
0.16971
4 244.58 0.3257
1.25068
4 0.034626 0.03446748
Centenary
sacco 2016 0.209872
0.16987
5 245.4545 0.3257
1.25113
4 0.036047
0.03453925
6
Capital savings 2012 0.212545 0.17015 245.875 0.32662
1.25260
8 0.037012
0.03497180
5
Capital savings 2013 0.212674
0.17048
7 245.94 0.328358
1.26134
6 0.037259
0.04
Capital savings 2014 0.212953
0.17084
9 246.3333 0.331589
1.26317
4 0.038104
0.04
Capital savings 2015 0.216109
9324.00
3 246.8333 0.333009
1.27012
1 0.038283
0.03542598
1
Capital savings 2016 0.216716
0.17118
8 247.8947 0.337311
1.27245
8 0.038699
0.03545851
7
Ntiminyakiru 2012 0.218342
0.17121
8 250.7313 0.338685
1.27745
1 0.040686
0.03580092
5
Ntiminyakiru 2013 0.219205
0.17201
6 250.7313 0.339427
1.27807
7 0.041158
0.03580092
5
Ntiminyakiru 2014 0.220722
0.17211
5 255.8621 0.339427
1.27942
3 0.044127
0.03600011
9
Ntiminyakiru 2015 0.223931
0.17237
7 256.8939 0.339427
1.28003
7 0.048775
0.03612975
5
Ntiminyakiru 2016 0.229758
8774.43
3 259.3939 0.343731
1.28074
6 0.052208
0.03612975
5
Chai sacco 2012 0.231048
0.17287
9 259.625 0.343731 1.28412 0.058633
0.03633767
7
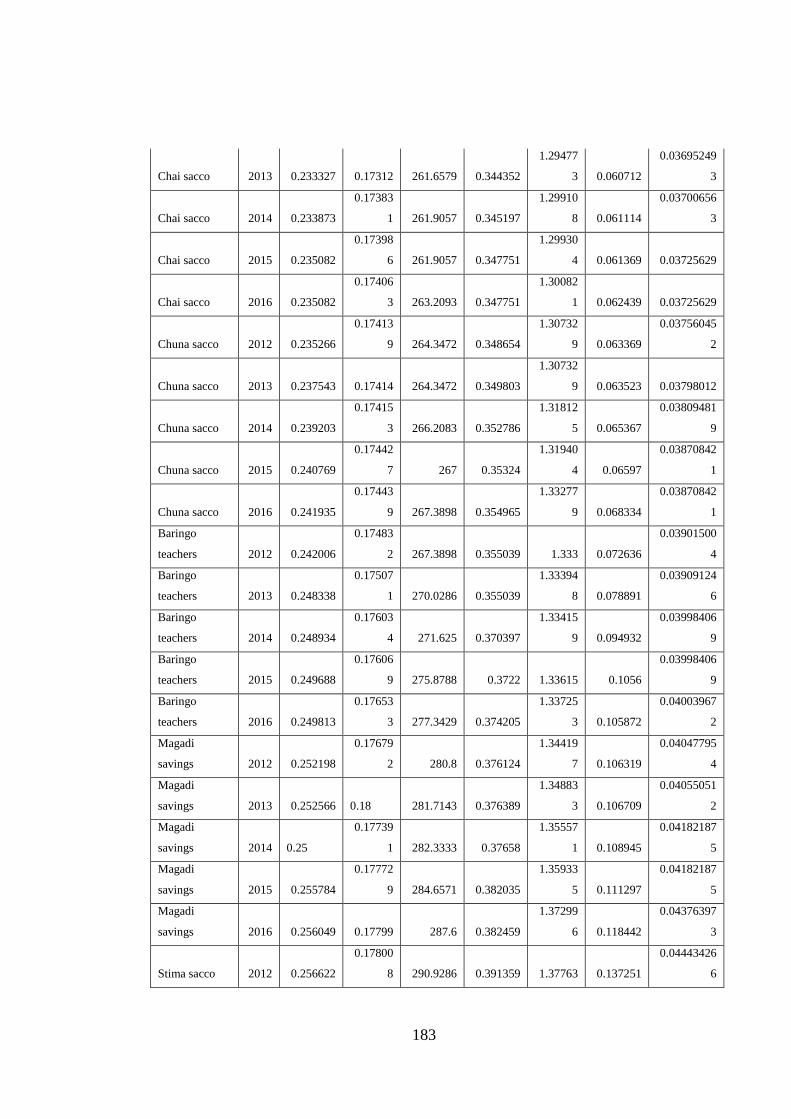
183
Chai sacco 2013 0.233327 0.17312 261.6579 0.344352
1.29477
3 0.060712
0.03695249
3
Chai sacco 2014 0.233873
0.17383
1 261.9057 0.345197
1.29910
8 0.061114
0.03700656
3
Chai sacco 2015 0.235082
0.17398
6 261.9057 0.347751
1.29930
4 0.061369 0.03725629
Chai sacco 2016 0.235082
0.17406
3 263.2093 0.347751
1.30082
1 0.062439 0.03725629
Chuna sacco 2012 0.235266
0.17413
9 264.3472 0.348654
1.30732
9 0.063369
0.03756045
2
Chuna sacco 2013 0.237543 0.17414 264.3472 0.349803
1.30732
9 0.063523 0.03798012
Chuna sacco 2014 0.239203
0.17415
3 266.2083 0.352786
1.31812
5 0.065367
0.03809481
9
Chuna sacco 2015 0.240769
0.17442
7 267 0.35324
1.31940
4 0.06597
0.03870842
1
Chuna sacco 2016 0.241935
0.17443
9 267.3898 0.354965
1.33277
9 0.068334
0.03870842
1
Baringo
teachers 2012 0.242006
0.17483
2 267.3898 0.355039 1.333 0.072636
0.03901500
4
Baringo
teachers 2013 0.248338
0.17507
1 270.0286 0.355039
1.33394
8 0.078891
0.03909124
6
Baringo
teachers 2014 0.248934
0.17603
4 271.625 0.370397
1.33415
9 0.094932
0.03998406
9
Baringo
teachers 2015 0.249688
0.17606
9 275.8788 0.3722 1.33615 0.1056
0.03998406
9
Baringo
teachers 2016 0.249813
0.17653
3 277.3429 0.374205
1.33725
3 0.105872
0.04003967
2
Magadi
savings 2012 0.252198
0.17679
2 280.8 0.376124
1.34419
7 0.106319
0.04047795
4
Magadi
savings 2013 0.252566
0.18 281.7143 0.376389
1.34883
3 0.106709
0.04055051
2
Magadi
savings 2014
0.25
0.17739
1 282.3333 0.37658
1.35557
1 0.108945
0.04182187
5
Magadi
savings 2015 0.255784
0.17772
9 284.6571 0.382035
1.35933
5 0.111297
0.04182187
5
Magadi
savings 2016 0.256049 0.17799 287.6 0.382459
1.37299
6 0.118442
0.04376397
3
Stima sacco 2012 0.256622
0.17800
8 290.9286 0.391359 1.37763 0.137251
0.04443426
6
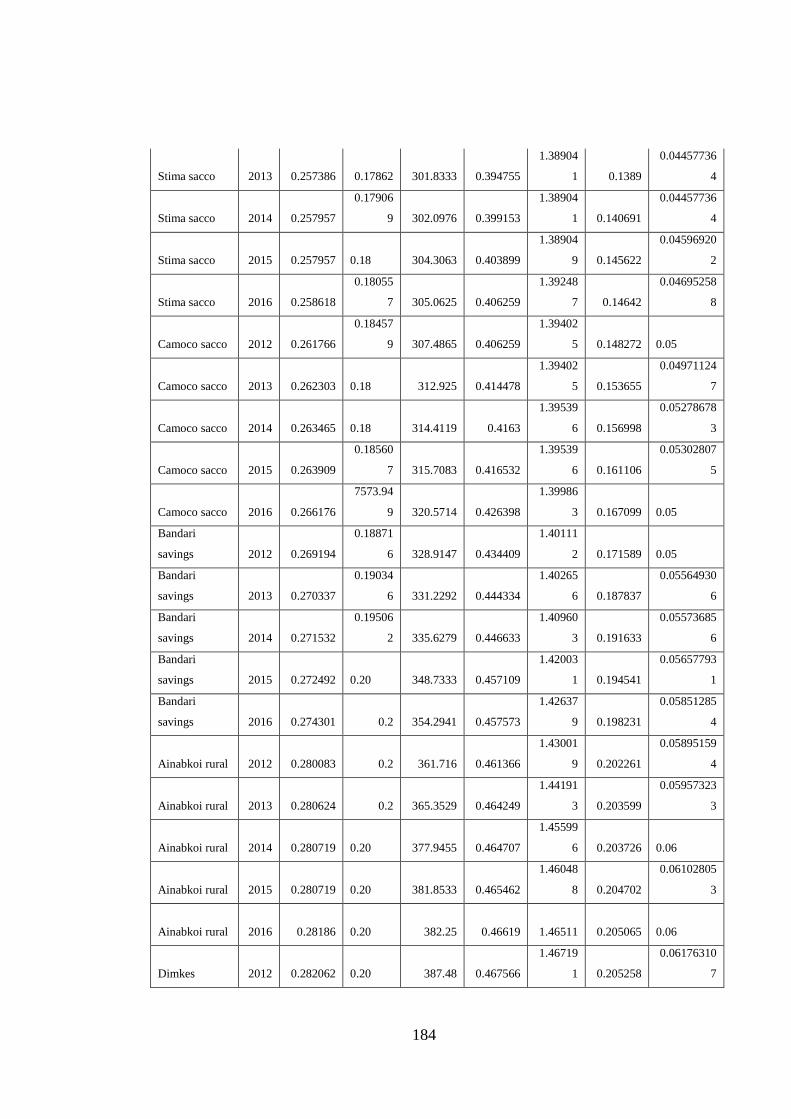
184
Stima sacco 2013 0.257386 0.17862 301.8333 0.394755
1.38904
1 0.1389
0.04457736
4
Stima sacco 2014 0.257957
0.17906
9 302.0976 0.399153
1.38904
1 0.140691
0.04457736
4
Stima sacco 2015 0.257957
0.18 304.3063 0.403899
1.38904
9 0.145622
0.04596920
2
Stima sacco 2016 0.258618
0.18055
7 305.0625 0.406259
1.39248
7 0.14642
0.04695258
8
Camoco sacco 2012 0.261766
0.18457
9 307.4865 0.406259
1.39402
5 0.148272
0.05
Camoco sacco 2013 0.262303
0.18 312.925 0.414478
1.39402
5 0.153655
0.04971124
7
Camoco sacco 2014 0.263465
0.18 314.4119 0.4163
1.39539
6 0.156998
0.05278678
3
Camoco sacco 2015 0.263909
0.18560
7 315.7083 0.416532
1.39539
6 0.161106
0.05302807
5
Camoco sacco 2016 0.266176
7573.94
9 320.5714 0.426398
1.39986
3 0.167099
0.05
Bandari
savings 2012 0.269194
0.18871
6 328.9147 0.434409
1.40111
2 0.171589
0.05
Bandari
savings 2013 0.270337
0.19034
6 331.2292 0.444334
1.40265
6 0.187837
0.05564930
6
Bandari
savings 2014 0.271532
0.19506
2 335.6279 0.446633
1.40960
3 0.191633
0.05573685
6
Bandari
savings 2015 0.272492
0.20 348.7333 0.457109
1.42003
1 0.194541
0.05657793
1
Bandari
savings 2016 0.274301 0.2 354.2941 0.457573
1.42637
9 0.198231
0.05851285
4
Ainabkoi rural 2012 0.280083 0.2 361.716 0.461366
1.43001
9 0.202261
0.05895159
4
Ainabkoi rural 2013 0.280624 0.2 365.3529 0.464249
1.44191
3 0.203599
0.05957323
3
Ainabkoi rural 2014 0.280719
0.20 377.9455 0.464707
1.45599
6 0.203726
0.06
Ainabkoi rural 2015 0.280719
0.20 381.8533 0.465462
1.46048
8 0.204702
0.06102805
3
Ainabkoi rural 2016 0.28186
0.20 382.25 0.46619 1.46511 0.205065
0.06
Dimkes 2012 0.282062
0.20 387.48 0.467566
1.46719
1 0.205258
0.06176310
7
185
Dimkes 2013 0.28484
0.20 390.4658
0.47 1.49417 0.207747
0.06176310
7
Dimkes 2014 0.286184
0.21 399.5
0.47
1.50269
1 0.209257
0.06317880
4
Dimkes 2015 0.287067
0.21 401.1633 0.472387
1.51111
8 0.209369 0.06333718
Dimkes 2016 0.288386 0.21048 401.1633 0.473643
1.51182
4 0.21504
0.06356901
8
Kenya
achievers 2012 0.29579
0.21 406.5854 0.485014
1.51680
1 0.215207
0.06478074
7
Kenya
achievers 2013 0.298924
0.21 406.5854 0.492117
1.52476
4 0.236028
0.06670150
7
Kenya
achievers 2014 0.303574
0.22499
8 408.122 0.495688
1.53 0.237842
0.06681859
2
Kenya
achievers 2015 0.311461
0.23451
8 408.122 0.501597
1.53220
2 0.241717
0.06858328
9
Kenya
achievers 2016 0.324849
0.23618
6 410.0494 0.50318
1.53352
1 0.243645
0.06957416
6
Afya sacco 2012 0.325601
0.23618
6 410.0494 0.504291
1.53671
7 0.246224
0.07474843
6
Afya sacco 2013 0.328382 0.23857 410.2222 0.508903
1.53671
7 0.24901 0.075013
Afya sacco 2014 0.329153
0.23895
3 411.8667 0.510441
1.53751
9 0.249636
0.08
Afya sacco 2015 0.331996
0.23997
1 413.0667 0.521728
1.55509
3 0.250535
0.08
Afya sacco 2016 0.332315 0.24357 419.95 0.543132
1.56286
5 0.251025 0.09347463
Sheria sacco 2012 0.338238
0.25331
8 426.5 0.551757 1.56557 0.256189
0.09350500
3
Sheria sacco 2013 0.339472
0.27 433 0.564695
1.57255
4 0.266841
0.10
Sheria sacco 2014 0.347906
0.27 433.3571 0.570793
1.57556
2 0.286873
0.10238510
2
Sheria sacco 2015 0.349602
0.27384
9 436.7143 0.574212
1.57696
5 0.288463
0.11054173
4
Sheria sacco 2016 0.356952
0.28285
8 437.4923 0.577919
1.57738
8 0.292188
0.12635382
7
Asili sacco 2012 0.360149
0.28 440.8 0.600733
1.58003
9 0.294456
0.12807364
3
186
Asili sacco 2013 0.364092
0.28 441.6667 0.601428
1.58003
9 0.299251 0.13056881
Asili sacco 2014 0.376877
0.28990
5 442.35 0.601798
1.58347
6 0.30164 0.15218593
Asili sacco 2015 0.377902
0.29579
1 445.7451 0.629814
1.58968
9 0.325505
0.16674907
8
Asili sacco 2016 0.378424
0.30336
6 452 0.662817
1.60548
3 0.326524
0.17
Nafaka sacco 2012 0.378953
0.30336
6 457.3485 0.687187
1.60548
3 0.327345
0.18292708
3
Nafaka sacco 2013 0.381136
0.31 459.1667 0.700105
1.61585
9 0.328376
0.22500900
1
Nafaka sacco 2014 0.426618
0.32 461.1667
0.71
1.66832
5 0.328561
0.23
Nafaka sacco 2015 0.427622
0.33 461.8571
0.71 1.6964 0.328873
0.26555685
1
Nafaka sacco 2016 0.575085
0.33 470.087 0.729016
1.70336
3 0.331816
0.28468821
4
Shoppers
sacco 2012 0.575085
0.34 473.2806 0.736231
1.73070
3 0.333379
0.29014942
3
Shoppers
sacco 2013 0.603707
0.35 488.0909 0.73691
1.73990
7 0.338079
0.29067815
6
Shoppers
sacco 2014 0.695764
0.35 489.5077 0.773793
1.76137
3 0.338201
0.29926613
1
Shoppers
sacco 2015 0.695764
2896.09
9 498.1573 0.792624
1.80412
6 0.342053
0.31143003
1
Shoppers
sacco 2016 0.741166
2720.03
7 498.1573 0.821911
1.85618
9 0.343194
0.34
Kenya bankers 2012 0.842668
2387.65
4 508.4189 0.832332
1.90504
6 0.345022
0.37903410
4
Kenya bankers 2013 0.894111
0.40460
1 509.561 0.837231
1.90733
4 0.354302
0.37928638
2
Kenya bankers 2014 0.901113
0.41597
8 510.1256 0.84889
1.91067
8 0.359014
0.38702966
8
Kenya bankers 2015 1.023159
0.43 510.9296 0.860437
1.93871
3 0.360798
0.39648866
4
Kenya bankers 2016 1.023159
0.43 511.4545 0.860437
1.93871
3 0.371209
0.46400108
3
Ukristo na
ufanisi 2012 1.034665
1944.59
1 529.6863 0.8656
1.96874
9 0.371382
0.46661057
3
187
Ukristo na
ufanisi 2013 1.064431 1891.15 541.7541 0.86865
1.97125
4 0.38315
0.51
Ukristo na
ufanisi 2014 1.11776
0.48202
1 545.0127 0.8831
2.01359
2 0.404927
0.55
Ukristo na
ufanisi 2015 1.126588
0.48202
1 545.8182 0.923802
2.15 0.415266
0.57
Ukristo na
ufanisi 2016 1.22139
0.49 551.6667 0.923802
2.25942
3 0.424481
0.57050515
3
Safaricom
savings 2012 1.245655
0.49 559.1262
0.93
2.38968
7 0.452099
0.57637330
1
Safaricom
savings 2013 1.258662
0.52 577.3889
0.93
2.38968
7 0.452714
0.58232536
7
Safaricom
savings 2014 1.294543
0.52 580.9565 0.930591
2.39231
1 0.632767
0.59
Safaricom
savings 2015 1.387943
0.53532
9 593.2716 0.930591
2.53842
6 0.70084 0.64796935
Safaricom
savings 2016 1.479965
0.79141
1 594.7778 0.945725
2.77093
5 0.745225
0.66027583
3
Wakenya
pamoja 2012 1.488424
0.79141
1 597.9306 0.945725
2.89 0.795863
0.67408811
2
Wakenya
pamoja 2013 1.502589
0.89 623.2759 0.948907
2.97506
9 0.863135
0.68103371
8
Wakenya
pamoja 2014 1.620866
0.97187
8 623.5 0.948907
3.21367
3 0.890388 0.68808558
Wakenya
pamoja 2015 1.71697 1.15722 638.9739 0.952404
3.87 0.944328
0.69420643
5
Wakenya
pamoja 2016 1.731781
1.16192
6 640.1667 0.962509
4.69101
8 0.955372
0.71387919
9
Agro
chemicals 2012 1.803326
1.20356
6 659.6981 0.972891
6.00497
7 0.971827
0.71
Agro
chemicals 2013 1.844989
1.24688
5 660.6667 0.97569
7.16708
9 1.011094 0.72079499
Agro
chemicals 2014 1.957287
1.32426
3 667.6104
0.98
7.65251
9 1.052698
0.74712261
7
Agro
chemicals 2015 1.988
1.33184
3 669.3448
0.98
8.02266
1 1.181356
0.78319757
1
Agro
chemicals 2016 1.988 1.53826 672.1333 1.029131
8.62522
1 1.191944
0.81898240
2
Siragi sacco 2012 2.265497
1.56254
8 675.9545 1.061215
10.0738
4 1.217316
0.89
188
Siragi sacco 2013 2.39759
1.57399
4 677.75
1.07
11.0336
3 1.228882
0.95928938
4
Siragi sacco 2014 2.707258
1.57399
4 680.7455
1.07
11.1848
6 6.197201
1.58167015
6
Siragi sacco 2015 3.328814
1.69046
3 708.6333 1.129586
11.4054
7 6.197201
1.75836127
7
Siragi sacco 2016 11.45771
1.74206
5 727.5982 1.200644
11.72 12.71655
1.86666984
5
2NK Sacco 2012 11.53182
1.74917
5 735.6724 1.212851
12.2173
4 12.72314
1.99360597
7
2NK Sacco 2013 11.56654
1.79233
5 744.7723 1.2838
12.5818
1 12.76021
2.00241431
8
2NK Sacco 2014 11.59982
1.80 802 1.338401 13.8935 12.77073
2.07955603
8
2NK Sacco 2015 11.72027
1.80305
1 804.6667 1.625282
19.4733
4 14.06479
2.35666992
8
2NK Sacco 2016 14.80989
1.90 820.2857 1.682486
487.543
8 14.06737
2.45873122
3
Dhabiti sacco 2012 14.80989
2.08 827.6667 1.778769
25.4599
5 15.06072
18.6521081
2
Dhabiti sacco 2013 30.83733
2.41 930.7536 1.978912
280.29 15.08184
18.6521081
2
Dhabiti sacco 2014 30.83733
2.41 974.359 2.312621
421.322
4 15.82858
27.5398400
5
Dhabiti sacco 2015 30.90709
2.56000
5 1089.6 2.617479
318.93 15.83172
27.5398400
5
Dhabiti sacco 2016 30.90709
2.62 1244.242 2.62307
474.345
9 16.02901
28.4861005
8
Ntunze savings 2012 32.30825
2.68 1247.266 2.66208
432.96 16.03128
28.4861005
8
Ntunze savings 2013 32.30825
2.72490
3 1299.839 5.960534
218.074
2 16.39866
31.3767529
5
Ntunze savings 2014 84.4203
2.80635
4 1610.468 12.16902
606.42 16.40842
31.3767529
5
Ntunze savings 2015 84.4203
2.88714
9 1976.5 21.65434
615.01 17.455
35.4035784
1
Ntunze savings 2016 216.7076
3.20393
6 3621 984.862
3.67665
7 17.45901
35.4035784
1